Article

Characterization of Petroleum Fractions and Ecotoxicity as a Science-Based Framework for Bioremediation Applications


1
Department of Ecological Engineering for Soil and Water Resources Protection, Faculty of Forestry, University of Belgrade, Kneza Višeslava 1, 11000 Belgrade, Serbia
2
Institute of Chemistry, Technology and Metallurgy, University of Belgrade, Njegoševa 12, 11000 Belgrade, Serbia
*
Author to whom correspondence should be addressed.
Earth 2026, 7(2), 65; https://doi.org/10.3390/earth7020065
Submission received: 5 March 2026 / Revised: 7 April 2026 / Accepted: 8 April 2026 / Published: 15 April 2026

Abstract

Hydrocarbon-contaminated sites are among the most common challenges for environmental professionals worldwide. Although bioremediation strategies have emerged, their efficiency in cleaning hydrocarbon-contaminated soil depends considerably on local conditions. This study presents a science-based framework to assess the potential for soil bioremediation based on site-specific conditions. At multiple depths, soil samples were collected from four locations (S1, S7, S13, and S16) within a historically contaminated heating plant site. Using a three-step framework based on the content of total petroleum hydrocarbons (TPH), hydrocarbon pollutant fractions, ecotoxicity, and microbial population density, the study quantitatively (using a scoring matrix) revealed considerable variability across locations regarding the potential for bioremediation. Thus, due to balanced parameter contributions, S16 has the most promising bioremediation potential. Location S1 may require additional effort to enhance microbial populations. Locations S7 and S13 have low scores, with S13 being the least suitable, requiring extensive efforts to improve site-specific conditions for bioremediation. By integrating chemical, biological, and ecological factors, this science-based framework emphasizes the importance of site pre-characterization, thus providing an evaluation tool for bioremediation applications at hydrocarbon-contaminated sites with similar data availability. Moreover, the pre-remediation matrix scoring evaluation results align with the in situ bioremediation efficiency observed at the site.

1. Introduction

Contaminated sediments pose a significant challenge to environmental professionals worldwide [1]. Effective soil and water protection, assessment and recovery from contamination have become global priorities [2]. Although the sources of soil and groundwater quality degradation are diverse [3,4,5], petroleum hydrocarbons are among the most common contributors due to their widespread use [6,7,8,9,10].
Petroleum is a complex mixture of liquid, gaseous, and solid hydrocarbons, typically found in a liquid state under normal conditions, and is lighter and more viscous than water. Contamination by petroleum hydrocarbons considerably impacts the physical and chemical properties of soil [11]. Organic compounds from petroleum disrupt the natural carbon-to-nitrogen ratio, leading to deficits in oxygen, nitrogen, and phosphorus [12]. Additionally, the presence of petroleum in the soil influences the development of specific microorganisms that utilize petroleum components as sources of carbon and energy [13,14,15].
Bioremediation strategies aim to mitigate hydrocarbon contamination; however, their efficacy depends heavily on site-specific conditions. One of the key factors includes the presence of microorganisms capable of degrading target hydrocarbons, the absence of microbial inhibitors (such as toxic compounds), the availability of suitable electron acceptors, sufficient nutrient levels, contaminant bioavailability, and favorable redox conditions [12,16].
Different petroleum fractions may require distinct approaches; thus, pre-characterization of petroleum fractions is essential for selecting the most appropriate remediation technique. For example, lighter hydrocarbons such as benzene, toluene, ethylbenzene, and xylenes (BTEX) are relatively water-soluble, volatile, and more readily biodegradable under aerobic conditions. In contrast, heavier fractions like polycyclic aromatic hydrocarbons (PAHs) or long-chain alkanes are more hydrophobic, less bioavailable, and often require anaerobic conditions or specialized microbial consortia for degradation. These heavier compounds may persist longer in the environment and necessitate more robust physical (e.g., soil excavation) or chemical (e.g., oxidation) treatments [17]. Understanding the type of contamination is crucial for assessing site-specific risks, such as threats to drinking water and vapor intrusion from mobile, volatile BTEX compounds, or long-term soil toxicity from persistent PAHs, and for developing bioremediation strategies tailored to the contaminant profile. Volatile organic compounds can pose an immediate risk to human health through inhalation and ingestion of contaminated drinking water, while polycyclic aromatic hydrocarbons can accumulate in the food chain and lead to chronic toxicity [18,19]. Numerous studies have noted the importance of optimizing bioremediation [20,21], thus, emphasizing the assessment of initial parameters during pre-bioremediation studies. Existing frameworks for contaminated site assessment include risk-based approaches such as RBMNA [22] and multi-criteria decision analysis (MCDA) [23], which integrate environmental, economic, and social criteria for remediation selection. In addition, Life Cycle Assessment (LCA) has been increasingly applied to evaluate the overall environmental sustainability of bioremediation strategies across their life cycle [24]. Recent microbiological frameworks [25] employ molecular biological tools to better understand biodegradation processes and guide remediation strategies. However, these approaches are often data-intensive, process-oriented, or decision-focused. While the indicators used in this study (TPH, toxicity, and microbial abundance) are well established, the novelty lies in their systematic integration into a normalized, weighted scoring framework that provides a simple, quantitative metric for comparing aerobic bioremediation potential.
To be more precise, this study presents a framework for aerobic bioremediation, where higher degradation rates are typically observed at hydrocarbon-contaminated sites, thereby providing a science-based approach to more effectively restoring these sites.

2. Materials and Methods

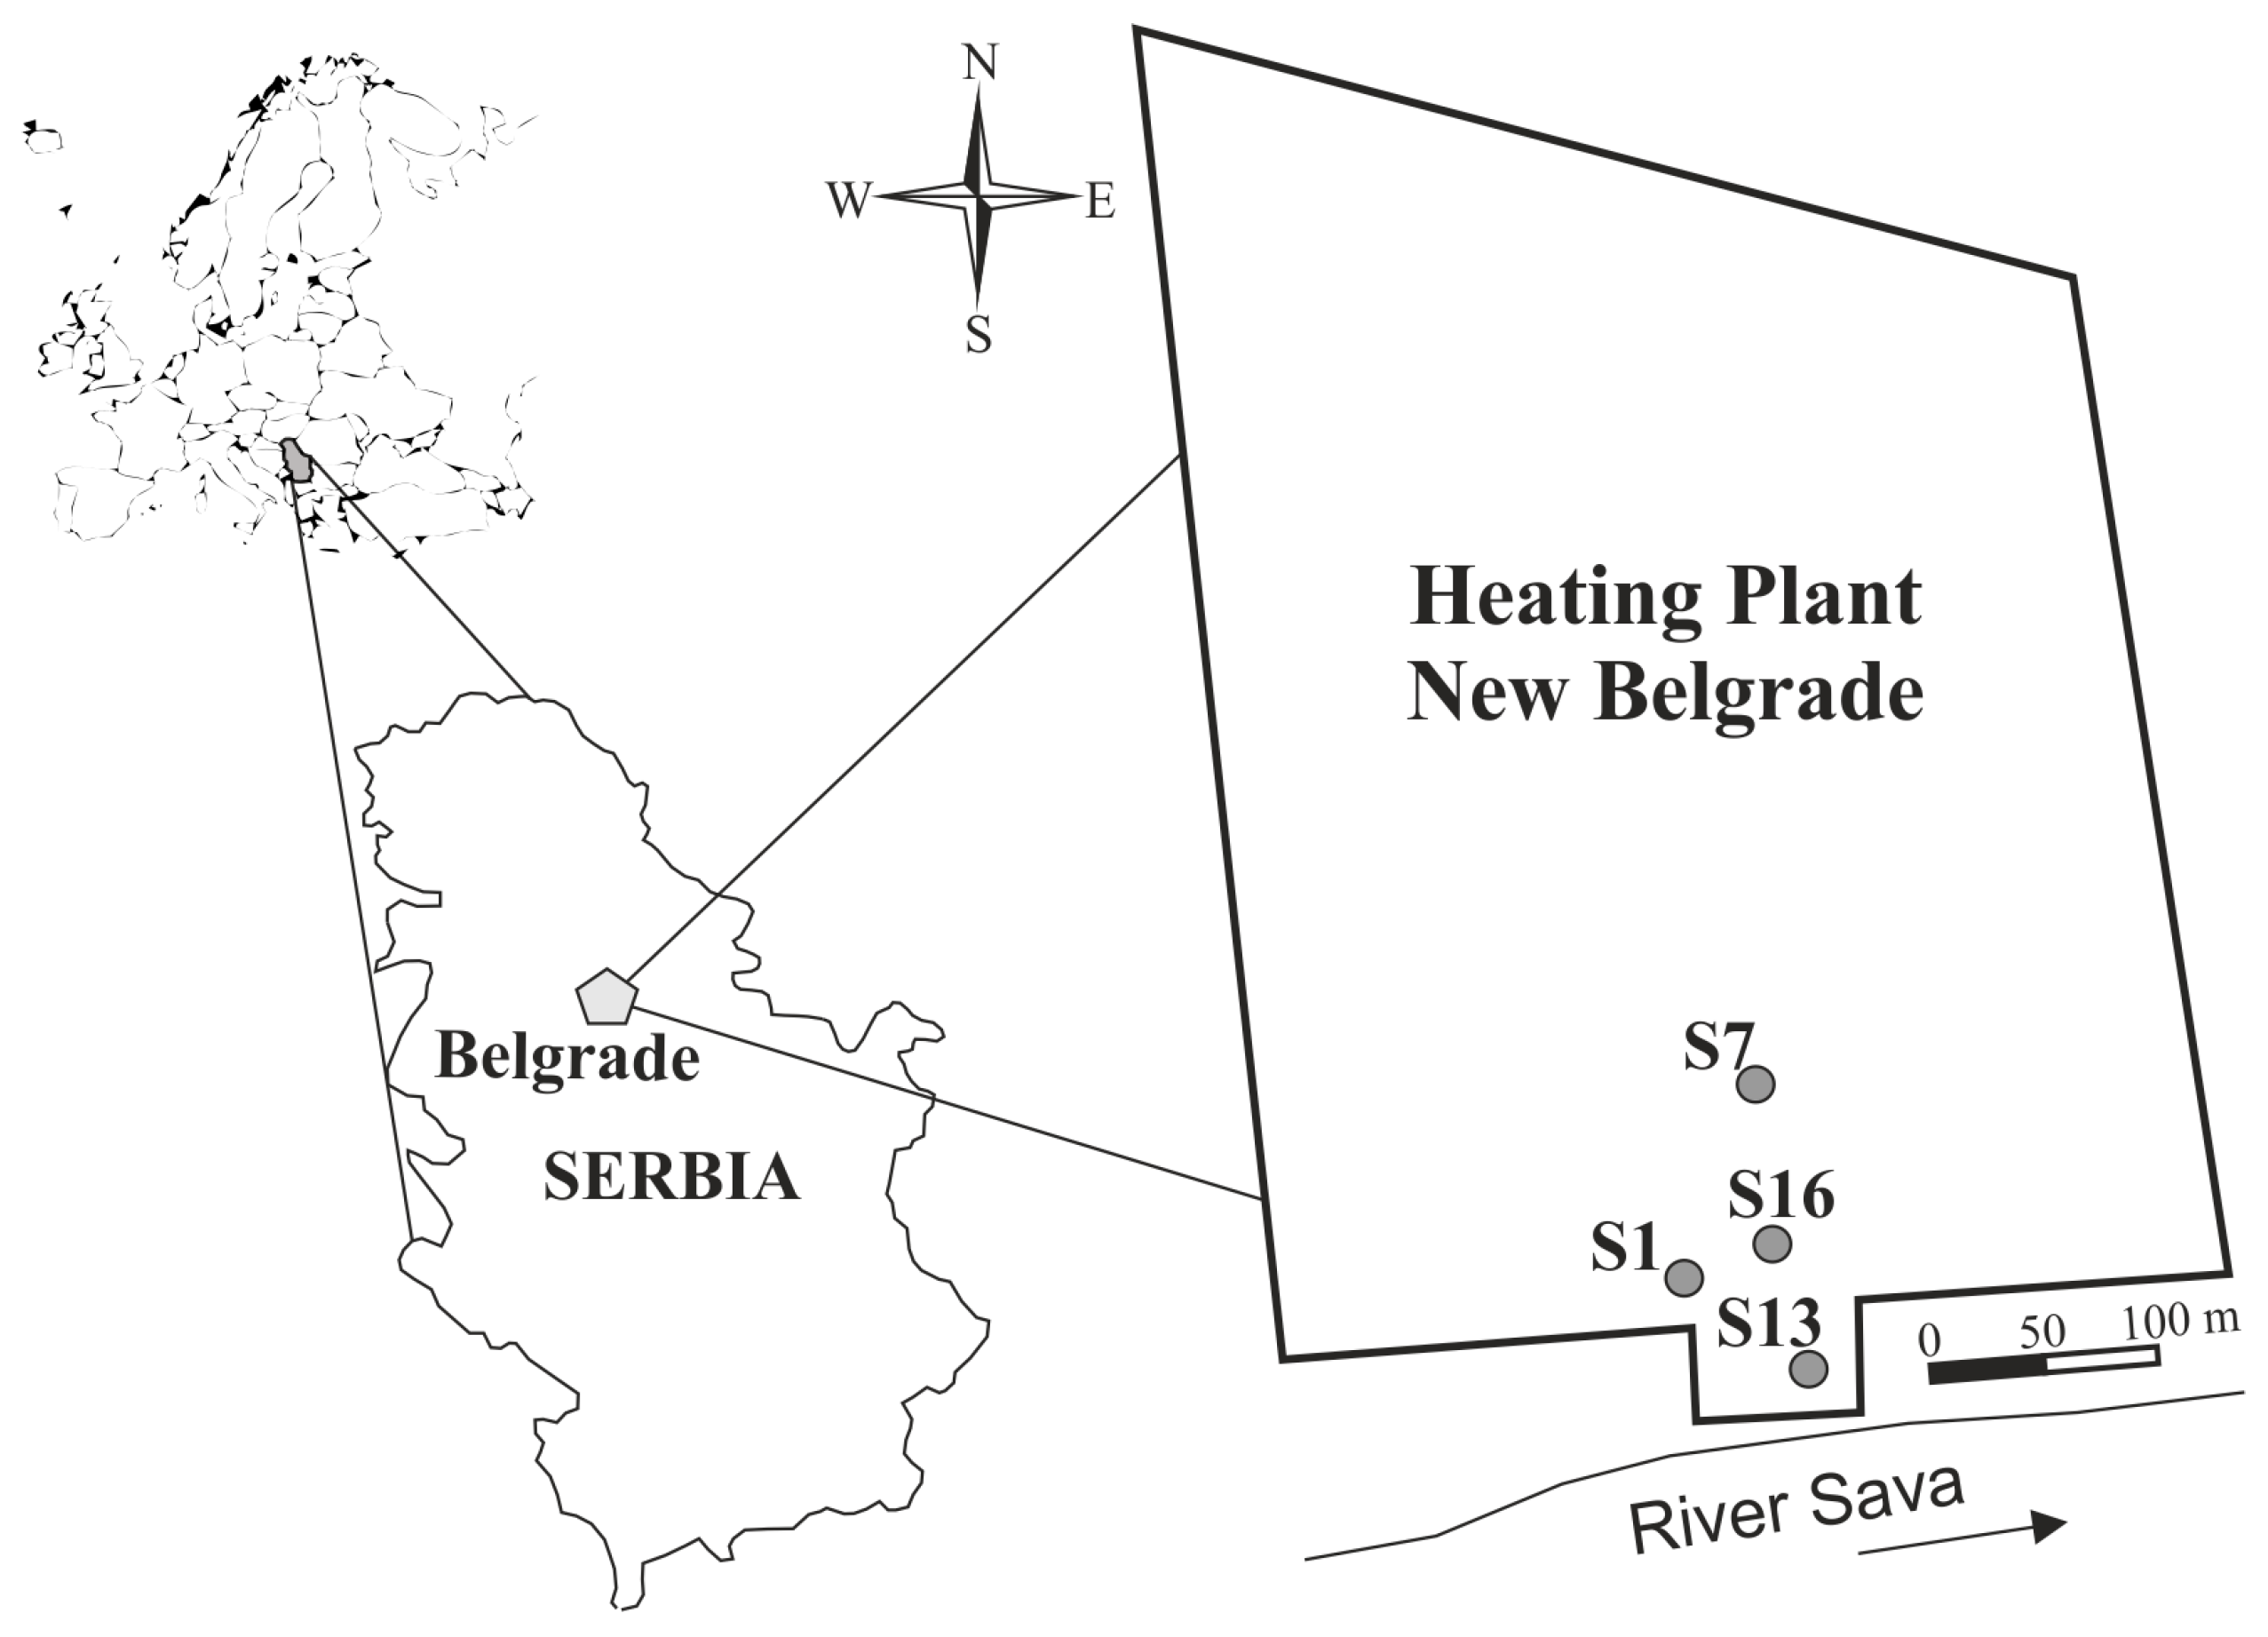
The study area (Heating Plant New Belgrade) is in Belgrade, Serbia (Figure 1). It is situated in the alluvial plain of the Sava River (left riverbank), approximately 1 km from its confluence with the Danube. With a total area of 30 hectares, it is one of the largest heating plants in SE Europe, utilizing natural gas and oil for its operation. Due to historical contamination by petroleum hydrocarbons, the study site has been the focus of various investigations, providing valuable insights into its geological, hydrogeological, and environmental characteristics [26,27,28].

2.1. Methodology

Soil samples were collected using rotary drilling at predefined depth intervals (0.0–15.0 m) at four locations across the contaminated site (S1, S7, S13, and S16). The cores were visually logged and segmented according to the specified depth intervals. Each segment was placed in clean, labeled containers to prevent cross-contamination and preserve sample integrity. In cases where lithological conditions (e.g., rocky or compacted clay layers) hindered core recovery, sampling was adjusted accordingly. The total number of samples collected at each location is provided in Table 1. After sampling, the soil samples were analyzed using a three-step framework (Figure 2). In the first step, the total petroleum hydrocarbon (TPH) content and three hydrocarbon pollutant fractions were quantified to elucidate their distribution within the contamination, particularly the aromatic fraction, which exhibits slower biodegradation and often demonstrates more significant toxic potential.
In the second step, the sample’s toxicity was assessed using ecotoxicological tests that measure luminescence inhibition in a bioluminescent marine bacterium Aliivibrio fischeri (Bio-Lumi kit), and the total number of microorganisms capable of degrading petroleum hydrocarbons was determined by performing serial dilutions of the sample and plating them on agar media. The third step is a scoring matrix evaluation (0–1) developed to normalize the results from the first two steps and direct comparison.
To achieve this, a Min–Max normalization approach was applied. Each parameter was scaled to a value between 0 and 1, allowing for the integration of variables with different units and ranges. An inverted Min–Max scaling was applied to TPH concentrations, as higher levels of contamination typically indicate a more unfavorable environment for bioremediation and may require additional remediation strategies. For toxicity (EC50) and microbial population (CFU), direct Min–Max normalization was used, where higher values correspond to more favorable site conditions.
This normalization approach ensured consistent scoring across all evaluated parameters and enabled the construction of a composite site score. Weights were assigned to each parameter based on the relative importance of each factor: TPH levels (40%, 0.4), toxicity (40%, 0.4), and the number of microorganisms (20%, 0.2). Elevated TPH levels can inhibit microbial activity, while high toxicity can directly harm microbial communities essential for bioremediation. Given their critical and often interrelated impacts, both parameters were assigned equal and substantial weights. Although the number of microorganisms is a significant factor in the bioremediation process, it holds less weight in this evaluation framework. This is because insufficiencies in microbial cells can be effectively addressed through biostimulation or by enhancing microbial consortiums with nutritional elements, as long as toxicity levels are acceptable. The site score was calculated using the following equation:
Site Score = (TPH Score × TPH Weight) + (Toxicity Score × EC50 Weight)
+ (Microorganism Score × Microorganism Weight)
The proposed framework aims to provide a rapid and comparable evaluation of bioremediation potential. Incorporating additional environmental factors (e.g., soil physicochemical properties, redox conditions, and oxygen availability) into future studies could further improve its predictive capability.

2.2. The Total Petroleum Hydrocarbon Determination

The total petroleum hydrocarbon content was determined gravimetrically using the DIN EN ISO 14345:2004 method for waste characterization—determination of hydrocarbon content by gravimetry. In brief, the hydrocarbons were extracted with a mixture of n-heptane and acetone in a 2:1 ratio. The resulting extract was transferred to a separatory funnel for washing. The aqueous phase—containing acetone and all water-soluble compounds—was discarded. The n-heptane phase was then further purified by passing through a column filled with Florisil and anhydrous sodium sulphate. The sodium sulphate was used to remove residual water, while the Florisil retained soil pigments and other polar impurities, thus acting as a selective filter. The purified n-heptane extract was collected in a weighed flask, evaporated to dryness under a gentle stream of nitrogen, and the remaining residue was weighed to determine the mass of hydrocarbons extracted.

2.3. The Total Extractable Organic Matter Determination

The total extractable organic matter was extracted using the Soxhlet method and then separated chromatographically in an adsorbent column to quantify its components by the method of [14]. Three fractions were investigated: saturated hydrocarbons (first fraction), aromatic hydrocarbons (second fraction), and alcohols and ketones (third fraction) [29].

2.4. Toxicity Determination

Ecotoxicological tests measuring luminescence inhibition emitted by the marine bacterium Aliivibrio fischeri were conducted following the ISO 11348-1:2007 method [30].
To prepare the soil extract for the toxicity tests, 9 g of air-dried soil were weighed and placed in a clean container. To this, 90 mL of distilled water was added. The mixture was stirred overnight to ensure thorough extraction of the water-soluble substances from the soil. The next day, the suspension was centrifuged for 10 min at 8000 rpm to separate solid particles from the liquid phase. The resulting supernatant was filtered to remove any remaining particles. The clear filtrate was then frozen at −18 °C and stored until further analysis.
The toxicity of the soil extract was analyzed with the bioluminescent marine bacterium Aliivibrio fischeri according to the ISO 11348 standard. Freeze-dried bacteria (BioFix® Lumi-10, Macherey-Nagel GmbH & Co. KG, Düren, Germany) were rehydrated in a reconstitution solution provided by the manufacturer. Prior to testing, the reconstituted bacteria were incubated for 15 min at 15 °C with a range of sample dilutions: 50%, 25%, 12.5%, 6.25% and 3.125%. The inhibitory effect on bacterial luminescence was measured and expressed as a percentage of inhibition compared to a control. From these results, the EC50 value, defined as the effective concentration causing a 50% reduction in luminescence, was calculated. All toxicity tests were performed in triplicate and the mean values were reported.

2.5. Microbial Population Characterization

The number of aerobic microorganisms capable of degrading petroleum hydrocarbons was determined by plating serial dilutions on agar plates incubated at 28 °C. The medium used was a mineral base medium [31] containing 2 g of standard D2 diesel fuel in 1 dm3 of medium [32] for microorganisms that decompose hydrocarbons [33,34].
The number of aerobic microorganisms capable of degrading petroleum hydrocarbons was determined in a composite sample obtained by proportionally mixing samples from the first three depths (0.0–0.3 m, 0.5 m and 1 m) in a 1:1 ratio.

2.6. Statistical Analysis

Soil samples were collected in the field as composite samples using the quartering method according to EPA protocol (https://www.epa.gov/sites/default/files/2015-06/documents/Soil-Sampling.pdf accessed on 15 May 2016). Thus, one representative sample per sampling point was obtained for TPH determination and microbial counts. Consequently, no independent replicate measurements were available for these parameters, and formal hypothesis testing was not applicable. For the Vibrio fischeri assay, results were expressed in accordance with the relevant ISO procedure, including standard deviations and confidence intervals for EC50 where applicable. Additionally, a sensitivity analysis of the scoring model was performed by varying the weighting scheme to assess the robustness of the final ranking (Supplementary Materials). The sensitivity analysis showed that changes in the weighting scheme affected the numerical values of the final scores but did not change the ranking order of the samples. In all seven scenarios, the ranking remained Z16 > Z1 > Z7 > Z13. The largest relative variation occurred for Z13, as expected given its low baseline score, while the highest-ranked sample (Z16) showed only minor variation across scenarios. These results confirm the robustness of the final ranking (Supplementary Materials).

3. Results and Discussion

3.1. The Total Petroleum Hydrocarbons (TPH)

The highest TPH content was observed in the surface sample (0.0–0.3 m depth) at location S16, measuring 1428.57 mg/kg. This sample also represented the most contaminated surface layer. In the subsurface layer (0.5–1.0 m depth), the highest TPH concentration was recorded at location S13, with a value of 728.17 mg/kg. Sampling between depths of 2 and 5 m was impeded by a rocky layer. At a depth of 15 m, the highest TPH content was registered at location S1, measuring 600.47 mg/kg (Table 1).

3.2. Fractional Separation of Total Extractable Organic Matter

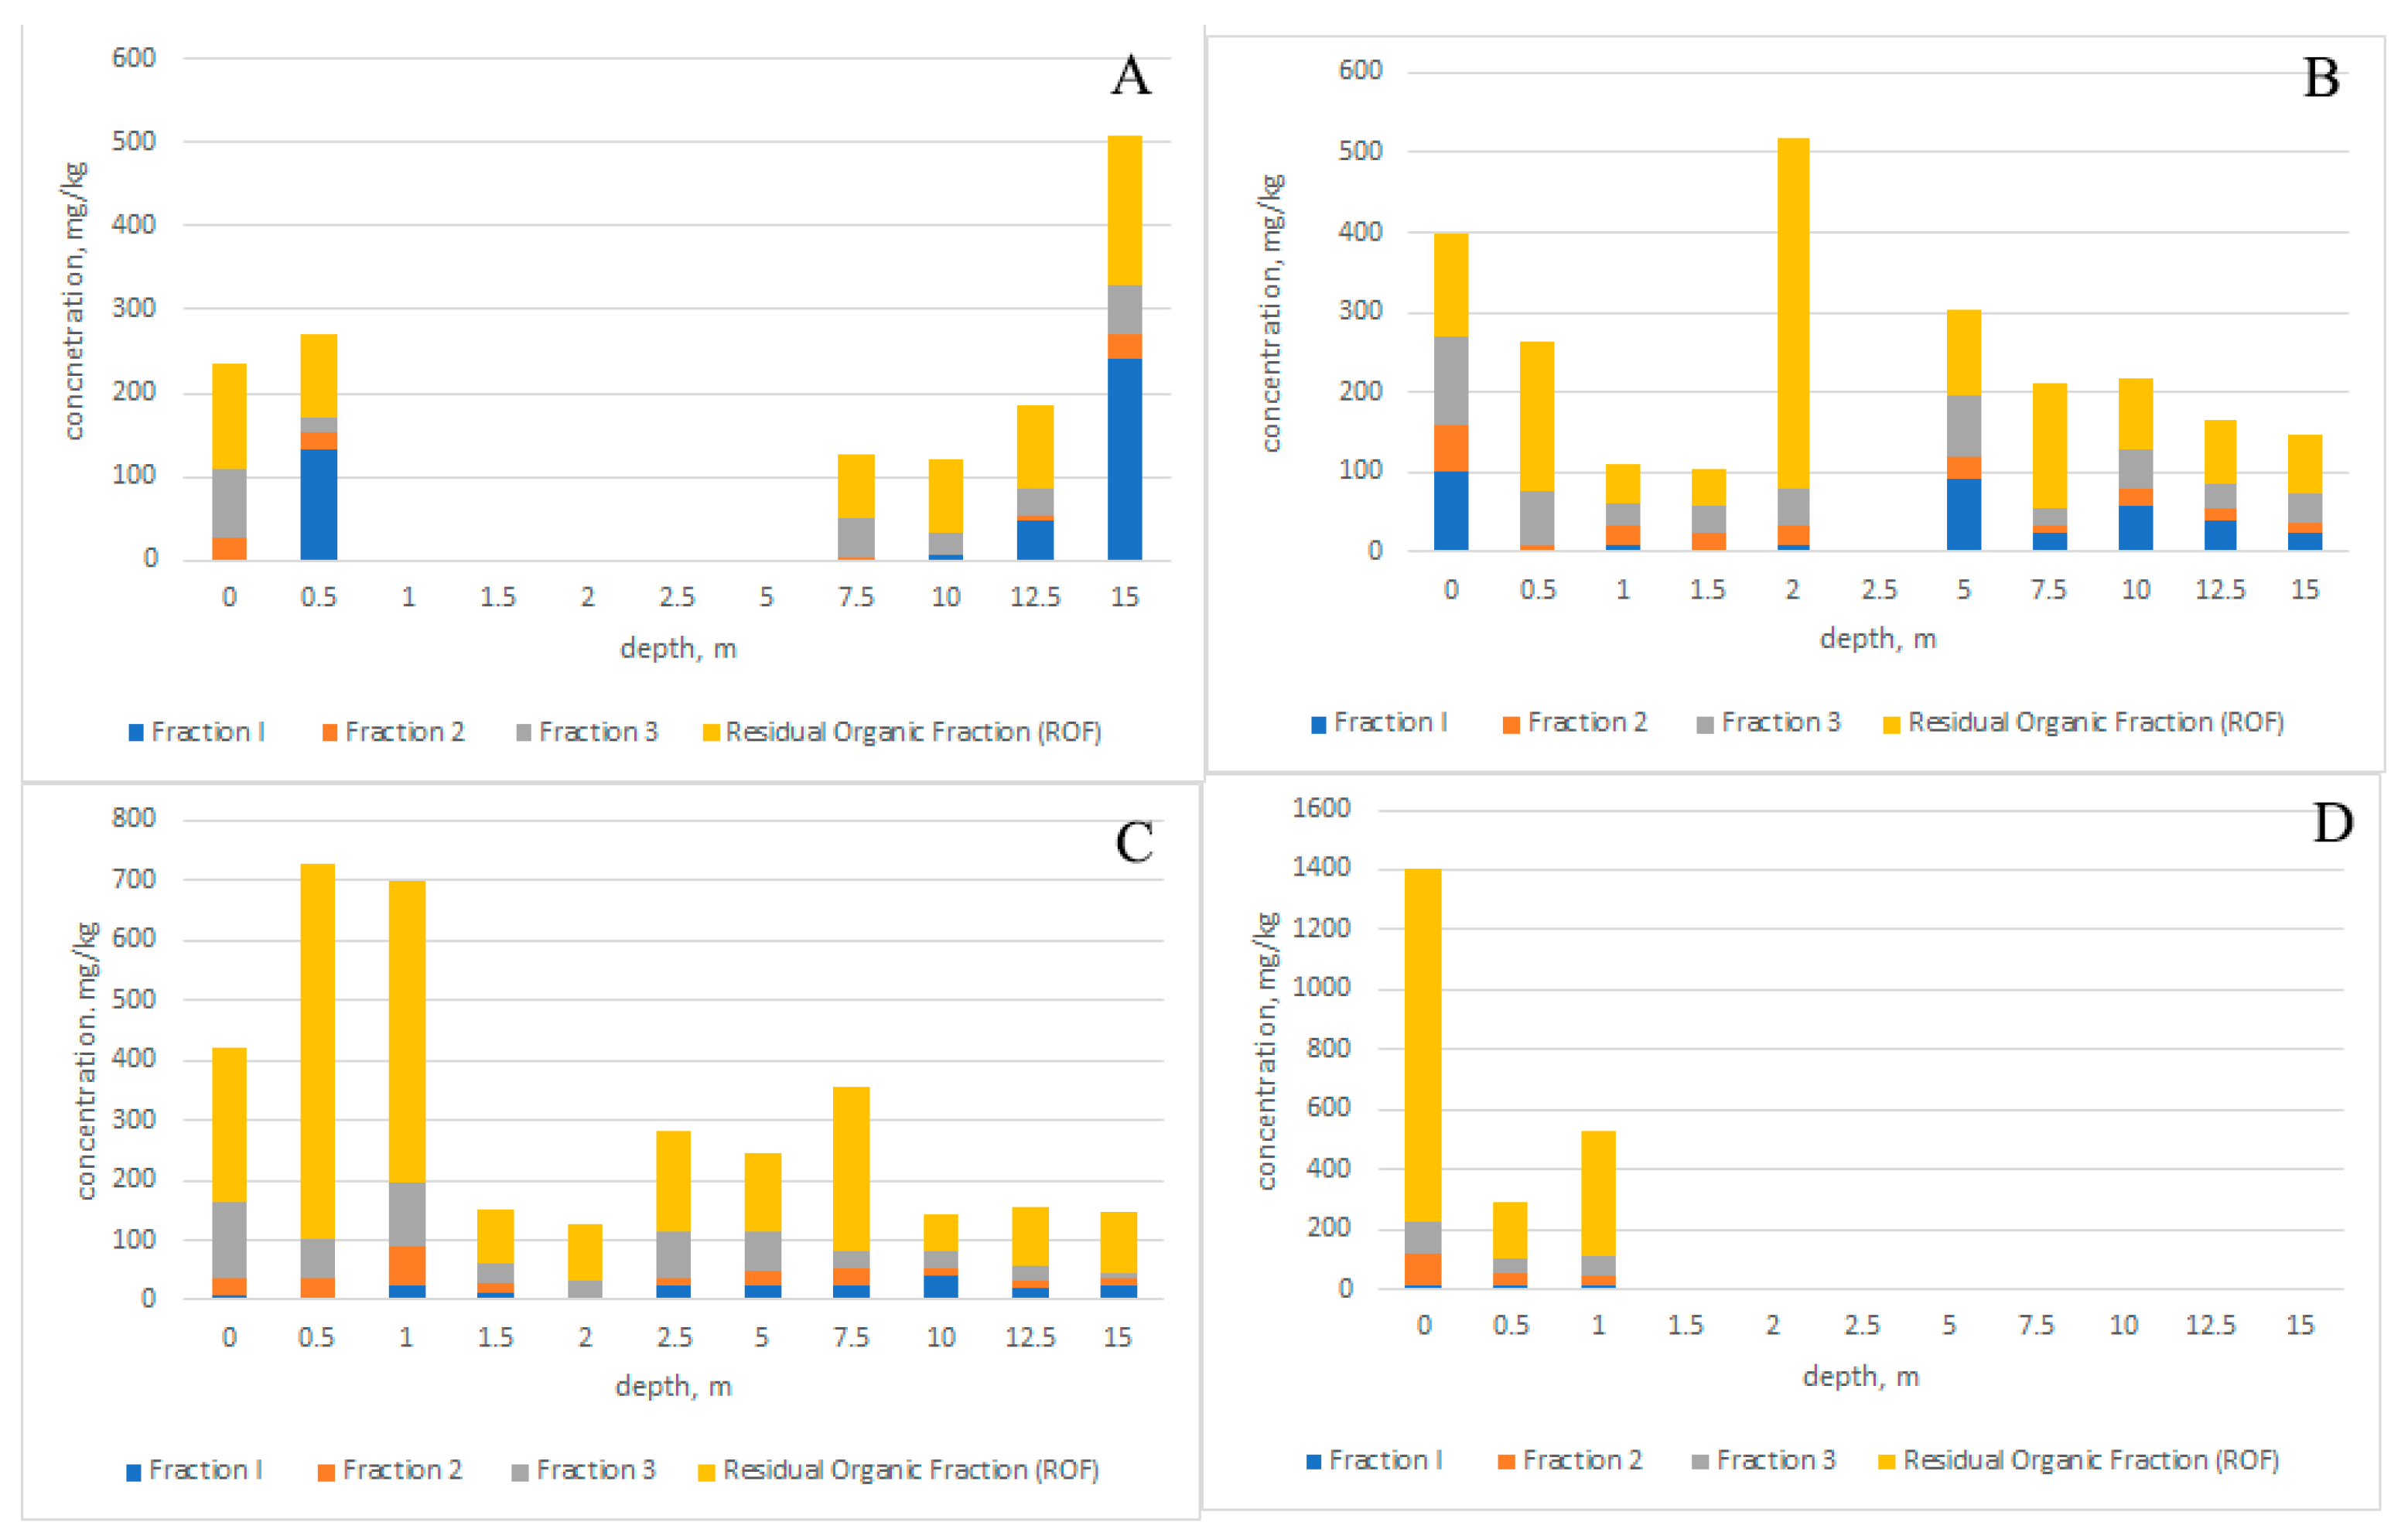
Following fractional separation on the column, the mass of each fraction in all samples was determined using the gravimetric method. The concentration of each fraction in the samples was then calculated. The first fraction comprises saturated hydrocarbons, the second contains aromatic hydrocarbons, and the third consists of alcohols and ketones (Figure 3).
At location S1, the first fraction, rich in saturated hydrocarbons, is most prevalent at depths of 0.5 m and 15.0 m. The second fraction, consisting of aromatic hydrocarbon compounds, is prominent at the surface and at the deepest depth of 15 m at this location. The third fraction, containing alcohols and ketones, shows high representation at the surface and at deeper depths of 7.5 m, 10.0 m, 12.5 m and 15 m. Sampling from depths of 1 to 5.0 m was not conducted due to the presence of a rocky layer. At location S7, the fractions are prominent at the surface layer and at a depth of 5 m, compared to the concentrations at all examined depths. Soil sampling at a depth of 2 m was not conducted due to a rocky layer presence.
At location S13, the fraction containing alcohols and ketones is most abundant at depths of 0.0–0.3 m, 2.5 m, and up to 5.0 m, while the highest concentrations of the aromatic hydrocarbons fraction were determined at a depth close to the surface (0.5 m) and at 7.5 m. Saturated hydrocarbons are most prevalent at depths of 7.5 m, 10.0 m and 12.5 m. Soil sampling at a depth of 15 m was not conducted due to a rocky layer occurrence.
At location S16, the third fraction, containing alcohols and ketones, and the second fraction, containing aromatic hydrocarbons, shows the highest concentration at depths of 0.5 m and 1.0 m. Saturated hydrocarbons are most prevalent at a depth of 0.5 m; their concentrations are much lower compared to the other fractions. Sampling at all deeper soil depths was not conducted due to a rocky layer in the ground.

3.3. Toxicity Screening Utilizing Aliivibrio fischeri

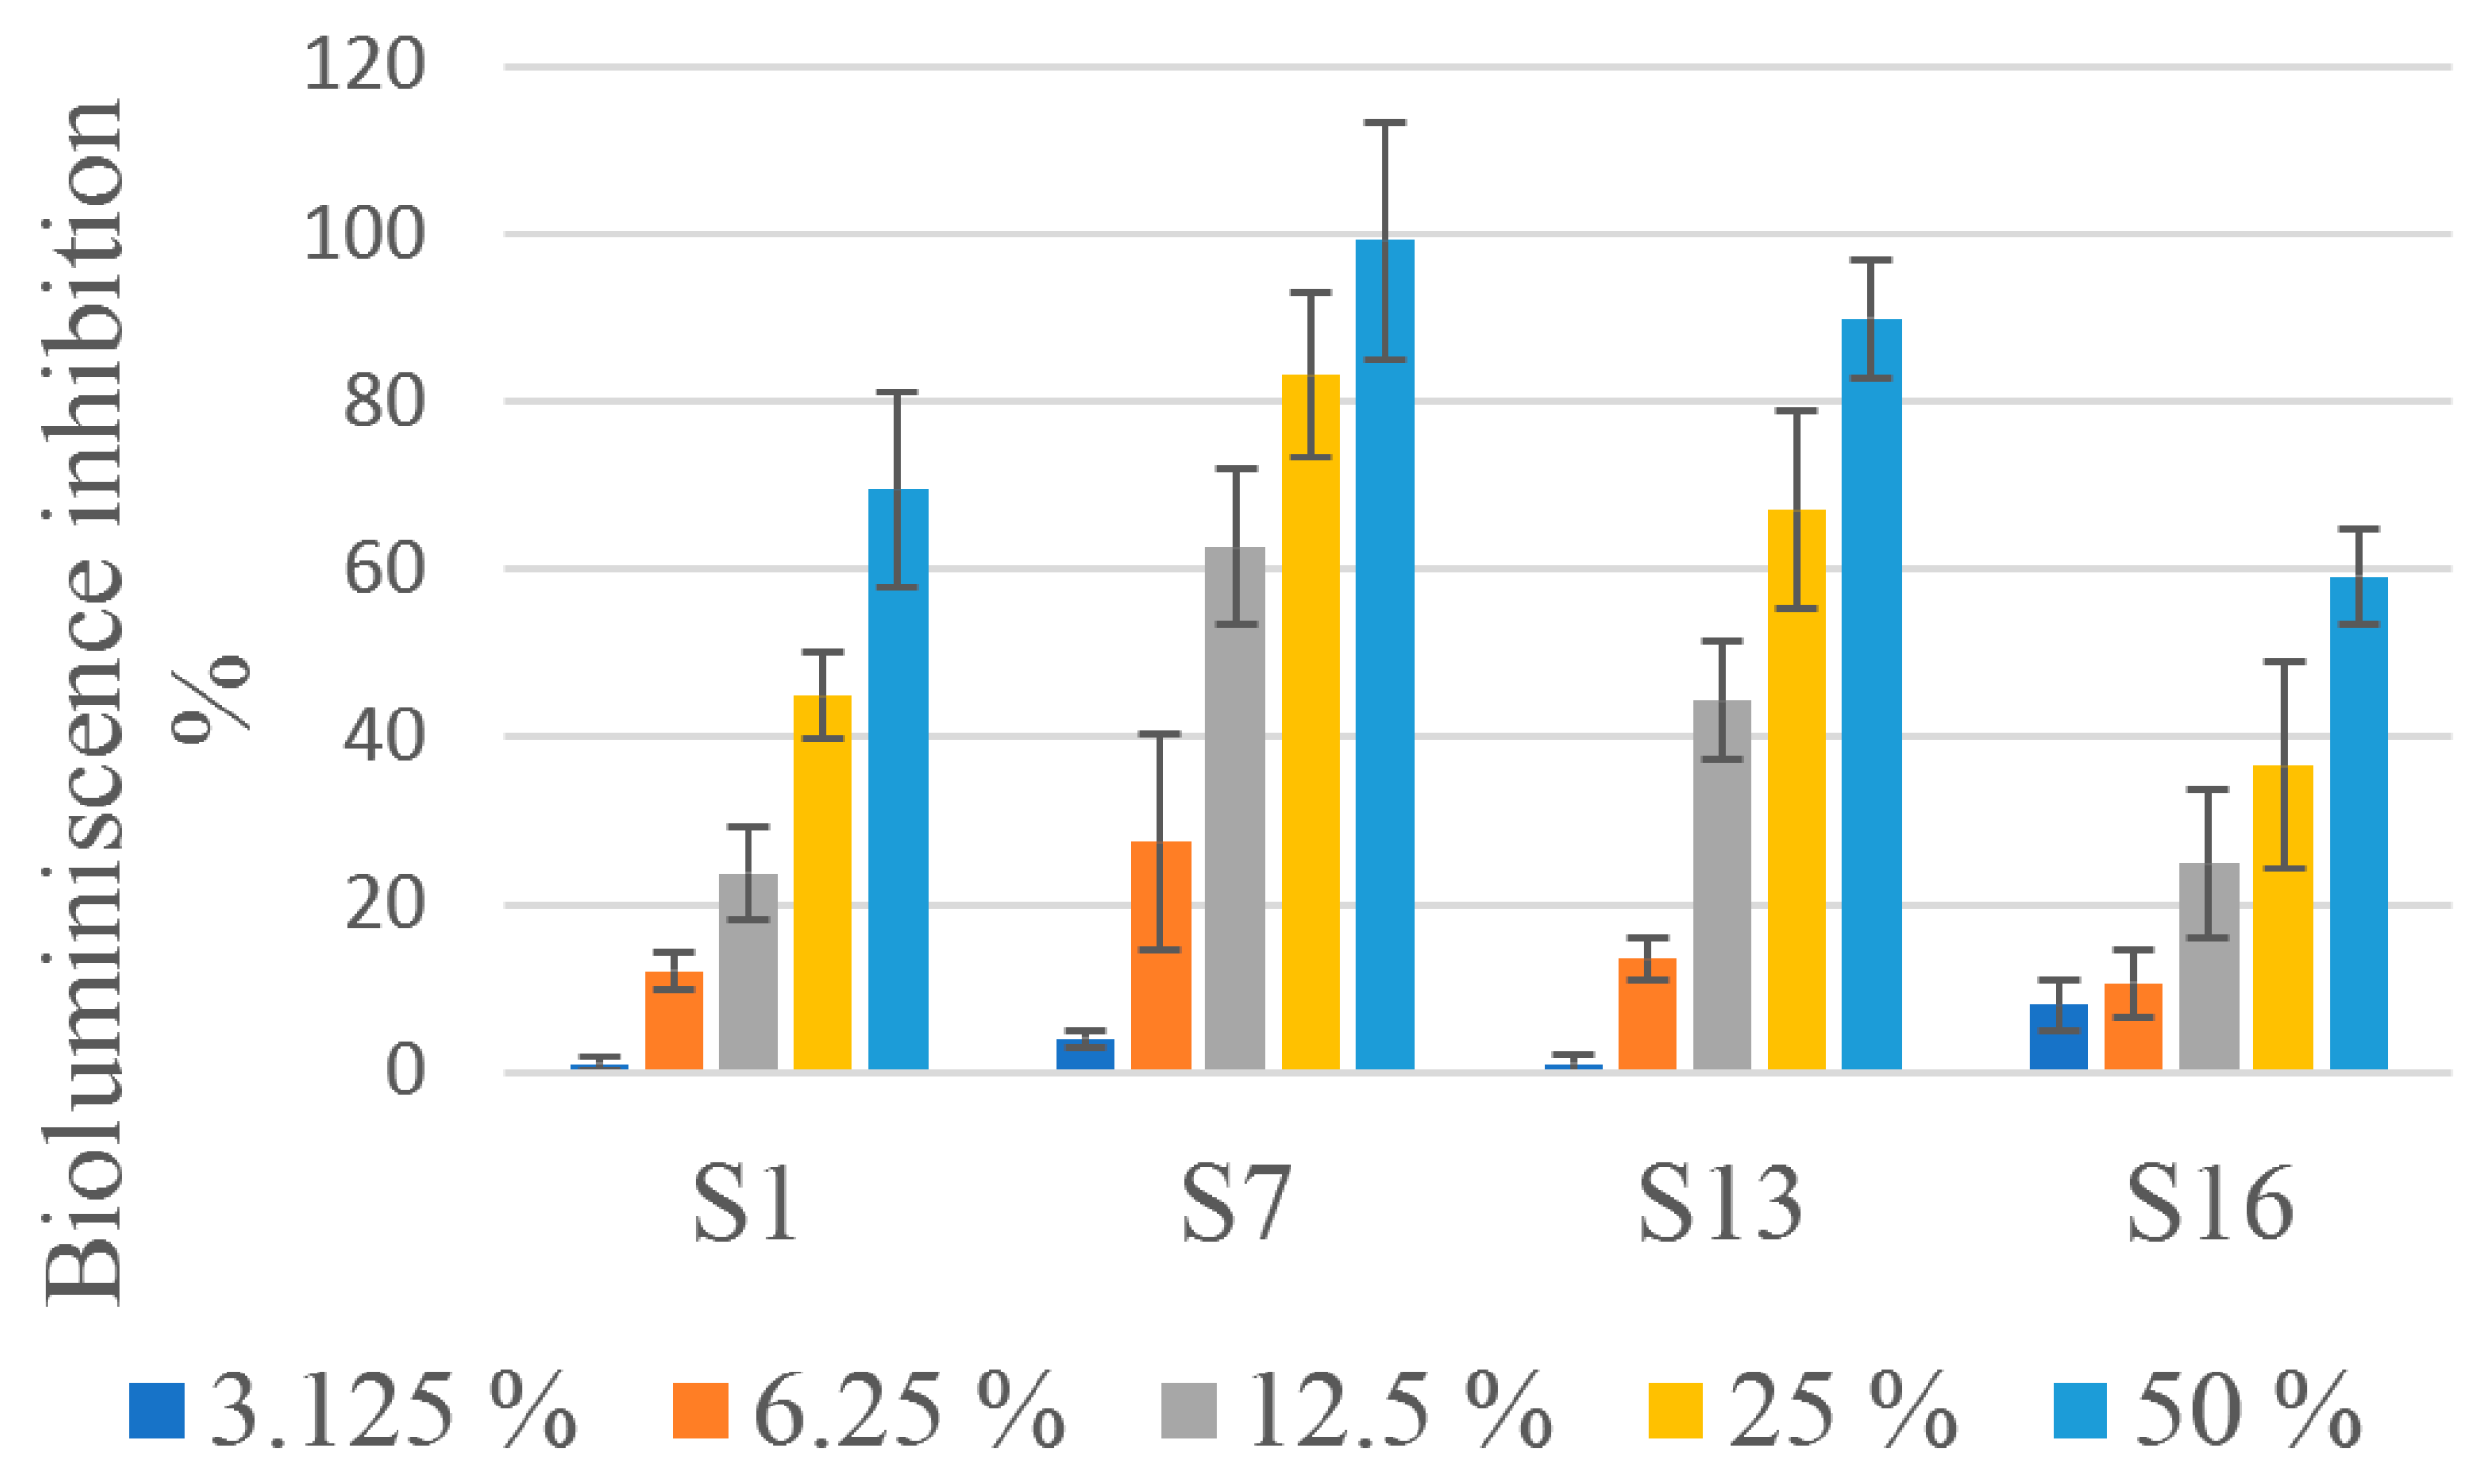
The toxicity test was conducted on each location’s sample with the highest TPH content. Water extracts were tested after 15 min of incubation. The bioluminescence inhibition in Aliivibrio fischeri was measured in water extracts at concentrations of 3.125%, 6.25%, 25%, and 50% over 15 min.
The results of the acute ecotoxicity test are presented in Figure 4, where different bars represent different dilutions of the starting solutions. Based on the obtained results, EC50 values were calculated for the sample S1, S7, S13 and S16 as: 31.75 ± 12.65%, 9.9 ± 1.75%, 11.98 ± 1.41% and 38.51 ± 2.03%, respectively. The corresponding E20 values for these samples were calculated as: 7.94 ± 1.22%, 7.14 ± 1.78%, 6.64 ± 1.42%, and 13.63 ± 8.55%, respectively.

3.4. Total Microorganism Count

The count of aerobic microorganisms that degrade hydrocarbons is expressed as CFU (colony-forming units) per milliliter (CFU/mL). The results for samples S1, S7, S13, and S16 are 2.00 × 10⁶, 1.20 × 10⁴, 1.10 × 10⁵, and 1.50 × 10⁷ CFU/mL, respectively.

3.5. Scoring Matrix Evaluation

A scoring matrix (0–1) was developed to normalize the obtained results, enabling direct comparison. As mentioned above, TPH values were normalized on an inverted scale since higher concentrations may indicate excessive contamination that could hinder biodegradation. A direct scaling method was used for toxicity and microbial populations: higher EC50 values indicate lower toxicity, while higher CFU values reflect greater microbial abundance, suggesting better bioremediation potential. Total scores for evaluating bioremediation potential (Table 2) were calculated according to the equation from the Section 2.1.
The S1 location has the second-highest score, indicating good potential for bioremediation. The high inverted TPH score (0.4) and moderate EC50 score (0.305) contribute significantly to the overall score. However, the low CFU score (0.027) suggests limited microbial activity, which could indicate that the bioremediation process will need to focus on the biostimulation of the consortium (under laboratory conditions or by nutrition adaptation at the site).
The S7 location has a relatively low score, primarily due to the absence of EC50 and CFU contributions. The TPH score (0.220) is moderate, but the lack of microbial populations and toxicity reduction potential indicates that this site is poorly suited for bioremediation without extensive additional interventions.
The S13 location has the lowest score, suggesting it is the least favorable for bioremediation. The absence of an inverted TPH contribution (0.0), combined with very low EC50 (0.029) and CFU (0.001) scores, indicates poor bioremediation potential and the need for considerable pre-treatment at this location.
The S16 location has the highest bioremediation potential score. The balanced contributions of inverted TPH (0.267), EC50 (0.4), and CFU (0.2) reveal optimal conditions for microbial activity and lower toxicity, which provide the basis for efficient bioremediation.
Locations S7 and S13 showed the highest relative abundance of the aromatic hydrocarbon fraction (fraction 2), which may contribute to their lower overall scores and reduced bioremediation efficiency. Aromatic hydrocarbons are generally more recalcitrant than saturated hydrocarbons due to the stability of their ring structures, making them less readily biodegradable and often more persistent in contaminated soils. Their presence is also environmentally significant, as aromatic compounds are frequently associated with increased ecotoxicological effects. While some simpler aromatic hydrocarbons may undergo aerobic biodegradation, the degradation of more complex aromatic structures is often slower and may depend on the complementary activity of both aerobic and anaerobic microorganisms. Therefore, the predominance of fraction 2 in these samples suggests that effective remediation may require a combined biodegradation approach, with both aerobic and anaerobic microbial pathways contributing to a higher degree of hydrocarbon removal.
After preliminary investigations, the contaminated area underwent a 12-month remediation using aerobic bioremediation technologies, as described by [27]. The same authors described different dynamics of pollutant degradation using microbiological in situ bioremediation [27]. The locations where the most significant pollutant degradation occurred were B1 and B2, corresponding to S1 and S16, which also showed the highest bioremediation potential in our study. The hydrocarbon content at B1 (S1) and B2 (S16) decreased by 91.4% (±0.6%) and 86.3% (±2.3%), respectively. Location B3, corresponding to S7, showed a much smaller decrease of 68.4% (±1.8%). These results preliminarily validate the predictive value of the scoring matrix through a controlled comparison across multiple locations within the site. All locations were subject to the same bioremediation technology and operational conditions to minimize variability associated with differences in remediation design, environmental conditions, and treatment strategies, thus providing internal validation of the results, with future work necessary to test the applicability of the scoring matrix across other sites.

3.6. Limitations

A limitation of the study is that TPH and microbial abundance were determined from representative composite field samples rather than independent replicates, which restricted the applicability of inferential statistical testing for these parameters. However, this sampling approach was chosen to obtain representative field material under actual environmental conditions. An additional limitation is that potentially relevant site-specific inhibitory factors, such as heavy metals and pH variations, were not included in the analytical characterization, although they may also affect microbial activity and, consequently, the overall efficiency of bioremediation at historically contaminated industrial sites. Another additional methodological limitation is that microbial abundance data were normalized using absolute CFU values rather than log-transformed counts.

4. Conclusions

The efficiency of bioremediation strategies depends on site-specific conditions. Thus, multiple factors must be considered when assessing the potential for bioremediation of hydrocarbon-contaminated sites. A three-step framework for evaluating aerobic bioremediation potential was utilized in this study. According to the scoring system, four locations within the study area were assessed, considering the most critical factors for successful soil bioremediation, such as TPH, toxicity, and microorganism populations. S16 is the most promising location for bioremediation applications due to balanced parameter contributions. Location S1 has good potential but may require strategies to enhance microbial populations (the bioremediation process will need to focus on biostimulation). Locations S7 and S13 have low scores, with S13 being the least suitable and requiring extensive remediation efforts to improve bioremediation potential. This science-based framework emphasizes the importance of site pre-characterization before applying soil bioremediation, thus providing a basis for more effective restoration. The pre-remediation matrix scoring evaluation aligns with the bioremediation efficiency achieved at the analyzed site, confirming its consistency with the field results. However, given the site-specific nature of environmental factors, its broader applicability requires further validation. Although internal validation has been conducted, future work will focus on testing the applicability of the scoring matrix across multiple sites with varying geological and environmental conditions.

Supplementary Materials

The following supporting information can be downloaded at: https://www.mdpi.com/article/10.3390/earth7020065/s1, Sensitivity analysis of the weighted scoring model.

Author Contributions

Conceptualization, M.I., N.M. and J.A.; methodology, G.D.; formal analysis, N.M.; investigation, N.M.; data curation, N.M.; visualization, M.I.; writing—original draft preparation, J.A.; writing—review and editing, J.M., G.D. and N.M.; supervision, M.I. All authors have read and agreed to the published version of the manuscript.

Funding

The authors gratefully acknowledge the financial support provided by the Ministry of Education, Science, and Technological Development of Serbia. This work was funded under Grant No. 451-03-33/2026-03/200026 and Grant No. 451-03-34/2026-03/200169. No contribution from other individuals or organizations is acknowledged.

Data Availability Statement

All data supporting the findings of this study are available within the published article and its Supplementary Materials.

Acknowledgments

As the co-authors of the paper are not native English speakers, we used the AI tool Insta-Text (https://instatext.io accessed on 3 April 2026) for proofreading the manuscript. This AI tool is officially provided by the University of Belgrade to all university staff for manuscript proofreading.

Conflicts of Interest

The authors declare no conflicts of interest.

Abbreviations

The following abbreviations are used in this manuscript:
TPHTotal Petroleum Hydrocarbons
BTEXBenzene, Toluene, Ethylbenzene, Xylenes
PAHsPolycyclic Aromatic Hydrocarbons
EC50Effective Concentration Causing 50% Luminescence Inhibition
E20Effective Concentration Causing 20% Luminescence Inhibition
CFUColony-Forming Units

References

  1. Mayer, P.; Parkerton, T.F.; Adams, R.G.; Cargill, J.G.; Gan, J.; Gouin, T.; Gschwend, P.M.; Hawthorne, S.B.; Helm, P.; Witt, G.; et al. Passive sampling methods for contaminated sediments: Scientific rationale supporting use of freely dissolved concentration. Integr. Environ. Assess. Manag. 2014, 10, 197–209. [Google Scholar] [CrossRef] [Scilit]
  2. Falconi, M.; Grenni, P. International approaches to contamination management: Introduction to the RemTech Europe 2021 Special Series. Integr. Environ. Assess. Manag. 2023, 19, 910–912. [Google Scholar] [CrossRef] [Scilit] [PubMed]
  3. Apostol, G.L.C.; Valenzuela, S.; Seposo, X. Arsenic in groundwater sources from selected communities surrounding Taal Volcano, Philippines: An exploratory study. Earth 2022, 3, 448–459. [Google Scholar] [CrossRef] [Scilit]
  4. Beg, M.K.; Kumar, N.; Srivastava, S.K.; Carranza, E.J.M. Interpretation of fluoride groundwater contamination in Tamnar area, Raigarh, Chhattisgarh, India. Earth 2023, 4, 626–654. [Google Scholar] [CrossRef] [Scilit]
  5. Rashed, M.; Al-Amri, N.; Halawani, R.; Niyazi, B.; El-Sawy, E.S.K.; Masoud, M.; El Osta, M. Multidisciplinary assessment of the subsurface contamination of Al-Musk Lake wastewater dumpsite in Jeddah City, KSA. Earth 2026, 7, 21. [Google Scholar] [CrossRef] [Scilit]
  6. Neff, J.M.; Stout, S.A.; Gunster, D.G. Ecological risk assessment of polycyclic aromatic hydrocarbons in sediments: Identifying sources and ecological hazard. Integr. Environ. Assess. Manag. 2004, 1, 22–33. [Google Scholar] [CrossRef] [Scilit]
  7. Zhang, Y.; Wang, J.; Ge, Z.; Guo, G.; Gao, S. Survey of polycyclic aromatic hydrocarbons and nitrated polycyclic aromatic hydrocarbons in Jiaxing City, China. Environ. Earth Sci. 2014, 71, 1095–1103. [Google Scholar] [CrossRef] [Scilit]
  8. Zemo, D.A.; O’Reilly, K.T.; Mohler, R.E.; Magaw, R.I.; Espino Devine, C.; Ahn, S.; Tiwary, A.K. Life cycle of petroleum biodegradation metabolite plumes and implications for risk management at fuel release sites. Integr. Environ. Assess. Manag. 2017, 13, 714–727. [Google Scholar] [CrossRef] [Scilit]
  9. Armiento, G.; Caprioli, R.; Cerbone, A.; Chiavarini, S.; Crovato, C.; De Cassan, M.; De Rosa, L.; Montereali, M.R.; Nardi, E.; Nardi, L.; et al. Current status of coastal sediments contamination in the former industrial area of Bagnoli-Coroglio (Naples, Italy). Chem. Ecol. 2020, 36, 579–597. [Google Scholar] [CrossRef] [Scilit]
  10. Rusakova, Y.; Plavnik, A.; Abdrashitova, R.; Salnikova, Y.; Wang, X.; Poluyanov, M.; Zaliatdinov, A. Causes of changes in mineralization of underground drinking water in the Shaim oil and gas region of the West Siberian Megabasin. Earth 2025, 6, 5. [Google Scholar] [CrossRef] [Scilit]
  11. Aleksander, M. Biodegradation and Bioremediation; Academic Press: London, UK, 1999. [Google Scholar]
  12. Alvarez, J.P.; Illman, A.W. Bioremediation and Natural Attenuation: Process Fundamentals and Mathematical Models; Wiley: New York, NY, USA, 2006. [Google Scholar]
  13. Chapelle, F.H. The significance of microbial processes in hydrogeology and geochemistry. Hydrogeol. J. 2000, 8, 41–46. [Google Scholar] [CrossRef] [Scilit]
  14. Lješević, M. Rural Ecology; Center for Environment and GIS: Belgrade, Serbia, 2002. (In Serbian) [Google Scholar]
  15. Das, N.; Chandran, P. Microbial degradation of petroleum hydrocarbon contaminants: An overview. Biotechnol. Res. Int. 2011, 2011, 941810. [Google Scholar] [CrossRef] [Scilit]
  16. Milić, J.; Avdalović, J.; Knudsen, T.Š. Microbial bioremediation of the oil polluted environment and the sustainable development goals of pillar Planet of the Agenda 2030. Environ. Dev. Sustain. 2024, 26, 30355–30377. [Google Scholar] [CrossRef] [Scilit]
  17. Philp, J.C.; Atlas, R.M. Bioremediation of contaminated soils and aquifers. In Bioremediation: Applied Microbial Solutions for Real-World Environmental Cleanup; Atlas, R.M., Philp, J.C., Eds.; ASM Press: Washington, DC, USA, 2005. [Google Scholar]
  18. Bulatović, S.; Ilić, M.; Šolević Knudsen, T.; Milić, J.; Pucarević, M.; Jovančićević, B.; Vrvić, M.M. Evaluation of potential human health risks from exposure to volatile organic compounds in contaminated urban groundwater in the Sava River aquifer, Belgrade, Serbia. Environ. Geochem. Health 2022, 44, 3451–3472. [Google Scholar] [CrossRef] [Scilit]
  19. Jomova, K.; Alomar, S.Y.; Nepovimova, E.; Kuca, K.; Valko, M. Heavy metals: Toxicity and human health effects. Arch. Toxicol. 2025, 99, 153–209. [Google Scholar] [CrossRef] [Scilit]
  20. Marić, N.; Ilić, M.; Miletić, S.; Gojgić-Cvijović, G.; Beškoski, V.; Vrvić, M.M.; Papić, P. Enhanced in situ bioremediation of groundwater contaminated by petroleum hydrocarbons at the location of the Nitex textiles, Serbia. Environ. Earth Sci. 2015, 74, 5211–5219. [Google Scholar] [CrossRef] [Scilit]
  21. Bulatović, S.; Marić, N.; Šolević Knudsen, T.; Avdalović, T.; Ilić, M.; Jovančićević, B.; Vrvić, M.M. Bioremediation of groundwater contaminated with petroleum hydrocarbons applied at a site in Belgrade (Serbia). J. Serb. Chem. Soc. 2020, 85, 1067–1081. [Google Scholar] [CrossRef] [Scilit]
  22. Khan, F.I.; Husain, T. Evaluation of a petroleum hydrocarbon contaminated site for natural attenuation using ‘RBMNA’ methodology. Environ. Model. Softw. 2003, 18, 179–194. [Google Scholar] [CrossRef] [Scilit]
  23. Abrams, F.; Hendrickx, L.; Turcanu, C.; Sweeck, L.; Van Orshoven, J. Multi-criteria decision analysis to support the remediation of polluted soils: A review of case studies. Land 2024, 13, 887. [Google Scholar] [CrossRef] [Scilit]
  24. Müller, J.B.; Duarte, G.A.; Corseuil, H.X.; Cherubini, E.; Ramos, D.T. Life Cycle Assessment of Different Bioremediation Technologies: An Approach Towards Sustainable Remediation; Federal University of Santa Catarina (UFSC): Florianópolis, Brazil, 2023.
  25. Key, T.A.; Sorsby, S.J.; Wang, Y.; Madison, A.S. Framework for field-scale application of molecular biological tools to support natural and enhanced bioremediation. Front. Microbiol. 2022, 13, 958742. [Google Scholar] [CrossRef] [Scilit] [PubMed]
  26. Vrvić, M.; Jovančićević, B.; Miletić, S. Detailed Investigations of Petroleum Hydrocarbon-Contaminated Soil at the Heating Plant “Novi Beograd”; Faculty of Chemistry, University of Belgrade: Belgrade, Serbia, 2015. (In Serbian) [Google Scholar]
  27. Lukić, M.; Avdalović, J.; Gojgić-Cvijović, G. Industrial-scale bioremediation of a hydrocarbon-contaminated aquifer’s sediment at the location of a heating plant, Belgrade, Serbia. Clean Technol. Environ. Policy 2024, 26, 1785–1798. [Google Scholar] [CrossRef] [Scilit]
  28. Jovancicevic, B.; Antić, M.; Šolević, T.; Vrvić, M.M.; Kronimus, A.; Schwarzbauer, J. Investigation of interactions between surface water and petroleum-type pollutants. Environ. Sci. Pollut. Res. 2005, 12, 205–212. [Google Scholar] [CrossRef] [Scilit]
  29. Milić, J.; Avdalović, J.; Šolević Knudsen, T.; Cvijović, G.G.; Jednak, T.; Vrvić, M.M. Initial microbial degradation of polycyclic aromatic hydrocarbons. Chem. Ind. Chem. Eng. Q. 2016, 22, 293–299. [Google Scholar] [CrossRef] [Scilit]
  30. ISO 11348-1:2007; Water Quality—Determination of the Inhibitory Effect of Water Samples on the Light Emission of Vibrio fischeri. ISO (International Organization for Standardization): Geneva, Switzerland, 2007.
  31. Löser, C.; Seidel, H.; Zehnsdorf, A.; Stottmeister, U. Microbial degradation of hydrocarbons in soil during aerobic/anaerobic changes and under purely aerobic conditions. Appl. Microbiol. Biotechnol. 1998, 49, 631–636. [Google Scholar] [CrossRef] [Scilit]
  32. Bossert, I.D.; Shor, L.M.; Kosson, D.S. Methods for measuring hydrocarbon biodegradation in soils. In Manual of Environmental Microbiology, 2nd ed.; ASM Press: Washington, DC, USA, 2002; pp. 934–943. [Google Scholar]
  33. Milić, S.J.; Beškoski, V.P.; Ilić, M.; Ali, A.M.S.; Gojgić-Cvijović, G.; Vrvić, M.M. Bioremediation of soil heavily contaminated with crude oil and its products: Composition of the microbial consortium. J. Serb. Chem. Soc. 2009, 74, 455–460. [Google Scholar] [CrossRef] [Scilit]
  34. Avdalović, J.; Đurić, A.; Miletić, S.; Ilić, M.; Milić, J.; Vrvić, M.M. Treatment of a mud pit by bioremediation. Waste Manag. Res. 2016, 34, 734–739. [Google Scholar] [CrossRef] [Scilit] [PubMed]
Figure 1. Geographic position of the investigated area.
Earth 07 00065 g001
Figure 2. Three-step framework for evaluating bioremediation potential.
Earth 07 00065 g002
Figure 3. Fractional distribution of hydrocarbons across different soil depths from locations (A) S1, (B) S7, (C) S13, and (D) S16.
Earth 07 00065 g003
Figure 4. Ecotoxicity of water extracts of samples S1, S7, S13, and S16 after 15 min of exposure. Bar colors indicate different dilutions of the initial extract: 3.125%, 6.25%, 25%, and 50%.
Earth 07 00065 g004
Table 1. Concentration of total petroleum hydrocarbons across samples and depths.
Concentrations of Total Extractable Organic Matter (mg/kg)
Depth (m)S1S7S13S16
0.0–0.3317.23476.08431.201428.57
0.5102.17239.61728.17293.79
1.0NS108.72714.20535.05
1.5NS112.32167.29NS
2.0NS525.72155.24NS
2.5NSNS309.41NS
5.0NS340.18298.05NS
7.5198.46211.69375.83NS
10.0122.50220.82156.13NS
12.5219.77156.13165.60NS
15.0600.47156.13154.12NS
Total1560.602502.213655.242257.41
NS—Not sampled because layer comprised rock or/and clay.
Table 2. Scoring matrix results for evaluation of bioremediation potential.
LocationTPHEC50CFUScore
S10.4000.3050.0270.732
S70.2200.0000.0000.220
S130.000.0290.0010.030
S160.2670.4000.2000.867
Disclaimer/Publisher’s Note: The statements, opinions and data contained in all publications are solely those of the individual author(s) and contributor(s) and not of MDPI and/or the editor(s). MDPI and/or the editor(s) disclaim responsibility for any injury to people or property resulting from any ideas, methods, instructions or products referred to in the content.