Article

Nocturnal Surface Urban Heat Island Dynamics and Climatic Drivers in Bangkok Metropolitan Region: A Decadal Assessment


by
Sitthisak Moukomla
1,
Supaporn Manajitprasert
2,
Nichaphat Petchkaew
3 and
Phurith Meeprom
4,*
1
Research Unit in Geospatial Research and Analytics for Climate and Environment (GRACE), Department of Geography, Faculty of Liberal Arts, Thammasat University, 99 Phahonyothin Rd, Khlong Nueng, Khlong Luang District, Pathum Thani 12120, Thailand
2
Geography Department, Faculty of Education, Ramkhamhaeng University, Bangkok 10240, Thailand
3
Geography Department, Faculty of Humanities and Social Sciences, Thaksin University, Songkhla 90000, Thailand
4
Geo-Informatics Department, Faculty of Humanities and Social Sciences, Burapha University, Chonburi 20131, Thailand
*
Author to whom correspondence should be addressed.
Earth 2026, 7(2), 60; https://doi.org/10.3390/earth7020060
Submission received: 7 March 2026 / Revised: 1 April 2026 / Accepted: 2 April 2026 / Published: 7 April 2026

Abstract

Nocturnal urban heat presents significant but understudied risks within tropical megacities, where high humidity and heat storage in built-up areas prevent nighttime thermal recovery and intensify chronic heat stress. This study investigates the nocturnal surface urban heat island (SUHI) dynamics in the Bangkok Metropolitan Region (BMR) over two decades (2003–2023) with a daytime SUHI comparative baseline. We examined long-term thermal variations using MODIS land surface temperature data and Landsat urban–rural classification. The results demonstrate an increase in nighttime land surface temperature (LST) of 0.109, with nocturnal SUHI proving more persistent than its daytime counterpart with a temperature difference as high as 2.0 °C between urban and rural areas during the night. While daytime SUHI peaked at 6.3 °C in April 2011, with the strongest effects during April–May, nocturnal SUHI exhibited less seasonal variability but sustained elevated values throughout the year. Heat-retaining nocturnal hotspots have expanded from central Bangkok to newly developed urban areas. Cross-correlation analysis suggests that El Niño–Southern Oscillation (ENSO) strongly modulates SUHI anomalies, with maximum cross-correlations for a time lag of 3 months. These results suggest the need for urban adaptation strategies that specifically address nocturnal heat, as well as design strategies such as improved ventilation, high-emissivity materials, green infrastructure allowing evapotranspiration, and cooling centers for vulnerable populations to enhance thermal resilience across the BMR.

1. Introduction

The surface urban heat island (SUHI) effect is a major environmental challenge in many fast-developing countries [1,2]. Increased impervious surfaces, reduced vegetation cover, and elevated anthropogenic heat emissions disrupt the natural energy balance in urban areas [3,4]. These factors exacerbate public health risks, increase urban energy consumption, and reduce the overall livability of cities [5].
Tropical megacities such as the Bangkok Metropolitan Region (BMR) experience particularly intense SUHI effects driven by rapid industrialization and urbanization [6]. The fast economic growth of the BMR has led to a dramatic increase in both impervious surfaces and human activities [7,8]. The urban environment has become increasingly susceptible to heat stress, with adverse implications for environmental sustainability and public health. Research [9,10,11] has examined how microclimates develop in densely built-up areas and interact with surrounding natural systems.
Thermal remote sensing is a vital tool for investigating the processes underlying the SUHI effect. However, many satellite sensors lack either the temporal resolution to capture diurnal variation or the spatial resolution to map intra-urban heterogeneity; achieving both simultaneously remains challenging. While MODIS provides high temporal resolution (daily observations), its moderate spatial resolution (1 km) presents a trade-off that is acceptable for long-term city-scale SUHI monitoring. Earlier work (e.g., [6,12,13,14]) emphasized daytime urban heat islands, and nighttime patterns remain comparatively understudied. Urban areas retain significant heat at night, and this accumulated thermal energy increases thermal discomfort and drives demand for energy-intensive cooling.
Consequently, heat stress intensifies for populations that depend on nighttime cooling for thermal recovery. This nocturnal heat retention is particularly pronounced in tropical cities due to high humidity compounding thermal discomfort during evening hours. When the city nighttime cooling is insufficient, vulnerable populations including the elderly, infants, and low-income residents—many of whom lack access to air conditioning—are put at greater risk of chronic thermal stress [15]. Nighttime temperatures are increasing at nearly double the rate of daytime highs, underscoring the growing significance of nocturnal urban heat islands for climate-resilient urban development [16]. Addressing this gap requires dynamic metrics that capture how urban heat patterns evolve alongside urban development and climate change [17]. However, long-term SUHI studies in tropical urbanized areas remain scarce, and existing observations often lack sufficient temporal coverage to capture decadal trends or climatic cycles [14]. As already seen in the BMR, seasonal and diurnal patterns have received little attention, leaving policymakers without adequate temporal evidence to inform interventions [18].
Nighttime SUHI research in other tropical megacities provides important context for understanding Bangkok’s thermal dynamics. Studies in Singapore [19,20] have documented persistent nocturnal heat islands driven by high building density and limited sky view factors, while Jakarta [21] exhibits intense nighttime SUHI associated with rapid informal settlement expansion and loss of coastal mangrove buffers. Mumbai’s nocturnal SUHI patterns reveal strong interactions between marine boundary layer influences and dense urban morphology [22]. However, Bangkok’s unique combination of extensive water body networks, flat topography, and rapid peri-urban conversion of paddy fields creates distinct nocturnal thermal dynamics that remain underexplored compared to these regional counterparts [23].
Furthermore, the influence of large-scale climate teleconnections, particularly El Niño–Southern Oscillation (ENSO), on SUHI intensity remains insufficiently understood. Recent studies have demonstrated that ENSO phases significantly modulate regional temperature patterns, cloud cover, and precipitation regimes across Southeast Asia, with El Niño events typically associated with reduced rainfall, suppressed cloud formation, and enhanced solar radiation absorption in urban areas. However, the spatiotemporal lag between ENSO climatic forcing and urban thermal responses, and particularly the mechanisms through which ENSO modulates nocturnal SUHI in tropical megacities, remains largely unexplored [24]. These limitations are compounded by methodological trade-offs in existing studies, which either employ high temporal but coarse spatial resolution or achieve fine spatial detail without the temporal coverage necessary for spatiotemporal analysis.
Here, we take advantage of long-term 30 m resolution Landsat for urban–rural classification, and daily MODIS-LST time series for two decades (2003–2023), to achieve continuous thermal monitoring capability. We also perform cross-correlation analysis between SUHI anomalies and MEIv2, providing additional insights into the influence of climate variability on urban heat dynamics in tropical monsoon regions [25]. The framework is applicable to further tropical cities confronting similar urban heat issues. This study systematically analyzes the persistence and seasonal variation of nocturnal SUHI over a two-decade period. The study objectives are therefore to characterize nocturnal SUHI dynamics and investigate their spatiotemporal variation. The findings will enhance understanding of nocturnal SUHI in tropical climates, providing suggestions for urban adaptation responses: enhanced ventilation, higher-emissivity materials, green infrastructure and cooling centers for heat-vulnerable clusters.

2. Material and Methods

2.1. Study Area

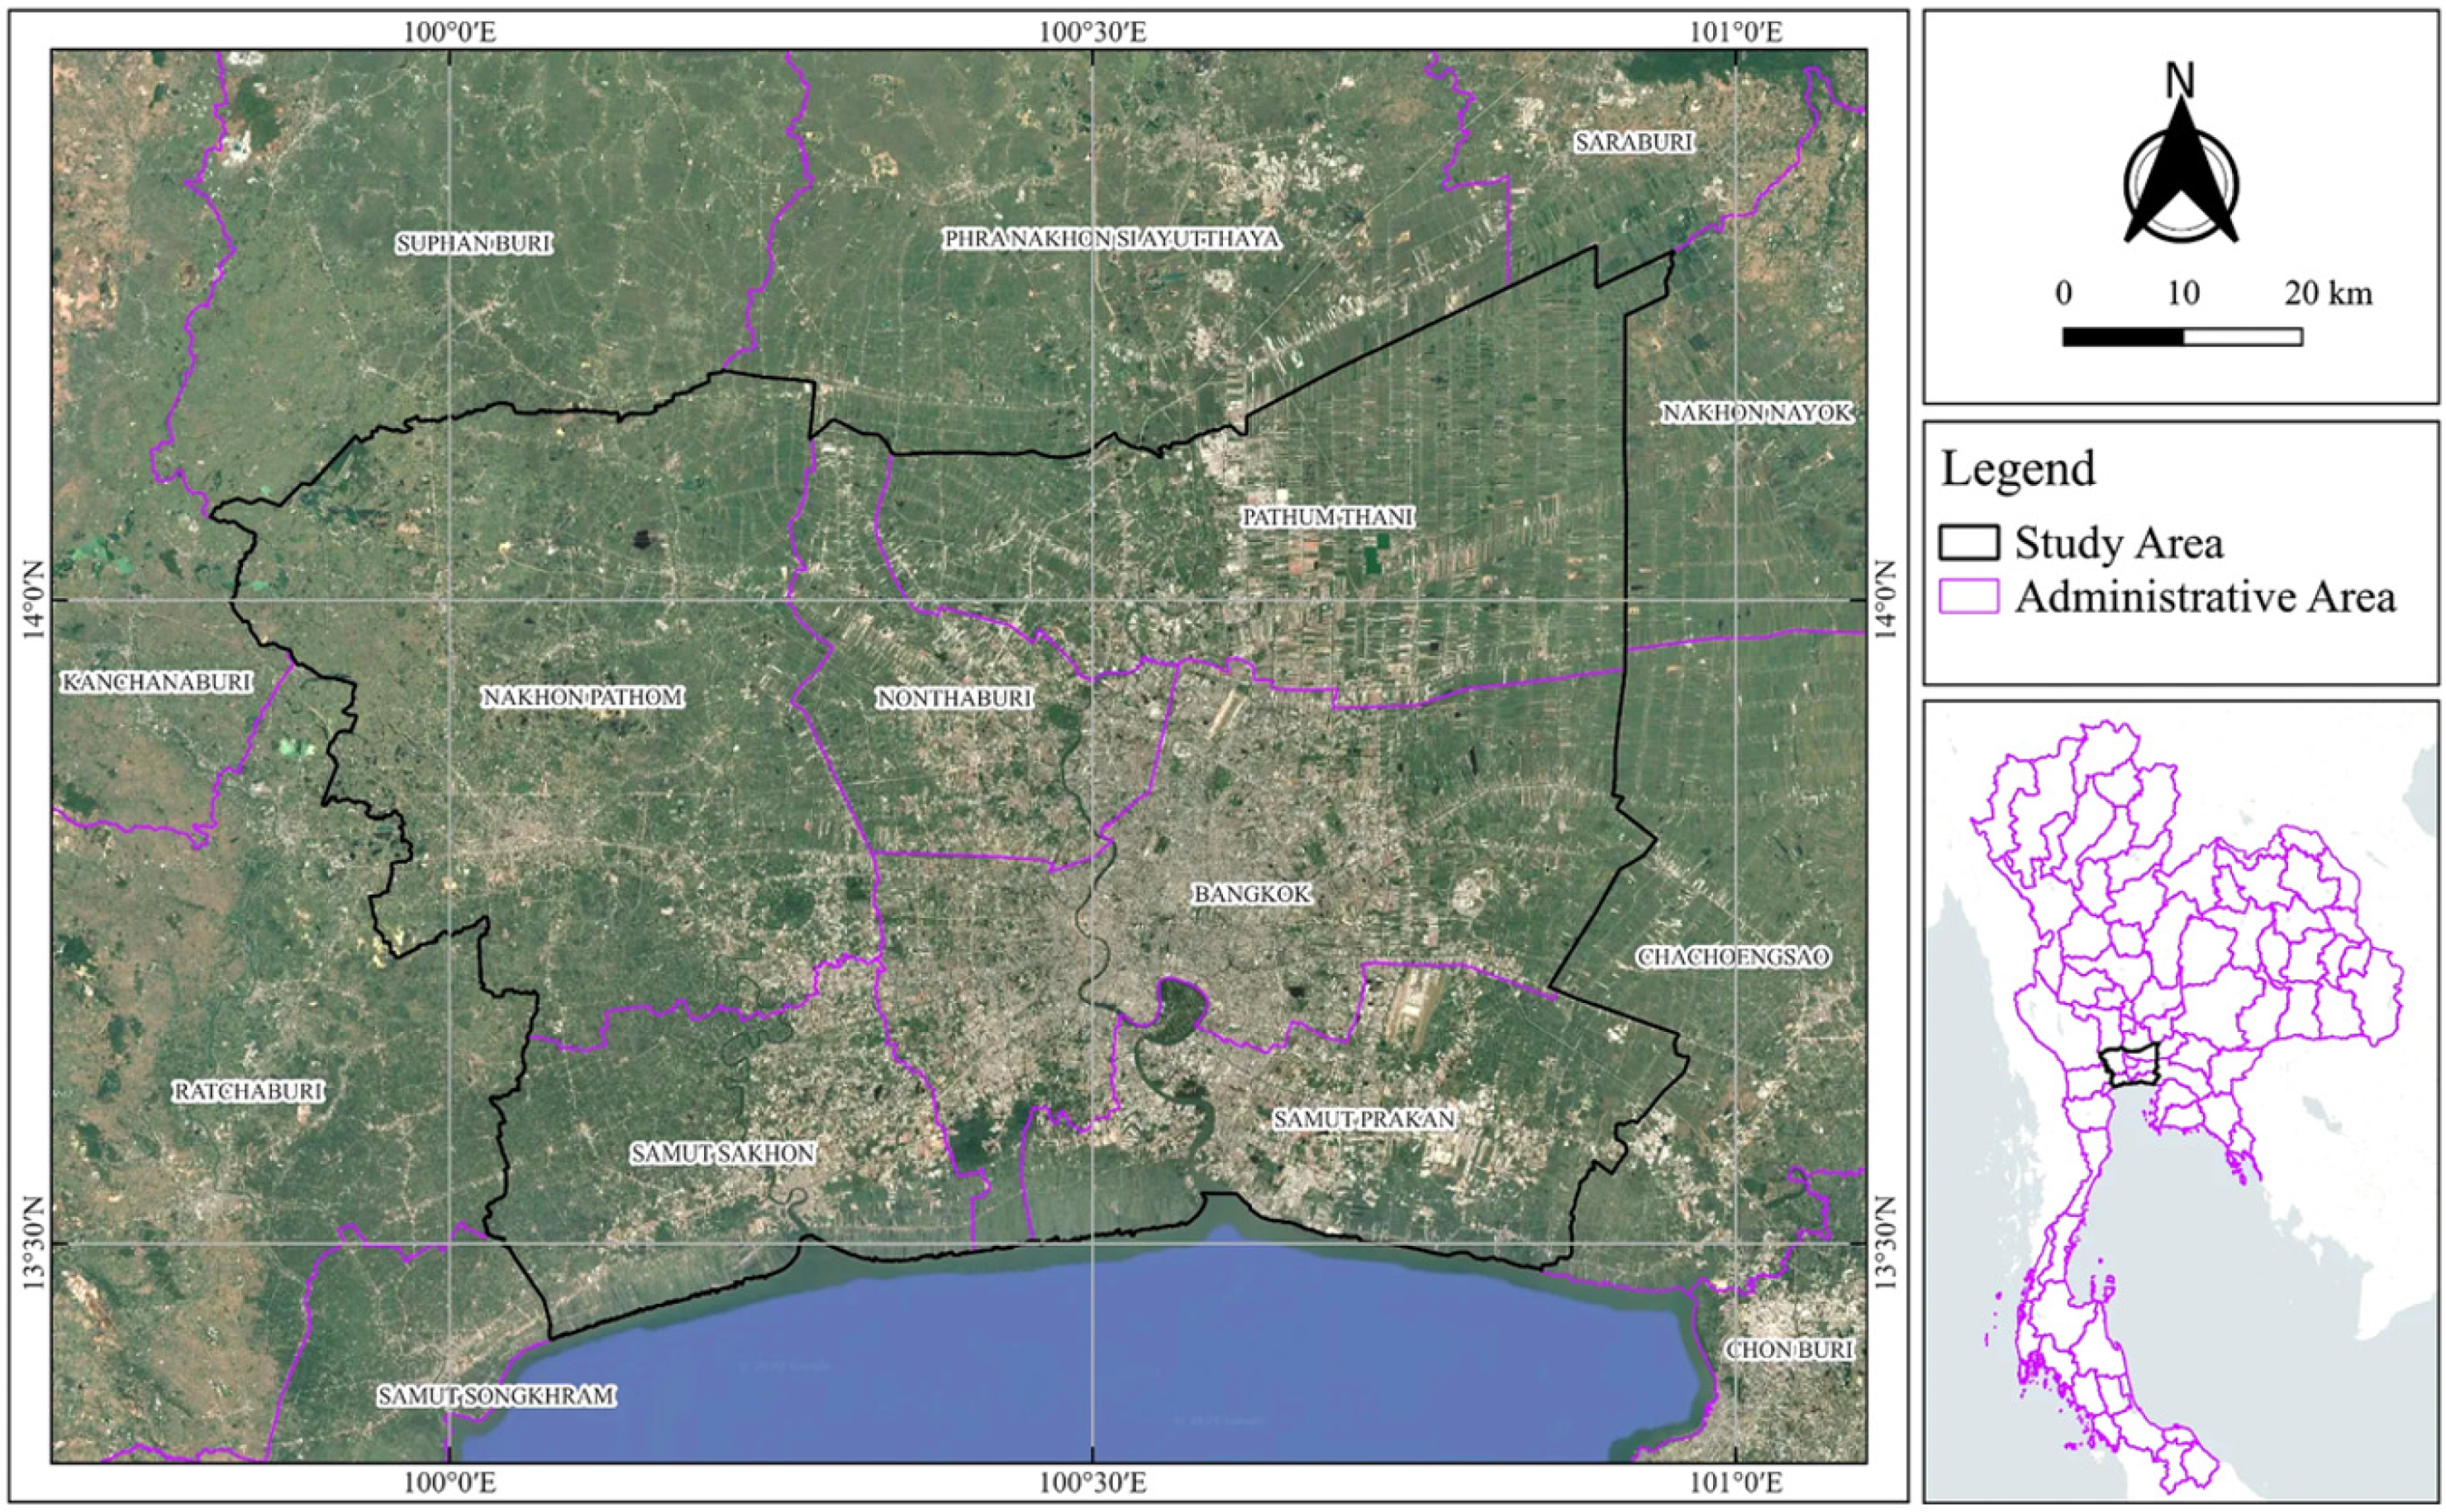
The BMR (Figure 1) extends from Bangkok to the surrounding provinces, covering an area of about 7760 km2. Rapid urbanization turned the region from agriculture to dense urban and suburban development [26]. The fast extension of the urban setting has drastically reduced green spaces and intensified the SUHI effect [27]. The diverse land cover composition of the BMR provides an appropriate setting for examining the relationship between urban growth and thermal dynamics. Understanding the interactions between urbanization, land cover change, and thermal behavior is essential for developing effective SUHI mitigation strategies [28]. The rapid growth and environmental impact of the BMR make it a representative case study for investigating how urban development influences the local climate [29], offering valuable insights into creating healthier, more resilient urban environments.

2.2. Data Collection and Processing

2.2.1. MODIS Land Surface Temperature/Emissivity

We used MODIS Land Surface Temperature/Emissivity (LST/E) Daily L3 Global 1 km data products from the Terra (MOD21A1D and MOD21A1N) and Aqua (MYD21A1D and MYD21A1N) satellites to assess SUHI impacts over the BMR between 2003–2023. MODIS was selected due to its high temporal resolution; Terra passes at approximately 09:00–10:00 UTC and 20:00–21:00 UTC, while Aqua passes at roughly 12:00–13:00 UTC and 02:00–03:00 UTC [28]. Such temporal resolution is suitable for monitoring seasonal and diurnal surface temperature trends [30]. Daily LST observations downloaded from GEE are cloud-free per pixel averages weighted by pixel quality with further filtering to avoid contaminated pixels [29,31]. Although there are major data gaps during Thailand’s monsoon season, the spatial resolution and high temporal frequency of MODIS sensors provide sufficient observations to derive monthly and seasonal results. Due to a fuel shortage, Terra’s orbit was lowered from 705 km to 694 km in October of 2022, resulting in earlier equatorial crossing times and narrower swath widths. The dataset obtained until September 2022 is key to the long-term monitoring of surface temperature trends [32]. This dataset has a spatial resolution of ~1000 m and is produced daily using a physics-based algorithm to retrieve LST and emissivity (as in the algorithm described above), offering significant improvements over previous products by addressing the −3 to −5 K cold bias seen in earlier-generation LST products. It averages cloud-free observations weighted by coverage, but has gaps during Thailand’s rainy season.

2.2.2. Landsat-Based Urban–Rural Classification

To improve the distinction among urban and rural pixels within the BMR, we changed from the MODIS Land Cover Product to Landsat image data with a finer resolution. Data from Landsat 5, Landsat 7, Landsat 8 and Landsat 9 (cloud-free datasets) were analyzed to investigate the SUHI effect for both urban and rural areas between 2003 and 2023. After which, it was used to find vegetated rural areas applying the Normalized Difference Vegetation Index (NDVI) and developed area using the Normalized Difference Built-up Index (NDBI) in Google Earth Engine to expedite processing. The classification thresholds were determined from histogram analysis of spectral index distributions and were verified against Google Earth high-resolution imagery as well as official land use maps from the Land Development Department of Thailand. Urban areas are defined as pixels where NDBI > 0.10 and NDVI < 0.40, indicating predominantly built-up surfaces with limited vegetation cover. Rural areas are defined as pixels where NDVI > 0.40 and NDBI < 0.10, representing vegetated landscapes including agriculture and forests. A sensitivity analysis was performed via varying thresholds by ±0.05 (i.e., NDBI thresholds of 0.05 and 0.15; NDVI thresholds of 0.35 and 0.45), which showed that SUHI intensity estimates remained stable within ±0.15 °C, confirming the robustness of the selected thresholds. To minimize the influence of urban thermal contamination on rural reference temperatures, rural pixels located within a 2 km buffer zone of classified urban boundaries were excluded from SUHI calculations. Transitional pixels not meeting either urban or rural criteria were also excluded to provide maximum contrast. Thresholds were held constant across all study years to ensure temporal comparability [33].
The higher spatial resolution of Landsat data enables more accurate evaluation of SUHI impacts that can be overlooked with lower-resolution datasets [34]. In addition, the combination of Landsat data with MODIS LST data enhances our observation. Landsat provides detailed images with fine spatial detail, while MODIS offers frequent updates, helping us track changes over time. This approach provides a robust toolset to analyze the spatiotemporal variation of SUHI in Bangkok, a fast-growing tropical megacity. This also enables us to understand how urbanization influences local climate patterns [35].

2.3. Estimating Land Surface Temperature

In this study, LST was estimated using MOD21A1D, MOD21A1N, MYD21A1D and MYD21A1N in the study area. The TES algorithm uses a relationship between spectral contrast and minimum emissivity to solve underdetermined radiative transfer equations to simultaneously retrieve LST and surface emissivity. This methodology removes atmospheric effects and accounts for surface emissivity variations, reducing the cold bias previously found in Collection 5 products (3–5 K). MODIS data has been selected due to its frequent revisit time of both daytime and night observations. We applied quality flags to remove pixels contaminated by clouds and observations with high sensor view angles (>45°). Monthly composites were produced by taking the average of all valid daily observations which aids in reducing data gaps during Thailand’s monsoon season (May–October). Spatially explicit analysis of temperature differences throughout the BMR is made possible through spatialization of 1000 m spatially resolved LST data. With the caveat that MODIS LST is a skin temperature product (rather than an air temperature one) subject to systematic biases and heterogeneous urban surfaces, relative urban–rural comparisons and trend analysis using MODIS LST products have been widely validated in tropical contexts.

2.4. SUHI Intensity Calculation

SUHI intensity is computed as the difference of average surface temperature between urban and rural areas [36]. We used an already well-described method commonly applied in the literature [37]. Here we employ Landsat-based land cover classification to separate out the built-up city from the more unbuilt, non-water, lowland rural pixels in the surrounding habitat at certain distances [31]. Then, SUHI intensity is calculated based on at least 50% cloud-free total urban pixels. Such a threshold enables us to maximize the number of days for which satellite images are available, while minimizing data unreliability. We use Oke’s equation [38] to calculate the SUHI as follows:
S U H I   =   L S T U r b a n     L S T R u r a l
where LSTUrban is the mean LST of the specified urban unit boundaries. On the other hand, LSTRural is calculated in the rural locations. In addition, we apply Hotspot Analysis Getis-Ord Gi* to our SUHI study to categorize and comprehend the spatial dissemination of extreme temperature variations within the urban landscape.

3. Results

3.1. Urbanization Dynamics in the Bangkok Metropolitan Region (2003–2023)

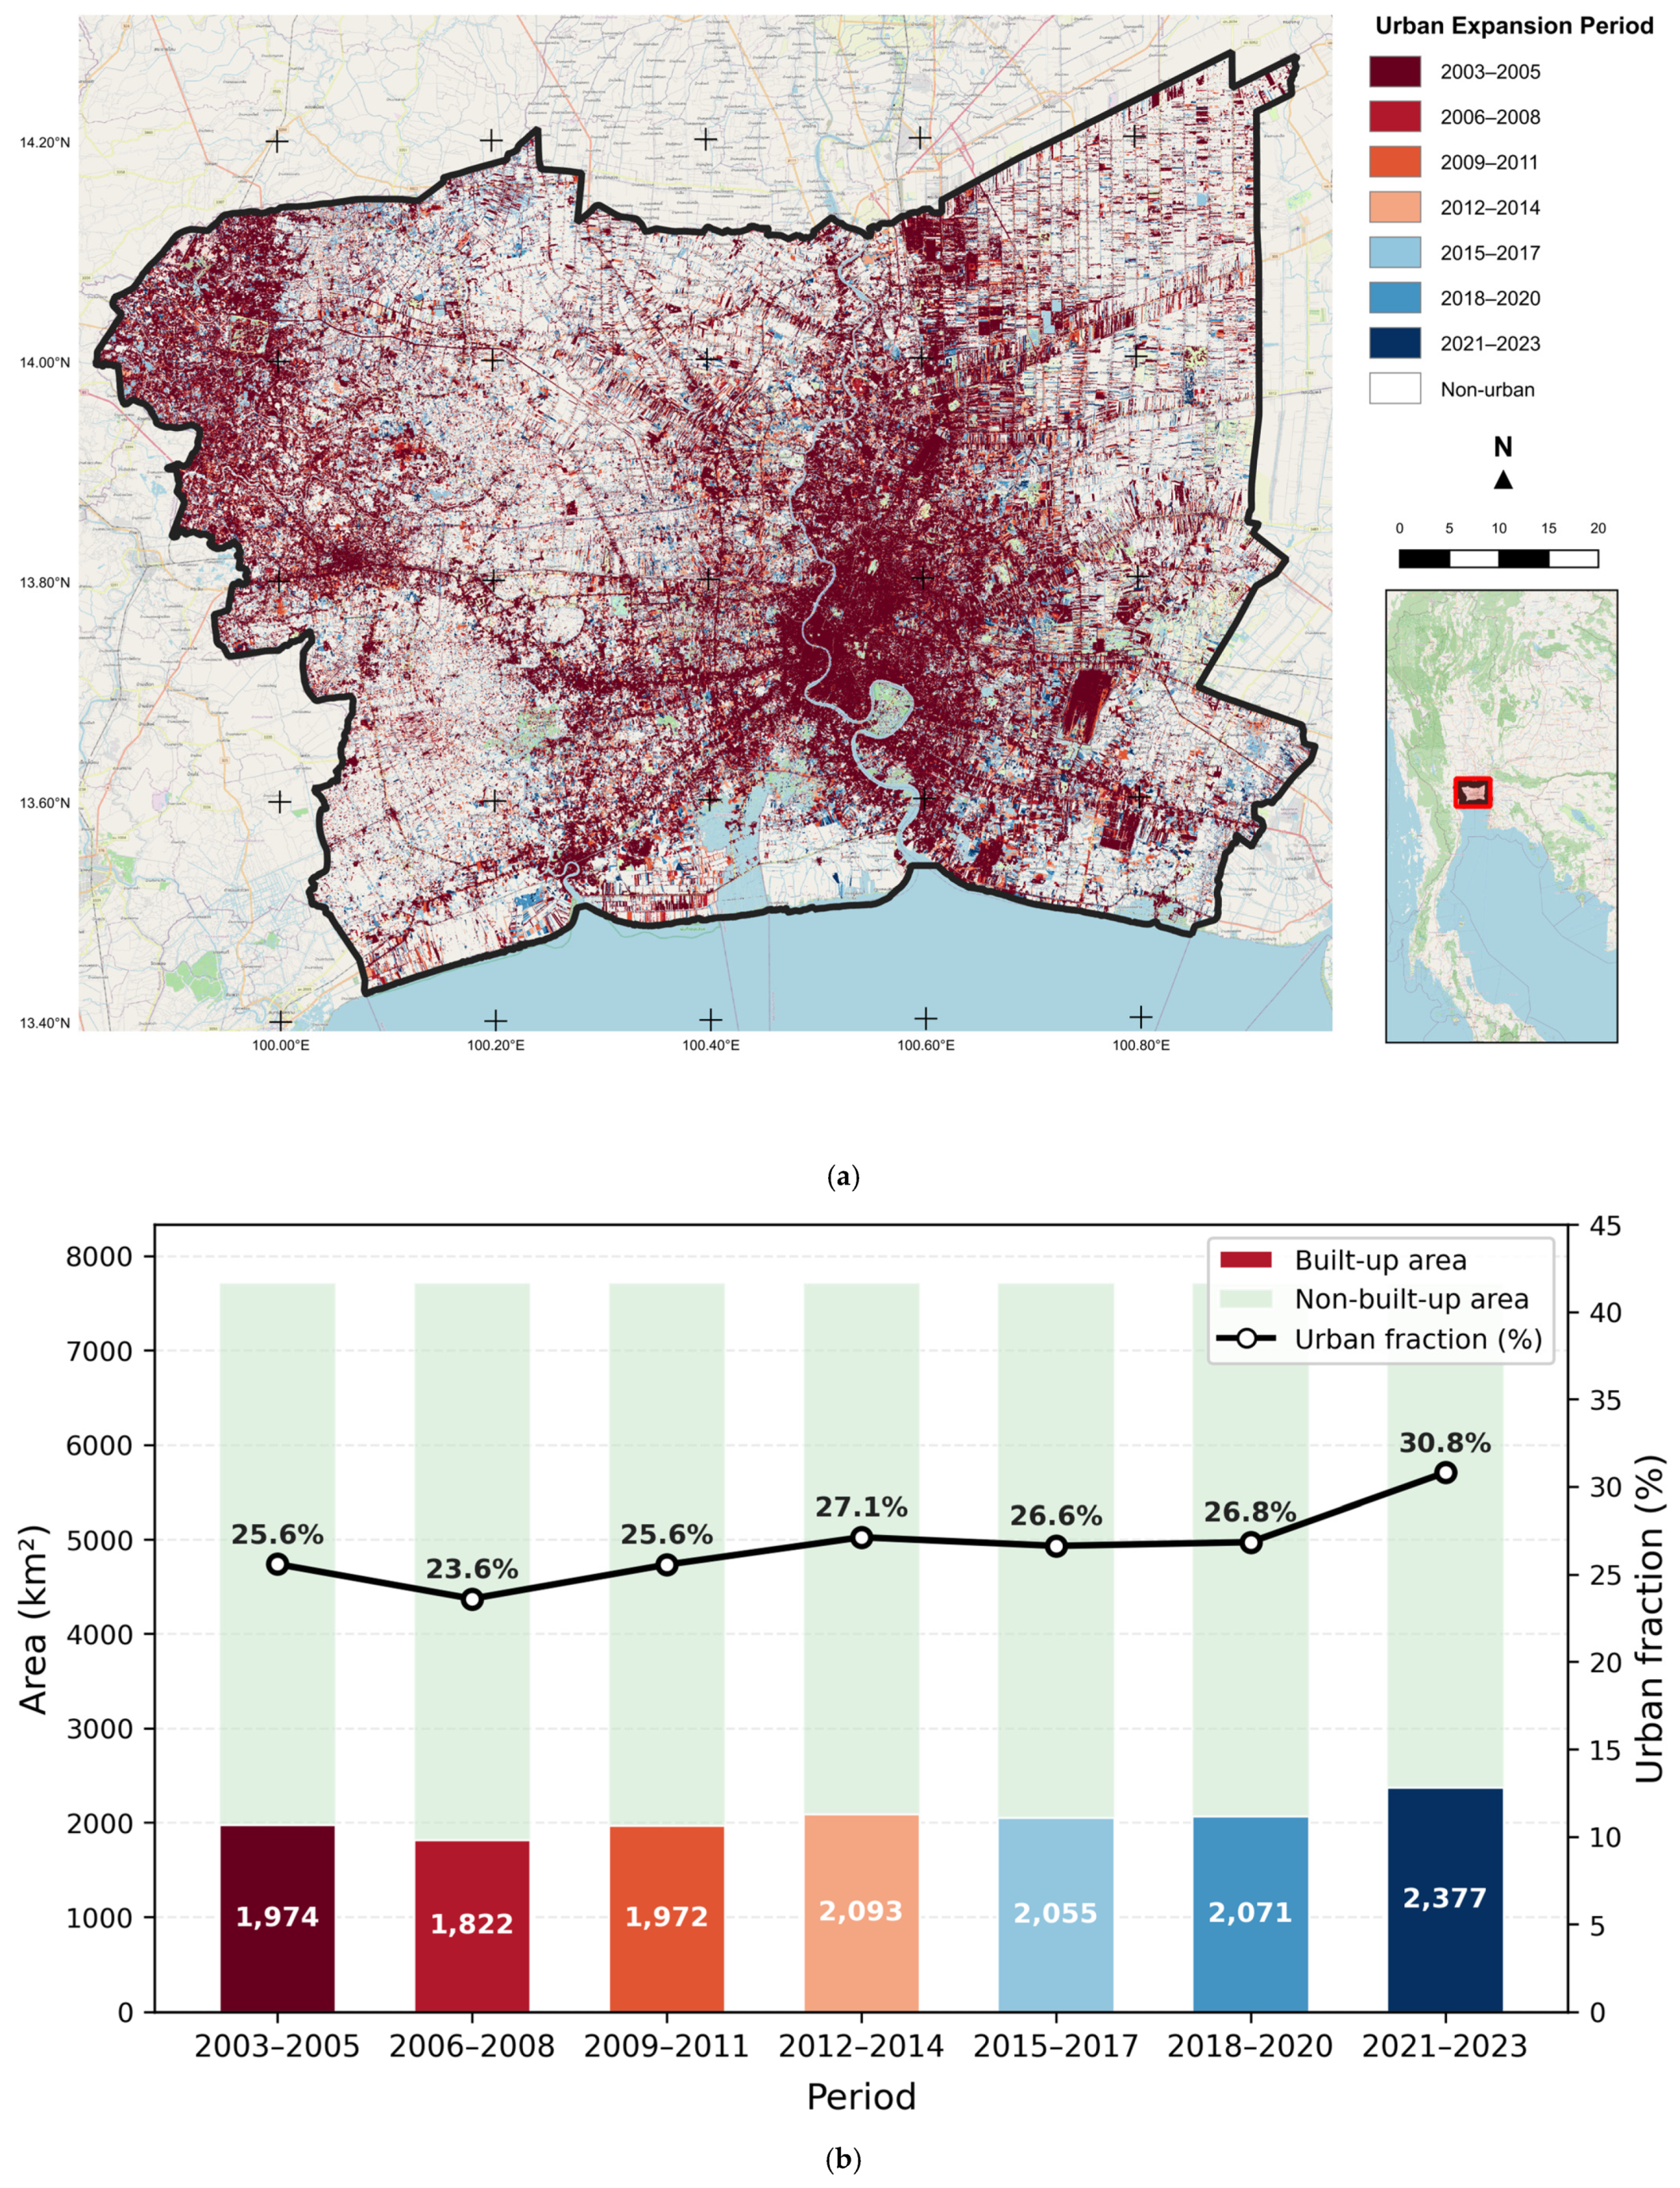
The analysis focuses on the changes in residential areas within the study area through 2023, marking a critical expansion of urbanized land at the expense of neighboring rural environments. Satellite imagery analysis allowed distinction between urban–rural land uses and identification of changes over the study period [38]. The results indicated significant growth in urban extent in the BMR, with overall urban growth of roughly 21% from 2003 to 2023. The fastest growth phases were from 2015 to 2017 and again from 2018 to 2020, spurred by an influx of new developments and population increases. The most striking change occurred in the northern and eastern fringes of the BMR, which transitioned from scenic greenery to being active residential, commercial or industrial zones [7].
Rural landscapes have decreased by about 7.2%, with former farmland and open lands increasingly being developed into urban infrastructure. The decrease in rural areas has considerable ecological consequences, as it can disrupt local ecosystems and biodiversity. It also highlights the need for urban planning that balances development with environmental conservation [26]. The speedy rise in urban land is observed in 2015–2020. The expansion is integrated with new policy and investments through tax incentives, suggesting the significant role of such outside factors that shape land use [8]. Understanding these dynamics is fundamental for future infrastructure development in the region.

3.2. Trend of LST in the BMR

3.2.1. Monthly Mean and Distribution of LST

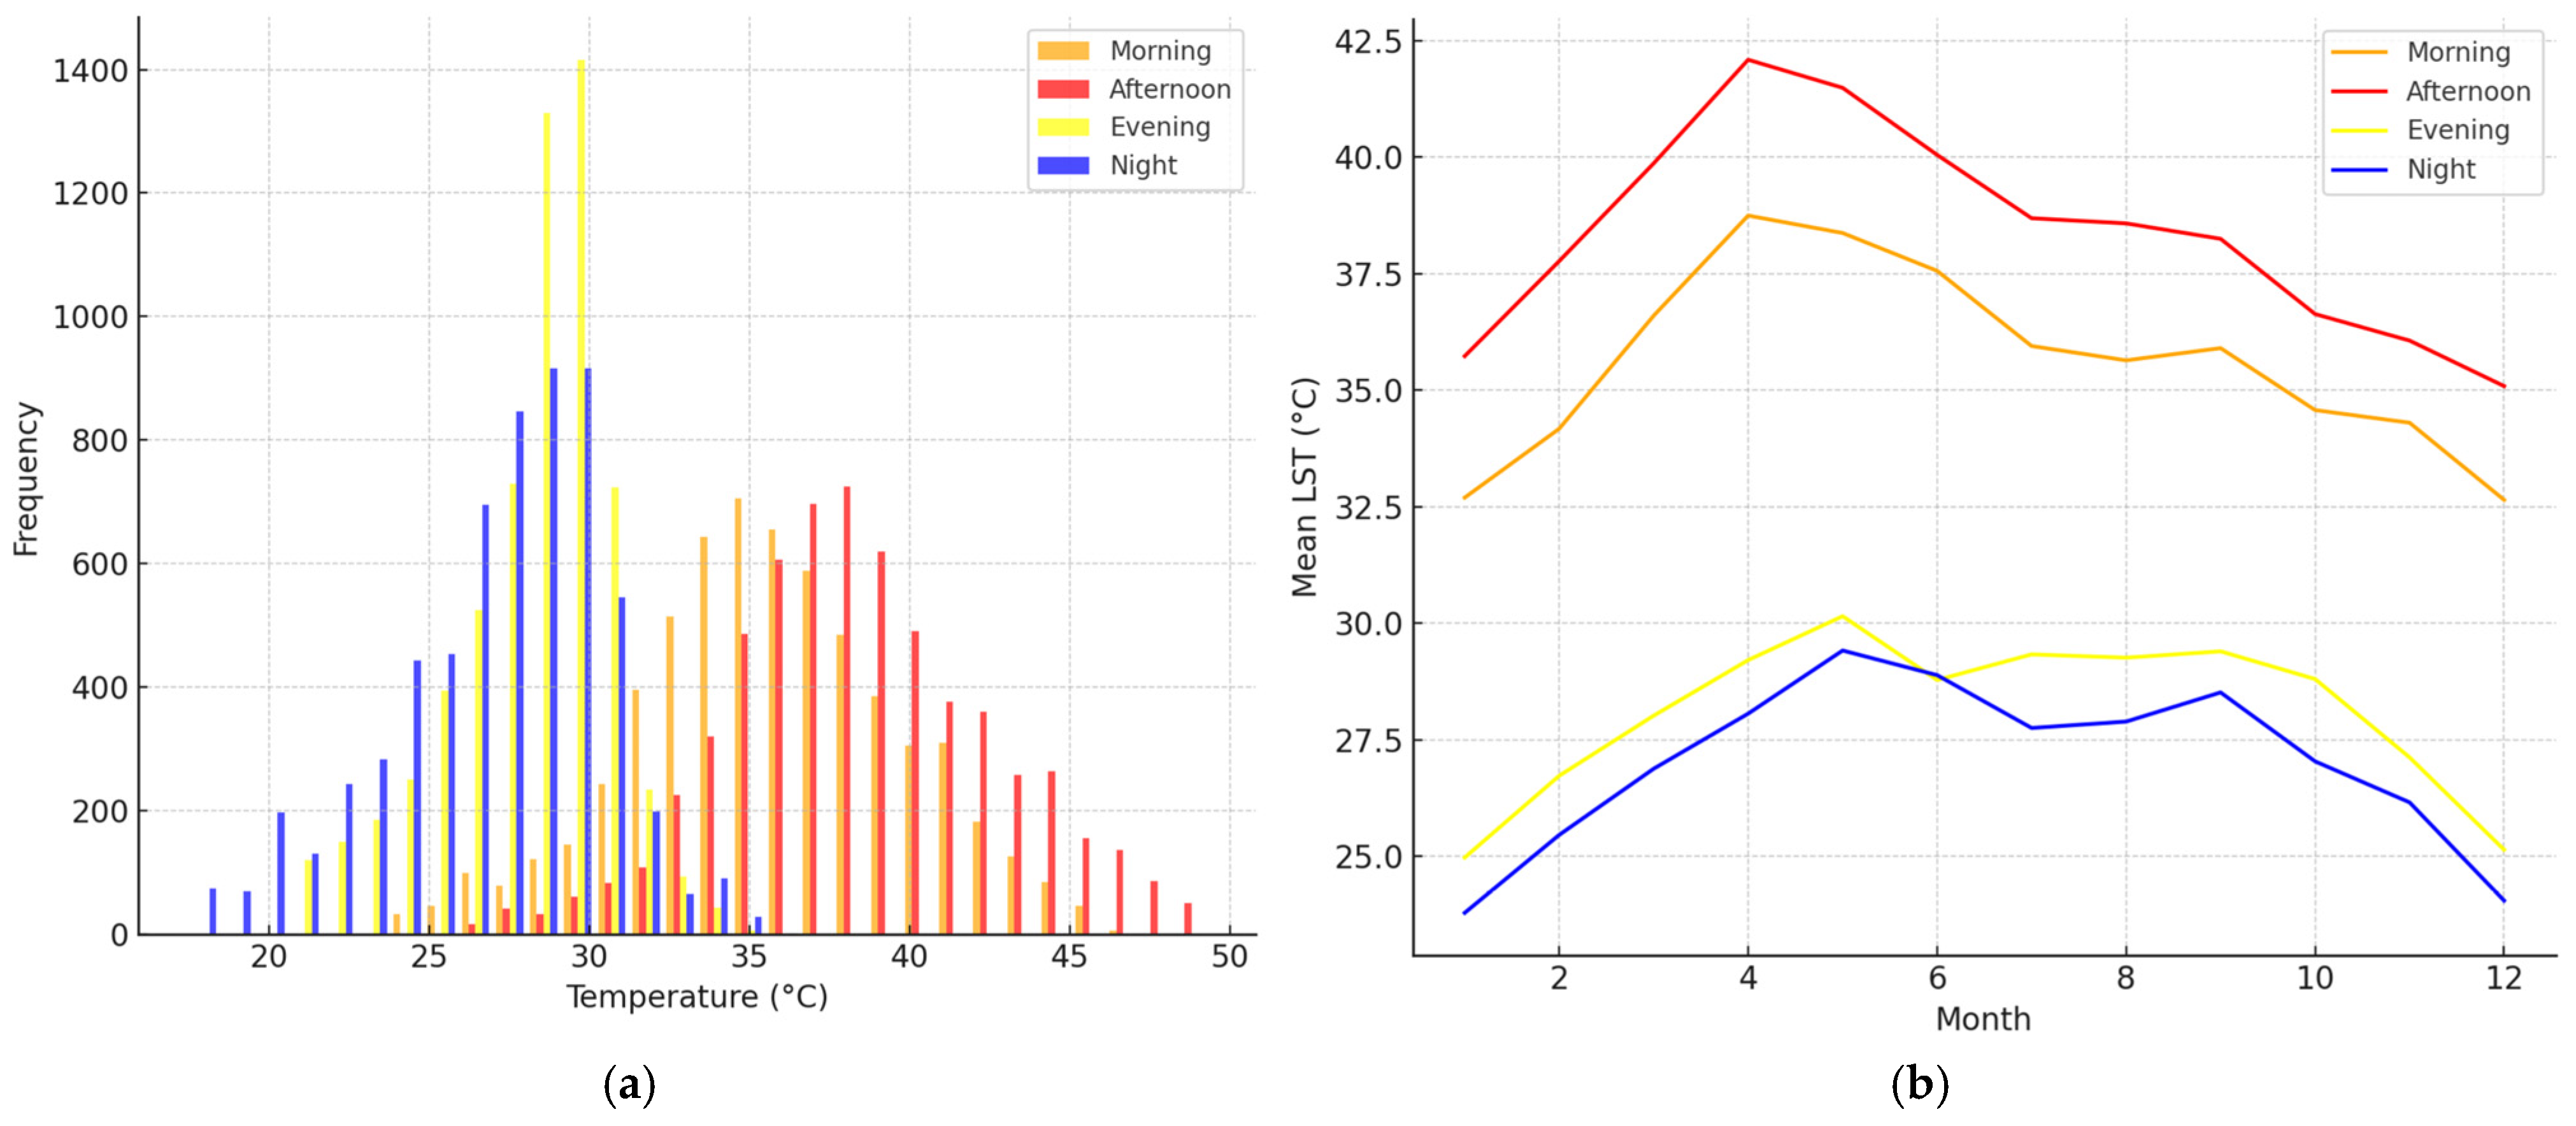
Monthly mean LST data used in the analysis of 2003–23 depict temperature dynamics for the BMR in the day and at night. Histograms of temperature distribution are shown in Figure 2. Average morning temperatures range from 20 °C to 40 °C, peaking between 30 °C and 35 °C. Afternoon temperatures are higher, from 25 °C until the highest value of this interval at 45 °C (mostly between 35 and 40). Evening temperatures cool to between 20 °C and 40 °C, with peak frequency observed between 25 °C and 30 °C. Nighttime temperatures are the coolest, ranging from 15 °C to 35 °C, with the most frequent values between 20 °C and 25 °C. This daily temperature cycle reflects typical heating and cooling patterns, with distinct seasonal variations [38].
As shown in Figure 3, the daytime LST seasonal fluctuations began at 34–36 °C in January and February and peaked above 40 °C in April and May before decreasing to reach a range of 34–36 °C by December. The nighttime LST values start at around 22–26 °C, reach their maximum between April and May (27–29 °C), and finally decline to a value of approximately 24–26 °C by December. These trends correlate with the environmental conditions having high solar radiation [39,40], causing July–August extremes (hot season) and moderate temperatures due to cloud cover and rains during the monsoon [41,42].

3.2.2. LST Trends in Urban and Rural Areas

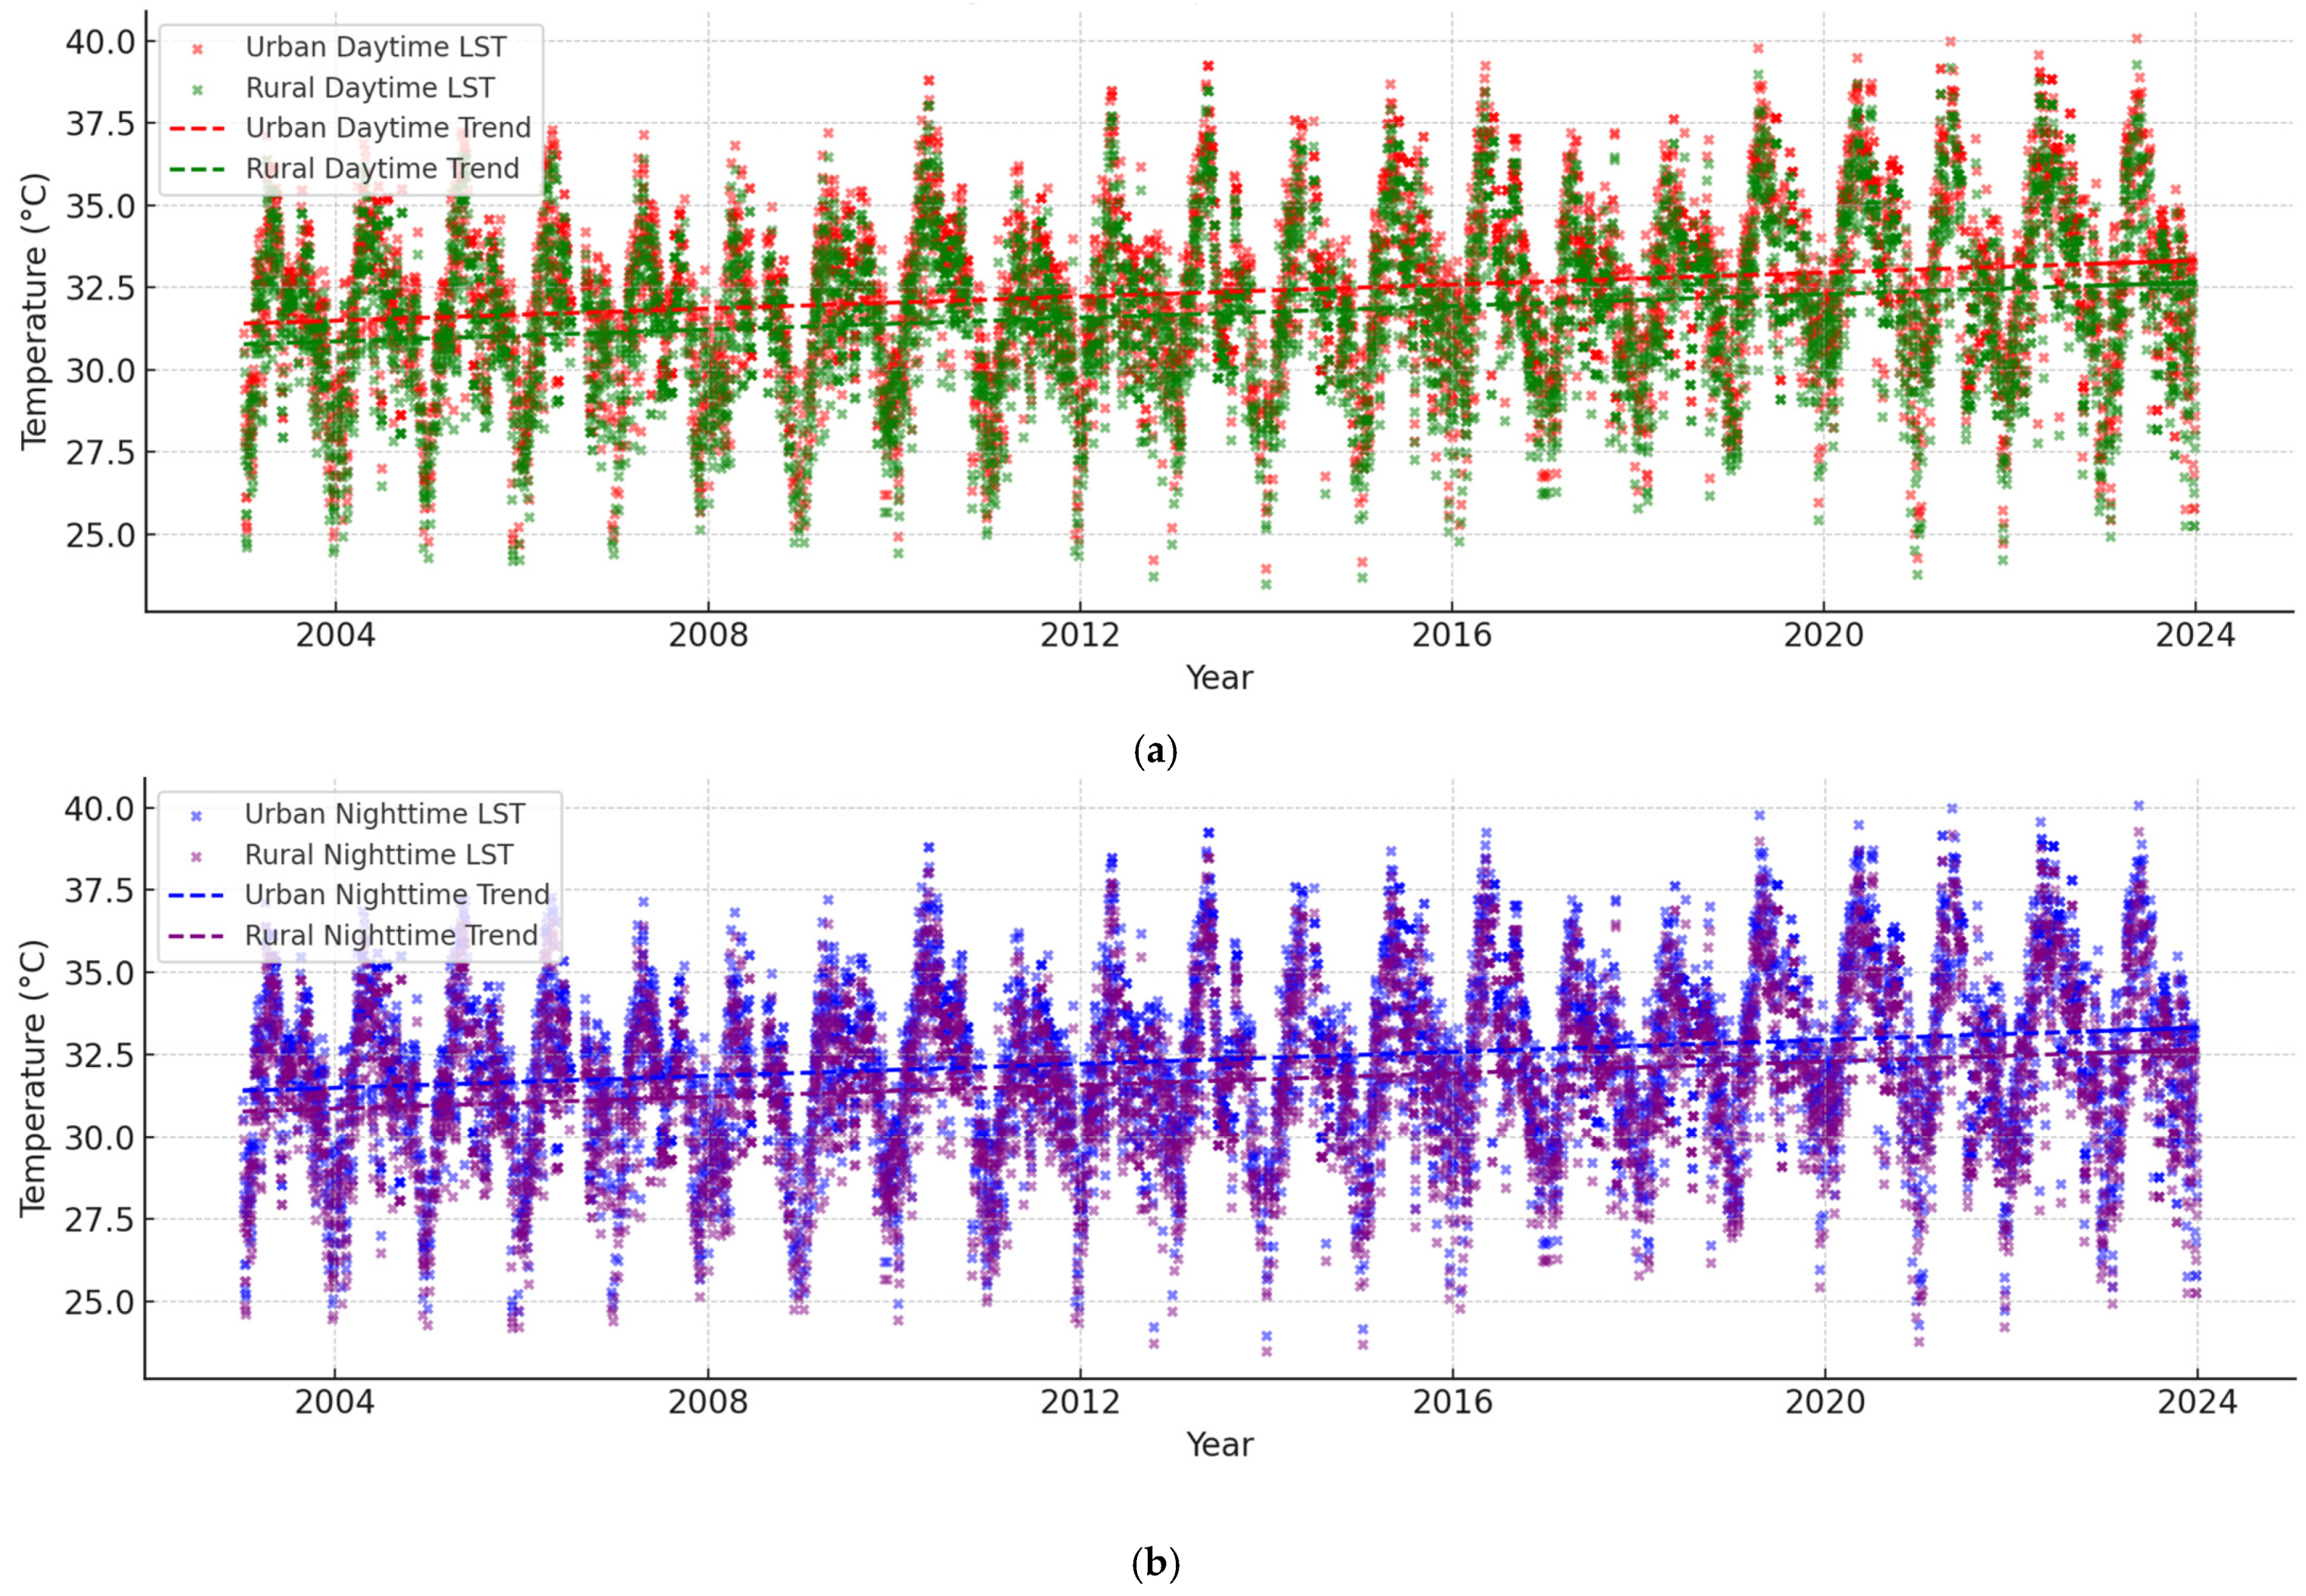
According to the long-term trend analysis of LST from 2003 to 2023, there was a continuous increase in temperature over both urban and rural regions of the BMR (Figure 4). The daytime LST in urban areas demonstrated a clear increasing trend, and the mean temperature increased by about 0.12 °C per year. A similar increasing pattern of daytime LST at the same rate can be observed in rural areas. The same trend of increasing LST rate for both urban and rural regions can be seen at night as well, with an average rate of increase of 0.109 °C. The similar trends between urban and rural areas suggest that the increase of LST occurs at the regional scale. Overall warming is driven by this scale whereas SUHI intensity remains relatively high, showing that the urban–rural thermal differential is persistent across different geographic scales. The persistent upward trends in the last two decades are reflective of widespread global warming [42] but also local environmental changes (e.g., urbanization and strong SUHI impacts at the built surface level) [43]. These results indicate the need for proactive urban planning strategies to address rising temperatures, particularly in densely populated cities where thermal impacts are amplified [44].

3.3. Long-Term Trends in SUHI Intensity

3.3.1. Daytime and Nighttime SUHI

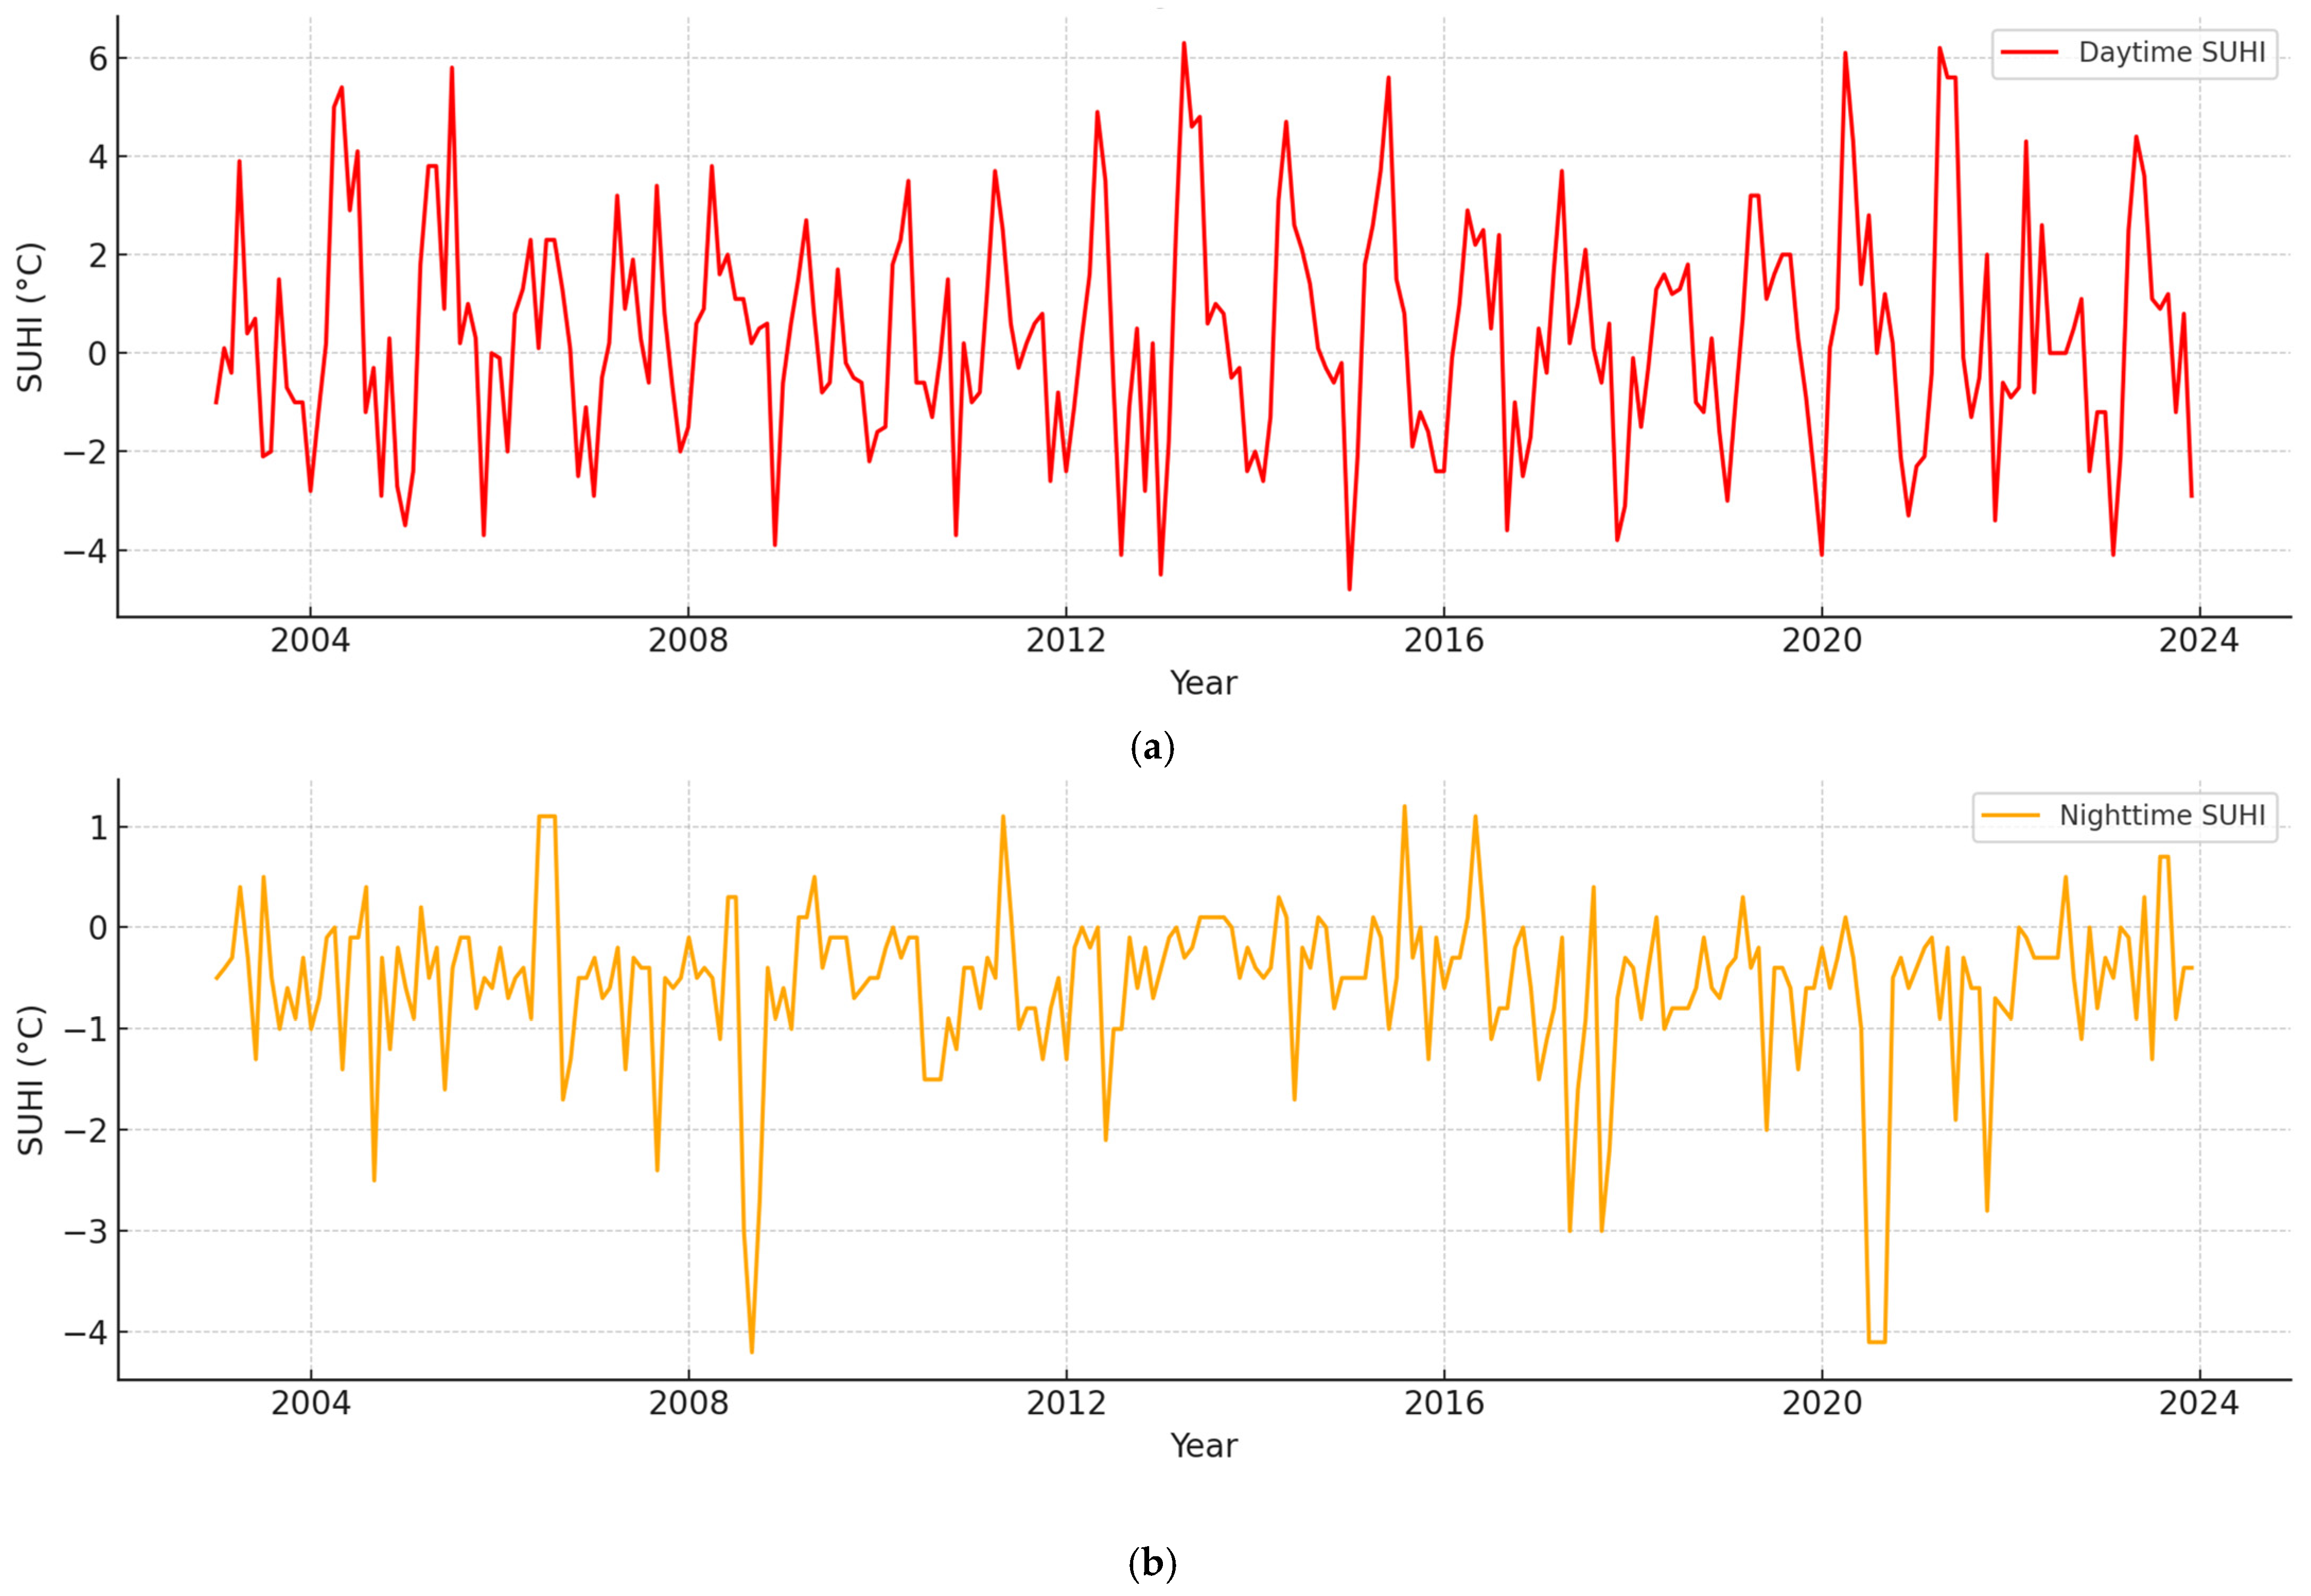
The analysis of monthly mean SUHI intensity, calculated as the temperature difference between urban and rural areas, provides a comprehensive overview of the SUHI effect during both daytime and nighttime periods (Figure 5). This spatial analysis showed considerable seasonal differences, with urban areas consistently recording higher temperatures than rural counterparts during the year [45,46,47,48].
The daytime SUHI exhibits seasonal characteristics, with lower values in the January-to-March range (1.0 °C to 1.5 °C). For the warmest months, SUHI shows high peaks in April and May, often reaching over 2.5 °C to 3.0 °C with a maximum of 6.3 °C in April 2011; during the monsoon season (June to September), values decrease slightly to between 2.0 °C and 2.5 °C owing to cloud cover and rainfall occurring at those times [11]. SUHI falls to 1.5 °C to 2.0 °C for October to December.
Like daytime SUHI, nighttime SUHI is also seasonal: Between January and March, it ranges from 0.5 °C to 1.0 °C. Its peak of 1.5 °C to 2.0 °C on the graph occurs in April and May because urban heat is being retained. The SUHI in the presence of a monsoon reduces to 0.0 °C to 0.5 °C and starts to decrease from October to December, with the monthly average having negative values for certain months indicating cooler rural areas at night compared to urban areas.

3.3.2. SUHI Seasonal Trends

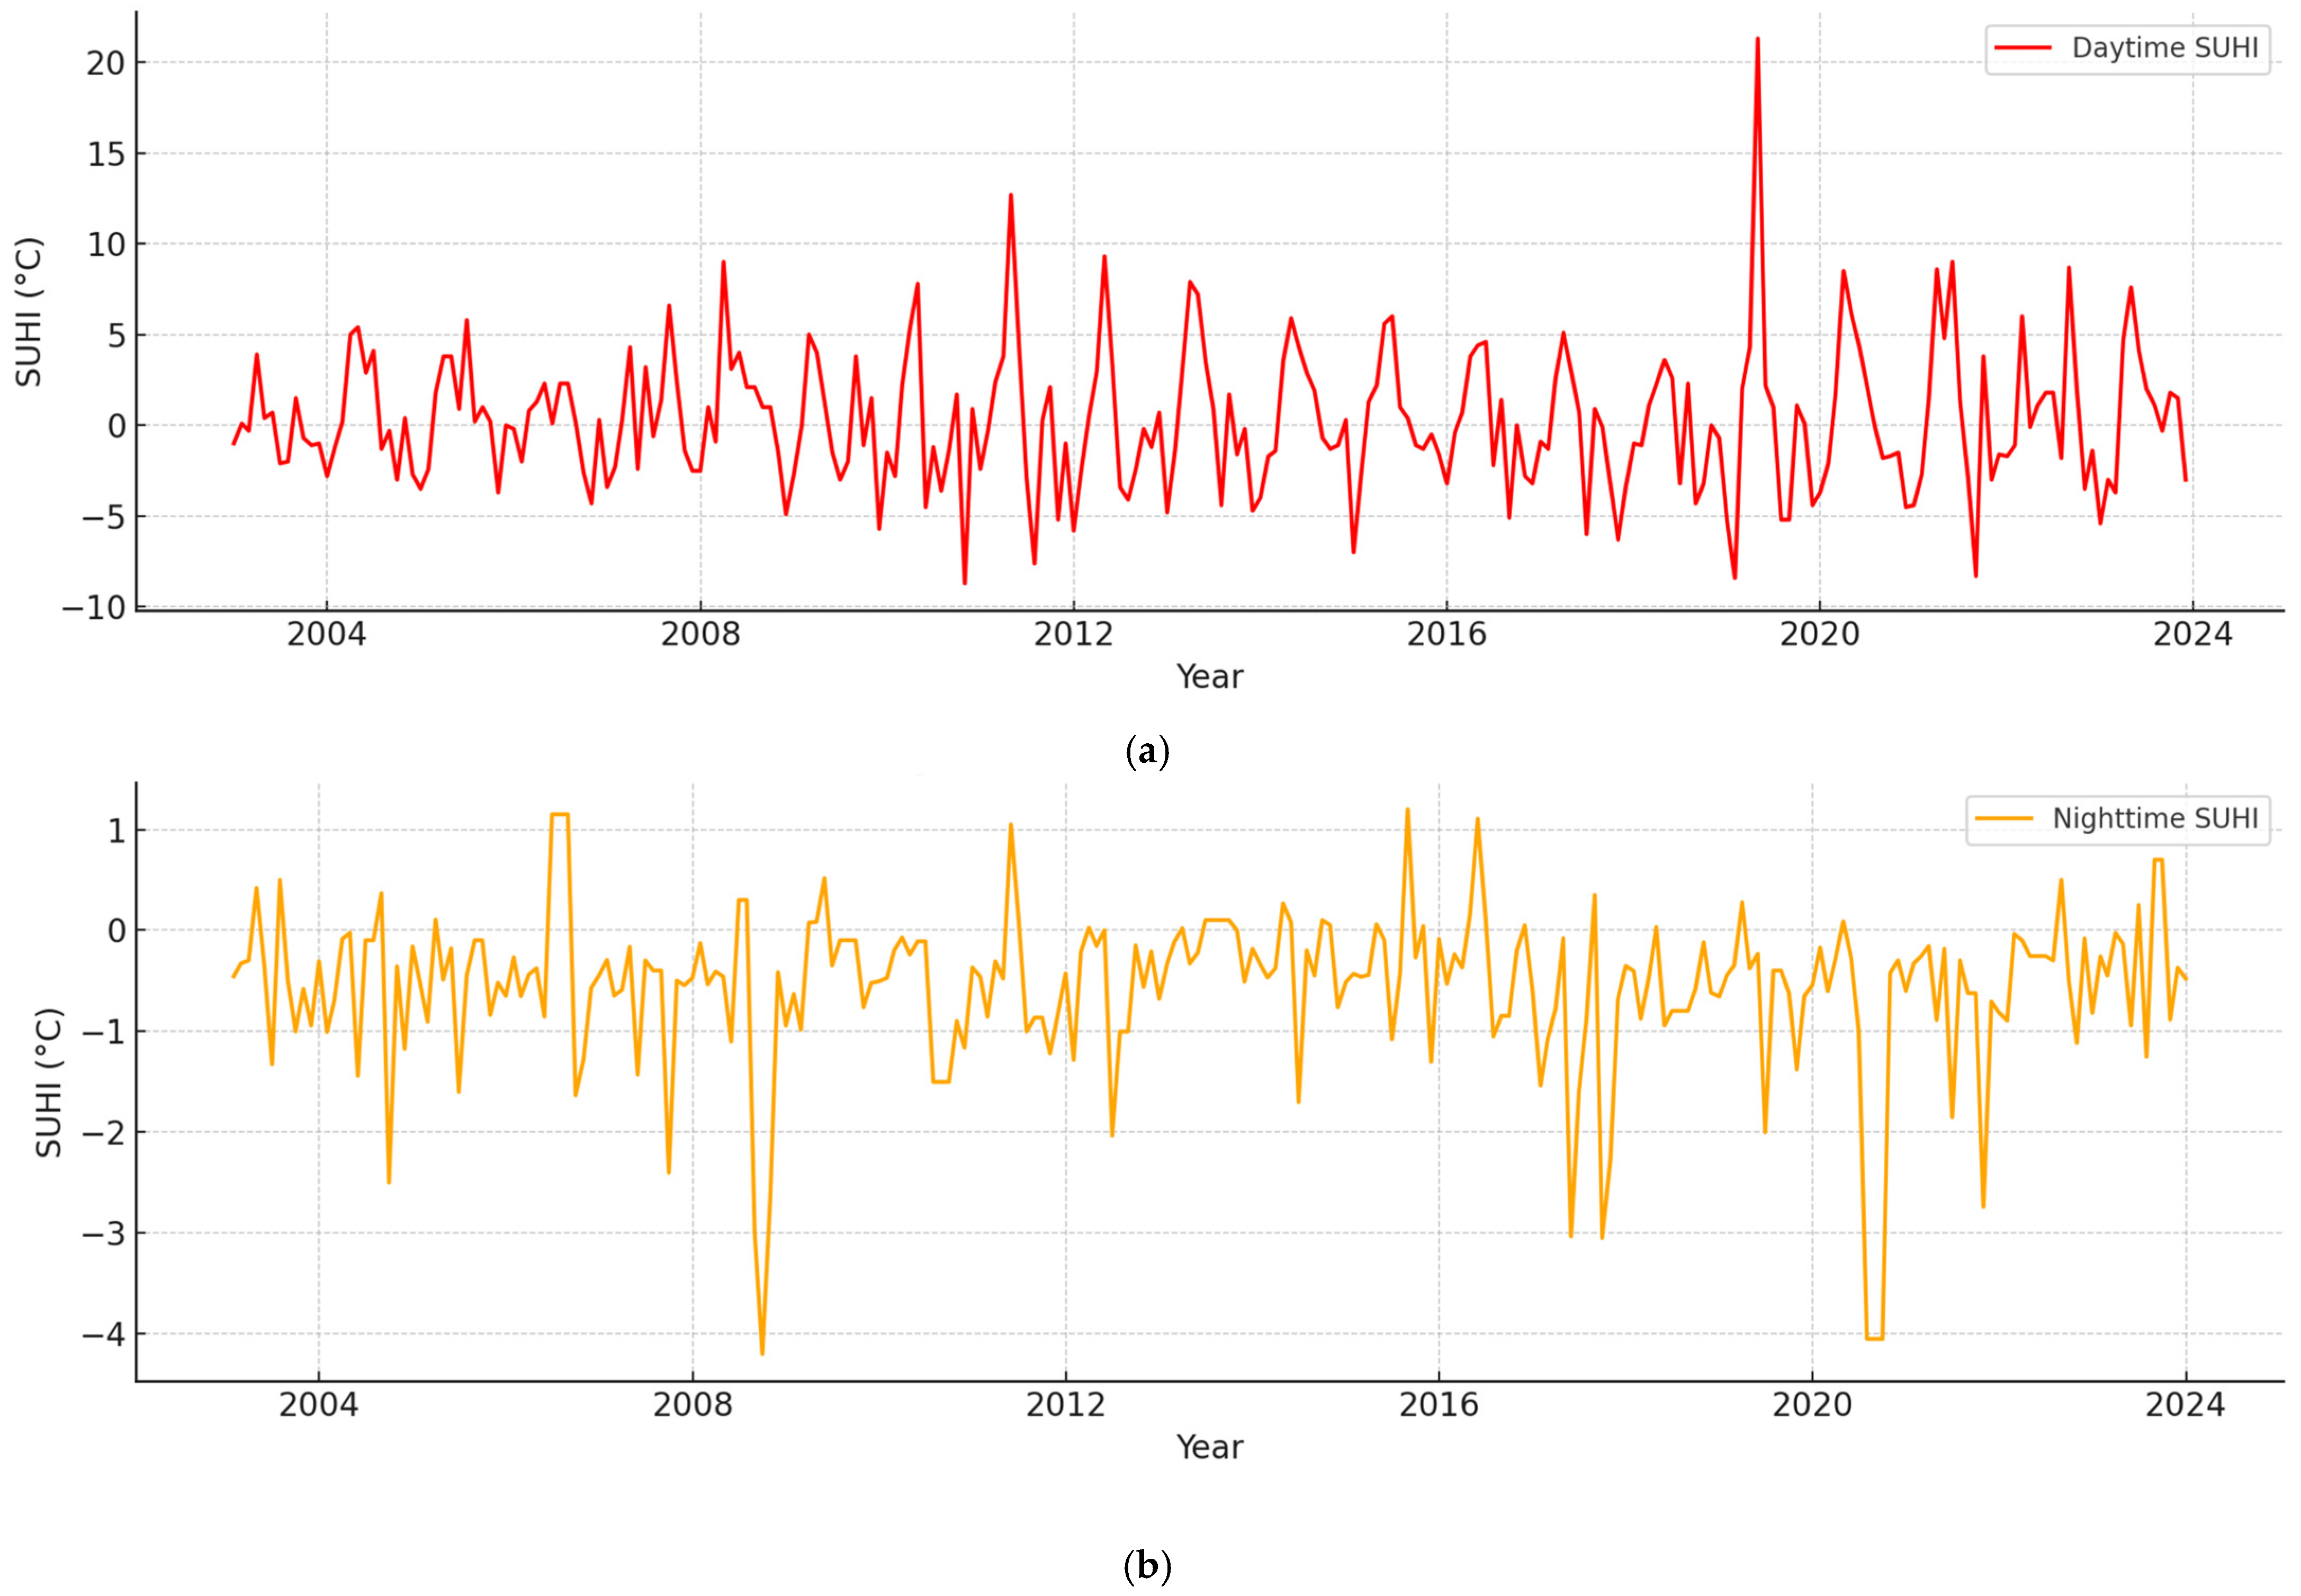
Different patterns were evident from the seasonal trends of SUHI intensity, especially during transitions between the cool and hot seasons [49] and later into monsoon season (Figure 6).
The seasonal trends of daytime SUHI show similar monthly patterns to those which were demonstrated above, with the highest intensities occurring consistently in April–May. Extremes stand out in April 2011 (6.3 °C) and May 2016 (5.6 °C), both associated with dry conditions under El Niño’s influence [48]. The monsoon season (June–September) lowers SUHI due to increased cloud cover and precipitation, but its values are still positive. In the cooler season (October–December), a further drop occurs with negative values at times. SUHI seasonal patterns during the night show less variability. Maximum nocturnal values were found in April 2012 (0.9 °C) and May 2014 (1.1 °C), confirming the persistence of nocturnal thermal inertia during the hot season. The effect of cooling due to monsoons is also evident from nighttime SUHI values [49,50,51,52] between the months of June and September which are consistently low (∼0.0–0.5°) except for a few places, indicating stable nighttime SUHI values over this period from October to December. From October to December, nighttime SUHI values continue to decline, with some months showing negative values (October 2020; −1.2 °C); this suggests that during this month, the nighttime LST was observed to be warmer in rural than in urban areas [53,54].

3.3.3. Analysis of SUHI Anomaly Trend

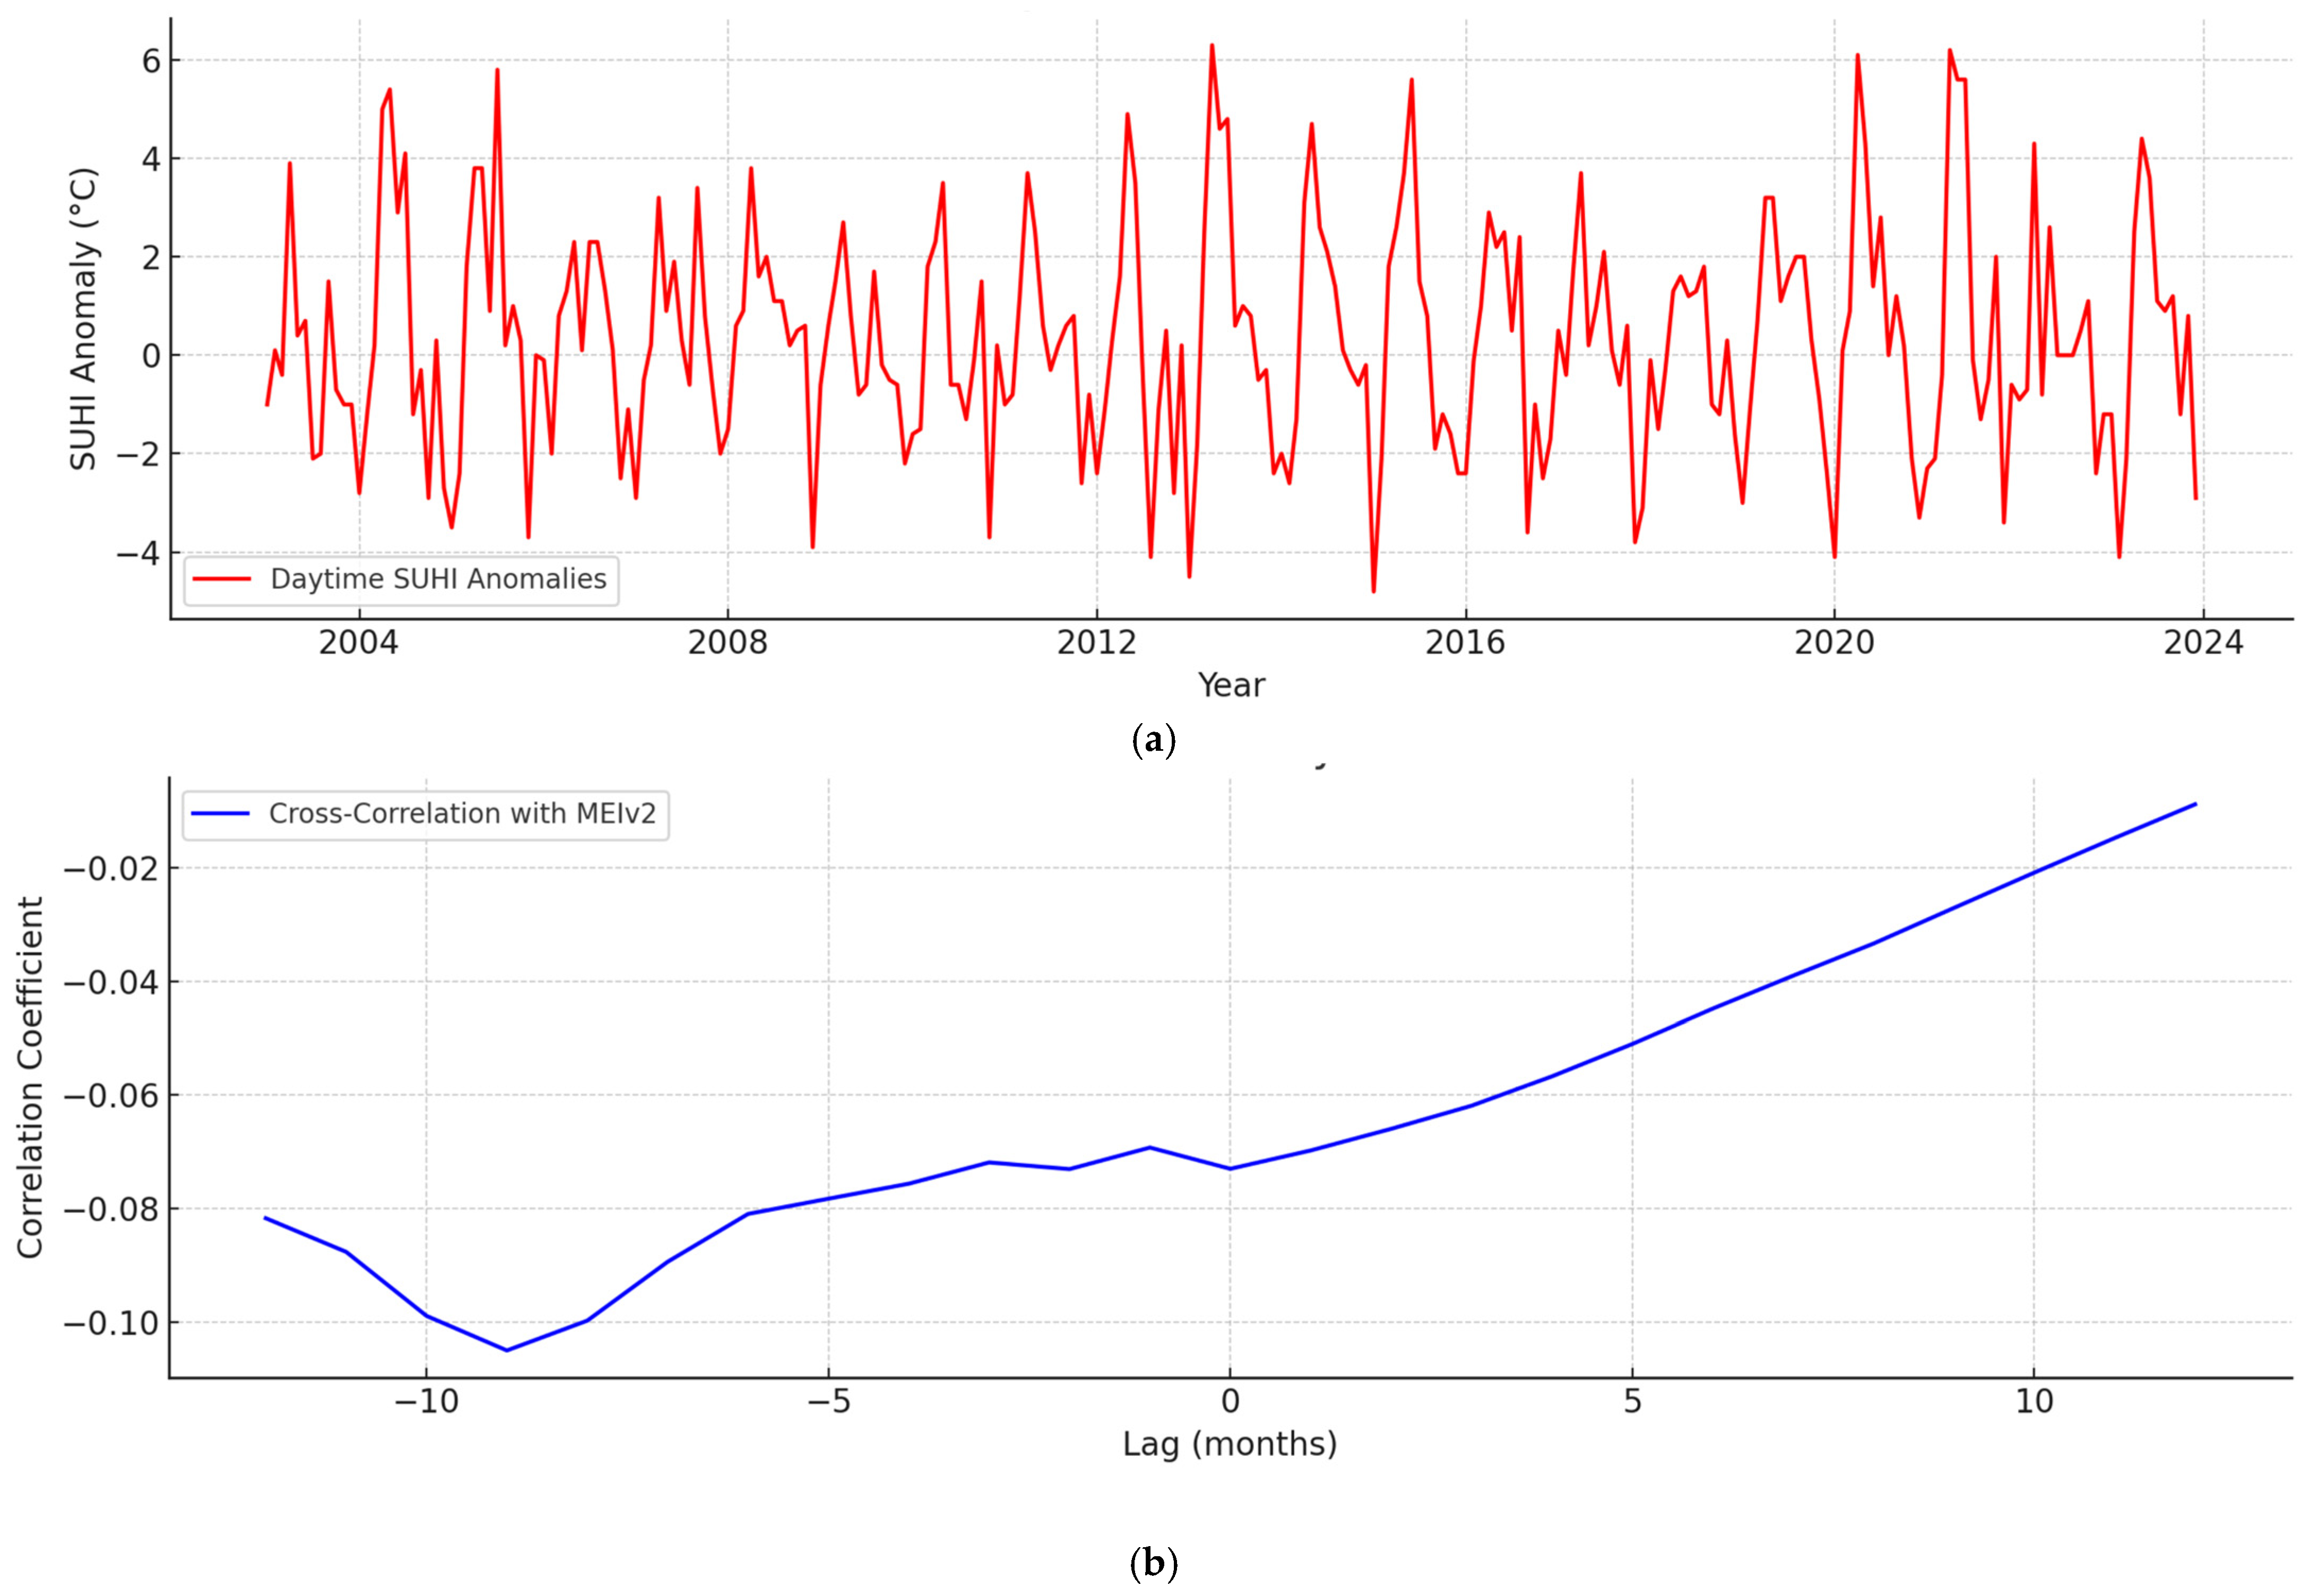
Daytime SUHI anomalies exhibit a weak positive trend of 0.00011 °C yr−1 up to October 2023, with strong positive anomalies in April and May noticed mostly in the years 2010, 2011 and 2016 (peak being at 6.3 °C for April from the year 2011). Negative anomalies, on the other hand, are relatively frequent in monsoons, e.g., −0.8 °C in June 2008. This indicates that at night urban areas are able to cool down more (SUHI anomalies decreasing by −0.00645 °C per year), suggesting an improving nocturnal cooling trend over the study period. Positive nighttime anomalies (e.g., 1.1 °C in May 2014) are much more alarming given their ongoing frequency, while negative anomalies (e.g., −1.2 °C in Oct 2020), often occur during monsoon months. The study reveals how climatic patterns such as El Niño and La Niña impact SUHI intensity. The cross-correlation with the Multivariate ENSO Index version 2 (MEIv2) showed a significant correlation, especially for lag 0, suggesting immediate reflections of MEIv2 changes in SUHI anomalies (Figure 7). The positive correlations indicate that ENSO events may modulate SUHI anomalies months later, particularly in hot and monsoon seasons. Since daytime SUHI anomalies show much larger variation, the analysis contributes to a better understanding of this variability and of its relation with climatic patterns.

3.4. Spatial Variation Analysis

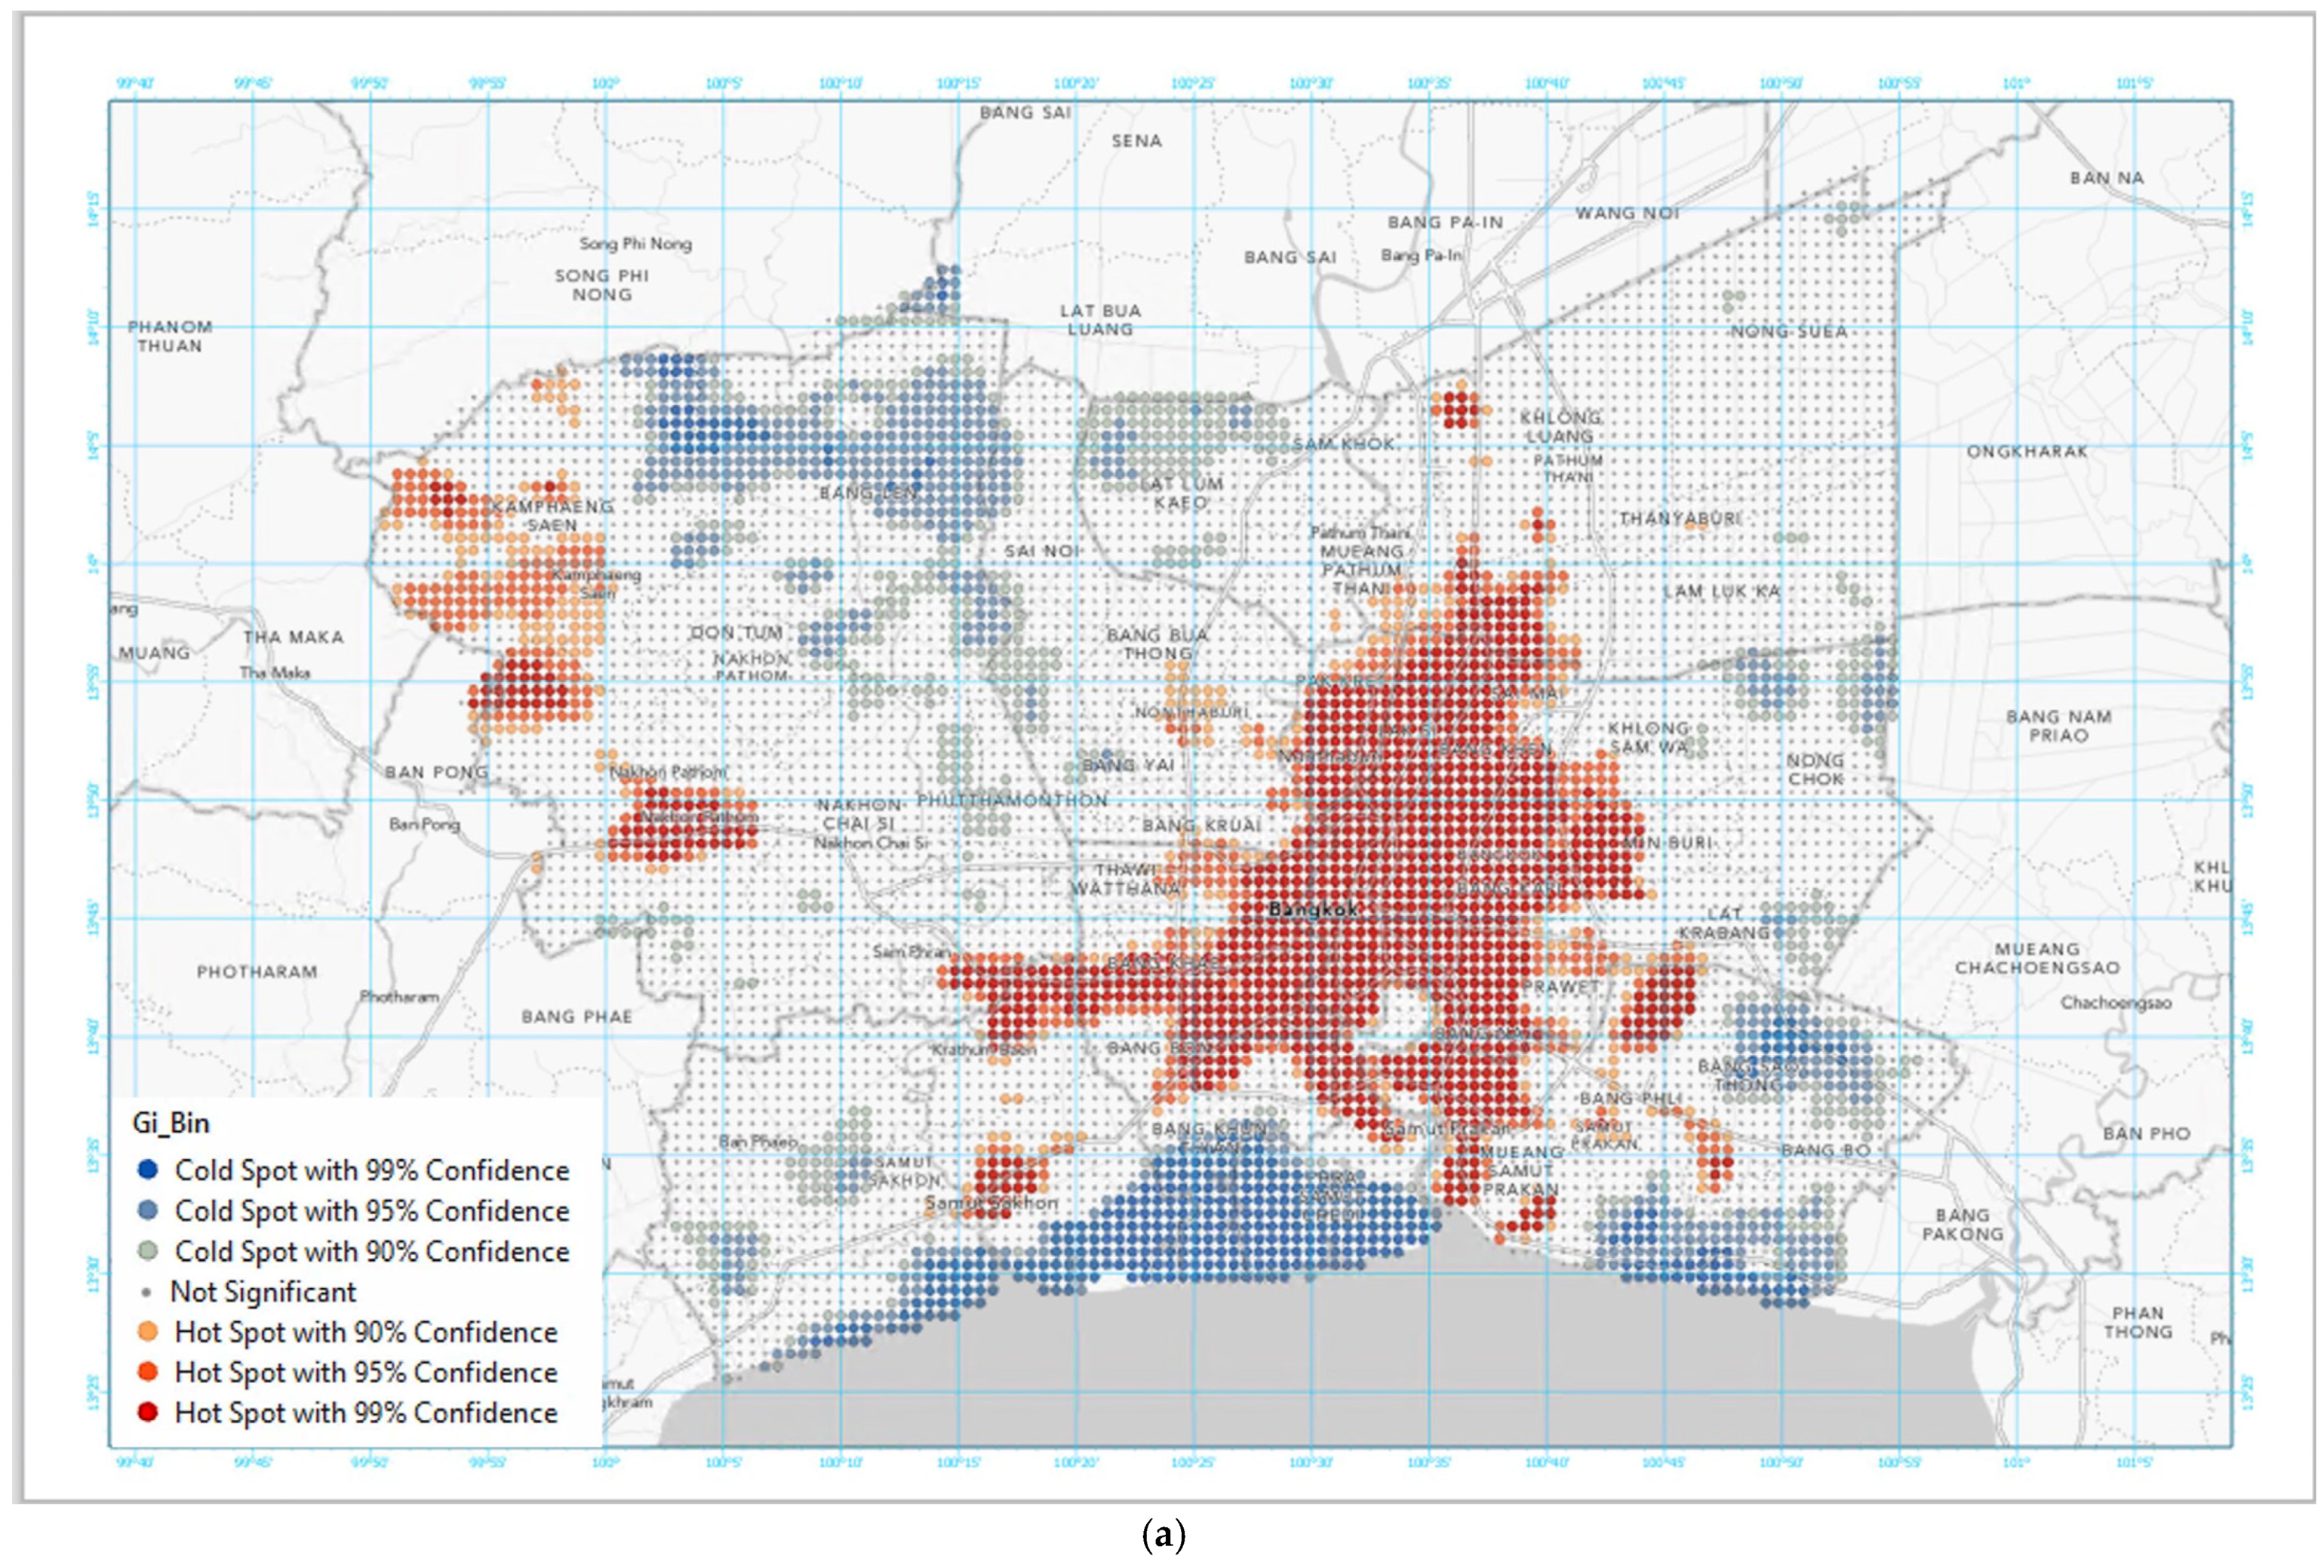
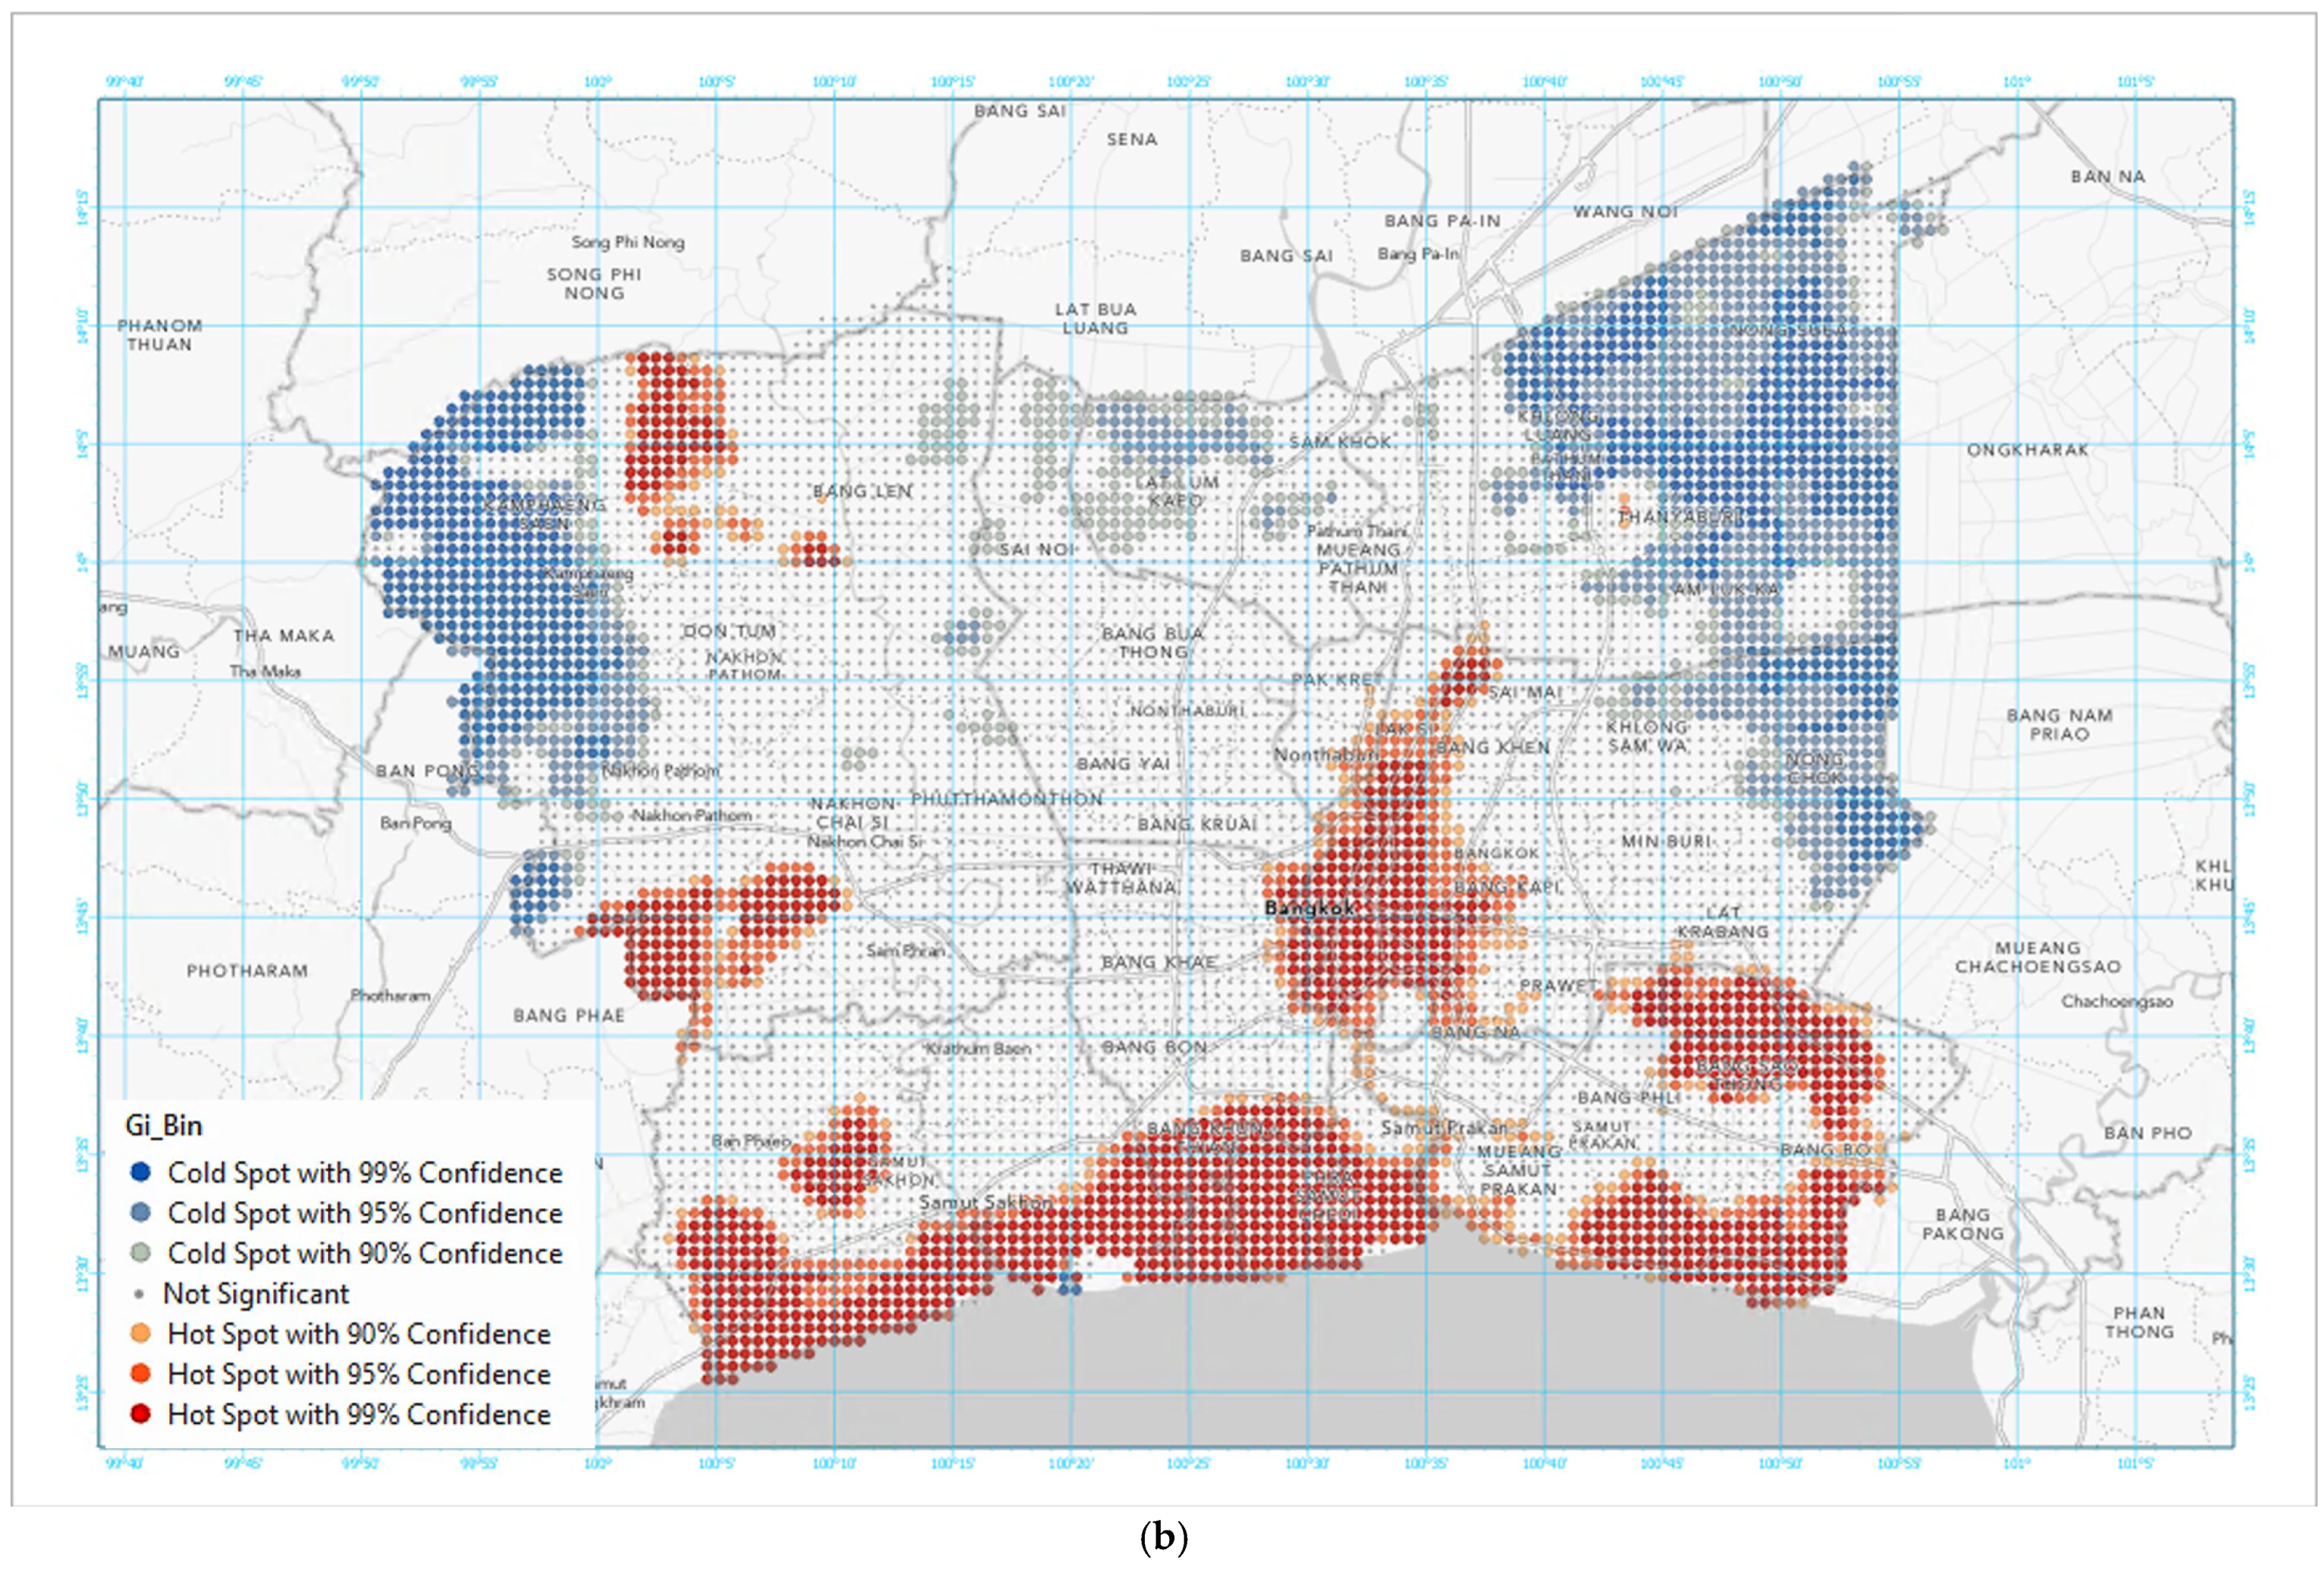
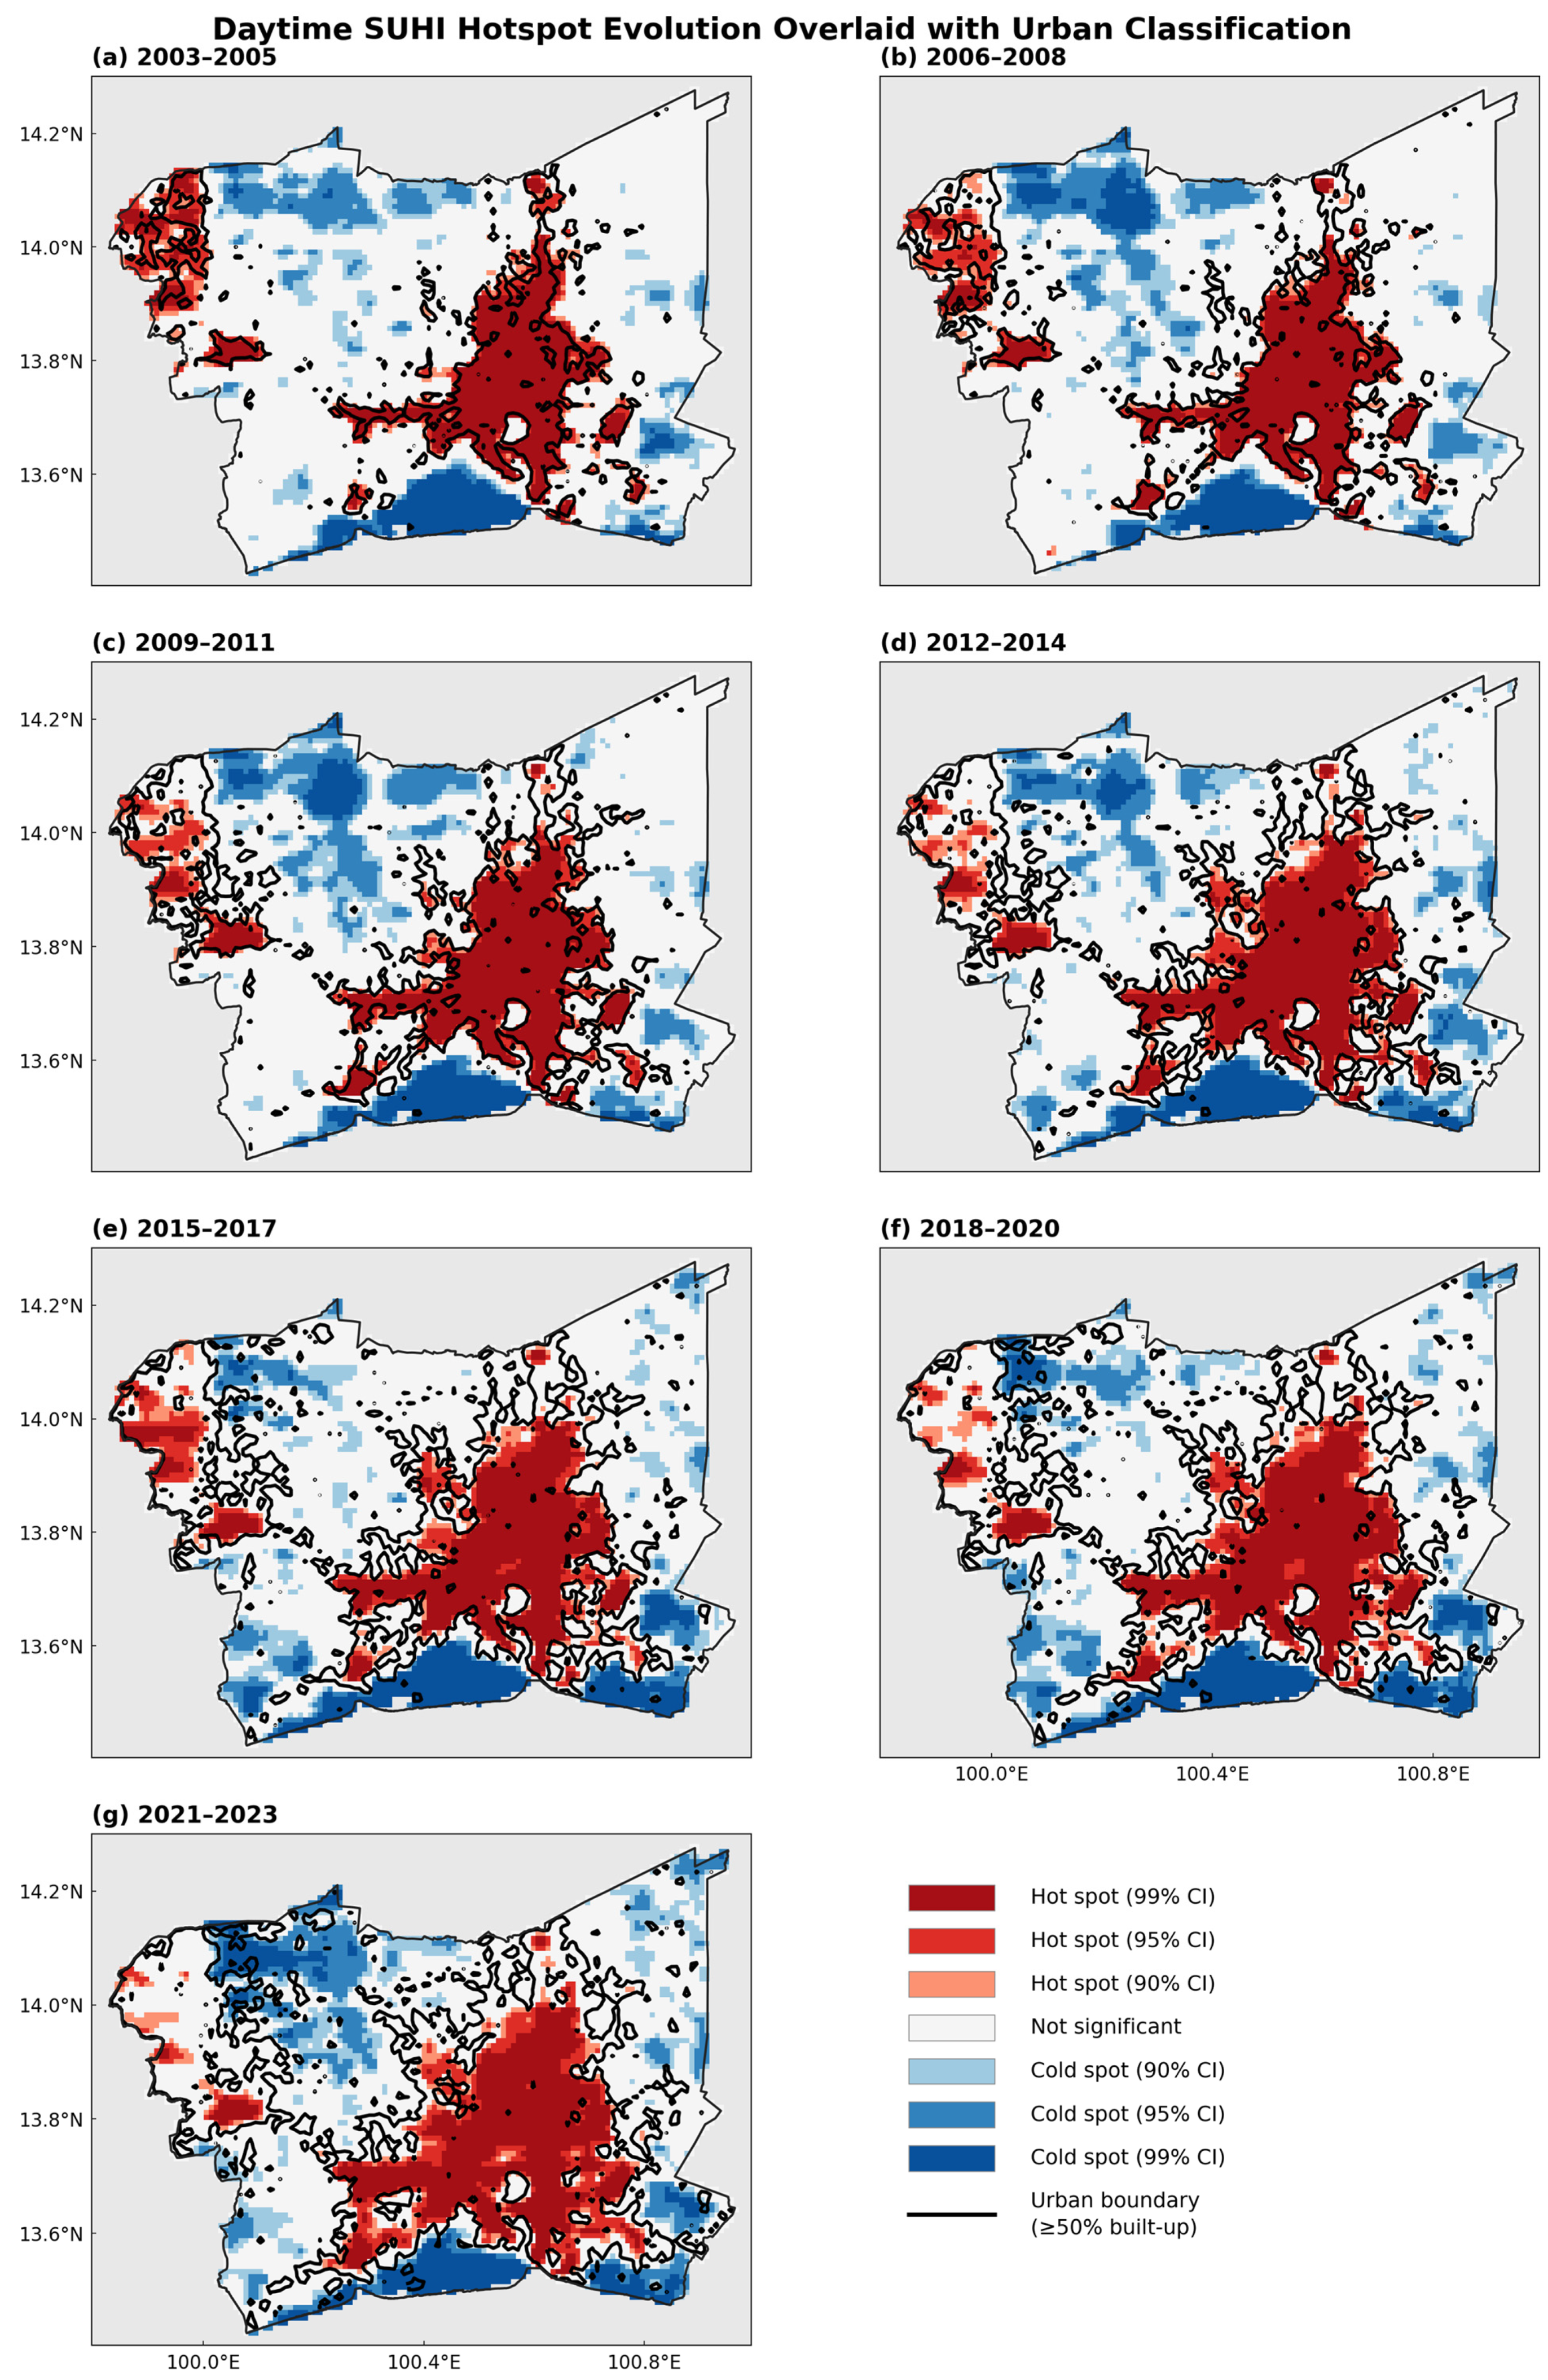
The Getis-Ord Gi* statistic [51] was used to identify daytime and nighttime SUHI hotspots, combined for analysis. Specifically, the data covers the periods of 2003–2005, 2006–2008, 2009–2011, 2012–2014, 2015–2017, 2018–2020, and 2021–2023, identifying significant clusters of high (hotspots) and low (coldspots) SUHI values, corresponding to areas of intense heat and relative coolness, respectively (Table 1).
The study identifies a continuous trend that shows SUHI being most pervasive in the urban core (Figure 8). Over the years, these sites have expanded and developed into intense hotspots reflecting rapid urbanization and increasing difficulties in controlling urban heat [53].
Figure 9 shows hotspots are more extensive and pronounced during the day, particularly in areas with dense urban development [12].
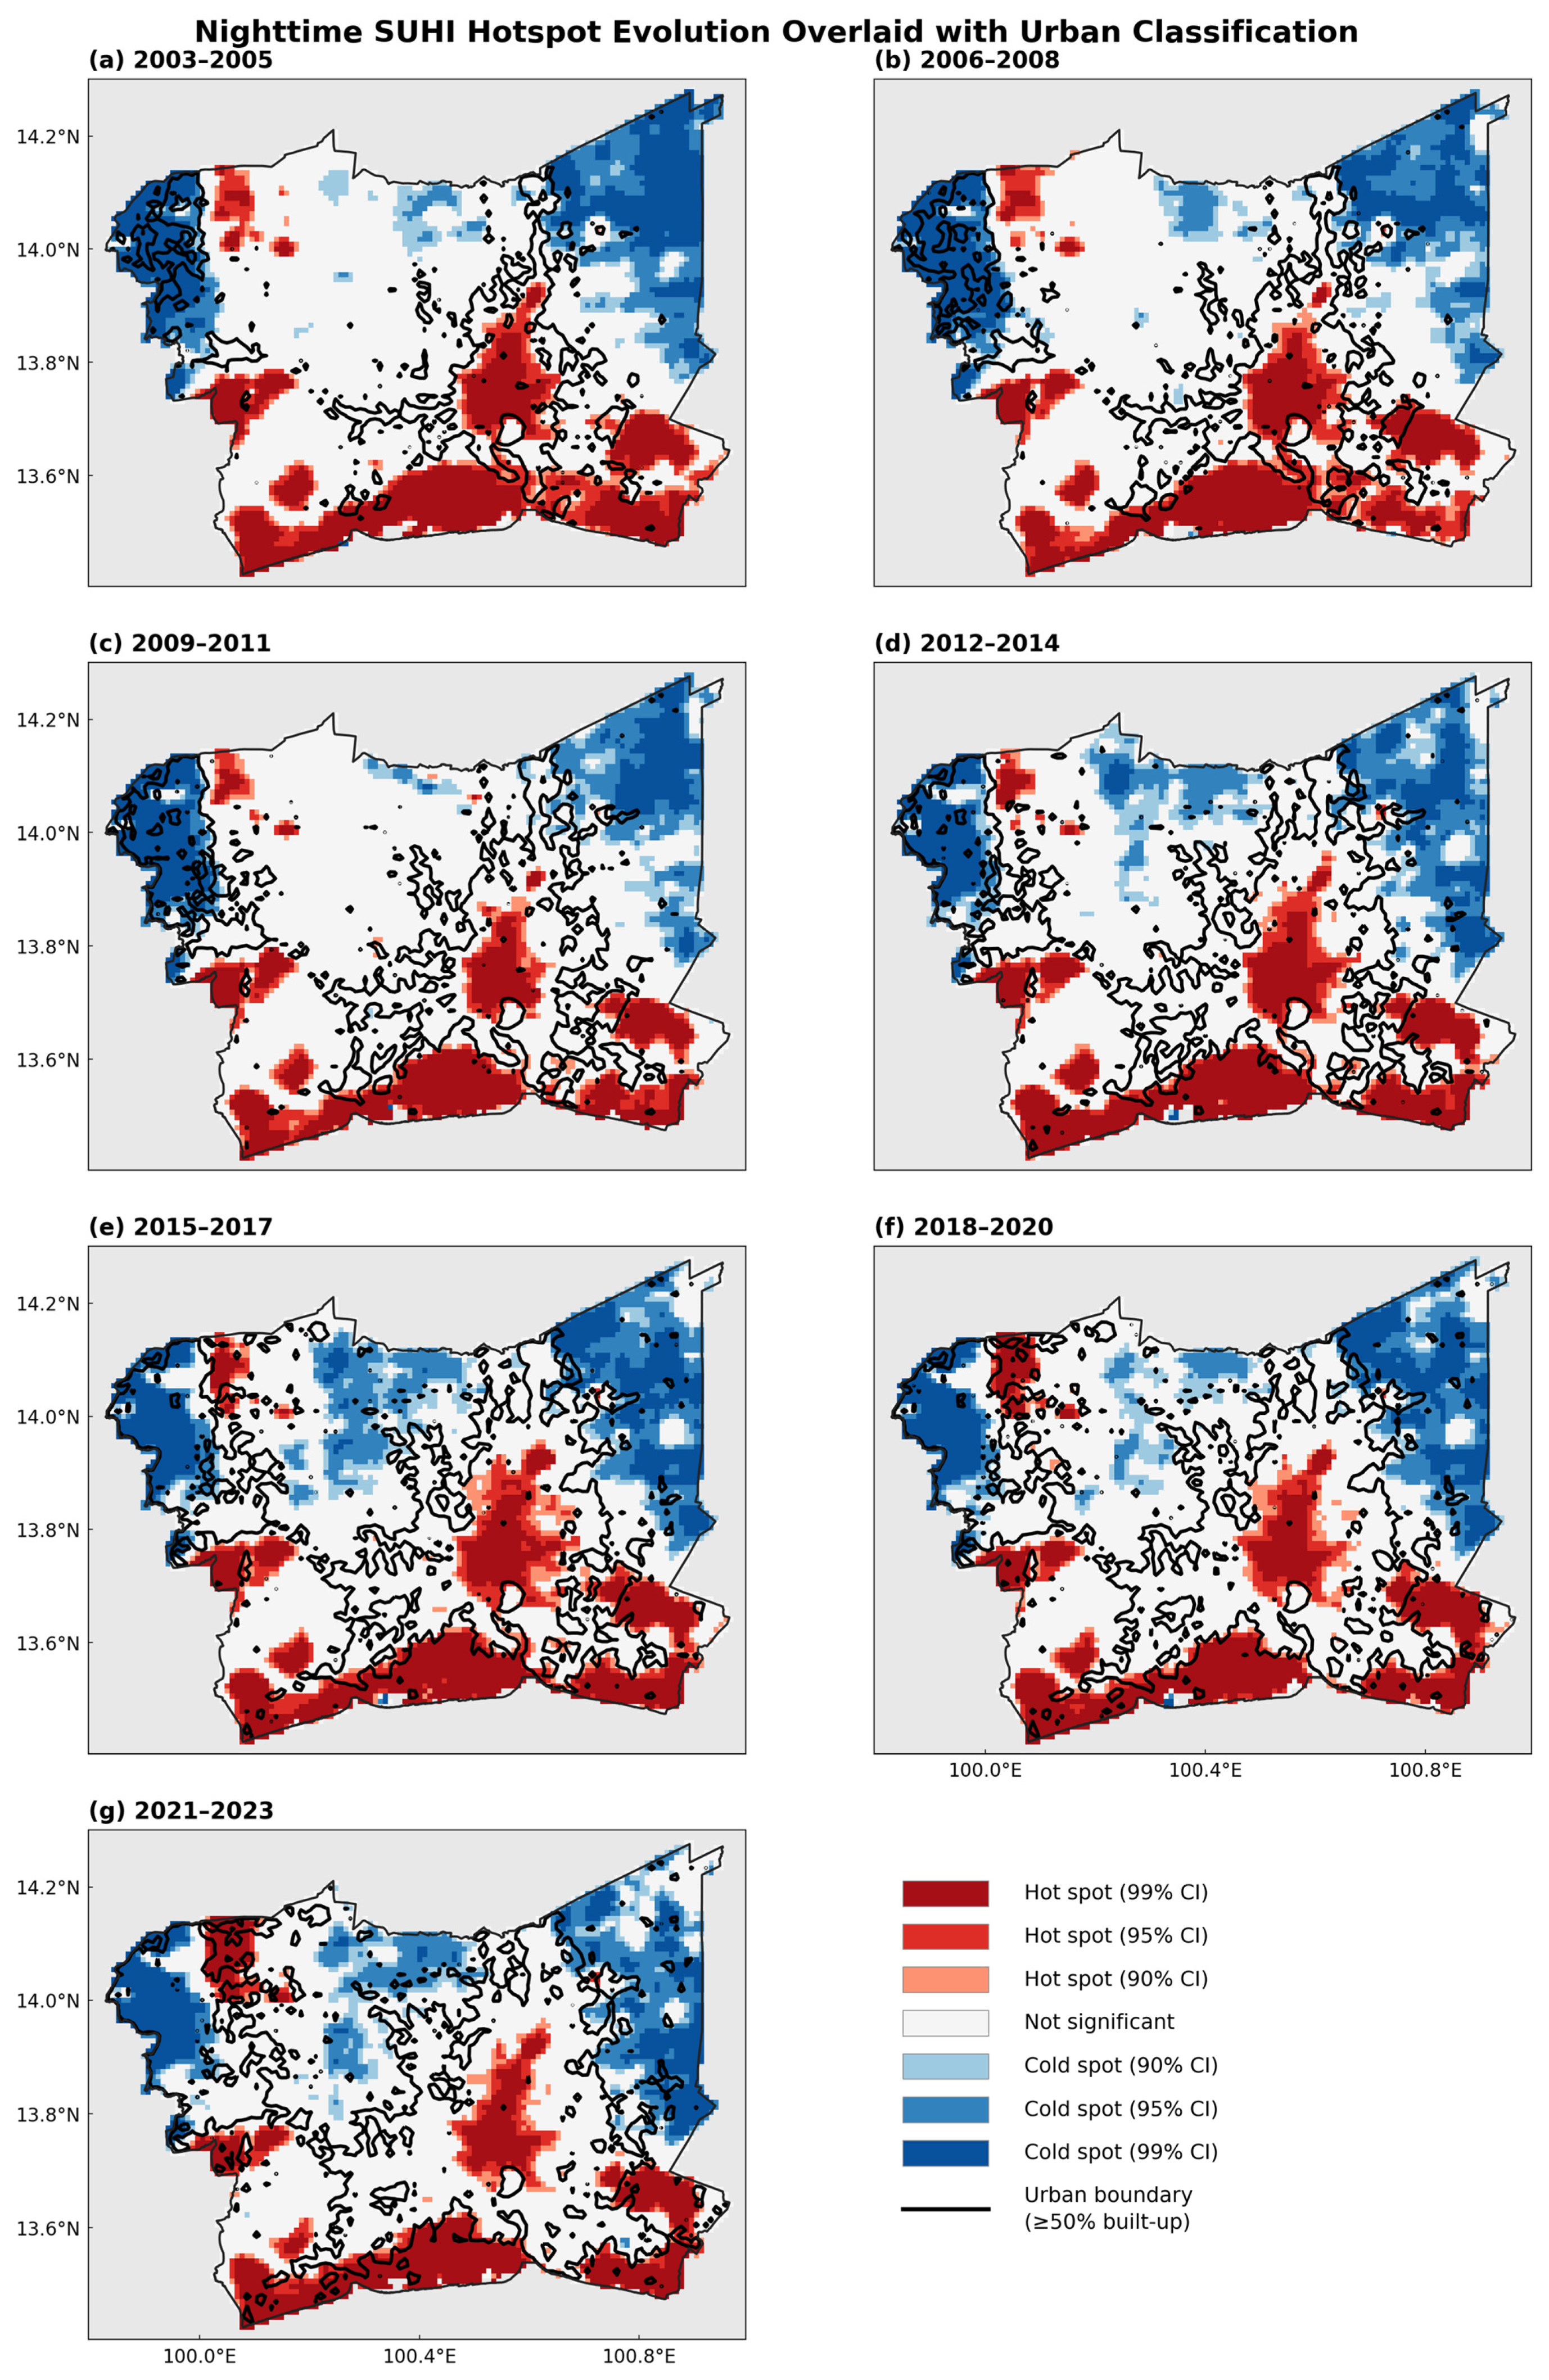
At nighttime, although the spatial distribution of hotspots remains largely similar, differences in intensity and spread are observed (Figure 10). These patterns indicate that urban areas can continue to retain heat after sunset [53], creating enduring nighttime heat islands [54].
The spatial correspondence between SUHI hotspot zones and LULC categories is striking. Persistent daytime and nighttime hotspots consistently overlap with areas classified as urban built-up land, particularly in the industrial zones of Samut Prakan and the commercial districts of central Bangkok. The expansion of hotspot zones between 2015 and 2020, and 2021 and 2023, closely mirrors the urban growth corridors identified in Section 3.1, confirming that land conversion from agricultural to built-up surfaces is a primary driver of SUHI intensification. Notably, nighttime hotspots show greater spatial persistence than daytime hotspots, suggesting that heat storage in the urban fabric plays a more dominant role than direct solar heating in determining chronic thermal stress zones.

4. Discussion

4.1. LST Monthly Mean and Distribution

The prominent seasonal LST distributions of BMR are under tropical solar forcing and urbanization features. The highest LST typically occurs in April and May, aligning with the peak of solar insolation and clear, sunny skies. During the monsoon season (from June to September), cloud cover and rainfall tend to cool things down during the day, yet heat stored in urban surfaces maintains elevated temperatures. By December, the solar intensity drops significantly, and so do the surface temperatures, reaching their lowest points of the year [55].
LST also changes through the night, but the effect is often more pronounced after sunset. This phenomenon is generally because materials, i.e., concrete and asphalt, absorb solar radiation and hold heat during the daytime. Consequently, areas with high population density usually have higher nighttime LST values than rural areas where natural vegetation mitigates temperatures [56].
Land use has a pronounced impact on heat in the BMR, and this is even more apparent as urban development evolves the landscape. As cities expand, the impervious surfaces increase while the green spaces decrease, combined with intensified human activity, contribute to rising temperatures across the urban landscape. This promotes an increased intensity of the urban heat island effect, particularly in the case of BMR. The area’s geographical features play a role too—its low-lying terrain and proximity to the Gulf of Thailand raise humidity levels and change local weather, which compound the warmth experienced in the city. These effects are interrelated and render the urban region distinctly hotter and less comfortable than neighboring rural areas [57].

4.2. Nocturnal and Diurnal SUHI Long-Term Trends in the BMR

While the monsoon season moderates SUHI intensity, however, urban areas continue to retain more heat than rural areas even during this period, confirming the persistent nature of the SUHI effect. Analysis over the long term reveals a gradual increase in SUHI intensity, which corresponds with global warming, along with local alterations such as urbanization and minimized vegetation coverage throughout the BMR [58]. Rural regions benefit from natural cooling effects through improved ventilation and the presence of water bodies that dissipate heat. In contrast, urban areas with dense built environments and impervious surfaces trap and retain heat. The nocturnal SUHI effect poses risks to public health by sustaining elevated temperatures that disproportionately affect vulnerable populations. These results highlight the importance of increasing nighttime cooling and resiliency in cities through increased green spaces, water features, and improved wind-flows to alleviate SUHI effects and improve quality of urban life [59].
It is noteworthy that the rural LST warming rate of 0.109 °C per year substantially exceeds the global average surface warming rate of approximately 0.02 °C per year, warranting further discussion. Three factors likely contribute to this elevated rural warming: (1) land use and land cover changes in areas classified as rural, where ongoing conversion of paddy fields and agricultural land to semi-urban uses increases surface imperviousness and heat absorption capacity even before areas are formally reclassified as urban; (2) urban heat island influence on nearby rural pixels, particularly given that the BMR’s rural areas are in close proximity to one of Southeast Asia’s largest urban agglomerations, creating a thermal gradient that elevates temperatures in the rural periphery; (3) regional warming amplification in tropical lowland areas, where land surface warming rates tend to exceed global averages due to changes in monsoon circulation and land–atmosphere feedback processes. This concurrent rural warming moderates the observed SUHI intensity trend, suggesting that the true urban thermal impact may be somewhat larger than the urban–rural differential alone indicates.

4.3. Spatial Distribution of Nocturnal and Diurnal SUHI

Through the mapping of annual average SUHI intensity, it is found that Central Bangkok and the surrounding districts are identified as perennial hotspots where peak SUHI effects have persistently occurred over the years. These persistent and more intense hotspots in this sub-region depict the understanding of rapid urbanization and lack of green spaces [60]. Coldspots, in contrast, are typically located on the outskirts of the city and most prominent at night [61], which indicates regions with less ability to retain heat. The higher SUHI impacts observed over water bodies around the BMR coastal front during the nighttime compared to the daytime can be related to the high thermal inertia of water, which absorbs and stores heat in the daytime and releases it gradually at night. More urban infrastructure and human activities in proximity to these coastal areas also exacerbate the situation with higher nighttime temperatures. The intermingling between urban places and water systems [62], together with higher humidity levels and land–sea breeze dynamics, is highly prevalent in sustaining elevated temperature over these zones [63].
An important finding is the presence of significant nighttime SUHI hotspots in areas that appear to have relatively high vegetation coverage in Figure 1, particularly in the southern, southeastern, and northern BMR. While latent heat release from water bodies partially explains warming in coastal areas, several additional factors contribute to nighttime hotspots in non-coastal zones. First, the type of rural vegetation matters: paddy fields and recently harvested agricultural land have substantially different thermal properties compared to natural forests, with lower evapotranspiration rates and reduced nocturnal cooling capacity during dry fallow periods. Second, spatial variations in soil moisture significantly affect nocturnal cooling rates; drier soils in semi-urbanized transitional zones store more heat and release it more slowly at night. Third, localized urban morphology including low-rise dense development, industrial zones, and warehousing complexes in the southeastern BMR may not register strongly in NDVI/NDBI indices but nonetheless contribute significant thermal mass. Fourth, the flat topography of the BMR (mean elevation < 5 m above sea level) limits cold air drainage and katabatic cooling that might otherwise moderate nighttime temperatures in more topographically varied regions. Additionally, the fixed classification thresholds used may underrepresent certain transitional urban areas where development occurs at low density within formerly agricultural landscapes.

4.4. Influence of Broader Climatic Patterns

The analysis reveals that nocturnal SUHI dynamics in the BMR are significantly modulated by ENSO teleconnections through several climatic pathways. During El Niño events, the weakening of the Walker circulation leads to reduced monsoon precipitation and cloud cover over mainland Southeast Asia, resulting in enhanced daytime solar radiation absorption by urban surfaces and greater nocturnal heat storage release. The associated reduction in soil moisture during El Niño phases suppresses evaporative cooling in rural areas, thereby amplifying the urban–rural temperature differential, particularly at night when evapotranspiration is the primary cooling mechanism for vegetated surfaces. Furthermore, altered synoptic wind patterns during ENSO events affect urban ventilation and heat advection, reducing nocturnal heat dissipation from the dense urban core. Conversely, during La Niña phases, increased atmospheric humidity enhances the atmospheric greenhouse effect and nocturnal longwave radiation, maintaining elevated nighttime temperatures across both urban and rural areas but with stronger effects in areas of high thermal mass. Interestingly, the cross-correlation analysis with MEIv2 reveals that after several months, SUHI anomalies appear to respond to shifts in this index. This time-lag more likely reflects the complex ocean–atmosphere interactions during ENSO events. The effect of ENSO require time to propagate to regional climate conditions. Cross-correlation analysis with MEIv2 confirms significant associations at various time lags, indicating that ENSO-driven variations are followed, after several months, by corresponding shifts in SUHI anomalies.
The cross-correlation analysis confirms a 3-month lag between ENSO indices and SUHI anomalies in the BMR, consistent with the typical timeframe for ENSO-driven atmospheric circulation changes to propagate through the Indian Ocean Dipole and Western North Pacific Monsoon systems to influence the Southeast Asian regional climate. This lag period is critical for potential early warning systems, as it suggests that seasonal SUHI predictions could be informed by ENSO monitoring data with a useful lead time for urban heat management planning. One of the major phenomena affecting Southeast Asia’s weather patterns is the El Niño system. Warming of the central and eastern tropical Pacific Ocean triggers cascading effects on regional climate patterns. These variations can intensify urban heat islands, prolong heatwaves, and alter cloud cover and precipitation patterns. Notably, these large-scale climatic shifts typically manifest in urban thermal environments with an approximate three-month lag. This underscores the importance for urban planners and climate scientists to consider both local conditions and broader global climate patterns when developing resilient urban spaces and adaptation strategies.
Based on the hotspot analysis results, we recommend spatially targeted urban heat mitigation strategies. For the persistent nighttime hotspot zones identified in the southern and southeastern BMR (Samut Prakan and adjacent areas), priority should be given to expanding urban green infrastructure, including street tree planting programs and pocket parks that enhance nocturnal evapotranspiration. In the commercial and industrial urban core of central Bangkok, implementing cool roof and high-emissivity surface material policies could reduce nocturnal heat storage and release. For the northern BMR where rapid peri-urban expansion is converting agricultural land to residential development, preserving and enhancing remaining agricultural buffer zones and establishing ventilation corridors aligned with prevailing wind patterns would help to maintain rural cooling influences. These spatially differentiated recommendations leverage the Getis-Ord Gi* hotspot maps (Figure 9 and Figure 10) to guide resource allocation toward areas of greatest thermal vulnerability.

4.5. Limitations

This study has several limitations that should be acknowledged. The coarse 1 km resolution of these data, such as that from the MODIS LST data set, may smooth out small-scale temperature differences in urban areas that are difficult to resolve. Additionally, the use of monthly averages may obscure rapid temperature shifts, particularly during monsoon season. Also, satellite measurements are based on surface temperatures rather than the air we actually breathe, meaning that the relationship between surface temperature and individual human thermal exposure remains uncertain, as surface conditions vary considerably depending on materials and atmospheric conditions.
Transitional zones between urban and rural land may be misclassified when using fixed NDVI and NDBI thresholds. Additionally, although a 2 km buffer zone was applied to separate urban and rural sampling areas, future studies could benefit from implementing more sophisticated urban–rural delineation methods that incorporate urban cluster size analysis and optimized buffer distances based on local thermal influence zones. The proximity of rural reference areas to expanding urban boundaries in the BMR may result in rural temperature values that partially reflect urban thermal influence, potentially leading to conservative SUHI intensity estimates. Although associations between ENSO and SUHI patterns are observed, these represent statistical correlations rather than established causal relationships. Going forward, integrating satellite data with ground-based air temperature measurements, using higher resolution thermal imagery and examining how ENSO drives nighttime urban heat in particular—and especially the tropics—would provide more comprehensive understanding.
Over the past two decades, land surface temperatures have increased steadily, driven by urban expansion, loss of green spaces, and the proliferation of heat-absorbing surfaces. These changes exacerbate the urban heat island effect. In response, mitigation strategies include expanding urban vegetation, implementing “green roofs,” incorporating reflective materials into buildings and designing more intelligent urban spaces. Nature-based solutions and energy-efficient design approaches will be essential for enhancing urban livability and resilience under continued warming.

5. Conclusions

This study provides a detailed analysis of the spatiotemporal dynamics for nocturnal SUHI over two decades in the BMR using MODIS LST and Landsat classifications. A key finding is that nighttime LSTs are steadily rising, on average by about 0.109 °C per year, while nocturnal SUHI effects persist longer than daytime SUHI effects. The urban–rural temperature differences can reach up to 2.0 °C, while areas with ambient temperatures are retained at night. The core of Bangkok Metro compared to newly developed peripheries highlights how urban land use now shapes microclimates. Additionally, cross-correlation analysis confirmed the distinct correlation between ENSO events and corresponding SUHI anomalies. The study also suggested that this relationship had a significant three-month delayed effect which might allow for seasonal heat predictions. These insights highlight the urgent need for city planning that focuses on nighttime heat. Interventions such as ventilation corridors, high-emissivity building materials, and greenery that encourages nighttime evapotranspiration could substantially reduce nocturnal heat stress. Establishing cooling centers for vulnerable populations is also critical for mitigating the health impacts of increasingly frequent hot nights.
Future work should evaluate finer spatial scales of the mechanisms of nocturnal heat storage and release, how urban morphology influences nocturnal cooling capacity, and whether particular nocturnal-heat-targeted interventions are effective by means of controlled field experiments.

Author Contributions

Conceptualization, S.M. (Sitthisak Moukomla) and P.M.; methodology, S.M. (Sitthisak Moukomla); software, S.M. (Sitthisak Moukomla); validation, P.M., S.M. (Supaporn Manajitprasert). and N.P.; formal analysis, S.M. (Sitthisak Moukomla); investigation, S.M. (Sitthisak Moukomla); resources, S.M. (Supaporn Manajitprasert); data curation, S.M. (Sitthisak Moukomla); writing—original draft preparation, S.M. (Sitthisak Moukomla); writing—review and editing, N.P.; visualization, N.P.; supervision, P.M.; project administration, S.M. (Supaporn Manajitprasert); funding acquisition, N.P. All authors have read and agreed to the published version of the manuscript.

Funding

This research was funded by Faculty of Liberal Arts, Thammasat University, grant number Fast Track 16/2567.

Data Availability Statement

The original contributions presented in this study are included in the article. Further inquiries can be directed to the corresponding author.

Acknowledgments

The authors thank Thammasat University for institutional support. During the preparation of this manuscript, the authors used Claude for the purposes of language editing and proofreading. The authors have reviewed and edited the output and take full responsibility for the content of this publication.

Conflicts of Interest

The authors declare no conflicts of interest.

References

  1. Cortes, A.; Rejuso, A.J.; Santos, J.A.; Blanco, A. Evaluating Mitigation Strategies for Urban Heat Island in Mandaue City Using ENVI-Met. J. Urban Manag. 2022, 11, 97–106. [Google Scholar] [CrossRef]
  2. Deliry, S.I.; Avdan, Z.Y.; Avdan, U. Extracting Urban Impervious Surfaces from Sentinel-2 and Landsat-8 Satellite Data for Urban Planning and Environmental Management. Environ. Sci. Pollut. Res. 2021, 28, 6572–6586. [Google Scholar] [CrossRef]
  3. Amindin, A.; Pouyan, S.; Pourghasemi, H.R.; Yousefi, S.; Tiefenbacher, J.P. Spatial and Temporal Analysis of Urban Heat Island Using Landsat Satellite Images. Environ. Sci. Pollut. Res. 2021, 28, 41439–41450. [Google Scholar] [CrossRef]
  4. Kotharkar, R.; Bagade, A.; Singh, P.R. A Systematic Approach for Urban Heat Island Mitigation Strategies in Critical Local Climate Zones of an Indian City. Urban Clim. 2020, 34, 100701. [Google Scholar] [CrossRef]
  5. Sharma, R.; Pradhan, L.; Kumari, M.; Bhattacharya, P. Assessing Urban Heat Islands and Thermal Comfort in Noida City Using Geospatial Technology. Urban Clim. 2021, 35, 100751. [Google Scholar] [CrossRef]
  6. Puttanapong, N.; Nuengjumnong, N.; SaeJung, J.J.; Moukomla, S. A 36-Year Geospatial Analysis of Urbanization Dynamics and Surface Urban Heat Island Effect: Case Study of the Bangkok Metropolitan Region. Geogr. Sustain. 2025, 6, 100322. [Google Scholar] [CrossRef]
  7. Arifwidodo, S.D.; Tanaka, T. The Characteristics of Urban Heat Island in Bangkok, Thailand. Procedia Soc. Behav. Sci. 2015, 195, 423–428. [Google Scholar] [CrossRef]
  8. Marks, D.; Connell, J. Unequal and Unjust: The Political Ecology of Bangkok’s Increasing Urban Heat Island. Urban Stud. 2023, 61, 2887–2907. [Google Scholar] [CrossRef]
  9. Sultana, S.; Satyanarayana, A.N.V. Assessment of Urbanisation and Urban Heat Island Intensities Using Landsat Imageries during 2000—2018 over a Sub-Tropical Indian City. Sustain. Cities Soc. 2020, 52, 101846. [Google Scholar] [CrossRef]
  10. Son, N.T.; Chen, C.F.; Chen, C.R.; Thanh, B.X.; Vuong, T.H. Assessment of Urbanization and Urban Heat Islands in Ho Chi Minh City, Vietnam Using Landsat Data. Sustain. Cities Soc. 2017, 30, 150–161. [Google Scholar] [CrossRef]
  11. Nguyen, C.T.; Chidthaisong, A.; Limsakul, A.; Varnakovida, P.; Ekkawatpanit, C.; Diem, P.K.; Diep, N.T.H. How Do Disparate Urbanization and Climate Change Imprint on Urban Thermal Variations? A Comparison between Two Dynamic Cities in Southeast Asia. Sustain. Cities Soc. 2022, 82, 103882. [Google Scholar] [CrossRef]
  12. Moazzam, M.F.U.; Lee, B.G. Urbanization Influenced SUHI Of 41 Megacities of the World Using Big Geospatial Data Assisted with Google Earth Engine. Sustain. Cities Soc. 2024, 101, 105095. [Google Scholar] [CrossRef]
  13. Le, M.T.; Bakaeva, N. A Technique for Generating Preliminary Satellite Data to Evaluate SUHI Using Cloud Computing: A Case Study in Moscow, Russia. Remote Sens. 2023, 15, 3294. [Google Scholar] [CrossRef]
  14. Wen, C.; Mamtimin, A.; Feng, J.; Wang, Y.; Yang, F.; Huo, W.; Zhou, C.; Li, R.; Song, M.; Gao, J. Diurnal Variation in Urban Heat Island Intensity in Birmingham: The Relationship between Nocturnal Surface and Canopy Heat Islands. Land 2023, 12, 2062. [Google Scholar] [CrossRef]
  15. Possega, M.; Aragao, L.; Ruggieri, P.; Santo, M.A.; Di Sabatino, S. Observational Evidence of Intensified Nocturnal Urban Heat Island during Heatwaves in European Cities. Environ. Res. Lett. 2022, 17, 124013. [Google Scholar] [CrossRef]
  16. O’Malley, C.; Kikumoto, H. An Investigation into Heat Storage by Adopting Local Climate Zones and Nocturnal-Diurnal Urban Heat Island Differences in the Tokyo Prefecture. Sustain. Cities Soc. 2022, 83, 103959. [Google Scholar] [CrossRef]
  17. Nganyiyimana, J.; Ngarambe, J.; Yun, G.Y. Nighttime Light: A Potential Proxy for Local Nocturnal Urban Heat Island Intensity in Seoul. J. Green Build. 2023, 18, 29–41. [Google Scholar] [CrossRef]
  18. Oliveira, A.; Lopes, A.; Niza, S.; Soares, A. An Urban Energy Balance-Guided Machine Learning Approach for Synthetic Nocturnal Surface Urban Heat Island Prediction: A Heatwave Event in Naples. Sci. Total Environ. 2022, 805, 150130. [Google Scholar] [CrossRef]
  19. Mughal, M.O.; Li, X.-X.; Norford, L.K. Urban Heat Island Mitigation in Singapore: Evaluation Using WRF/Multilayer Urban Canopy Model and Local Climate Zones. Urban Clim. 2020, 34, 100714. [Google Scholar] [CrossRef]
  20. Li, S.; Biljecki, F.; Liu, P.; Stouffs, R. Drivers of Day-Night Intra-Surface Urban Heat Island Variations under Local Extreme Heat: A Case Study of Singapore. Sustain. Cities Soc. 2025, 135, 107000. [Google Scholar] [CrossRef]
  21. Siswanto, S.; Nuryanto, D.E.; Ferdiansyah, M.R.; Prastiwi, A.D.; Dewi, O.C.; Gamal, A.; Dimyati, M. Spatio-Temporal Characteristics of Urban Heat Island of Jakarta Metropolitan. Remote Sens. Appl. 2023, 32, 101062. [Google Scholar] [CrossRef]
  22. Shastri, H.; Barik, B.; Ghosh, S.; Venkataraman, C.; Sadavarte, P. Flip Flop of Day-Night and Summer-Winter Surface Urban Heat Island Intensity in India. Sci. Rep. 2017, 7, 40178. [Google Scholar] [CrossRef]
  23. Lefevre, A.; Malet-Damour, B.; Boyer, H.; Riviere, G. Urban Heat Island in the Tropics: A Review of Advances, Challenges, and Future Directions. City Environ. Interact. 2025, 28, 100265. [Google Scholar] [CrossRef]
  24. Assaf, G.; Assaad, R.H. Modeling the Impact of Land Use/Land Cover (LULC) Factors on Diurnal and Nocturnal Urban Heat Island (UHI) Intensities Using Spatial Regression Models. Urban Clim. 2024, 55, 101971. [Google Scholar] [CrossRef]
  25. da Silva Lopes, E.; Hora, K.E.R. Impact of Urban Morphology on the Intensity of Nocturnal Heat Islands: Analysis through the Validation of Simulation Models in Central-West Brazil. Urban Clim. 2024, 56, 102047. [Google Scholar] [CrossRef]
  26. Khamchiangta, D.; Dhakal, S. Future Urban Expansion and Local Climate Zone Changes in Relation to Land Surface Temperature: Case of Bangkok Metropolitan Administration, Thailand. Urban Clim. 2021, 37, 100835. [Google Scholar] [CrossRef]
  27. Tian, P.; Li, J.; Cao, L.; Pu, R.; Wang, Z.; Zhang, H.; Chen, H.; Gong, H. Assessing Spatiotemporal Characteristics of Urban Heat Islands from the Perspective of an Urban Expansion and Green Infrastructure. Sustain. Cities Soc. 2021, 74, 103208. [Google Scholar] [CrossRef]
  28. Thanvisitthapon, N.; Nakburee, A.; Khamchiangta, D.; Saguansap, V. Climate Change-Induced Urban Heat Island Trend Projection and Land Surface Temperature: A Case Study of Thailand’s Bangkok Metropolitan. Urban Clim. 2023, 49, 101484. [Google Scholar] [CrossRef]
  29. Khamchiangta, D.; Dhakal, S. Time Series Analysis of Land Use and Land Cover Changes Related to Urban Heat Island Intensity: Case of Bangkok Metropolitan Area in Thailand. J. Urban Manag. 2020, 9, 383–395. [Google Scholar] [CrossRef]
  30. Zhang, F.; Zhang, X.; Chen, W.; Yang, B.; Chen, Z.; Tang, H.; Wang, Z.; Bi, P.; Yang, L.; Li, G.; et al. Cloud-Free Land Surface Temperature Reconstructions Based on MODIS Measurements and Numerical Simulations for Characterizing Surface Urban Heat Islands. IEEE J. Sel. Top. Appl. Earth Obs. Remote Sens. 2022, 15, 6882–6898. [Google Scholar] [CrossRef]
  31. Nayak, S.; Vinod, A.; Prasad, A.K. Spatial Characteristics and Temporal Trend of Urban Heat Island Effect over Major Cities in India Using Long-Term Space-Based MODIS Land Surface Temperature Observations (2000–2023). Appl. Sci. 2023, 13, 13323. [Google Scholar] [CrossRef]
  32. Bonafoni, S.; Keeratikasikorn, C. Land Surface Temperature and Urban Density: Multiyear Modeling and Relationship Analysis Using Modis and Landsat Data. Remote Sens. 2018, 10, 1471. [Google Scholar] [CrossRef]
  33. Parkinson, C.L. The Earth-Observing Aqua Satellite Mission: 20 Years and Counting. Earth Space Sci. 2022, 9, e2022EA002481. [Google Scholar] [CrossRef]
  34. Palanisamy, P.A.; Jain, K.; Bonafoni, S. Machine Learning Classifier Evaluation for Different Input Combinations: A Case Study with Landsat 9 and Sentinel-2 Data. Remote Sens. 2023, 15, 3241. [Google Scholar] [CrossRef]
  35. Li, X.; Gong, P.; Liang, L. A 30-Year (1984–2013) Record of Annual Urban Dynamics of Beijing City Derived from Landsat Data. Remote Sens. Environ. 2015, 166, 78–90. [Google Scholar] [CrossRef]
  36. Oke, T.R. The Energetic Basis of the Urban Heat Island; Wiley: Hoboken, NJ, USA, 1982; Volume 108. [Google Scholar]
  37. Oke, T.R. Boundary Layer Climates; Routledge: Abingdon, UK, 2002; ISBN 0203407210. [Google Scholar]
  38. García, D.H.; Díaz, J.A. Space–Time Analysis of the Earth’s Surface Temperature, Surface Urban Heat Island and Urban Hotspot: Relationships with Variation of the Thermal Field in Andalusia (Spain). Urban Ecosyst. 2023, 26, 525–546. [Google Scholar] [CrossRef]
  39. Sharma, R.; Joshi, P.K. Identifying Seasonal Heat Islands in Urban Settings of Delhi (India) Using Remotely Sensed Data—An Anomaly Based Approach. Urban Clim. 2014, 9, 19–34. [Google Scholar] [CrossRef]
  40. Haashemi, S.; Weng, Q.; Darvishi, A.; Alavipanah, S.K. Seasonal Variations of the Surface Urban Heat Island in a Semi-Arid City. Remote Sens. 2016, 8, 352. [Google Scholar] [CrossRef]
  41. Mohammad, P.; Goswami, A. Quantifying Diurnal and Seasonal Variation of Surface Urban Heat Island Intensity and Its Associated Determinants across Different Climatic Zones over Indian Cities. GIsci. Remote Sens. 2021, 58, 955–981. [Google Scholar] [CrossRef]
  42. Yu, W.; Yang, J.; Cong, N.; Ren, J.; Yu, H.; Xiao, X.; Xia, J. Attribution of Urban Diurnal Thermal Environmental Change: Importance of Global-Local Effects. IEEE J. Sel. Top. Appl. Earth Obs. Remote Sens. 2023, 16, 8087–8101. [Google Scholar] [CrossRef]
  43. She, Y.; Liu, Z.; Zhan, W.; Lai, J.; Huang, F. Strong Regulation of Daily Variations in Nighttime Surface Urban Heat Islands by Meteorological Variables across Global Cities. Environ. Res. Lett. 2022, 17, 14049. [Google Scholar] [CrossRef]
  44. Siddiqui, A.; Kushwaha, G.; Nikam, B.; Srivastav, S.K.; Shelar, A.; Kumar, P. Analysing the Day/Night Seasonal and Annual Changes and Trends in Land Surface Temperature and Surface Urban Heat Island Intensity (SUHII) for Indian Cities. Sustain. Cities Soc. 2021, 75, 103374. [Google Scholar] [CrossRef]
  45. Dewan, A.; Kiselev, G.; Botje, D.; Mahmud, G.I.; Bhuian, M.H.; Hassan, Q.K. Surface Urban Heat Island Intensity in Five Major Cities of Bangladesh: Patterns, Drivers and Trends. Sustain. Cities Soc. 2021, 71, 102926. [Google Scholar] [CrossRef]
  46. Hu, J.; Yang, Y.; Zhou, Y.; Zhang, T.; Ma, Z.; Meng, X. Spatial Patterns and Temporal Variations of Footprint and Intensity of Surface Urban Heat Island in 141 China Cities. Sustain. Cities Soc. 2022, 77, 103585. [Google Scholar] [CrossRef]
  47. Ghosh, S.; Kumar, D.; Kumari, R. Assessing Spatiotemporal Variations in Land Surface Temperature and SUHI Intensity with a Cloud Based Computational System over Five Major Cities of India. Sustain. Cities Soc. 2022, 85, 104060. [Google Scholar] [CrossRef]
  48. Terao, T.; Islam, M.N.; Hayashi, T.; Oka, T. Nocturnal Jet and Its Effects on Early Morning Rainfall Peak over Northeastern Bangladesh during the Summer Monsoon Season. Geophys. Res. Lett. 2006, 33, L18806. [Google Scholar] [CrossRef]
  49. Yuan, W.; Yu, R.; Chen, H.; Li, J.; Zhang, M. Subseasonal Characteristics of Diurnal Variation in Summer Monsoon Rainfall over Central Eastern China. J. Clim. 2010, 23, 6684–6695. [Google Scholar] [CrossRef]
  50. Oh, S.G.; Han, J.Y.; Min, S.K.; Son, S.W. Impact of Urban Heat Island on Daily and Sub-Daily Monsoon Rainfall Variabilities in East Asian Megacities. Clim. Dyn. 2023, 61, 19–32. [Google Scholar] [CrossRef]
  51. Guerri, G.; Crisci, A.; Messeri, A.; Congedo, L.; Munafò, M.; Morabito, M. Thermal Summer Diurnal Hot-Spot Analysis: The Role of Local Urban Features Layers. Remote Sens. 2021, 13, 538. [Google Scholar] [CrossRef]
  52. Chang, Y.; Xiao, J.; Li, X.; Weng, Q. Monitoring Diurnal Dynamics of Surface Urban Heat Island for Urban Agglomerations Using ECOSTRESS Land Surface Temperature Observations. Sustain. Cities Soc. 2023, 98, 104833. [Google Scholar] [CrossRef]
  53. Ming, Y.; Liu, Y.; Gu, J.; Wang, J.; Liu, X. Nonlinear Effects of Urban and Industrial Forms on Surface Urban Heat Island: Evidence from 162 Chinese Prefecture-Level Cities. Sustain. Cities Soc. 2023, 89, 104350. [Google Scholar] [CrossRef]
  54. Raj, S.; Paul, S.K.; Chakraborty, A.; Kuttippurath, J. Anthropogenic Forcing Exacerbating the Urban Heat Islands in India. J. Environ. Manag. 2020, 257, 110006. [Google Scholar] [CrossRef]
  55. Garzón, J.; Molina, I.; Velasco, J.; Calabia, A. A Remote Sensing Approach for Surface Urban Heat Island Modeling in a Tropical Colombian City Using Regression Analysis and Machine Learning Algorithms. Remote Sens. 2021, 13, 4256. [Google Scholar] [CrossRef]
  56. Sarif, M.O.; Rimal, B.; Stork, N.E. Assessment of Changes in Land Use/Land Cover and Land Surface Temperatures and Their Impact on Surface Urban Heat Island Phenomena in the Kathmandu Valley (1988–2018). ISPRS Int. J. Geoinf. 2020, 9, 726. [Google Scholar] [CrossRef]
  57. Dutta, D.; Rahman, A.; Paul, S.K.; Kundu, A. Changing Pattern of Urban Landscape and Its Effect on Land Surface Temperature in and around Delhi. Environ. Monit. Assess. 2019, 191, 551. [Google Scholar] [CrossRef]
  58. Keeratikasikorn, C.; Bonafoni, S. Satellite Images and Gaussian Parameterization for an Extensive Analysis of Urban Heat Islands in Thailand. Remote Sens. 2018, 10, 665. [Google Scholar] [CrossRef]
  59. Yang, C.; Zhao, S. Synergies or Trade-Offs between Surface Urban Heat Island and Hot Extreme: Distinct Responses in Urban Environments. Sustain. Cities Soc. 2024, 101, 105093. [Google Scholar] [CrossRef]
  60. Chakraborty, T.; Lee, X. A Simplified Urban-Extent Algorithm to Characterize Surface Urban Heat Islands on a Global Scale and Examine Vegetation Control on Their Spatiotemporal Variability. Int. J. Appl. Earth Obs. Geoinf. 2019, 74, 269–280. [Google Scholar] [CrossRef]
  61. Silva, J.S.; da Silva, R.M.; Santos, C.A.G. Spatiotemporal Impact of Land Use/Land Cover Changes on Urban Heat Islands: A Case Study of Paço Do Lumiar, Brazil. Build. Environ. 2018, 136, 279–292. [Google Scholar] [CrossRef]
  62. Peng, X.; Zhou, Y.; Fu, X.; Xu, J. Study on the Spatial-Temporal Pattern and Evolution of Surface Urban Heat Island in 180 Shrinking Cities in China. Sustain. Cities Soc. 2022, 84, 104018. [Google Scholar] [CrossRef]
  63. Hou, H.; Su, H.; Yao, C.; Wang, Z.H. Spatiotemporal Patterns of the Impact of Surface Roughness and Morphology on Urban Heat Island. Sustain. Cities Soc. 2023, 92, 104513. [Google Scholar] [CrossRef]
Figure 1. Study area, the BMR includes the Bangkok Metropolitan Region and its neighboring areas.
Earth 07 00060 g001
Figure 2. Urban expansion in the BMR (2003–2023): (a) composite urbanization map by period of first detection, and (b) urban area change over time.
Earth 07 00060 g002
Figure 3. Monthly land surface temperature: (a) histogram of monthly LST; (b) monthly mean LST.
Earth 07 00060 g003
Figure 4. LST trend for urban and rural areas: (a) daytime; (b) nighttime.
Earth 07 00060 g004
Figure 5. SUHI variations: (a) daytime; (b) nighttime. The top panel illustrates daytime SUHI trends (red line), highlighting significant fluctuations and peaks, especially during the hot season. The bottom panel shows nighttime SUHI trends (orange line), with generally smaller variations but still notable long-term trends.
Earth 07 00060 g005
Figure 6. SUHI seasonal trends: (a) daytime; (b) nighttime. The top panel presents daytime SUHI trends (red line), emphasizing seasonal peaks and a notable spike around 2012, likely linked to an extreme weather event. The bottom panel displays nighttime SUHI trends (orange line), showing less variability but clear seasonal patterns, especially during cooler months and the monsoon season.
Earth 07 00060 g006
Figure 7. Analysis of daytime SUHI anomalies (a) and cross-correlation between SUHI daytime anomalies and MEIv2 (b).
Earth 07 00060 g007
Figure 8. SUHI cluster analysis results: (a) daytime and (b) nighttime.
Earth 07 00060 g008aEarth 07 00060 g008b
Figure 9. Daytime SUHI cluster from (a) 2003–2005, (b) 2006–2008, (c) 2009–2011, (d) 2012–2014, (e) 2015–2017, (f) 2018–2020, and (g) 2021–2023.
Earth 07 00060 g009
Figure 10. Nighttime SUHI cluster from (a) 2003–2005, (b) 2006–2008, (c) 2009–2011, (d) 2012–2014, (e) 2015–2017, (f) 2018–2020, and (g) 2021–2023.
Earth 07 00060 g010
Table 1. A summary of statistics related to hotspots, coldspots, and neutral areas over the study period.
Year%
Hotspots
%
Coldspots
%
Neutral
Gi
ZScore (S.D.)
Gi
pValue (S.D.)
Nighttime
2003–200523.3223.6253.060.0032 (2.13)0.2679 (0.31)
2006–200822.1822.5455.280.0026 (2.12)0.2774 (0.30)
2009–201119.0218.8662.12−0.0035 (2.02)0.3257 (0.31)
2012–201421.1624.3654.470.0007 (2.12)0.2757 (0.30)
2015–201723.2626.4350.31−0.0001 (2.12)0.2449 (0.29)
2018–202021.6122.8555.540.0030 (2.11)0.2690 (0.30)
2021–202320.8623.6055.53−0.0003 (2.13)0.2672 (0.29)
Daytime
2003–200520.3016.8162.890.0096 (2.12)0.2757 (0.28)
2006–200818.9318.4562.620.0093 (2.12)0.2778 (0.28)
2009–201120.3519.2860.370.0104 (2.13)0.2568 (0.27)
2012–201421.8319.1858.980.0119 (2.12)0.2434 (0.27)
2015–201721.7317.5060.770.0115 (2.13)0.2619 (0.28)
2018–202021.7919.5158.700.0117 (2.13)0.2472 (0.27)
2021–202323.5822.9953.430.0126 (2.13)0.2277 (0.27)
Disclaimer/Publisher’s Note: The statements, opinions and data contained in all publications are solely those of the individual author(s) and contributor(s) and not of MDPI and/or the editor(s). MDPI and/or the editor(s) disclaim responsibility for any injury to people or property resulting from any ideas, methods, instructions or products referred to in the content.