Article

Adsorption Isotherms of PP, PVC, PA6, LDPE, and HDPE Microplastic Particles, and Their Blend on a Hydrophobic Bio-Substrate at Three Temperatures and Two Environments


1
Chemical Engineering Department, University of New Brunswick, Fredericton, NB E3B 5A3, Canada
2
Chemical Engineering Department, Laval University, Quebec, QC G1V 0A6, Canada
*
Author to whom correspondence should be addressed.
Pollutants 2026, 6(2), 20; https://doi.org/10.3390/pollutants6020020
Submission received: 11 February 2026 / Revised: 14 March 2026 / Accepted: 30 March 2026 / Published: 7 April 2026

Abstract

Micro- and nano-plastic pollution caused by the mismanagement of plastics waste is a significant problem worldwide, causing severe impacts in aquatic and terrestrial environments. The purpose of this study was to evaluate the adsorption capacity of a thermally stable and superhydrophobic bio-substrate to remove microplastic particles (MPPs) from aqueous systems. In this work, the adsorption efficiency of cattail fluff towards MPPs from pristine PP, PVC, PA6, LDPE, HDPE, and their blend was evaluated. The effect of temperature (30 °C, 40 °C, and 50 °C) and two binding environments (distilled water and industrial wastewater) on adsorption was determined. Non-linear regressions of seven adsorption isotherm models including Langmuir, Freundlich, Temkin, Dubinin–Radushkevich (D–R), Redlich–Peterson (R–P), Toth, and Sips were applied to fit the experimental data. Error function analysis confirmed that the D–R adsorption isotherm model offers the best fit of the experimental data. The results show that the bio-substrate is very effective in adsorbing MPPs from aqueous systems with adsorption capacities of qe = 3597 mg/g and qe = 2807 mg/g in distilled water and synthetic industrial water, respectively. The composition of the MPPs determines the effect of temperature and binding environment on the adsorption performance of the bio-substrate. Physisorption dynamics for the MPP/bio-substrate system are also provided and discussed. Overall, the hydrophobic bio-substrate is highly effective in removing MPPs from aqueous systems, with the added advantages of low cost, sustainability, and scalability for practical applications.

1. Introduction

Micro- and nano-plastic pollution caused by the mismanagement of plastic waste is a significant problem worldwide. The severity of this pollution is that under environmental conditions (e.g., UV radiation, temperature, humidity, physical abrasion, etc.) the weathering of micro- and nano-plastics induces the leaching of dissolved organic compounds (DOCs) (e.g., a mixture of complex organic substances including a range of plastic monomers, oligomers, bisphenol A, phenol derivatives, oxidized organic components of different molecular weights, flame retardants, phthalates, etc.) in aquatic and terrestrial systems, causing important environmental impacts [1,2,3,4,5,6,7,8]. As reported in the literature [1], only 14 days of weathering of polyvinylchloride (PVC) and polystyrene (PS) microparticles (e.g., particle sizes < 5 mm) under simulated environmental conditions was enough to trigger the release of dissolved organic compounds, DOCs, from microplastic particles (MPPs) at concentrations ranging from 0.12 to 3.3 mg of DOC/g of MPPs, which is alarming. Therefore, the ensuing problem of micro- and nanoplastic ingestion by aquatic and terrestrial organisms through the food chain is a threat to aquatic and terrestrial ecosystems [2,4,6,9,10,11,12,13,14,15]. Furthermore, it has been demonstrated that micro- and nanoplastics, which display large surface areas and hydrophobicity, function as carriers of other toxic pollutants via adsorption on their surface through different interactions (e.g., hydrophobic, van der Waals, π–π interactions, etc.), increasing the environmental pollution problem [2,5,6,7,8,9,10,11,12,13,14,15,16]. For instance, previous research confirmed that the adsorption of organic compounds onto a microplastic surface is double the adsorption of organic compounds onto natural sediments and soils [3].
Hence, it is paramount to remove micro- and nanoplastics from the environment, especially from water bodies and/or water sources, to control the spread of this contamination [9]. Common techniques for the separation of micro- and nanoplastics from the environment include visual inspection and manual sorting, density separation, flotation, screening, filtration, and adsorption [2,9,17]. From these separation techniques, the adsorption process has drawn interest in the field of wastewater treatment operations for the removal of micro- and nano-plastics because it is a cost-effective, flexible, easy, and environmentally friendly process [9,15,18,19,20,21,22,23,24,25,26].
Adsorption dynamics are determined by molecular interactions between the adsorbate (e.g., solute) and the adsorbent. Therefore, the type of molecular interaction dictates if physical adsorption (e.g., van der Waals forces, hydrophobic interactions, London forces, dipole–dipole forces, etc.), chemical adsorption (e.g., covalent bonds), or ionic exchange (e.g., electrostatic interaction) takes place [18,19,20,22,25]. The efficiency of the adsorption process is affected by several variables including adsorbent type, the availability of active sites on the adsorbent surface, the formation of mono or multilayer adsorption layers, the enthalpy of adsorption, the adsorption Gibb’s free energy, the adsorbate composition, interactions between adsorbate molecules, interactions between adsorbate and adsorbent molecules, the binding environment, and the temperature of the system, among others [27]. The adsorption process is generally exothermic; thus, increasing the temperature of the system normally decreases the adsorption efficiency [27]. Therefore, it is important to evaluate the effect of temperature and binding environment on the adsorption efficiency of the adsorbents.
Experimental adsorption data is commonly fitted through adsorption isotherm models to gain more insights on the adsorbate–adsorbent relationship at equilibrium. This is important because a complete understanding of the dynamics of the adsorption process via adsorption isotherm models allows the establishment of key information such as adsorption mechanisms, maximum adsorption capacities, and adsorbate–adsorbent affinities under different adsorption conditions [18,20,22,24]. This information is also crucial for the design and optimization of adsorption processes and for equipment for practical applications [21,22,25,26,28]. Some of the isotherm models commonly used in water treatment processes include Langmuir, Freundlich, Temkin, Dubinin–Radushkevich, Hill, Sips, Toth, Kahn, Koble–Corrigan, and Redlich–Peterson, among others [18,19,21,22,24,25].
According to the literature [19,20], suitable adsorbents must fulfill the following criteria: they must be derived from wide sources, non-toxic, bio-compatible, bio-degradable, renewable, low cost, and available; they must allow green synthesis modifications, be chemically and thermally stable, have uniform particle size, have high mechanical strength, have a high adsorption capacity, have high selectivity, and allow for easy regeneration. Biobased and natural substrates fulfill several of the requirements for high-quality adsorbents, especially low-cost ones. Furthermore, natural sorbents and bio-substrates exhibit heterogeneous adsorption distribution sites [25]. Common natural and bio-substrates used as adsorbents include minerals (e.g., clays, hydrotalcites, bentonite, etc.), agricultural products (e.g., agricultural waste), seaweeds, yeasts, mosses, bacteria, fungi, lichen, algal waste, spider silk, cellulose, chitosan, biochar, and biopolymers, among others [2,20,25]. Especially for micro- and nano-plastics, previous work showed that three-dimensional adsorbent structures, such superhydrophobic sponges (e.g., contact angle > 150°) or magnetic sponges produced from natural materials, are effective in removing microplastics from wastewater [2].
This work focuses on the evaluation of a hydrophobic bio-substrate’s efficiency in removing microplastics from water. The bio-substrate evaluated was cattail fluff from Typha latifolia, which is an aquatic “herbaceous, rhizomatous, and perennial [plant] with long sword-like leaves from the bare stalk which terminates in a cylindrical inflorescence of female flowers immediately below the male flowers, erupting as fluff when matured” [29]. T. latifolia is found in wetlands worldwide [30,31,32] and in every province and territory in Canada [33]. The flowers (also called fruits) contain achene and perigone hairs (e.g., cattail fluff) that retain most of the seeds rigidly attached to their fibers, while a small proportion of seeds fall or remain in between the fiber clusters [34]. Cattail fluff has been used in several applications such as in wound dressing to adsorb the ichor [29,35], the treatment of burns and ulcers [35], raw material to produce paper, stuffing for mattresses and toys, bay beds, board linings, lifejackets [33,34,35,36], pillow cores [37,38,39], baskets, mats, fans, rope [33,35], textile yarns [40], tinder and insulation [33,39,41], torches dipped into coal oil or kerosene [34,35,41], and the adsorption of oil [42].
The main goal of this study was to determine the efficiency of cattail fluff for the removal of microplastic particles from wastewater. Therefore, the following specific objectives were established: (1) We aimed to perform experimental batch adsorptions tests on five different pristine microplastics of irregular shapes: polypropylene (PP), polyvinyl chloride (PVC), polyamide 6 (PA6), low-density polyethylene (LDPE), high-density polyethylene (HDPE), and their combination (e.g., equal mass). The batch adsorption experiments were conducted at three temperatures (30 °C, 40 °C, and 50 °C) and in two binding environments (distilled water type 2 and an industrial wastewater). (2) We also performed non-linear regression fitting of the experimental adsorption data to seven adsorption models including Langmuir, Freundlich, Temkin, Dubinin–Radushkevich (D–R), Redlich–Peterson (R–P), Toth, and Sips to establish the relationships between the adsorbent and adsorbate under equilibrium conditions. (3) We established the best adsorption isotherm model via error analysis including the coefficient of determination (R2), adjusted coefficient of determination (Adj R2), root mean square deviation error (RMSD), mean square residual (MSE), and non-linear chi-square test (X2). (4) Finally, we determined the effect of the type of microplastic material, temperature, and binding environment on the microplastic adsorption efficiency of cattail fluff.
The main findings of this study indicate that the hydrophobic bio-substrate (cattail fluff) is very effective in adsorbing MPPs of different pristine plastic materials (e.g., PP, PVC, PA6, LDPE, HDPE, and their blend) from aqueous systems at different adsorption temperatures and in different binding environments. The potential applicability of the bio-substrate at a larger scale in real wastewater systems is currently being evaluated by our research team. The ongoing project aims to evaluate the effectiveness of the bio-substrate in removing MPPs from surface water drainage (e.g., rainwater runoff from roofs, driveways, and land) before it enters a lake in a rural area in New Brunswick, Canada.

2. Materials and Methods

2.1. Bio-Substrate: Cattail Fluff

Mature cattail flowers (Typha latifolia) were collected from wild wetlands around the city of Fredericton, New Brunswick, Canada. The cattail fluff was manually separated from the flowers and placed on a flat surface covered with a fine mesh to let it dry under ambient conditions. The dried cattail fluff was used as the bio-substrate without any chemical modification. The contact angle of cattail fluff was characterized using type 2 deionized water as the liquid phase, employing a Goniometer, model G16-2, manufactured by Wet Scientific (Beaumont, TX, USA). The cattail fluff was subjected to thermogravimetric analysis (TGA) using a TA Instrument Model SDT Q600 manufactured by WatersTM (New Castle, DE, USA). The thermogravimetric analysis was conducted under a nitrogen atmosphere at a flow rate of 50 mL/min and using a heating ramp of 10 °C/min. The bio-substrate was exposed to Fourier Transform Infrared (FTIR) spectrometry using a Bruker ALPHA II spectrometer (Billerica, MA, USA) equipped with an attenuated total reflectance (ATR) module. The OPUS software, https://www.bruker.com/en/products-and-solutions/infrared-and-raman/opus-spectroscopy-software/opus-touch.html?source=google&medium=cpc&campaign=BAXS_HMP_|_TITAN-Launch_PMax&content=world&s_kwcid=AL!14677!3!!!!x!!&gad_source=1&gad_campaignid=23686891660&gbraid=0AAAAACRXyuK9Eb3DYYPQO8a0GNY81s9Rp&gclid=CjwKCAjw1tLOBhAMEiwAiPkRHkOkED5B0906Z0J2tDKCiTRfcsEgLt9yKNtu-uJhkLStlV49mlmjXRoC9BoQAvD_BwE (accessed on 20 March 2026) was used to operate the instrument. Prior to each measurement, the ATR crystal was cleaned with distilled water. A background spectrum was collected under ambient conditions by averaging 24 scans, providing a spectral resolution of 4 cm−1. Cattail fiber samples were then placed directly onto the ATR crystal. The spectra were acquired by averaging 24 scans for each sample. Baseline correction was applied automatically to all spectra in the OPUS software.

2.2. Microplastic Materials

Five pristine MPP materials, which were provided by the Centre de Recherche sur les Matériaux Avancés, CERMA (Laval University, Quebec City, QC, Canada), of an irregular shape were evaluated as follows: polypropylene (PP), polyvinyl chloride (PVC), polyamide 6 (PA6), low-density polyethylene (LDPE), and high-density polyethylene (HDPE). Table 1 summarizes information on the weight-average diameter of the irregular-shape MPPs used in this study. Table 1 also provides the contact angle of the MPPs as reported in our previous work [43] and the corresponding average molecular weights.
Particles within a diameter ranging from 1 μm to 5000 μm are classified as microplastic particles [2,3,9]. Therefore, the MPPs used in this work fall inside the micro-size particle classification.
MPPs were also subjected to Fourier Transform Infrared (FTIR) spectrometry using the analytical equipment previously described in Section 2.1.

2.3. Binding Environment

The binding environments used during the batch adsorption experiments were type 2 deionized water (DWT2) and synthetically produced water (SPW) from an oil recovery operation. The latter was used as a proxy for industrial wastewater. The objective was to establish the effect of binding environment on the adsorption behavior of microplastic particles on cattail fluff. An Arium® Advanced EDI Bench-Top Unit (Sartorius Corporation, Bohemia, NY, USA) was employed to produce DWT2 with an electrical conductivity of 0.07 μS/cm, an ionic strength of 1.12 × 10⁻⁶ mol/L, and a pH of 5.62. The SPW was prepared following standard procedures for solution preparation. Therefore, the accurate masses of salts and light crude oil were obtained and added to the pre-established volume of DWT2. The amount of crude oil (e.g., condensate) added was 105 mg/L. The light crude oil was provided by Contact Exploration Inc. Stoney Creek, Sussex, NB, Canada. The SPW has an electrical conductivity of 34,120 μS/cm, which was determined using a FiveGo™ Conductivity Meter F3 (Mettler Toledo, Fisher Scientific, Hampton, NH, USA), an ionic strength of 54.8 mol/L, and a pH of 6.38. Table 2 presents the composition of the synthetically produced water.

2.4. Adsorption Experiments

2.4.1. Experimental Procedure

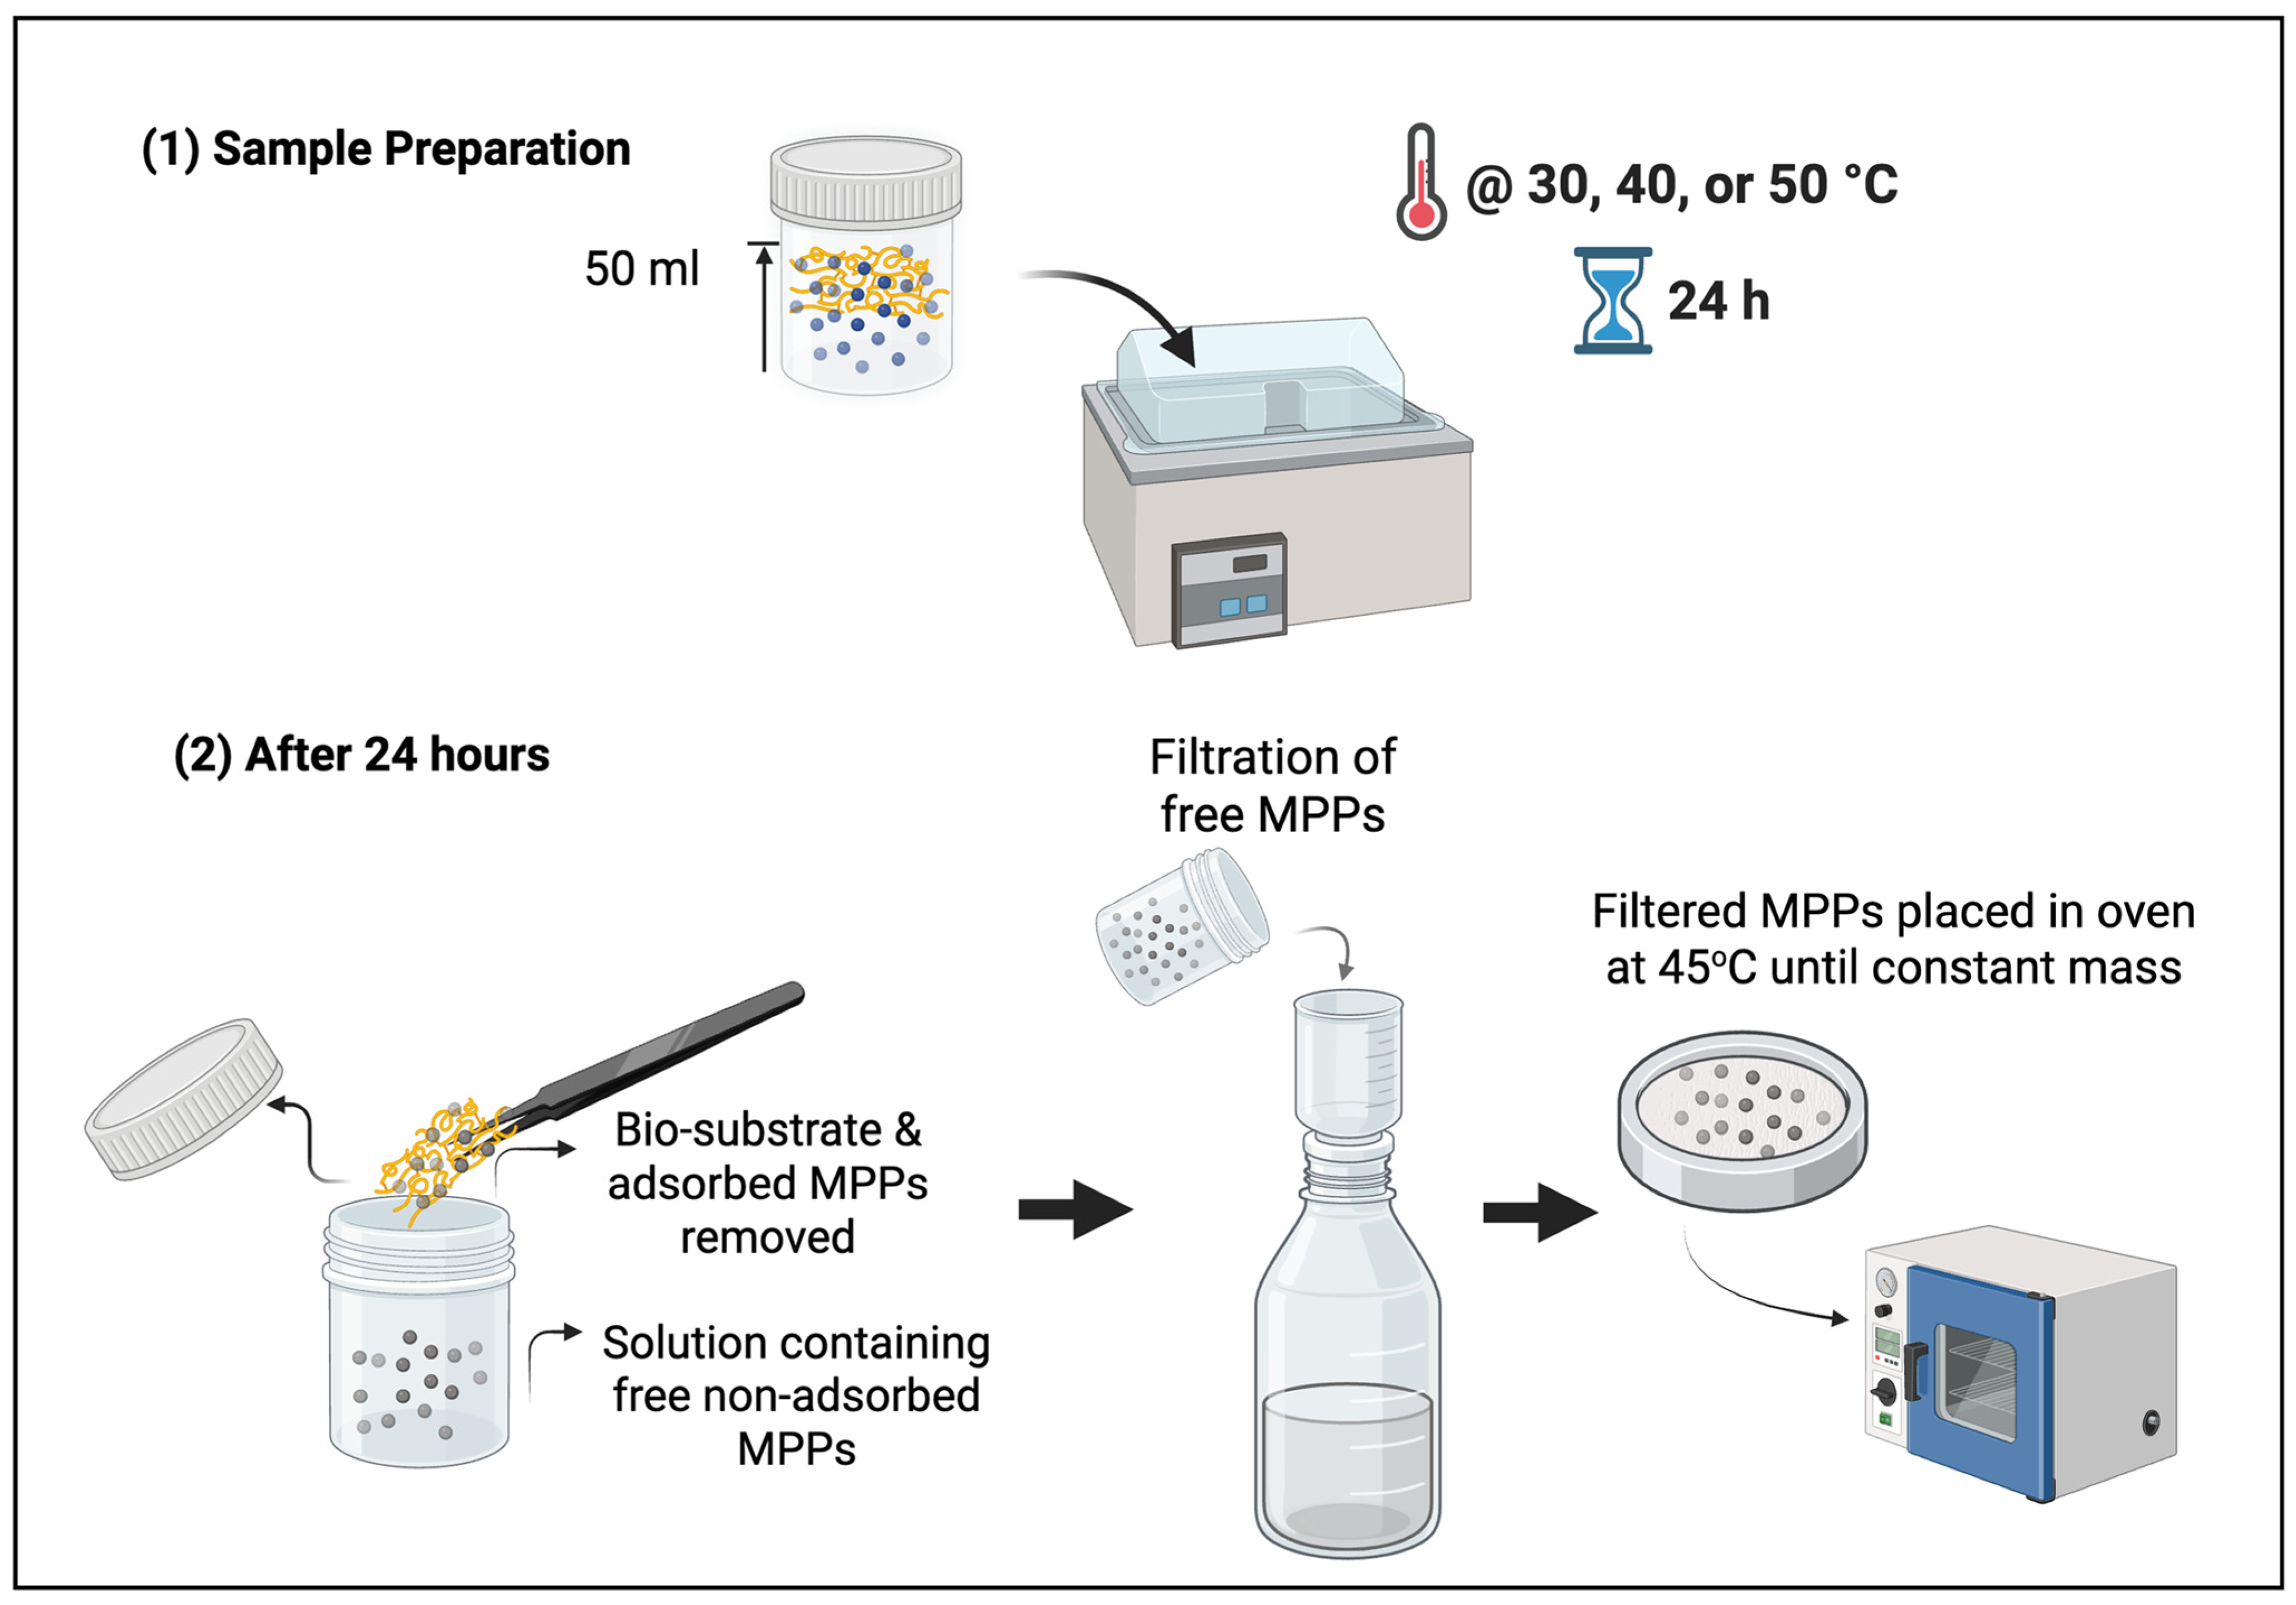
A fixed amount of bio-substrate (cattail fluff) of 100 mg was placed in a clear, round wide-mouth plastic jar. Afterwards, the pre-established mass of microplastic particles (MPPs) was added to the jar. Next, the bottle was filled to a total volume of 50 mL with the corresponding binding environment (DWT2 or SPW). Finally, the jar was securely closed with the cap. Teflon tape was applied to the tread of the bottle before placing the cap to avoid the leakage of the aqueous solution. Subsequently, the prepared jar was thoroughly mixed to maximize the contact of the bio-substrate with the MPPs before being placed in a water bath at the corresponding temperature of the experimental run (30 °C, 40 °C, or 50 °C) for a period of 24 h. Once the adsorption time of 24 h was achieved, the bottle was opened and the buoyant bio-substrate containing the adsorbed MPPs was carefully removed using a tweezer. The remaining solution was subjected to filtration under a vacuum using Fisherbrand® (Thermo Fisher Scientific, Waltham, MA, USA) filter paper P8 (porosity: coarse; pore size: a range from 20 to 25 μm; flow rate: fast, at 160 mL/min) manufactured by Fisher Scientific (Hampton, NH, USA). The filter paper was pre-weighted and dried before use. After filtration, the filter paper containing the free (non-adsorbed) residual MPPs was placed in an oven at 45 °C. The mass of the filter paper with the retained free MPPs was continuously monitored until a constant mass was obtained. Later, the concentration of free MPPs (Ce or the equilibrium concentration) was calculated. The median of the standard error of the calculated Ce was ±63.09 mg/L. Figure 1 shows a simplified schematic of the experimental procedure.

2.4.2. Experimental Matrix

In this study, the concentration of MPPs in aqueous solution ranged from 1000 mg/L to 10,000 mg/L, with increments of 1000 mg/L for a total of 10 solution concentrations. The mass of adsorbent (bio-substrate) was kept fixed at 100 mg. Two binding environments were evaluated: DWT2 and SPW. The adsorption performance of 5 polymers, PP, PVC, PA6, LDPE, HDPE, and their blend or M5Poly (equal mass), was determined. Batch adsorption tests were conducted at three temperatures, 30 °C, 40 °C, and 50 °C, for a period of 24 h until equilibrium was reached. The batch adsorption tests were carried out in triplicate. Table 3 summarizes the experimental matrix applied in this work.

2.4.3. Adsorption Isotherm Models

The relationship between the adsorbent and adsorbate under equilibrium conditions was established by performing non-linear regression fitting on the experimental adsorption data using seven adsorption isotherm models: Langmuir, Freundlich, a modified Temkin, modified Dubinin–Radushkevich (D–R), Redlich–Peterson (R–P), Toth, and Sips. Table 4 reports on the non-linear equations of these models and the corresponding relevant information.

2.4.4. Statistical Analysis

Non-linear regression was applied to fit the experimental data to the adsorption isotherm models selected (Table 4). PolymathPlus Pro, Web Server Version: 7.0.56, was used to compute the non-linear regression models.
The statistical interpretation of the best fit of the adsorption isotherm models to the experimental data was conducted by applying a 95% confidence interval and performing error function analysis including the coefficient of determination (R2), the adjusted coefficient of determination (Adj R2), the root mean square deviation error (RMSD), the mean square residual (MSE), and a non-linear chi-square test (X2). The modified Thompsom τ technique was used to reject questionable experimental data points [48].
Table 4. Adsorption isotherm models: non-linear equations and relevant information.
Langmuir adsorption isotherm model
q e = q m a x K L C e 1 + K L C e
where qe is the mass of solute uptake per unit mass of adsorbent at equilibrium [mg/g], Ce is the equilibrium concentration of the solute [mg/L], qMax is the maximum adsorption capacity [mg/g], and KL is the Langmuir adsorption constant [L/mg].
Monolayer adsorption. Homogeneous adsorption surface (e.g., uniform adsorption sites), thus constant adsorption energy. No interaction between adsorbate molecules adsorbed on neighboring sites. No steric hindrance and lateral interaction between the adsorbed molecules. Reversible chemical reaction [18,19,21,22,25].
Freundlich adsorption isotherm model
q e = K f C e 1 n
where qe is the mass of solute uptake per unit mass of adsorbent at equilibrium [mg/g], Ce is the equilibrium concentration of the solute [mg/L], Kf is the Freundlich adsorption constant [L/mg], and n is the Freundlich exponent related to surface heterogeneity and adsorption intensity.
Applies to reversible non-ideal adsorption process, multilayer adsorption, physical adsorption process, heterogeneous adsorption systems(e.g., different surface energies) [18,19,22,25].
Complete Temkin adsorption isotherm model
q e = q T ln 1 + K T C e 1 + K 1 C e ,   q T = R T b T
where qe is the mass of solute uptake per unit mass of the adsorbent at equilibrium [mg/g], qT is the surface capacity for the adsorption/unit binding energy [(mg/g)/(J/mol)], bT is heat of adsorption [J/mol], Ce is the equilibrium concentration of the solute [mg/L], KT is the Temkin adsorption constant [L/mg], K1 is the equilibrium binding constant [L/mg], R is the universal gas constant [J/mol·K], and T is the temperature [K].
Applies to uniform distribution of heterogeneous binding sites on the adsorbant surface (e.g., the binding energy varies linearly over these different binding sites) and multilayer adsorption. This isotherm model accounts for the effect of adsorbate/adsorbate interactions on the adsorption process and the increase of surface coverage leads to a linear decrease in the heat of adsorption [18,19,21,22,25,49,50].
Dubinin–Radushkevich (D–R) adsorption isotherm model
q e = q m a x e β ε 2 , ε = R T ln 1 + C o C e ,           E = 1 2 β
where qe is the mass of solute uptake per unit mass of adsorbent at equilibrium [mg/g], qMax is the maximum sorption capacity [mg/g], β is a constant related to the adsorption energy [mol2/J2], ε is the adsorption potential [J/mol], R is the universal gas constant [J/mol·K], T is the absolute temperature [K], Co is the standard molar concentration of the solute [1 mol/L], Ce is the solute concentration at equilibrium [mol/L], and E is the mean free energy of adsorption [J/mol].
Applies to adsorption experimental data at different temperatures, heterogenous adsorption systems, multilayer adsorption, and well-suited for physical adsorption processes. The term E is defined as “the free energy change when 1 mol of adsorbate is transferred to the solid surface from infinity from the solution” [19]. Therefore, E is a measure of adsorption strength between the adsorbent and adsorbate [18,19,21,22,25,51].
Redlich–Peterson (R–P) adsorption isotherm model
q e = K R C e 1 + a R C e b R
where qe is the mass of solute uptake per unit mass of adsorbent at equilibrium [mg/g], Ce is the equilibrium concentration of the solute [mg/L], KR is the Redlich–Peterson adsorption constant [L/g], aR is an R–P constant [L/mg], and bR is an exponent that varies between 0 and 1 [dimensionless].
Applies to homogeneous and heterogeneous adsorption systems. This is an empirical hybrid model of the Langmuir and Freundlich adsorption isotherm models [18,19,21,22,25].
Toth adsorption isotherm model
q e = q m a x K T C e 1 +   K T C e n 1 n
where qe is the mass of adsorbate per unit mass of the adsorbent at equilibrium [mg/g], qMax is the maximum adsorption capacity [mg/g], Ce is the equilibrium concentration of the solute [mg/L], KT is the Toth adsorption constant [L/mg], and n is an empirical parameter [dimensionless].
Applies to heterogeneous adsorption systems. This isotherm model is based on quasi-gaussian energy distribution model [18,19,21,22,25].
Sips adsorption isotherm model
q e = q m a x K S C e 1 n 1 + K S C e 1 n
where qe is the adsorbate uptake per unit mass of the adsorbent at equilibrium [mg/g], qMax is the maximum adsorption capacity [mg/g], KS is the Sips adsorption constant [L/mg], Ce is the equilibrium concentration of the solute [mg/L], and n is the Sips isotherm exponent [dimensionless].
Applies to homogeneous and heterogeneous adsorption systems. This is a hybrid model that combines the Freundlich and Langmuir adsorption isotherms [18,19,21,22,25].

3. Results

3.1. Bio-Substrate: Cattail Fluff Analysis

3.1.1. Contact Angle

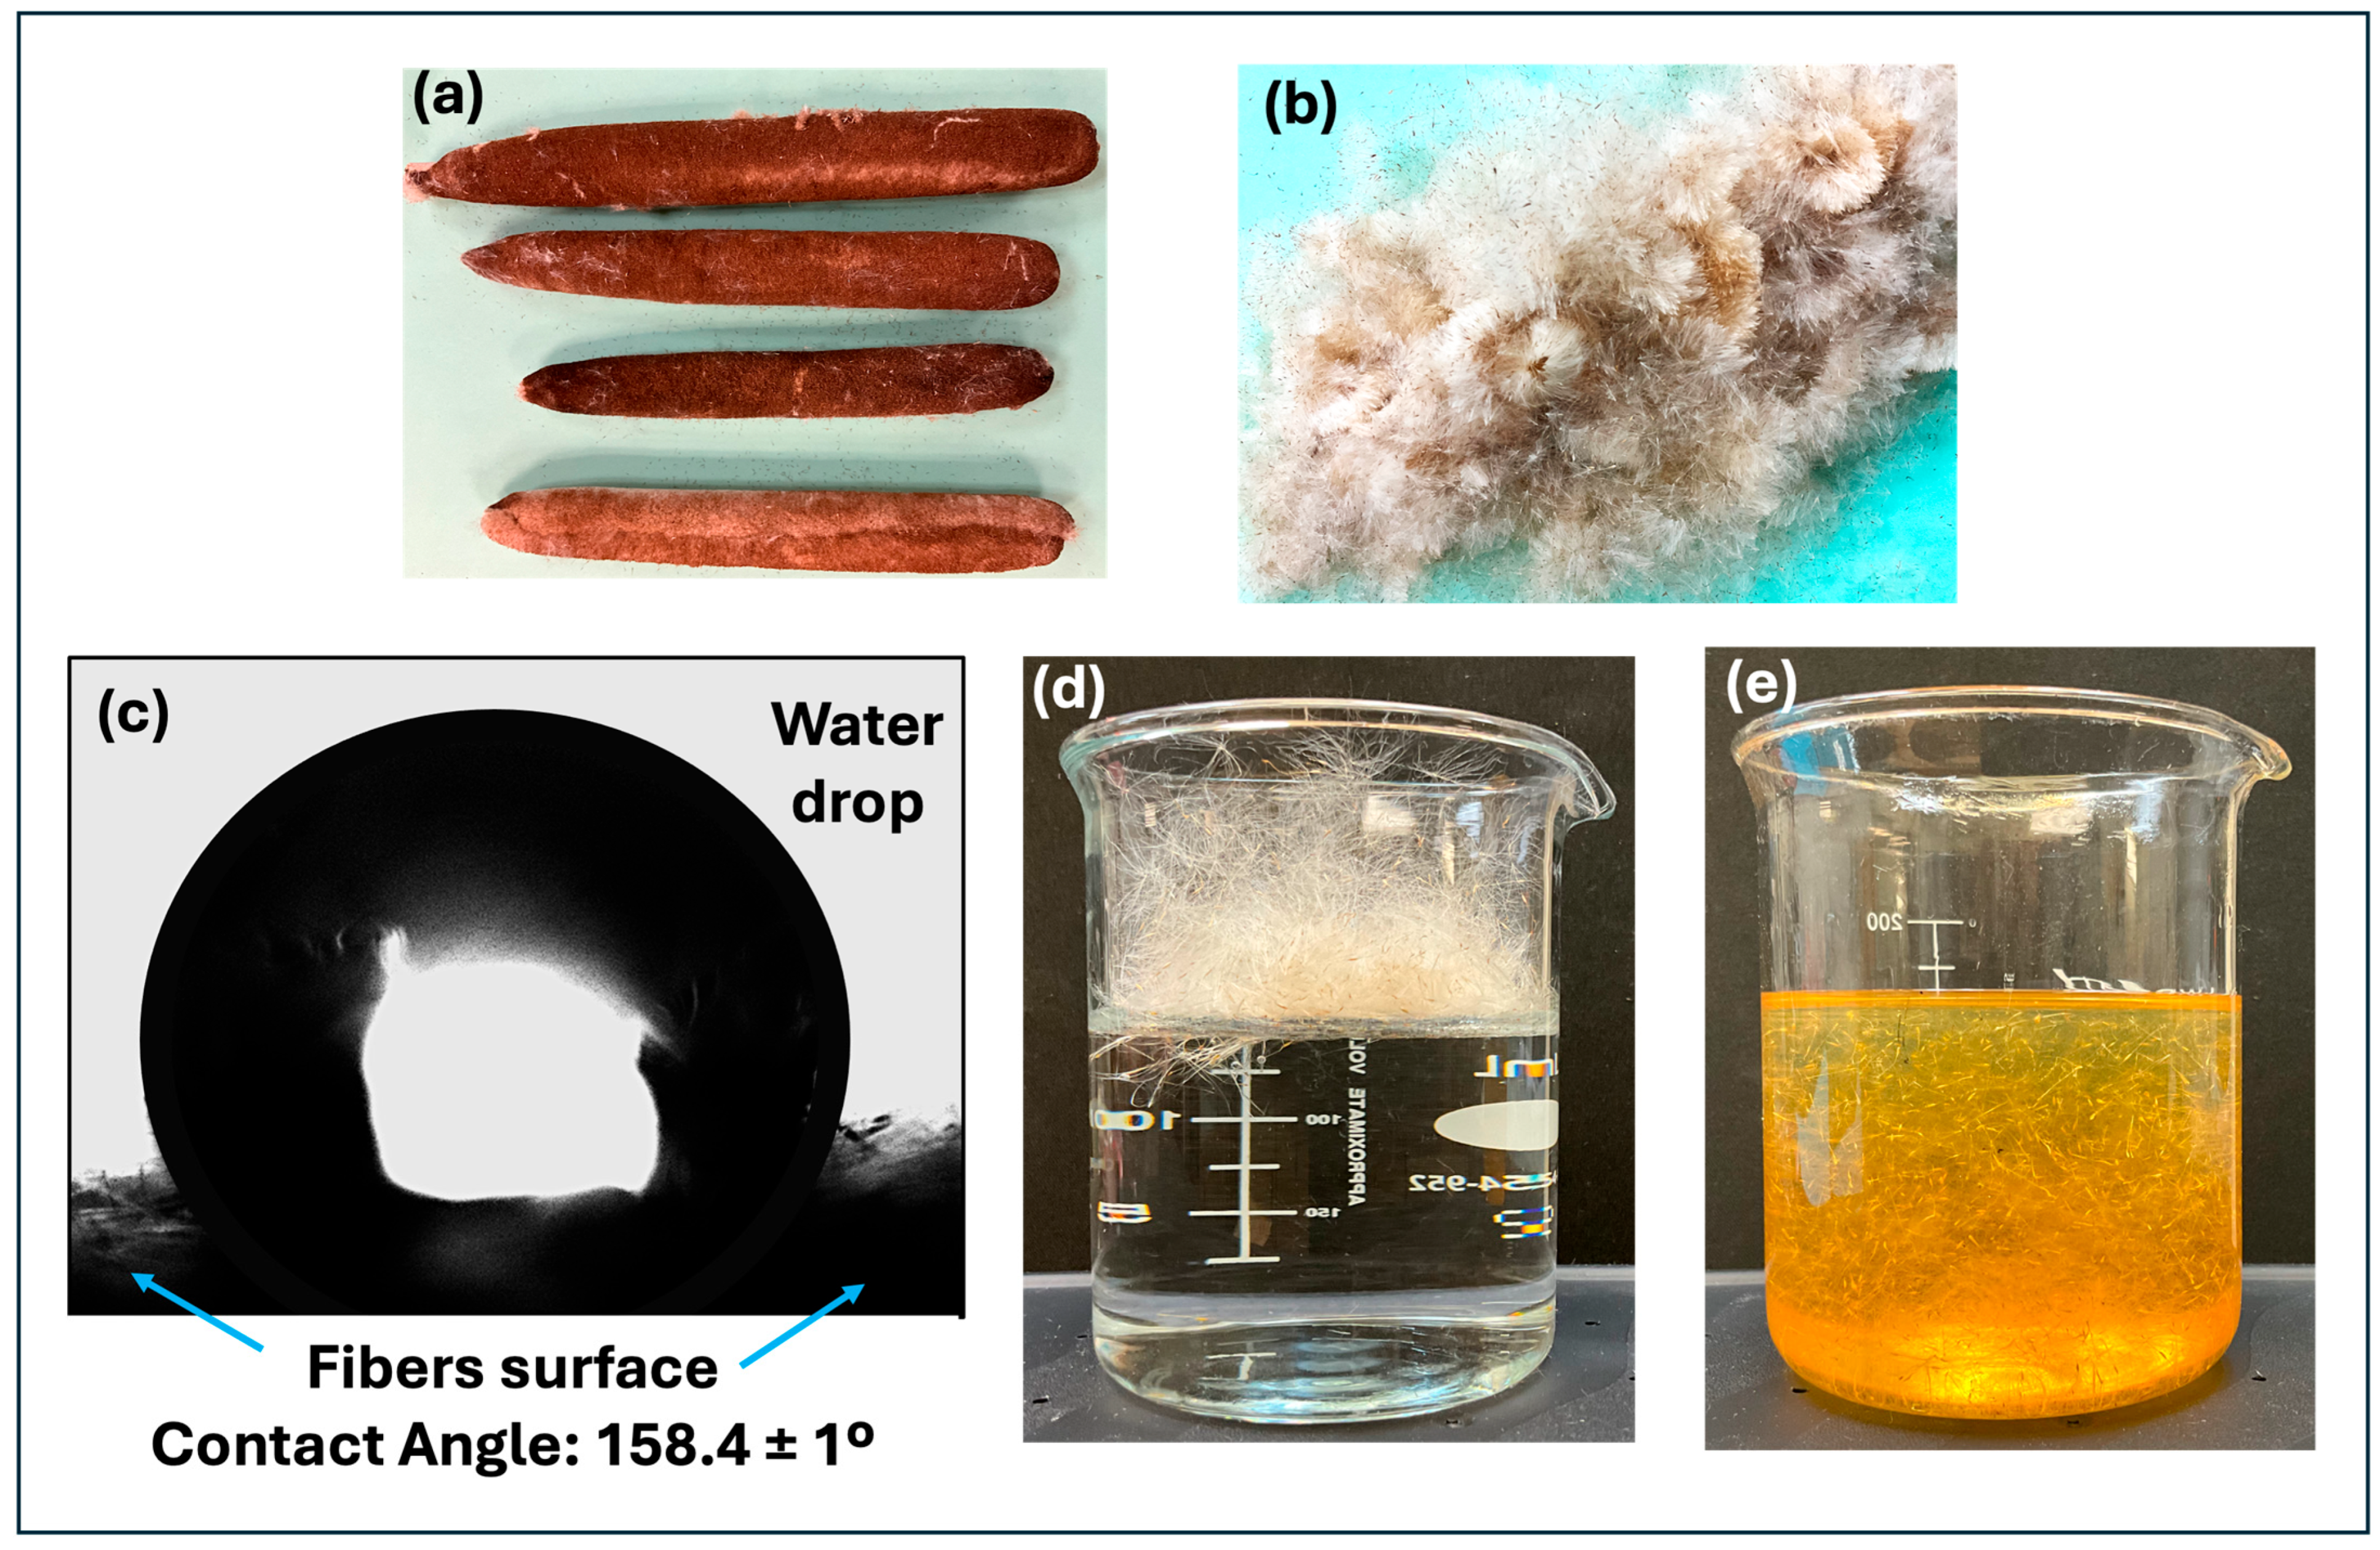
The average contact angle obtained from four samples of cattail fluff is 158.4 ± 1°. Materials with water contact angles above 150° are considered superhydrophobic [52]. Figure 2a–e display pictures of the mature cattail fruit and cattail fluff, a picture of a drop of water (e.g., DWT2) over the surface of fibers during contact angle measurement, a picture of the cattail fluff in contact with type 2 deionized water (e.g., DWT2), and a picture of cattail fluff in contact with a blend of kerosene and light crude oil (condensate), respectively. Figure 2d shows that the cattail fluff is not wetted by water; on the contrary, it functions as a water-repellent material. Figure 2e indicates that when the cattail fluff was put in contact with oil, the fluff was instantaneously submerged in the oil phase. The hydrophobicity of cattail fluff is caused by the presence of a wax coating on the surface of the fluff fibers, which has been previously reported [42,53]. As reported in [43], the surface area of the cattail fibers is 0.0097 ± 0.037 m2/g.

3.1.2. Thermogravimetric Analysis (TGA)

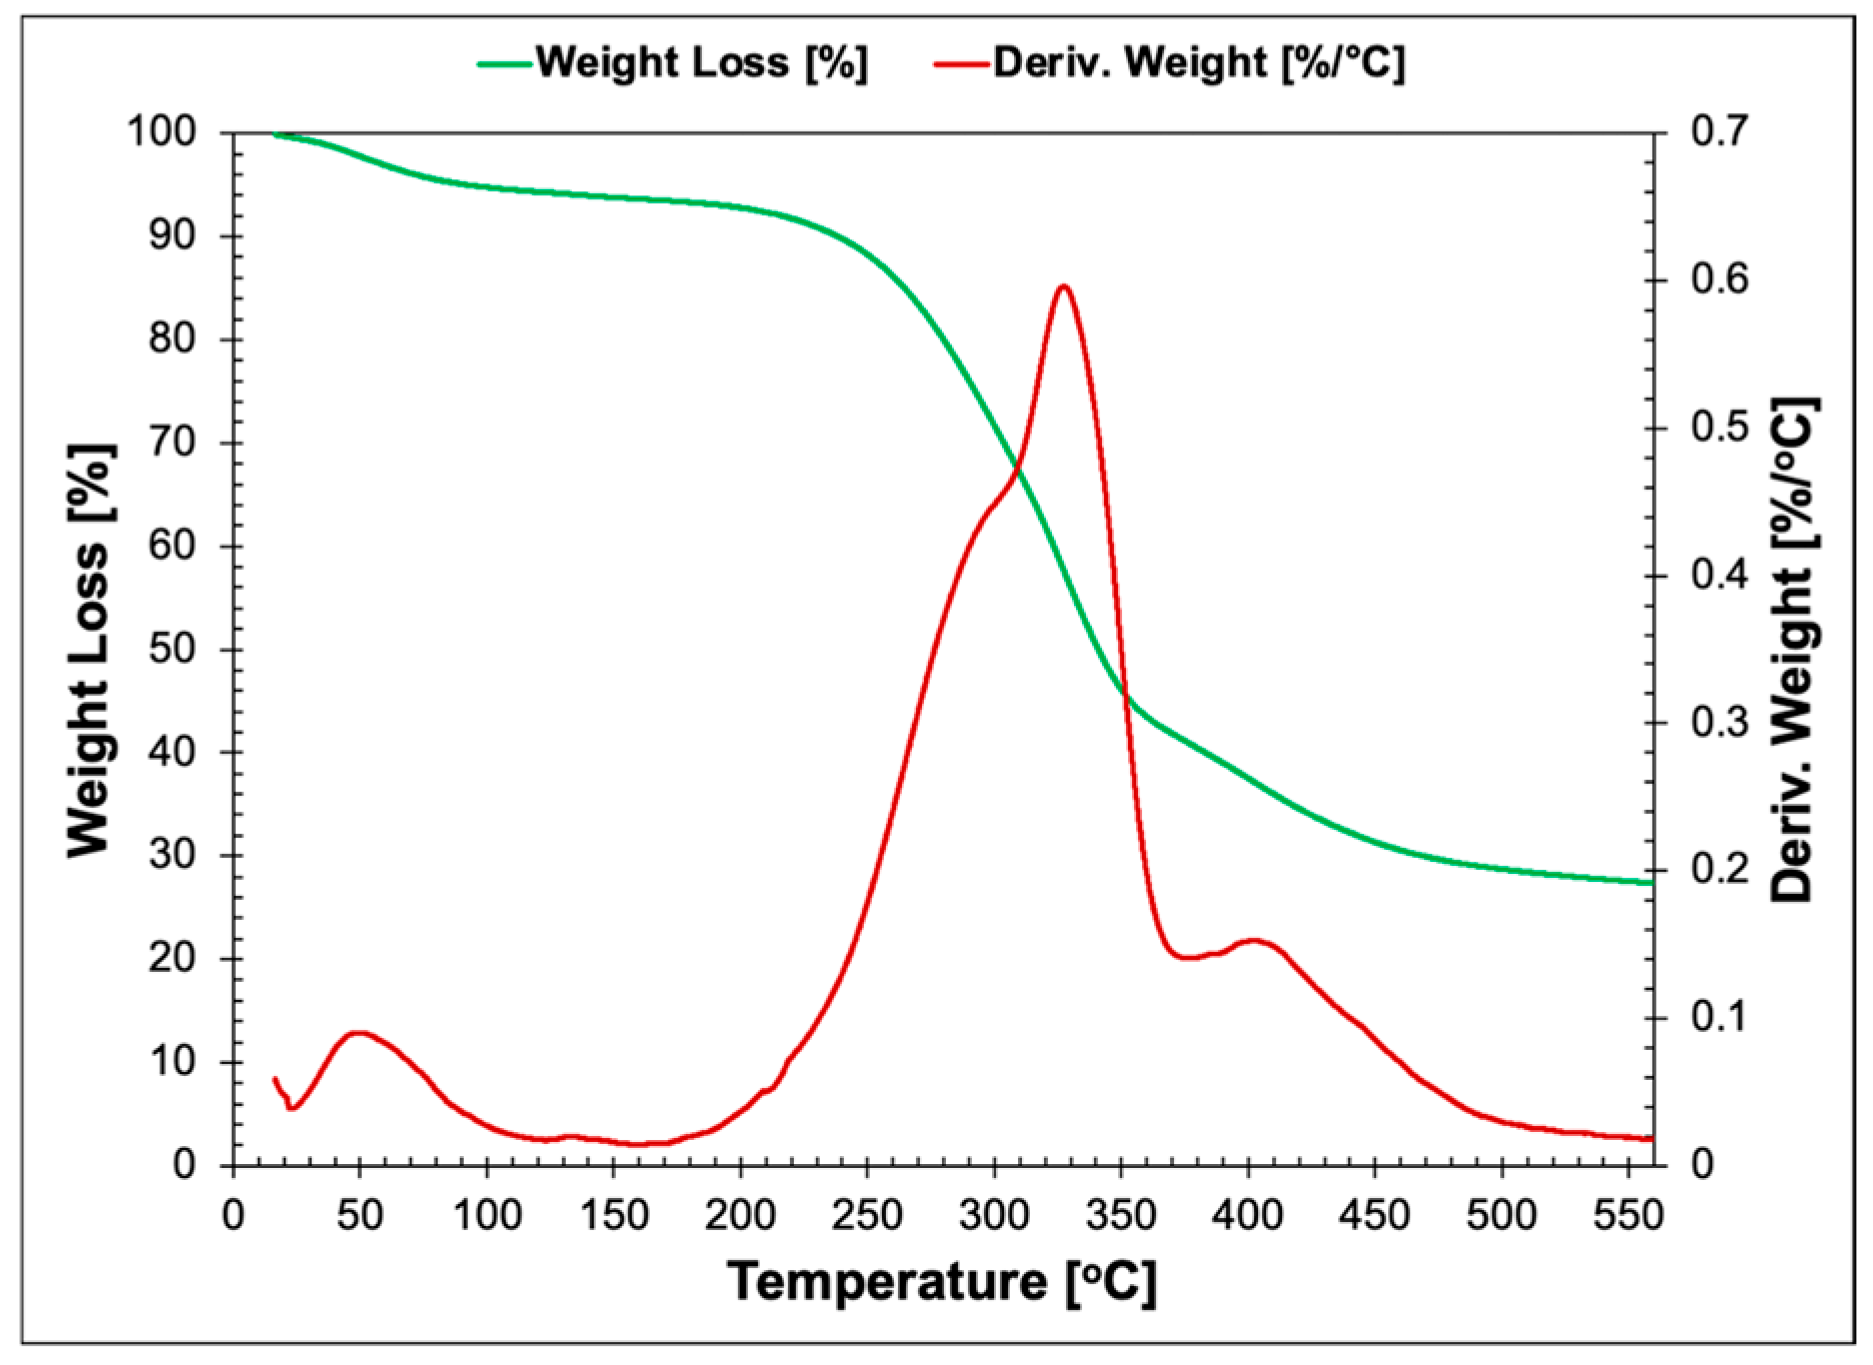
Figure 3 shows the thermal behavior of cattail fluff via the thermogravimetric (TG) curve and its derivative (DTG). The TG curve shows three distinct regions. The first region (16 to 200 °C) corresponds to the dehydration stage where unbound and bound water are removed from the fluff with a weight loss of 7.8%. The maximum rate of dehydration occurred around TMax 49 °C, as the DTG curve indicates. The second region (200 to 370 °C) corresponds to the main thermal decomposition of the bio-substrate with TOnset = 262 °C. The DTG curves indicate that the maximum rate of degradation occurs at TMax = 328 °C. The thermal degradation of hemicellulose and part of the cellulose takes place in this region with a total weight loss of 72%. It is also possible that the degradation of lignin is initiated in this region (around 350 °C). In this second region, the DTG curve shows a broad peak that could indicate the occurrence of overlapping decomposition reactions [54]. The third region (370 to 560 °C) represents a weight loss of 18%. The maximum degradation peak in this region occurs at TMax = 402 °C. In this region, the total decomposition of cellulose and lignin takes place. This thermal behavior coincides with previous reported TGA information on cattail fluff [54,55] and other natural fibers [56,57]. The thermogravimetric analysis suggests that the cattail fluff is thermally stable up to 262 °C; therefore, it is suitable for relatively high-temperature applications.

3.2. Microplastic Particle (MPP) FTIR Analysis

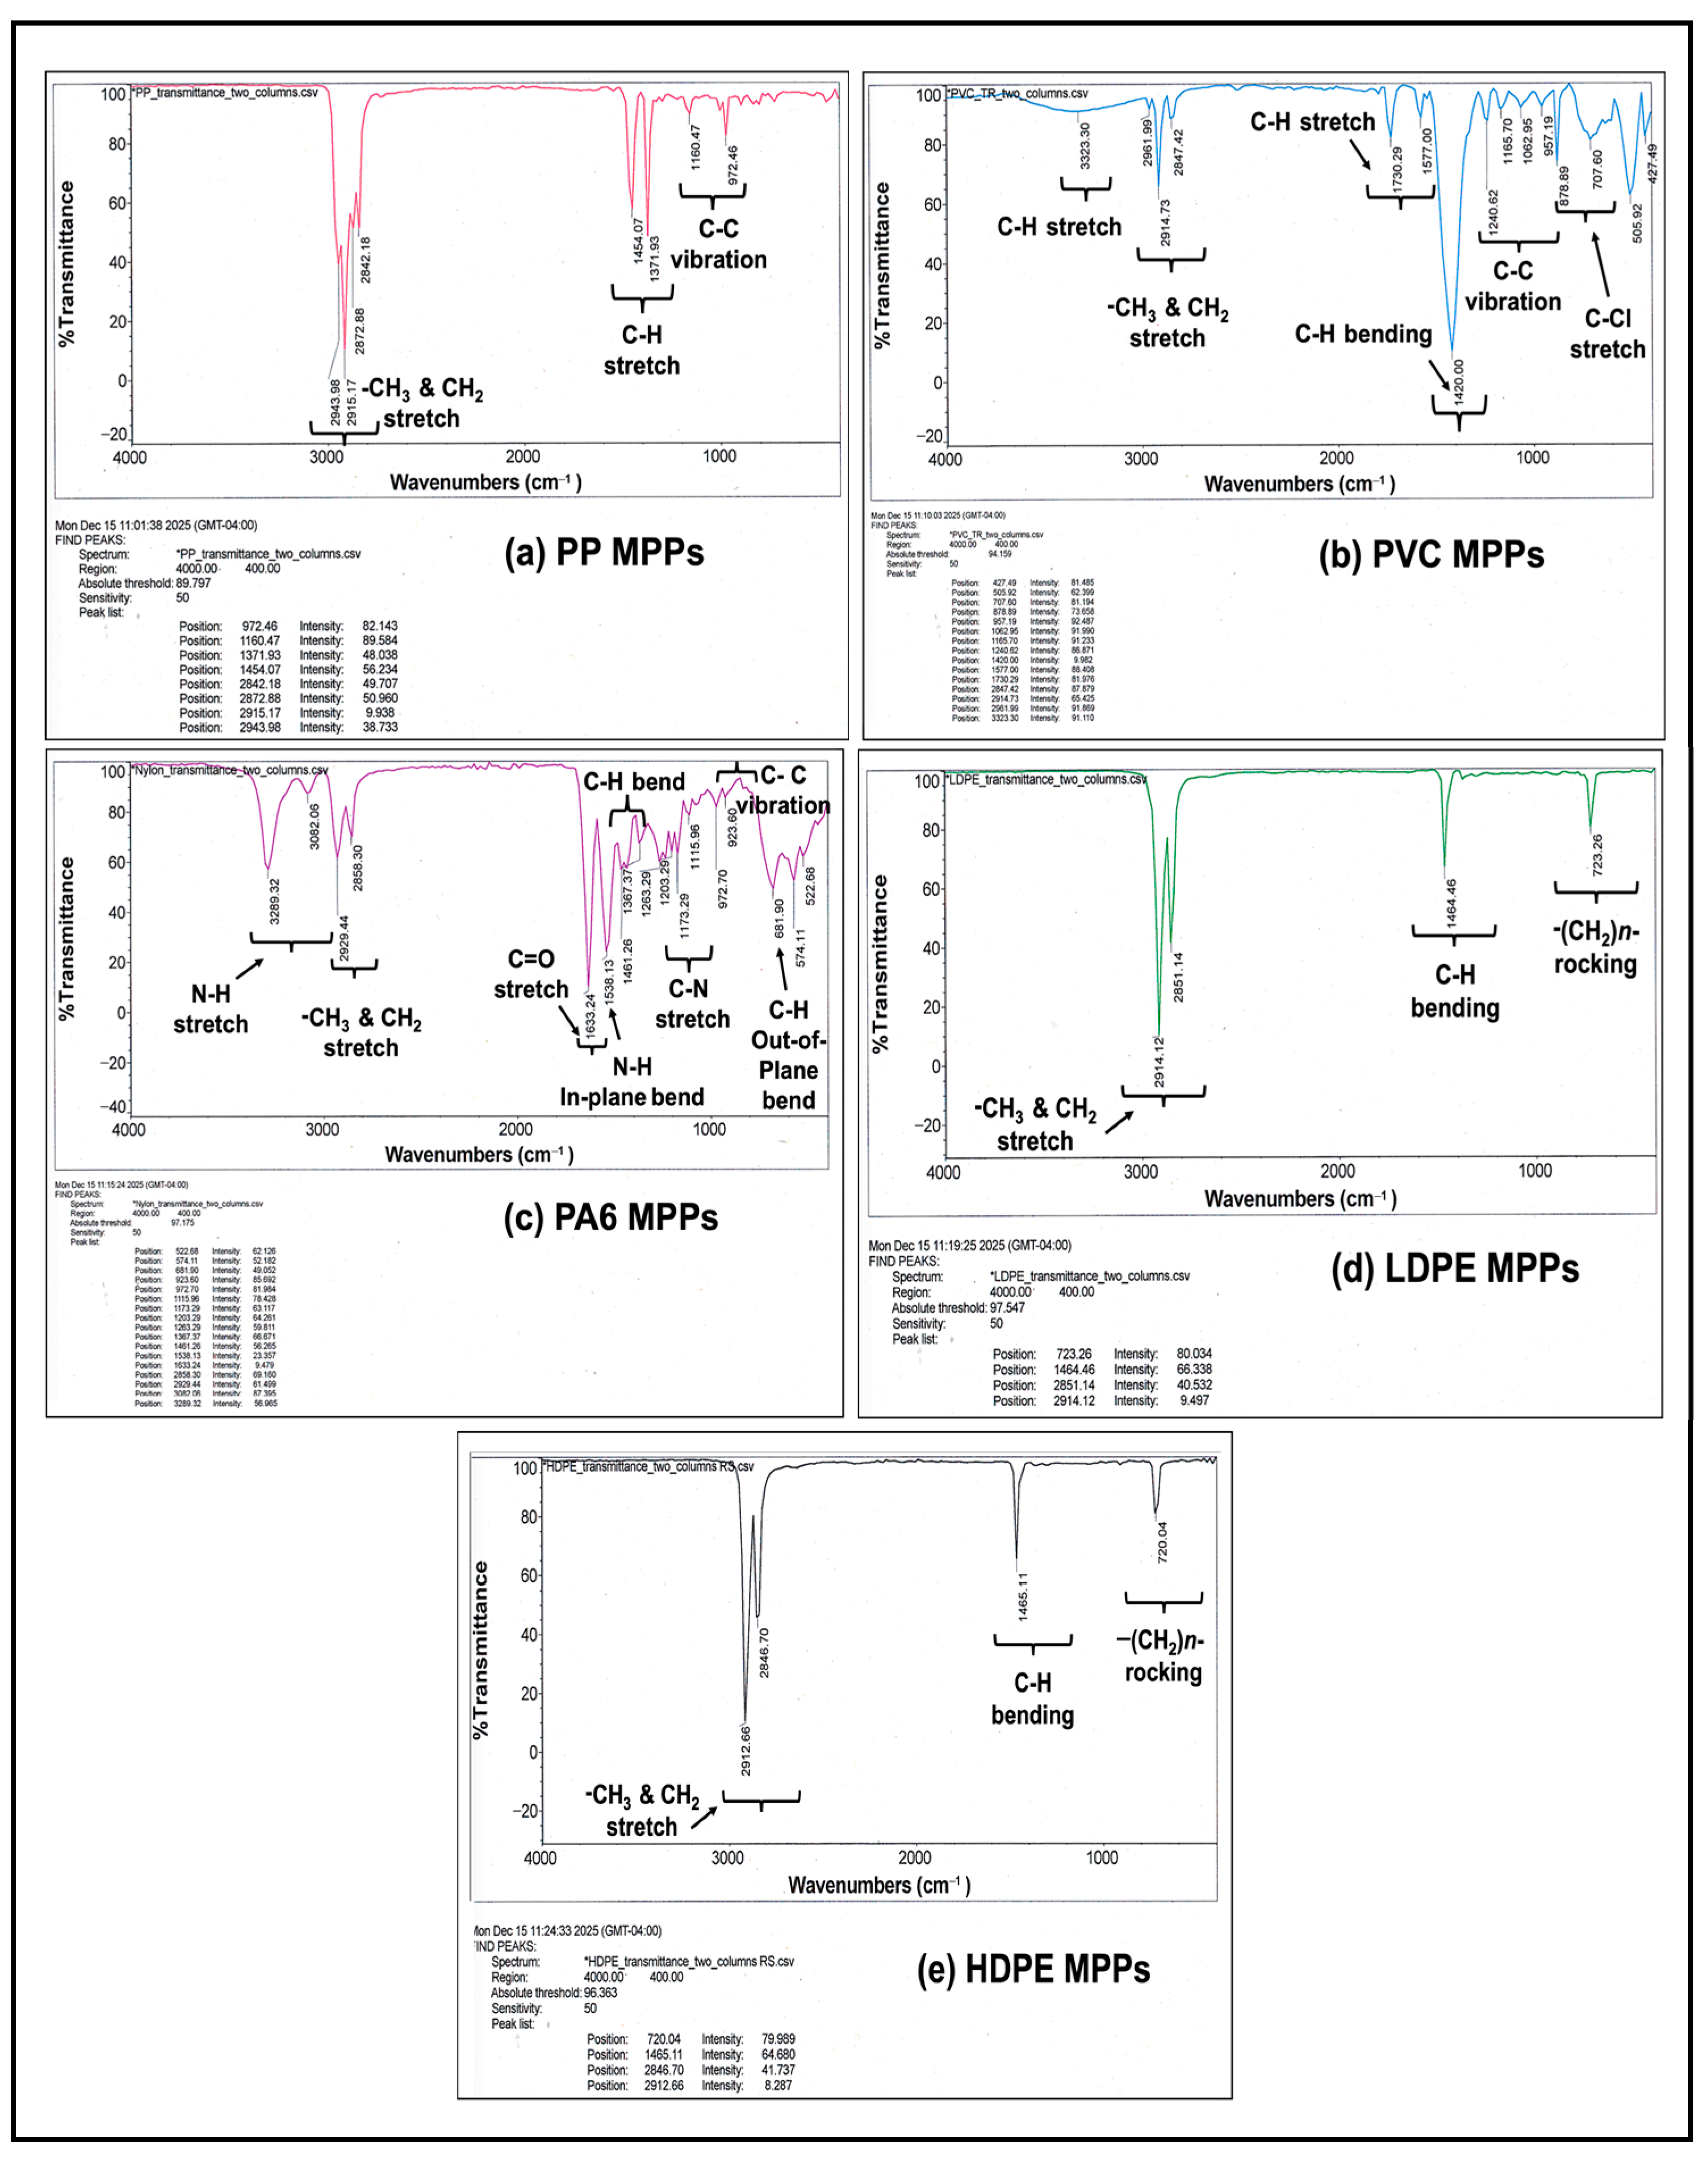
The microplastic particles were subjected to FTIR analysis to verify the composition of the plastic materials used in this work. Figure 4a–e present the FTIR spectrum of each of the microplastic materials with the corresponding peak’s locations and functional groups. The assignment of functional groups was guided from previous studies [58,59]. The FTIR analysis confirmed that the composition of the plastic materials agrees with those described in previous FTIR studies on the characterization of plastics [59,60,61,62].

3.3. Adsorption of Microplastic Particle (MPP)/Adsorption Isotherms

3.3.1. Polypropylene (PP) Adsorption Isotherms

Table 5 shows the values of the statistical parameters and the analysis of several error functions obtained from the non-linear regression of seven isotherm adsorption models to determine the model generating the best fit of the PP MPP adsorption experimental data obtained at three temperatures (30 °C, 40 °C, and 50 °C) and two binding environments (DWT2 and SPW). The non-linear regression analysis indicates that the Dubinin–Radushkevich (D–R) model offers the best fit of the experimental adsorption data for PP MPPs for all the experimental conditions. The D–R isotherm adsorption model allows for the description of adsorption experimental data at different temperatures on heterogeneous adsorbents, which might explain why this model provides the best fit of the adsorption experimental data [18,51]. Table 6 summarizes the D–R model adsorption parameters: the maximum adsorption capacity (qMax) calculated from the experimental adsorption data, the D–R constant (β) showing the corresponding 95% confidence index, and the calculated mean free energy of adsorption (E).
The results in Table 6 indicate that in DWT2, the adsorption (qMax) of PP MPPs onto the bio-substrate underwent a minor decrease as temperature increased. However, for the case in which SPW served as the binding environment, adsorption decreased as temperature increased. In the case of an insoluble solute in a solution adsorbing onto a solid phase, the mean free energy of adsorption (E) derived from the D–R model cannot be used to distinguish the type of adsorption (e.g., physisorption, ion exchange, or chemisorption) [19,25,63]. However, in the context of this study, E is useful for evaluating the relative strength of the adsorbate–adsorbent interaction. For PP MPPs, the E values in Table 6 indicate that the strength of the PP MPP–adsorbent interactions increased slightly as the temperature increased in both binding environments, which agrees with previous research on the effect of temperature on hydrophobic interactions [19].
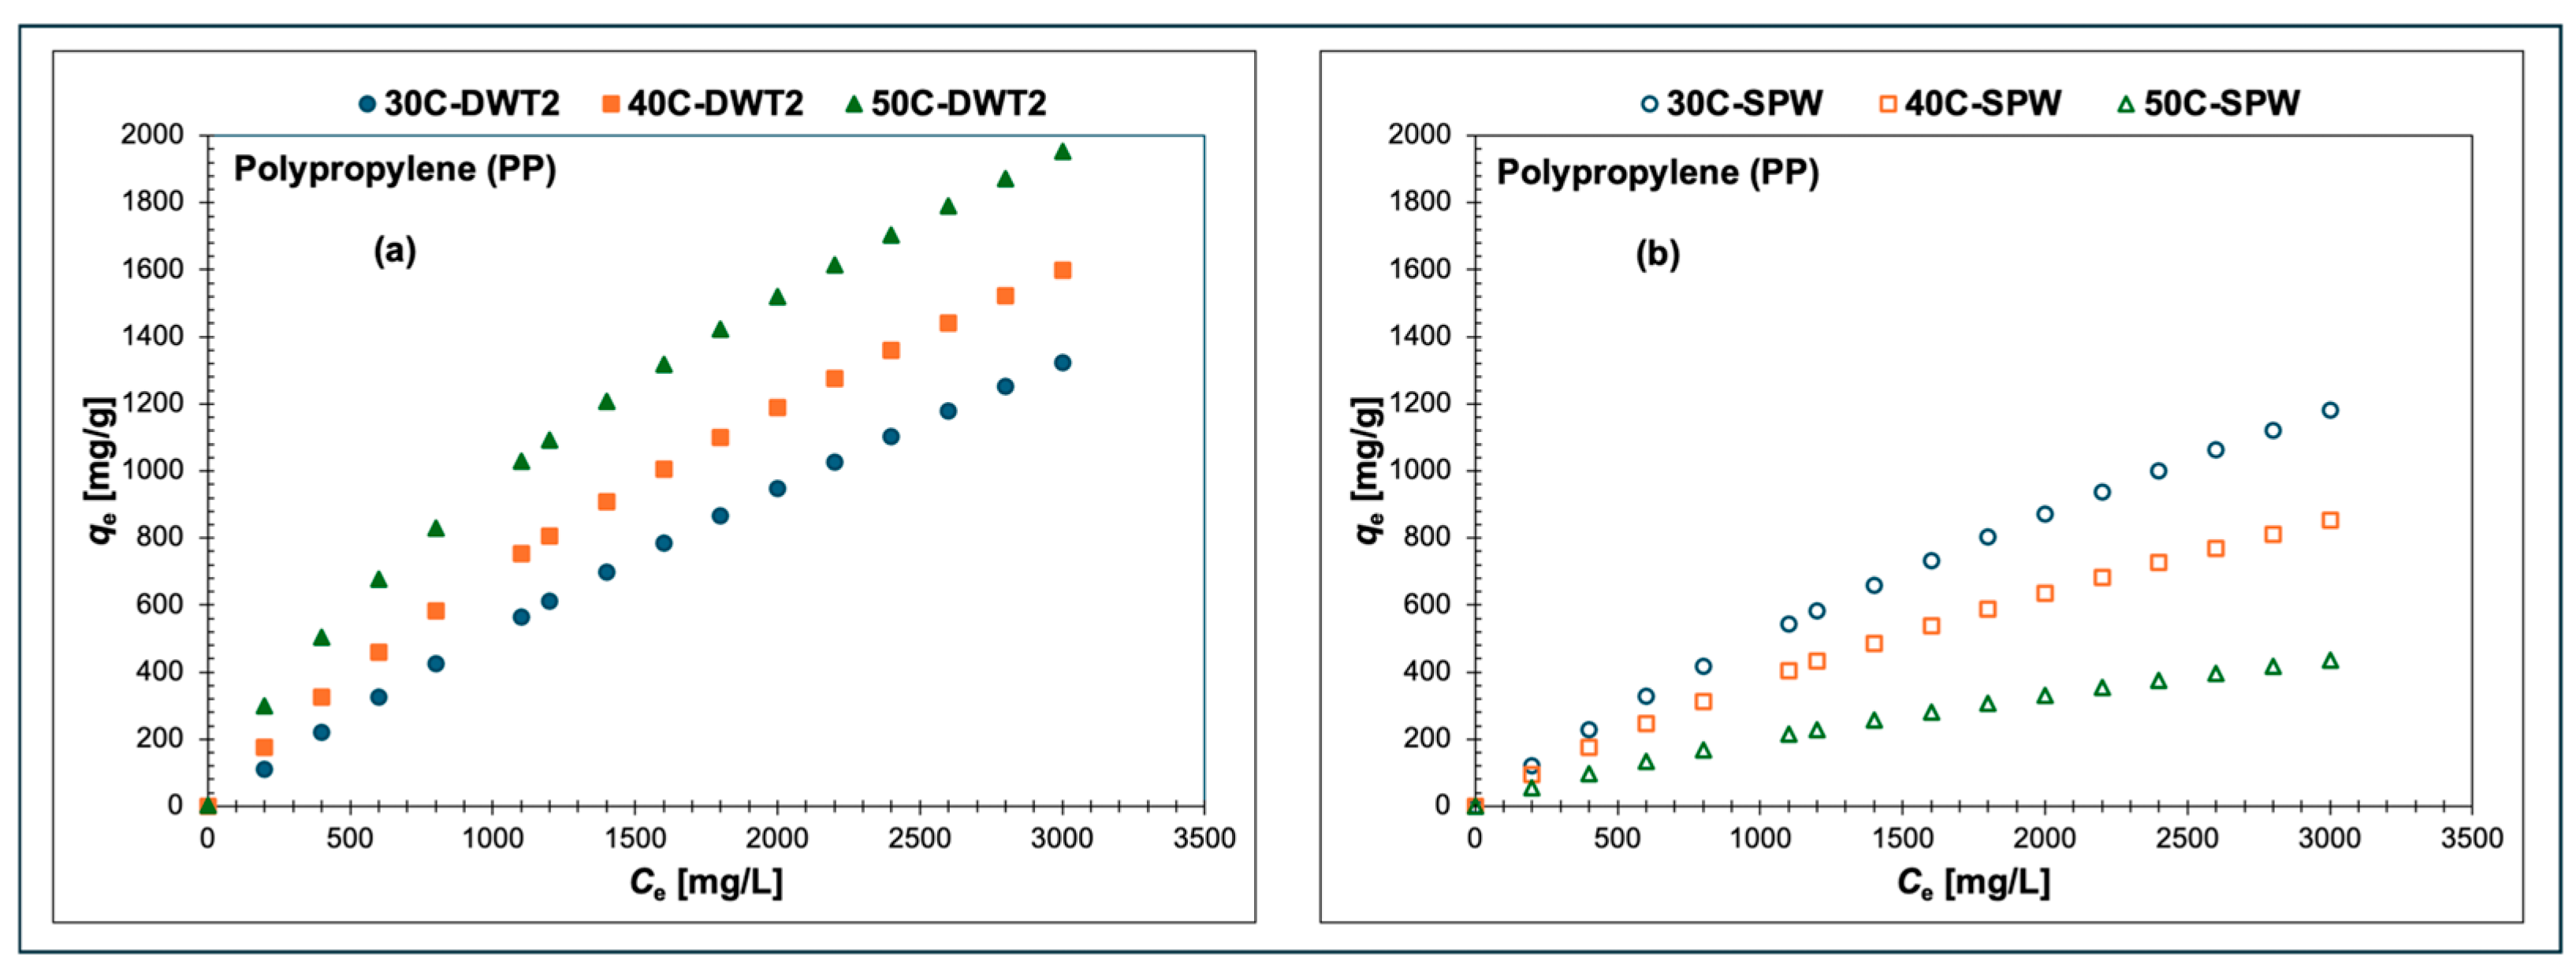
Effect of Temperature. Figure 5a,b display the effect of temperature on the adsorption capacity of the bio-substrate. Figure 5a,b present qe as a function of Ce and temperature for the corresponding binding environments (DWT2 and SPW).
The adsorption of PP MPPs on the bio-substrate is strongly affected by temperature. Figure 5a reveals the higher adsorption of PP MPPs at higher temperatures in DWT2. This trend reverses in the case of SPW (Figure 5b), in which adsorption decreases with temperature.
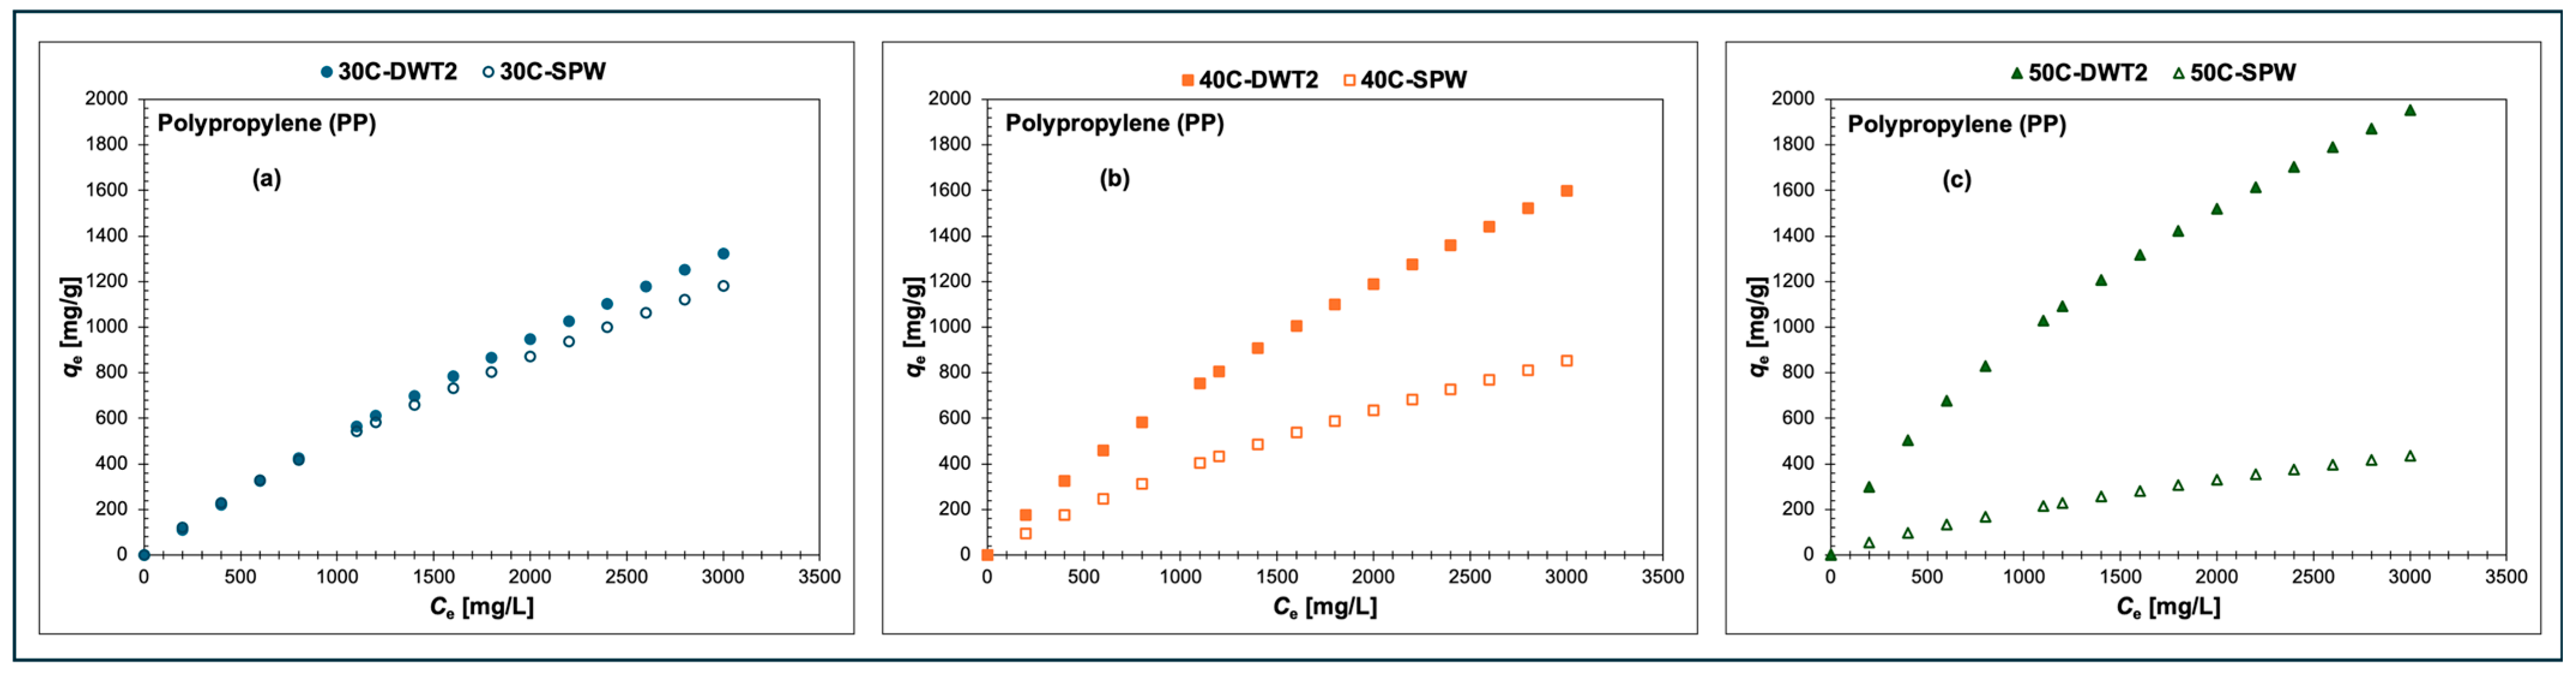
Effect of Binding Environment. Figure 6 implies that an overall higher adsorption of PP MPPs is observed in DWT2 as the binding environment.

3.3.2. Polyvinylchloride (PVC) Adsorption Isotherms

Table 7 reports the values of the statistical parameters and the analysis of error functions obtained from the non-linear regression of seven isotherm adsorption models (Table 4) at different experimental conditions. According to the error function analysis, the Dubinin–Radushkevich (D–R) model provides the best fit of the adsorption experimental data.
Table 8 summarizes the D–R model adsorption parameters. The maximum adsorption capacity (qMax) and the D–R constant (β) show the corresponding 95% confidence index. Column 4 in Table 8 displays the calculated mean free energy of adsorption (E).
Table 8 indicates that in DWT2, qmax increases as temperature increases, while the opposite occurs in SPW. The mean free energy of adsorption values, denoted by E, suggest that stronger adsorbate–adsorbent interactions take place in the SPW environment.
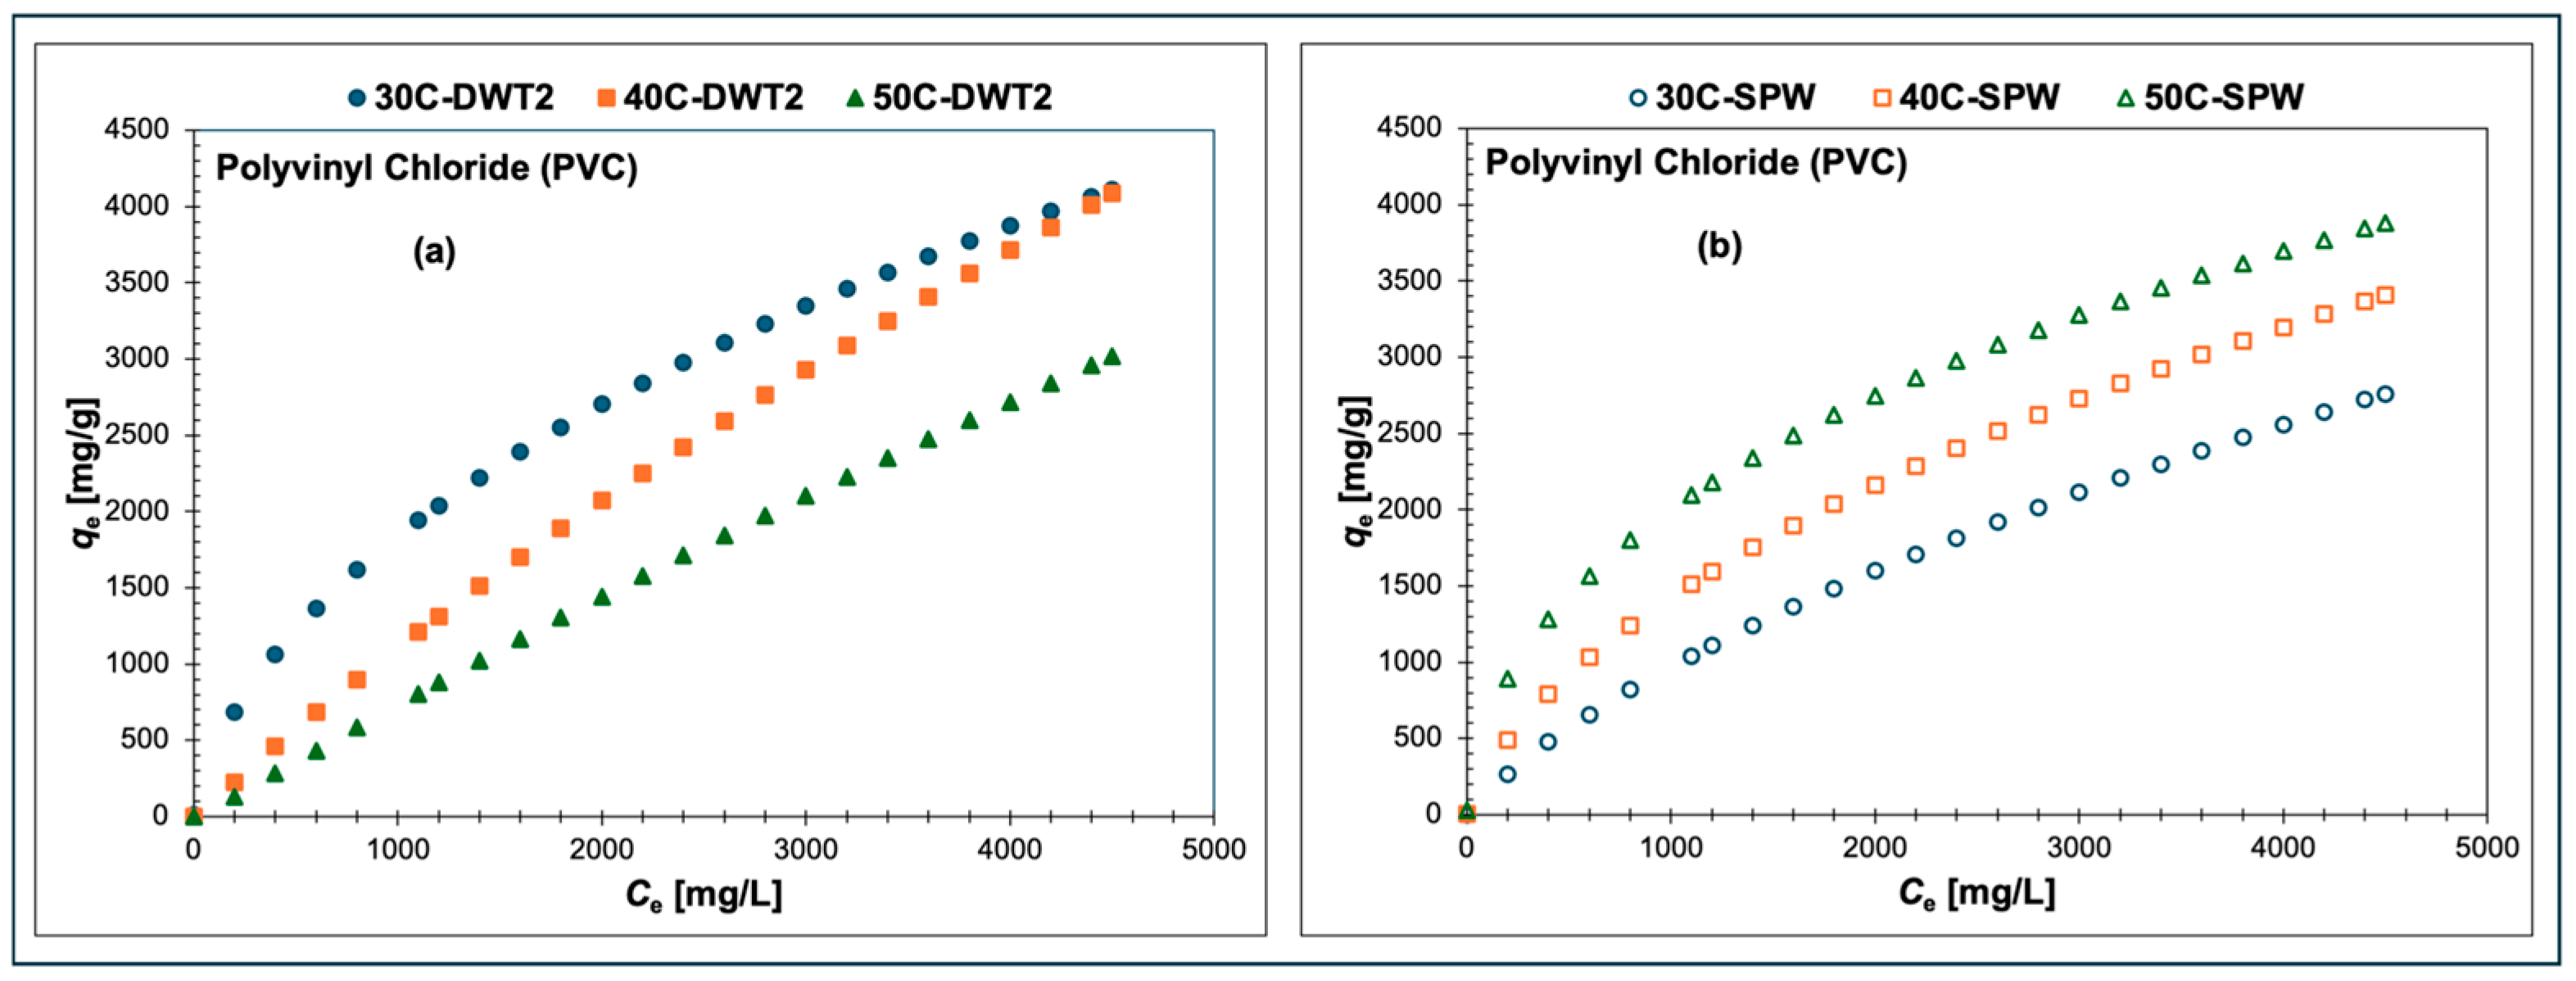
Effect of Temperature. The adsorption of PVC MPPs in DWT2 (Figure 7a) decreases as temperature increases. In the case of SPW (Figure 7b), adsorption increases as temperature increases, following a consistent trend.
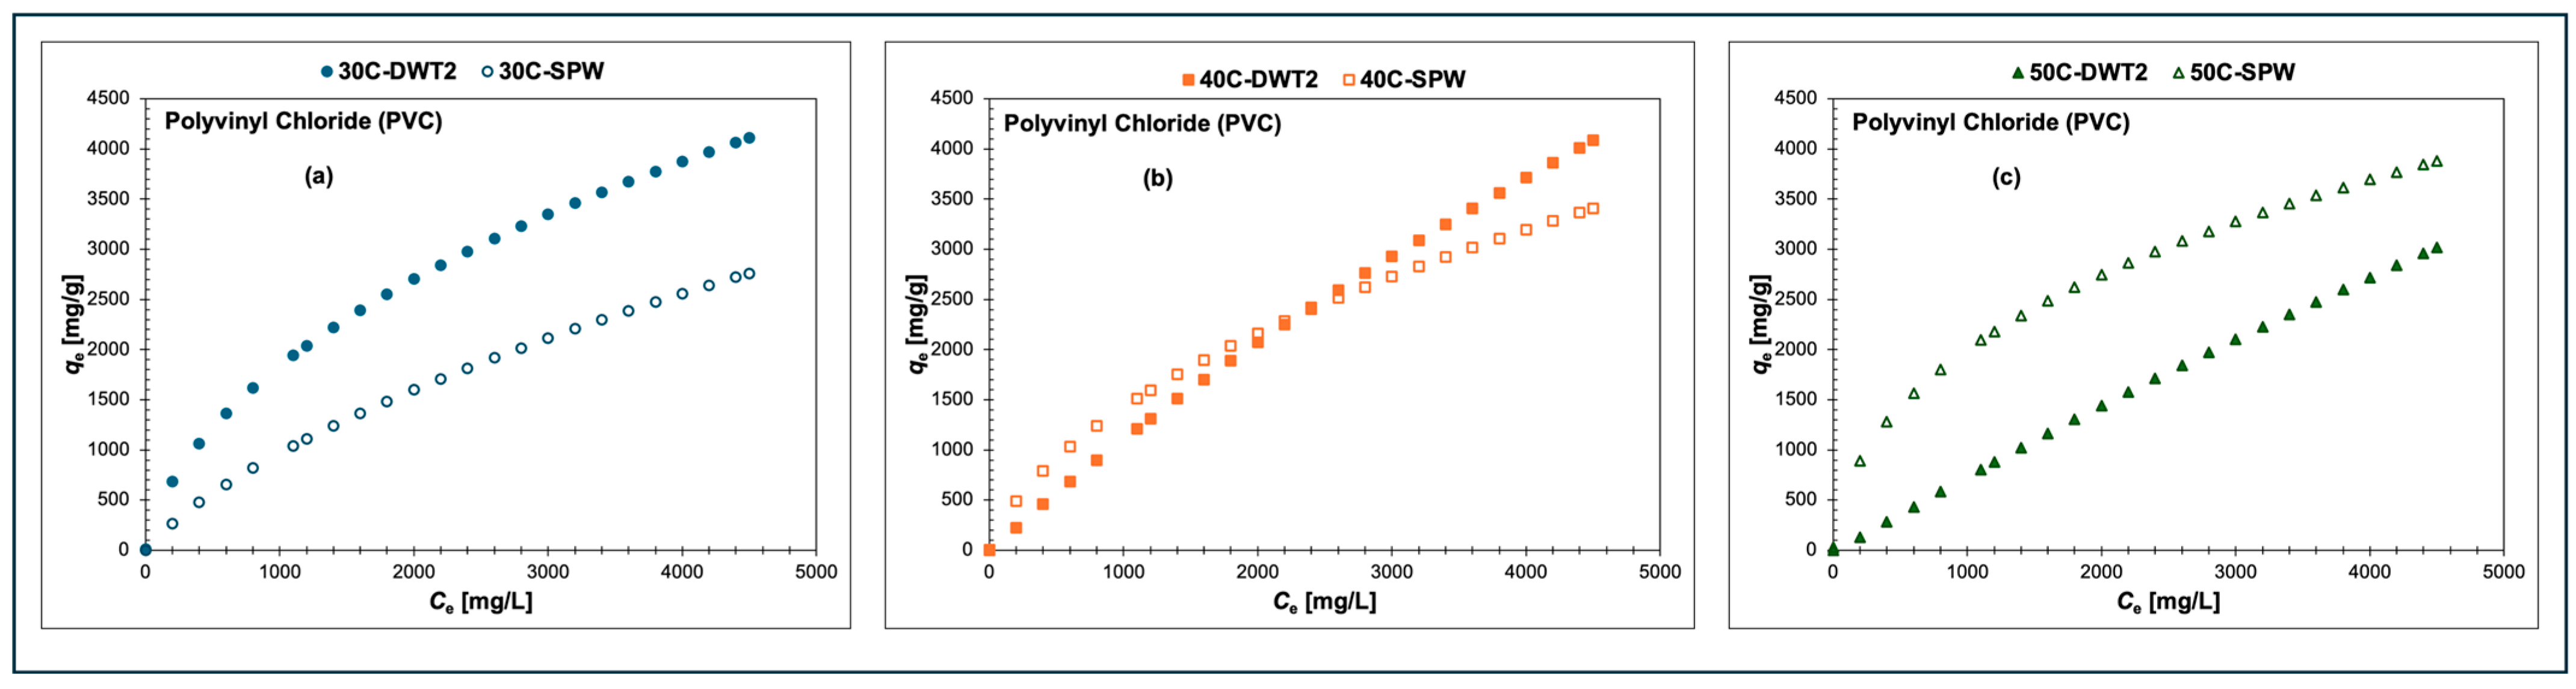
Effect of Binding Environment. Figure 8a displays the larger adsorption of PVC MPPs in DWT2 compared to the adsorption observed in SPW. Figure 8b shows overlapping adsorption behavior in both binding environments, while Figure 8c indicates greater adsorption of PVC MPPs in SPW. These experimental observations reveal the important role of the binding environment composition on the adsorption of PVC MPPs onto the bio-substrate.

3.3.3. PA6 Adsorption Isotherm

Table 9 shows the values of the statistical parameters and the analysis of several error functions obtained from the non-linear regression of seven isotherm adsorption models (Table 4) for the adsorption of PA6 MPPs at different experimental conditions. Table 9 indicates that the Dubinin–Radushkevich (D–R) model provides the best fit of the experimental adsorption data.
Table 10 summarizes the D–R model adsorption parameters: the maximum adsorption capacity (qMax) and the D–R constant (β) showing the corresponding 95% confidence index. Column 4 in Table 10 displays the calculated mean free energy of adsorption (E). Table 10 shows that qMax increases as temperature increases in both binding environments. The E values suggest stronger adsorbate–adsorbent interactions in SPW.
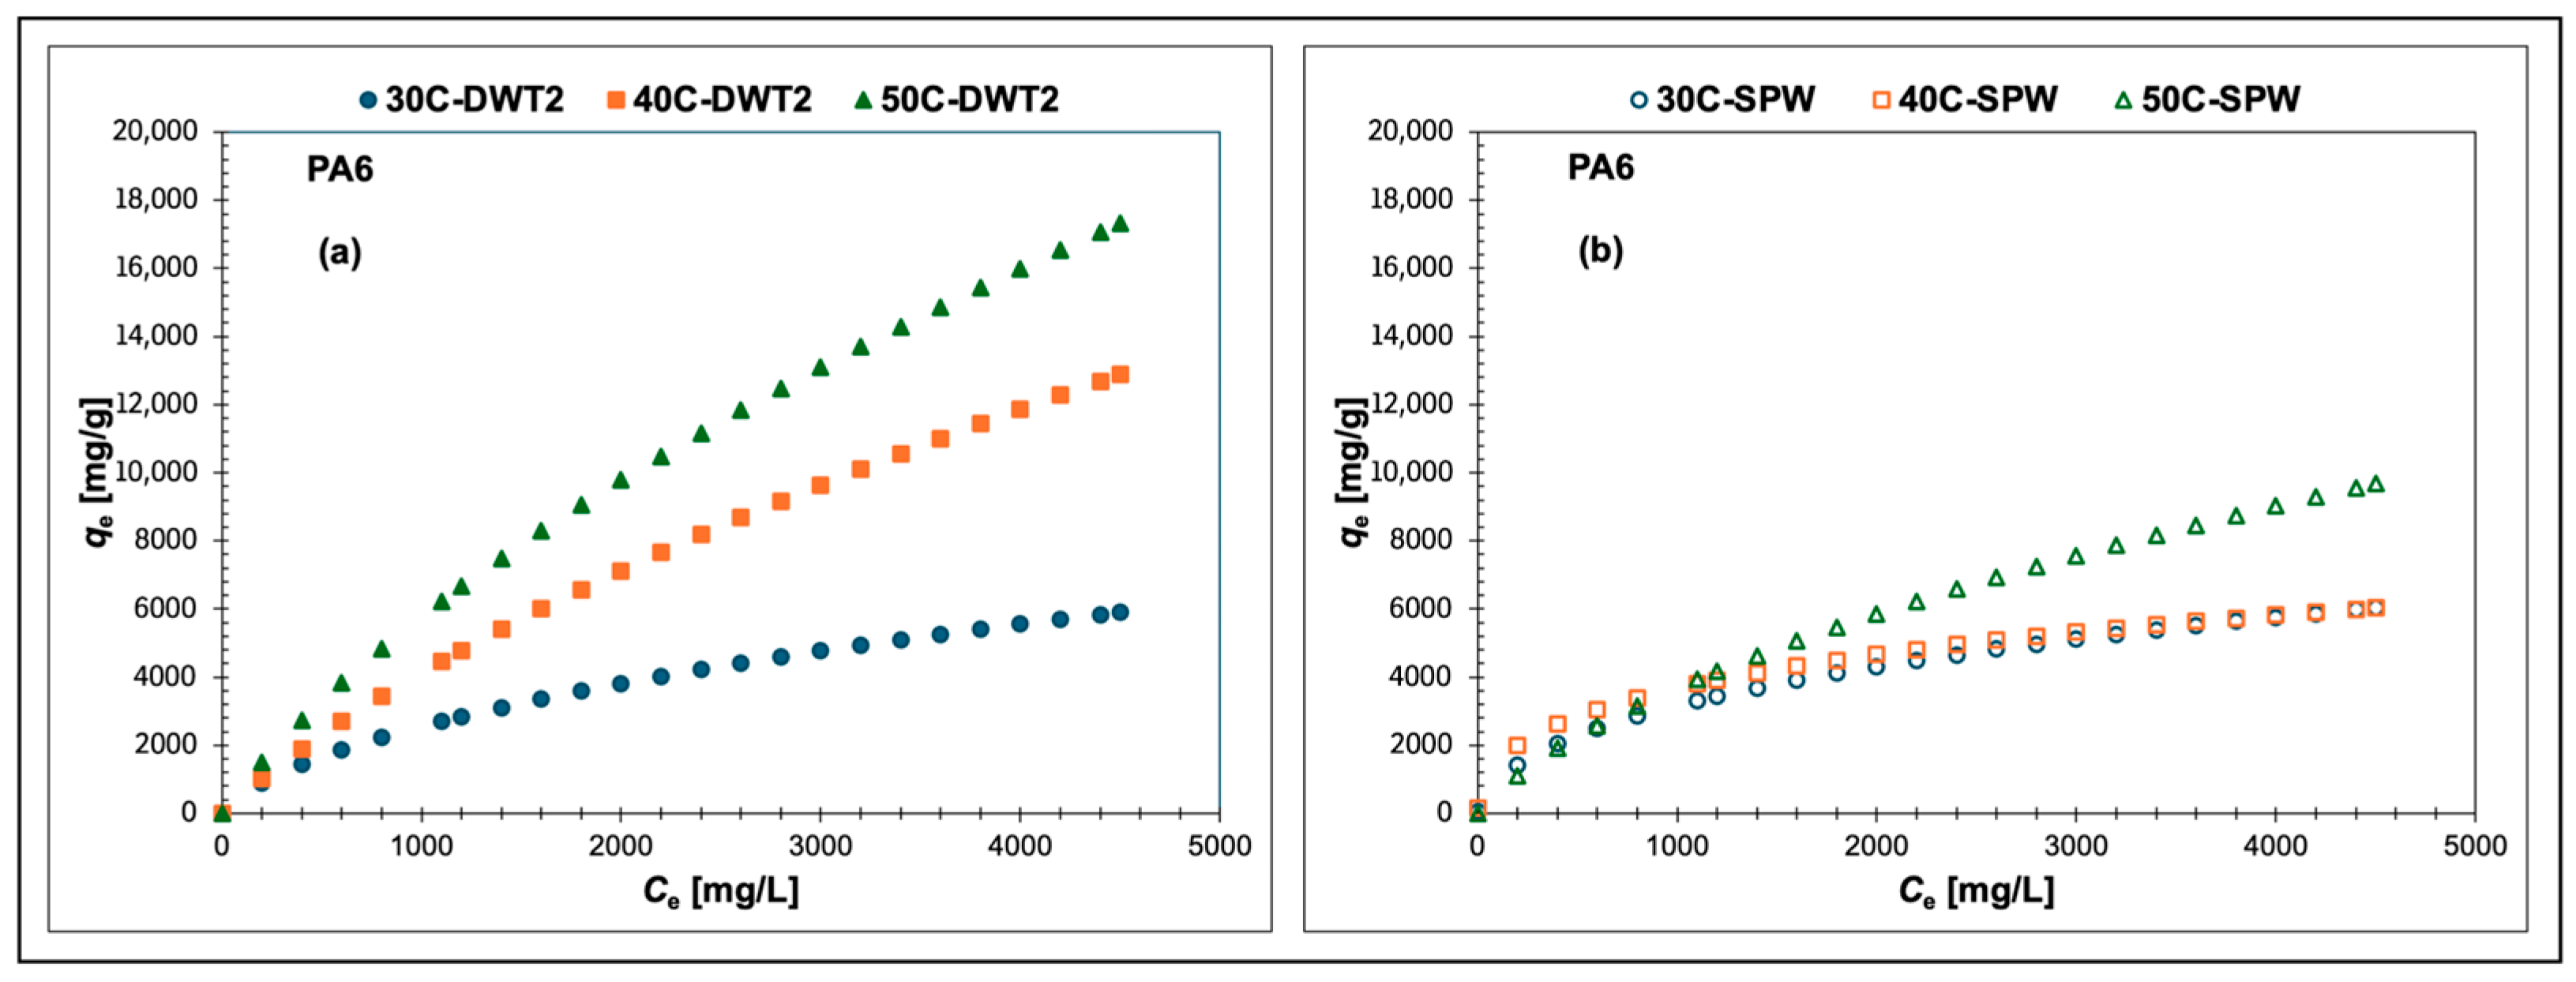
Effect of Temperature. Figure 9a,b demonstrate that the adsorption of PA6 MPPs increases as temperature increases in both binding environments. However, the effect of temperature on PA6 adsorption is prominent in DWT2.
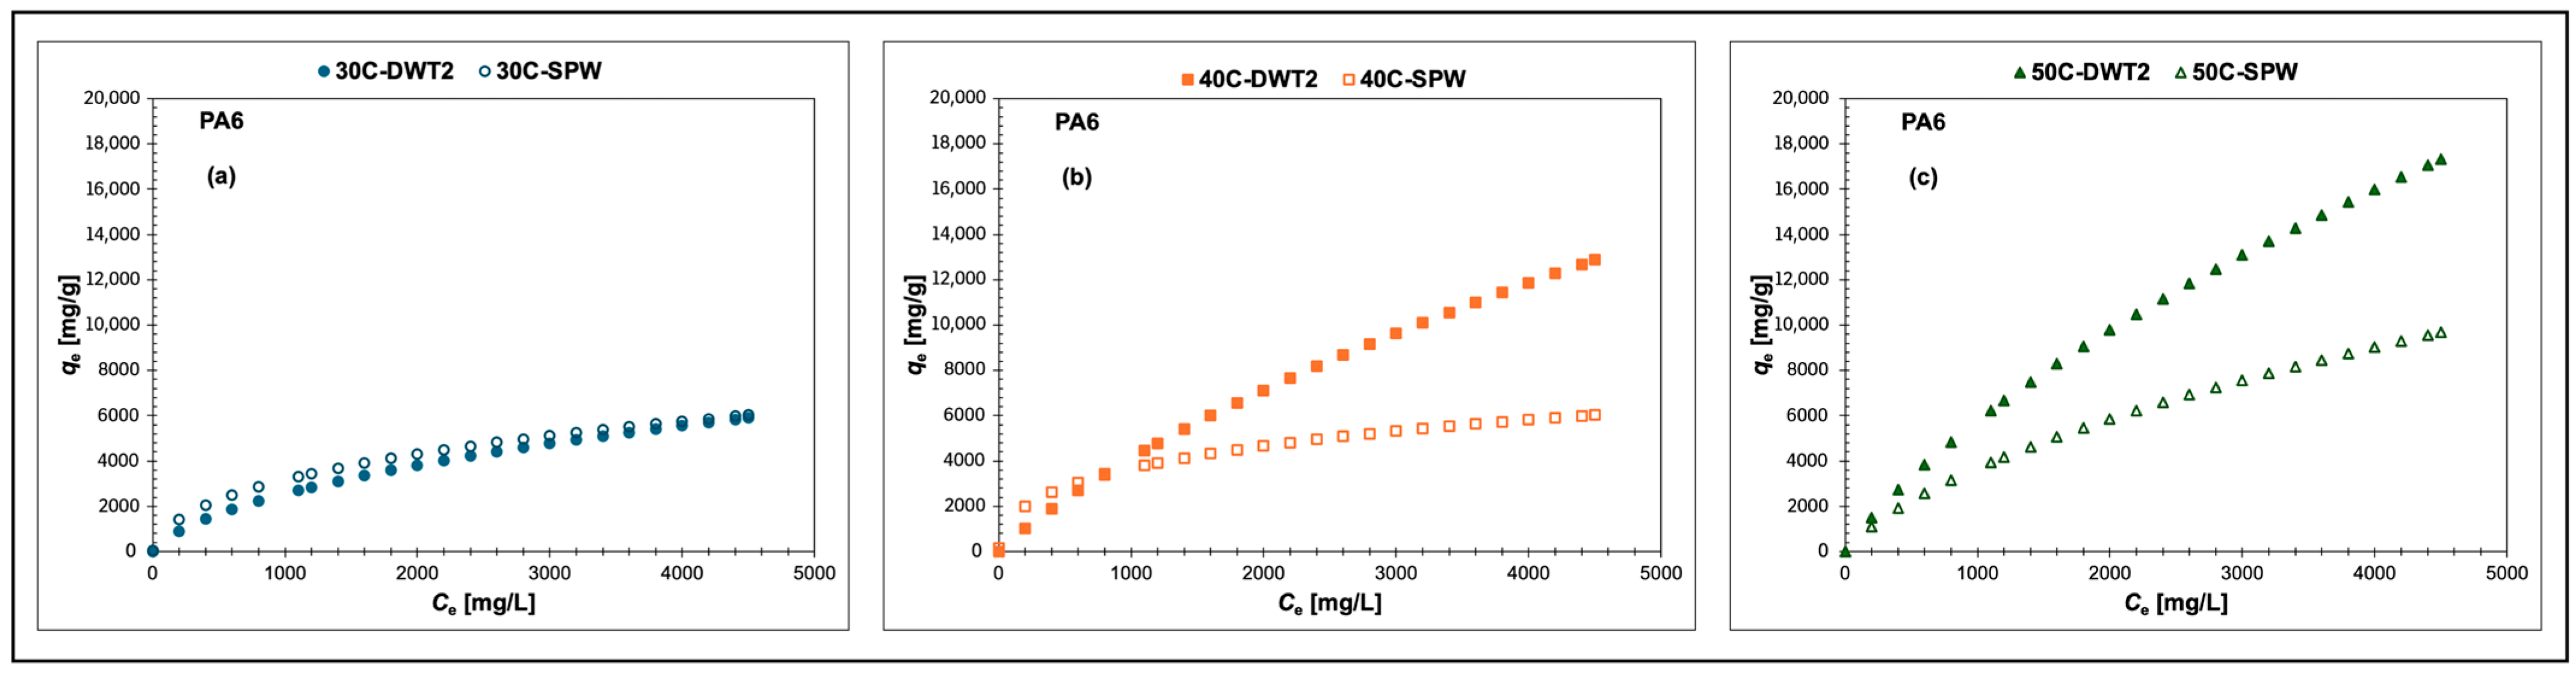
Effect of Binding Environment. Figure 10a–c reveal that the adsorption of PA6 MPPs increases substantially in DWT2 as the binding environment.

3.3.4. Low-Density Polyethylene (LDPE) Adsorption Isotherm

Table 11 shows the values of the statistical parameters and the analysis of several error functions obtained from the non-linear regression of seven isotherm adsorption models (Table 4) of LDPE MPPs’ adsorption under different experimental conditions.
The error function analysis (Table 11) demonstrates that the Dubinin–Radushkevich (D–R) model offers the best fit of the LDPE MPPs’ experimental adsorption data.
Table 12 summarizes the D–R model adsorption parameters: the maximum adsorption capacity (qMax) and the D–R constant (β) showing their corresponding 95% confidence index. Column 4 in Table 12 displays the calculated mean free energy of adsorption (E).
The data in Table 12 implies that qMax decreases as temperature increases in DWT2, while the opposite occurs in SPW. However, the calculated mean free energy of adsorption values, denoted by E, suggest that stronger interactions between the adsorbate–adsorbent take place in DWT2.
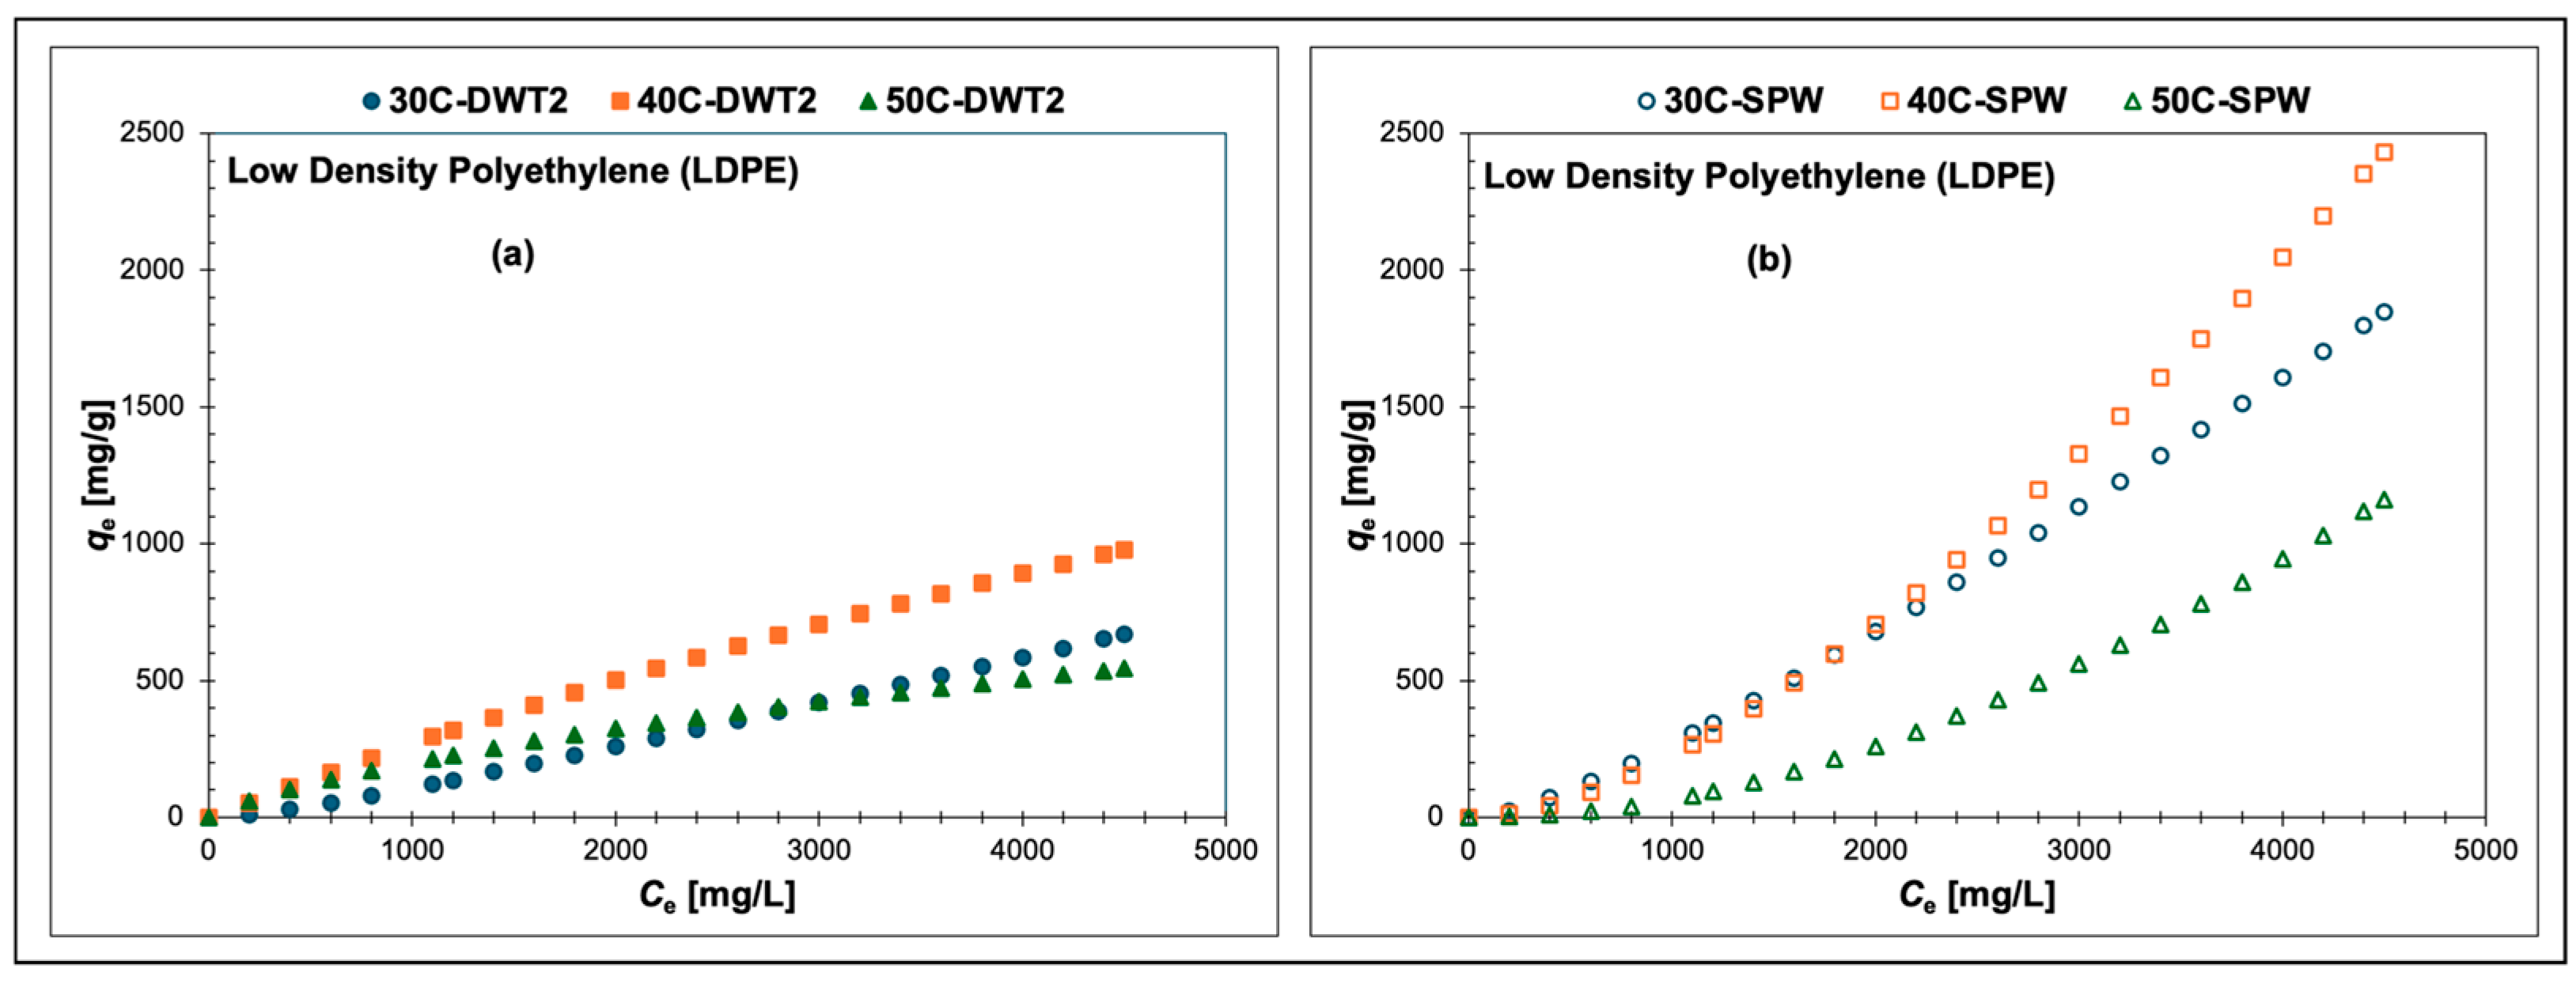
Effect of Temperature. Figure 11a and Figure 11b display the effect of temperature on the adsorption of LDPE MPPs onto the bio-substrate surface for DWT2 and for SPW as the binding environments, respectively.
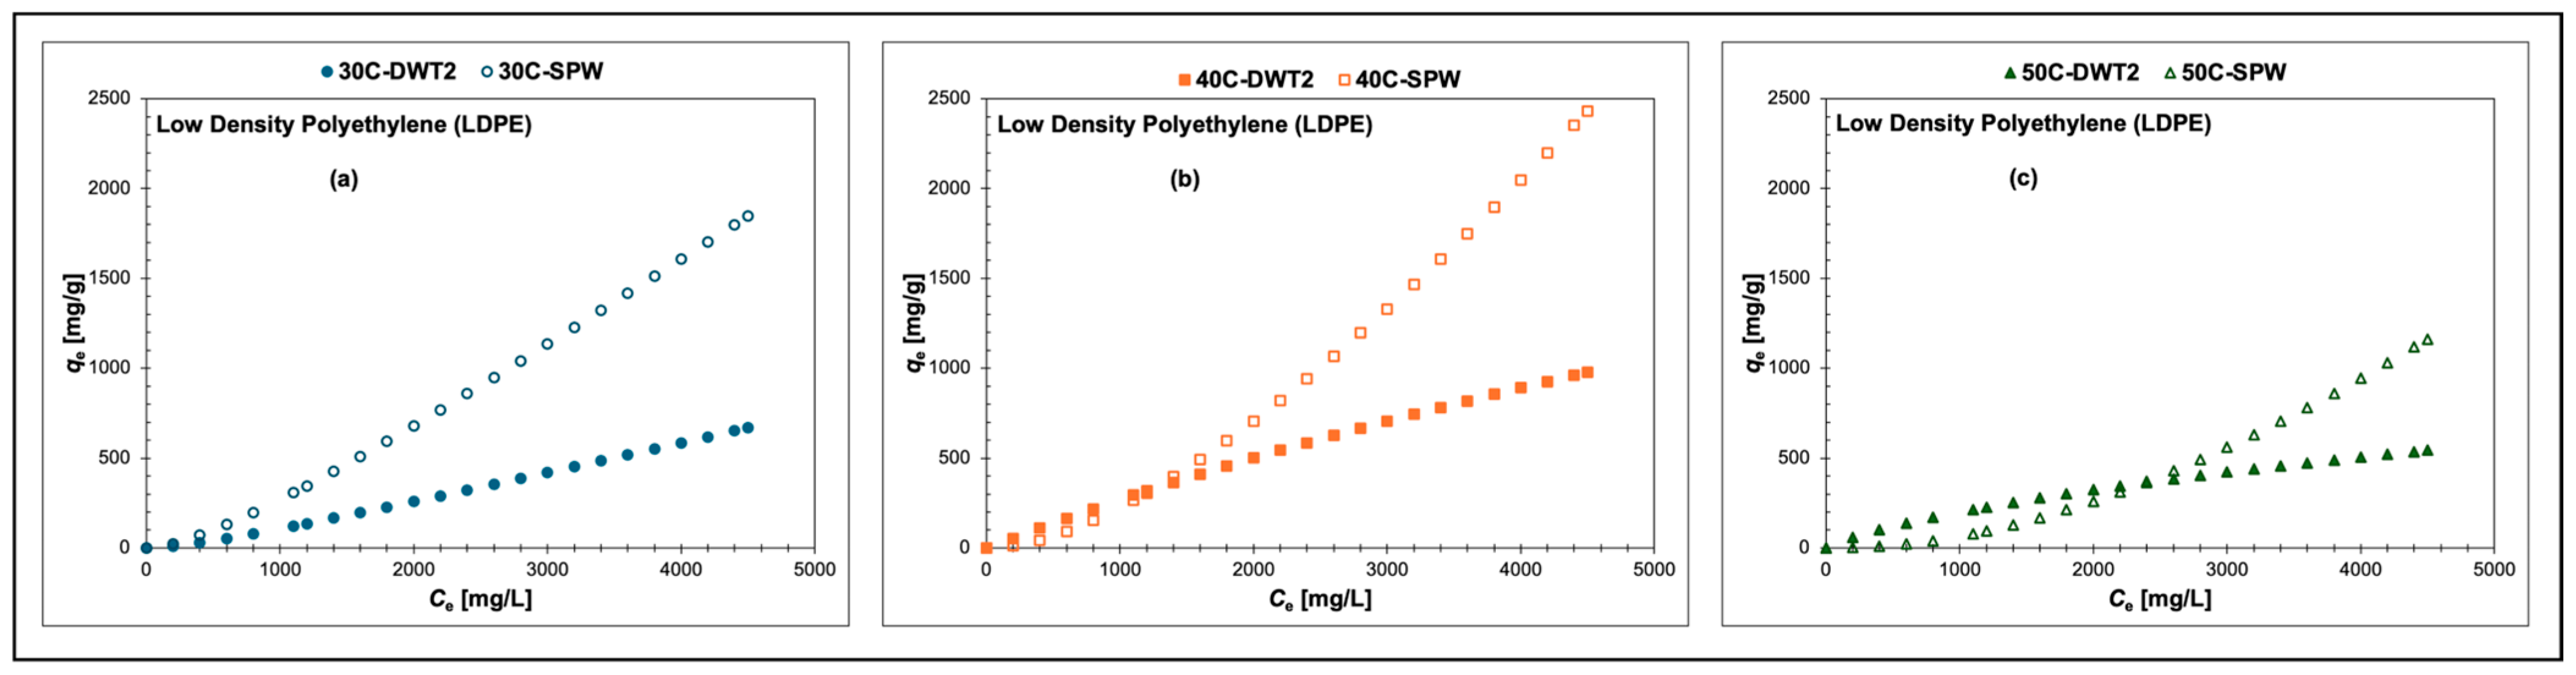
Effect of Binding Environment. The isotherm adsorption curves displayed in Figure 12a–c indicate the overall greater adsorption of LDPE MPPs in the presence of SPW as the binding environment.

3.3.5. High-Density Polyethylene (HDPE) Adsorption Isotherm

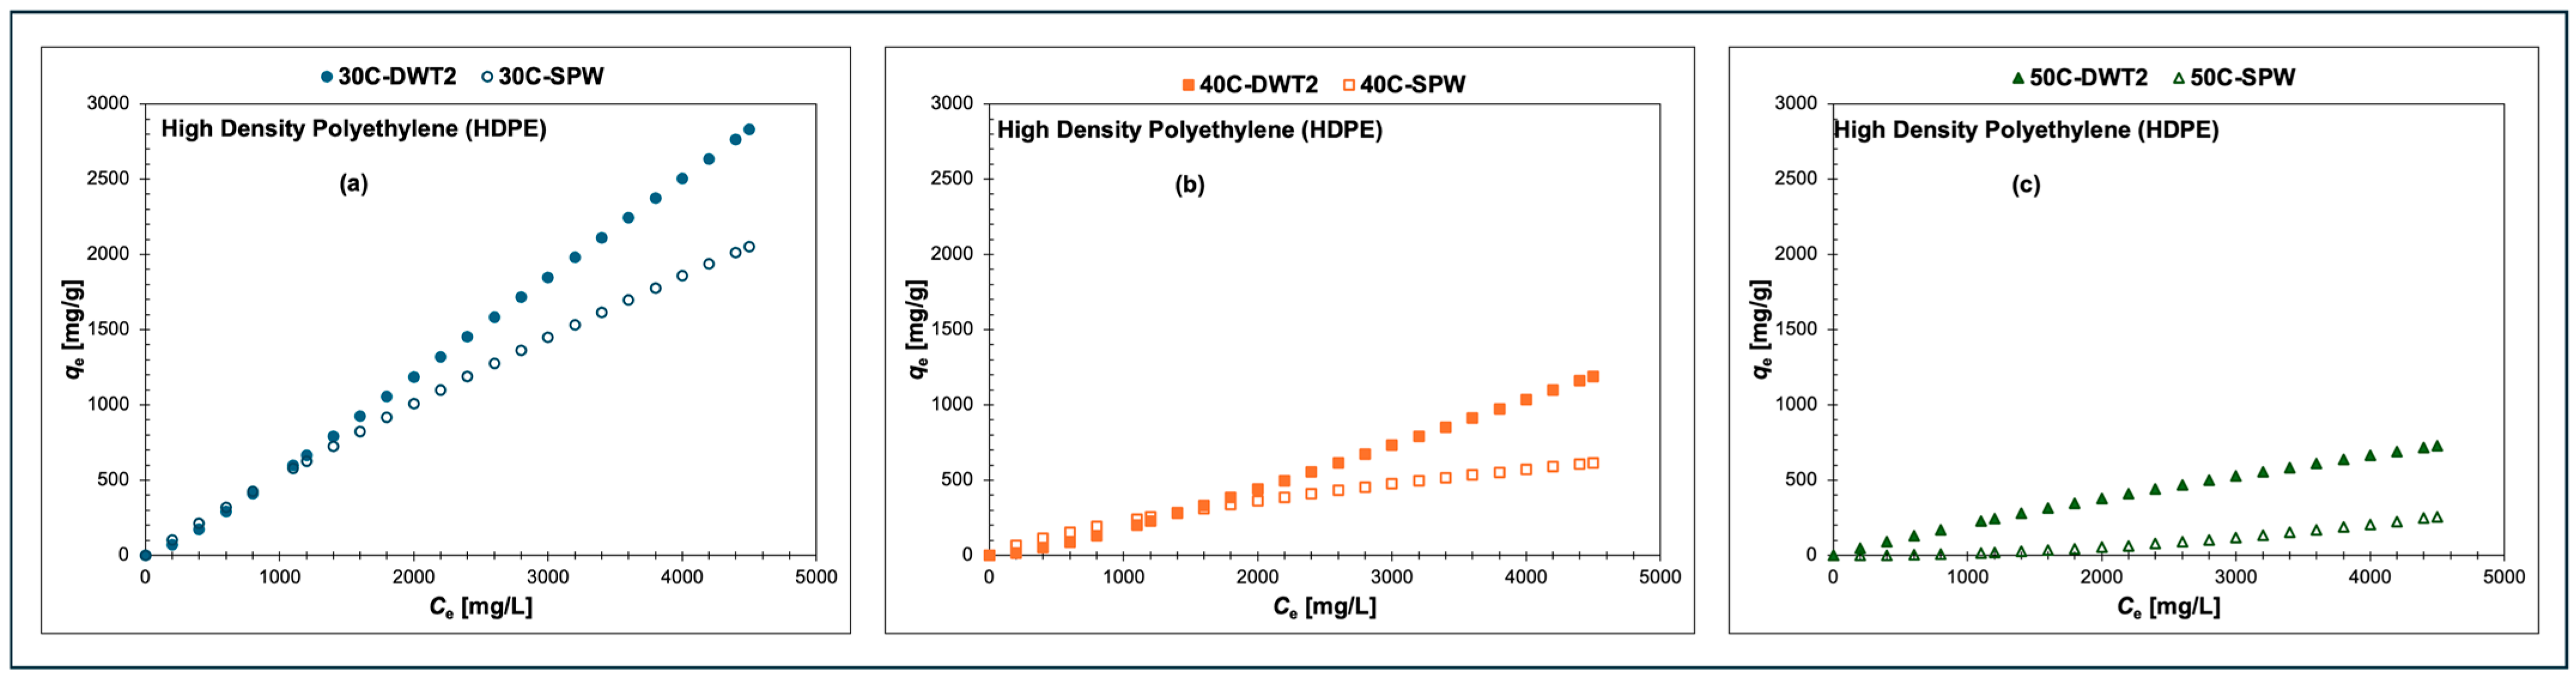
Table 13 shows the values of the statistical parameters and the analysis of several error functions obtained from the non-linear regression of seven isotherm adsorption models (Table 4) under the experimental adsorption conditions for HDPE MPPs. The Dubinin–Radushkevich (D–R) model provides the best fit of the experimental adsorption data for HDPE MPPs (Table 13).
Table 14 summarizes the D–R model adsorption parameters: the maximum adsorption capacity (qMax) and the D–R constant (β) showing the corresponding 95% confidence index. Column 4 in Table 14 displays the calculated mean free energy of adsorption (E).
Table 14 indicates that qmax is inversely affected by temperature in DWT2, whereas in SPW, qMax tends to increase with temperature, with the largest value of qMax = 2.9 × 10⁻² ± 5.9 × 10⁻³ mol/g at 50 °C. The E values exhibit a more consistent trend in DWT2, where the strength of the adsorbate–adsorbent interaction increases as temperature increases.
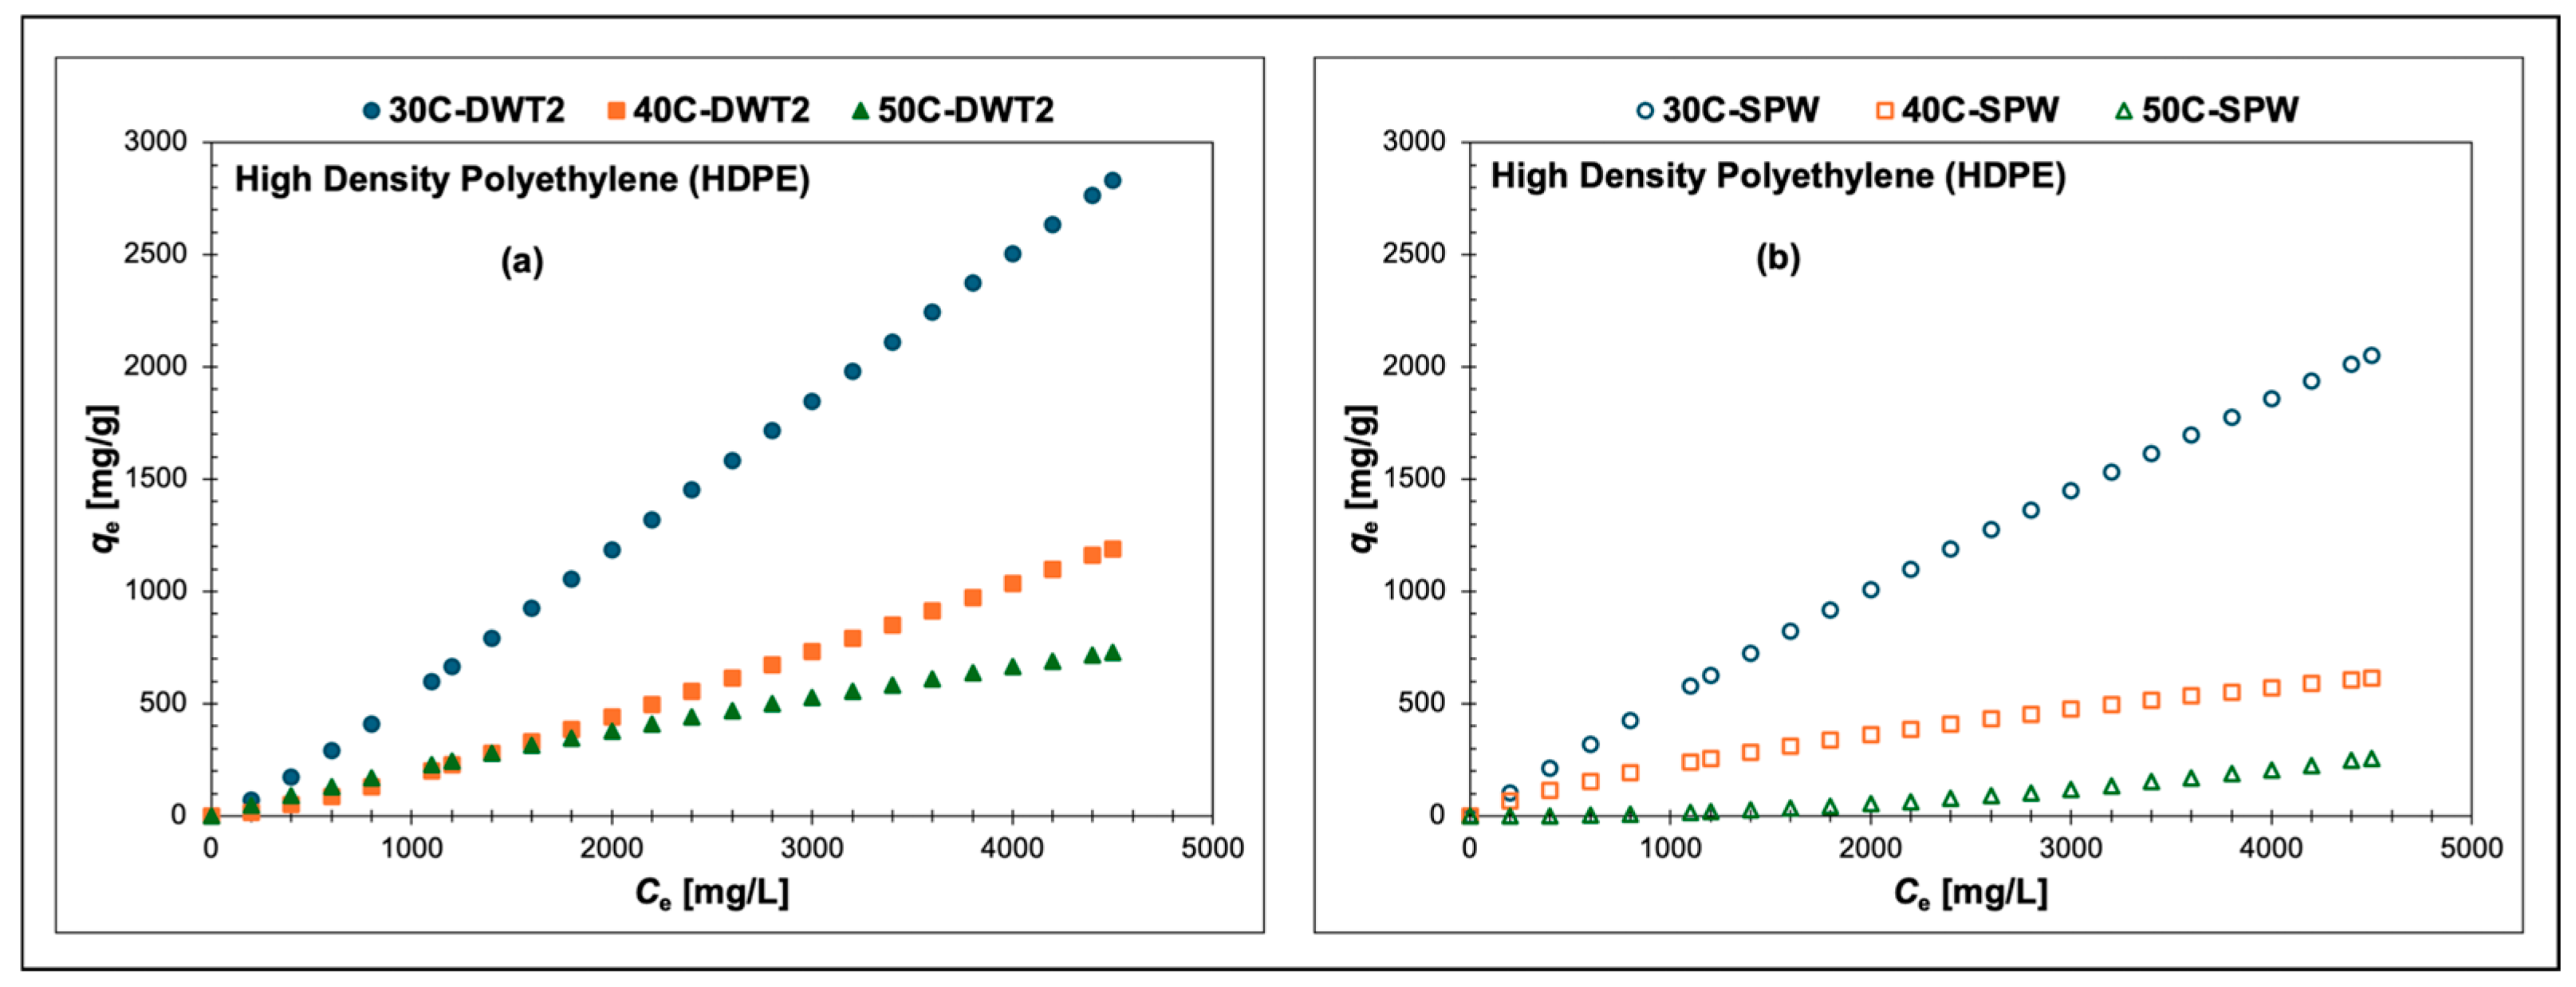
Effect of Temperature. Figure 13a,b imply that the adsorption of HDPE MPPs is inversely related to temperature in both binding environments, with the remarkable adsorption of HDPE MPPs at a temperature of 30 °C.
Effect of Binding Environment. Figure 14 displays the greater adsorption of HDPE MPPs in DWT2 as the binding environment at all adsorption temperatures.

3.3.6. Adsoprtion Isotherm for Mixture of 5 Polymers (M5Poly)

Table 15 summarizes the error function analysis of the experimental data on the M5Poly MPPs’ adsorption, fitted to seven adsorption isotherm models. As shown in Table 15, the best fit is provided by the Dubinin–Radushkevich (D–R) model.
Table 16 summarizes the D–R model adsorption parameters: the maximum adsorption capacity (qMax) and the D–R constant (β) showing their corresponding 95% confidence index. Column 4 in Table 16 displays the calculated mean free energy of adsorption (E).
Table 16 suggests that the adsorption of M5Poly MPPs decreases as temperature increases in both binding environments, whereas the strength of the adsorbate–adsorbent interactions increases as temperature increases in DWT2 and SPW.
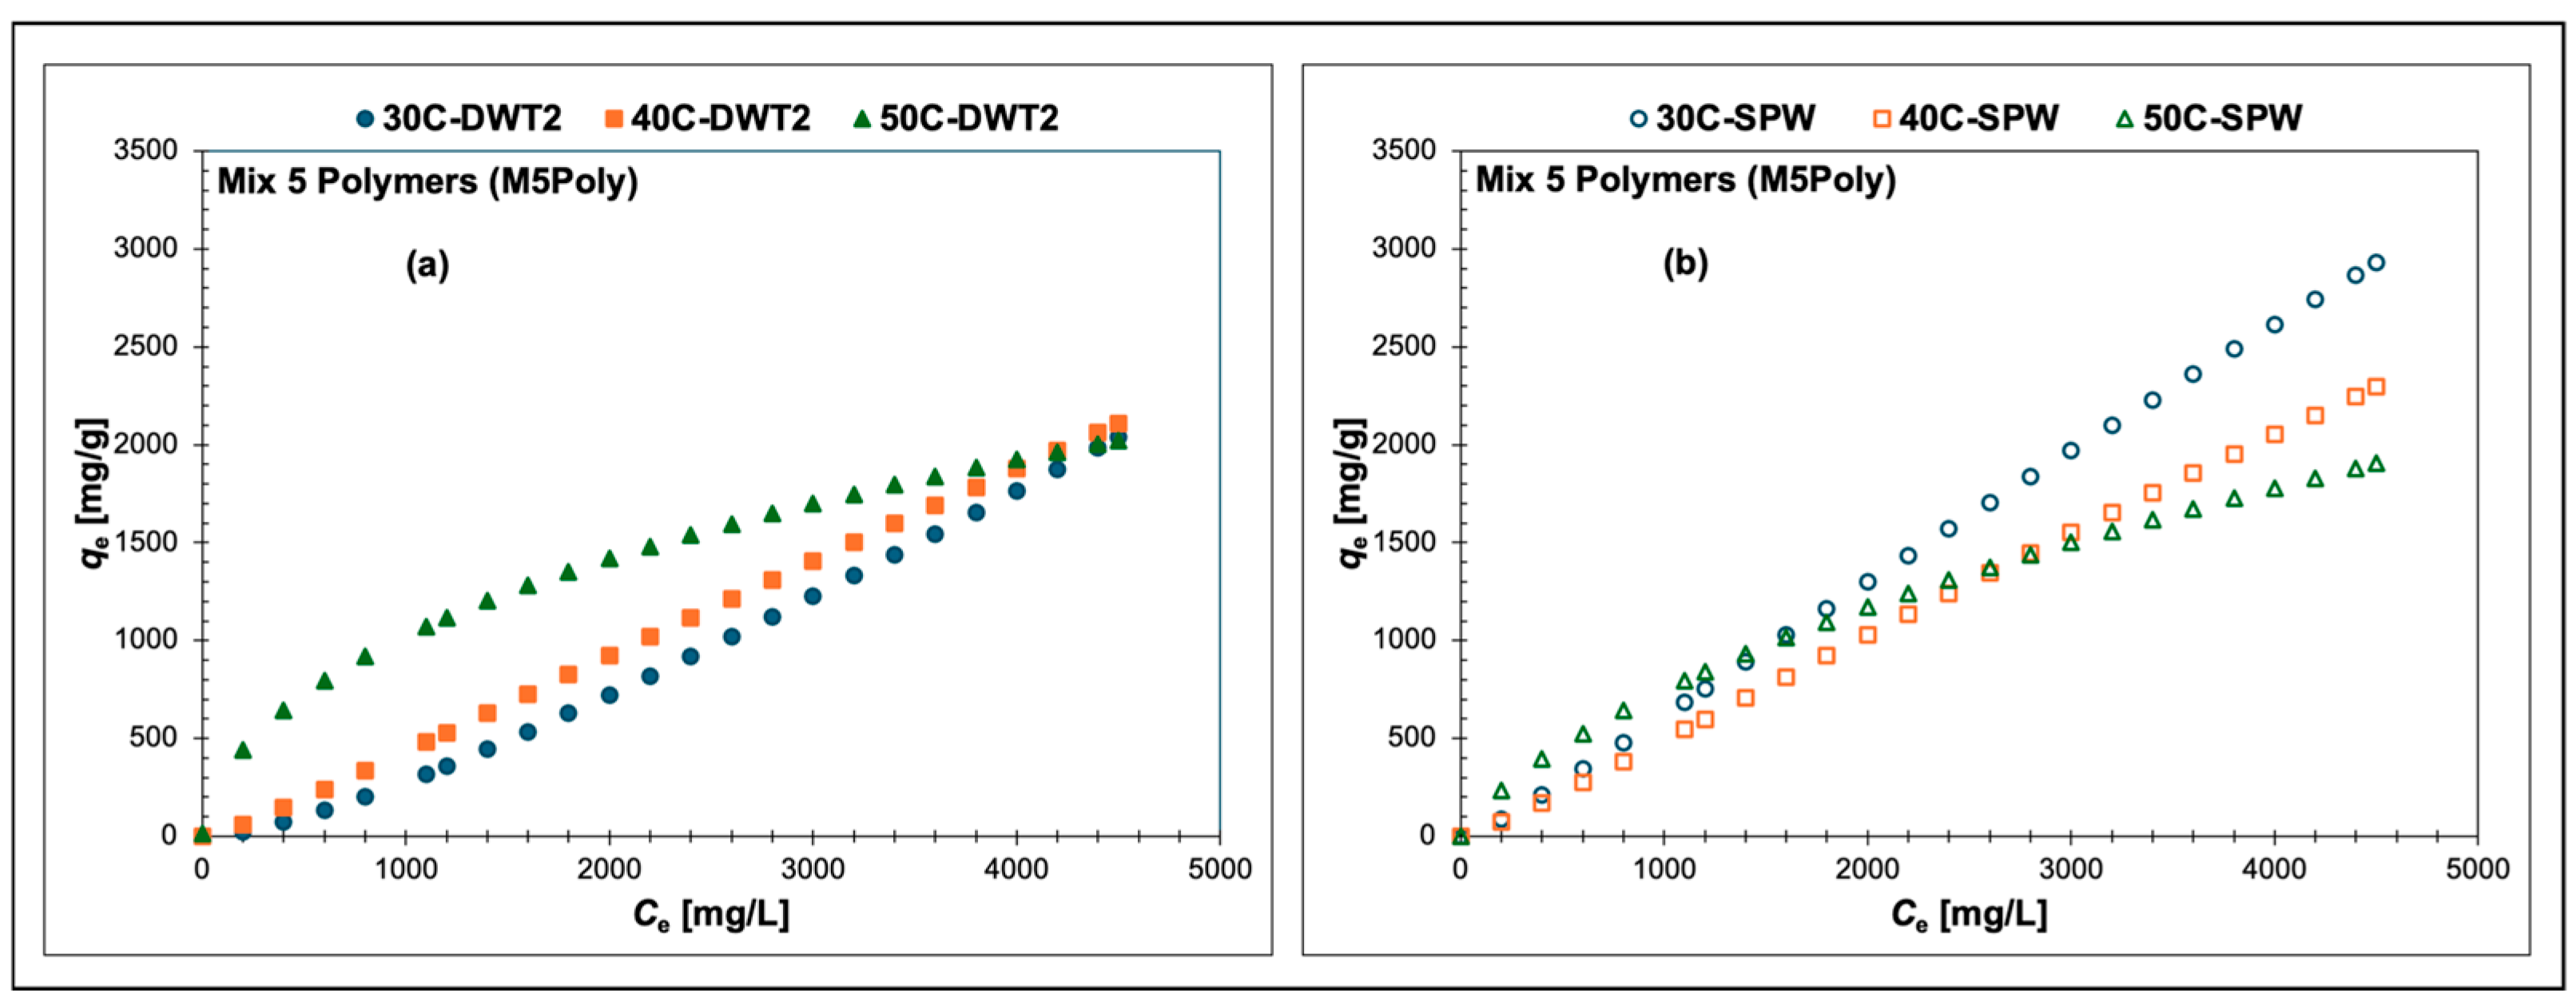
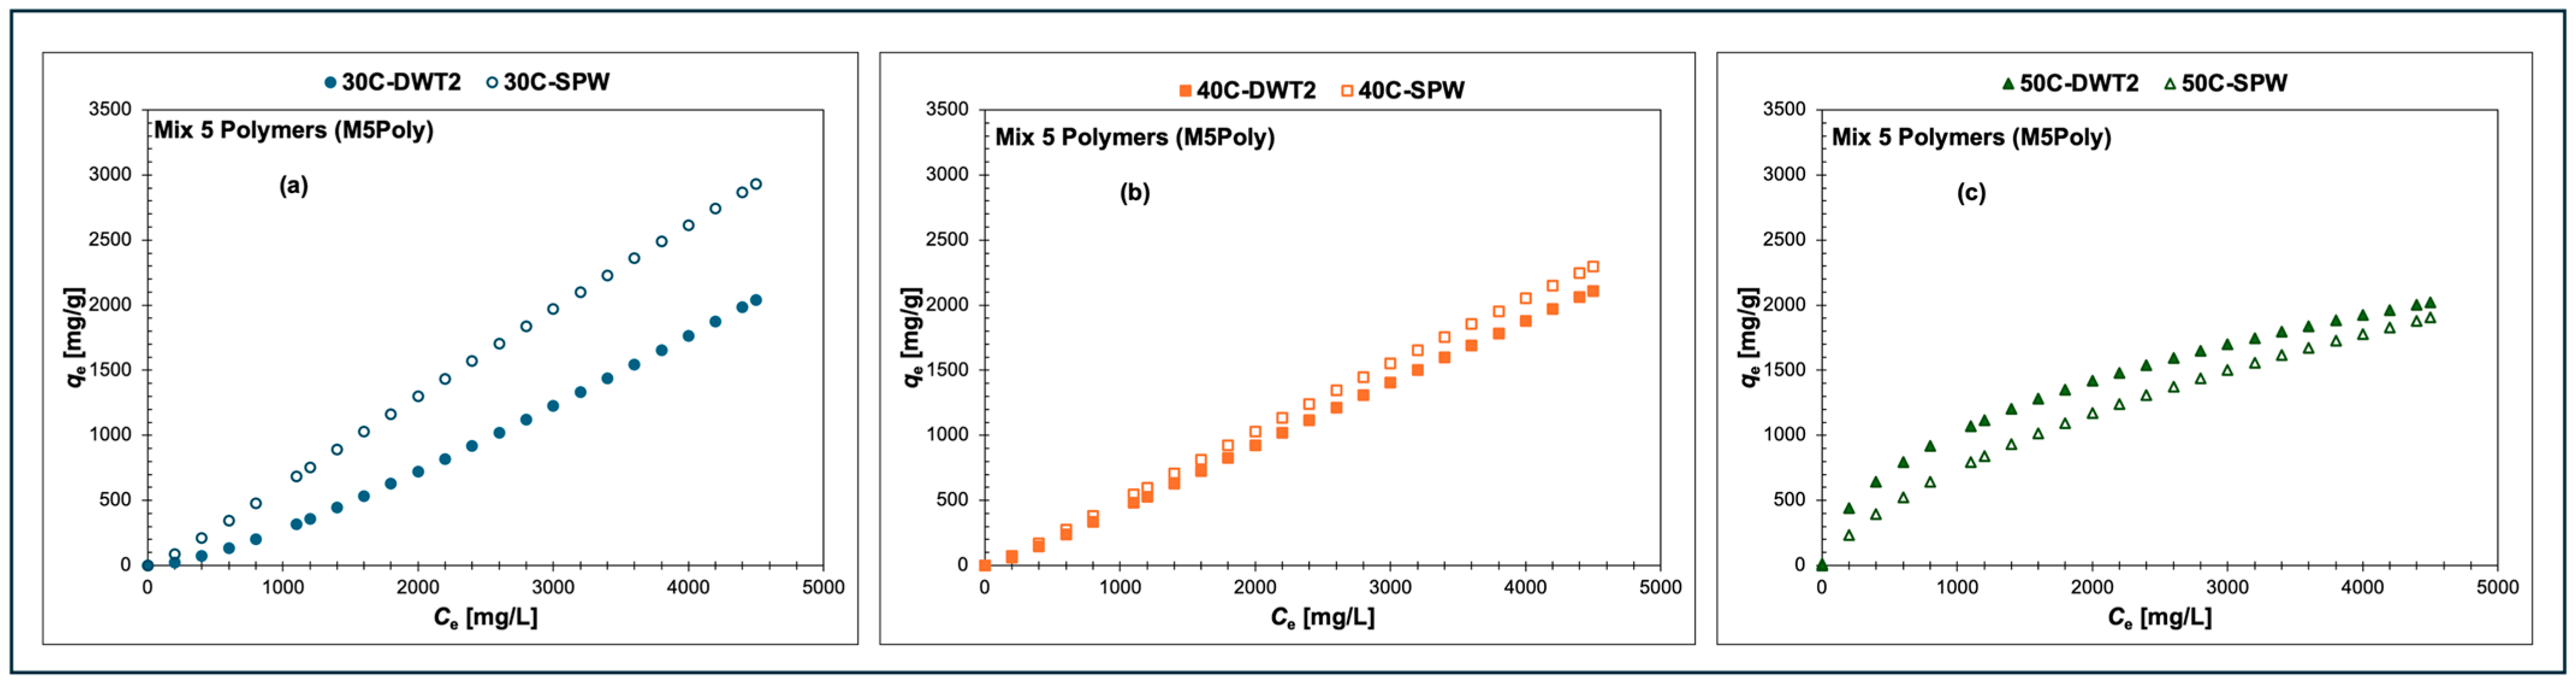
Effect of Temperature. According to Figure 15a, the adsorption of M5Poly MPPs increases as the temperature increases in DWT2. However, at Ce ≥ 4000 mg/L, the isotherm adsorption curves intercept, and the adsorption performance reverses; thus, from this interception point on, the adsorption of MPPs decreases with increasing temperature. For the case of SPW, Figure 15b shows that the adsorption of M5Poly MPPs decreases as the temperature increases. The 30 °C isotherm adsorption curve displays the best adsorption performance in SPW, while the 40 °C and the 50 °C isotherm curves display overlapping adsorption behavior. This adsorption behavior matches the findings reported in Table 16.
Effect of Binding Environment. Figure 16a reveals that higher adsorption of M5Poly MPPs occurs in SPW at 30 °C, while at 40 °C, the adsorption performance is very similar in both binding environments (Figure 16b), with slightly larger adsorption in SPW at higher Ce values. Figure 16c indicates that the adsorption performance reverses, and greater adsorption of MPPs is obtained in DWT2 according to the 50 °C isotherm adsorption curves.
Table 17 summarizes the key experimental observations of the MPPs’ adsorption behavior onto the bio-substrate at the experimental range of qe as a function of Ce.
Table 17 identifies comparable adsorption performance trends between the MPPs using the same color shading in the background of the rows. For instance, with DWT2 as the binding environment, PP, PA6, and M5Poly MPPs show the same adsorption performance (clear blue shading). Likewise, PVC and HDPE MPPs (clear green shading) display identical adsorption behavior in DWT2. In SPW as the binding environment, PP, HDPE, and M5Poly MPPs exhibit similar adsorption traits (clear yellow shading). Likewise, PVC and PA6 MPPs in SPW show matching adsorption trends (clear orange shading), whereas LDPE MPPs have unique adsorption performance in both binding environments.
These experimental results reveal that MPP materials do not display a consistent adsorption pattern in aqueous environments. Therefore, the adsorption of MPPs onto the bio-substrate is strongly influenced by the chemical composition of the plastic materials, the composition of the binding environment, and the temperature of the adsorption process. As presented in Table 17, some of the MPPs (PP, PA6, and HDPE) display higher adsorption in DWT2, while other materials, like LDPE MPPs, exhibit greater adsorption in SPW; whereas PVC MPPs exhibit the same adsorption at specific temperatures and larger adsorption at 30 °C in DWT2 and at 50 °C in SPW.
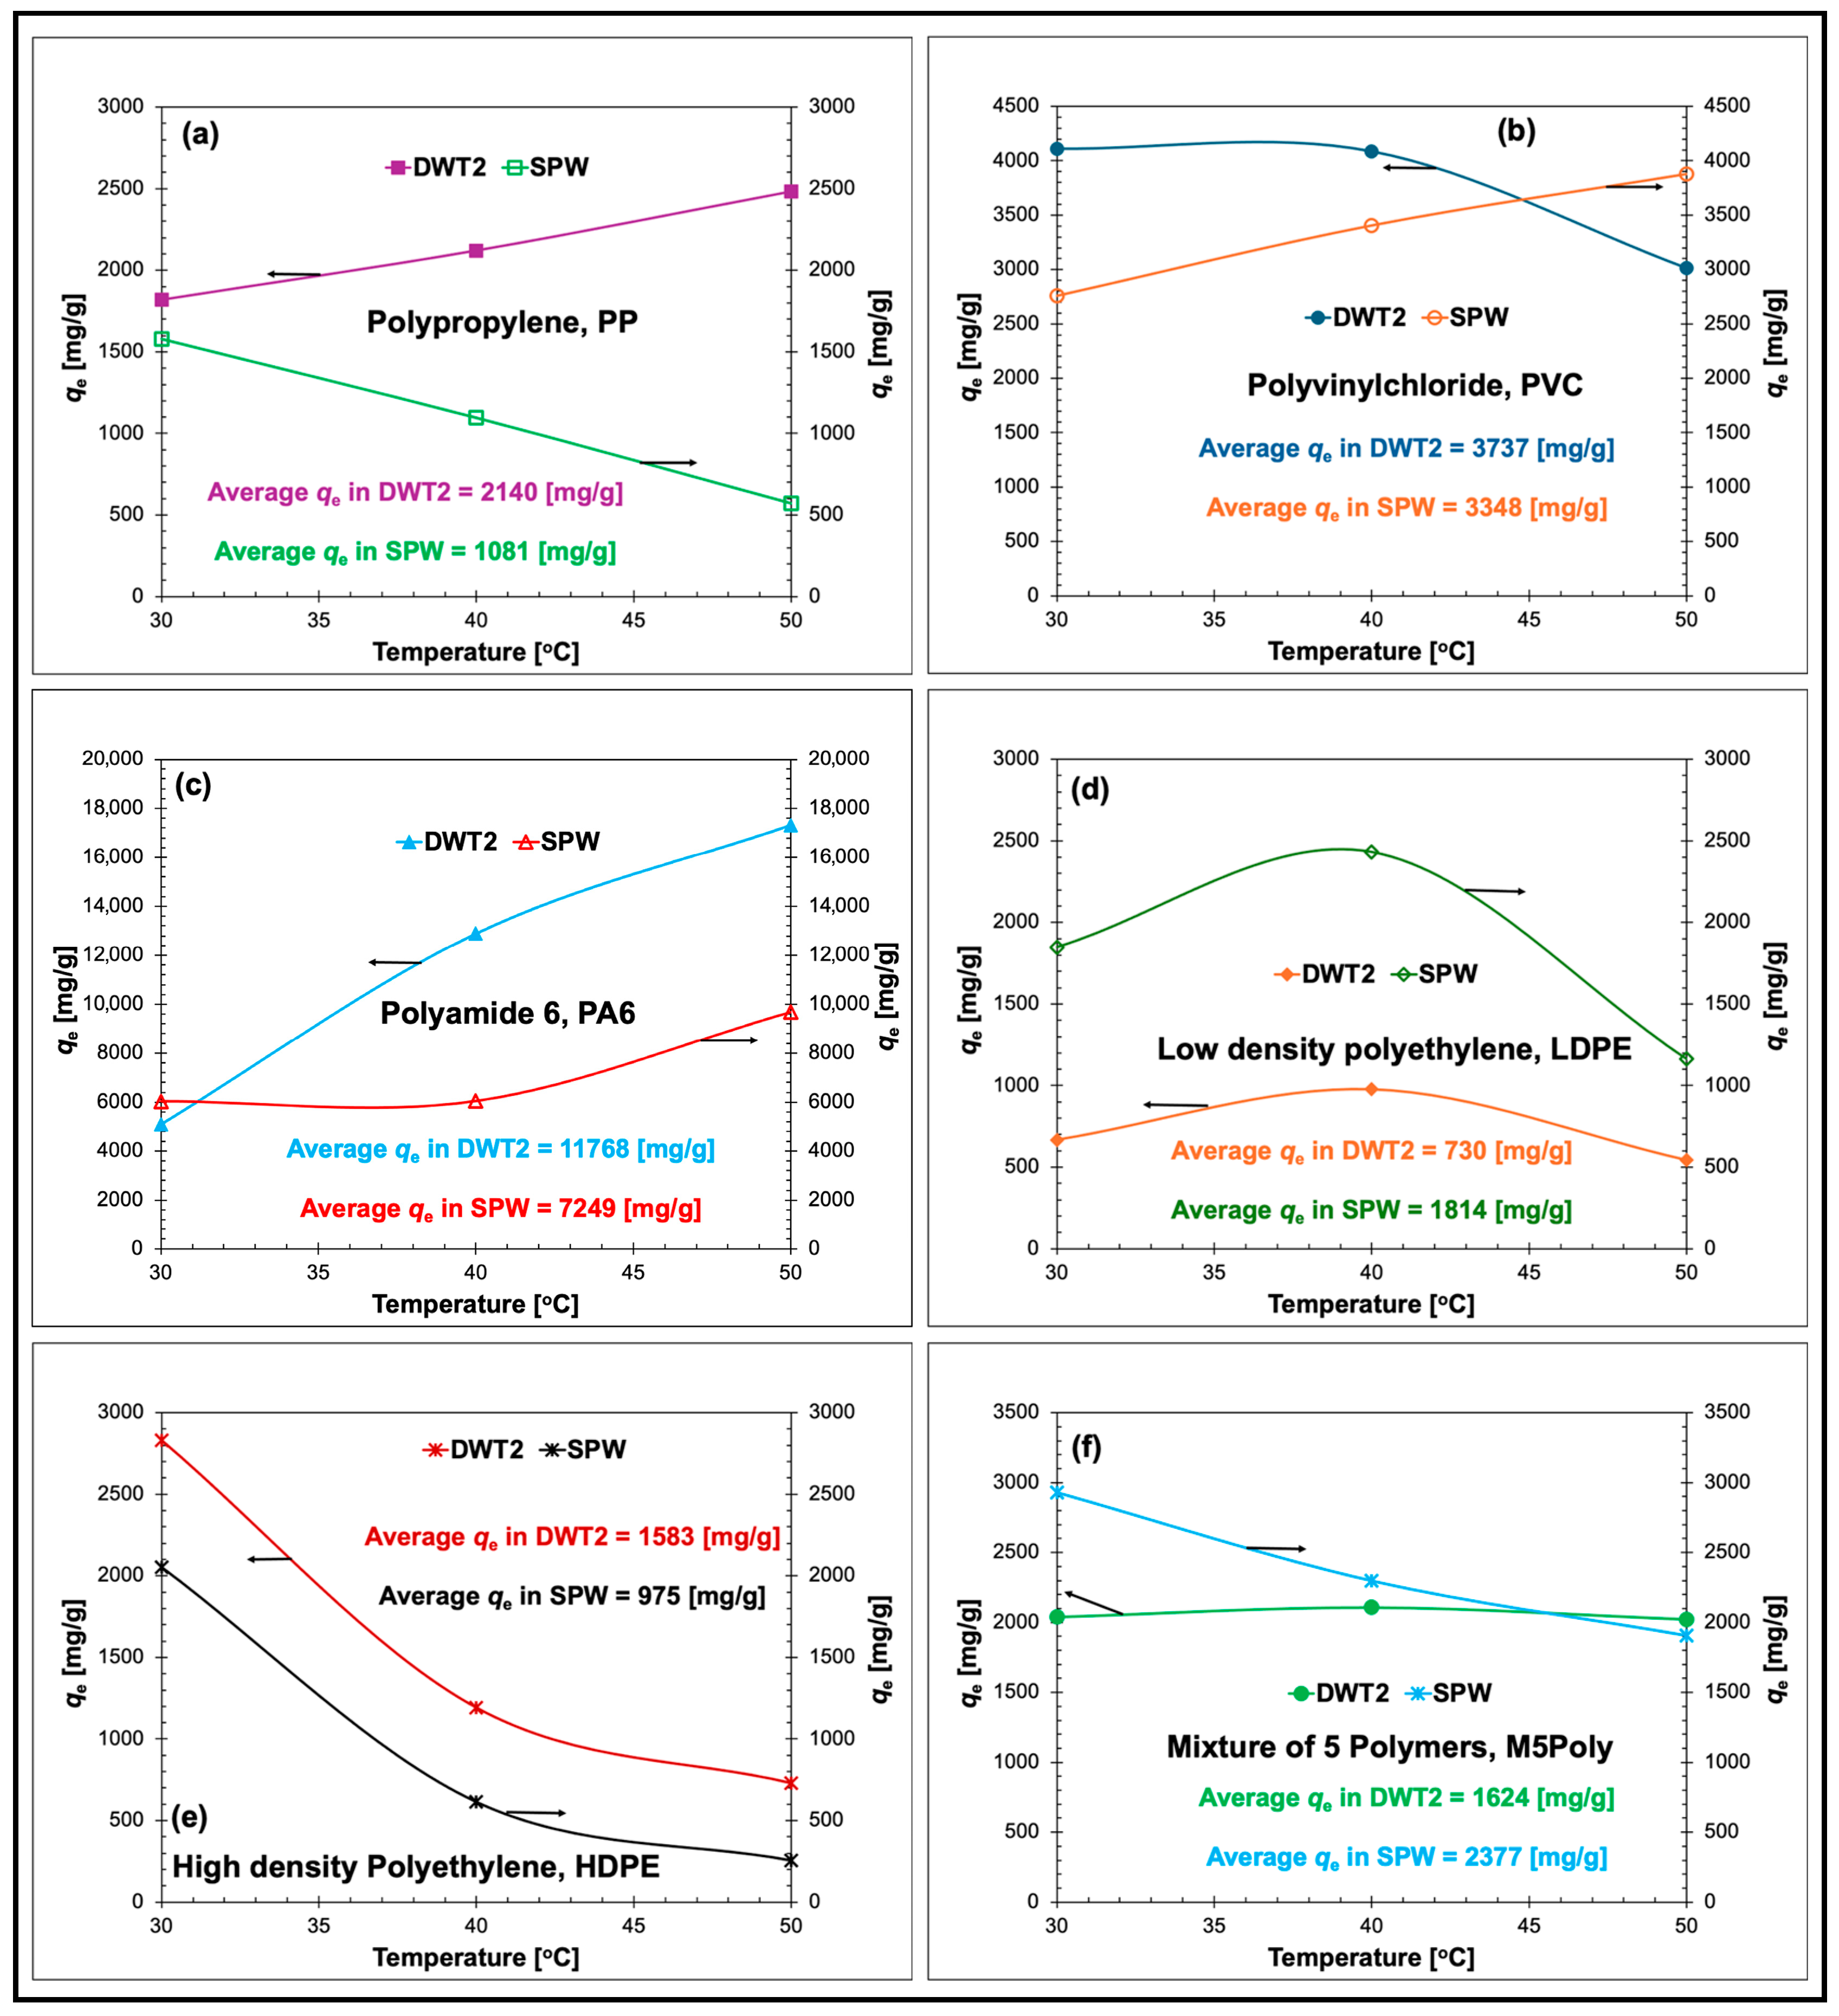
Figure 17a–f display qe (solute uptake per unit mass of adsorbent at equilibrium) as a function of temperature at a fixed solute equilibrium concentration of Ce = 4500 mg/L for all the MPP materials. Figure 17a–f also provide information on the average qe in the range of temperature evaluated for both binding environments at Ce = 4500 mg/L.
The general adsorption performance summarized in Figure 17a–f confirms the significant solute uptake per unit mass of bio-adsorbent (qe) within the range of temperatures evaluated. The lowest qe value registered was 730 mg/g for LDPE MPPs in DWT2 (Figure 17d), while the highest qe value was 11,768 mg/g for PA6 MPPs in DWT2 (Figure 17c). The information presented in Figure 17 matches the general adsorption trends provided in Table 17. A discussion on the potential adsorption mechanisms of MPPs on the bio-substrate is presented in the following section.

4. Discussion

The modified Dubinin–Radushkevich (D–R) isotherm adsorption model provided the best fit of the experimental adsorption data for all the MPP materials evaluated in this work. The D–R model is a commonly used isotherm model suitable for physical and chemical adsorption processes [4,18,21,24]. The D–R isotherm adsorption model “is especially well-suited for physical adsorption processes” [18], and for describing monolayer and/or multilayer adsorption on heterogeneous adsorbent surfaces [18,19,21,22,24]. According to the literature [19], the “D-R model is defined more broadly than the Langmuir model and is extended to cover the case of aqueous contaminants adsorption”. The D–R isotherm model is temperature-dependent and assumes an adsorption mechanism based on the Gaussian energy distribution onto heterogenous surfaces [19,25]. Consequently, as the D–R isotherm adsorption model allows for the description of adsorption experimental data at different temperatures on heterogeneous adsorbents, it provides the best fit of the adsorption experimental data in this study [18,51]. On one hand, the Temkin adsorption isotherm model is also temperature-dependent, as previous research has demonstrated several limitations associated with its applicability. These limitations include the range of validity of adsorbate concentration (e.g., restricted to only intermediate concetrations) [25,49] and a limited range of ion concentrations in the binding media [18]. Likewise, the newly proposed nonlinear three-constant Temkin adsorption isotherm model requires complex iteration processes to determine the model fitting parameters [50]. On the other hand, the Redlich–Peterson (R–P), Toth, and Sips adsorption isotherm models are empirical hybrid models of the Langmuir and Freundlich adsorption isotherm models, which offer limited relevance in our study because these models are non-temperature-dependent.
The bio-substrate used in this study exhibits a superhydrophobic solid surface (contact angle of 158.4 ± 1°), as its surface is coated with a film of wax, making it have a low-energy surface. The MPP materials PP, PVC, LDPE, and HDPE are hydrophobic plastic materials with contact angles > 100° (Table 1); hence, they are low-surface-energy materials. The PA6 MPPs, on the other hand, exhibit a contact angle of 68°, indicating that the surface of PA6 displays a surface that is neither hydrophobic nor hydrophilic; therefore, it could be considered a solid surface with dual-surface wettability and higher surface energy relative to those of the other MPPs materials evaluated in this work.
Hydrophobic surfaces exhibit low surface energy. In a liquid–hydrophobic solid adsorption system, the MPPs in the aqueous solution do not interact with the aqueous solvent (having a negligible energetic incentive) but migrate toward the hydrophobic solid surface because the interactions between MPPs and the hydrophobic surface are energetically favored. This is because solid surfaces will always try to minimize its energy by adsorbing a material with a lower energy onto its surface. Thus, in the context of this study, surface energy minimization occurs both ways on the MPPs and on the bio-substrate surface. Accordingly, “through the adsorption process, the number of exposed surface atoms with [relatively] high surface energy [either on the bio-substrate and/or on the MPPs surface] are minimized [through hydrophobic interactions] with lower energy atoms or molecules” [64].
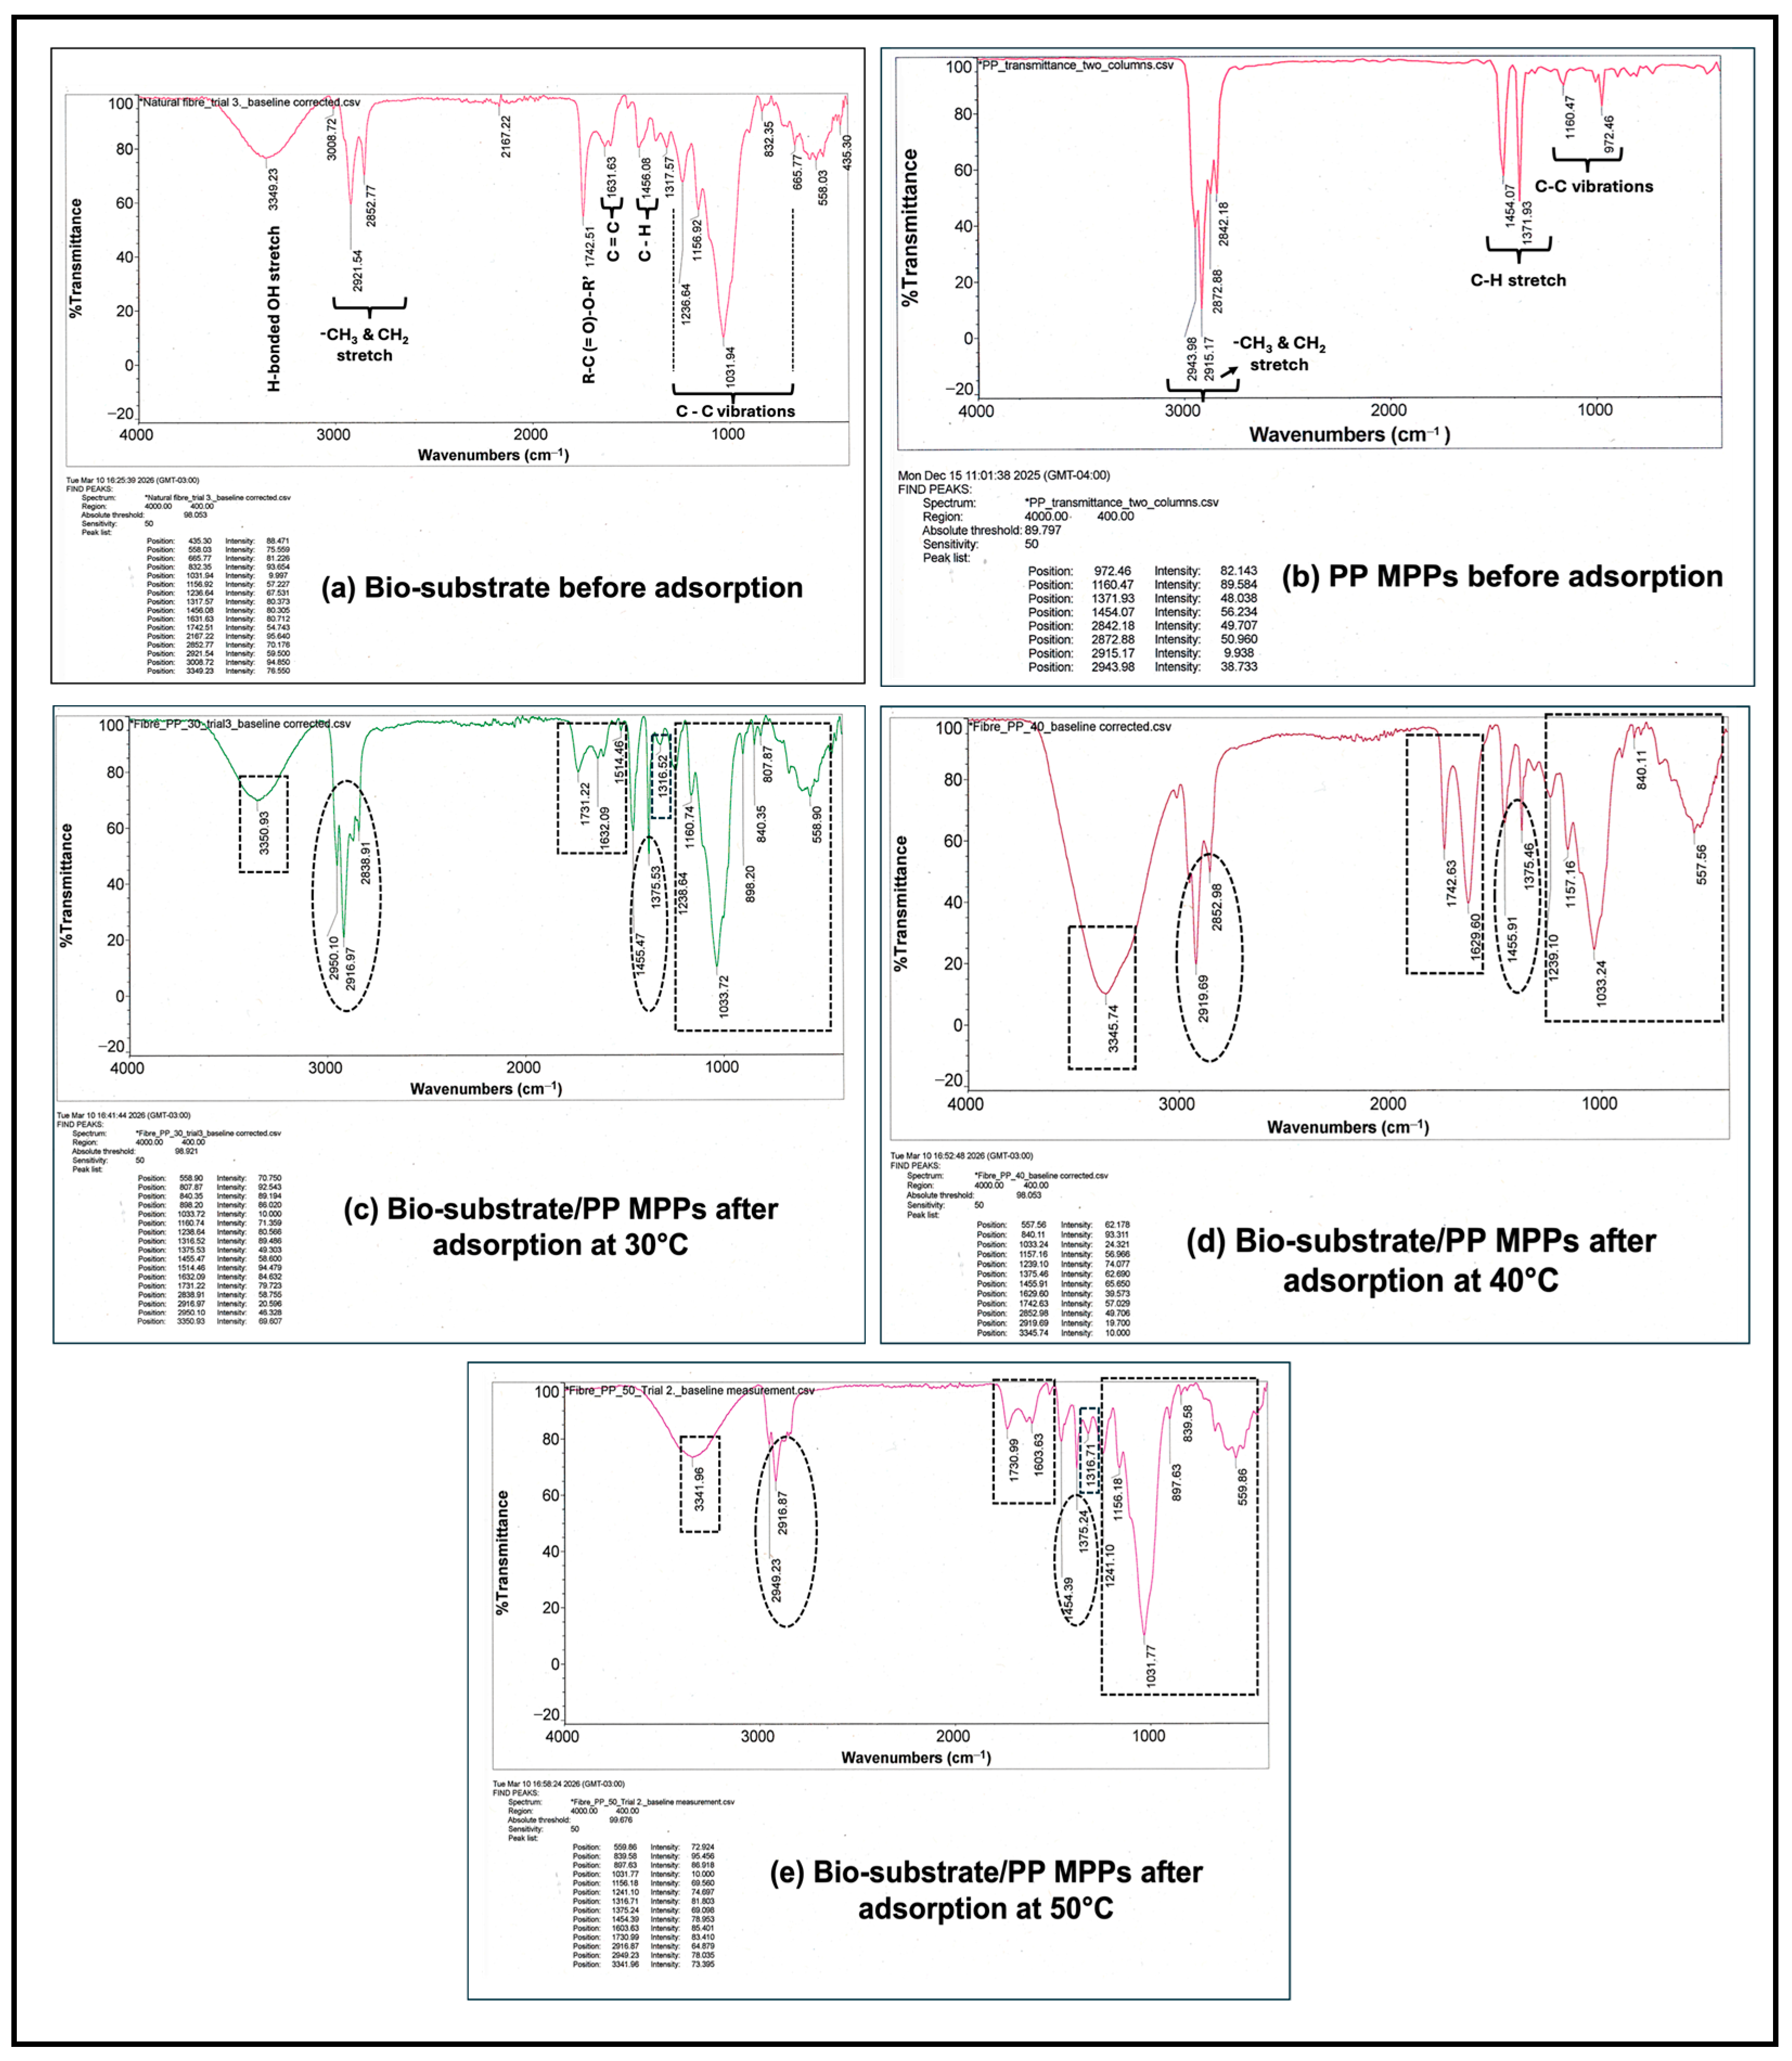
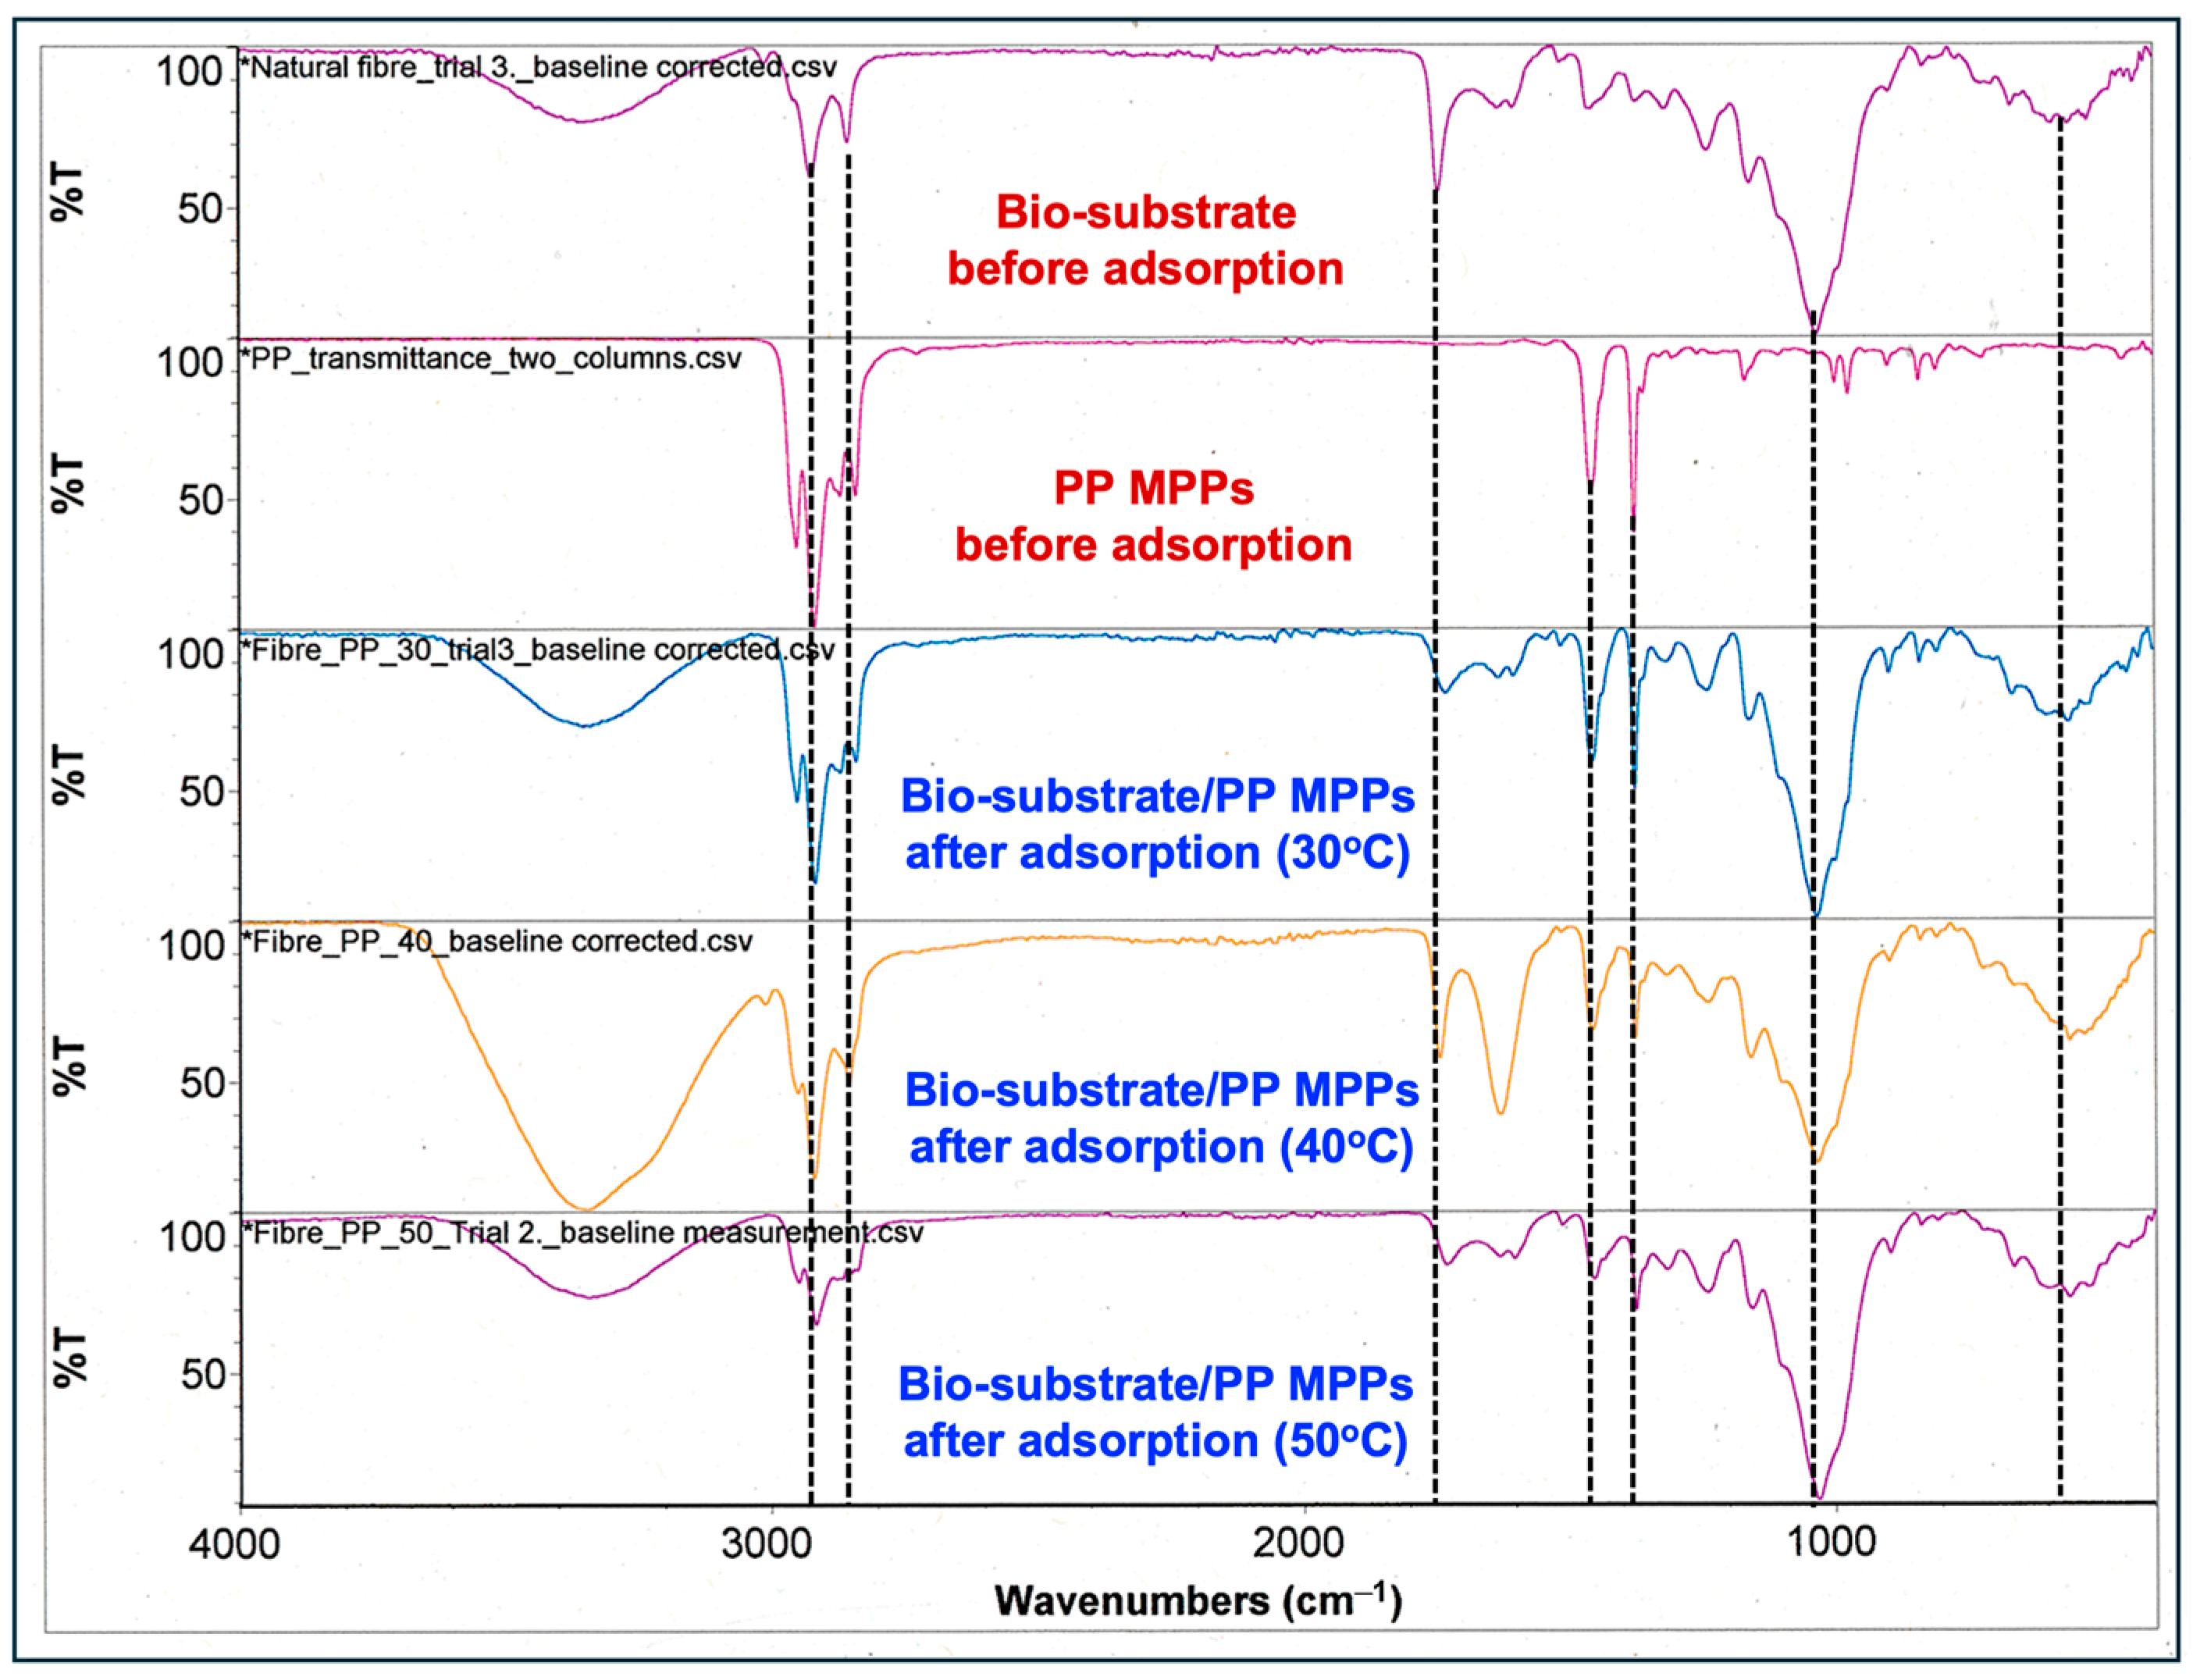
FTIR spectroscopy was performed to evaluate the interactions between PP MPPs and the bio-substrate. Figure 18 displays the FTIR spectra of the bio-substrate before adsorption (Figure 18a) and the PP MPPs before adsorption (Figure 18b), and Figure 18c–e present the spectra of PP MPPs adsorbed onto the bio-substrate at 30 °C, 40 °C, and 50 °C in SPW as the binding environment.
Figure 18a shows the spectrum of the bio-substrate before adsorption. The broad frequency located at 3349.23 cm−1 corresponds to the H-bonded OH stretch related to the presence of alcohols. The strong frequencies located at 2921.54 cm−1 and 2852.77 cm−1 are assigned to the methyl (-CH3) and methylene (-CH2) asym./sym. stretching of saturated aliphatic groups attributed to natural waxes. The strong peak at location 1742.51cm−1 corresponds to esters (e.g., R-C(=O)-O-R′), while the peaks at 1631.63 cm−1 and at 1456.8 cm−1 are assigned to alkenyl C=C stretching and methylene C-H bending. These functional groups are normally associated with natural waxes. The strong peaks observed from 1317.57 cm−1 to 665.77 cm−1 are attributed to skeletal vibrations of the C-C stretching of saturated aliphatic (alkane/alkyl) group frequencies. The interpretation of the FTIR spectra was guided by [58]. Figure 18b displays the FTIR spectrum of PP MPPs before adsorption, which is also presented in Figure 4a, showing the corresponding peaks’ location and allocation of functional groups. The FTIR spectra of the bio-substrate samples after the adsorption of PP MPPs at different temperatures display the peak locations of both materials: the bio-substrate and the PP MPPs. The peaks surrounded by dashed squares in Figure 18c–e correspond to peaks characteristic to the bio-substrate, whereas the peaks surrounded by dashed ovals belong to PP MPPs. In the adsorbed bio-substrate–PP MPP samples in Figure 18c–e, some peaks of the saturated aliphatic group frequencies of the bio-substrate and PP MPPs overlap each other. All the peaks of PP MPPs identified in the FTIR spectra are observed in the bio-substrate samples after adsorption. The FTIR spectra of the of adsorbed samples do not reveal the presence of new peak locations, so there is no formation of new components through covalent bonding; therefore, physisorption of PP MPPs onto the bio-substrate takes place. Furthermore, all the peaks associated with saturated alkane/alkyl group frequencies, including -CH3, -CH2, C-H bend, skeletal C-C vibrations, alkene group frequency C=C, and carbonyl ester or R-C(=O)-O-R′, are slightly shifted after adsorption, indicating that all these functional groups interact during the physisorption process. The intensity of some of the peaks slightly increase or decrease after adsorption, suggesting hydrophobic interactions between the PP MPPs and the bio-substrate. Some peaks of saturated aliphatic group frequencies (e.g., -CH3 and -CH2) at locations characteristic of the bio-substrate, 2852.77 cm−1 and 2921.54 cm−1, completely overlap after adsorption in the presence of PP MPPs (e.g., Figure 18c–e). The average gain in peak intensity was 20%, while the average reduction in peak intensity was 24%. Figure 19 presents the stacked FTIR spectra of the materials before and after adsorption for better visualization of the peak location before and after adsorption. According to the FTIR spectra displayed in Figure 18 and Figure 19, physisorption of PP MPPs onto the bio-substrate occurs via weak forces such as hydrophobic interactions due to the affinity of the saturated aliphatic groups (e.g., alkane/alkyl), alkene, and carbonyl functional groups present in both materials: the bio-substrate and PP MPPs.

4.1. Hydrophobic Interactions: Effect of Temperature

Hydrophobic interactions rely upon the affinity of non-polar hydrophobic materials for water molecules, in terms of their aggregation and repulsion in a polar medium [10,65,66,67]. According to the literature [66], “hydrophobic association is driven by an increase in entropy as the ordered water gets released from the surface of the hydrophobic solute to the bulk upon formation of the contact [of the hydrophobic] pair”. On average, higher adsorption of PP, PVC, PA6, HDPE, and M5Poly MPPs (e.g., except for LDPE MPPs) onto the bio-substrate occurs in DWT2 as the binding environment (Table 17 and Figure 17), suggesting that the adsorption of these MPPs onto the bio-substrate is dominated by hydrophobic interactions, hence making the process one of physisorption process. These results agree with the earlier FTIR spectroscopy analysis results (Figure 18) and with the findings of other researchers regarding the adsorption of MPPs onto hydrophobic surfaces [14,68]. Table 17 and Figure 17 also show that in DWT2 as the binding environment, the adsorption of all MPPs (excluding HDPE MPPs) increases with temperature. A slight increase in the absorption of MPPs onto the bio-substrate is observed for PVC, LDPE, and M5Poly MPPs as a function of temperature, while for PP and PA6 MPPs, adsorption increases significantly as temperature increases. This performance is expected as the strength of hydrophobic interactions increases with temperature. This occurs because the water molecules trapped within the hydrophobic aggregates or clusters are expelled into the bulk of the aqueous solution to maximize the hydrogen bonds among the water molecules [59,65,66]. The effect of temperature on hydrophobic interactions is evident from the mean free energy of adsorption values, denoted by E, reported in this work. E provides information on the strength of the interactions between the MPPs and the bio-substrate. As Table 17 outlines, E values increase as temperature increases for PP, LDPE, HDPE, and M5Poly MPPs in both binding environments (DWT2 and SPW), while for PVC and PA6 MPPs, E increases as temperature increases in SPW as the binding environment.

4.2. Hydrophobic Interactions: Effect of Binding Environment Composition

The synthetically produced water, SPW, used in this study as a binding environment contained monovalent and divalent cations including Na+, Ca2+, and Mg2+ (refer to Table 2), as well as monovalent and divalent anions such as Cl and SO42−. In addition, the SPW aqueous solution contained 105 mg/L of light crude oil (e.g., condensate).
Table 17 and Figure 17 display the significant effect of the SPW binding environment on the sorption performance of MPPs on the bio-substrate. Reduced adsorption was observed for all the MPPs apart from the LDPE MPPs. The overall average adsorption of MPPs in SPW as the binding environment was 2807 mg/g, while the overall average adsorption of MPPs in DWT2 was 3597 mg/g. The average adsorption reduction in SPW was 22%. Consequently, the effect of binding environment composition on the performance of MPP adsorption onto the bio-substrate is noteworthy.
Hydrophobic interactions between the adsorbate (MPPs) and the adsorbent (bio-substrate) are affected by the presence of salts in the binding environment. The addition of electrolytes tends to increase the strength of hydrophobic interactions because electrolytes decrease the solubility of non-polar materials in water [66,69]. This implies that “higher salt concentration favors aggregation [of hydrophobic particles] because an increase in ion concentration in the medium acts to neutralize Coulombic repulsion between the surface charge and the counterion cloud” of the MPPs. This causes the compression of the double layer surrounding the MPPs screening the repulsion among particles in solution, which promotes the agglomeration or formation of MPPs clusters in SPW [70,71]. The agglomeration of MPPs causes steric hindrance effects at the adsorption surface, causing the reduced adsorption of MPPs clusters onto available adsorption sites on the hydrophobic bio-substrate. The steric hindrance effect on the reduced adsorption of agglomerates has been confirmed by previous researchers [72,73], who reported on the significant effect of adsorbate steric factors of agglomerated solid solutes on the adsorption process, with reported adsorption reductions of up to 40%.
The distinctive behavior of the adsorption of LDPE MPPs onto the bio-substrate surface when SPW was used as binding environment was probably caused by the “unique” relation between the surface charge of LDPE and its adsorption performance in aqueous solutions of inorganic electrolytes. During the manufacture of LDPE, the polymerization stage and/or further processing cause the oxidation of the LDPE surface due to the dissociation of carboxyl groups. Thus, at pH > 2.5, the surface of LDPE is negatively charged [74]. As expected, the addition of electrolytes at low concentrations (<0.01 M) enhances the adsorption of electrolytes onto the double layer at the LDPE surface, compressing it [74]. This effect causes the agglomeration of LDPE MPPs, which decreases the adsorption of MPPs onto the bio-substrate. However, the addition of higher concentrations of electrolytes (e.g., 0.3 mol/L in this work) suppresses it [75]. According to the literature [74], at higher concentrations of electrolytes, “the effect of adsorption of counterions is probably counterbalanced by the inverse effect of increasing the surface charge”. The increase in the negative surface charge on the LDPE MPPs promotes repulsion between the particles in solution, preventing their agglomeration in the SPW solution, which favors their adsorption onto the bio-substrate. The surface potential decay and the effect of humidity on charge formation and transport in LDPE have been studied by other researchers [76,77].
Furthermore, the addition of lyophobic components (e.g., light crude oil) to the binding environment also positively influences the adsorption behavior of MPPs. The enhanced adsorption of MPPs onto the bio-substrate via the addition of a lyophobic additive to the binding environment increases the hydrophobicity of the bio-substrate by forming a uniform layer of oil on the bio-substrate surface, which increases its hydrophobicity. As the hydrophobicity of the absorbents increases, its adsorption capacity increases toward hydrophobic components [4]. According to the literature [78], the addition of light oil causes the “pre-paving” of the substrate, which increases its interaction with hydrophobic components. Previous work observed that hydrophobization of the surface of porous aerated concrete using oleic and stearic acid significantly increased the sorption capacity of the adsorbent for dispersed oil [79]. In our previous work [43], we also demonstrated that the addition of heavy crude oil to the binding environment drastically enhanced the rate of adsorption of MPPs onto the hydrophobic surface of the bio-substrate. However, in this study, it is difficult to quantify the independent effect of adding electrolytes and lyophobic additives to the binding environment on the adsorption of MPPs, because we did not conduct independent experimental runs by adding only electrolytes and/or only the lyophobic component to the binding environment.

4.3. Isotherm Adsorption Curve

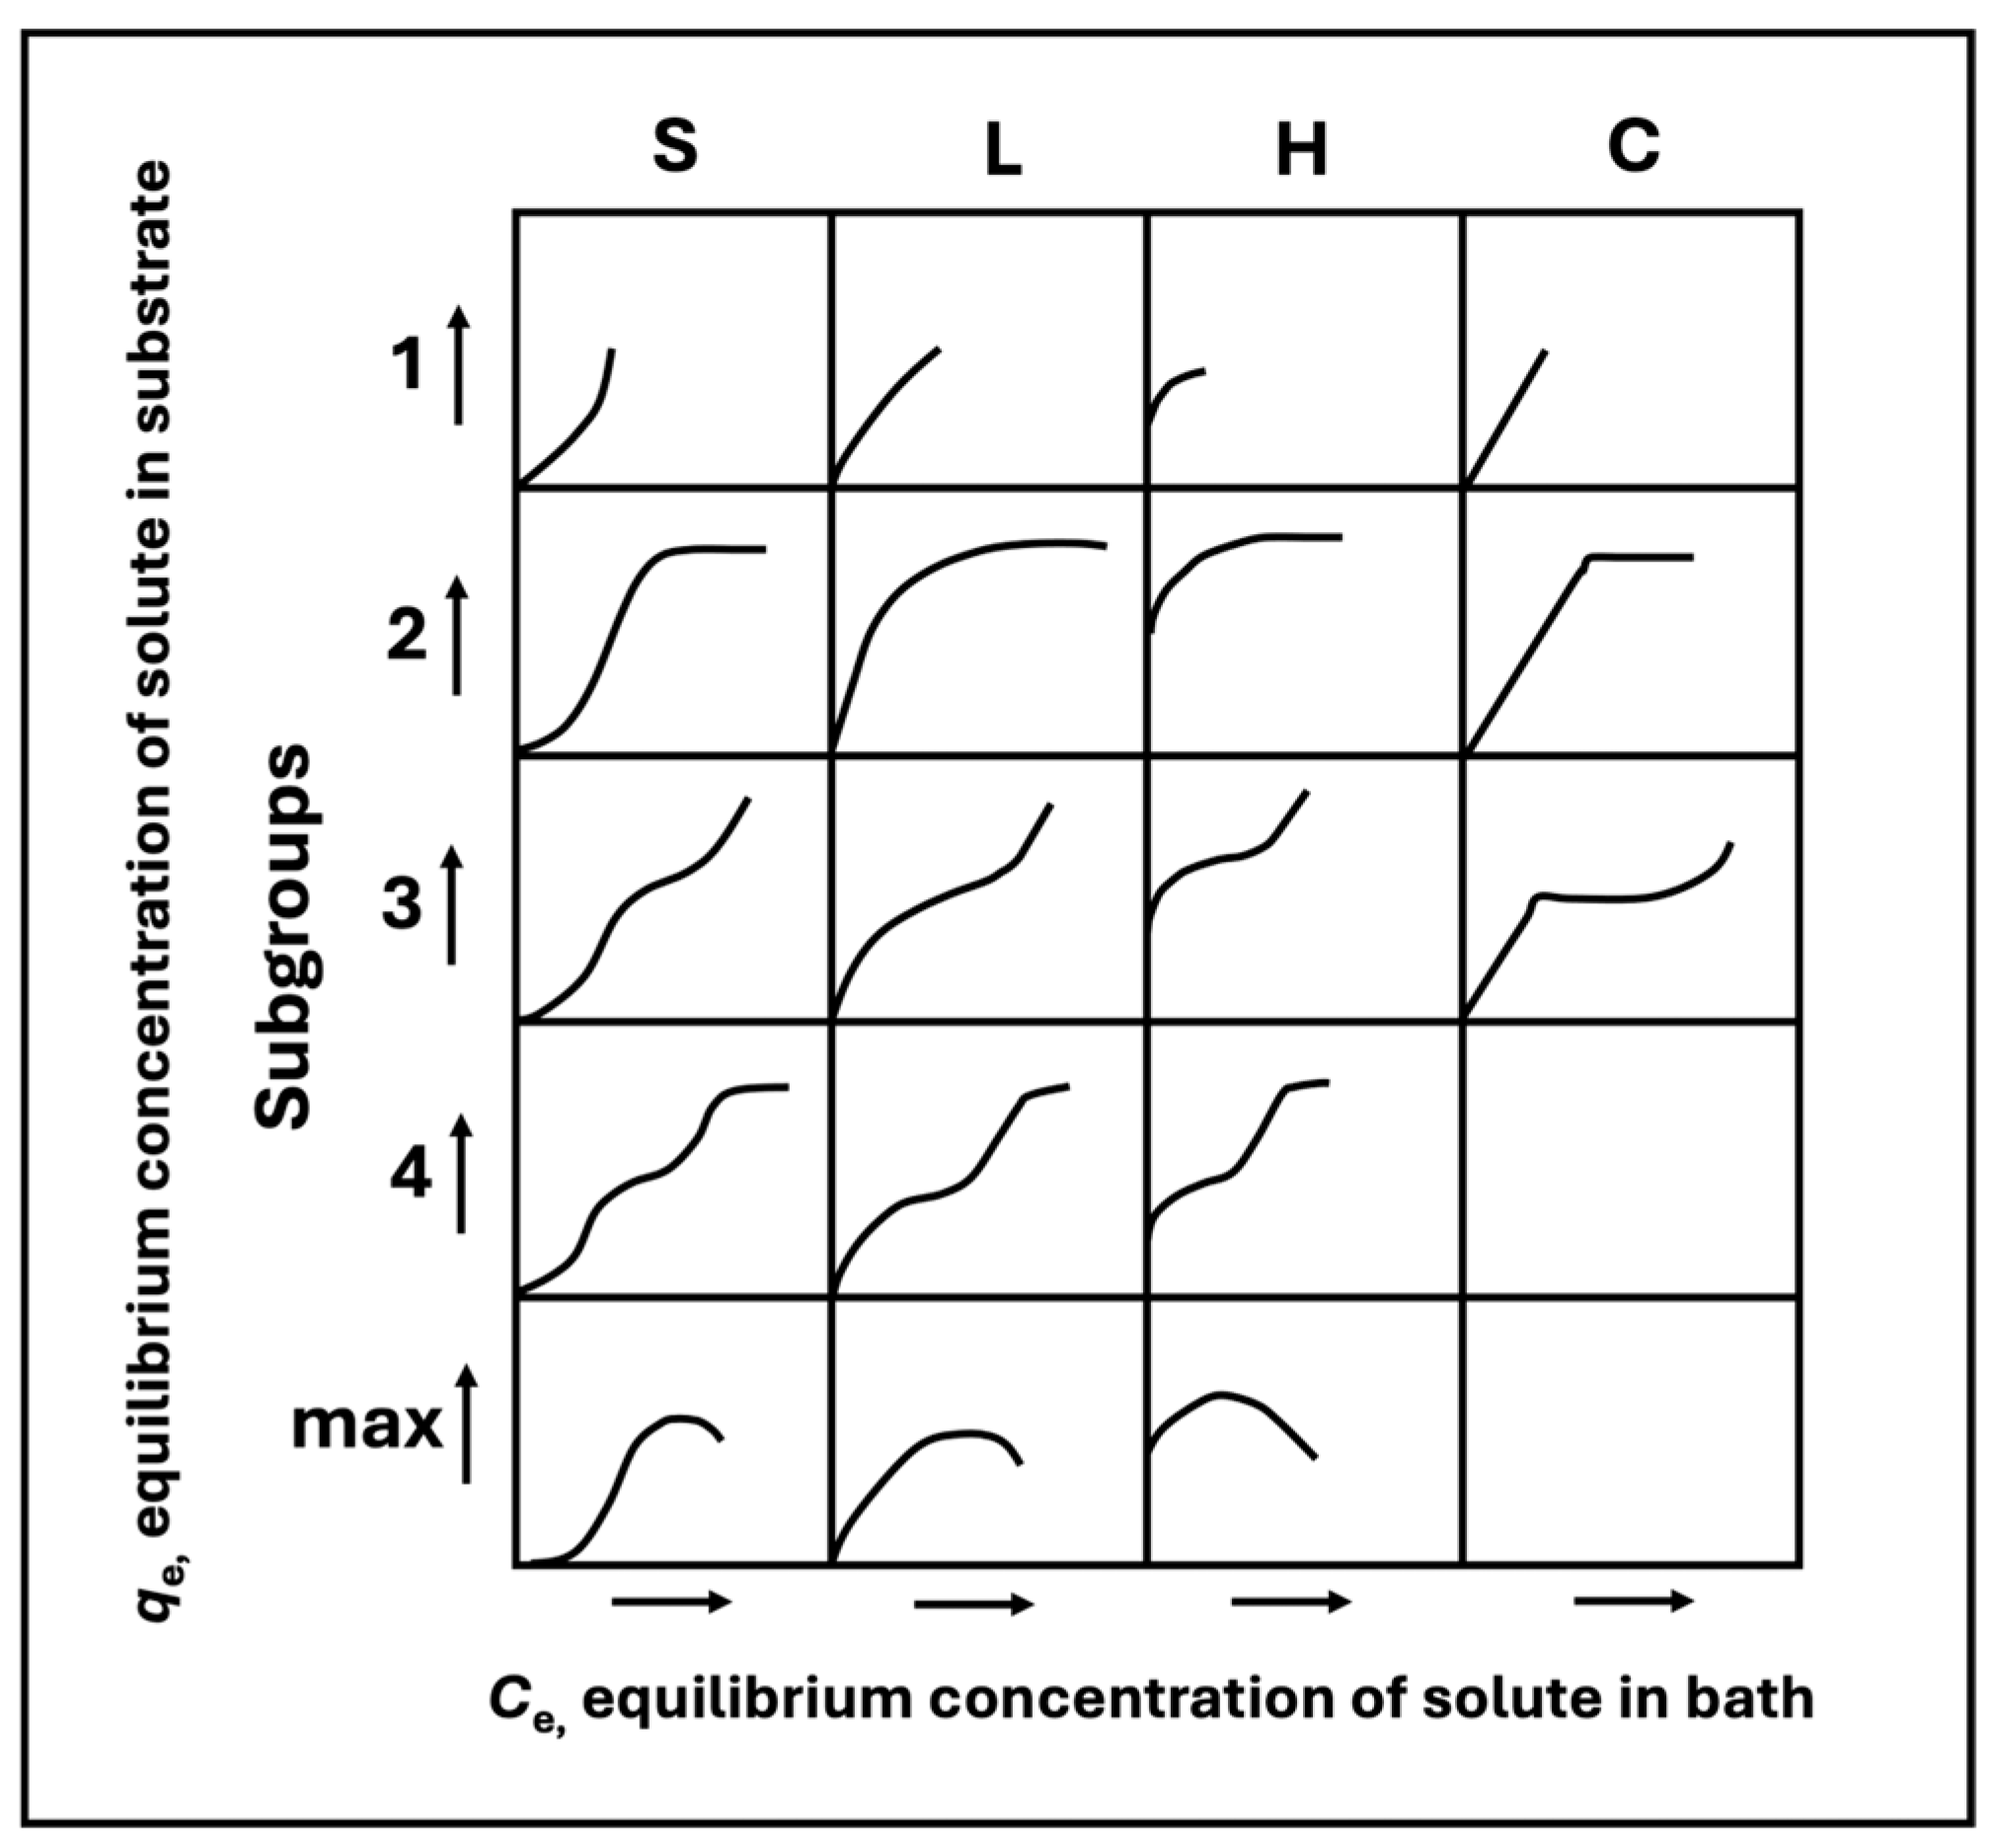
In this study, the D–R adsorption isotherm curves seem to follow the class C isotherm in Figure 20 [80,81]. The linear isotherm “is consistent with conditions in which the number of sites (not necessarily of equal energy [heterogenous adsorbents]) remain constant throughout the whole range of solute concentration up to the saturation of the substrate” [80]. However, in this work, the adsorption isotherms do not reach a plateau, indicating incomplete saturation of the adsorbent surface, possibly due to adsorbate steric effects. Consequently, the adsorption isotherm is class C subgroup 1 [81]. According to the literature [80], the adsorption dynamics for this class of isotherm “consider the model as an adsorbing surface with an area which expands by opening-up or disentangling [the fibers network] of the structure. We may then assume that the rate of adsorption is independent of the available area of substrate at any given time, because each molecule as it becomes adsorbed can readily generate a new vacant site; it is therefore dependent only on the concentration of cA of the solute A in the solution in contact with it”. This process will continue until a horizontal plateau is reached, which “indicates saturation of all the internal area of substrate which can be opened up by the solute” that would correspond to class C, subgroup 2, in Figure 20. Isotherms in class C are common for “(a) a [heterogenous] porous substrate with flexible molecules, and a solute with (b) higher affinity for the substrate than [for] the solvent, and with (c) better penetrating power, by virtue of condition (b)” [81]. In other words, a class C subgroup 1 isotherm indicates “constant partition of the substance [MPPs] between the surface layer and the bulk phase” [82].
As earlier indicated, in this work, all the isotherm curves seem to follow the adsorption mechanism described for a class C-curve subgroup 1 aside from the adsorption isotherm curves of LDPE MPPs in SPW as the binding environment. The LDPE MPP isotherm curves appear to follow the adsorption mechanisms associated with an isotherm in class S subgroup 1 (Figure 20). The adsorption dynamics of a S isotherm curve indicates that “adsorption becomes easier as concentrations increases” [81]. The S-curve isotherm is common for “a monofunctional solute molecule with moderate intermolecular attraction, causing it to pack vertically [vertical or possible inclined] in regular array in the adsorbed layer…Sometimes, high salt concentration promotes S-curve formation” [81,82]. As previously discussed, the distinctive effect of electrolytes on the adsorption performance of LDPE MPPs is probably related to the adsorption mechanism attributed to the S-curve isotherm class.
The Dubinin–Radushkevich (D–R) model constant β (mol2/J2) determines the shape of the isotherm [19]. In this study, the average value of β for all the isotherms displaying a class C subgroup 1 is β = 5.9 × 10⁻⁹ mol2/J2, while the average β value for the isotherm following a class S subgroup 1 isotherm is β = 1.3 × 10⁻⁸ mol2/J2. These experimental results agree with the reported values in [19], which describe a β value for a S-curve isotherm of one order of magnitude higher than the that of L-shape curve. The C-curve subgroup 1 isotherm appears to be in between the L-curve and S-curve isotherms in subgroup 1 in terms of its behavior (see Figure 20).

5. Conclusions

The adsorption performance of a superhydrophobic and thermally stable (up to 262 °C) bio-substrate toward microplastic particles (MPPs) in aqueous solutions was investigated. Batch adsorption tests were conducted at three temperatures (30 °C, 40 °C, and 50 °C) and in two binding environments (DWT2 and SPW) for 24 h to reach adsorption equilibrium. Several adsorption isotherm models were evaluated, including Langmuir, Freundlich, Temkin, Dubinin–Radushkevich (D–R), Redlich–Peterson (R–P), Toth, and Sips. Non-linear regression and error function analyses indicated that the D–R adsorption isotherm model offered the best fit for the adsorption experimental data. The experimental results indicated that the hydrophobic bio-substrate (cattail fluff) is very effective in adsorbing MPPs of different pristine plastic materials (PP, PVC, PA6, LDPE, HDPE, and their blend) from aqueous systems at different adsorption temperatures and in different binding environments. The effect of binding environment on the adsorption of MPPs was established. Finally, it was observed that the adsorption process was dominated by hydrophobic interactions between the adsorbate/bio-substrate system, therefore following a physisorption process. The majority of the MPPs followed the adsorption dynamics of class C curve subgroup 1.
Overall, 22% higher MPP adsorption was obtained in distilled water compared to industrial wastewater. Nonetheless, the average bio-substrate adsorption capacities in both binding environments were very high, with qe = 3597 mg/g in DWT2 and qe = 2807 mg/g in SPW. The effects of temperature and binding environment on the adsorption of MPPs onto the bio-substrate are a function of the plastic material composition. Adsorption mechanisms of MPPs onto the bio-substrate were discussed in detail, but more research should be conducted using weathered MPPs to establish the effect of weathering conditions on the adsorption capacity of this superhydrophobic bio-substrate. Other plastics could also be investigated, such as acrylonitrile–butadiene styrene (ABS), polyethylene terephthalate (PET), and polystyrene (PS), just to name the most important. Furthermore, more research is justified to evaluate regeneration processes to reuse the spent bio-adsorbent, the adsorption effectiveness of the regenerated bio-substrate, and the mechanical stability of the bio-substrate after several regeneration stages.
Overall, the hydrophobic bio-substrate was highly effective in removing MPPs from aqueous systems, with the added advantages of low cost, sustainability, and scalability for practical applications.

Author Contributions

Conceptualization, L.R.-Z.; methodology, L.R.-Z.; resources, L.R.-Z. and D.R.; investigation, L.R.-Z. and R.R.; data curation, L.R.-Z. and R.R.; formal analysis, L.R.-Z.; validation, L.R.-Z., R.R. and D.R.; writing—original draft preparation, L.R.-Z.; writing—review and editing, L.R.-Z., R.R. and D.R.; supervision, L.R.-Z.; project administration, L.R.-Z.; funding acquisition, L.R.-Z. and D.R. All authors have read and agreed to the published version of the manuscript.

Funding

This research received no external funding.

Data Availability Statement

The data will be made available on request.

Acknowledgments

The authors would like to acknowledge the technical support provided by Omar Ibrahim, undergraduate chemical engineering student at the University of New Brunswick, Fredericton Campus during sample preparation.

Conflicts of Interest

The authors declare no conflicts of interest.

References

  1. Lee, Y.K.; Hur, J. Adsorption of microplastic-derived organic matter onto minerals. Water Res. 2020, 187, 116426. [Google Scholar] [CrossRef] [Scilit] [PubMed]
  2. Liu, P.; Wu, L.; Guo, Y.; Huang, X.; Guo, Z. High crystalline LDHs with strong adsorption properties effectively remove oil and micro-nano plastics. J. Clean. Prod. 2024, 437, 140628. [Google Scholar] [CrossRef] [Scilit]
  3. Ali, F.; Ahmad, F.; Salam, D.A. Adsorption behavior of crude oil hydrocarbons on polyethylene microplastics in batch experiments. Mar. Pollut. Bull. 2025, 215, 117832. [Google Scholar] [CrossRef] [Scilit]
  4. Agboola, O.D.; Benson, N.U. Physisorption and Chemisorption Mechanisms Influencing Micro (Nano) Plastics-Organic Chemical Contaminants Interactions: A Review. Front. Environ. Sci. 2021, 9, 678574. [Google Scholar] [CrossRef] [Scilit]
  5. Zhao, L.; Rong, L.; Xu, J.; Lian, J.; Wang, L.; Sun, H. Sorption of five organic compounds by polar and nonpolar microplastics. Chemosphere 2020, 257, 127206. [Google Scholar] [CrossRef] [Scilit]
  6. Liu, F.; Zhang, D.; Ma, Y.; Jing, M.; Li, G.; Yang, S. Sorption behavior of oxytetracycline on microplastics and the influence of environmental factors in groundwater: Experimental investigation and molecular dynamics simulation. J. Contam. Hydrol. 2025, 269, 104489. [Google Scholar] [CrossRef] [Scilit]
  7. Funari, R.A.; Frescura, L.M.; De Menezes, B.B.; Bastos, A.F.D.M.; Da Rosa, M.B. Adsorption of naphthalene and its derivatives onto high-density polyethylene microplastic: Computational, isotherm, thermodynamic, and kinetic study. Environ. Pollut. 2023, 318, 120919. [Google Scholar] [CrossRef] [Scilit]
  8. Zhang, J.; Zhan, S.; Zhong, L.B.; Wang, X.; Qiu, Z.; Zheng, Y.M. Adsorption of typical natural organic matter on microplastics in aqueous solution: Kinetics, isotherm, influence factors and mechanism. J. Hazard. Mater. 2023, 443, 130130. [Google Scholar] [CrossRef] [Scilit]
  9. Huang, Z.; Bu, J.; Wang, H. Application of two modified kaolin materials in removing micro-plastics from water. J. Mater. Cycles Waste Manag. 2022, 24, 1460–1475. [Google Scholar] [CrossRef] [Scilit]
  10. Wang, B.; Liu, W.; Zhang, M. Application of carbon-based adsorbents in the remediation of micro- and nanoplastics. J. Environ. Manag. 2024, 349, 119522. [Google Scholar] [CrossRef] [Scilit] [PubMed]
  11. Ganesan, M.; Nallathambi, G. Functionalized natural fibre composite filter for the removal of microplastics and heavy metal ions from water. Int. J. Environ. Sci. Technol. 2024, 21, 2747–2764. [Google Scholar] [CrossRef] [Scilit]
  12. Zhang, Y.; Ni, F.; He, J.; Shen, F.; Deng, S.; Tian, D.; Zhang, Y.; Liu, Y.; Chen, C.; Zou, J. Mechanistic insight into different adsorption of norfloxacin on microplastics in simulated natural water and real surface water. Environ. Pollut. 2021, 284, 117537. [Google Scholar] [CrossRef] [Scilit]
  13. Duan, Y.; Sun, S.Y.; Zhao, J.; Yuan, H. Microplastics affect the removal of dye in textile wastewater: Adsorption capacity and its effect on coagulation behavior. Sep. Purif. Technol. 2025, 359, 130505. [Google Scholar] [CrossRef] [Scilit]
  14. Li, J.; Zhou, Y.; Liu, W.; Zhang, M. Molecular dynamics simulation of microplastics adsorption mechanisms on balsa biochar. Sep. Purif. Technol. 2026, 383, 136214. [Google Scholar] [CrossRef] [Scilit]
  15. Laca, A.; Patiño, Y.; Sánchez-Condado, A.; Sol, D.; Laca, A.; Díaz, M. Performance of activated carbon for polypropylene microplastic removal in wastewater. Sustain. Chem. Environ. 2025, 9, 100211. [Google Scholar] [CrossRef] [Scilit]
  16. Bhagat, K.; Barrios, A.C.; Rajwade, K.; Kumar, A.; Oswald, J.; Apul, O.; Perreault, F. Aging of microplastics increases their adsorption affinity towards organic contaminants. Chemosphere 2022, 298, 134238. [Google Scholar] [CrossRef] [Scilit] [PubMed]
  17. Chen, Y.; Kang, K.; Guo, L.; Kang, J.; Qi, H. Facile synthesis of functional holocellulose fibers for removal of micro-/nanoparticles of plastics from wastewater. Chem. Eng. J. 2023, 457, 141251. [Google Scholar] [CrossRef] [Scilit]
  18. Ahmed, H.R.; Kayani, K.F.; Ealias, A.M.; Aziz, K.H.H. A Comprehensive Review of Forty Adsorption Isotherm Models: An In-depth Analysis of Ten Statistical Error Measures. Water Air Soil Pollut. 2025, 236, 346. [Google Scholar] [CrossRef] [Scilit]
  19. Hu, Q.; Lan, R.; He, L.; Liu, H.; Pei, X. A critical review of adsorption isotherm models for aqueous contaminants: Curve characteristics, site energy distribution and common controversies. J. Environ. Manag. 2023, 329, 117104. [Google Scholar] [CrossRef] [Scilit]
  20. Kumar, A.; Sidharth, S.; Kandasubramanian, B. A review on algal biosorbents for heavy metal remediation with different adsorption isotherm models. Environ. Sci. Pollut. Res. 2023, 30, 39474–39493. [Google Scholar] [CrossRef] [Scilit]
  21. Mozaffari Majd, M.; Kordzadeh-Kermani, V.; Ghalandari, V.; Askari, A.; Sillanpää, M. Adsorption isotherm models: A comprehensive and systematic review (2010−2020). Sci. Total Environ. 2022, 812, 151334. [Google Scholar] [CrossRef] [Scilit]
  22. Wang, J.; Guo, X. Adsorption isotherm models: Classification, physical meaning, application and solving method. Chemosphere 2020, 258, 127279. [Google Scholar] [CrossRef] [Scilit]
  23. Siperstein, F.R.; Avendaño, C.; Ortiz, J.J.; Gil-Villegas, A. Analytic expressions for the isosteric heat of adsorption from adsorption isotherm models and two-dimensional SAFT-VR equation of state. AIChE J. 2021, 67, e17186. [Google Scholar] [CrossRef] [Scilit]
  24. Isiuku, B.O.; Okonkwo, P.C.; Emeagwara, C.D. Batch adsorption isotherm models applied in single and multicomponent adsorption systems—A review. J. Dispers. Sci. Technol. 2021, 42, 1879–1897. [Google Scholar] [CrossRef] [Scilit]
  25. Al-Ghouti, M.A.; Da’ana, D.A. Guidelines for the use and interpretation of adsorption isotherm models: A review. J. Hazard. Mater. 2020, 393, 122383. [Google Scholar] [CrossRef] [Scilit] [PubMed]
  26. Pinto, F.R.; Marcellos, C.F.C.; Manske, C.; Gomes Barreto, A., Jr. Statistical analysis of parameters and adsorption isotherm models. Environ. Sci. Pollut. Res. 2024, 31, 53729–53742. [Google Scholar] [CrossRef] [Scilit]
  27. Salari, A.; Ostad Movahed, S. The effect of temperature on the adsorption of the sodium lignosulphonate (SL) on the surface of the selected plastics as a potential solution for the plastics waste management. Polym. Polym. Compos. 2023, 31, 09673911231181850. [Google Scholar] [CrossRef] [Scilit]
  28. Petkovska, M. Discrimination between adsorption isotherm models based on nonlinear frequency response results. Adsorption 2014, 20, 385–395. [Google Scholar] [CrossRef] [Scilit]
  29. Gescher, K.; Deters, A.M. Typha latifolia L. fruit polysaccharides induce the differentiation and stimulate the proliferation of human keratinocytes in vitro. J. Ethnopharmacol. 2011, 137, 352–358. [Google Scholar] [CrossRef] [Scilit]
  30. Schuck, L. Seeds of a Sustainable Transition? Investigating the Properties of Cattail Seed Hair as Textile Fillings and Their Potential for Peatland Management Shifts in Finland. Master’s Thesis, Aalto University, Aalto, Finland, 2022. [Google Scholar]
  31. Larson, D.J. Cat-tails, Insects and Cows. Blue Jay 2021, 79, 9–15. [Google Scholar] [CrossRef] [Scilit]
  32. Joiner, S. Plant Hybridization Alters Arthropod Community Structure: Patterns of Diversity and Abundance on Parental and Hybrid Cattails. Doctoral Thesis, Cornell University, Ithaca, NY, USA, 2013. [Google Scholar]
  33. Typha latifolia L. Available online: https://journals.kpu.ca/index.php/LCDP/article/view/372/72 (accessed on 2 December 2025).
  34. Banik, H. Selected Properties of Cattail Fibre for Biomedical Applications. Master’s Thesis, University of Manitoba, Winnipeg, MB, Canada, 2022. [Google Scholar]
  35. Mitich, L.M. Common Cattail, Typha latifolia L. Weed Technol. 2000, 14, 446–450. [Google Scholar] [CrossRef] [Scilit]
  36. The Incredibly Usable Cattail. Available online: https://opensiuc.lib.siu.edu/cgi/viewcontent.cgi?article=1418&context=ebl (accessed on 2 December 2025).
  37. Xiao, N.; Zhang, Y.; Xia, H.; Cheng, B.; Zhang, X.; Yang, C. Typha Fluff as a Sustainable Thermal Filling Material: A comparative Study with Down and Polyester Fibre. Text. Leather Rev. 2025, 8, 744–764. [Google Scholar] [CrossRef] [Scilit]
  38. Southern Cattail. Available online: https://plants.usda.gov/DocumentLibrary/plantguide/pdf/cs_tydo.pdf (accessed on 2 December 2025).
  39. Thieret, J.W.; Luken, J.O. The Typhaceae in The Southeastern United States. Harv. Pap. Bot. 1996, 1, 27–56. [Google Scholar]
  40. Hammond-Kaarremaa, L. Threads, twist and fibre: Looking at Coast Salish Textiles. In Proceedings of the Textile Society of America Symposium Proceedings, Vancouver, BC, Canada, 19–23 September 2018. [Google Scholar] [CrossRef] [Scilit]
  41. Stevens, M.L. Ethnoecology of Selected California Wetland Plants. Fremontia 2004, 32, 7–15. [Google Scholar]
  42. Gorbachev, S.; Gorovykh, O.G.; Mani, A.; Dixit, A.; Alzhanov, B.A.; Yan, J. Biotechnological breakthrough to cattail fiber as an ultra-efficient natural oil sorbent. Sci. Rep. 2025, 15, 24688. [Google Scholar] [CrossRef] [Scilit] [PubMed]
  43. Bhagwat, K.P.; Rodrigue, D.; Romero-Zerón, L. Effective Removal of Microplastic Particles from Wastewater Using Hydrophobic Bio-Substrates. Pollutants 2024, 4, 231–250. [Google Scholar] [CrossRef] [Scilit]
  44. Fried, J.R. Polymer Science & Technology, 3rd ed.; Pearson Education, Inc.: Montreal, QC, Canada, 2014; pp. 397–689. [Google Scholar]
  45. Ojha, S.S.; Afshari, M.; Kotek, R.; Gorga, R.E. Morphology of electrospun nylon-6 nanofibers as a function of molecular weight and processing parameters. J. Appl. Polym. Sci. 2008, 108, 308–319. [Google Scholar] [CrossRef] [Scilit]
  46. Pucci, A.; Ruggeri, G.; Moretto, L.; Bronco, S. Effect of the structure of the polymer matrix on the terthiophene chromophore dispersion in dichroic polyethylene films. Polym. Adv. Technol. 2002, 13, 737–743. [Google Scholar] [CrossRef] [Scilit]
  47. Figure 1. Simplified Schematic of the Experimental Procedure. [Created in BioRender. Romero-Zeron, L.]. 2025. Available online: https://BioRender.com/embgznq (accessed on 29 March 2026).
  48. Shen, Q.; Yang, R. Thompson-Tau Outlier Detection Method for Detecting Abnormal Data of Listed Pharmaceutical Companies in China. In Proceedings of the 2015 8th International Symposium on Computational Intelligence and Design, Hangzhou, China, 12–13 December 2015; pp. 379–382. [Google Scholar] [CrossRef] [Scilit]
  49. Chu, K.H. Revisiting the Temkin Isotherm: Dimensional Inconsistency and Approximate Forms. Ind. Eng. Chem. Res. 2021, 60, 13140–13147. [Google Scholar] [CrossRef] [Scilit]
  50. Mudhoo, A. Unveiling new insights: Revised Temkin adsorption isotherm parameters from fresh curve fits in adsorption studies. Chem. Eng. Sci. 2025, 311, 121585. [Google Scholar] [CrossRef] [Scilit]
  51. Do, D.D. Adsorption Analysis: Equilibria and Kinetics: (With CD Containing Computer Matlab Programs); Imperial College Press and World Scientific Publishing CO.: London, UK, 1998; Volume 2, p. 111. [Google Scholar] [CrossRef]
  52. Ma, M.; Hill, R.M. Superhydrophobic surfaces. Curr. Opin. Colloid Interface Sci. 2006, 11, 193–202. [Google Scholar] [CrossRef] [Scilit]
  53. Cao, S.; Dong, T.; Xu, G.; Wang, F. Study on structure and wetting characteristic of cattail fibers as natural materials for oil sorption. Environ. Technol. 2026, 37, 3193–3199. [Google Scholar] [CrossRef] [Scilit]
  54. Al-Hakkak, J.S.; Barbooti, M.M. Thermogravimetric study on typha (Typha angustifolia L.). J. Therm. Anal. 1989, 35, 815–821. [Google Scholar] [CrossRef] [Scilit]
  55. Xiao, Y.; Xiao, Y.; Hao, J.; Wu, X.; Liu, T.; Zhang, H.; Tang, N.; Wang, X. Facile synthesis of curly conductive polyaniline composite fibers using cattail fluff as substrate. Polym. Bull. 2020, 77, 3101–3109. [Google Scholar] [CrossRef] [Scilit]
  56. Pereira Junio, R.F.; L. De Mendonça Neuba, L.; Souza, A.T.; Pereira, A.C.; Cassiano Nascimento, L.F.; Monteiro, S.N. Thermochemical and structural characterization of promising carnauba novel leaf fiber (Copernicia prunifera). J. Mater. Res. Technol. 2022, 18, 4714–4723. [Google Scholar] [CrossRef] [Scilit]
  57. Nanda, J.; Das, S.N.; Mohapatra, A. Compressive Characterization of Date Palm Leaf Fiber. J. Nat. Fibers 2022, 19, 9813–9826. [Google Scholar] [CrossRef] [Scilit]
  58. Coates, J. Interpretation of Infrared Spectra, A Practical Approach. In Encyclopedia of Analytical Chemistry, 1st ed.; Meyers, R.A., Ed.; Wiley: Hoboken, NJ, USA, 2000. [Google Scholar] [CrossRef] [Scilit]
  59. Smith, B.C. Infrared Spectroscopy of Polymers, XI: Introduction to Organic Nitrogen Polymers. Spectroscopy 2023, 38, 14–18. [Google Scholar] [CrossRef] [Scilit]
  60. Barbeş, L.; Rădulescu, C.; Stihi, C. ATR-FTIR spectrometry characterization of polymeric materials. Rom. Rep. Phys. 2014, 66, 765–777. [Google Scholar]
  61. Klempová, S.; Oravec, M.; Vizárová, K. Analysis of thermally and UV–Vis aged plasticized PVC using UV–Vis, ATR-FTIR and Raman spectroscopy. Spectrochim. Acta A Mol. Biomol. Spectrosc. 2023, 294, 122541. [Google Scholar] [CrossRef] [Scilit]
  62. Gulmine, J.V.; Janissek, P.R.; Heise, H.M.; Akcelrud, L. Polyethylene characterization by FTIR. Polym. Test. 2002, 21, 557–563. [Google Scholar] [CrossRef] [Scilit]
  63. Inglezakis, V.J.; Zorpas, A.A. Heat of adsorption, adsorption energy and activation energy in adsorption and ion exchange systems. Desalination Water Treat. 2012, 39, 149–157. [Google Scholar] [CrossRef] [Scilit]
  64. Surface Energy: Formula and Definition. Available online: https://www.ossila.com/pages/a-guide-to-surface-energy#:~:text=Generally%2C%20a%20surface%20with%20a,of%20interacting%20with%20the%20surface (accessed on 22 January 2026).
  65. Sun, Q.; Fu, Y.; Wang, W. Temperature effects on hydrophobic interactions: Implications for protein unfolding. Chem. Phys. 2022, 559, 111550. [Google Scholar] [CrossRef] [Scilit]
  66. Kauzmann, W. Some Factors in the Interpretation of Protein Denaturation. In Advances in Protein Chemistry; Elsevier: New York, NY, USA, 1959; Volume 14, pp. 1–63. [Google Scholar] [CrossRef] [Scilit]
  67. Meyer, E.E.; Rosenberg, K.J.; Israelachvili, J. Recent progress in understanding hydrophobic interactions. Proc. Natl. Acad. Sci. USA 2006, 103, 15739–15746. [Google Scholar] [CrossRef] [Scilit]
  68. Balsamo, M.; Mistretta, M.C.; Scaffaro, R. Green production of bioinspired reusable PP fluff for true-to-life microplastics removal from water. Sustain. Mater. Technol. 2025, 46, e01679. [Google Scholar] [CrossRef] [Scilit]
  69. Zangi, R.; Hagen, M.; Berne, B.J. Effect of Ions on the Hydrophobic Interaction between Two Plates. J. Am. Chem. Soc. 2007, 129, 4678–4686. [Google Scholar] [CrossRef] [Scilit]
  70. Al Harraq, A.; Bharti, B. Microplastics through the Lens of Colloid Science. ACS Environ. Au 2022, 2, 3–10. [Google Scholar] [CrossRef] [Scilit]
  71. Li, S.; Yang, M.; Wang, H.; Jiang, Y. Adsorption of microplastics on aquifer media: Effects of the action time, initial concentration, ionic strength, ionic types and dissolved organic matter. Environ. Pollut. 2022, 308, 119482. [Google Scholar] [CrossRef] [Scilit]
  72. Chiou, C.C.T.; Manes, M. Application of the Polanyi adsorption potential theory to adsorption from solution on activated carbon. IV. Steric factors, as illustrated by the adsorption of planar and octahedral metal acetylacetonates. J. Phys. Chem. 1973, 77, 809–813. [Google Scholar] [CrossRef] [Scilit]
  73. Green, M. Adsorption of Mixed Liquids and Solids from Water Solution onto Activated Carbon. Ph.D. Dissertation, Kent State University, Kent, OH, USA, 1981. [Google Scholar]
  74. Beneš, P.; Paulenová, M. Surface charge and adsorption properties of polyethylene in aqueous solutions of inorganic electrolytes: II. Radiochemical investigation. Colloid Polym. Sci. 1974, 252, 472–477. [Google Scholar] [CrossRef] [Scilit]
  75. Beneš, P.; Paulenová, M. Surface charge and adsorption properties of polyethylene in aqueous solutions of inorganic electrolytes: I. Streaming potential measurement. Kolloid-Z. Z. Polym. 1973, 251, 766–771. [Google Scholar] [CrossRef] [Scilit]
  76. Aragoneses, A.; Tamayo, I.; Lebrato, A.; Cañadas, J.C.; Diego, J.A.; Arencón, D.; Belana, J. Effect of humidity in charge formation and transport in LDPE. J. Electrost. 2013, 71, 611–617. [Google Scholar] [CrossRef] [Scilit]
  77. Ziari, Z.; Sahli, S.; Bellel, A. Surface potential decay of low-density polyethylene (LDPE) films under different corona discharge conditions. Moroc. J. Condens. Matter 2010, 12, 218–222. [Google Scholar]
  78. Yuan, S.; Yang, X.; Zhang, N.; Zhang, J.; Yuan, S.; Wang, Z. Molecular insights into the adsorption and penetration of oil droplets on hydrophobic membrane in membrane distillation. Water Res. 2024, 253, 121329. [Google Scholar] [CrossRef] [Scilit]
  79. Matsuno, A.; Kawamoto, K. Assessment of Dispersed Oil Sorption in Oily Wastewater onto Hydrophobized/Oleophilized Autoclaved Aerated Concrete (AAC) Grains. Environments 2023, 10, 92. [Google Scholar] [CrossRef] [Scilit]
  80. Giles, C.H.; Smith, D.; Huitson, A. A general treatment and classification of the solute adsorption isotherm. I. Theoretical. J. Colloid Interface Sci. 1974, 47, 755–765. [Google Scholar] [CrossRef] [Scilit]
  81. Giles, C.H.; MacEwans, T.H.; Nakhwa, N.; Smith, D. Studies in Adsorption. Part XI.* A System of Classification of Solution Adsorption Isotherms, and its Use in Diagnosis of Adsorption Mechanisms and in Measurement of Specific Surface Areas of Solids. J. Chem. Soc. 1960, 786, 3973–3993. [Google Scholar] [CrossRef] [Scilit]
  82. Oscik, J. Adsorption; Polish Scientific Publishers: Warszawa, Poland, 1982. [Google Scholar]
Figure 1. Overview of the experimental procedure [47].
Pollutants 06 00020 g001
Figure 2. (a) Mature cattail fruit, (b) cattail fluff, (c) picture of a drop of water (e.g., DWT2) over the surface of fibers during contact angle measurement, (d) cattail fluff in contact with water (e.g., DWT2), and (e) cattail fluff submerged in a blend of kerosene and light crude oil.
Pollutants 06 00020 g002
Figure 3. Thermogravimetric analysis of cattail fluff.
Pollutants 06 00020 g003
Figure 4. FTIR analysis of the plastic microparticles studied: (a) PP, (b) PVC, (c) PA6, (d) LDPE, and (e) HDPE.
Pollutants 06 00020 g004
Figure 5. Effect of temperature on the adsorption capacity of PP MPPs onto the bio-substrate surface in different binding environments: (a) DWT2 and (b) SPW.
Pollutants 06 00020 g005
Figure 6. Effect of binding environment and temperature on the adsorption of PP MPPs onto the bio-substrate surface: (a) 30 °C, (b) 40 °C, and (c) 50 °C.
Pollutants 06 00020 g006
Figure 7. Effect of temperature on the adsorption capacity of PVC MPPs onto the bio-substrate surface for different binding environments: (a) DWT2 and (b) SPW.
Pollutants 06 00020 g007
Figure 8. Effect of binding environment and temperature on the adsorption of PVC MPPs onto the bio-substrate surface at (a) 30 °C, (b) 40 °C, and (c) 50 °C.
Pollutants 06 00020 g008
Figure 9. Effect of temperature on the adsorption capacity of PA6 MPPs on the bio-substrate surface and binding environments: (a) DWT2 and (b) SPW.
Pollutants 06 00020 g009
Figure 10. Effect of binding environment and temperature on the adsorption of PA6 MPPs onto the bio-substrate surface at (a) 30 °C, (b) 40 °C, and (c) 50 °C.
Pollutants 06 00020 g010
Figure 11. Effect of temperature on the capacity of LDPE MPPs’ adsorption onto the bio-substrate surface. Binding environments: (a) DWT2 and (b) SPW.
Pollutants 06 00020 g011
Figure 12. Effect of binding environment and temperature on the adsorption of LDPE MPPs on the bio-substrate surface at (a) 30 °C, (b) 40 °C, and (c) 50 °C.
Pollutants 06 00020 g012
Figure 13. Effect of temperature on the adsorption capacity of HDPE MPPs on the bio-substrate surface and binding environments: (a) DWT2 and (b) SPW.
Pollutants 06 00020 g013
Figure 14. Effect of binding environment and temperature on the adsorption of HDPE MPPs on the bio-substrate surface at (a) 30 °C, (b) 40 °C, and (c) 50 °C.
Pollutants 06 00020 g014
Figure 15. Effect of temperature on the adsorption capacity of M5Poly MPPs on the bio-substrate and binding environment: (a) DWT2 and (b) SPW.
Pollutants 06 00020 g015
Figure 16. Effect of binding environment and temperature on the adsorption of M5Poly MPPs on the bio-substrate surface: (a) 30 °C, (b) 40 °C, and (c) 50 °C.
Pollutants 06 00020 g016
Figure 17. qe [mg/g] as a function of temperature for Ce = 4500 mg/L: (a) PP, (b) PVC, (c) PA6, (d) LDPE, (e) HDPE, and (f) M5Poly MPPs.
Pollutants 06 00020 g017
Figure 18. FTIR spectra of samples before and after adsorption. (a) Bio-substrate before adsorption, (b) PP MPPs before adsorption, (c) bio-substrate/PP MPPs after adsorption at 30 °C, (d) bio-substrate/PP MPPs after adsorption at 40 °C, and (e) bio-substrate/PP MPPs after adsorption at 50 °C.
Pollutants 06 00020 g018
Figure 19. Stacked FTIR spectra of samples before and after adsorption.
Pollutants 06 00020 g019
Figure 20. System of isotherm classification: class S, class L (Langmuir type), class H (high adsorption affinity), and class C (constant partition of the substance between the surface layer and the bulk phase). Within a particular classes, subgroups 1, 2, 3, 4, and max (revealing a maximum) are distinguished by the shape of the isotherms at a higher concentration [81,82]. (Adapted from [81] with permission).
Pollutants 06 00020 g020
Table 1. Microplastic particles (MPPs), weight average diameter, contact angle, and average molecular weight.
Plastic
Material
Weight Average
Diameter [μm]
Contact Angle
[°]
Average Molecular Weight [g/mol]
PP284111.1 ± 4.230,000 [44]
PVC127121.0 ± 0.987,500 [44]
PA629868.5 ± 5.547,667 [45]
LDPE292102.5 ± 2.423,000 [44]
HDPE299104.1 ± 1.9145,000 [46]
Table 2. Composition of the synthetically produced water (SPW).
SaltsContent (wt.%)
NaCl1.72
MgCl20.04
CaCl20.33
Na2SO40.01
Water97.9
Total100
Table 3. Experimental matrix: batch adsorption tests conducted in triplicate.
Binding Environment: DWT2 or SPW
Adsorption Time: 24 h
MPPs
Solution
[mg/L]
T = 30 °CT = 40 °CT = 50 °C
MPPs
Materials
1000
2000
3000
4000
5000
6000
7000
8000
9000
10,000
Table 5. Adsorption of PP onto a bio-substrate. Non-linear fitting of isotherm adsorption models (Table 4) at three temperatures and in two binding environments.
Binding Environment: DWT2
Temperature: 30 °C
Adsorption Isotherm ModelsR2R2adjRMSDX2MSE
Langmuir0.940.93582133,289
Freundlich0.870.8411060117,644
Modified Temkin0.940.91582141,985
Dubinin–Radushkevich (D–R)0.940.922.04 × 10−62.2 × 10−174.9 × 10⁻¹¹
Redlich–Peterson (R–P)0.950.92551937,423
Toth0.940.91582141,666
Sips0.960.94481427,771
Temperature: 40 °C
Adsorption Isotherm ModelsR2R2adjRMSDX2MSE
Langmuir0.650.59174192322,083
Freundlich0.840.8211693144,328
Modified Temkin0.970.96481629,928
Dubinin–Radushkevich (D–R)0.810.784.3 × 10−63.8 × 10−62 × 10−10
Redlich–Peterson (R–P)0.940.91754071,658
Toth0.650.51173191385,042
Sips0.810.73128111211,287
Temperature: 50 °C
Adsorption Isotherm ModelsR2R2adjRMSDX2MSE
Langmuir0.880.8610554107,103
Freundlich0.870.8411060117,644
Modified Temkin0.880.8210555134,189
Dubinin–Radushkevich (D–R)0.870.853.5 × 10−61.9 × 10−61.3 × 10−10
Redlich–Peterson (R–P)0.880.8210454133,523
Toth0.880.8210554133,927
Sips0.880.8310353129,005
Binding Environment: SPW
Temperature: 30 °C
Adsorption Isotherm ModelsR2R2adjRMSDX2MSE
Langmuir0.890.87663246,049
Freundlich0.890.87683347,581
Modified Temkin0.900.86622949,898
Dubinin–Radushkevich (D–R)0.890.872.2 × 10−61.1 × 10−65.15 × 10−11
Redlich–Peterson (R–P)0.890.85663255,227
Toth0.890.85663255,227
Sips0.890.85653254,874
Temperature: 40 °C
Adsorption Isotherm ModelsR2R2adjRMSDX2MSE
Langmuir0.880.86835474,178
Freundlich0.950.94532430,009
Modified Temkin0.950.93532436,363
Dubinin–Radushkevich (D–R)0.950.941.8 × 10−68.0 × 10−73.32 × 10−11
Redlich–Peterson (R–P)0.950.93542436,657
Toth0.880.84835387,766
Sips0.950.93532436,108
Temperature: 50 °C
Adsorption Isotherm ModelsR2R2adjRMSDX2MSE
Langmuir0.940.92227.04881
Freundlich0.920.90269.06522
Modified Temkin0.930.90227.06103
Dubinin–Radushkevich (D–R)0.920.918.1 × 10−72.8 × 10−76.48 × 10−12
Redlich–Peterson (R–P)0.940.91227.05930
Toth0.940.91216.05476
Sips0.950.93195.04485
Table 6. D–R model best fit parameters for polypropylene (PP).
Binding Environment: DWT2
Temperature [°C]qmax [mol/g]β [mol2/J2]E [kJ/mol]
301.8 × 10⁻³ ± 2.0 × 10−46.7 × 10−9 ± 2.3 × 10−118.53
401.4 × 10⁻³ ± 2.6 × 10−25.7 × 10−9 ± 4.5 × 10−119.36
501.1 × 10⁻³ ± 2.0 × 10−54.6 × 10−9 ± 3.3 × 10−1110.48
Binding Environment: SPW
Temperature [°C]qmax [mol/g]β [mol2/J2]E [kJ/mol]
301.2 × 10⁻³ ± 5.7 × 10−66.3 × 10−9 ± 9.7 × 10−128.93
407.3 × 10⁻⁴ ± 4.0 × 10−35.7 × 10−9 ± 2.0 × 10−109.40
503.2 × 10⁻⁴ ± 4.3 × 10−65.1 × 10−9 ± 2.5 × 10−119.95
Table 7. Adsorption of PVC onto the bio-substrate. Non-linear fitting of isotherm adsorption models (Table 4) at three temperatures and in two binding environments.
Binding Environment: DWT2
Temperature: 30 °C
Adsorption Isotherm ModelsR2R2adjRMSDX2MSE
Langmuir0.810.75196117321,328
Freundlich0.740.66232165446,793
Modified Temkin0.810.63197117483,633
Dubinin–Radushkevich (D–R)0.760.682.6 × 10−61.8 × 10−65.45 × 10−11
Redlich–Peterson (R–P)0.850.7019074452,289
Toth0.790.58207136537,758
Sips0.990.9848728,913
Temperature: 40 °C
Adsorption Isotherm ModelsR2R2adjRMSDX2MSE
Langmuir0.940.921023894,305
Freundlich0.940.931013791,778
Modified Temkin0.940.9010438128,753
Dubinin–Radushkevich (D–R)0.940.921.2 × 10−64.4 × 10−71.25 × 10−11
Redlich–Peterson (R–P)0.940.8910541133,502
Toth0.940.9010137122,529
Sips0.940.9010237122,791
Temperature: 50 °C
Adsorption Isotherm ModelsR2R2adjRMSDX2MSE
Langmuir0.930.92753260,129
Freundlich0.940.93743058,187
Modified Temkin0.970.96491431,761
Dubinin–Radushkevich (D–R)0.930.919.1 × 10−74.03 × 10−78.81 × 10−12
Redlich–Peterson (R–P)0.940.91743169,354
Toth0.940.91753171,058
Sips0.940.91743070,299
Binding Environment: SPW
Temperature: 30 °C
Adsorption Isotherm ModelsR2R2adjRMSDX2MSE
Langmuir0.950.94571835,017
Freundlich0.960.95521528,747
Modified Temkin0.960.95501432,456
Dubinin–Radushkevich (D–R)0.960.956.2 × 10−71.9 × 10−74.1 × 10−12
Redlich–Peterson (R–P)0.930.90702963,034
Toth0.960.94521534,606
Sips0.960.94521534,740
Temperature: 40 °C
Adsorption Isotherm ModelsR2R2adjRMSDX2MSE
Langmuir0.950.94591934,391
Freundlich0.940.93642039,892
Modified Temkin0.950.93571639,621
Dubinin–Radushkevich (D–R)0.940.936.95 × 10−72.0 × 10−74.7 × 10−12
Redlich–Peterson (R–P)0.950.93601639,705
Toth0.920.89712561,219
Sips0.950.92581640,898
Temperature: 50 °C
Adsorption Isotherm ModelsR2R2adjRMSDX2MSE
Langmuir0.950.94732457,173
Freundlich0.930.92833073,638
Modified Temkin0.950.93722368,194
Dubinin–Radushkevich (D–R)0.940.938.94 × 10−73.0 × 10−78.53 × 10−12
Redlich–Peterson (R–P)0.950.93732468,495
Toth0.930.90863495,543
Sips0.950.93722365,737
Table 8. D–R model best fit parameters for polyvinyl chloride (PVC).
Binding Environment: DWT2
Temperature [°C]qmax [mol/g]β [mol2/J2]E [kJ/mol]
305.5 × 10⁻⁴ ± 8.7 × 10−83.96 × 10−9 ± 2.1 × 10−1311.24
402.5 × 10⁻³ ± 1.4 × 10−76.02 × 10−9 ± 7.6 × 10−149.12
502.6 × 10⁻³ ± 1.1 × 10−76.13 × 10−9 ± 5.5 × 10−149.03
Binding Environment: SPW
Temperature [°C]qmax [mol/g]β [mol2/J2]E [kJ/mol]
307.7 × 10⁻⁴ ± 7.3 × 10−75.2 × 10−9 ± 1.4 × 10−129.84
405.5 × 10⁻⁴ ± 8.2 × 10−84.0 × 10−9 ± 4.8 × 10−1311.16
503.3 × 10⁻⁴ ± 3.9 × 10−122.9 × 10⁻⁹ ± 3.9 × 10−1213.20
Table 9. Adsorption of PA6 on the bio-substrate. Non-linear fitting of isotherm adsorption models (Table 4) at three temperatures and in two binding environments.
Binding Environment: DWT2
Temperature: 30 °C
Adsorption Isotherm ModelsR2R2adjRMSDX2MSE
Langmuir0.920.9114453187,628
Freundlich0.880.8518284298,770
Modified Temkin0.920.8714553251,050
Dubinin–Radushkevich (D–R)0.890.873.6 × 10−61.6 × 10−61.2 × 10−10
Redlich–Peterson (R–P)0.960.9311031145,601
Toth0.950.9211433156,051
Sips0.980.97671254,412
Temperature: 40 °C
Adsorption Isotherm ModelsR2R2adjRMSDX2MSE
Langmuir0.870.85179108314,134
Freundlich0.920.9014774212,674
Modified Temkin0.870.81180107397,580
Dubinin–Radushkevich (D–R)0.910.893.2 × 10−61.7 × 10−69.98 × 10−11
Redlich–Peterson (R–P)0.930.9013359218,075
Toth0.880.8217598373,978
Sips0.910.8714875269,440
Temperature: 50 °C
Adsorption Isotherm ModelsR2R2adjRMSDX2MSE
Langmuir0.950.9411342135,695
Freundlich0.960.9510737123,265
Modified Temkin0.890.8417498387,925
Dubinin–Radushkevich (D–R)0.950.942.4 × 10−68.8 × 10−76.0 × 10−11
Redlich–Peterson (R–P)0.960.9410838148,745
Toth0.950.9311746175,327
Binding Environment: SPW
Temperature: 30 °C
Adsorption Isotherm ModelsR2R2adjRMSDX2MSE
Langmuir0.930.92972792,987
Freundlich0.880.8612948162,296
Modified Temkin0.930.909728117,180
Dubinin–Radushkevich (D–R)0.890.872.6 × 10−69.1 × 10−76.5 × 10−11
Redlich–Peterson (R–P)0.940.919325106,658
Toth0.940.919225104,657
Sips0.970.96611145,577
Temperature: 40 °C
Adsorption Isotherm ModelsR2R2adjRMSDX2MSE
Langmuir0.930.921022693,848
Freundlich0.820.7717173262,946
Modified Temkin0.930.8910226125,436
Dubinin–Radushkevich (D–R)0.840.803.35 × 10−61.3 × 10−61.0 × 10−10
Redlich–Peterson (R–P)0.940.919322104,394
Toth0.950.919321103,200
Sips0.980.9753733,353
Temperature: 50 °C
Adsorption Isotherm ModelsR2R2adjRMSDX2MSE
Langmuir0.990.9947723,732
Freundlich0.990.98561135,700
Modified Temkin0.990.9947828,638
Dubinin–Radushkevich (D–R)0.990.991.1 × 10−62.0 × 10−71.33 × 10−11
Redlich–Peterson (R–P)0.990.9947727,687
Toth0.990.9946727,538
Sips0.990.9947727,968
Table 10. D–R model best fit parameters for PA6.
Binding Environment: DWT2
Temperature [C°]qmax [mol/g]β [mol2/J2]E [kJ/mol]
301.4 × 10⁻³ ± 3.0 × 10−64.4 × 10−9 ± 3.2 × 10−1210.67
406.9 × 10⁻³ ± 1.0 × 10−55.6 × 10−9 ± 6.9 × 10−149.47
508.3 × 10⁻³ ± 9.2 × 10−65.0 × 10−9 ± 1.2 × 10−129.95
Binding Environment: SPW
Temperature [C°]qmax [mol/g]β [mol2/J2]E [kJ/mol]
308.0 × 10⁻⁴ ± 3.6 × 10−63.4 × 10−9 ± 6.0 × 10−1212.18
405.2 × 10⁻⁴ ± 1.1 × 10−62.4 × 10−9 ± 2.4 × 10−1214.34
503.2 × 10⁻³ ± 1.4 × 10−44.4 × 10−9 ± 5.2 × 10−1110.61
Table 11. Adsorption of LDPE onto bio-substrate. Non-linear fitting of isotherm adsorption models (Table 4) at three Temperatures and in two binding environments.
Binding Environment: DWT2
Temperature: 30 °C
Adsorption Isotherm ModelsR2R2adjRMSDX2MSE
Langmuir0.930.91321410,019
Freundlich0.940.9330128571
Modified Temkin0.930.90311311,653
Dubinin–Radushkevich (D–R)0.940.931.2 × 10−64.9 × 10−71.5 × 10−11
Redlich–Peterson (R–P)0.940.9228119720
Toth0.930.89321412,339
Sips0.970.961954501
Temperature: 40 °C
Adsorption Isotherm ModelsR2R2adjRMSDX2MSE
Langmuir0.910.88522424,526
Freundlich0.900.87542626,724
Modified Temkin0.900.84522432,726
Dubinin–Radushkevich (D–R)0.900.882.6 × 10−61.1 × 10−64.7 × 10−11
Redlich–Peterson (R–P)0.910.84522432,702
Toth0.910.84522432,715
Sips0.930.89431722,654
Temperature: 50 °C
Adsorption Isotherm ModelsR2R2adjRMSDX2MSE
Langmuir0.910.8828117689
Freundlich0.910.9027107145
Modified Temkin0.920.8826108413
Dubinin–Radushkevich (D–R)0.910.901.2 × 10−64.5 × 10−71.35 × 10−11
Redlich–Peterson (R–P)0.910.8727108869
Toth0.910.8727108869
Sips0.910.8727108939
Binding Environment: SPW
Temperature: 30 °C
Adsorption Isotherm ModelsR2R2adjRMSDX2MSE
Langmuir0.720.679812294,668
Freundlich0.840.81746154,328
Modified Temkin0.840.77745666,721
Dubinin–Radushkevich (D–R)0.840.813.3 × 10−62.7 × 10−61.0 × 10−10
Redlich–Peterson (R–P)0.850.78725662,784
Toth0.800.70837184,154
Sips0.870.81675054,861
Temperature: 40 °C
Adsorption Isotherm ModelsR2R2adjRMSDX2MSE
Langmuir0.680.58194155313,447
Freundlich0.670.56198158327,729
Modified Temkin0.680.37194155470,560
Dubinin–Radushkevich (D–R)0.880.833.2 × 10−62.4 × 10−65.0 × 10−10
Redlich–Peterson (R–P)0.690.40192152461,553
Toth0.680.37194156470,331
Sips0.730.47178145395,811
Temperature: 50 °C
Adsorption Isotherm ModelsR2R2adjRMSDX2MSE
Langmuir0.760.73121119156,407
Freundlich0.920.90724654,901
Modified Temkin0.970.95451826,422
Dubinin–Radushkevich (D–R)0.920.903.1 × 10−62.0 × 10−61.0 × 10−10
Redlich–Peterson (R–P)0.910.88734767,855
Toth0.770.67121118186,399
Sips0.920.89704563,413
Table 12. D–R model best fit parameters for low-density polyethylene (LDPE).
Binding Environment: DWT2
Temperature [°C]qmax [mol/g]β [mol2/J2]E [kJ/mol]
303.4 × 10⁻³ ± 1.6 × 10−51.0 × 10−8 ± 1.0 × 10−117.0
401.2 × 10⁻³ ± 9.0 × 10−76.8 × 10−9 ± 1.5 × 10−128.6
503.2 × 10⁻⁴ ± 1.1 × 10−45.0 × 10−9 ± 6.7 × 10−1010.0
Binding Environment: SPW
Temperature [°C]qmax [mol/g]β [mol2/J2]E [kJ/mol]
301.2 × 10⁻² ± 3.6 × 10−41.1 × 10−8 ± 5.7 × 10−116.8
405.3 × 10⁻² ± 1.9 × 10−21.3 × 10−8 ± 4.0 × 10−106.3
509.4 × 10⁻² ± 3.7 × 10−21.4 × 10−8 ± 7.5 × 10−105.9
Table 13. Adsorption of HDPE on the bio-substrate. Non-linear fitting of isotherm adsorption models (Table 4) at three temperatures and in two binding environments.
Binding Environment: DWT2
Temperature: 30 °C
Adsorption Isotherm ModelsR2R2adjRMSDX2MSE
Langmuir0.800.7513591163,994
Freundlich0.810.7613491160,639
Modified Temkin0.650.41181162393,577
Dubinin–Radushkevich (D–R)0.810.769.2 × 10−76.3 × 10−77.6 × 10−12
Redlich–Peterson (R–P)0.810.6813491214,165
Toth0.800.6713591217,668
Sips0.820.7012988198,617
Temperature: 40 °C
Adsorption Isotherm ModelsR2R2adjRMSDX2MSE
Langmuir0.890.86743948,654
Freundlich0.900.88693642,821
Modified Temkin0.800.6610173121,326
Dubinin–Radushkevich (D–R)0.900.884.8 × 10−72.5 × 10−72.1 × 10−12
Redlich–Peterson (R–P)0.900.84693657,141
Toth0.890.82733964,173
Sips0.900.84693656,698
Temperature: 50 °C
Adsorption Isotherm ModelsR2R2adjRMSDX2MSE
Langmuir0.860.83462318,870
Freundlich0.880.84502120,579
Modified Temkin0.870.75502231,752
Dubinin–Radushkevich (D–R)0.870.833.5 × 10−71.5 × 10−71.0 × 10−12
Redlich–Peterson (R–P)0.880.75502130,942
Toth0.850.70552837,951
Sips0.830.66593143,031
Binding Environment: SPW
Temperature: 30 °C
Adsorption Isotherm ModelsR2R2adjRMSDX2MSE
Langmuir0.910.90612739,604
Freundlich0.920.91592537,421
Modified Temkin0.930.90572341,073
Dubinin–Radushkevich (D–R)0.910.904.3 × 10−71.8 × 10−71.9 × 10−12
Redlich–Peterson (R–P)0.920.89592545,087
Toth0.910.88612748,286
Sips0.880.83733967,405
Temperature: 40 °C
Adsorption Isotherm ModelsR2R2adjRMSDX2MSE
Langmuir0.710.65122120146,383
Freundlich0.860.83846969,028
Modified Temkin0.900.85704560,810
Dubinin–Radushkevich (D–R)0.980.977.5 × 10−81.0 × 10−84.7 × 10−14
Redlich–Peterson (R–P)0.720.5712068177,519
Toth0.710.56122129182,114
Sips0.880.82786375,479
Temperature: 50 °C
Adsorption Isotherm ModelsR2R2adjRMSDX2MSE
Langmuir0.840.79463219,342
Freundlich0.910.89341910,124
Modified Temkin0.960.932496957
Dubinin–Radushkevich (D–R)0.910.892.4 × 10−71.4 × 10−75.1 × 10−13
Redlich–Peterson (R–P)0.950.9225117599
Toth0.840.73463225,554
Sips0.910.84352114,631
Table 14. D–R model best fit parameters for high-density polyethylene (HDPE).
Binding Environment: DWT2
Temperature [°C]qmax [mol/g]β [mol2/J2]E [kJ/mol]
304.1 × 10⁻³ ± 1.31 × 10−47.8 × 10−9 ± 4.4 × 10−118.0
403.7 × 10⁻³ ± 2.91 × 10−78.4 × 10−9 ± 1.1 × 10−138.0
502.8 × 10⁻⁴ ± 7.21 × 10−55.1 × 10−9 ± 3.4 × 10−109.8
Binding Environment: SPW
Temperature [°C]qmax [mol/g]β [mol2/J2]E [kJ/mol]
301.1 × 10⁻³ ± 1.5 × 10−66.4 × 10−9 ± 1.9 × 10−128.8
401.1 × 10⁻⁴ ± 3.5 × 10−74.4 × 10−9 ± 4.1 × 10−1210.6
502.9 × 10⁻² ± 5.9 × 10−31.2 × 10−8 ± 2.9 × 10−106.3
Table 15. Adsorption of M5Poly on the bio-substrate. Non-linear fitting of isotherm adsorption models (Table 4) at three temperatures and in two binding environments.
Binding Environment: DWT2
Temperature: 30 °C
Adsorption Isotherm ModelsR2R2adjRMSDX2MSE
Langmuir0.910.90683449,499
Freundlich0.930.92592636,771
Modified Temkin0.870.82835088,756
Dubinin-Radushkevich (D–R)0.930.921.3 × 10−66.1 × 10−71.8 × 10−11
Redlich–Peterson (R–P)0.950.93522034,597
Toth0.920.88663156,176
Sips0.940.92552338,907
Temperature: 40 °C
Adsorption Isotherm ModelsR2R2adjRMSDX2MSE
Langmuir0.890.87703652,540
Freundlich0.890.88703651,718
Modified Temkin0.980.9731712,385
Dubinin–Radushkevich (D–R)0.880.861.5 × 10−68.3 × 10−72.6 × 10−11
Redlich–Peterson (R–P)0.900.86673357,507
Toth0.890.85703562,272
Sips0.890.85703662,745
Temperature: 50 °C
Adsorption Isotherm ModelsR2R2adjRMSDX2MSE
Langmuir0.890.88632748,878
Freundlich0.930.95421220,713
Modified Temkin0.940.93461428,565
Dubinin–Radushkevich (D–R)0.950.949.2 × 10−72.6 × 10−79.9 × 10−12
Redlich–Peterson (R–P)0.950.94421224,284
Toth0.860.81743773,229
Sips0.950.94421224,209
Binding Environment: SPW
Temperature: 30 °C
Adsorption Isotherm ModelsR2R2adjRMSDX2MSE
Langmuir0.890.87925297,149
Freundlich0.890.87915296,024
Modified Temkin0.870.839961131,368
Dubinin–Radushkevich (D–R)0.890.871.9 × 10−61.1 × 10−64.3 × 10−11
Redlich–Peterson (R–P)0.890.859132112,073
Toth0.890.859152112,519
Sips0.890.859152112,045
Temperature: 40 °C
Adsorption Isotherm ModelsR2R2adjRMSDX2MSE
Langmuir0.930.91703152,435
Freundlich0.930.92693150,890
Modified Temkin0.980.9739919,343
Dubinin–Radushkevich (D–R)0.920.911.6 × 10−67.5 × 10−72.6 × 10−11
Redlich–Peterson (R–P)0.930.91662956,117
Toth0.930.90693161,107
Sips0.930.90693161,458
Temperature: 50 °C
Adsorption Isotherm ModelsR2R2adjRMSDX2MSE
Langmuir0.980.982446685
Freundlich0.970.9634813,426
Modified Temkin0.980.982447870
Dubinin–Radushkevich (D–R)0.970.976.5 × 10−71.41 × 10−74.8 × 10−12
Redlich–Peterson (R–P)0.980.982447795
Toth0.980.982548114
Sips0.980.98233.817171
Table 16. D–R model best fit parameters for the 5-polymer mix (M5Poly).
Binding Environment: DWT2
Temperature [°C]qmax [mol/g]β [mol2/J2]E [kJ/mol]
301.3 × 10⁻² ± 1.4 × 10−31.0 × 10−8 ± 2.0 × 10−106.9
404.1 × 10⁻³ ± 2.0 × 10−47.8 × 10−9 ± 8.0 × 10−118.0
503.0 × 10⁻⁴ ± 7.3 × 10−93.1 × 10−9 ± 3.6 × 10−1412.6
Binding Environment: SPW
Temperature [°C]qmax [mol/g]β [mol2/J2]E [kJ/mol]
305.3 × 10⁻³ ± 2.4 × 10−48.2 × 10−9 ± 7.6 × 10−117.8
403.9 × 10⁻³ ± 4.6 × 10−47.6 × 10−9 ± 1.9 × 10−108.1
505.8 × 10⁻⁴ ± 1.1 × 10−64.3 × 10−9 ± 2.8 × 10−1210.8
Table 17. Key experimental observations of the MPPs on the bio-substrate surface.
PolymerChemical
Formula
Binding
DWT2
Adsorption (A)
Environment
SPW
Adsorption (A)
Adsorption Strength, E [kJ/mol]
Polypropylene (PP)(CH2-CH(CH3))n
Linear Polymer
A ↑ T ↑
A ↑ Ce
Overall ≫ A
A ↓ T ↑
A ↑ Ce
E ↑ T ↑
DWT2 and SPW
Polyvinylchloride
(PVC)
(C2H3Cl)n
Linear Polymer
A ↓ T ↑
A ↑ Ce
A >> @ 30 °C
A ↑ T ↑
A ↑ Ce
A > @ 50 °C
DTW2
E ↓ T ↑
SPW
E ↑ T ↑
Polyamide 6
(PA6)
-[NH(CH2)5CO]-
Linear Polymer
A ↑ T ↑
A ↑ Ce
Overall ≫ A
A ↑ T ↑
A ↑ Ce
DTW2
E ↓ T ↑
SPW
E ↑ T ↑
Low-Density
Polyethylene
(LDPE)
(C2H4)n
Branched
Polymer
A > @ 40 °C
A ↑ Ce
A > @ 40 °C
A ↑ Ce
Overall ≫ A
DTW2
E ↑ T ↑
SPW
E constant
High-Density
Polyethylene
(HDPE)
(C2H4)n
Linear Polymer
A ↓ T ↑
A ↑@ Ce
Overall ≫ A
A ↓ T ↑
A ↑ Ce
DWT2
>E @ 50 °C SPW
>E @ 40 °C
M5Poly-A ↑ T ↑
A ↑ Ce
A > @ 40 °C
A ↓ T ↑
A ↑ Ce
>A @ 30 °C
E ↑ T ↑
DWT2 & SPW
Disclaimer/Publisher’s Note: The statements, opinions and data contained in all publications are solely those of the individual author(s) and contributor(s) and not of MDPI and/or the editor(s). MDPI and/or the editor(s) disclaim responsibility for any injury to people or property resulting from any ideas, methods, instructions or products referred to in the content.