Abstract
The current work presents a testing machine built from off-the-shelf components to test for conductive yarns’ (or textiles’) durability to repeated bending that can occur during general wear-and-tear or domestic washing procedures. The testing method is explained with an example and results, comparing two different conductive yarns weaved into polyester-based narrow fabric.
1. Introduction
Conductive yarns are an essential part of e-textile (electronic textiles) applications [1,2]. Nevertheless, integrated electronics often create high-stress areas at the electronics encapsulation–textiles transition points. Thus, measuring their ability to withstand repeated bending is essential. Contrary to domestic washing tests, bending tests help to identify the exact moment(s) when the conductive yarns are breaking, thus helping to compare their durability more accurately and in uniform conditions.
This work presents a bending tester that can be assembled from off-the-shelf components together with a testing method to test e-textiles interconnection materials’ durability. The study exemplifying the method includes two different conductive yarns weaved into narrow fabric in six rows with a pitch of 1.27 mm. For testing purposes, a non-functional printed circuit board was encapsulated with a casting material on the narrow fabric creating rigid–soft (encapsulation–textile) transition areas and accumulated stress for the conductive yarns (Figure 1).
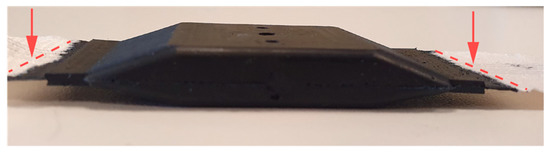
Figure 1.
Final sample encapsulation; red markings highlight the transition/high-stress areas.
2. Materials and Methods
The materials are divided into two categories: testing samples and testing machine. The methods explain the testing process in more detail.
2.1. Samples
The testing samples were based on a narrow fabric weaved in conductive yarns. The yarns were integrated into the narrow fabric in 6 rows, with a pitch of 1.27 mm to create a communication bus for the I2C communication protocol. Two different yarns were tested during this work:
- Multifilament Ni-plated copper yarn consisting of 6 filaments twisted around a polyester core. The twisted filaments were protected by a Teflon coating. The average resistance of the yarn was 0.8 ohm/m and the outer diameter was 0.60 mm.
- Multifilament copper-plated steel yarn consisting of 14 twisted filaments. The filaments were protected by a Teflon coating. The average resistance of the yarn was 0.99 ohm/m and the outer diameter was 0.68 mm.
A CO2 laser was used to create an opening in the yarn for an electrical connection with electronic parts. A rigid PCB (printed circuit board) was glued onto the narrow fabric and connected to the conductive yarns through soldering. The integrated electronics were encapsulated with a polyurethane-based flexible potting compound through the low-pressure injection-molding process. The encapsulation was designed to have a smooth transition from thick to thin. However, the difference in the encapsulation material and the textile flexibility properties created transition points with higher mechanical stress. The final outcome of the sample and the highlighted stress areas are seen in Figure 1.
The conductive-yarn endings on each side were stripped from the Teflon cover. On one side, the conductive-yarn endings were coupled together and soldered to make 3 loops. On the second side, the conductive-yarn endings were soldered on an interposer PCB with female pins (Figure 2).
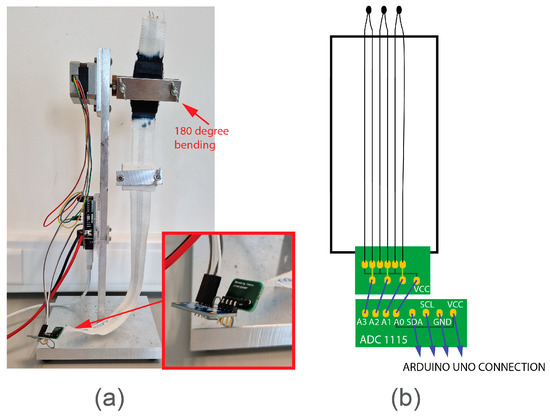
Figure 2.
Testing set-up where the motor is at the top left side where also the 180-degree rotation takes place. (a) Machine set-up highlighting the connection between ADC and sample and where the 180-degree bending takes place. (b) Sample set-up highlighting the connections between interposer board/yarns and interposer board/ADC board.
2.2. Machine
The tester was developed using off-the-shelf components and a specially milled frame (Figure 2). The fixed part of the machine consisted of:
- stepper motor Nema 17;
- Arduino UNO microcontroller together with Motorshield V2 board;
- Adafruit ADC1115 (analogue-to-digital converter) together with male 90-degree pins.
The stepper motor was attached to the top and connected to the Arduino UNO/Motorshield V2 board. The connections between Motorshield and Arduino board did not allow connecting the sample to the microcontroller. Thus, the ADC board was connected in between to read out the data. The male pins on the ADC board allowed connection and disconnection of the sample easily to the machine.
2.3. Testing Method
A sample with a weight clamp was attached from the (black) encapsulated part to the motor and flexed 180 degrees. Since the yarns were coupled together, one ending of the loop received the power input and the other end was used to read the output. During the test, the samples were flexed 180 degrees for 100,000 cycles or until it was observed that at least two yarn loops’ voltage dropped and was not regained for 10 seconds.
The ADC was used to convert digital signals to analogue signals to read every voltage value measured, whether the signal was there or not. If the yarn was damaged in between, the voltage drop would indicate it. Data read-out included: the voltage of the yarns (V), the number of cycles performed, and time (s). The data transmission was read out and saved using PuTTY (an open-source terminal emulator) through the serial port [3]. The data were logged in a CSV file that is easily usable for analysis.
However, resistance rise is often a more desired measurement for failure analysis. Resistance can be measured using Ohm’s law by first defining the current (I).
The original resistance of a yarn (RY) loop was 1.2 Ω. The voltage input was always 5 V and the original voltage output (Vout) was always 4.95 V. Thus, the voltage loss (Vloss) at the start was always 50 mV. Based on that, the current was calculated:
when the resistance of the yarns stays within 10% of the load resistance, the current stays stable and it can be assumed the same. To calculate the load resistance (RL), the following formula can be used:
Thus, if the RY changes over 12 Ω, then the current will also change. When the yarn resistance changes over the 12 Ω during the tests (voltage drops), the resistance should be calculated accordingly:
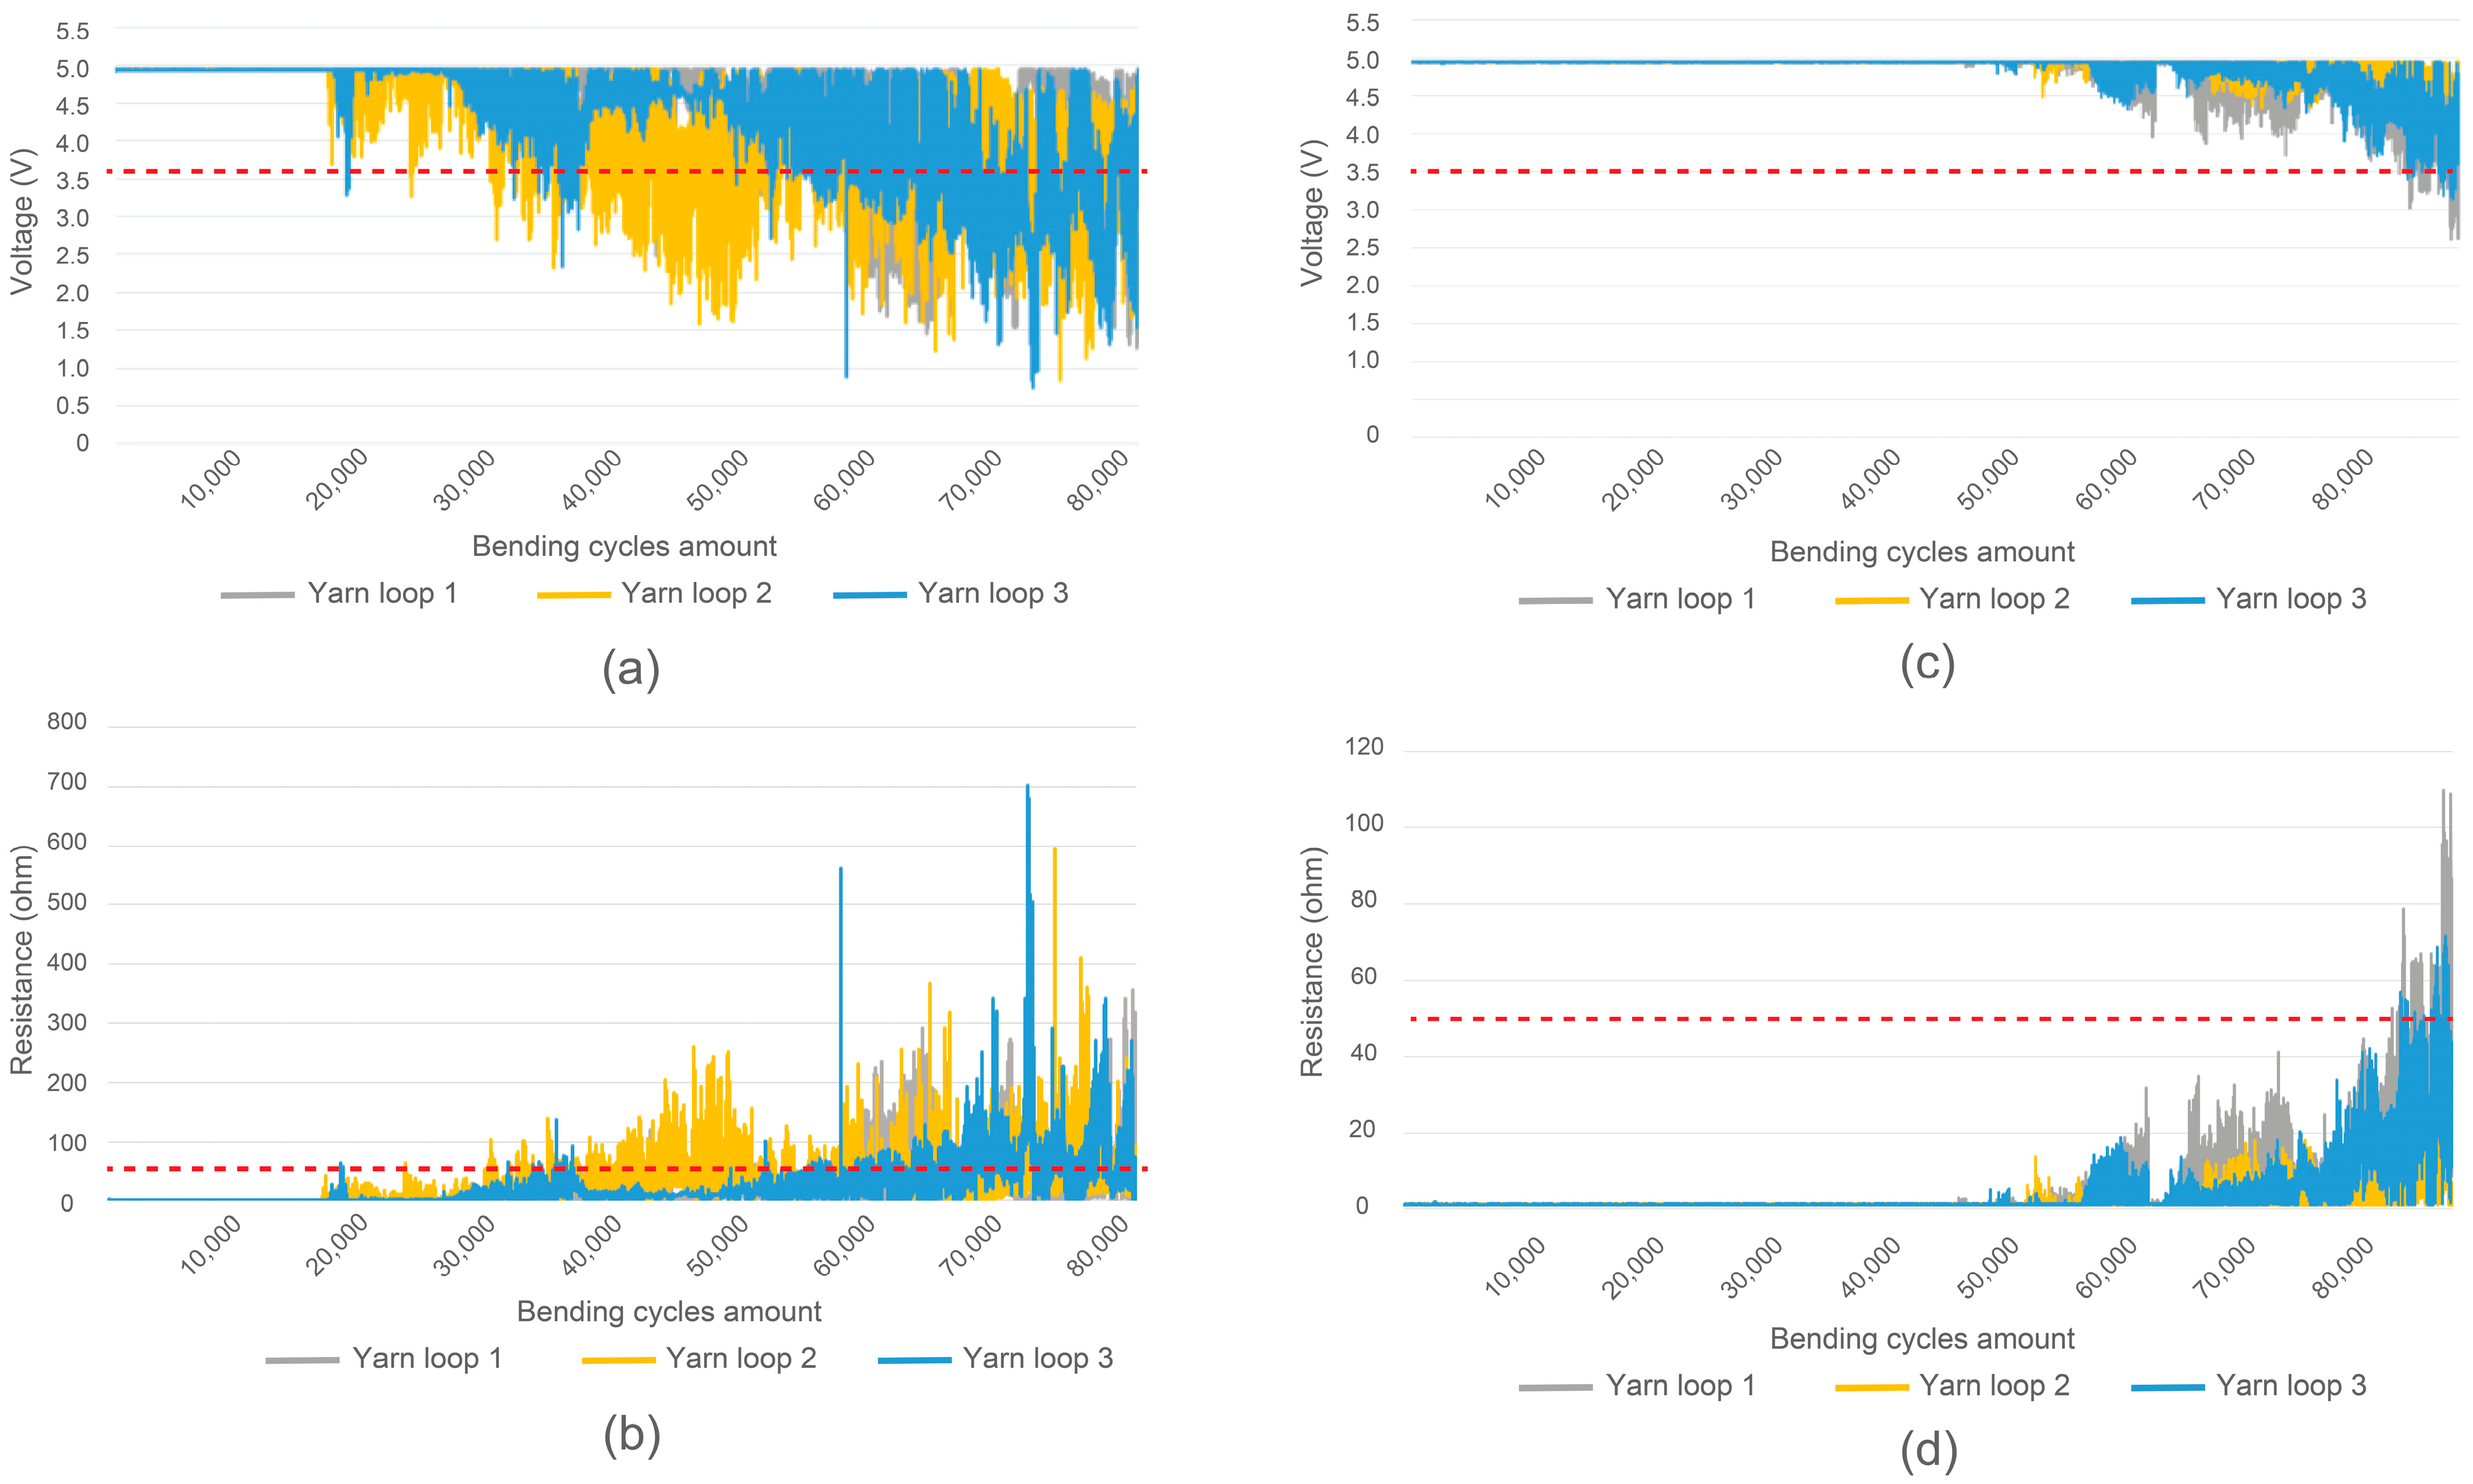
Thus, the resistance of the yarn loops can be also plotted during failure analysis (Figure 3b,d).

Figure 3.
Results with red dotted line highlighting the failure points. (a) Yarn 1 (Ni-plated copper yarn) showing voltage drops. (b) Yarn 1 (Ni-plated copper yarn) showing resistance changes. (c) Yarn 2 (copper-plated steel yarn) showing voltage drops. (d) Yarn 2 (copper-plated steel yarn) showing resistance changes.
3. Results
As mentioned earlier, the samples were flexed 180 degrees for 100,000 cycles or until the voltage dropped in at least two yarn loops for 10 seconds after bending. The failure points were based on the final needs of the application. Voltage under 3.5 V or resistance rise to 50 ohms was considered a failure point. The voltage drops are seen in Figure 3a,c comparing two different conductive yarns during the bending tests.
It was also observed that if more than one yarn was breaking during the tests, the second failure appeared quite fast. Moreover, the copper-plated steel yarn (yarn 2) durability was considerably better than the Ni-plated copper yarn (yarn 1). Voltage drops were smaller and more stable, indicating how steel and a larger quantity of filaments provide much better durability than conductive yarns.
Moreover, the data showed how earlier resistance rises were reduced back to original measurements (Figure 3a,c between 20,000 and 30,000 cycles). The stable connections were lost due to the filaments breaking during the bending tests. However, it was still possible for the yarn to regain some connection with other filaments, which resulted in a regain of voltage output as well. Voltage drops increase in size and persistence when filaments break. It was observed that a yarn with a larger number of filaments (yarn 2) regained the original conductivity more, was more stable, and started to break later. Thus, higher numbers of filaments together with less sensitivity to plastic deformation under bending the base material (steel or copper) support stable connections longer.
4. Conclusions and Future Work
This work introduced a bending tester aimed to determine conductive yarns’ breaking points. The testing method was also explained by bending two different conductive yarns weaved into a narrow fabric. The results show how the two yarns degraded differently and at what exact point they started to degrade. The tool presents an opportunity to test for a proof-of-concept without ordering expensive machines and tests. Future work will include alternative testing features, such as a slower or faster bending cycle or a different weight clamp.
Author Contributions
Conceptualization, P.V., F.T. and F.B.; methodology, P.V. and F.B.; software, P.V. and F.B.; validation, P.V. and F.B.; formal analysis, P.V., F.B. and J.V.; investigation, P.V. and F.B.; resources, P.V. and F.B.; data curation, P.V.; writing—original draft preparation, P.V.; writing—review and editing, P.V., F.T., F.B. and J.V.; visualization, P.V.; supervision, F.B. and J.V. All authors have read and agreed to the published version of the manuscript.
Funding
This research received no external funding.
Institutional Review Board Statement
Not applicable.
Informed Consent Statement
Not applicable.
Data Availability Statement
Data is contained within the article. Please contact the authors for additional information.
Conflicts of Interest
The authors declare no conflict of interest.
References
- De Pasquale, G.; Mura, A. Accelerated lifetime tests on e-textiles: Design and fabrication of multifunctional test bench. J. Ind. Text. 2018, 47, 1925–1943. [Google Scholar] [CrossRef]
- Zaman, S.U.; Tao, X.; Cochrane, C.; Koncar, V. Wash Analyses of Flexible and Wearable Printed Circuits for E-Textiles and Their Prediction of Damages. Electronics 2021, 10, 1362. [Google Scholar]
- Bolton, W. I/O Processing. In Programmable Logic Controllers, 6th ed.; Bolton, W., Ed.; Newnes: Boston, MA, USA, 2015; Chapter 4; pp. 79–113. [Google Scholar] [CrossRef]


Disclaimer/Publisher’s Note: The statements, opinions and data contained in all publications are solely those of the individual author(s) and contributor(s) and not of MDPI and/or the editor(s). MDPI and/or the editor(s) disclaim responsibility for any injury to people or property resulting from any ideas, methods, instructions or products referred to in the content. |
© 2023 by the authors. Licensee MDPI, Basel, Switzerland. This article is an open access article distributed under the terms and conditions of the Creative Commons Attribution (CC BY) license (https://creativecommons.org/licenses/by/4.0/).