Operational Risk Analysis on Gas Distribution Process at PT—Perta Daya Gas Using FMECA Method †
 ,
,
Abstract
1. Introduction
2. Methods
- Risk identification based on the results of observations, interviews, and questionnaires;
- Initial risk assessment based on 3 FMECA parameters and calculating the Risk Priority Number (RPN);
- Criticality level analysis to determine high-priority risks;
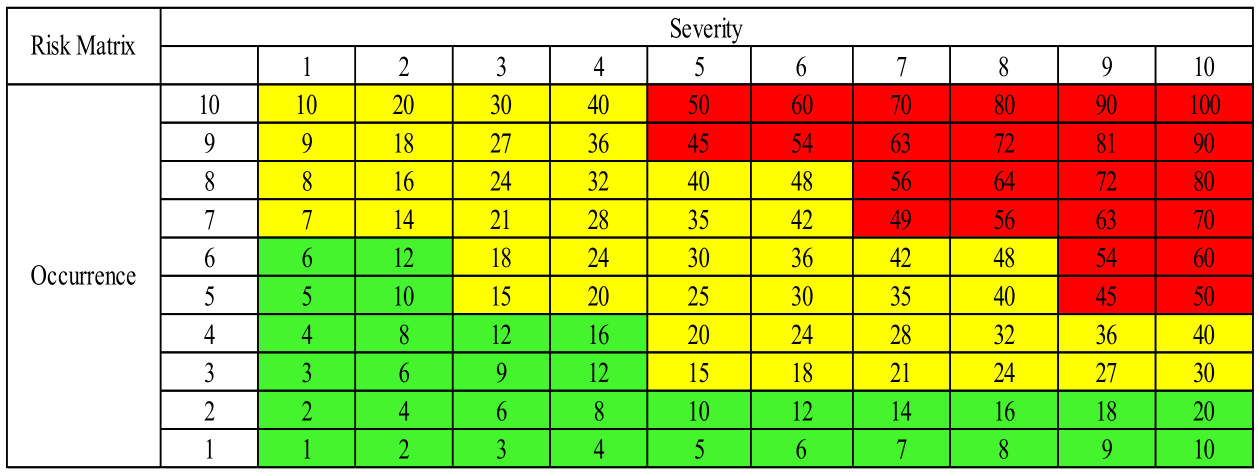
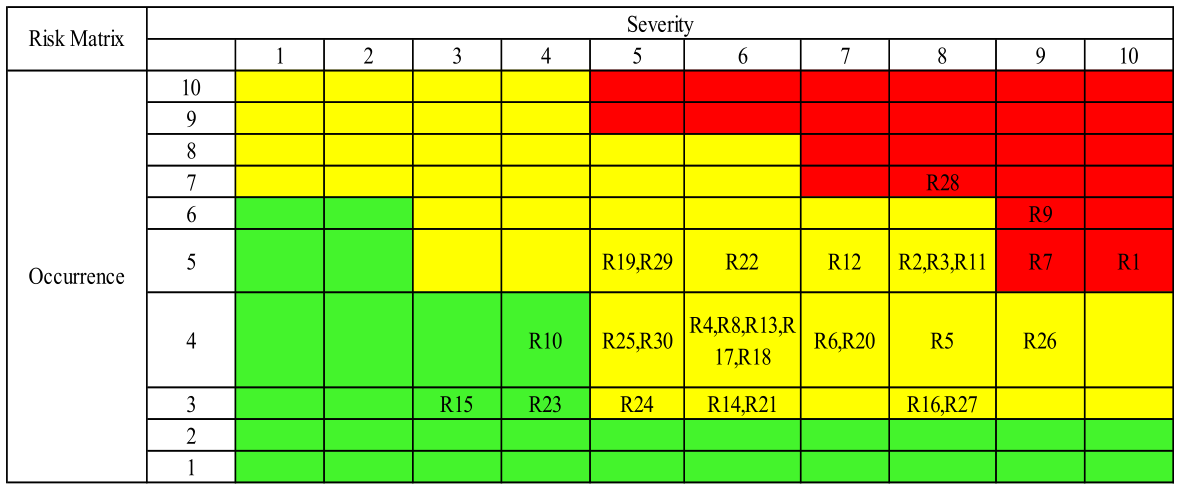
- Risk mapping based on severity and occurrence values;
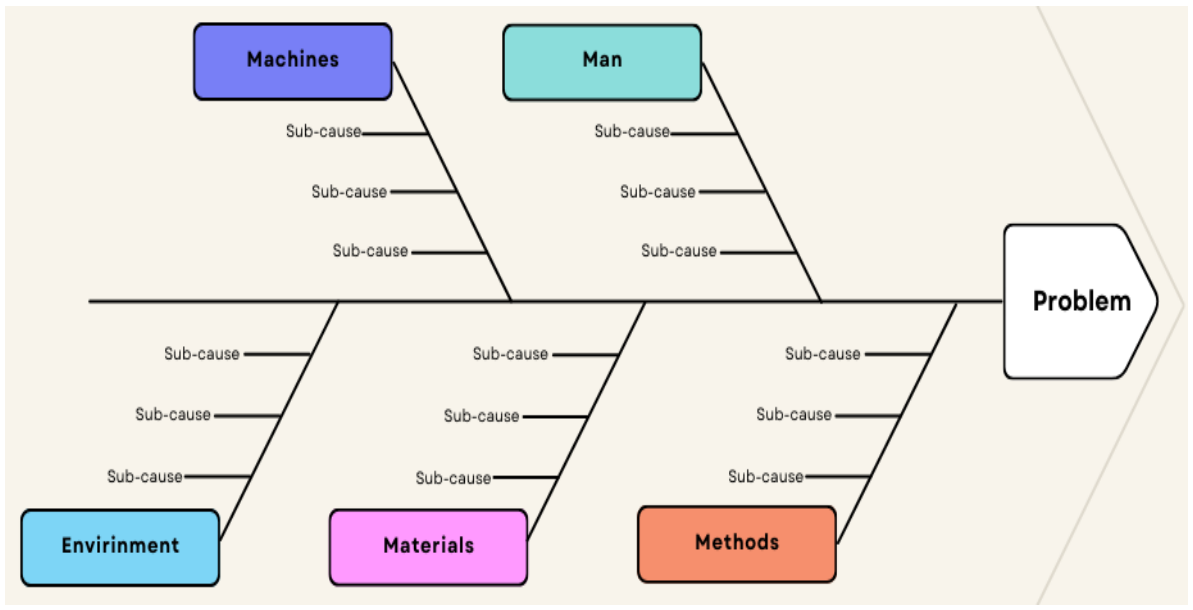
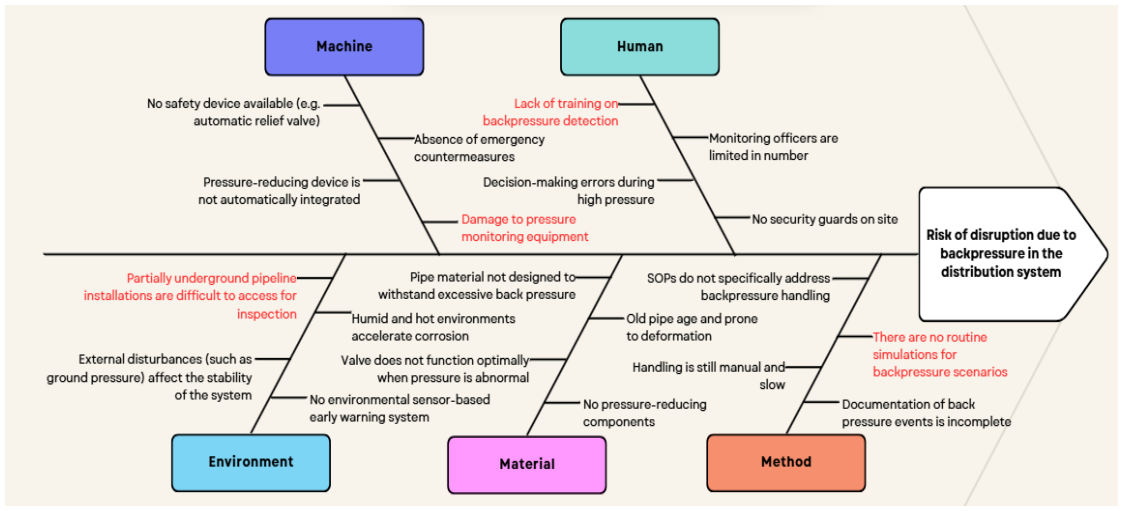
- Root cause analysis using a Fishbone diagram to prioritize risks;
- Recommendations for mitigation actions based on the results of the Fishbone diagram Analysis;
- Reassessment after mitigation is carried out by recalculating the RPN value to determine the percentage of risk reduction and evaluate the effectiveness of mitigation actions that have been implemented. Reassessment is conducted after mitigation measures have been implemented to determine whether the RPN value for the identified risk remains high in terms of severity. This is done because the FMECA method uses the RPN value as the primary factor in assessing risk. The KPIs in question are already included in the FMECA matrix, which is divided into the categories of severity (S), occurrence (O), and detection (D).

| Category | Description | Rating |
|---|---|---|
| Very Fatal | Causing major losses, serious accidents, or halting all operations. | 10 |
| Fatal | Resulting in major damage, serious injury, or disruption of key operations. | 9 |
| Very Serious | Causing significant damage or having a major impact on safety and the environment. | 8 |
| Serious | Causing moderate damage or disruption to critical systems, but still controllable. | 7 |
| Quite Serious | Disrupting some operations, but recoverable without long-term impact. | 6 |
| Moderate | Limited impact, affecting only a small part of the process or system. | 5 |
| Mild | Causing minor disruptions, without damaging the system or posing a hazard. | 4 |
| Very Mild | Very minor impact, not affecting operational smoothness. | 3 |
| Almost None | Impact is barely noticeable, causing no disruptions. | 2 |
| None | No impact at all, not affecting the system or safety. | 1 |
| Category | Description | Rating |
|---|---|---|
| Almost Certain | Very likely to occur in the near future based on current conditions. | 10 |
| Very High | Highly likely to occur if repairs or controls are not carried out immediately. | 9 |
| High | Quite likely to occur in the near future if conditions are left unaddressed. | 8 |
| Somewhat High | Possible to occur in the next 1–2 years if surveillance or maintenance is not improved. | 7 |
| Moderate | Possible, but only under certain conditions or in less controlled situations. | 6 |
| Low | It is unlikely to occur, but still possible if no additional preventive measures are taken. | 5 |
| Very Low | It is very rare, only possible if several abnormal conditions occur simultaneously. | 4 |
| Almost Never | It is highly unlikely to occur, only possible if there is a major failure or an extremely unusual situation. | 3 |
| Never | It is almost impossible to occur under current working and operational conditions. | 2 |
| Did Not Occur | It is impossible to occur because it has been prevented or completely eliminated from the system. | 1 |
| Category | Description | Rating |
|---|---|---|
| Very Difficult to Detect | Almost impossible to detect before failure occurs. | 10 |
| Difficult to Detect | Very unlikely to be detected before it occurs. | 9 |
| Low Probability of Detection | Usually not detected until failure occurs. | 8 |
| Low Detection | Tends not to be detected by normal systems. | 7 |
| Slightly Monitored | May be detected by manual inspection or indirect signs. | 6 |
| Fairly Detectable | May be detected before it occurs, if routine monitoring is performed. | 5 |
| Frequently Detected | Often detected by control systems or field indicators. | 4 |
| Easy to Detect | Generally detected immediately by monitoring devices or standard procedures. | 3 |
| Very Easy to Detect | Very easy to recognize and prevent before it has an impact. | 2 |
| Certainly Detected | Certainly detected before it occurs because it is protected by automatic systems or alarms. | 1 |
| Critically | Risk Acceptance | |
|---|---|---|
| Criticallity Level | Range Score RPN | |
| Very Low | 0–30 | The risk is acceptable without corrective action. |
| Low | 31–60 | The risk is sufficiently controlled, but further monitoring and evaluation are needed. |
| Moderate | 61–180 | The risk is still within reasonable limits without the need for special mitigation measures. |
| High | 181–252 | The risk is serious and requires immediate corrective action to prevent greater impact. |
| Critical | 253–324 | The risk is extremely dangerous and must be addressed immediately to avoid adverse consequences. |
| Very Critical | >324 | The risk is extreme and unacceptable, requiring immediate corrective action to avoid major failure or disaster. |

3. Results and Discussion
3.1. Risk Identification
3.2. Risk Assessment
3.3. Criticality Analysis
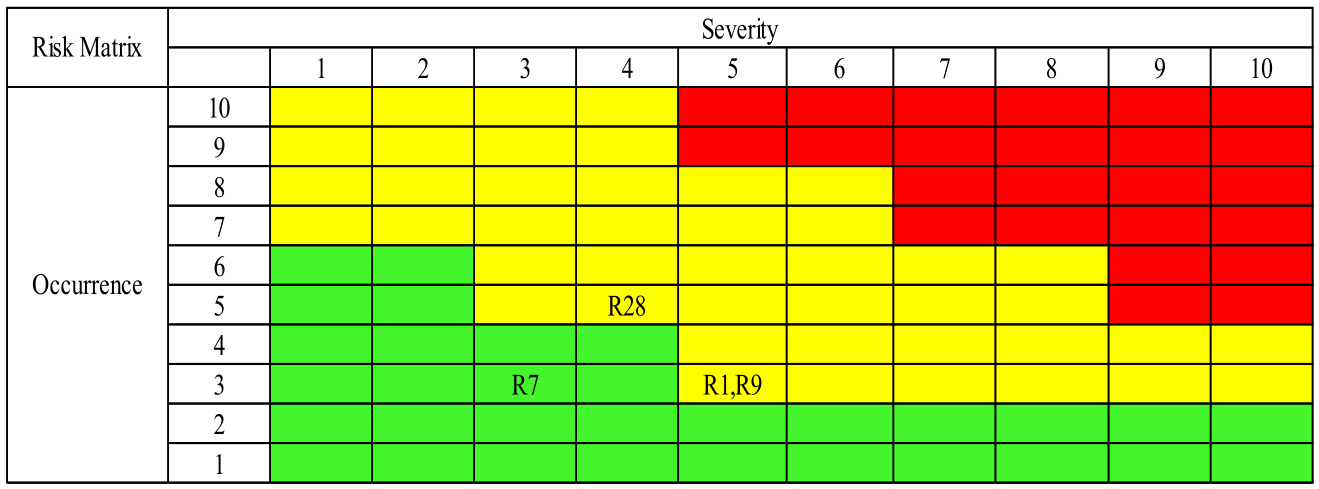
3.4. Risk Map
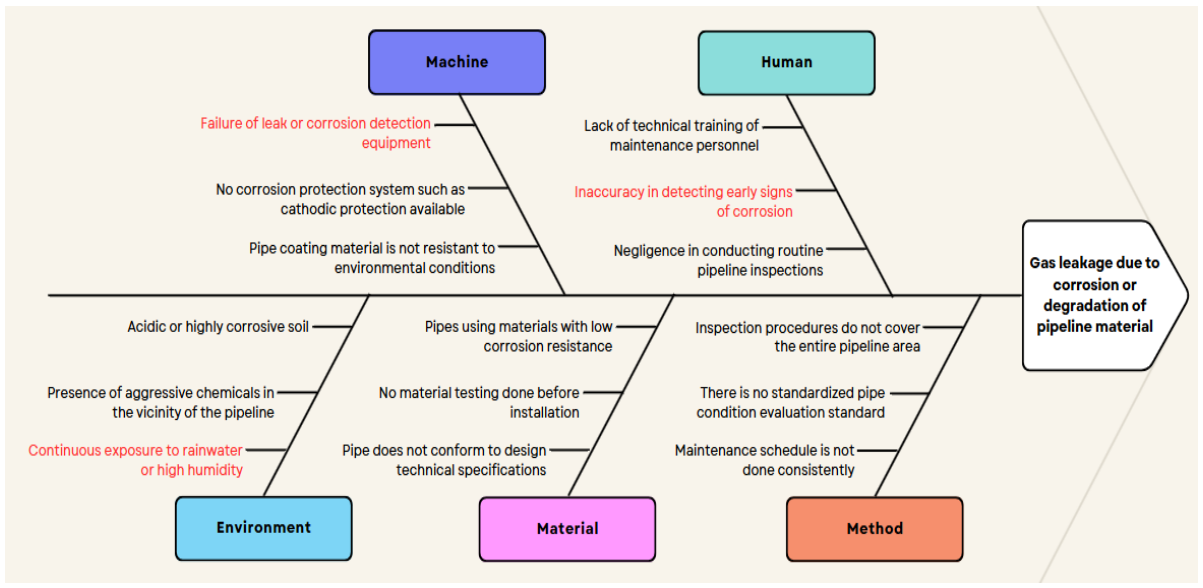
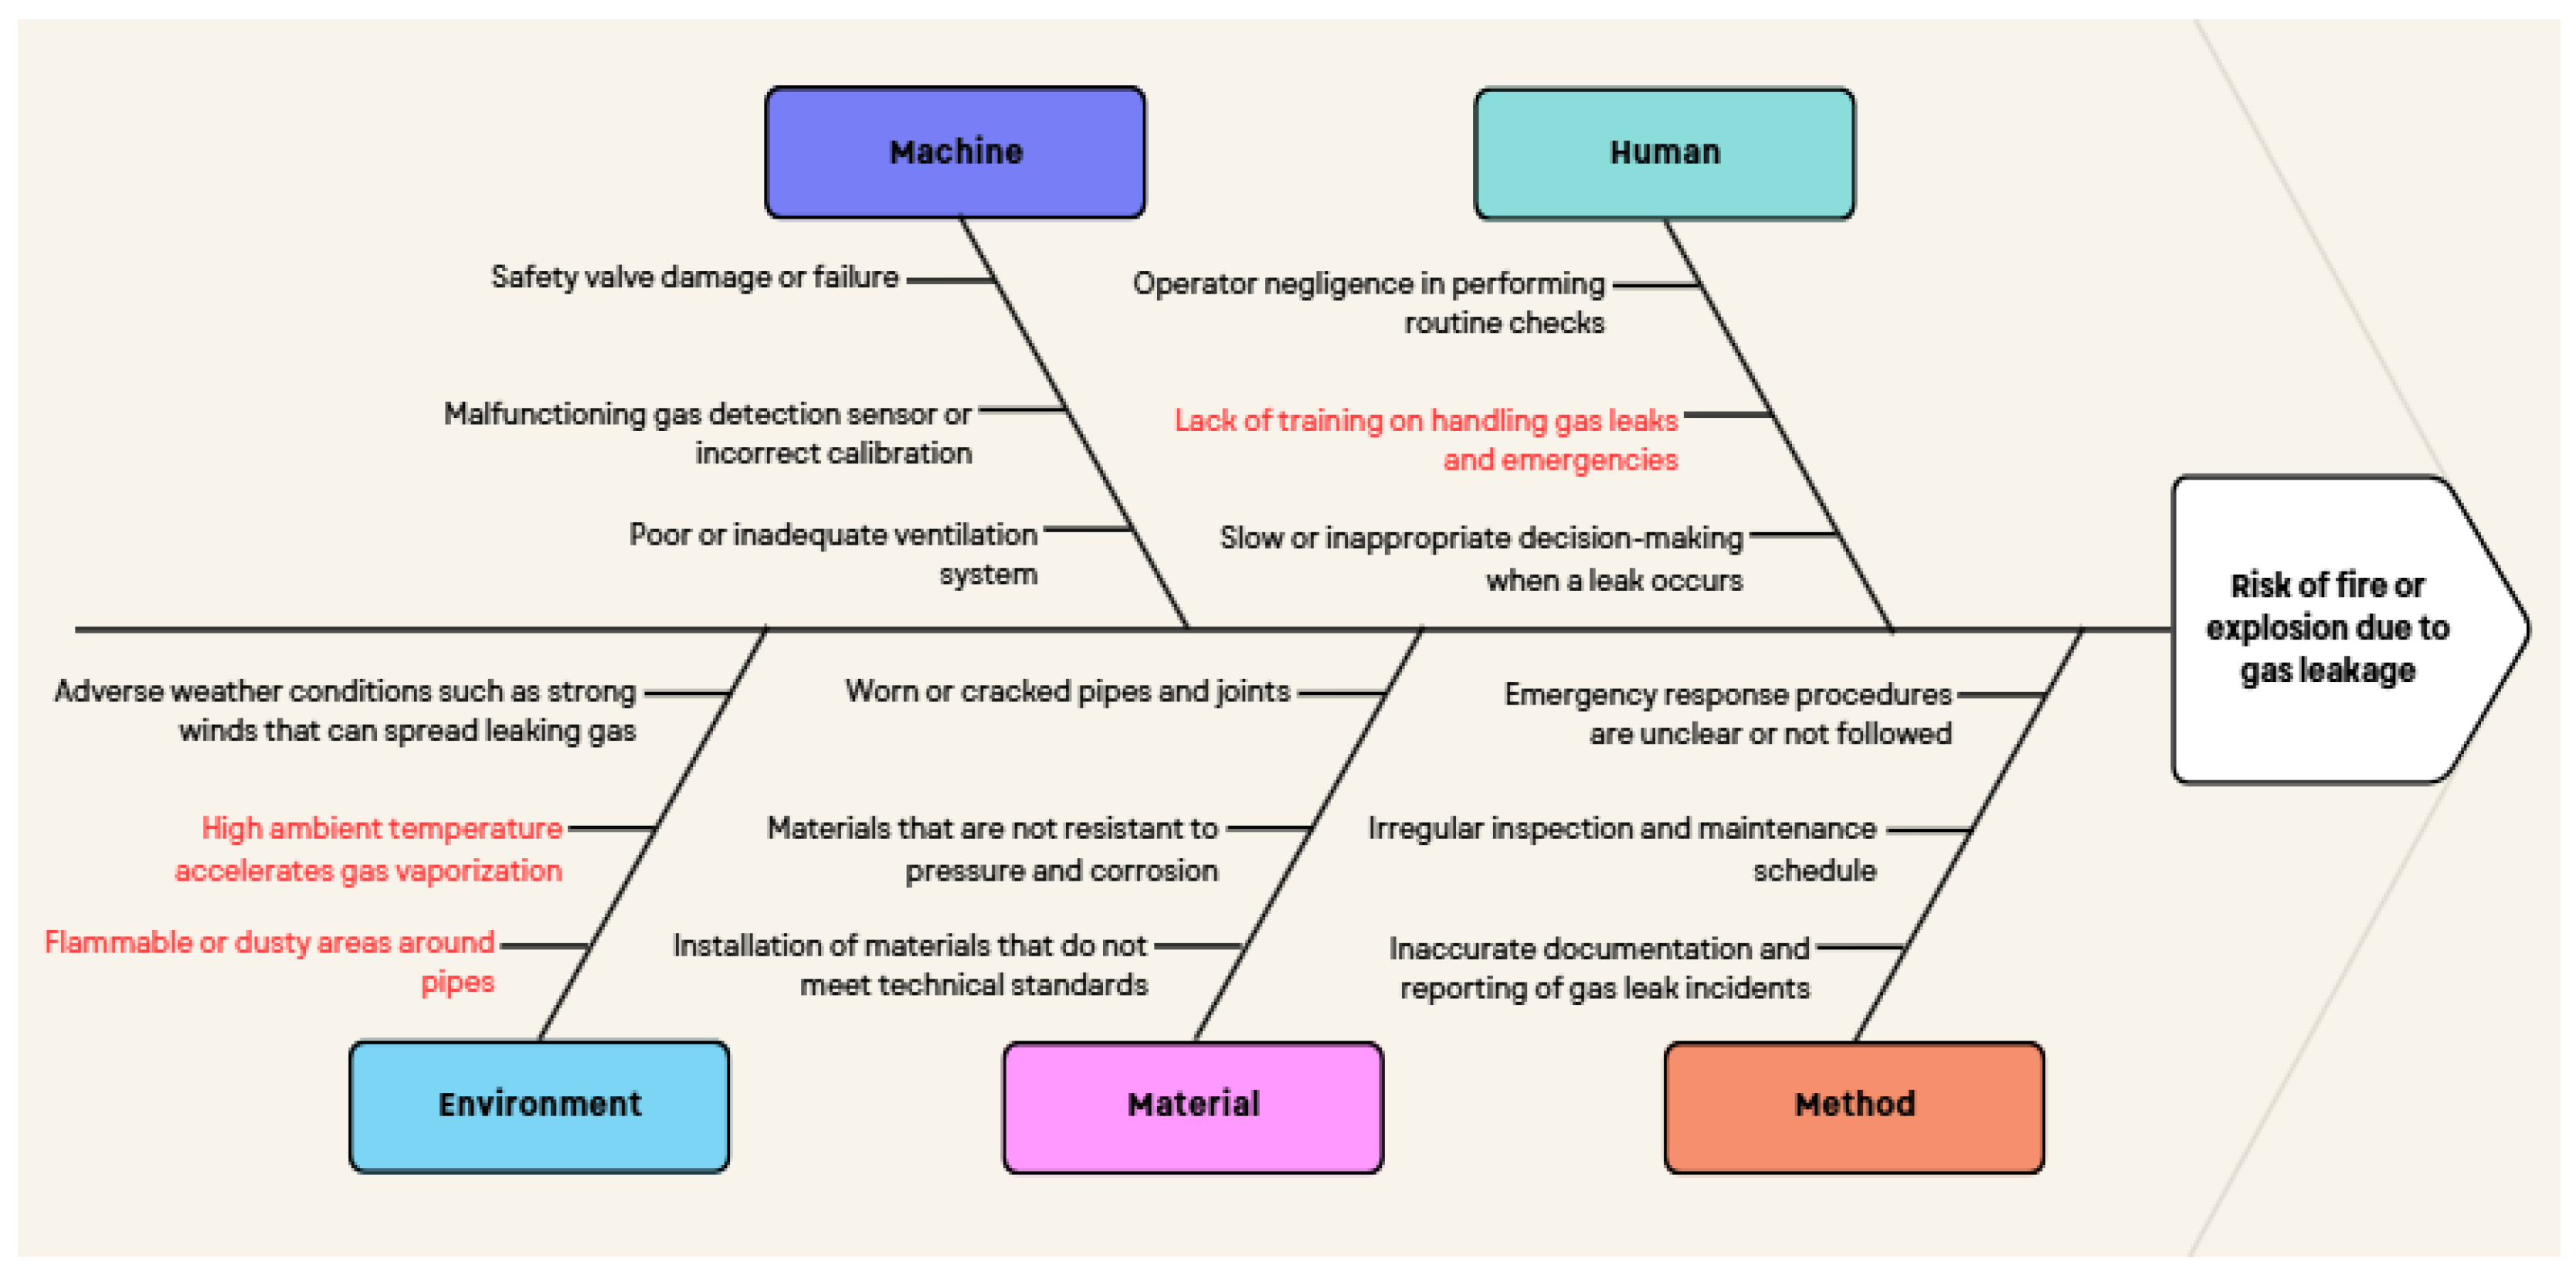
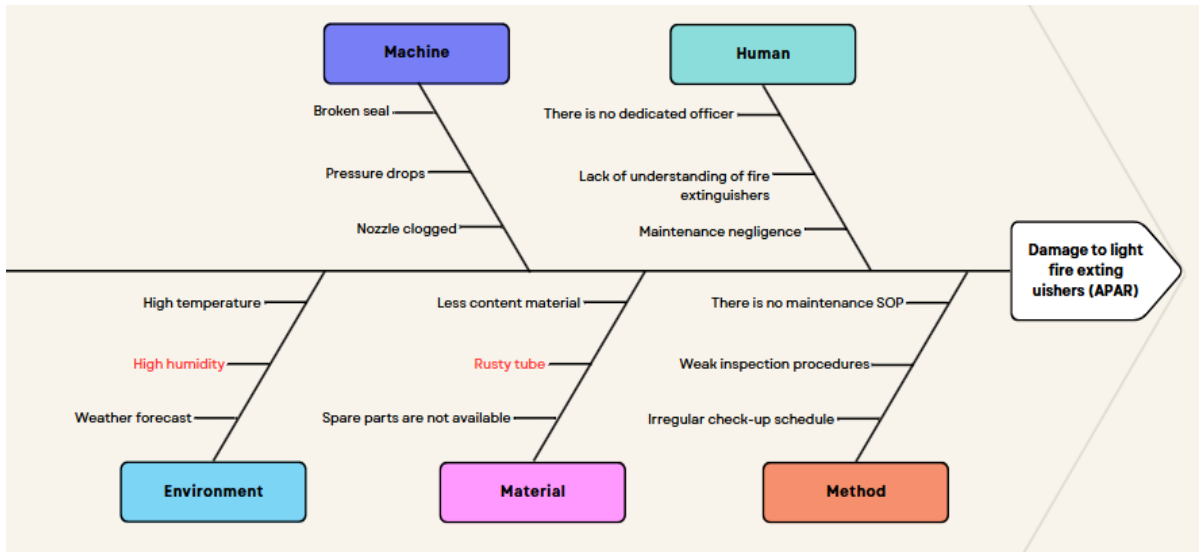
3.5. Risk Evaluation with Root Cause Analysis (Fishbone)


3.6. Risk Mitigation
3.7. Control Analysis
| Code | Risk | Before Mitigation | After Mitigation | Percentage Decrease (%) | ||||||||
|---|---|---|---|---|---|---|---|---|---|---|---|---|
| (S) | (O) | (D) | RPN | Criticality Level | (S) | (O) | (D) | RPN | Criticality Level | |||
| R28 | Risk of disruption due to backpressure in the distribution system | 8 | 7 | 5 | 280 | Critical | 4 | 5 | 3 | 60 | Low | 79% |
| R1 | Gas leakage due to corrosion or degradation of pipe material | 10 | 5 | 5 | 250 | High | 5 | 3 | 4 | 60 | Low | 76% |
| R7 | Risk of fire or explosion due to gas leakage | 9 | 5 | 5 | 225 | High | 3 | 3 | 3 | 27 | Low | 88% |
| R9 | Malfunction of light fire extinguisher (APAR) | 9 | 6 | 4 | 216 | High | 5 | 3 | 3 | 45 | Low | 79% |
4. Conclusions
Author Contributions
Funding
Institutional Review Board Statement
Informed Consent Statement
Data Availability Statement
Acknowledgments
Conflicts of Interest
References
- Sari, S.I. Perancangan Profil Risiko Pada Klaster Industri Olahan Hasil Laut Dengan Metode Fmea (Studi Kasus: Umkm Olahan Hasil Laut Kecamatan Bulak, Surabaya). Thesis, Institut Teknologi Sepuluh Nopember, Surabaya, Indonesia, 2019. Available online: http://repository.its.ac.id/id/eprint/64367 (accessed on 14 June 2026).
- Wibowo, Y.; Herlina; Soekarno, S.; Wiyono, A.E.; Prihani, S.T. Manajemen Risiko Pengembangan Industri Mocaf (Modified Cassava Flour) Di Kabupaten Jember. J. Teknol. Ind. Pertan. 2023, 33, 239–253. [Google Scholar] [CrossRef] [Scilit]
- Bastian, M.T. Analisa Risiko Fmeca Pada Kamar Mesin Kmp Takabonerate 500 Gt. Bachelor’s Thesis, Universitas Hasanuddin, Makassar, Indonesia, 2020. Available online: https://repository.unhas.ac.id/id/eprint/1684/ (accessed on 14 June 2026).
- Nuraini, L. Analisis Keandalan Dengan Metode Fmeca Pada Sistem Distribusi Pt. Pln Ulp Daruba Maluku Utara. Bachelor’s Thesis, Universitas Islam Sultan Agung, Semarang, Indonesia, 2024. Available online: https://repository.unissula.ac.id/37388/ (accessed on 14 June 2026).
- Firmansyah, E.; Sulistiyowati, W. Analysis of Quality Control of Suitcases to Minimize Defects Using the Control Map Method and FMECA (Failure Mode Effect and Criticality Analysis) Pt. Mitra Mutu Abadi. Perpus UMSIDA 2024, 1–15. [Google Scholar] [CrossRef] [Scilit]
- Banin, M.M. Analisis Risiko Pada Ukm Omah Batik Ngesti Pandowo Di Kampung Batik Semarang. Bachelor’s Thesis, Universitas Islam Indonesia, Yogyakarta, Indonesia, 2022. Available online: https://dspace.uii.ac.id/handle/123456789/39742 (accessed on 15 June 2026).
- Rahman, A.; Fahma, F. Penggunaan Metode Fmeca (Failure Modes Effects Criticality Analysis) Dalam Identifikasi Titik Kritis Di Industri Kemasan. J. Teknol. Ind. Pertan. 2021, 31, 110–119. [Google Scholar] [CrossRef] [Scilit]
- Alijoyo, A.; Wijaya, B.; Jacob, I. Failure Mode Effect Analysis Analisis Modus Kegagalan Dan Dampak Risk Evaluation Risk Analysis: Consequences Probability Level of Risk. In 31 Teknik Penilaian Risiko Berbasis ISO 31010; LSP MKS: Bandung, Indonesia, 2020. [Google Scholar]
- Novanandini, E.R.; Dewi, O.C.; Nugroho, Y.S. Evaluation of Fire Safety Maintenance of an Educational Laboratory Facility. In IOP Conference Series: Earth and Environmental Science; IOP Publishing Ltd.: Vancouver, BC, Canada, 2021; Volume 933, pp. 1–10. [Google Scholar] [CrossRef] [Scilit]
- Khikmawati, E.; Anggraini, M.; Pratiwi, N.R. Analisis Penyebab Produk Rusak Dengan Metode Fmeca Dan Memberikan Usulan Perbaikan Dengan Konsep Kaizen 5w 1h Pada Produk Air Demineral Kemasan 200 ML (Study Kasus: Cv. Gowinda Jaya Tirta Buana). J. Rekayasa Teknol. Dan Sains 2025, 9, 22–28. [Google Scholar] [CrossRef] [Scilit]
- Hooijberg, E.H.; Cook, J.R.; Freeman, K.P. Equipment Maintenance and Instrument Performance. J. Am. Vet. Med. Assoc. 2021, 258, 725–731. [Google Scholar] [CrossRef] [Scilit] [PubMed]
- Nasser, A.H.A.; Ndalila, P.D.; Mawugbe, E.A.; Kouame, M.E.; Paterne, M.A.; Li, Y. Mitigation of Risks Associated with Gas Pipeline Failure by Using Quantitative Risk Management Approach: A Descriptive Study on Gas Industry. J. Mar. Sci. Eng. 2021, 9, 1. [Google Scholar] [CrossRef] [Scilit]
- Ariyon, M.; Rahman, B.; Sastraningsih, E.; Mayes, A. The Mitigation of Risk Management: Non-Productive Time Analysis on Drilling Operations in Zy Field. J. Geosci. Eng. Environ. Technol. 2024, 9, 174–179. [Google Scholar] [CrossRef] [Scilit]
- Geofanny, G.K.; Tanaamah, A.R. Sistem Manajemen Risiko Berbasis Iso 31000:2018 Di Pt. Bawen Mediatama. J. Tek. Inform. Dan Sist. Inf. 2022, 9, 2870–2878. [Google Scholar]
- Kassem, M.A. Risk Management Assessment in Oil and Gas Construction Projects Using Structural Equation Modeling (Pls-Sem). Gases 2022, 2, 33–60. [Google Scholar] [CrossRef] [Scilit]
- Shanks, K.; Hamad, A.; Ameer, A. Failure Modes Effects and Criticality Analysis and Fault Tree Analysis Case Study of Waste Heat Recovery Plant in a Cement Factory, United Arab Emirates. J. Fail. Anal. Prev. 2020, 20, 40–50. [Google Scholar] [CrossRef] [Scilit]
- Dudek, E.; Kozłowski, M. The Concept of Risk Tolerability Matrix Determination for Aeronautical Data and Information Chain. J. KONBiN 2017, 43, 69–94. [Google Scholar] [CrossRef] [Scilit]
- Khalilzadeh, M.; Banihashemi, S.A.; Heidari, A.; Orazani, S.M.H.; Taebi, P. Risk Management in the Production Phase of Oil and Gas Projects: Evaluating Risk Responses and Their Impact on Safety and Damage Reduction. Discov. Civ. Eng. 2025, 2, 91. [Google Scholar] [CrossRef] [Scilit]
- Nugroho, O.A.; Utama, A.A. Improving Regional Sulawesi Downstream Oil and Gas Construction Risk Management: A Literature Review. Eur. J. Bus. Manag. Res. 2025, 10, 28–32. [Google Scholar] [CrossRef] [Scilit]
- Tanjung, W.N.; Atikah, S.A.; Hidayat, S.; Ripmiatin, E.; Asti, S.S.; Khodijah, R.S. Risk Management Analysis Using Fmeca and Anp Methods in the Supply Chain of Wooden Toy Industry. IOP Conf. Ser. Mater. Sci. Eng. 2019, 528, 1–8. [Google Scholar] [CrossRef] [Scilit]
- Jaya, R.; Ismail, M.; Yusriana; Mirza, I.; Mehran; Asis; Bakar, B.A. Analisis Dan Mitigasi Risiko Rantai Pasok Minyak Pala Kabupaten Aceh Selatan Menggunakan Fmeca. J. Teknol. Ind. Pertan. 2019, 29, 79–87. [Google Scholar] [CrossRef] [Scilit]
- Baradari, F.; Nopiah, Z.M.; Ja’afar, S.; Dahalan, W.S.A.W. Critical Risk Factors of Joint Venture Projects in the Oil and Gas Industry between Malaysia and Thailand. Int. J. Glob. Optim. Its Appl. 2022, 1, 58–69. [Google Scholar] [CrossRef] [Scilit]
- Putri, W.F. Penilaian Resiko Pipa Gas Distribusi Dengan Metode Pipeline Integrity Management System. J. Ilm. Tek. Ind. Prima 2022, 6, 15–19. [Google Scholar] [CrossRef] [Scilit]
- Karimah; Muzakir. Analisa Manajemen Risiko Operasional Receiving & Storage Pada Pt. Pertamina Fuel Terminal Meulaboh Dengan Menggunakan Metode Fmea. J. Akunt. Manaj. Dan Ilmu Ekon. 2022, 2, 260–267. [Google Scholar] [CrossRef] [Scilit]
- Pratama, M.R.; Alhilman, J.; Pamoso, A. Usulan Estimasi Optimal Inspection & Maintenance Pada Pipa Penyaluran Gas Dengan Menggunakan Metode Risk Based Inspection Dan Risk Based Maintenance Di Pt Xyz. E-Proceeding Eng. 2020, 7, 6439–6446. [Google Scholar]
- Rustono; Triasrini, F.M.; Paniya. Failure Mode and Effect Analysis on Risk Management at an Oil and Gas Survey Company in Indonesia. Int. J. Sci. Technol. Manag. 2023, 4, 1725–1732. [Google Scholar] [CrossRef] [Scilit]
- Faradillah, J.M.; Rachmadhani, M.M.; Kadang, D.R.; Mahmud, F.; Amri, I. Analisis Dan Evaluasi Manajemen Risiko Pada Usaha Laundry Rumahan Menggunakan Metode Likelihood Dan Consequence Risk Matriks. Ind. Eng. J.-Syst. 2024, 02, 54–66. [Google Scholar]
- Rachmadhani, M.M.; Histiarini, A.R.; Kayatun, S.N.; Wahyudien, M.A.N.; Ahistasari, A. Analisis Manajemen Risiko Aset Pada Biro Administrasi Akademik Dan Kemahasiswaan Universitas Muhammadiyah Sorong. JISI J. Integr. Sist. Ind. 2024, 11, 171–182. [Google Scholar] [CrossRef] [Scilit]
- Rachmadhani, M.M.; Immawan, T.; Mansur, A.; Choi, W. Risk Management Framework Design Based on Iso 31000 and Scor Model. Spektrum Ind. 2023, 21, 41–51. [Google Scholar] [CrossRef] [Scilit]
- Subagja, I. Peranan Perusahaan Migas Nasional Terhadap Ketersediaan Energi Indonesia (Study Di Perusahaan Pt. Bahtera Abadi Gas Kabupaten Tuban). JUSTITIABLE 2019, 1, 117–130. [Google Scholar] [CrossRef] [Scilit]
- Yaqin, R.I.; Zamri; Siahaan, J.P.; Priharanto, Y.E.; Alirejo, M.S.; Umar, M.L. Pendekatan Fmea Dalam Analisa Risiko Perawatan Sistem Bahan Bakar Mesin Induk: Studi Kasus Di Km. Sidomulyo. J. Rekayasa Sist. Ind. 2020, 9, 189–200. [Google Scholar] [CrossRef] [Scilit]
- Maulana, F.C.; Wardana, S.P.; Aji, T.R.; Haryono, D.S. Analisis Pengendalian Risiko Kecelakaan Kerja Di Kilang Dan Unit Utilitas Ppsdm Migas Cepu. Maj. Ilm. Swara Patra 2024, 14, 13–20. [Google Scholar] [CrossRef] [Scilit]
- Maharani, A.I.; Aziza, A.H.; Lubis, A.F.; Zaharani, Y.T. Manajemen Risiko Industri Minyak Bumi Dan Gas Pada Proses Industri Dan Manajemen Risiko. Environ. Confl. 2024, 1, 32–41. [Google Scholar] [CrossRef] [Scilit]
- Solikha, N.R.; Marodiyah, I. Risk Management in Production Using Quality Risk Approach and Fmea. Indones. J. Law Econ. Rev. 2024, 19, 6–14. [Google Scholar] [CrossRef] [Scilit]


| Risk Category | Risk Scale | Description | Color |
|---|---|---|---|
| Unacceptable Risk | 45–100 | The risk is very high and unacceptable. It must be controlled immediately. | |
| Tolerable Risk | 7–48 | The risk is still acceptable, but additional evaluation and control are needed. | |
| Acceptable Risk | 1–20 | The risk is low and acceptable. Periodic monitoring is sufficient. |
| Risk Category | Risk | Already Compliant (✓/✕) | |
|---|---|---|---|
| Code | Possible Risks | ||
| Operational | R1 | Gas leaks due to corrosion or degradation of pipe materials | ✓ |
| R2 | Failure of gas leak detection systems (sensors not functioning or inaccurate) | ✓ | |
| R3 | Failure of gas pressure control systems (valves and regulators) | ✓ | |
| R4 | Human error in operating equipment | ✓ | |
| R5 | Extreme environmental or natural factors (earthquakes, weather, floods, erosion, plant infestation) | ✓ | |
| R6 | Damage caused by external activities (construction or industrial activities in the vicinity) | ✓ | |
| R7 | Risk of fire or explosion due to gas leaks near electrical equipment | ✓ | |
| R8 | Non-compliance with industrial gas safety regulations | ✓ | |
| R9 | Damage to portable fire extinguishers (APAR) | ✓ | |
| R10 | Power outage due to external disruptions | ✓ | |
| R11 | Use of substandard pipe materials | ✓ | |
| R12 | Workplace accidents due to procedural errors or negligence | ✕ | |
| R13 | Security breaches or sabotage of gas infrastructure | ✓ | |
| R14 | Improper handling of hazardous materials | ✓ | |
| R15 | Logistics and transportation issues | ✓ | |
| R16 | Obsolete technology impacting operational efficiency and safety | ✓ | |
| R17 | Failure in emergency response planning | ✓ | |
| R18 | Health and safety risks to workers due to exposure to hazardous materials or the work environment | ✓ | |
| R19 | Non-compliance with standard operating procedures | ✓ | |
| R20 | Unstable gas pressure fluctuations | ✓ | |
| R21 | Dependence on a single gas supplier | ✓ | |
| R22 | Gas supply shortages from the main source | ✓ | |
| R23 | Gas contamination due to foreign substances entering the distribution process | ✓ | |
| R24 | Communication disruptions in gas distribution operations | ✓ | |
| R25 | Gas pressure monitoring system failure (inaccurate pressure sensors or unresponsive systems) | ✓ | |
| R26 | Disruption to the cathodic protection system of gas pipes | ✓ | |
| R27 | Risk of leakage due to excessive pressure in pipes | ✓ | |
| R28 | Risk of disruption due to backpressure in the distribution system | ✓ | |
| R29 | Mechanical damage to valves due to high operational pressure | ✓ | |
| R30 | Decline in gas quality due to excessive condensation in pipes | ✓ | |
| R31 | Risk of hazardous substance spills during facility maintenance | ✓ | |
| R32 | Disruption due to vibration and ground shifting along the pipeline route | ✕ | |
| Code | Risk | (S) | (O) | (D) | RPN |
|---|---|---|---|---|---|
| R1 | Gas leaks due to corrosion or degradation of pipe materials | 10 | 5 | 5 | 250 |
| R2 | Failure of gas leak detection systems (sensors not functioning or inaccurate) | 8 | 5 | 4 | 160 |
| R3 | Failure of gas pressure control systems (valves and regulators) | 8 | 5 | 3 | 120 |
| R4 | Human error in operating equipment | 6 | 4 | 2 | 48 |
| R5 | Extreme environmental or natural factors (earthquakes, weather, floods, erosion, plant infestation) | 8 | 4 | 3 | 96 |
| R6 | Damage due to external activities (construction or industrial activities in the vicinity) | 7 | 4 | 4 | 112 |
| R7 | Risk of fire or explosion due to gas leaks | 9 | 5 | 5 | 225 |
| R8 | Non-compliance with industrial gas safety regulations | 6 | 4 | 3 | 72 |
| R9 | Damage to fire extinguishers (APAR) | 9 | 6 | 4 | 216 |
| R10 | Power outages due to external disturbances | 4 | 4 | 3 | 48 |
| R11 | Use of pipes that do not meet standards | 8 | 5 | 3 | 120 |
| R13 | Security breaches or sabotage of gas infrastructure | 7 | 5 | 2 | 70 |
| R14 | Improper handling of hazardous materials | 6 | 4 | 2 | 48 |
| R15 | Logistics and transportation issues | 6 | 3 | 2 | 36 |
| R16 | Obsolete technology affecting operational efficiency and safety | 3 | 3 | 2 | 18 |
| R17 | Failure in emergency response planning | 8 | 3 | 3 | 72 |
| R18 | Health and safety risks for workers due to exposure to hazardous materials or the work environment | 6 | 4 | 3 | 72 |
| R19 | Non-compliance with standard operating procedures | 6 | 4 | 3 | 72 |
| R20 | Unstable gas pressure fluctuations | 5 | 5 | 3 | 75 |
| R21 | Reliance on a single gas supplier | 7 | 4 | 3 | 84 |
| R22 | Shortage of gas supply from the main source | 6 | 3 | 3 | 54 |
| R23 | Gas contamination due to foreign substances entering the distribution process | 6 | 5 | 3 | 90 |
| R24 | Communication disruptions in gas distribution operations | 4 | 3 | 2 | 24 |
| R25 | Failure of the gas pressure monitoring system (inaccurate pressure sensors or unresponsive systems) | 5 | 3 | 3 | 45 |
| R26 | Disruptions in the cathodic protection system of gas pipelines | 5 | 4 | 3 | 60 |
| R27 | Risk of leaks due to excessive pressure in pipelines | 9 | 4 | 3 | 108 |
| R28 | Risk of disruptions due to backpressure in the distribution system | 8 | 7 | 5 | 280 |
| R29 | Mechanical damage to valves due to high operational pressure | 8 | 3 | 4 | 96 |
| R30 | Decreased gas quality due to excessive condensation in the pipeline | 5 | 5 | 3 | 75 |
| R31 | Risk of hazardous substance spills during facility maintenance | 5 | 4 | 3 | 60 |
| Code | Risk | (S) | (O) | (D) | RPN | Criticallity Level |
|---|---|---|---|---|---|---|
| R28 | Risk of disruption due to backpressure in the distribution system | 8 | 7 | 5 | 280 | Critical |
| R1 | Gas leaks due to corrosion or degradation of pipe materials | 10 | 5 | 5 | 250 | High |
| R7 | Risk of fire or explosion due to gas leaks | 9 | 5 | 5 | 225 | High |
| R9 | Damage to fire extinguishers (APAR) | 9 | 6 | 4 | 216 | High |
| R2 | Failure of gas leak detection systems (sensors not functioning or inaccurate) | 8 | 5 | 4 | 160 | Moderate |
| R3 | Failure of gas pressure control systems (valves and regulators) | 8 | 5 | 3 | 120 | Moderate |
| R11 | Use of non-standard pipe materials | 8 | 5 | 3 | 120 | Moderate |
| R6 | Damage due to external activities (construction or industrial activities in the vicinity) | 7 | 4 | 4 | 112 | Moderate |
| R27 | Risk of leaks due to excessive pressure in pipes | 9 | 4 | 3 | 108 | Moderate |
| R5 | Extreme environmental or natural factors (earthquakes, weather, floods, erosion, plant infestation) | 8 | 4 | 3 | 96 | Moderate |
| R29 | Mechanical damage to valves due to high operating pressure | 8 | 3 | 4 | 96 | Moderate |
| R23 | Gas contamination due to the entry of foreign substances from the distribution process | 6 | 5 | 3 | 90 | Moderate |
| R21 | Dependence on a single gas supplier | 7 | 4 | 3 | 84 | Moderate |
| R20 | Unstable gas pressure fluctuations | 5 | 5 | 3 | 75 | Moderate |
| R30 | Decline in gas quality due to excessive condensation in the pipeline | 5 | 5 | 3 | 75 | Moderate |
| R8 | Non-compliance with gas industry safety regulations | 6 | 4 | 3 | 72 | Moderate |
| R17 | Failure in emergency response planning | 8 | 3 | 3 | 72 | Moderate |
| R18 | Health and safety risks for workers due to exposure to hazardous materials or working environments | 6 | 4 | 3 | 72 | Moderate |
| R19 | Non-compliance with standard operating procedures | 6 | 4 | 3 | 72 | Moderate |
| R13 | Security breaches or sabotage of gas infrastructure | 7 | 5 | 2 | 70 | Moderate |
| R26 | Disruption to the cathodic protection system of gas pipelines | 5 | 4 | 3 | 60 | Low |
| R31 | Risk of hazardous substance spills during facility maintenance | 5 | 4 | 3 | 60 | Low |
| R22 | Shortage of gas supply from the main source | 6 | 3 | 3 | 54 | Low |
| R4 | Human error in equipment operation | 6 | 4 | 2 | 48 | Low |
| R10 | Power outage due to external disruption | 4 | 4 | 3 | 48 | Low |
| R14 | Improper handling of hazardous materials | 6 | 4 | 2 | 48 | Low |
| R25 | Failure of the gas pressure monitoring system (inaccurate pressure sensors or unresponsive system) | 5 | 3 | 3 | 45 | Low |
| R15 | Logistics and transportation issues | 6 | 3 | 2 | 36 | Low |
| R24 | Communication disruptions in gas distribution operations | 4 | 3 | 2 | 24 | Very Low |
| R16 | Obsolete technology that impacts operational efficiency and safety | 3 | 3 | 2 | 18 | Very Low |
| Code | Risk | Cause | Impact | Mitigation |
|---|---|---|---|---|
| R28 | Disturbances caused by backpressure | Damage to pressure monitoring devices (Machinery) | Overpressure, pipe damage, gas flow stoppage | 1. Calibration (comparison process) of pressure measuring instruments with SNI/ISO standards 2. Replacement of instruments if the results differ by more than 5% from the expected value 3. Procurement of instruments with automatic alarm and auto-shutdown features 4. Monthly performance audits of instruments based on inspection reports |
| Lack of training in backpressure detection (People) | Operators failed to recognize backpressure symptoms early on | 1. Intensive training based on real cases (case-based training) 2. Competency test for detecting abnormal pressure every 6 months 3. Direct supervision during critical shifts (peak hours) 4. Evaluation of training effectiveness through feedback and live simulations | ||
| No routine simulation of backpressure scenarios (Methods) | Unprepared for sudden pressure surges | 1. Backpressure scenario simulation with actual parameters (not just theory) 2. Review and revision of SOPs based on simulation results 3. HSE-Operator collaboration in simulation (not just a formality) 4. Documentation of simulation results as a reference for improvement | ||
| Underground pipe installations are difficult to access for inspection (Environment) | Slow detection of abnormal pressure symptoms | 1. Re-mapping of underground pipelines and addition of inspection access points 2. Utilization of smart pigging for internal pipeline detection 3. Installation of automatic pressure sensors at critical points 4. Physical and digital audit of underground pipeline conditions | ||
| R1 | Gas leaks due to corrosion or degradation of pipe materials | Failure of leak or corrosion detection equipment (Machinery) | causing pipe damage and potential serious accidents | 1. Perform routine calibration of Pressure Gauge (PG) and Pressure Transmitter (PT) 2. Conduct periodic inspections using portable Non-Destructive Testing (NDT) tools 3. Add simple pressure and flow monitoring as an early warning system 4. Perform routine visual checks at critical points |
| Inaccuracy in detecting early signs of corrosion (Human) | Corrosion is not identified early, increasing the risk of gas leaks | 1. Provide technical training related to corrosion identification for operators 2. Develop inspection guidelines in the form of checklists to facilitate field inspections 3. Implement a system of verification of logsheet completion by two officers 4. Conduct periodic evaluation and revision of inspection SOPs | ||
| Continuous exposure to rainwater or high humidity (Environment) | Accelerating the corrosion process and damaging the pipe coating, thereby increasing the risk of leaks | 1. Strengthening the coating of underground pipes with corrosion-resistant materials 2. Repairing and optimizing the drainage system around the pipeline 3. Conducting regular moisture monitoring in vulnerable areas 4. Carrying out the re-closure of excavated soil in accordance with standards to prevent water accumulation | ||
| R7 | Risk of fire or explosion due to gas leaks | Lack of training in leak and emergency response (Human) | Delayed or incorrect response, causing gas leaks to develop into fires or explosions. | 1. Conduct regular training for all staff in handling gas leaks and emergencies. 2. Conduct emergency response simulations at least twice a year to improve preparedness. 3. Provide emergency response SOPs that are easily understood and accessed in every work area. |
| High ambient temperatures accelerate gas evaporation (Environment) | Increased concentrations of flammable gases, increasing the risk of fire and explosion. | 1. Install automatic temperature and gas sensors in vulnerable locations for early detection. 2. Conduct routine monitoring of environmental temperature, especially during summer. 3. Plant trees or shade plants around the pipeline area to lower surface temperatures and reduce gas evaporation. | ||
| The area around the pipe is flammable or dusty (Environment) | Sparks caused by dust or flammable materials, triggering fires or explosions. | 1. Routinely cleaning the area around the pipeline from dry vegetation and combustible dust. 2. Creating and maintaining a flammable material free zone of at least 3 m on both sides of the pipeline. 3. Placing fire extinguishers (APAR) at strategic points and conducting periodic checks | ||
| R9 | Damage to light fire extinguishers (APAR) | Rust on the fire extinguisher tube (Material) | Pressure decreased, contents leaked, extinguisher failed to be used in an emergency | 1. Visual inspection and physical checking of tubes every month 2. Repainting of scratched or corroded tubes 3. Replacement of fire extinguishers that are more than 5 years old 4. Store fire extinguishers in moisture-proof brackets / supports 5. Use the services of an experienced third party for APAR maintenance so that all tools remain in good condition and avoid rust. |
| Environmental humidity is too high (Environment) | Rapid corrosion, mechanical parts damaged, label damaged | 1. Installation of silica gel in the extinguisher storage room 2. Placement of fire extinguishers in locations with good air circulation 3. Avoid placement near outside walls or leaking areas 4. Monitoring room temperature and humidity every week |
Disclaimer/Publisher’s Note: The statements, opinions and data contained in all publications are solely those of the individual author(s) and contributor(s) and not of MDPI and/or the editor(s). MDPI and/or the editor(s) disclaim responsibility for any injury to people or property resulting from any ideas, methods, instructions or products referred to in the content. |
© 2026 by the authors. Licensee MDPI, Basel, Switzerland. This article is an open access article distributed under the terms and conditions of the Creative Commons Attribution (CC BY) license.
Share and Cite
Rachmadhani, M.M.; Gani, M.; Faradillah, J.M.; Ahistasari, A.; Amri, I. Operational Risk Analysis on Gas Distribution Process at PT—Perta Daya Gas Using FMECA Method. Eng. Proc. 2026, 137, 25. https://doi.org/10.3390/engproc2026137025
Rachmadhani MM, Gani M, Faradillah JM, Ahistasari A, Amri I. Operational Risk Analysis on Gas Distribution Process at PT—Perta Daya Gas Using FMECA Method. Engineering Proceedings. 2026; 137(1):25. https://doi.org/10.3390/engproc2026137025
Chicago/Turabian StyleRachmadhani, Mirga Maulana, Mardhiah Gani, Jihan Muhrifa Faradillah, Asih Ahistasari, and Irman Amri. 2026. "Operational Risk Analysis on Gas Distribution Process at PT—Perta Daya Gas Using FMECA Method" Engineering Proceedings 137, no. 1: 25. https://doi.org/10.3390/engproc2026137025
APA StyleRachmadhani, M. M., Gani, M., Faradillah, J. M., Ahistasari, A., & Amri, I. (2026). Operational Risk Analysis on Gas Distribution Process at PT—Perta Daya Gas Using FMECA Method. Engineering Proceedings, 137(1), 25. https://doi.org/10.3390/engproc2026137025