1. Introduction
At the current state of research, polymer electrolyte membrane (PEM) fuel cells are the most promising fuel cell type to be implemented into aircraft, particularly regarding their power densities when compared to, e.g., solid oxide fuel cells (SOFCs) [
1]. Therefore, many studies focus on the steady-state analysis of components, systems and the overall aircraft. However, only a small amount of research has been conducted about the dynamic behavior of propulsion systems. This is particularly important for fuel-cell-only aircraft, as it is currently required by the European Union Aviation Safety Agency (EASA) that 95% of the rated take-off power must be reached within five seconds [
2]. It is interesting how the different components in a new powertrain architecture interact with each other in the various operation points which occur during an aircraft mission. Especially following the sizing process, this can give comprehensive information on how the system can and should be operated with regard to its control. Additionally, the control scheme should be developed with a focus on keeping the degradation of the fuel cell at a minimum level. This is particularly necessary in aviation to increase the lifetime and thus decrease the maintenance costs.
The goal of this work is to develop a dynamic model of a PEM fuel cell system, including its control. The main focus lies on the hydrogen fuel supply, including a recirculation loop, and the air supply, including the control of the relative humidity. These two subsystems are responsible for providing the fuel cell with suitable product gases. Within this model, subsystems and components can easily be swapped out. This enables dynamic simulations with which the transient behavior and the interaction between the subsystems during the aircraft mission can be analyzed. The results of these analyses can then give feedback on aspects such as the design of the control scheme, the health monitoring of the fuel cell regarding degradation, and the sizing process of the components.
2. Simulation Setup
The dynamic simulations are set up and carried out using the Modelica modeling language together with the in-house-developed, open-source ThermoFluidStream (TFS) library [
3] and a custom fuel cell model [
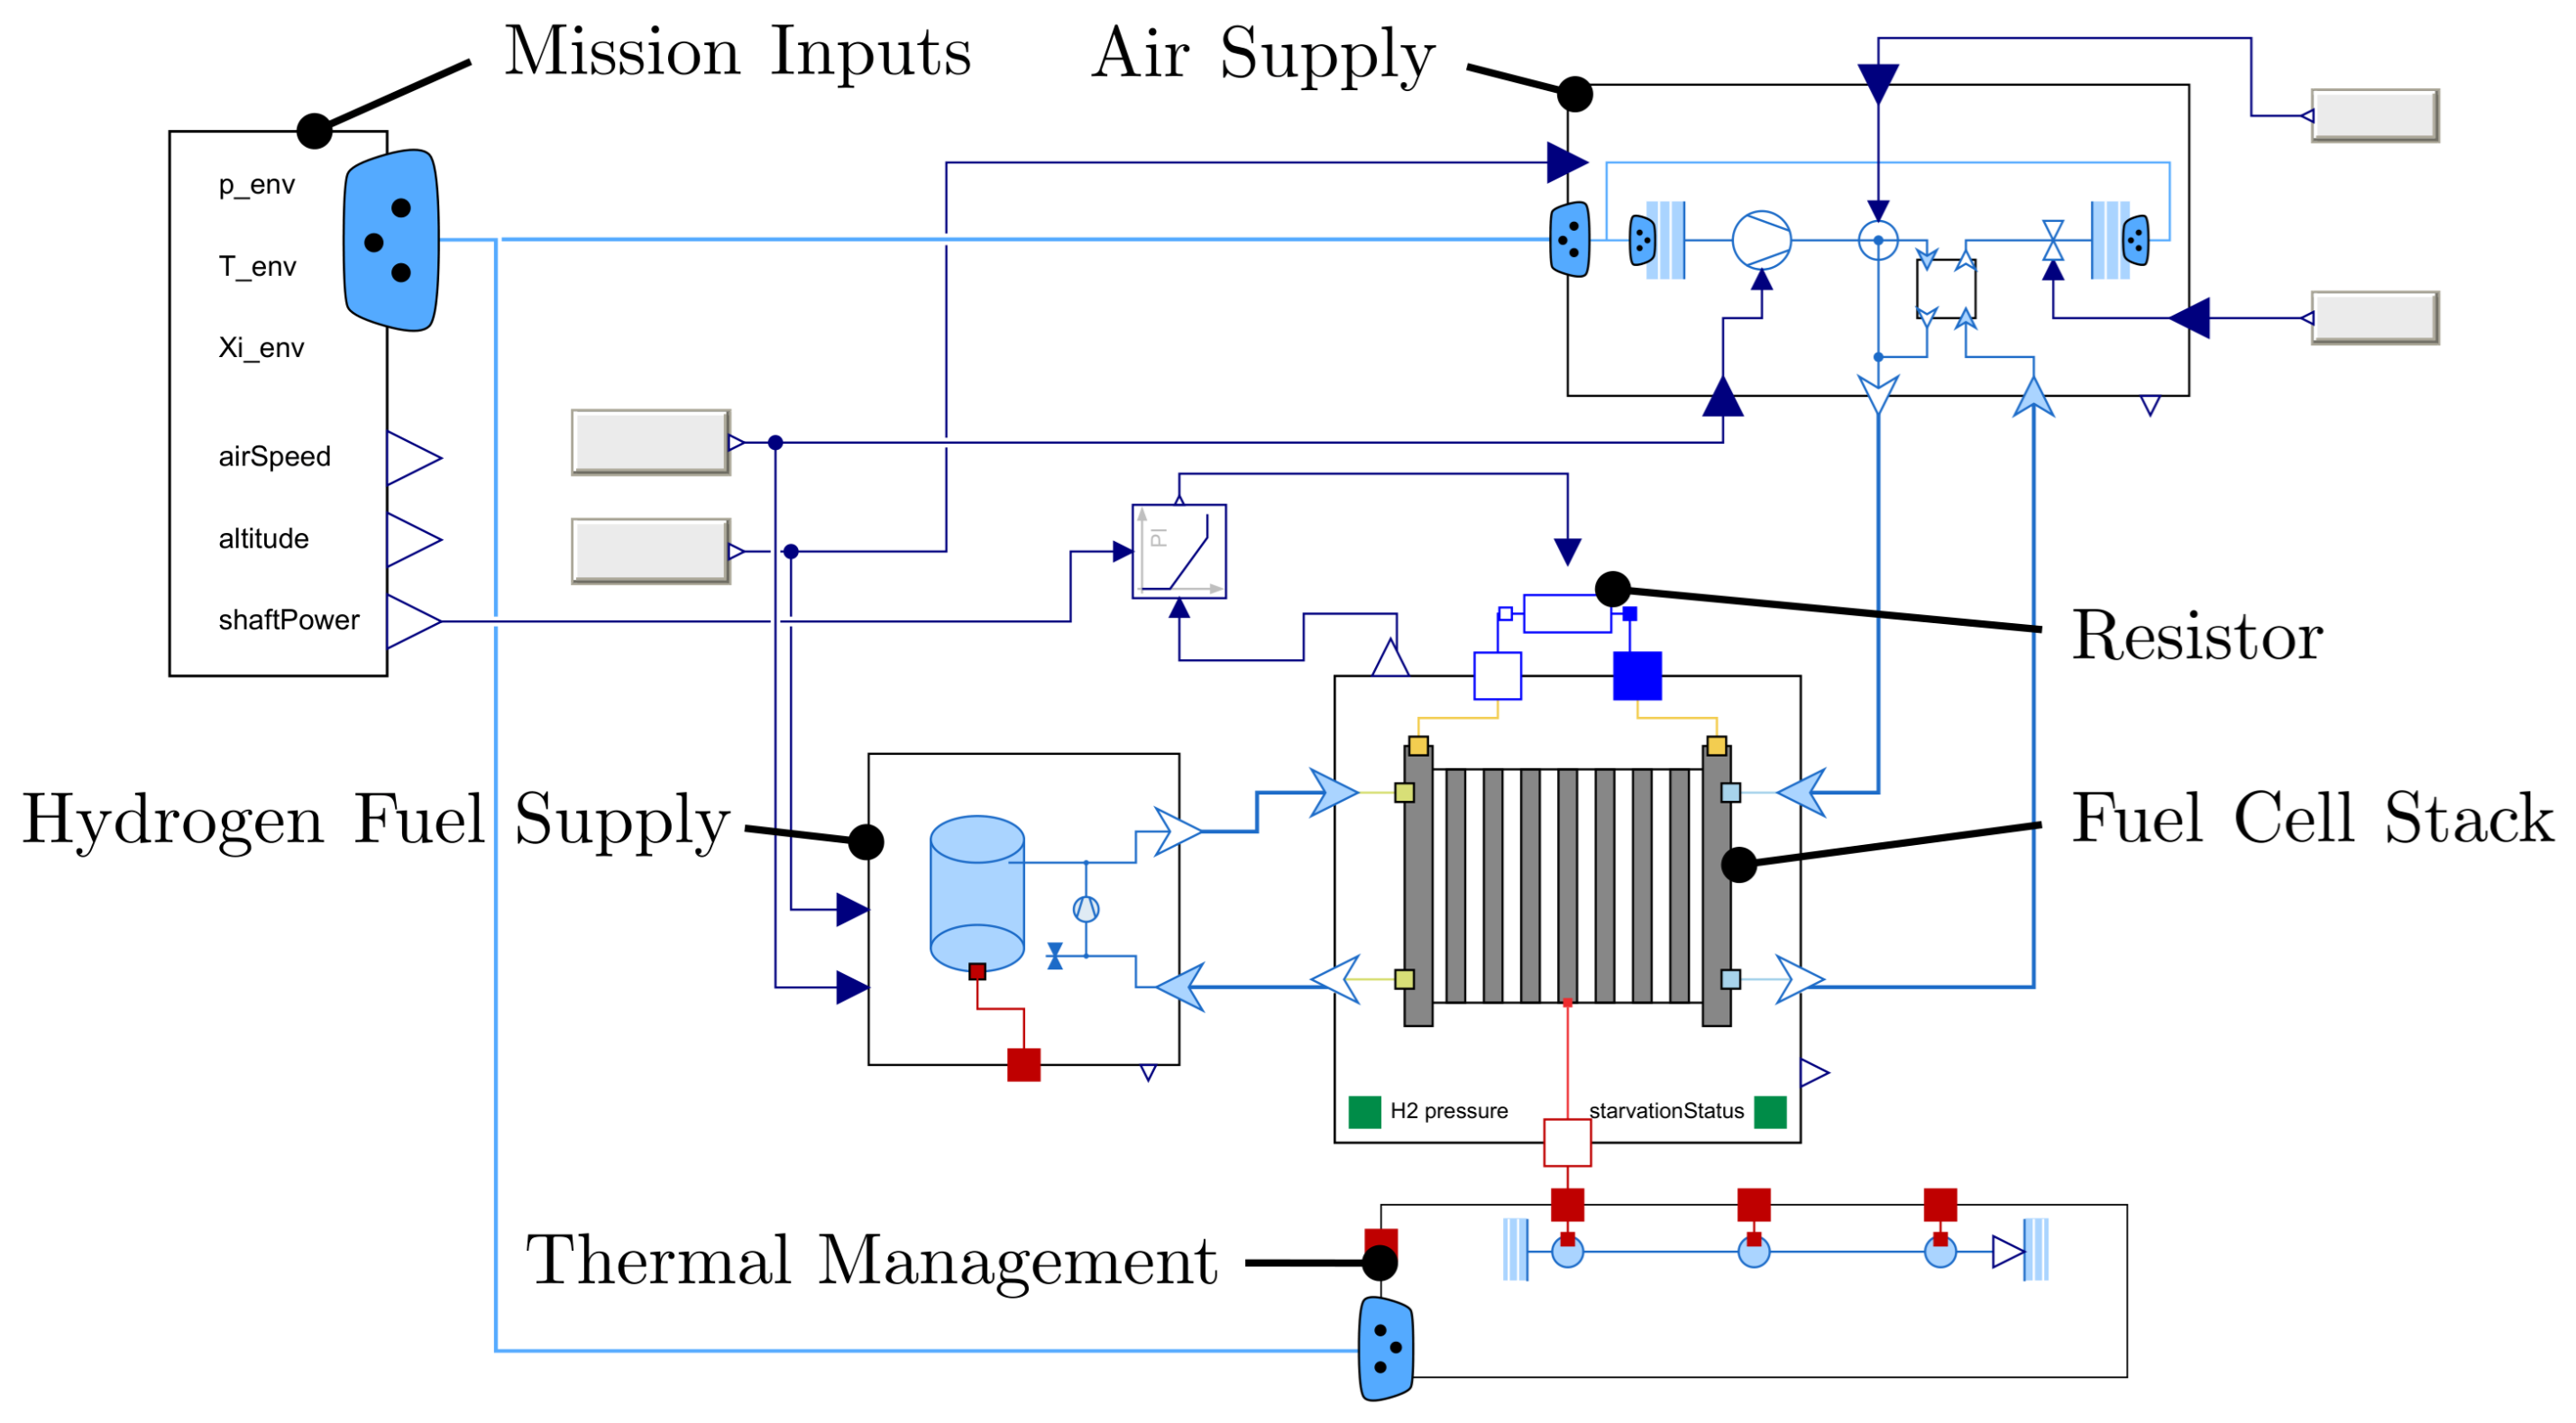
4]. The model of the fuel cell system as depicted in
Figure 1 includes all subsystems necessary to operate a PEM fuel cell, such as the fuel cell stack itself, the hydrogen fuel supply, the air supply and a thermal management system. The electric components are represented by a resistor. The architecture seen here is a generic approach based on the literature and internal knowledge [
5].
All the subsystems are swappable by the use of standard interfaces which define the inputs and outputs. This makes it easy, e.g., to compare different architectures of one subsystem. The focus of this study lies on the hydrogen fuel supply and on the air supply. Thus, these two subsystems are presented in more detail below. The thermal management is kept simple by using a liquid loop which controls the fuel cell temperature. Currently, thermal management is not used to condition the product gases, which should be the case in the future. The electrical system is replaced by a variable resistor which controls the electric power output of the fuel cell. The power electronics are considered in another simulation where a simple version of the fuel cell system is implemented together with a battery, an electric motor, a propeller and an aircraft model to simulate the complete powertrain [
6]. Based on the inputs from the flight mission, this simulation delivers the required output power of the fuel cell system based on realistic ramp-up transients of PEM fuel cells. This required power output is implemented in the mission input block, which is displayed in the top left corner of the model in
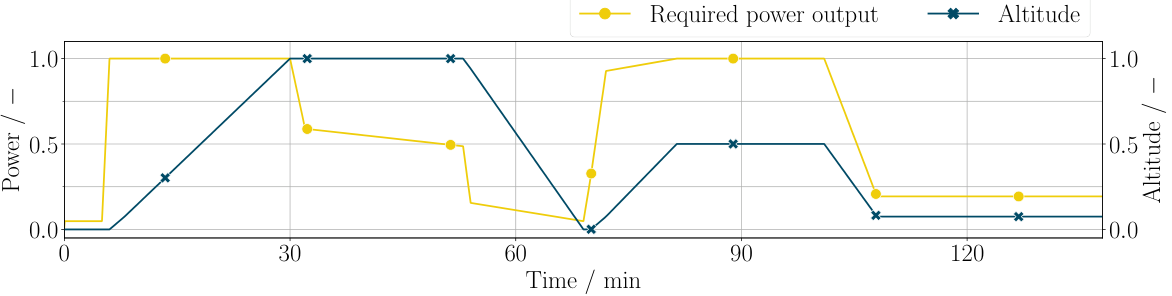
Figure 1 together with the ambient air conditions. The latter are calculated according to the International Standard Atmosphere (ISA) using the altitude of the flight mission, which is depicted in
Figure 2. This flight mission comes from the EU Clean Aviation project AMBER. The project aims to develop a next-generation propulsion system for regional aircraft by combining a MW-class turboprop engine with a MW-class PEM fuel cell system reaching a hybridization rate of 50%.
2.1. Hydrogen Fuel Supply
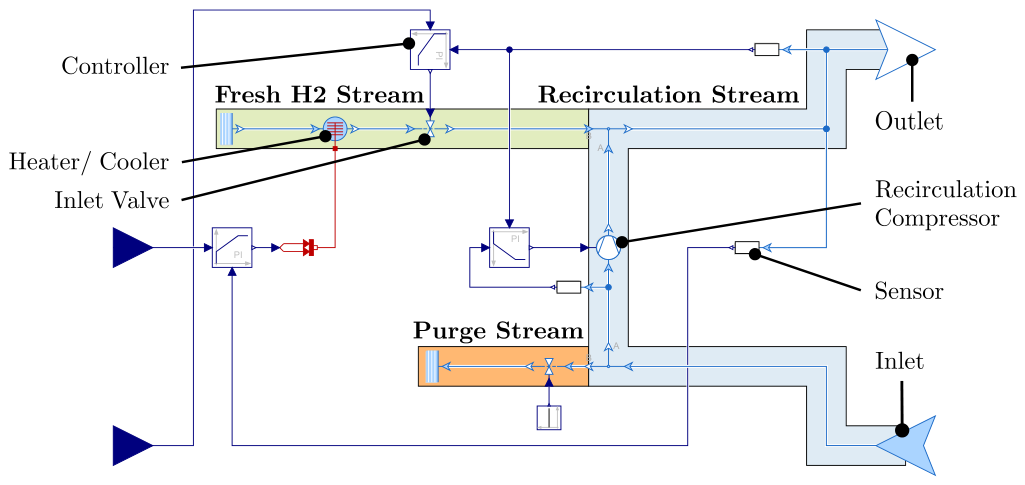
The architecture of the hydrogen fuel supply is presented in
Figure 3 in the form of the Modelica model with all important components. Less important components of the model were removed for a better visualization. In the fresh hydrogen stream, highlighted in green, hydrogen comes from the tank assuming it is already vaporized at a temperature of 23 K. After passing through the inlet valve, the fuel enters the recirculation stream with the blue envelope. This stream mainly includes an outlet to the fuel cell, an inlet from the fuel cell and the recirculation compressor. Additionally, a purge stream, marked in orange, is introduced to consider purging the recirculation stream. This is a common method to prevent the accumulation of nitrogen due to diffusion in the fuel cell from the air to the hydrogen side. Even though this mechanism, referred to as nitrogen backdiffusion, is not implemented in the fuel cell model, it is necessary to understand how the system responds to the purging process.
The task of the fuel supply is to provide the anode of the fuel cell with a sufficient amount of hydrogen at a suitable pressure and temperature. The anode pressure should be at the same level as the cathode pressure, ideally slightly higher with a maximum difference of 0.2 bar [
7]. The temperature should be at the operating temperature of the fuel cell. Although some architectures feature an anode humidifier in the fuel supply, this is not considered here. The control makes sure the task of the fuel supply is fulfilled and works as follows: The opening ratio of the inlet valve is used to control the outlet pressure of the fuel supply, hence the inlet pressure into the fuel cell. This can be done assuming the tank pressure is higher than the operating pressure of the fuel cell. The rotational speed of the recirculation compressor is used to control the recirculation of the fuel cell exhaust gas. This is currently executed by adjusting the pressure on the suction side of the compressor to a slightly lower value than the operating pressure of the fuel cell. This is a way to create recirculation that is easy to implement in a real system. However, using other control variables such as the mass flow is possible as well. An artificial thermal management is used to introduce or remove thermal energy to control the hydrogen temperature, although this is not the focus of this work.
2.2. Air Supply
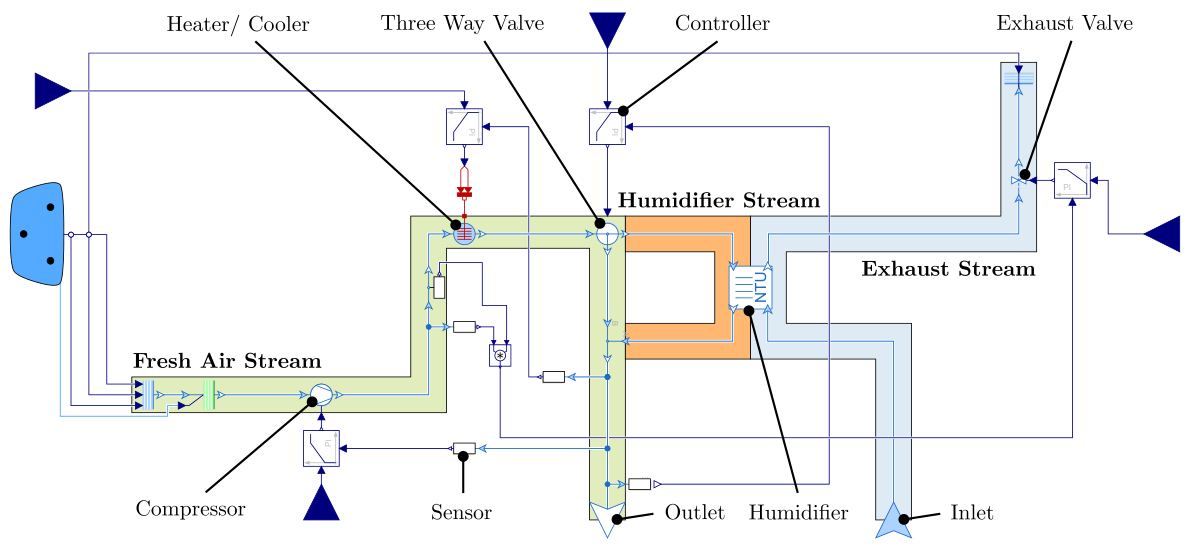
The air supply architecture in
Figure 4 is displayed in the form of the simulation model, similarly to the fuel supply with a reduced number of components. The fresh air enters the air supply at ambient conditions, considering the dynamic pressure to obtain the stagnation pressure. This fresh air stream, including a compressor and the artificial thermal management, is highlighted in green. The three-way valve divides the flow into a humidifier stream marked in orange and a bypass around the humidifier. After recombining the two streams, the air is directed to the fuel cell. The exhaust air from the fuel cell is used to humidify the fresh air in the humidifier before being released with the exhaust valve. The humidifier was modeled following [
8].
The task of the air supply is similar to the hydrogen supply. It has to provide a sufficient amount of oxygen, by using air in this case, at a suitable pressure, temperature and humidity. The pressure control of the air supply works by controlling the rotational speed of the compressor. The mass flow is controlled via the opening ratio of the exhaust valve. Swapping these two control variables, as is sometimes done in the literature, was tested as well. However, it was considered to work better in the presented way for this specific system. Similarly to the fuel supply, an artificial thermal management is implemented, which predominantly cools down the air after the compression. The three-way valve is used to adjust the bypass ratio of the humidifier stream and hence the mass fraction of the air supply outlet. Ultimately, this process is used to control the relative humidity of the air.
3. Results and Discussion
In this section, the control results of both the hydrogen fuel supply and the air supply subsystems are described. Afterwards, the results of the complete system are presented. Subsequently, important aspects when operating a fuel cell concerning its degradation are discussed.
3.1. Subsystem Results: Hydrogen Fuel Supply
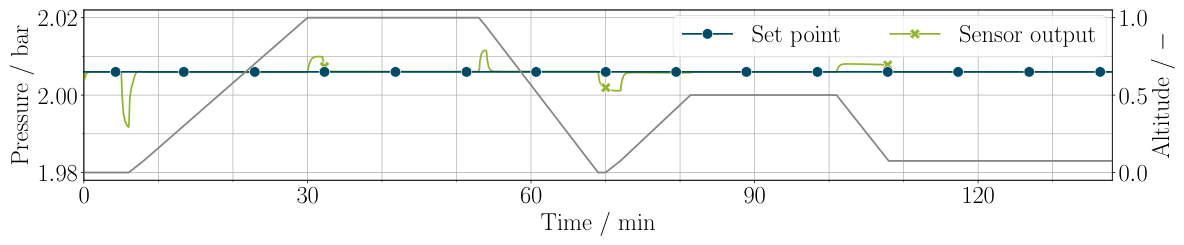
First, the control results of the fuel cell inlet pressure and the compressor suction side pressure are analyzed. The course of the fuel cell inlet pressure during the mission simulation is displayed in
Figure 5. Marked in grey is the altitude profile of the flight mission to give an orientation on the flight phases. This is shown in almost every upcoming plot. Both of the variables show good agreement between the set point and the sensor output. The deviations, which occur mostly during take-off and while switching between different flight phases, are considered small, with a maximum absolute value of 0.7% in the case of the fuel supply outlet pressure when referenced to the set point. The compressor suction side pressure works similarly well, following its set point, which has a close offset to the fuel cell inlet pressure. While creating these results, purging of the recirculation loop was turned off. Purging did not change the overall results much, but it introduced fluctuations, e.g., into the pressure. Therefore, the essence of the results would not have been visible anymore.
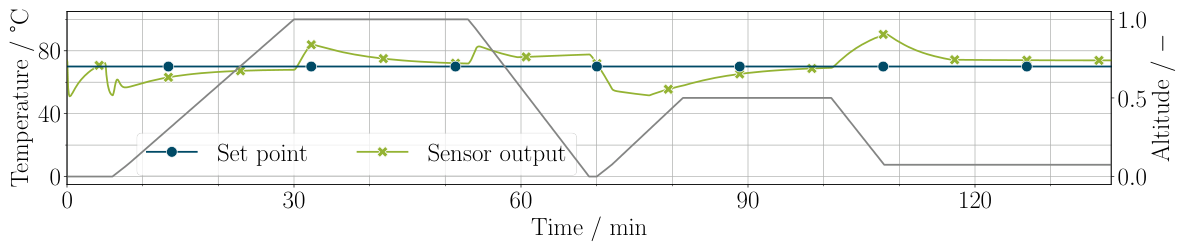
The results of the temperature control are presented in
Figure 6. The occuring deviations are significant and last up to approximately 20 min due to the thermal transients being comparably slow. The temperature keeps within a minimum of 50 °C and 90 °C, i.e., within a difference of −5.8% and 2.9% with reference to 343.15 K. These deviations are not considered critical for the fuel cell, assuming the temperature gradients, both temporal and spatial, are not too large. However, the control is improvable, which can be achieved by architectural as well as control-related changes, such as a different controller or implementing a feed-forward input.
3.2. Subsystem Results: Air Supply
In the case of the air supply, the pressure control works sufficiently well, as shown in
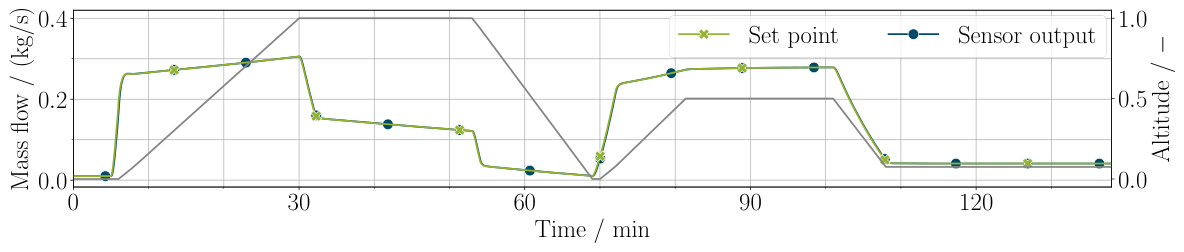
Figure 7. Deviations reach a maximum value of 3.3% and even stay below 1% after the take-off. Comparably, the control of the oxygen mass flow also works well, which is depicted in
Figure 8. The mass flow as measured by the sensor in the simulation follows the set point very well in this scaling. However, it has to be considered that the exact amount of used oxygen in the fuel cell as the set point cannot be measured, though it can be well estimated, e.g., by the electric current output.
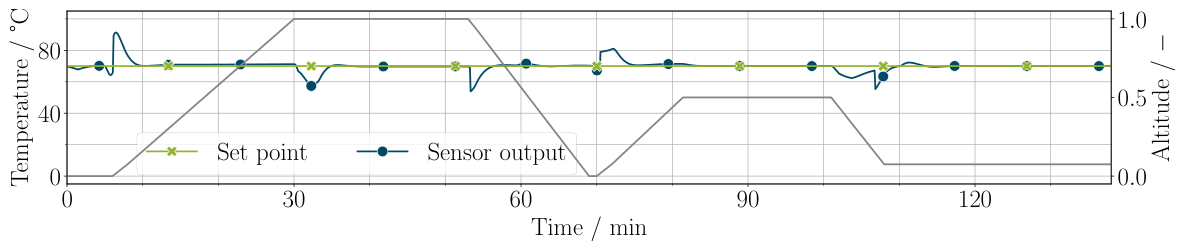
Compared to the fuel supply, the temperature control of the air supply works better, which can be observed in
Figure 9. Although the amplitudes of the deviation are similar, the duration in which the deviations occur is smaller, approximately 5 min instead of 20 min. Due to the amplitudes, the temperature control of the air supply is also improvable.
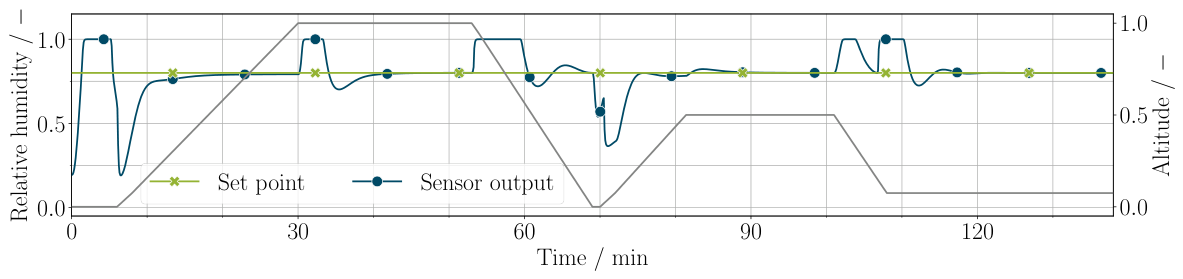
The variable which is the most difficult to control is the relative humidity, which is reflected in
Figure 10. The deviations in both amplitude and duration are large. This difficulty is assumed to come from the dependency of the relative humidity of the water content, the pressure and the temperature. Although the pressure and the temperature are control variables, which should ideally follow a constant set point in this case, both of them vary over time, especially the temperature. A sudden saturation happens in situations where the power is reduced, such as when going from climb to cruise or when beginning the descent. This would very likely result in flooding, which is a problem. Accordingly, a low saturation is obtained when the power is increased, e.g., during take-off or in the beginning of the go-around. This inherits the risks of drying out the membrane, which is also not desired. The described behavior corresponds to the behavior of the temperature as well as the pressure. In a separate test case, a change in the thermal state has been recreated to analyze the effect. As such, it became clear that the effect of the temperature deviations dominates. Hence, it became more important to improve the temperature control than the pressure control with regard to the control of the humidity. However, a feed-forward control could improve the humidity control as well by decreasing the humidity before the fuel cell power is reduced.
3.3. Complete System Results and Fuel Cell Operation
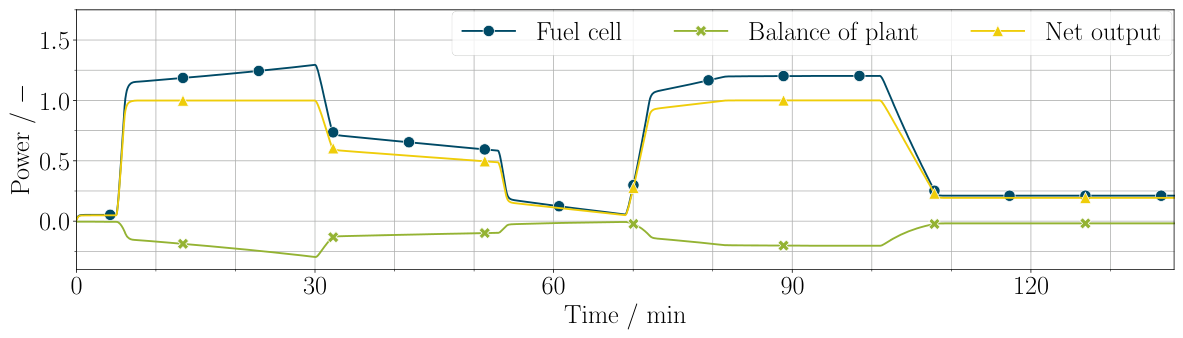
To get an overview of the power distribution of the fuel cell system, the power output of the fuel cell, the balance of plant power and the net output power are presented in
Figure 11. The balance of plant power is dominated by the air compressor while the hydrogen recirculation compressor marginally contributes to it. The balance of plant power has to be compensated by the fuel cell in order to obtain the net power output, which is the set point of the electric power control. Additionally, the effect of the altitude can be seen by the increasing demand of the air compressor during the climb phase which comes from the lower ambient air pressure at higher altitudes. The power distribution is considered realistic, although the used models, especially the compressor models, are not sized in detail since they are general, physics-based models. The power offtake for the balance of plant components ranges from approximately 6% during taxiing to over 16.5% during cruise and up to 22.7% at the top of the climb with reference to the fuel cell power.
An important aspect regarding fuel cell systems and their operation is the degradation of the fuel cell. One goal in aviation is to keep degradation to a minimum level to keep maintenance costs low. In order to prevent fuel cell degradation, it is important to consider certain factors:
- 1.
Sufficient amounts of hydrogen and oxygen have to be supplied to the fuel cell.
- 2.
The pressure at the anode side should be higher than at the cathode side while keeping within a specific limit.
- 3.
The temperature gradients, both spatial and temporal, should not exceed certain thresholds.
- 4.
The humidity management inside the fuel cell is of utmost importance to prevent flooding as well as dry-outs.
Thus, the first two aspects in particular are discussed in more detail below. First, the fuel and oxygen supply should be considered. The oxygen supply is already shown in
Figure 8. Assuming the mass flow of consumed oxygen in the fuel cell could be measured, the mass flow obtained in the simulation corresponds to a surplus ratio of 2 during most of the mission. In the case of the take-off, the surplus ratio drops to 1.35, which decreases the efficiency of the fuel cell slightly, but it does not impose oxygen starvation which would result in the degradation of the fuel cell. Fuel starvation is not a risk as well since the current control approach results in surplus ratios of a minimum of 6 for hydrogen. If nitrogen backdiffusion was considered, reaching an exemplary mass fraction of 50% before purging, the surplus ratio would still be sufficiently high.
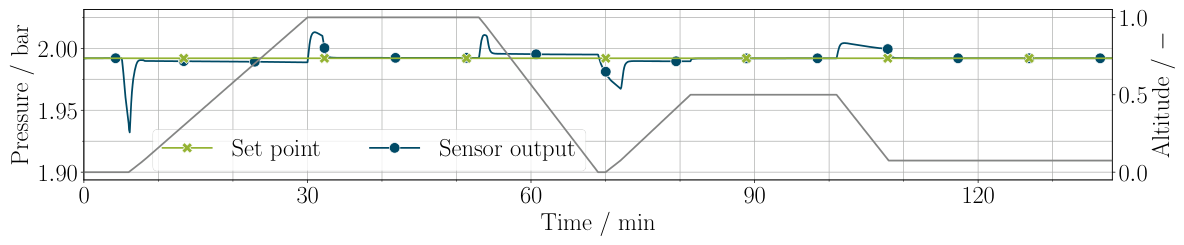
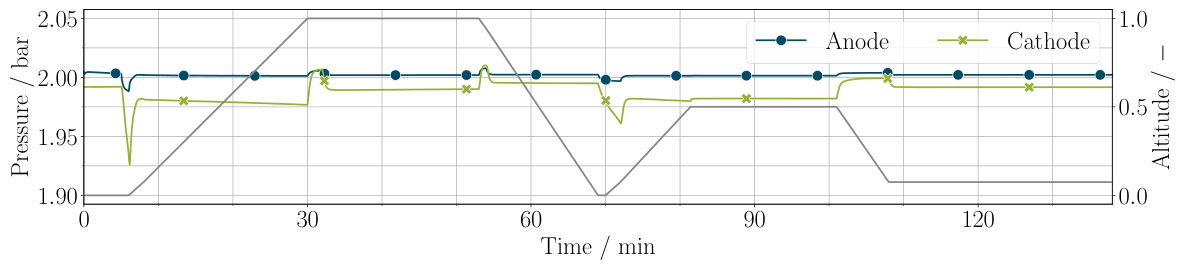
Second, the pressure difference between the anode and the cathode side shall be analyzed. To do so, the average pressure at each side is depicted in
Figure 12. In order to operate the fuel cell well, the anode-side pressure should be slightly higher than the cathode-side pressure. This is mainly to facilitate the diffusion of hydrogen ions through the membrane and at the same time to decrease the nitrogen backdiffusion. Simultaneously, the pressure difference must keep within a limit of approximately 0.2 bar in order to not structurally damage the membrane [
7]. Both of these aspects are achieved during the complete mission simulation.
Third, the temperature gradients, both spatial and temporal, should be considered. Since the focus of this work was not on the thermal management, however, the two quantities can be elaborated more thoroughly when realistic thermal management is included in the fuel cell system.
Fourth, two processes can occur which are related to the water content inside the fuel cell. Too much water inside the fuel cell can result in flooding and too little water can result in the drying-out of the membrane. Both of these processes imply heavy degradation on the fuel cell and can ultimately lead to its destruction. However, considering these effects in more detail than already presented in
Section 3.2 is not applicable at the current stage of the fuel cell model.
4. Conclusions
A dynamic PEM fuel cell system was modeled with the focus on the fuel cell stack, the hydrogen fuel supply and the air supply. When simulating the model over a complete aircraft mission including a reserve mission, the components showed realistic dynamic behavior. Together with this model, a baseline control scheme was developed using PI controllers. Although this control scheme is comprehensive with multiple individual controllers, it is able to provide the fuel cell with a sufficient amount of product gases at the desired temperature, pressure and relative humidity. Regarding the degradation of the fuel cell, the control can be improved, especially the thermal management. However, this subsystem was not the focus of this work. With this fuel cell system, many analyses are possible, e.g., a deeper investigation of transient operational points such as the take-off. The model can also be used to investigate the start-up of a fuel cell stack. Additionally, components and subsystems can easily be swapped out to compare different architectures. Furthermore, different control schemes can be developed with the focus on minimizing the degradtaion of the fuel cell, which is a very important aspect in aviation. Hence, the developed dynamic PEM fuel cell system model is a powerful baseline for many kinds of future analyses.