Proceeding Paper

Electrical Energy Storage and Conversion System Sizing, Performance and Battery Degradation in Hybrid Electric Regional Aircraft †
1
AIT Austrian Institute of Technology GmbH, Giefinggasse 2, 1210 Vienna, Austria
2
Department of Industrial Engineering, University of Salerno, Via Giovanni Paolo II 132, 84084 Fisciano, SA, Italy
*
Author to whom correspondence should be addressed.
Presented at the 15th EASN International Conference, Madrid, Spain, 14–17 October 2025.
Eng. Proc. 2026, 133(1), 26; https://doi.org/10.3390/engproc2026133026
Published: 21 April 2026

Abstract

To meet aviation decarbonization goals, novel electric energy storage systems are required. A promising approach combines a Li-ion battery with a hydrogen proton exchange membrane fuel cell system (PEMFCS) into an electrochemical energy storage and conversion (EC-ESC) system. Proper power management ensures efficiency, reliability and durability. The study investigates EC-ESC performance for regional hybrid electric aircraft under varying degrees of hybridization. By systematically adjusting the power split between the battery and FCS, we quantify its impacts on system sizing, energy efficiency and battery degradation. The results show that a well-balanced power distribution enhances overall efficiency and energy density while extending system lifetime.

1. Introduction

The aviation industry faces increasing regulatory, economic and societal pressure to reduce greenhouse gas emissions and to reach the international climate goals, like the Green Deal [1]. Representing 2.5% of total global CO2 emissions, aviation’s impact is growing with annual traffic increases of 3–4% [2,3,4,5]. Regional aircraft on short-range flights below 600 nmi (<1100 km) are major contributors to aviation’s climate impact [6]. In 2022, short-haul flights emitted 151 g CO2/km and domestic flights 246 g CO2/km, compared to 35 g CO2/km for national trains [7]. Although responsible for only 18% of these emissions, short-haul flights accounted for 55% of operations, highlighting their outsized impact on noise and air pollution [6]. With 3600–5000 regional aircraft in service in 2023, reducing their emissions is crucial for aviation sustainability [8,9]. Aviation electrification offers a promising path toward low-emission air transport, encompassing more electric aircraft (MEA) to hybrid electric aircraft (HEA) and full-electric systems [10,11]. HEAs are particularly suitable for regional aircraft carrying 50–100 passengers, relying on advanced onboard energy storage systems that meet demanding requirements for gravimetric energy density, power density, efficiency, cycle life and safety [5,12]. Li-ion batteries are mature, offering a suitably high-power density and rapid response to peak loads, but suffer from limited specific energy (currently ~300 Wh/kg, ~700 Wh/L [13,14]), safety issues and accelerated degradation under high charge and discharge rates (C-rates) posing significant challenges for their use in regional aircraft [14,15,16,17]. Conversely, hydrogen fuel cell systems (FCS) offer higher gravimetric energy density, ideal for cruise phases. Proton exchange membrane fuel cell systems (PEMFCSs) represent the most considered fuel cell varieties for aircraft applications, due to their relatively low operating temperatures, ranging from 30 to 100 °C. This temperature range facilitates rapid startup and efficient adaptation to fluctuating power demands. However, their slow dynamic response limits their ability to handle rapid load changes [18,19]. This complementarity has led to increasing interest in hybrid battery/FCS systems, improving overall efficiency and component longevity by having batteries handle peak loads and rapid responses, while PEMFCs ensure base load and long-range energy supply. Studies from Thonemann et al. [6] indicate that hydrogen-powered configurations, particularly those combining lithium-ion batteries with PEMFC, offer significant long-term environmental benefits, despite technical challenges such as hydrogen storage. Nevertheless, electrochemical energy storage and conversion (EC-ESC) systems introduce new engineering and operational challenges, primarily in energy distribution, power management and weight optimization. Improper control can result in energy losses, thermal stress or premature battery degradation. This study addresses these challenges by analyzing and optimizing the EC-ESC system for regional aircraft. We investigate how varying the energy share between the advanced Li-metal anode battery and the PEMFCS affects total system weight, energy losses, battery degradation (capacity fade, thermal stress), power distribution dynamics, charge/discharge behaviour (C-rate) and State-of-Charge (SoC) profiles. Through numerical simulations, we quantify the interdependencies and trade-offs, aiming to identify optimal control strategies that minimize energy losses and system weight while maximizing battery durability and overall system performance.
This work is organized into four sections: following the introduction (Section 1), Section 2 gives an overview of the systems architecture, battery and fuel cell modelling and EC-ESC management strategy, Section 3 discusses the results, and Section 4 summarizes key conclusions.

2. Methodology

This study’s methodology is based on a 0D system model of an EC-ESC for hybrid electric regional aircraft combining battery, PEMFCS and their power control. The EC-ESC architecture follows the HECATE architecture simulating one of the two independent electrical power supply units (Restricted access deliverables from the European Union Project HECATE (no 101101961)).
A numerical simulation framework was developed to evaluate performance, weight, and degradation characteristics. For this purpose, a Dymola/Modelica simulation model was established and refined from an initial battery system model to the full EC-ESC model. The battery model, detailed in Section 2.1, was enhanced with a power distribution block, integrating the PEMFCS baseline model (see details in Section 2.2), and a control logic for power sharing between the battery and PEMFCS (see details in Section 2.3). System performance requirements were derived from HECATE project inputs. Simulations were performed with a fixed time step of 0.001 s, using the DASSL solver, an implicit variable-step integration method and a numerical tolerance of 1 × 10⁻⁹.

2.1. Battery System Modelling

The initial battery system model simulates both thermal and electrical cell behaviour and enables flexible cell configuration. The modelling framework includes submodules for load, charging, control, environment, parameters, measurements and thermal management.
For modelling simplification, a scalable cell model was developed that replicates the electrothermal behaviour of a single cell and is scaled by the number of series (ns) and parallel (np) connections. A static, single-parameter model with SoC and temperature-dependent internal resistance was selected as it was considered accurate enough for system simulation.
Electrical losses within the cells are transferred to a lumped thermal model, capturing the coupled electrothermal interactions. Heat generation is assumed at the cell centre and conducted toward the two main surfaces of the pouch format cell for exchange with the cooling system, while lateral heat transfer is neglected. Convective heat transfer is assumed between the cell surfaces and the coolant. Thermal properties of the cooling medium are not considered. The thermal management system (TMS) regulates cooling power to prevent the battery pack temperature from exceeding a set temperature during flight. A Proportional-Derivative (PD) controller regulates coolant temperature, supported by a power limiter and temperature sensor. The system effectively mitigates cell temperature rise and reduces thermal hysteresis.
This study utilizes publicly available data from prototype high-energy Lithium-Nickel-Manganese-Cobalt-Oxide (NMC) and Li-metal anode pouch cells manufactured by SES that have demonstrated exceptional power performance (up to 7 C) alongside high energy density and enhanced safety [20,21,22,23]. Cell specifications were scaled and adjusted to the target design requirements (Table 1).

2.2. PEMFCS Modelling

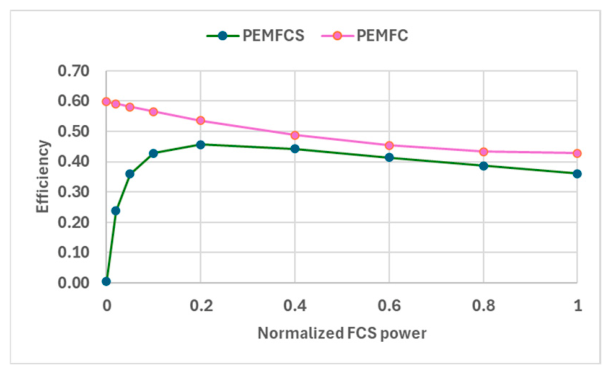
A control-oriented PEMFCS model, developed by UNISA, was implemented based on system- and stack-level efficiency functions (see Figure 1) [24]. This efficiency driven model calculates electrical outputs (current, voltage), heat dissipation, auxiliaries’ power consumption and hydrogen mass flow. It accommodates multi-stack configurations and accounts for the key technological constraints outlined in the Clean Hydrogen Partnership’s Strategic Research and Innovation Agenda (SRIA), particularly the power density requirements at 0.65 V, ensuring adequate stack efficiency [19,24,25]. More details on the implementation of the efficiency-driven model and PEMFCS degradation mechanisms of the PEMFCS can be found in the companion paper [26].
The PEMFCS is designed to operate synergistically with the battery. A system power density of 2 kW/kg and tank mass efficiency of 15% are assumed [27], and the nominal power output is set to 600 kW.

2.3. EC-ESC Management Strategy

The EC-ESC system integrates two primary components. Batteries support peak loads (e.g., takeoff), enhance operational flexibility and improve system energy efficiency, given by:
η system   =   E o u t , t o t a l e l   E F C S t o t + E B a t t o t ; E F C S t o t =   E F C S e l η F C S ;   E B a t t o t = E B a t e l + E B a t h e a t .
Hydrogen PEMFCS offer high gravimetric energy density and low system weight but suffer from rather lower power density and slow response to load changes, which necessitates auxiliary battery energy storage.
To evaluate the impact of different energy management strategies on performance, weight and degradation, four representative scenarios (I–IV) and one variation of Scenario II are established in Table 2. These reflect realistic power-sharing strategies with the battery’s energy share increasing from ~1:32 to ~1:4. Scenario I represents a fuel cell dominant configuration, serving as a reference case for minimal hybridisation. Scenarios II–III introduce increasing levels of battery assistance, especially during high power phases, where Scenario IIa. follows the same energy management strategy as Scenario II but incorporates additional parallel cells to accommodate the high C-rate. Scenario IV represents a substantial battery contribution.
The battery pack is scaled to the various mission profiles and power demands. With a cell-specific energy of 450 Wh/kg (pack level: 344 Wh/kg), it reflects battery technology projected to 2035 [14]. Each cell has the specifications listed in Table 1. To achieve a nominal system voltage of 800 V, 210 cells are connected in series. Table 3 summarizes the required and actual pack energy as a result of the specific serial and parallel cell configurations.
The required PEMFCS energy varies between 920 and 1100 kW across the scenarios. The stack has a volume of approximately 706 L and a mass of approximately 300 kg, while the tank volume ranges from 916 L to 1085 L depending on the scenario.

3. Simulation Results

This section presents the results of the numerical simulations conducted using the developed EC-ESC system model. The analysis includes four key aspects: system performance, thermal behaviour, system weight and battery degradation.

3.1. System Performance

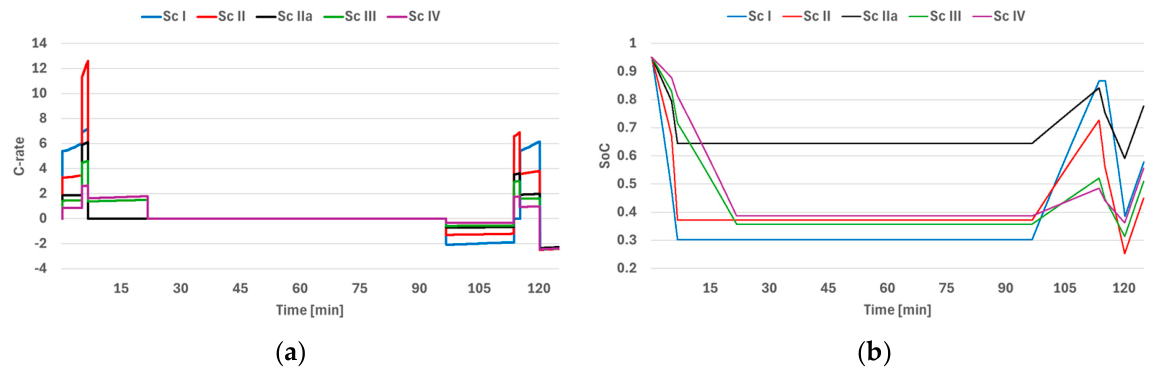
Simulation results indicate that system performance and energy efficiency are strongly influenced by the energy-sharing strategy. In Scenarios I and II, the smaller battery capacity results in higher average C-rates (up to 13 C during takeoff, Figure 2a) and larger SoC gradients (Figure 2b), increasing instantaneous thermal stress and resistive losses, which reduce electrical energy conversion efficiency. Scenario IIa., a variation of Scenario II, demonstrates the impact on the C-rate by increasing the number of parallel cells. The lower current (peak < 7 C) mitigates thermal load and voltage drop during load changes. More balanced configurations, Scenario III and IV, exhibit smoother power transitions. Larger battery capacity keeps peak C-rates below 5 C (Figure 2a) and SoC within a narrower operating window (Figure 2b), enhancing electrochemical stability and minimizing thermal peaks.
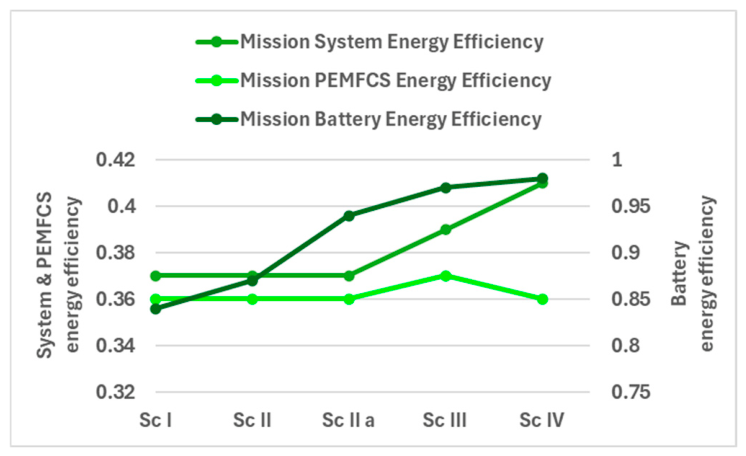
The analysis of energy efficiency across the mission scenarios reveals that while PEMFCS efficiencies remain relatively constant at around 36%, battery energy efficiency shows a significant improvement, increasing from 84% in Scenario I to 98% in Scenario IV due to higher capacity and lower recharge demand. This also positively influences the system energy efficiency, which increases by up to 4%, but is determined by the low energy efficiency of the PEMFCS (Figure 3).

3.2. Thermal Behaviour

Battery temperature closely follows C-rate and SoC gradients across flight phases. The target coolant temperature was set to 20 °C with unlimited cooling power. Cooling demand is low during taxi-out and takeoff, increases during landing and taxi-in due to increased resistance at low SoC, and peaks during fast charging. Differences in discharge cooling demand primarily result from SoC-dependent internal resistance, with cell temperature playing a secondary role. Scenario I shows a temperature rise of 2.5 °C and heat release of 39 kW. Scenario II exhibits higher thermal stress with a 2.7 °C increase and peak heat release of 188 kW, due to high C-rates during takeoff. Scenario IIa. illustrates the impact of reduced C-rates: despite having an identical mission power and energy consumption as Scenario II, more parallel cells lower current, reducing the maximum temperature rise to 0.6 °C and peak heat release to 72 kW, improving thermal stability with minimal mass penalty. In Scenarios III and IV, temperature remains nearly constant (20 °C), with heat generation of 51 kw and 27 kW, respectively, indicating sufficient cooling (Table 4). PEMFCS produces a nearly constant heat loss of approximately 950 kW during steady operation, except in Scenario III, where the battery assistance during climb reduces PEMFCS load and heat loss to below 400 kW (Table 4).

3.3. System Weight

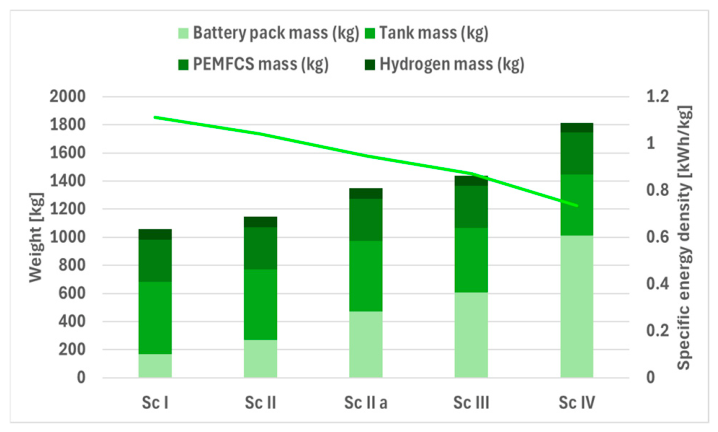
Higher energy demand, reaching approximately 350 kWh (Table 3) in Scenario IV, requires larger battery packs, which increases the weight of the EC-ESC. The higher gravimetric energy density of hydrogen partially compensates for the increase, so the total system weight does not scale linearly with the battery pack size. Scenario IIa. adds approximately 200 kg compared to Scenario II but improves thermal behaviour and reduces thermal stress. Among all cases, Scenario III offers the most favourable trade-off between weight and performance, achieving a total mass reduction of approximately 19% compared to the battery-heavy setup (Scenario IV) without compromising performance. The comparison is depictured in Figure 4.

3.4. Battery Degradation

Since no ageing data are available for Li-metal anode cells, the sensitivity of degradation with respect to the operating strategy is assessed with a reference ageing model from literature [28]. Long-term simulations were performed until capacity dropped to 80% of the initial value. In Scenarios I and II, limited battery capacity causes high C-rates and charge throughput due to higher recharge energy demand (Table 5), accelerating capacity fade and thermal stress, especially during takeoff, when high currents raise cell temperature and internal resistance. Scenario IIa., with lower currents, achieves the longest predicted cycle life (Table 5). Balanced configurations (Scenarios III and IV) distribute power demand more evenly, reduce relative currents, mitigate SoC gradients and slow degradation. These scenarios extend battery life by up to 23% compared to Scenarios I and II, while differences between Scenario III, IV and Scenario IIa. remains below 10% (Table 5). Table 5 illustrates the recharge energy demand and the relative battery life (to 80% state of health) of Scenarios I–IIa, IV with respect to Scenario III, which represents the optimal balance between performance, weight and degradation.
Industry data indicate that Li-metal cells currently achieve around 500–700 cycles [20]. This remains far from the target of 2000+ cycles, which is required for economic utilization of batteries in hybrid electric regional aircraft.

4. Discussion and Conclusions

This study presents a detailed analysis of an EC-ESC system integrating advanced Li-metal batteries and a PEMFCS for regional hybrid electric aircraft. Simulations demonstrate that the energy-sharing strategy critically affects mission energy efficiency and performance, weight and component longevity. Limited battery capacities (Scenarios I and II) result in extreme C-rates and large SoC gradients, increasing electrochemical and thermal stress while reducing conversion efficiency through resistive losses. Scenario IIa., with identical mission energy and power demand as Scenario II, highlights the benefits of increased battery capacity: despite approximately 200 kg higher mass, it exhibits markedly lower thermal stress and the longest predicted cycle life. On the other hand, Scenario IIa. shows unutilized capacity, which indicates a possible further downsizing of the battery. Configurations of Scenarios III and IV achieve smoother power distribution, lower thermal gradients, enhanced system and battery energy efficiency and improved component stability at increased system mass. Scenario III provides the best trade-off between performance, weight and durability: it achieves nearly the same mission energy efficiency gains as Scenario IV (up to 4%) while avoiding a mass penalty (19% less weight compared to Scenario IV). At the same time, Scenario III maintains a low peak temperature rise compared to Scenarios I and II. Scenario IIa. performs similar to Scenario III at slightly lower system weight but higher peak C-rate. In general, the system sizing is strongly determined by the PEMFCS energy efficiency. Its improvement is a key lever to system optimization.

Author Contributions

Conceptualization, E.H., A.R. and H.K.; methodology, E.H. and A.R.; software, E.H. and P.A.; validation, E.H. and P.A.; writing—original draft, E.H.; writing—review and editing, A.R., H.K., P.A. and E.H.; visualization, E.H.; supervision, H.K., A.R. and M.S. All authors have read and agreed to the published version of the manuscript.

Funding

This research is funded by the European Union under GA no 101101961—HECATE. Views and opinions expressed are however those of the author(s) only and do not necessarily reflect those of the European Union or Clean Aviation Joint Undertaking. Neither the European Union nor the granting authority can be held responsible for them. The project is supported by the Clean Aviation Joint Undertaking and its Members.

Institutional Review Board Statement

Not applicable.

Informed Consent Statement

Not applicable.

Data Availability Statement

Data is available upon request.

Conflicts of Interest

Authors Emina Hadžialić, Alexander Ryzhov, and Helmut Kühnelt were employed by the company AIT Austrian Institute of Technology GmbH, Electric Vehicle Technologies. The remaining authors declare that the research was conducted in the absence of any commercial or financial relationships that could be construed as a potential conflict of interest.

References

  1. A Green Deal Industrial Plan for the Net-Zero Age. Available online: https://ec.europa.eu/commission/presscorner/detail/en/fs_24_1391 (accessed on 10 September 2025).
  2. Where Do CO2 Emissions from Transport Come from? Available online: https://ourworldindata.org/co2-emissions-from-transport (accessed on 10 September 2025).
  3. What Share of Global CO2 Emissions Come from Aviation? Available online: https://ourworldindata.org/global-aviation-emissions (accessed on 2 October 2025).
  4. ACI World Airport Traffic Forecasts 2023–2052. Available online: https://store.aci.aero/wp-content/uploads/2024/02/WATF-Executive-Summary.pdf#:~:text=By%20the%20end%20of%202024%2C%20global%20passenger%20traffic,to%202042%2C%20and%203.6%25%20from%202023%20to%202052 (accessed on 4 September 2025).
  5. A Route to Net Zero European Aviation. Available online: https://transition-pathways.europa.eu/system/files/2025-02/DESTINATION-2050-Roadmap-2025_compressed.pdf (accessed on 2 September 2025).
  6. Thonemann, N.; Pierrat, E.; Dudka, K.M.; Saavedra-Rubio, K.; Dragsdahl, A.L.S.T.; Laurent, A. Towards sustainable regional aviation: Environmental potential of hybrid-electric aircraft and alternative fuels. Sustain. Prod. Consum. 2024, 45, 371–385. [Google Scholar] [CrossRef]
  7. Which form of Transport Has the Smallest Carbon Footprint? Available online: https://ourworldindata.org/travel-carbon-footprint (accessed on 2 September 2025).
  8. How Many Commercial Airplanes Are There in the World? Available online: https://myaircraftcost.com/how-many-commercial-airplanes-are-there-in-the-world/ (accessed on 10 November 2025).
  9. A Plan for More Planes. Available online: https://www.mckinsey.com/featured-insights/week-in-charts/a-plan-for-more-planes (accessed on 10 November 2025).
  10. Wheeler, P.; Bozhko, S. The More Electric Aircraft: Technology and challenges. IEEE Electrif. Mag. 2014, 2, 6–12. [Google Scholar] [CrossRef]
  11. Tom, L.; Khowja, M.; Vakil, G.; Gerada, C. Commercial Aircraft Electrification—Current State and Future Scope. Energies 2021, 14, 8381. [Google Scholar] [CrossRef]
  12. Pattanayak, T.; Mavris, D. Battery technology for sustainable aviation: A review of current trends and future prospects. Appl. Energy 2025, 397. [Google Scholar] [CrossRef]
  13. SES.ai. 10 Years of Li-Metal Batteries Technology, Supply Chain, and New Business Model. Investor Presentation. Available online: https://s29.q4cdn.com/695431818/files/doc_presentation/2022/06/SES-Investor-Presentation-Marketing-Handout-6-9.pdf (accessed on 10 October 2025).
  14. Hasan, M.M.; Haque, R.; Jahirul, M.I.; Rasul, M.G.; Fattah, I.M.R.; Hassan, N.M.S.; Mofijur, M. Advancing energy storage: The future trajectory of lithium-ion battery technologies. J. Energy Storage 2025, 120, 116511. [Google Scholar] [CrossRef]
  15. Li, M.; Lu, J.; Chen, Z.; Amine, K. 30 Years of Lithium-Ion Batteries. Adv. Mater. 2018, 30, 1800561. [Google Scholar] [CrossRef] [PubMed]
  16. Aphale, S.; Kelani, A.; Nandurdikar, V.; Lulla, S.; Mutha, S. Li-ion Batteries for Electric Vehicles: Requirements, State of Art, Challenges and Future Perspectives. In Proceedings of the PECon 2020, Virtual, 7–8 December 2020. [Google Scholar] [CrossRef]
  17. Strategic Research Agenda for Batteries 2020. Available online: https://ec.europa.eu/newsroom/ener/items/696024/en (accessed on 17 September 2025).
  18. Adler, E.J.; Martins, J.R.R.A. Hydrogen-powered aircraft: Fundamental concepts, key technologies, and environmental impacts. Prog. Aerosp. Sci. 2023, 141, 100922. [Google Scholar] [CrossRef]
  19. Dicks, A.L.; Rand, D.A.J. Fuel Cell Systems Explained, 2nd ed.; Wiley: Hoboken, NJ, USA, 2018. [Google Scholar] [CrossRef]
  20. SES.ai. AI-Enhanced High Energy Density and High Power Density Li-Metal and Li-Ion Batteries. Available online: https://s29.q4cdn.com/695431818/files/doc_presentation/2025/06/sesai_ir_deck_2025-June.pdf (accessed on 1 September 2025).
  21. Eclipse Energy LLC. Test Report: RPT-21-635_Ivanhoe_Cell Characterization_Rev.1. Available online: https://s29.q4cdn.com/695431818/files/doc_downloads/tech_reports/Eclipse-Test-Report.pdf (accessed on 1 September 2025).
  22. Exponent. SES Cell Electrical Test. Available online: https://docs.publicnow.com/viewDoc?filename=182779%5CEXT%5CEC8D5C34F65C17056EE5006D07A0976CC88D51B5_1349F43EED54CB170CE23CD52056B727409B38FD.PDF (accessed on 1 September 2025).
  23. Ivanhoe Capital. Summary of 3rd Party Testing of SES Hybrid Lithium-Metal Cells. Available online: https://s29.q4cdn.com/695431818/files/doc_downloads/tech_reports/Test-Report-Summary.pdf (accessed on 1 September 2025).
  24. Aliberti, P.; Minneci, M.; Sorrentino, M.; Cuomo, F.; Musto, C. Efficiency-Based Modeling of Aeronautical Proton Exchange Membrane Fuel Cell Systems for Integrated Simulation Framework Applications. Energies 2025, 18, 999. [Google Scholar] [CrossRef]
  25. Clean Hydrogen Partnership. Strategic Research and Innovation Agenda. Available online: https://www.clean-hydrogen.europa.eu/about-us/key-documents/strategic-research-and-innovation-agenda_en (accessed on 10 October 2025).
  26. Aliberti, P.; Hadžialić, E.; Sorrentino, M.; Kühnelt, H. Degradation-Aware Preliminary Sizing and Control Framework for Regional Aircraft Hybrid Fuel Cell-Battery Systems. In Proceedings of the 15th EASN International Conference on “Innovation in Aviation & Space Towards Sustainability Today and Tomorrow, Madrid, Spain, 14–17 October 2025. [Google Scholar]
  27. Sparano, M.; Sorrentino, M.; Troiano, G.; Cerino, G.; Piscopo, G.; Basaglia, M.; Pianese, C. The future technological potential of hydrogen fuel cell systems for aviation and preliminary co-design of a hybrid regional aircraft powertrain through a mathematical tool. Energy Convers. Manag. 2023, 281, 116822. [Google Scholar] [CrossRef]
  28. Xu, B.; Oudalov, A.; Ulbig, A.; Andersson, G.; Kirschen, D.S. Modeling of Lithium-Ion Battery Degradation for Cell Life Assessment. IEEE Trans. Smart Grid 2018, 9, 1131–1140. [Google Scholar] [CrossRef]
Figure 1. PEMFCS/PEMFC efficiency curves [24,25].
Engproc 133 00026 g001
Figure 2. C-rate (a) and SOC (b) for each scenario.
Engproc 133 00026 g002
Figure 3. Mission energy efficiency (Equation (1)) comparison: system vs. PEMFCS vs. battery.
Engproc 133 00026 g003
Figure 4. System weight vs. system-specific energy density for each scenario. The bars show the mass breakdown (left axis), while the green line represents the specific energy density (right axis).
Engproc 133 00026 g004
Table 1. Specifications of the Li-ion battery cell used for battery model parametrization.
Cell PropertyValueUnit
FormatPouch-
Nominal capacity24/29 2Ah
Nominal energy91.68/110.78 2Wh
Gravimetric energy density 450Wh/kg
Mass0.204/0.246 2kg
Nominal voltage3.82V
Specific heat capacity~560J/(kg·K)
Thermal conductivity in-plane direction11.4W/(m·K)
Thermal conductivity plane direction4.6W/(m·K)
2 The reduced battery energy demand in Scenario I required scaling down the cell capacity. The smaller battery is mass efficient without affecting performance.
Table 2. Energy share for each phase and scenario.
ScenarioTaxi
(Out, In)
TakeoffClimbCruiseDescentLandingEnergy Share
I.BATBAT + FCSFCSFCSrechargeFCS~1:32
II.BATBATFCSFCSrechargeBAT~1:19
IIa.BATBATFCSFCSrechargeBAT~1:19
III.BATBATBAT + FCSFCSrechargeBAT~1:7
IV.BATBATBATFCSrechargeBAT~1:4
Table 3. Battery energy and number of parallel cells.
ScenarioI.II.IIa.III.IV.
Required Battery energy (kWh)44.891.791.7208.9 326.1
Number of cells connected in parallel3479 15
Actual battery pack energy (kWh)46.593.1162.8209.4349
Table 4. Battery temperature, cooling power, C-rate and battery/PEMFCS heat release.
ScenarioBattery Target Operating Temperature [°C]Maximum Cooling Power [kW]C-RateMax. Battery Temperature Increase [°C]Max. Battery Heat Release at End of Takeoff [kW]FCS Heat Release [kW]
I.202072.539950
II.2043132.7188950
IIa.202060.672950
III.202050.451380/950
IV.202030.327950
Table 5. Recharge energy demand during flight and relative battery life with respect to Scenario III.
ScenarioIIIIIa.III.IV.
Recharge energy demand76.5%37.4%37.4%16.4%10.5%
Battery life 83%86%109%100% (Ref)106%
Disclaimer/Publisher’s Note: The statements, opinions and data contained in all publications are solely those of the individual author(s) and contributor(s) and not of MDPI and/or the editor(s). MDPI and/or the editor(s) disclaim responsibility for any injury to people or property resulting from any ideas, methods, instructions or products referred to in the content.