Proceeding Paper

The Challenges in Extending Engine Performance Modeling for Highly Integrated Transport Aircraft †
1
Institute of Aircraft Propulsion Systems, University of Stuttgart, Pfaffenwaldring 6, 70569 Stuttgart, Germany
2
Institute of Jet Propulsion and Turbomachinery, TU Braunschweig, Hermann-Blenk-Straße 37, 38108 Braunschweig, Germany
*
Author to whom correspondence should be addressed.
Presented at the 15th EASN International Conference, Madrid, Spain, 14–17 October 2025.
Eng. Proc. 2026, 133(1), 181; https://doi.org/10.3390/engproc2026133181
Published: 28 May 2026

Abstract

The utilization of boundary layer ingestion in combination with a turbofan engine with an ultra-high bypass ratio is regarded as one of the possible solutions to increase the energy efficiency of the aircraft as a complete system. However, this concept inevitably leads to strong coupling between the external aircraft flow and engine internal flow, associated with an increased degree of flow non-uniformity. As a consequence, the engine components experience changed matching, and their performance is dependent on the engine power settings, aircraft design and flight conditions. All of these installation effects are reflected in engine performance modeling, which can enable reliable engine performance assessment. In this context, this article investigates the sensitivity of such engines and discusses possible approaches and preliminary ideas in extending engine performance modeling.

1. Introduction

Boundary layer ingestion (BLI) engines support wet area reduction in aircraft by eliminating external mounting and reducing the pylon structure surface. This offers an opportunity to reduce aircraft drag, increase the propulsion efficiency and consequently decrease the fuel consumption, as discussed by Arend et al. [1]. However, with the direct ingestion of the fuselage flow into the engine, the aerodynamic integration between the aircraft and the propulsion system is increased, and this leads to a significant installation effect compared with conventional configurations.
In addition to BLI configurations, the application of an ultra-high bypass ratio (UHBR) design also brings several benefits, as discussed by Giesecke et al. [2]. With an increased injected mass flow, the engine can realize huge thrust while decreasing the jet velocity, which further leads to lower fuel consumption during a flight. Nevertheless, several challenges regarding the UHBR design have been noted. A fan with an ultra-high bypass ratio forces the nozzle to operate more often at the steeper side of its characteristic curve, as shown in Figure 1. Compared with a nozzle at a low bypass ratio, the nozzle for an engine with a high bypass ratio operates more frequently and is unchecked. Under this scenario, the engine is more sensitive to disturbances from the outside; as a consequence, the operation points of the engine components can vary within a wider range in terms of their characteristics. This effect further strengthens the interactions between the engine components, as well as the interaction of the engine itself with the nacelle external flow.

2. Materials and Methods

Several previous studies have already shown that the application of a BLI engine leads to distortions in the flow field in front of the fan. Mennicken et al. [3] carried out a detailed investigation of flow pattern changes and the consequent deviations in fan operation for such a configuration. Their research revealed that the distorted field resulting from BLI changes the incidence of the fan flow and therefore alters the fan operation point on its map. In order to develop an accurate fan performance modeling method based on the consideration of this form of distorted flow after BLI, an improved understanding of fan performance is required.

2.1. Fan Performance Parameters

Based on the Euler equation, the work of a turbomachine can be written as in Equation (1). Together with the flow triangles of a blade, as well as the non-dimensional forms of relevant parameters, Equation (1) can be further transformed into Equation (2):
Δ h t = u · Δ ω u
Δ h t = f ( axial and circumferential Mach number , in -   and outflow angle , rotor geometry ) .
If the geometrical parameters that are specified by the configuration of the investigated turbomachine are neglected, Equation (2) clearly shows that, besides the two explicit Mach numbers, there is an implicit combination of the in- and outflow angles in the blade passage that is relevant to the fan working point in the fan map. As shown by Mennicken et al. [3], the incidence change from the induced swirl pair changes the operation point of the fan, which cannot be simply regarded as movement along the same fan with a reduced rotation speed line. This meas that a normal fan map that is acquired by measurement in uniform test conditions is not applicable to the same fan operating with a BLI configuration. As a consequence, any assessment of such a fan requires reliable modeling of the fan’s performance with the consideration of this installation effect.

2.2. Installation Effect

Besides the flow distortion in front of the fan, the characteristics of the BLI intake, nozzle and bypass duct also play important roles in the determination of the fan operation point. Based on Equation (3) below, the fan operation point is determined by two groups of parameters together. The first group represents the fan’s capabilities in performing work, as described by the Euler equation and represented by M a a x , f a n , π f a n , η f a n . The second group of parameters is related to the neighboring components of the fan. ζ i n t a k e is the pressure loss in the intake, while Δ H t , B y p a s s D u c t is the heat transfer in the bypass duct. M a n o z z l e , P t , n o z z l e P a m b i e n t reflect the characteristics of the nozzle, and they are linked by the nozzle coefficients, such as the discharge coefficient C d and the specific thrust coefficient C f g , in nozzle performance assessment. This means that any variation in these components’ characteristics resulting from the installation will also exert an impact on fan operation. Therefore, the accurate assessment of neighboring components becomes critical for fan performance assessment and vice versa.
M a a x , f a n = f ( ζ i n t a k e , Δ H t , B y p a s s D u c t , π f a n , η f a n , M a n o z z l e , P t , n o z z l e P a m b i e n t , A n o z z l e A f a n , m ˙ f a n m ˙ n o z z l e )

3. Results and Discussion

3.1. Baseline Engine Cycle Design

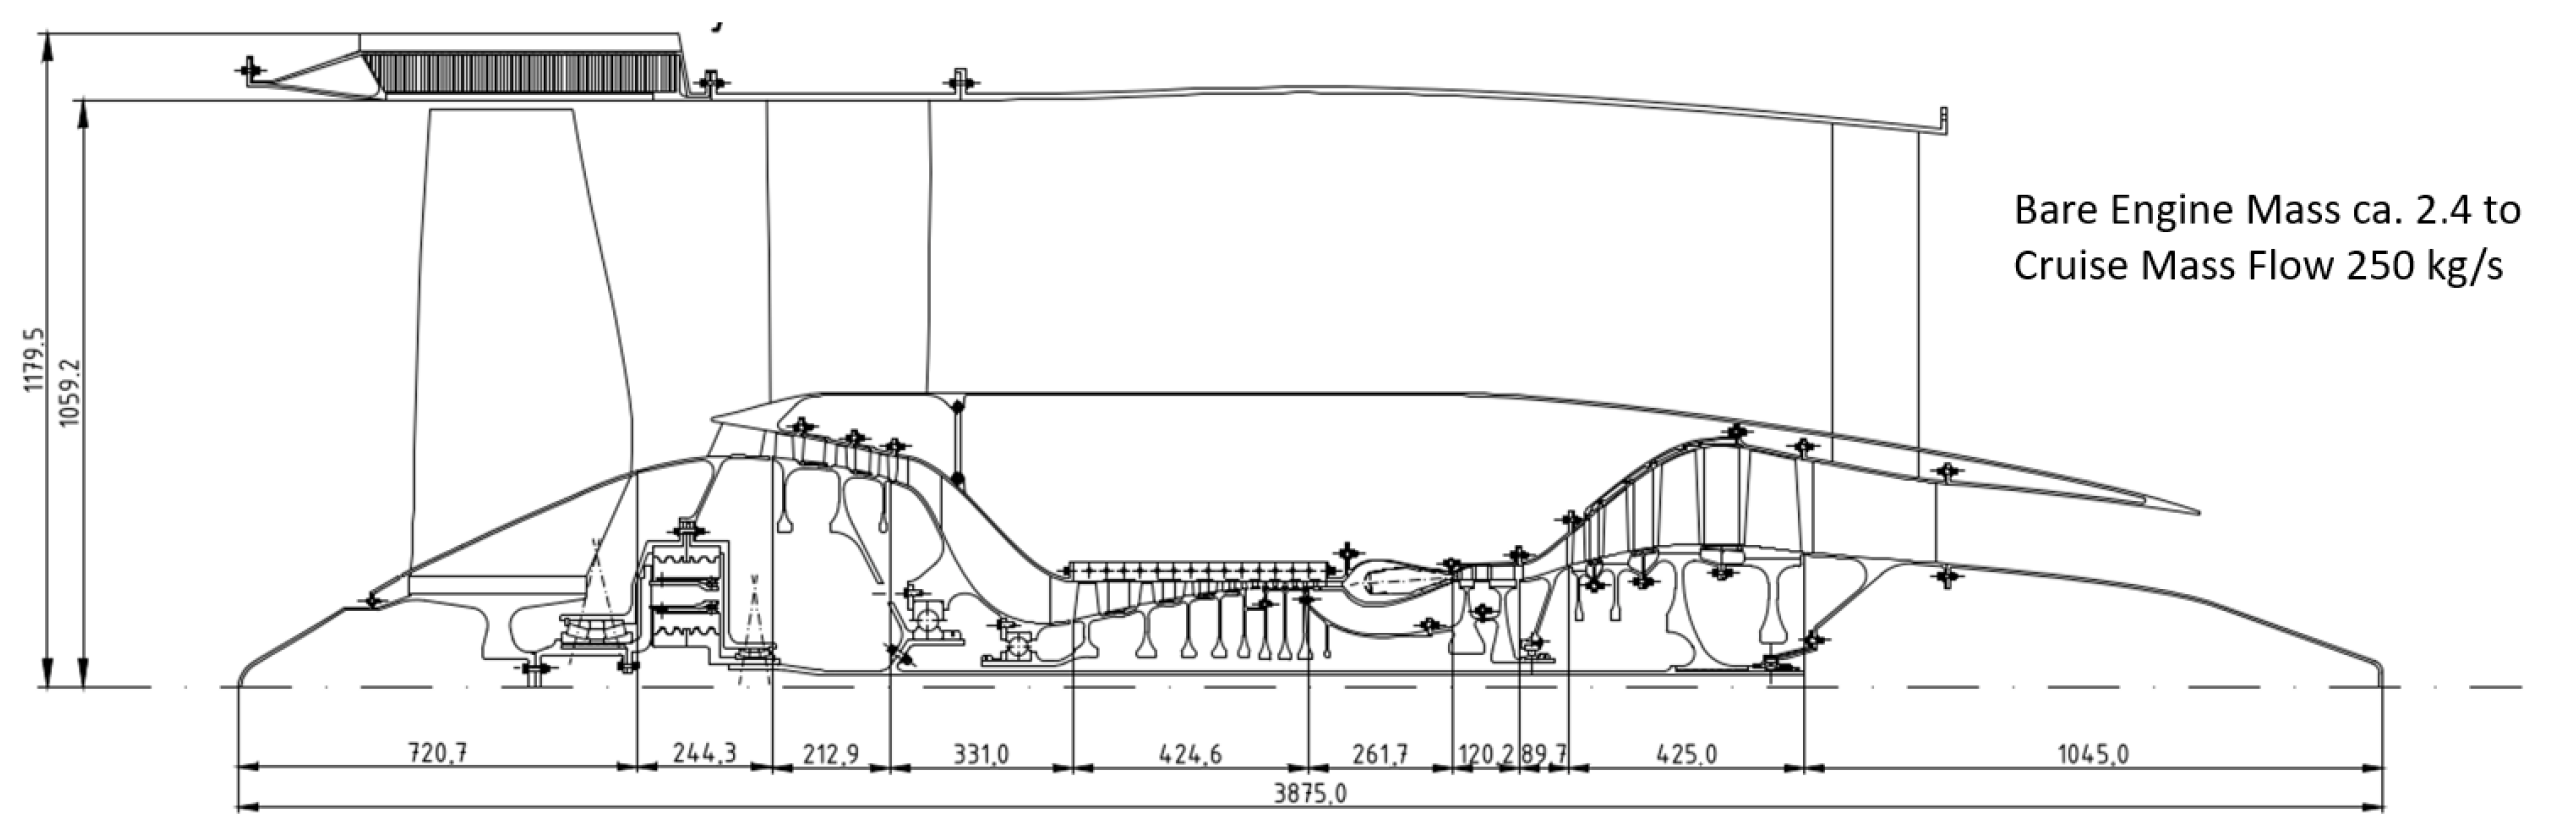
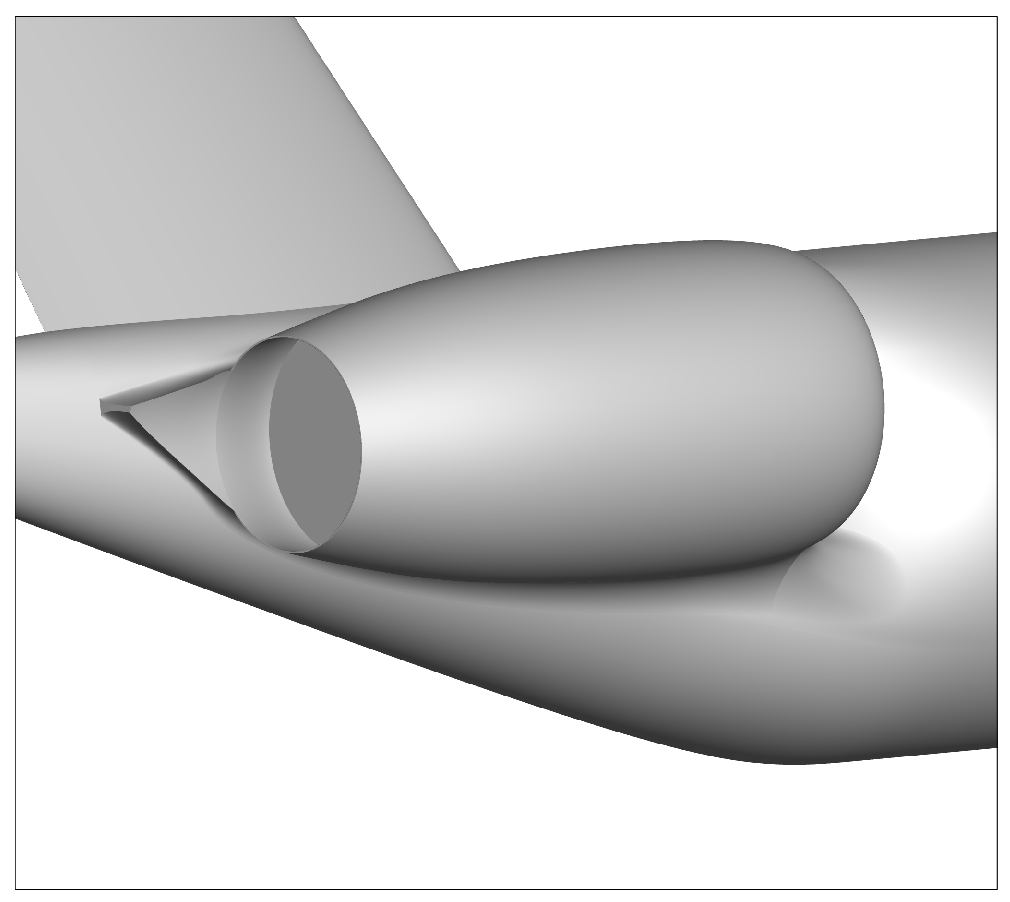
The engine cycle data at the design point is generated using the commercial tool GasTurb [4]. A two-spool geared turbofan configuration with an internal mixing nozzle is selected (Figure 2), with cruise operation defined as the design point, considering that it represents the longest segment of the mission and accounts for the majority of the total fuel burn [5]. The ultra-high-bypass-ratio (UHBR) engine used in this study is based on the design presented in [2]. A bypass ratio (BPR) of 18 is selected as it offers a favorable trade-off between decreasing specific fuel consumption (SFC) and the increasing total engine mass arising from the larger fan module. At the same time, the minimum take-off weight is also achieved with this BPR. Meanwhile, by employing a common nozzle outlet, the exhaust–rear airframe integration is simplified, as the number of outlets is reduced to one, as seen in Figure 3.
Sensitivity analyses examining the relationship between the fan pressure ratio (FPR), BPR and TSFC show that, for a given BPR, there is an optimal FPR that minimizes the TSFC. This optimal FPR decreases as the BPR increases, and the corresponding reductions in TSFC exhibit diminishing returns. The transonic fan stage used in this study—characterized by a hub-to-tip ratio of 0.25, an FPR of 1.34, a fan tip diameter of 2.1 m and isentropic efficiency of 93%—is based on rotor designs developed for an overwing-mounted UHBR engine in [7]. An analysis is also conducted to determine suitable values for the overall pressure ratio (OPR) and burner exit temperature (T4), with the core efficiency as the parameter of interest. T4, corresponding to the maximum core efficiency, increases with the OPR; however, constraints—such as the blade height of the final compressor stage and the thermal loading in the turbine—limit the OPR to 75 and T4 to 1700 K, yielding core efficiency of 58%. These are consistent with the findings presented in [8,9]. The remaining turbomachinery components within the core are modeled using efficiencies representative of the current state of the art. Finally, in modeling the nozzle, C D and C F G are prescribed. Based on the optimization studies presented in [10,11], which advocate for a shorter and flatter nozzle geometry, values of 0.986 and 0.995, respectively, are adopted.

NPSS Engine Cycle Data at Cruise and Take-Off Design Points

A numerical propulsion system simulation (NPSS) model derived from the GasTurb model with the implementation of different component maps is used in the subsequent investigation. Part of the engine cycle data simulated with this model for both cruise and take-off points is shown in the following Table 1.

3.2. Sensitivity Analysis of Engine Performance

As already described above, the variation in losses at different engine components can lead to rematching in the engine, which in turn exerts an overall impact on engine performance. In order to understand this rematch, a sensitivity analysis focusing on the engine SFC and fan stability is carried out by introducing one percent artificial loss in different components during an engine performance simulation.

3.2.1. Specific Fuel Consumption

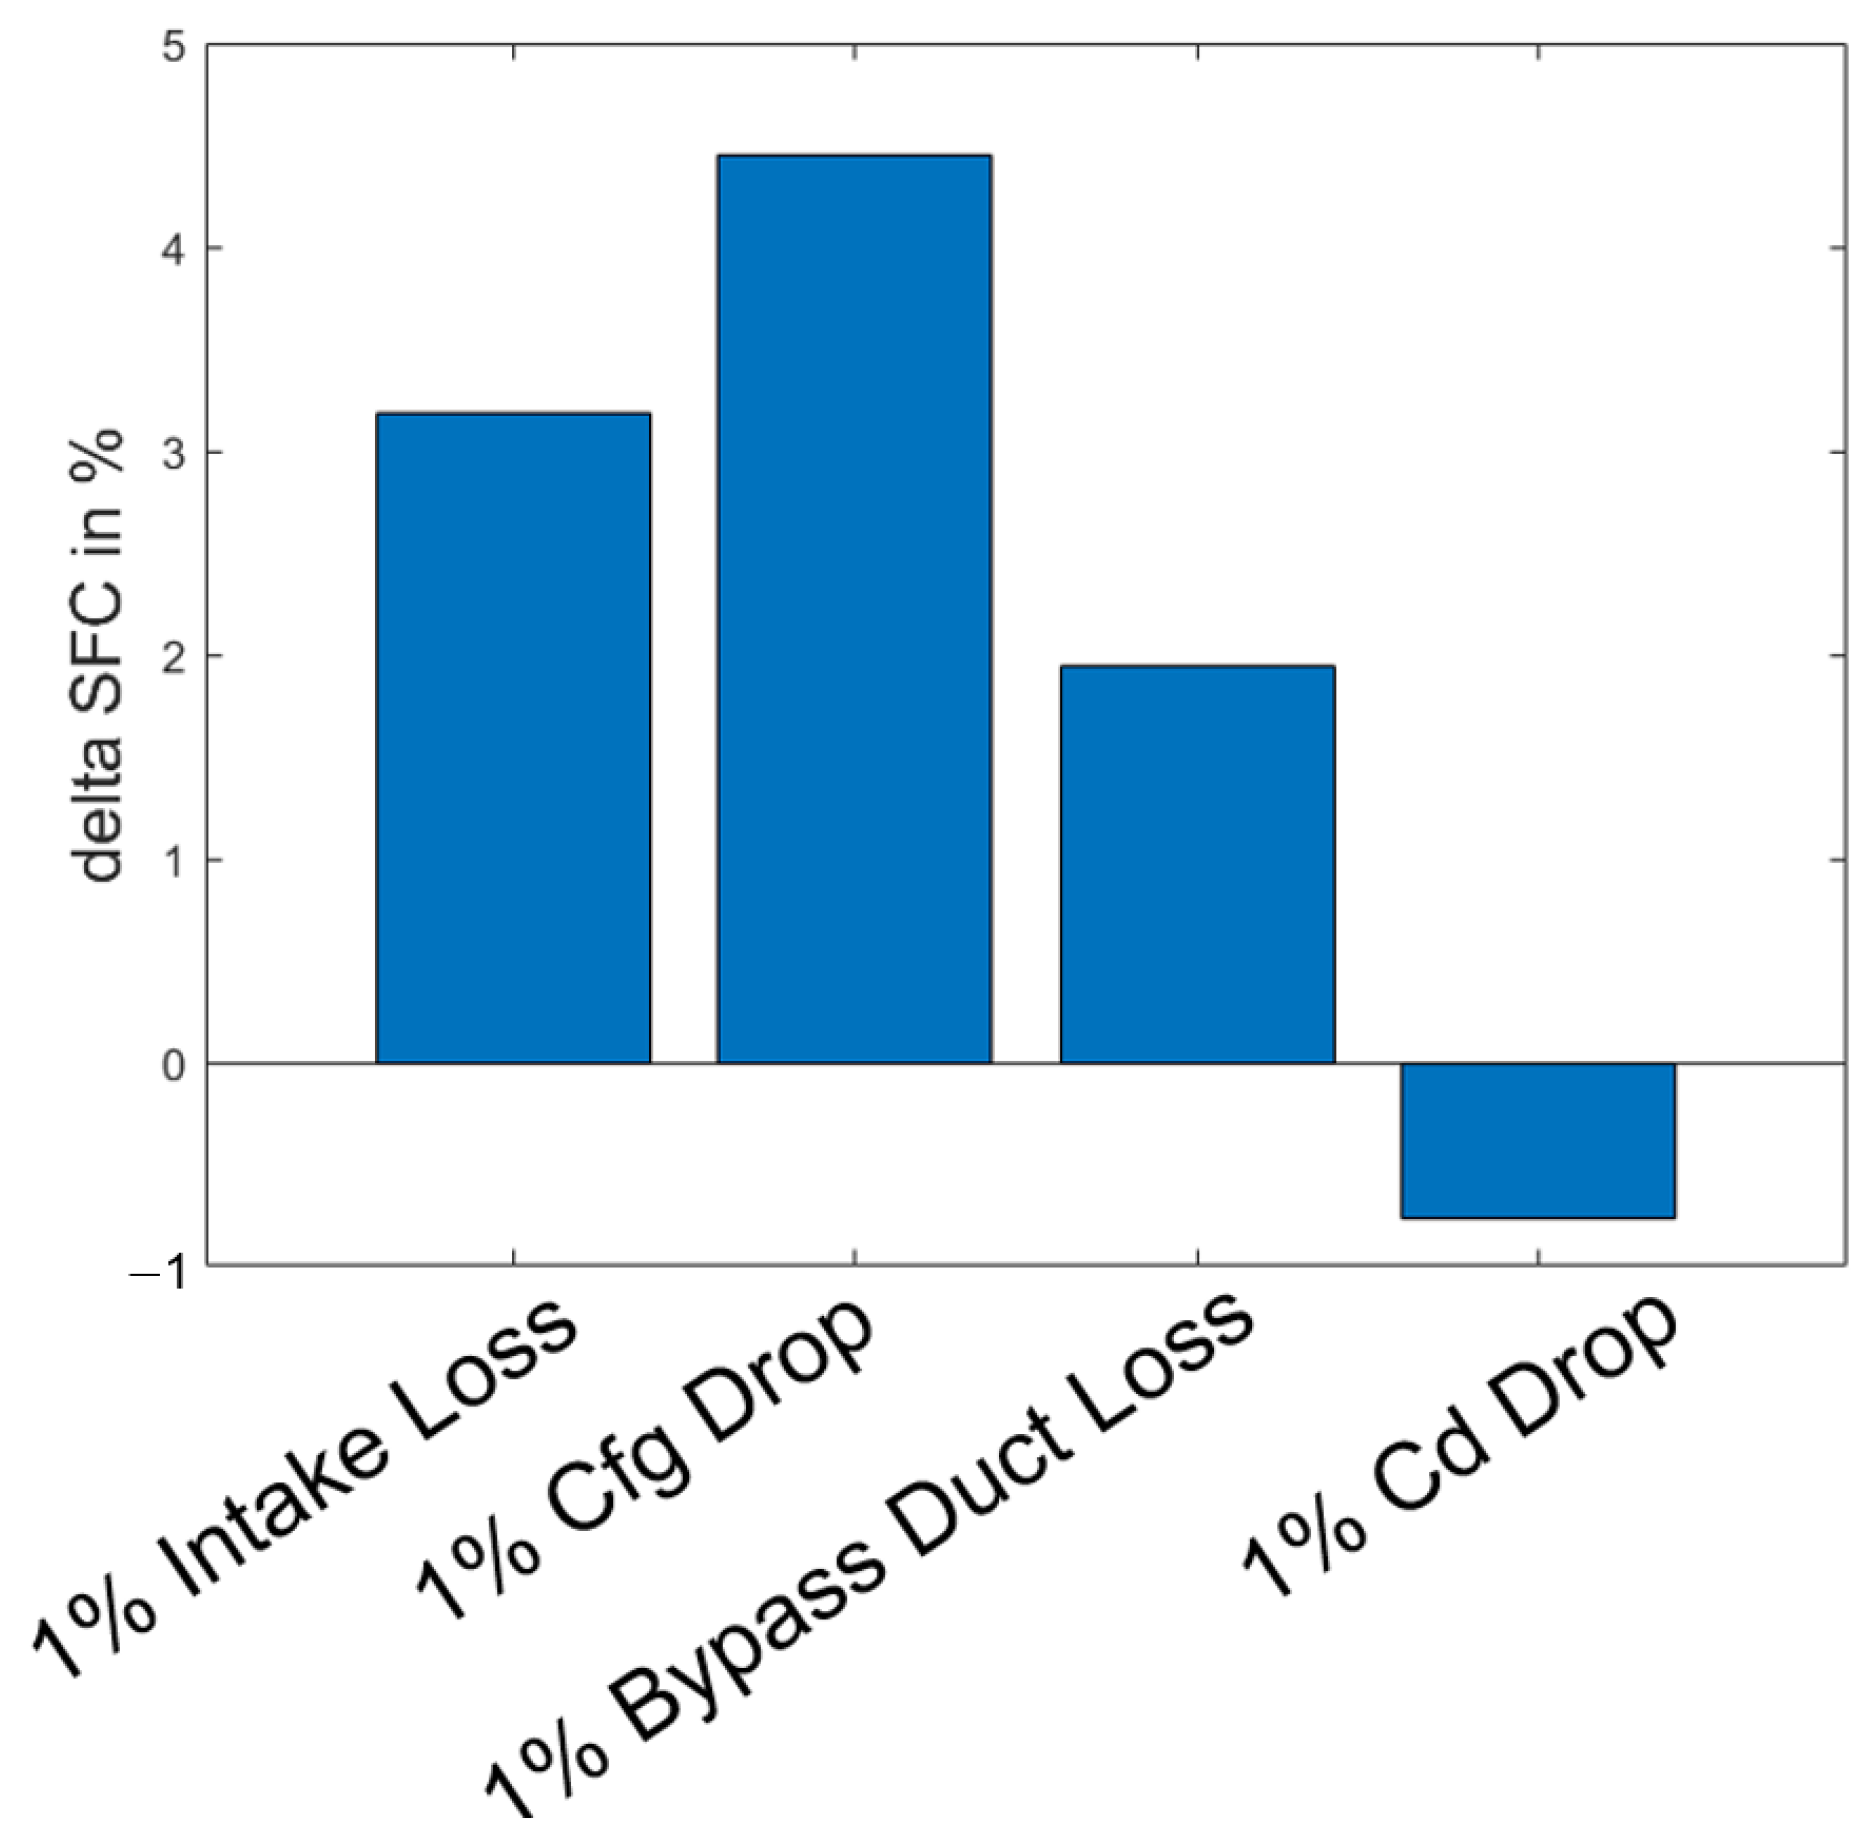
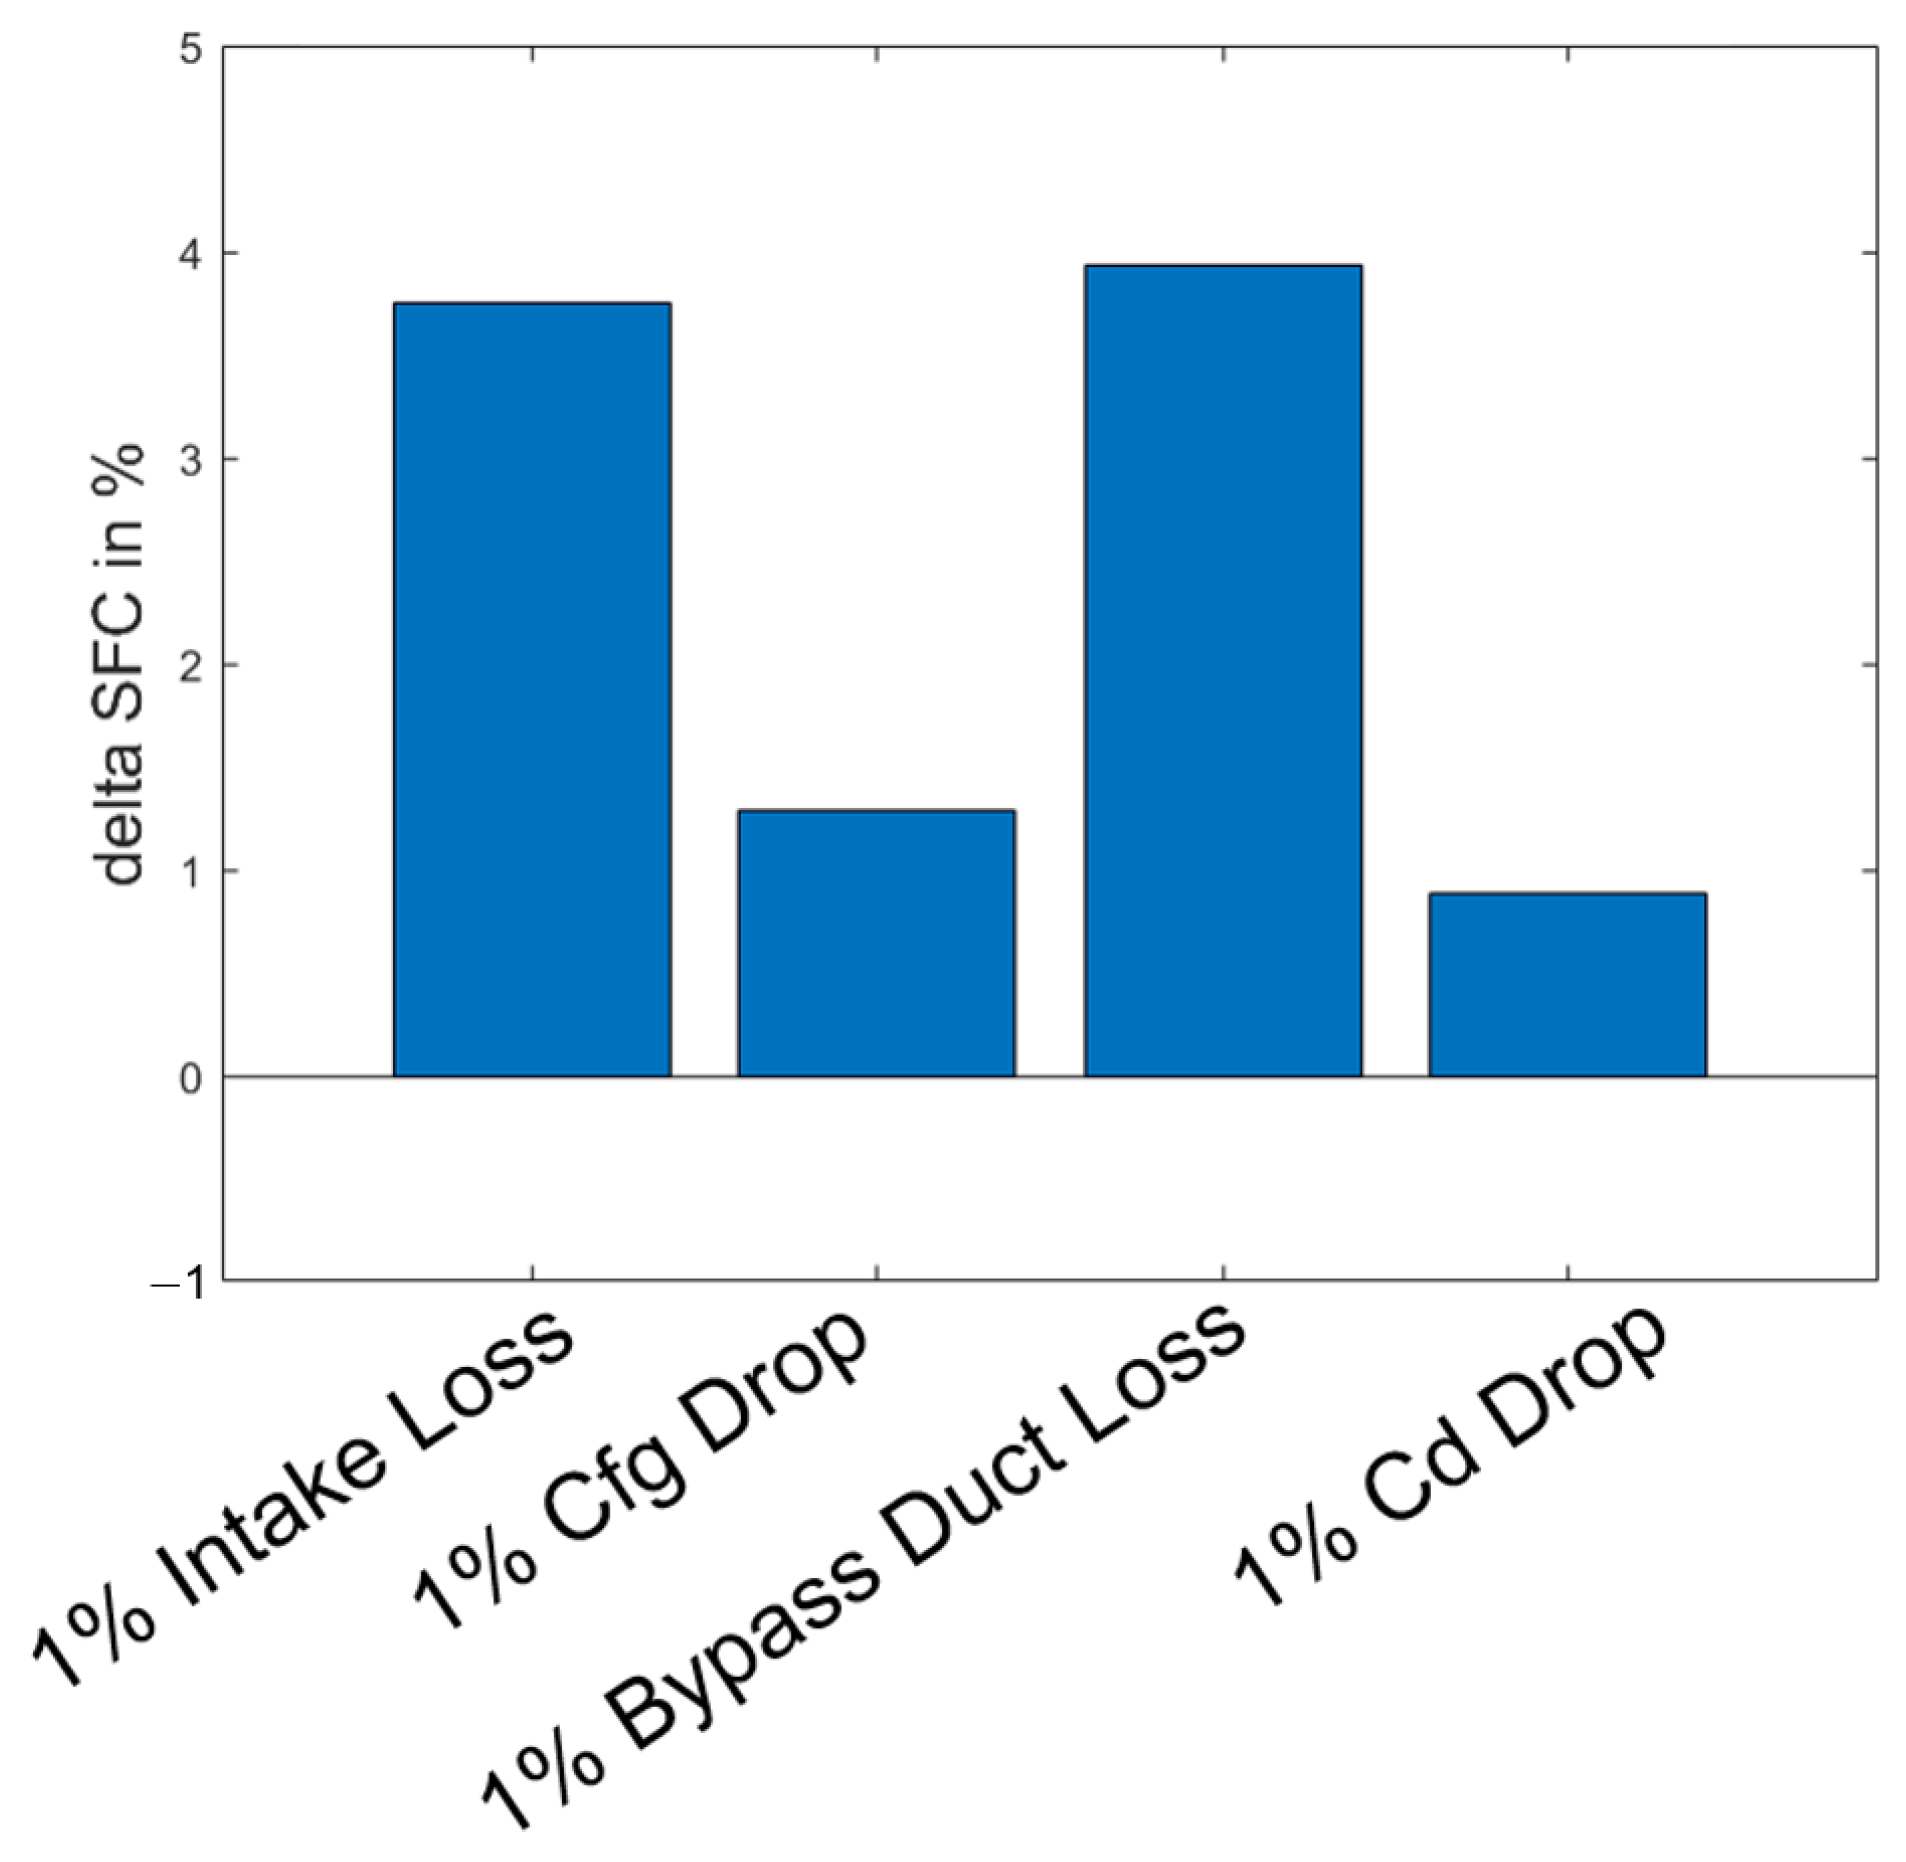
Figure 4 shows that, under cruise conditions with certain net thrust, one percent losses in the intake and nozzle thrust coefficient C F G have most significant influence, contributing to 3.18% and 4.45% SFC increases, respectively. The influence of the decrease in the nozzle discharge coefficient and bypass duct loss is relatively mild. However, in take-off conditions, as Figure 5 indicates, the intake loss and bypass duct loss are more dominant, resulting in 3.75% and 3.93% more fuel consumption, respectively, while the impact from the C F G drop is significantly limited.

3.2.2. Fan Stability

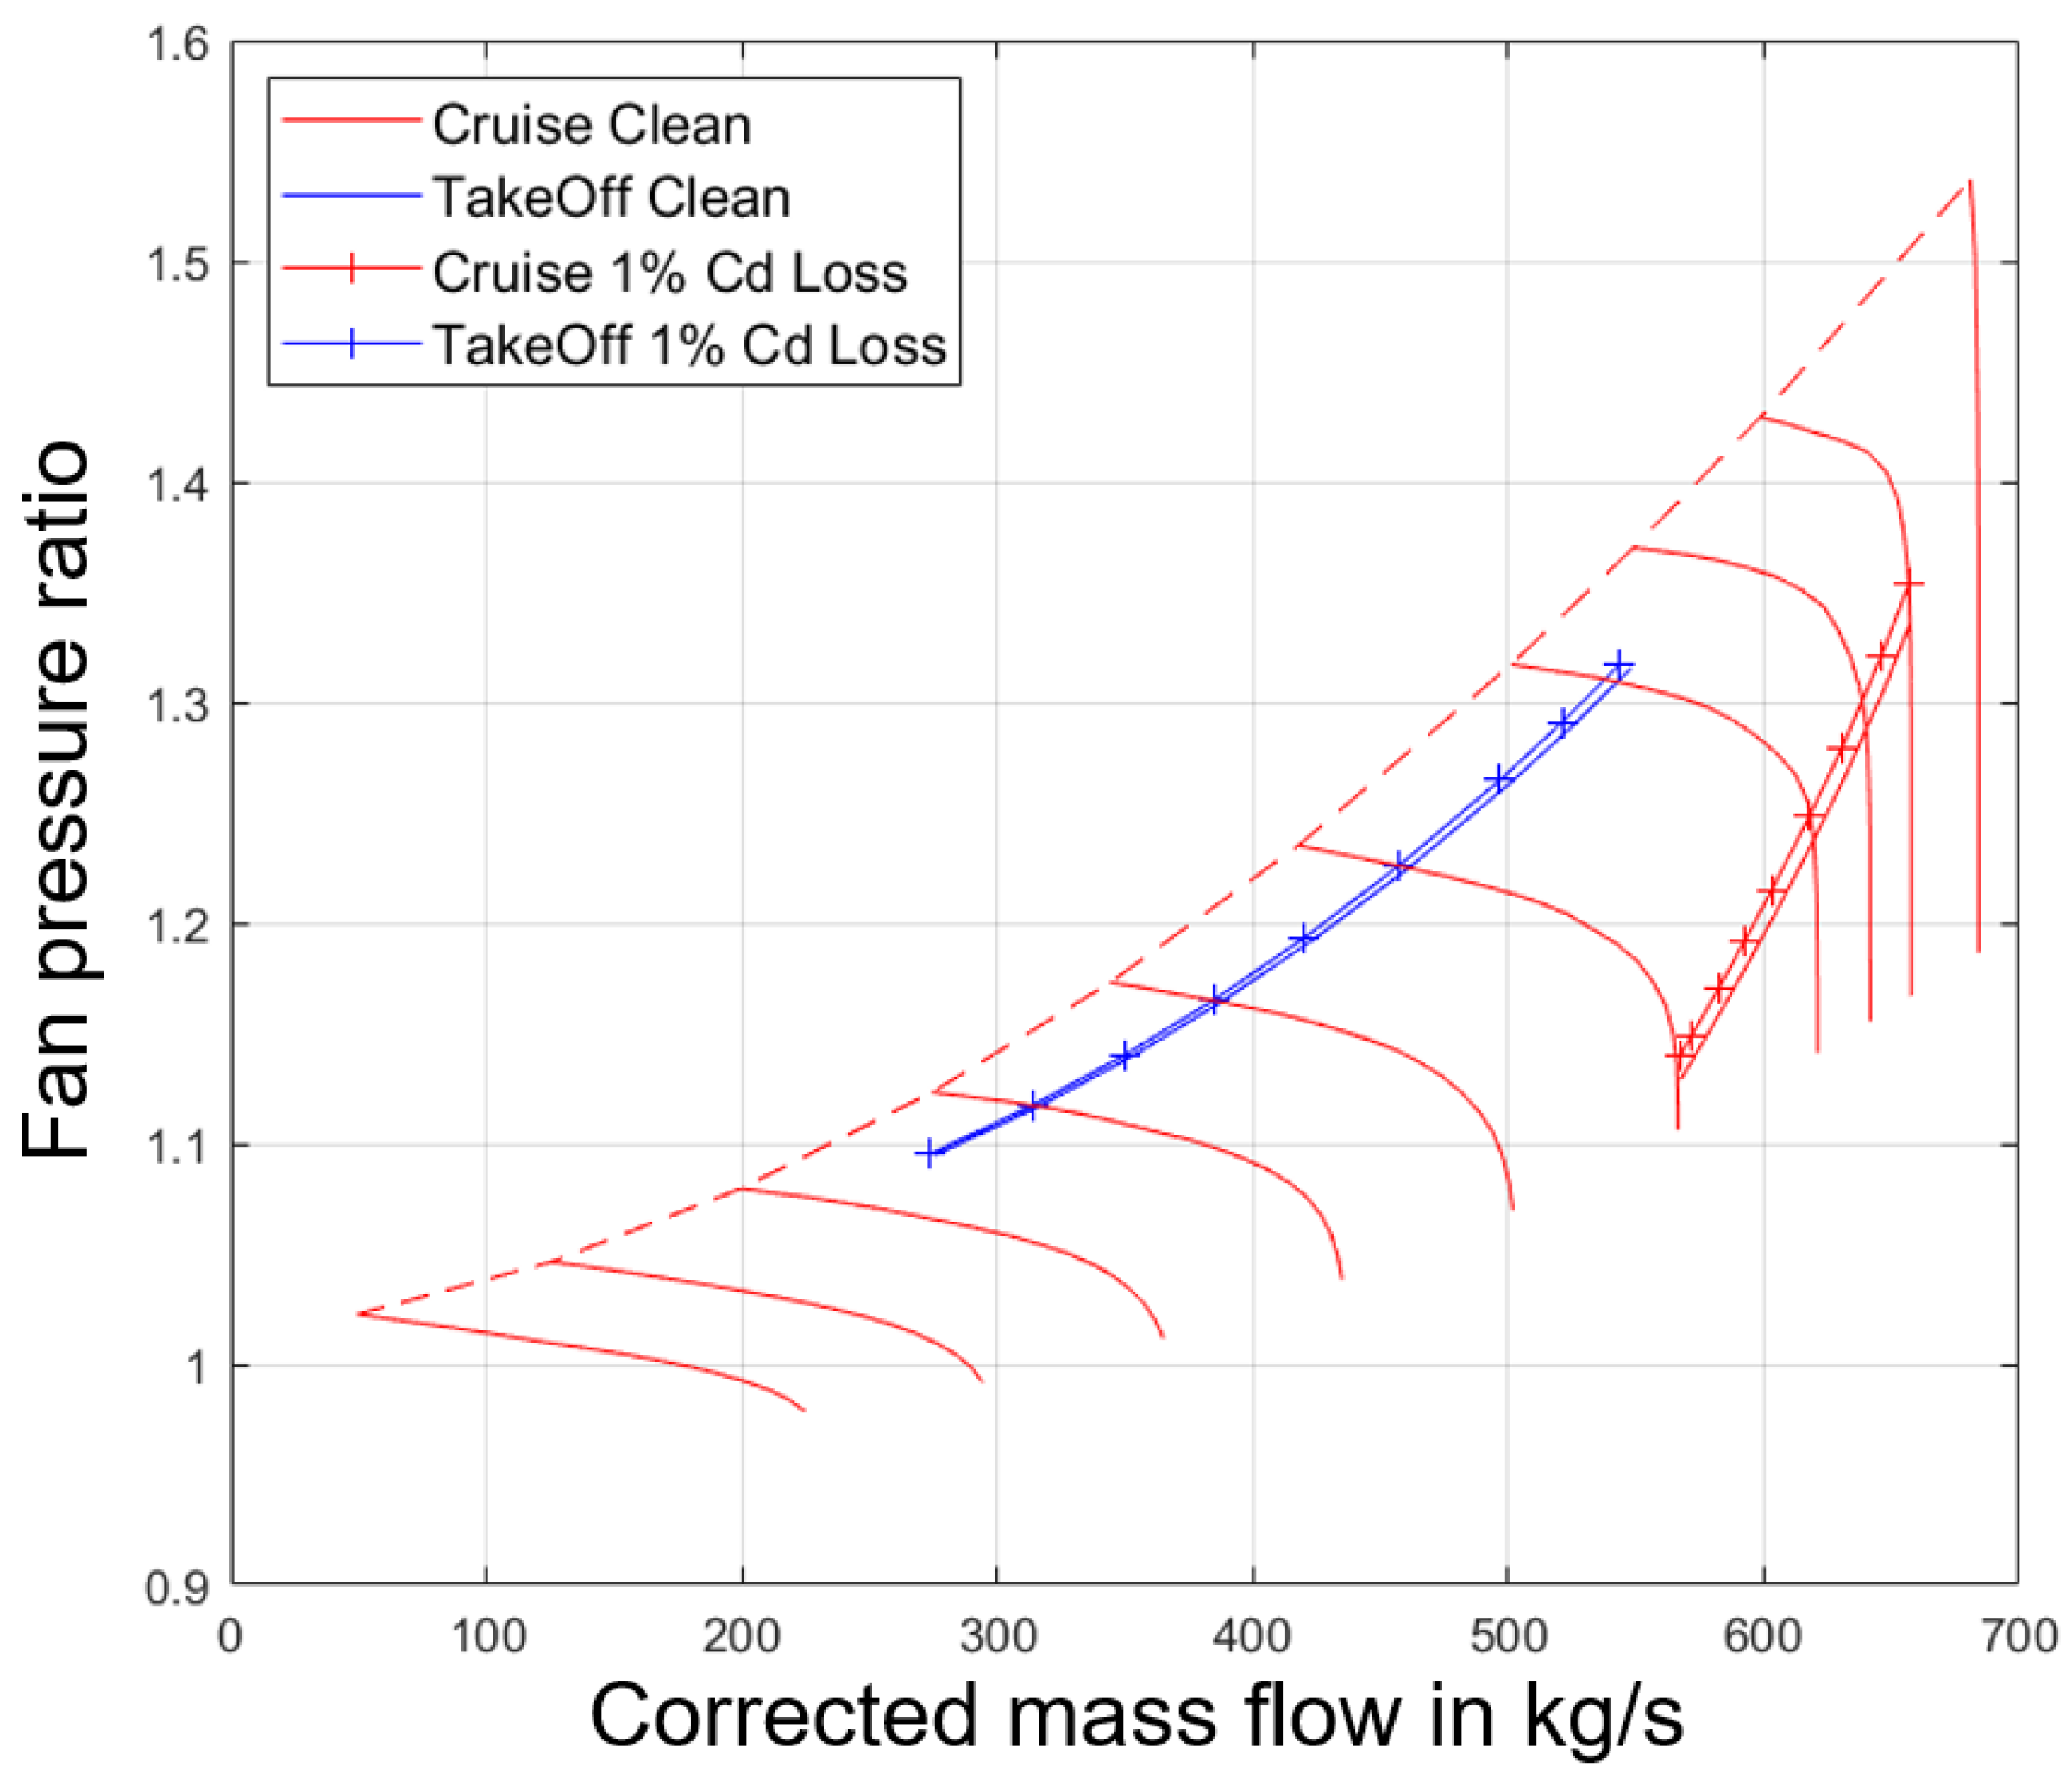
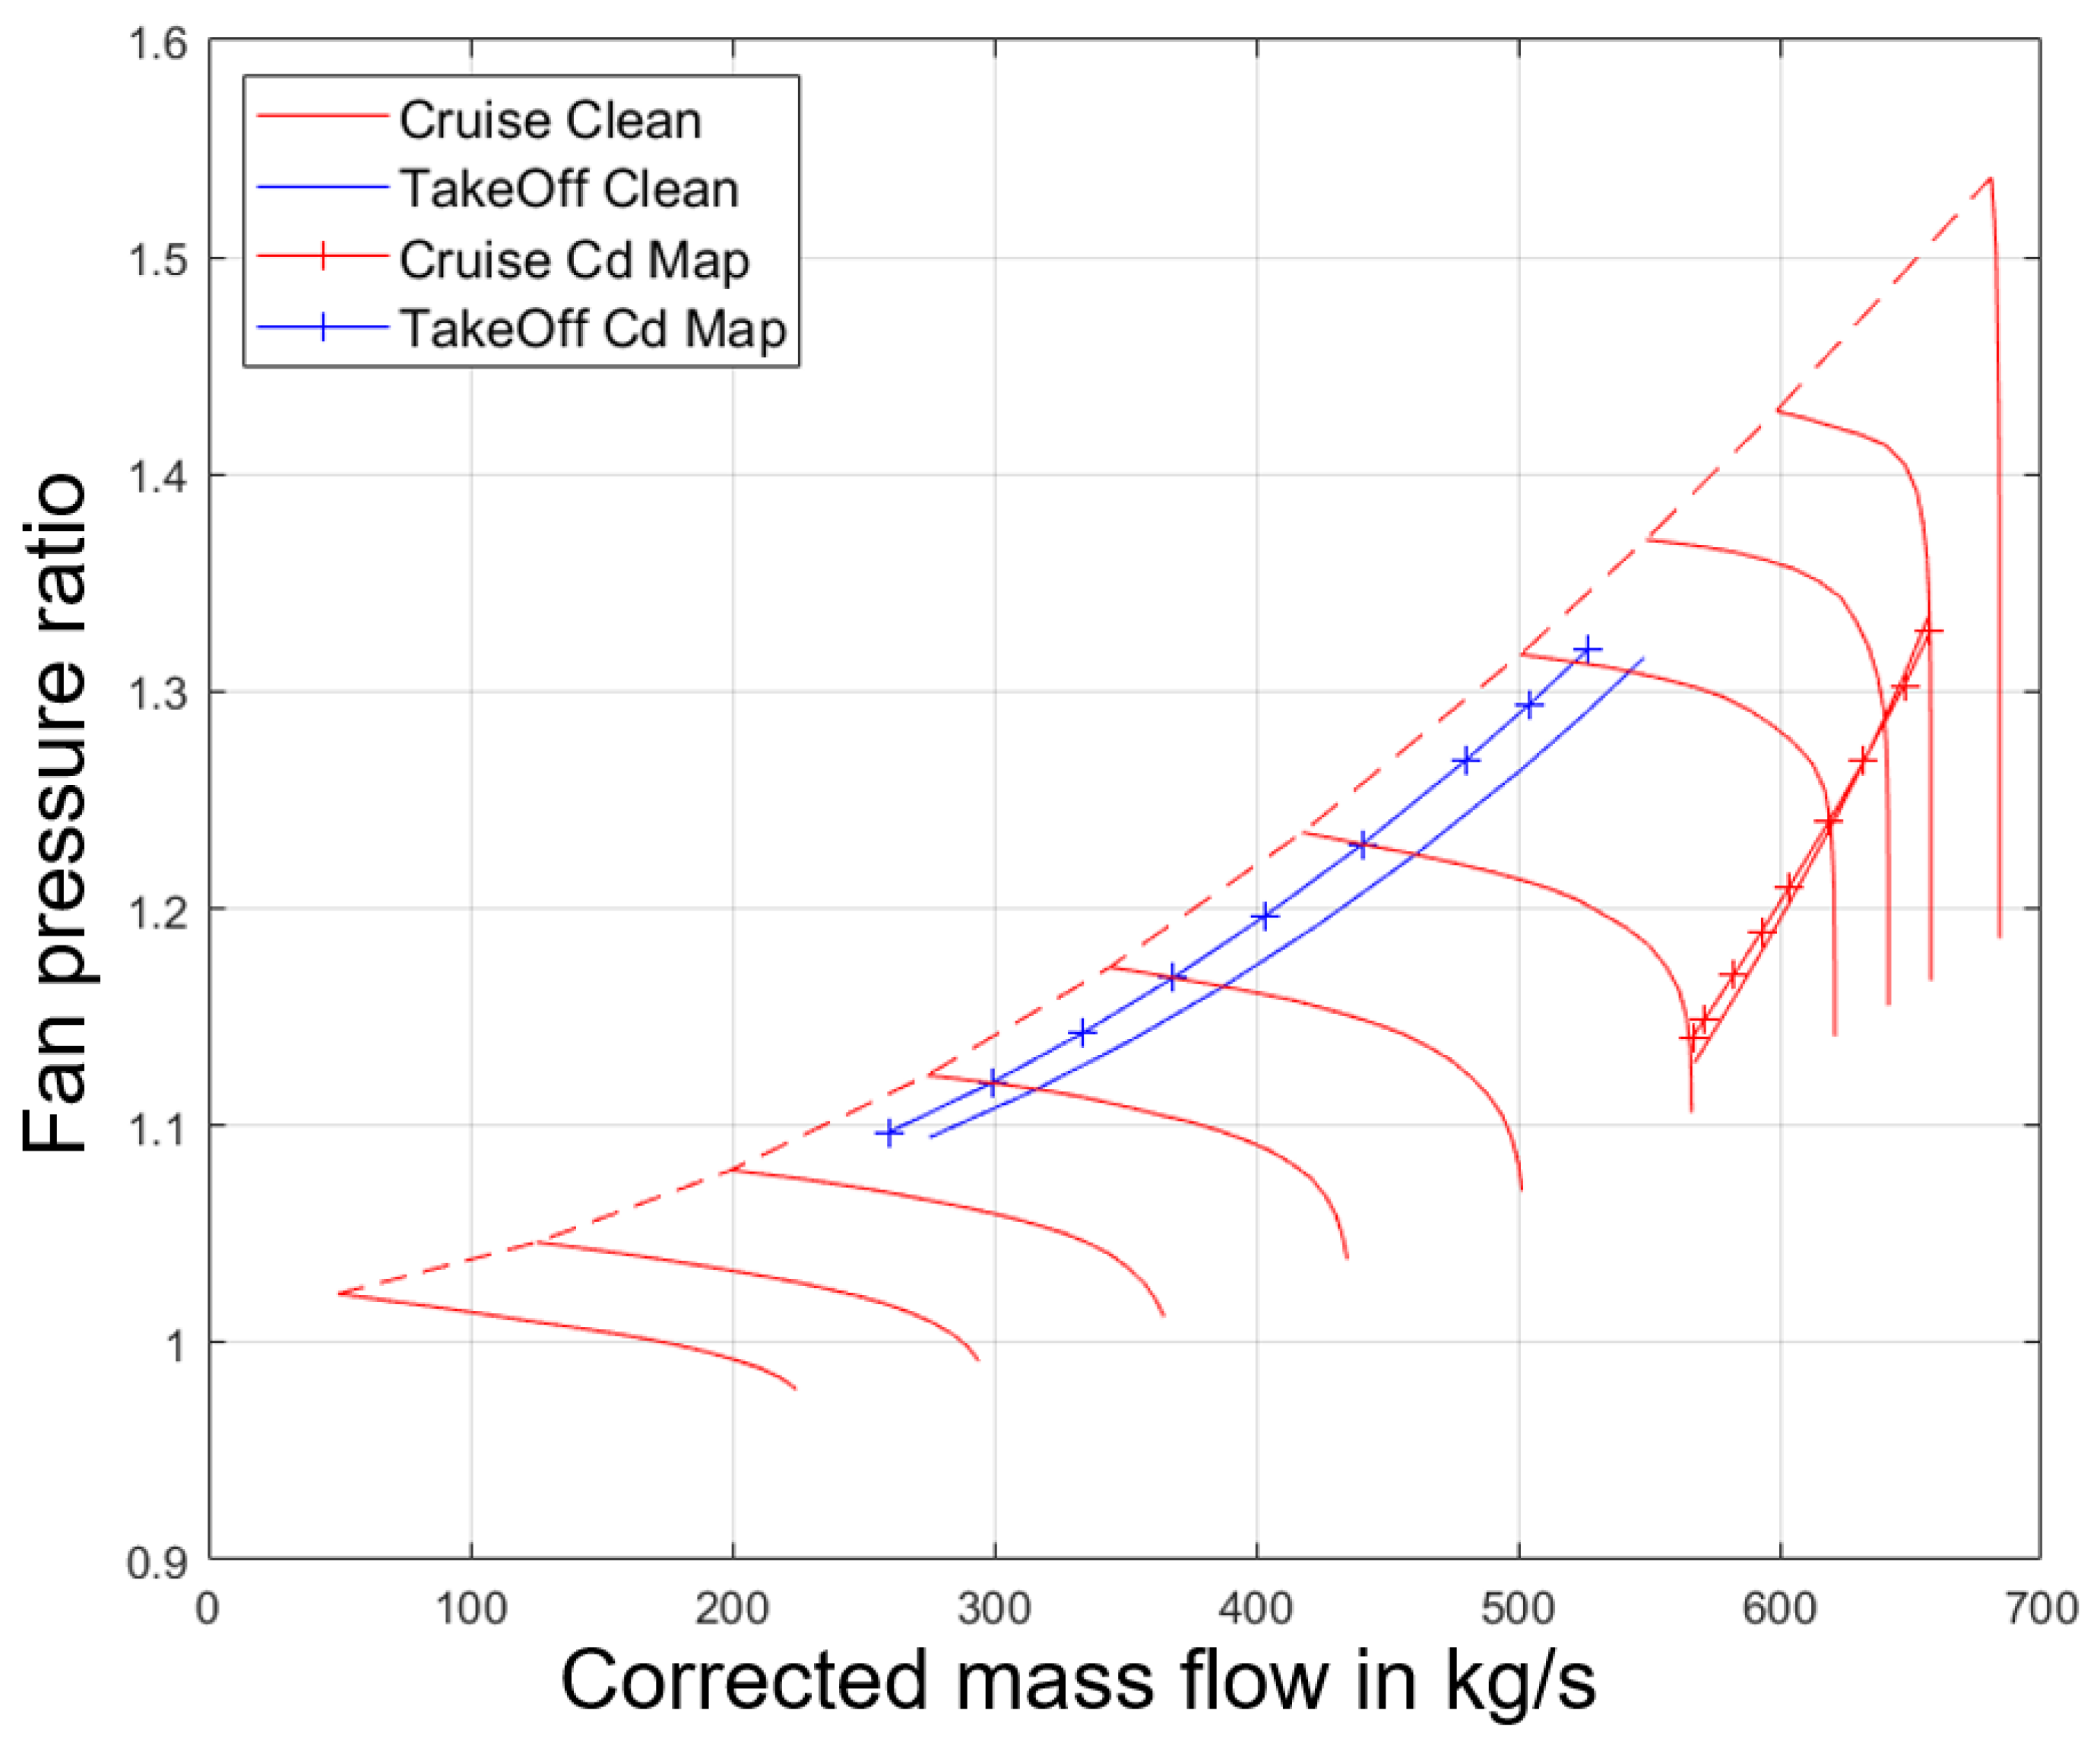
Another important aspect for engine performance assessment is the stability of the UHBR fan. As Figure 6 shows, with a loss in the nozzle discharge coefficient C d , the fan working line at cruise and take-off moves towards the fan stalling line; consequently, this leads to a potential problem regarding fan stability. This phenomenon is directly linked with the throttle effect, represented by C d . The nozzle discharge coefficient C d reflects the boundary layer or any other possible blockage effect that happens in the nozzle resulting from aerodynamic losses. In other words, a lower C d indicates increased throttling to the fan and increases its stalling risk.
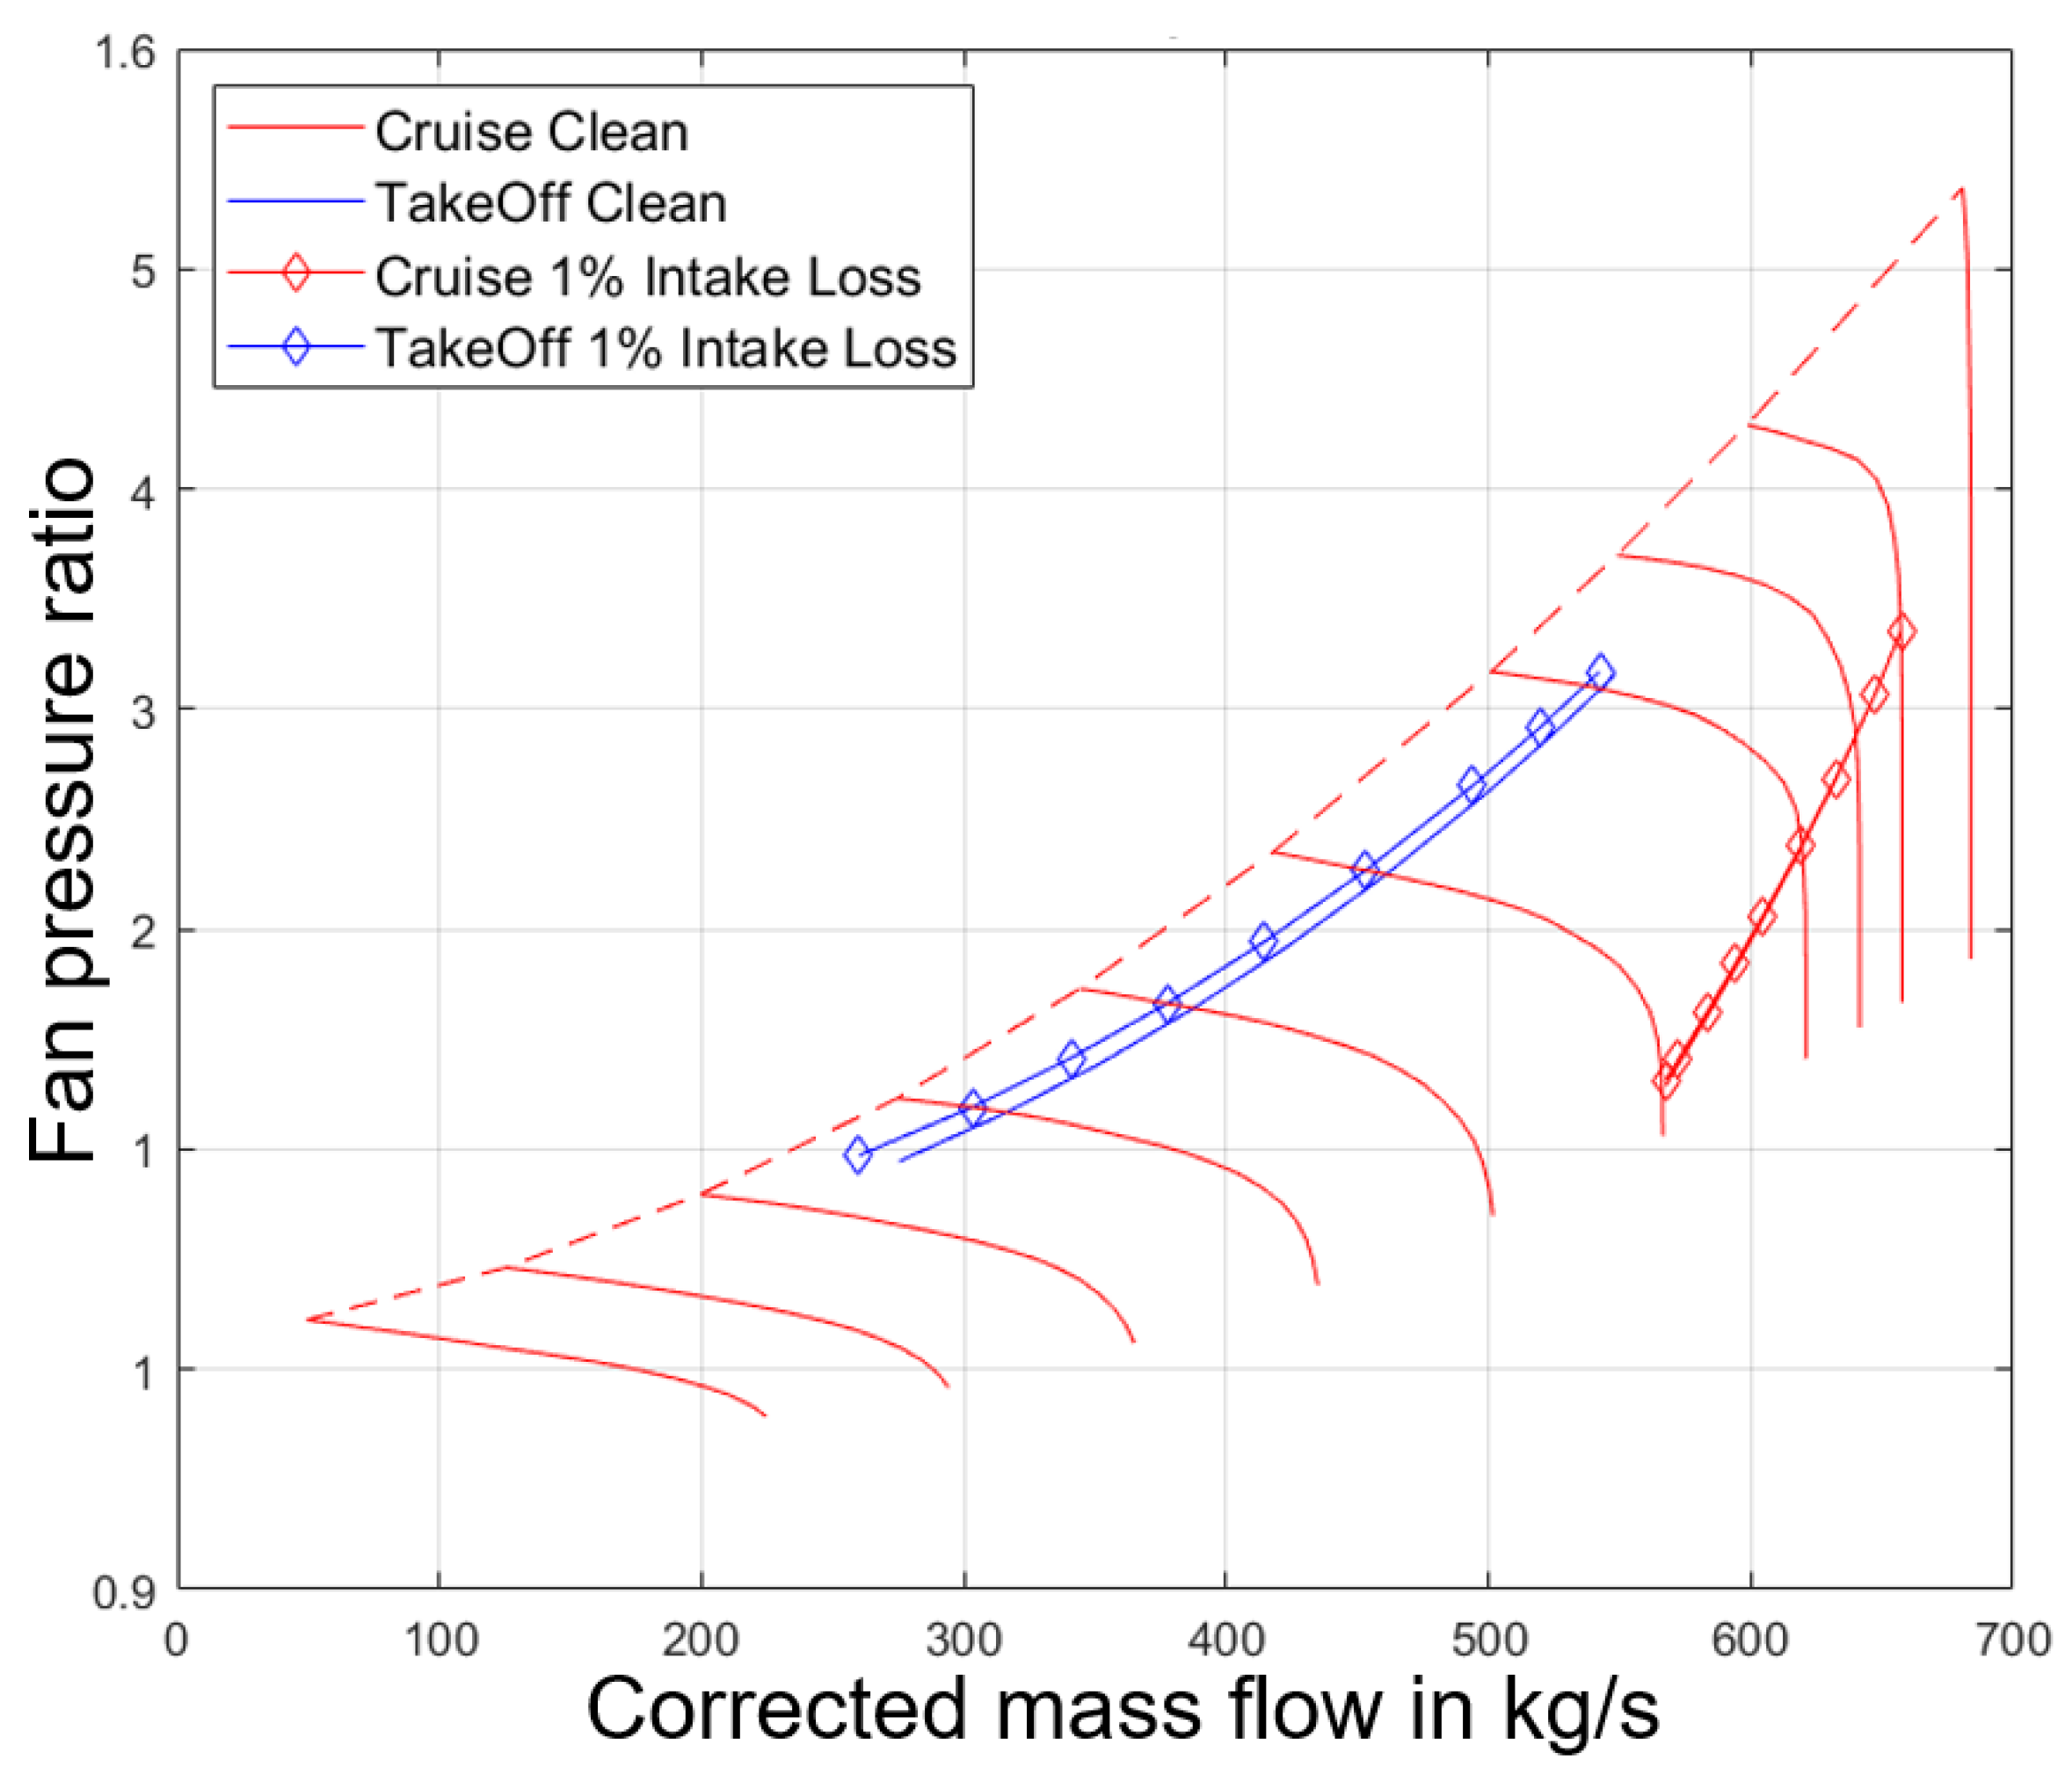
Besides blockage effects in the nozzle, losses in the intake also play an important role in fan stability. As Figure 7 displays, a pressure loss in the intake also leads to the elevation of the fan working line at both cruise and take-off. Compared with a minor change under cruise conditions, the surge margin reduction is more distinct under take-off conditions.

3.3. Installation Effect on Engine Performance

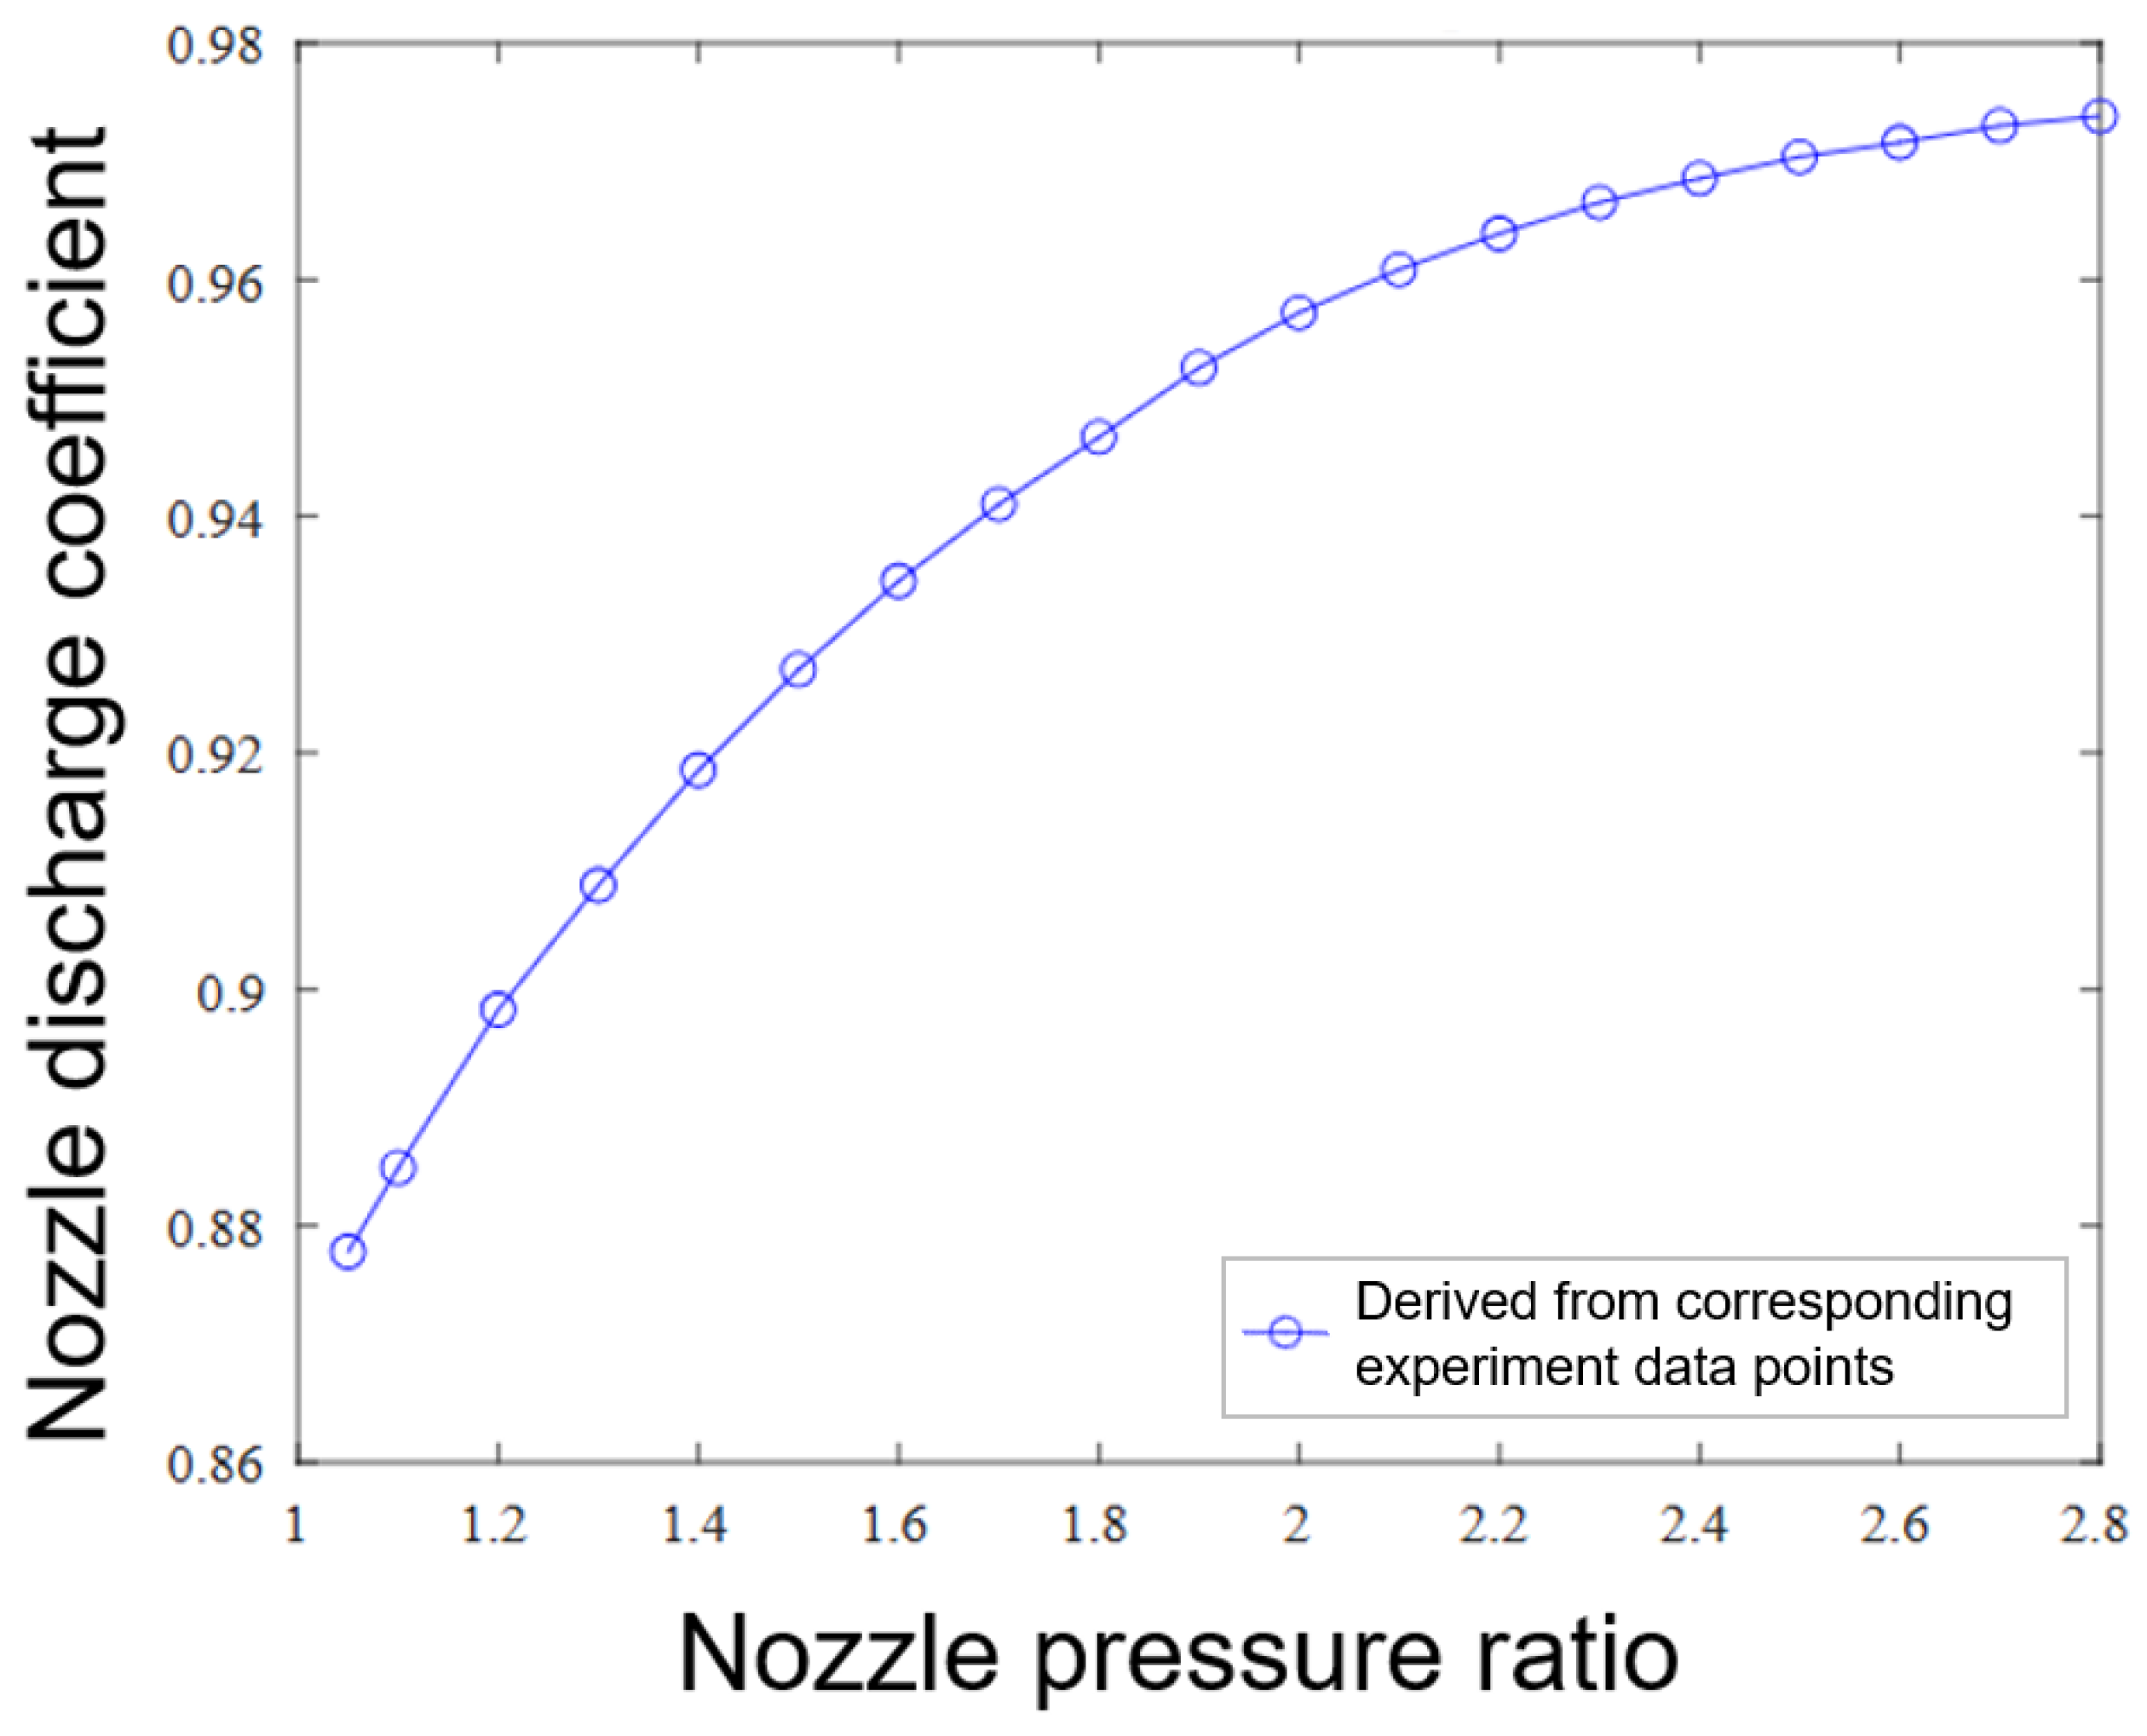
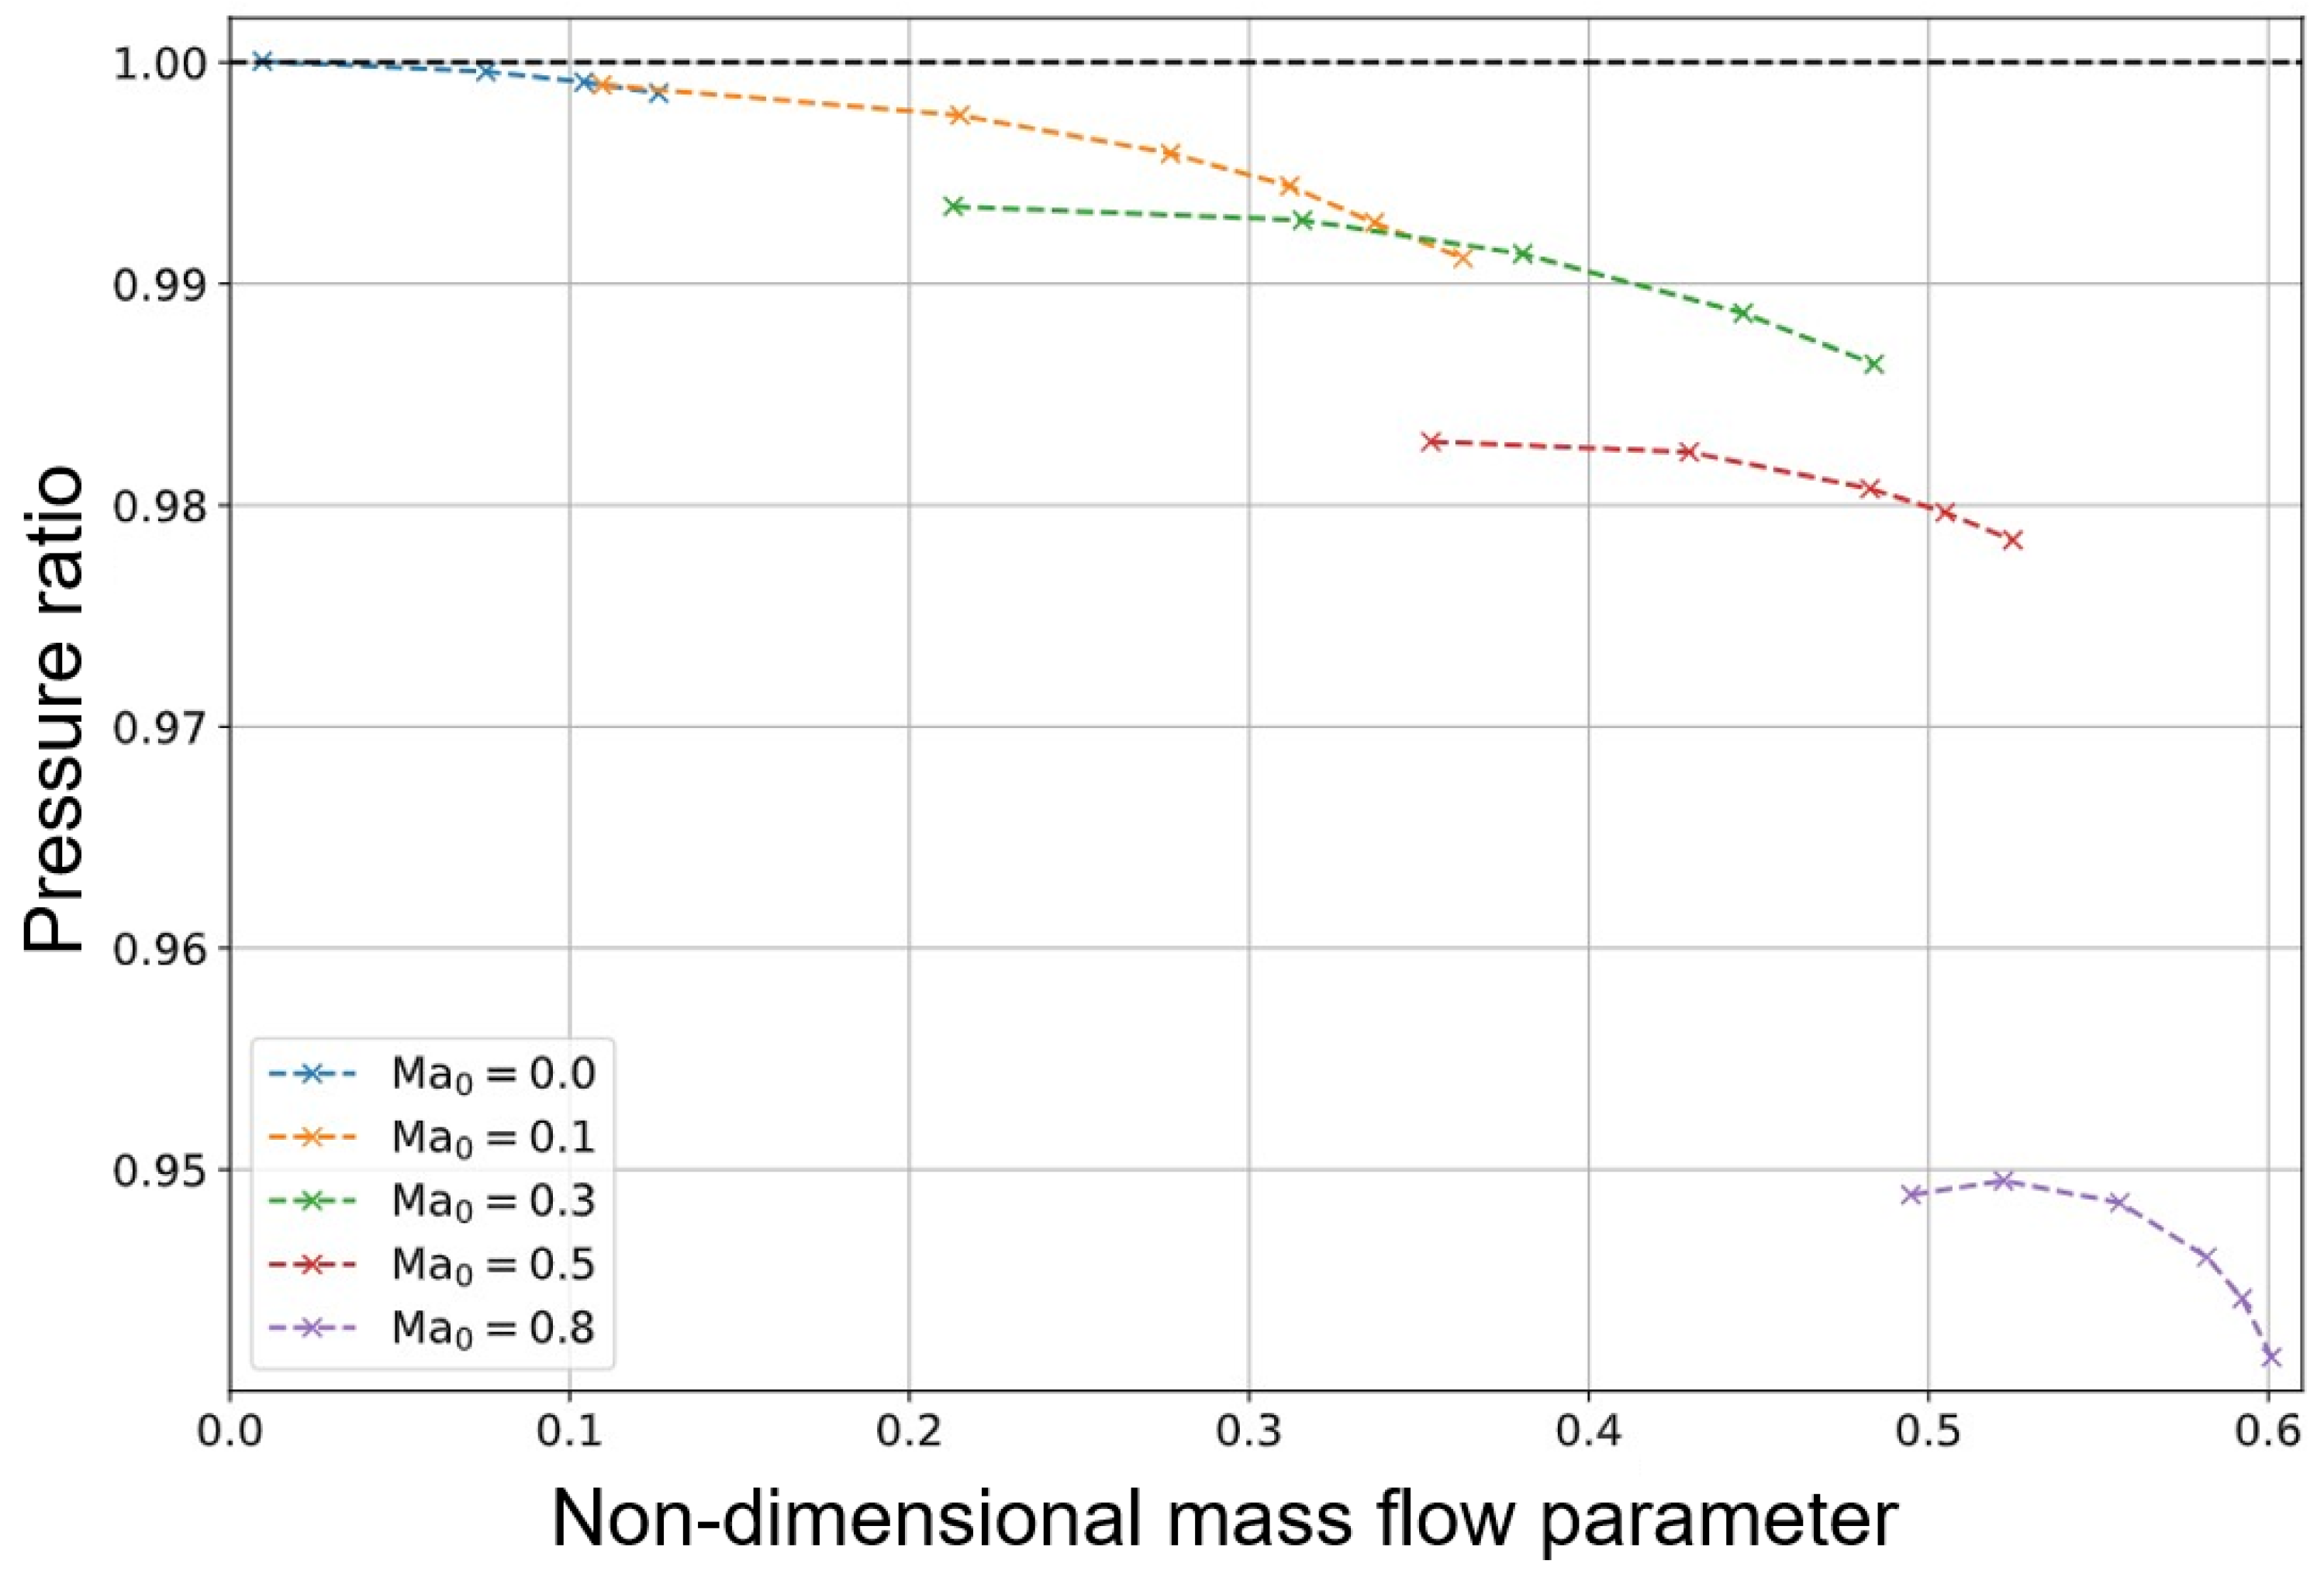
With a basic understanding of engine sensitivity, an investigation of the engine’s performance considering the installation effect resulting from the boundary layer ingestion (BLI) configuration and nozzle is carried out. In order to achieve this, an intake map is obtained, as shown in Figure 8, derived from [12], and a C d map is obtained, as shown in Figure 9, derived from R. E. Grey and H. D. Wilsted [13]. These are implemented in the engine performance simulation.

3.3.1. Installation Effect Reflected by Nozzle Discharge Coefficient Variation

As shown in the experiments carried out by R. E. Grey and H. D. Wilsted [13], both the nozzle discharge coefficient C d and the thrust coefficient C f g vary with a change in the nozzle pressure ratio. Within the range studied in the present work, the nozzle discharge coefficient map from the previously mentioned experiments is included in the engine performance simulation, aiming to partially reflect the real nozzle dynamics in an installation scenario.
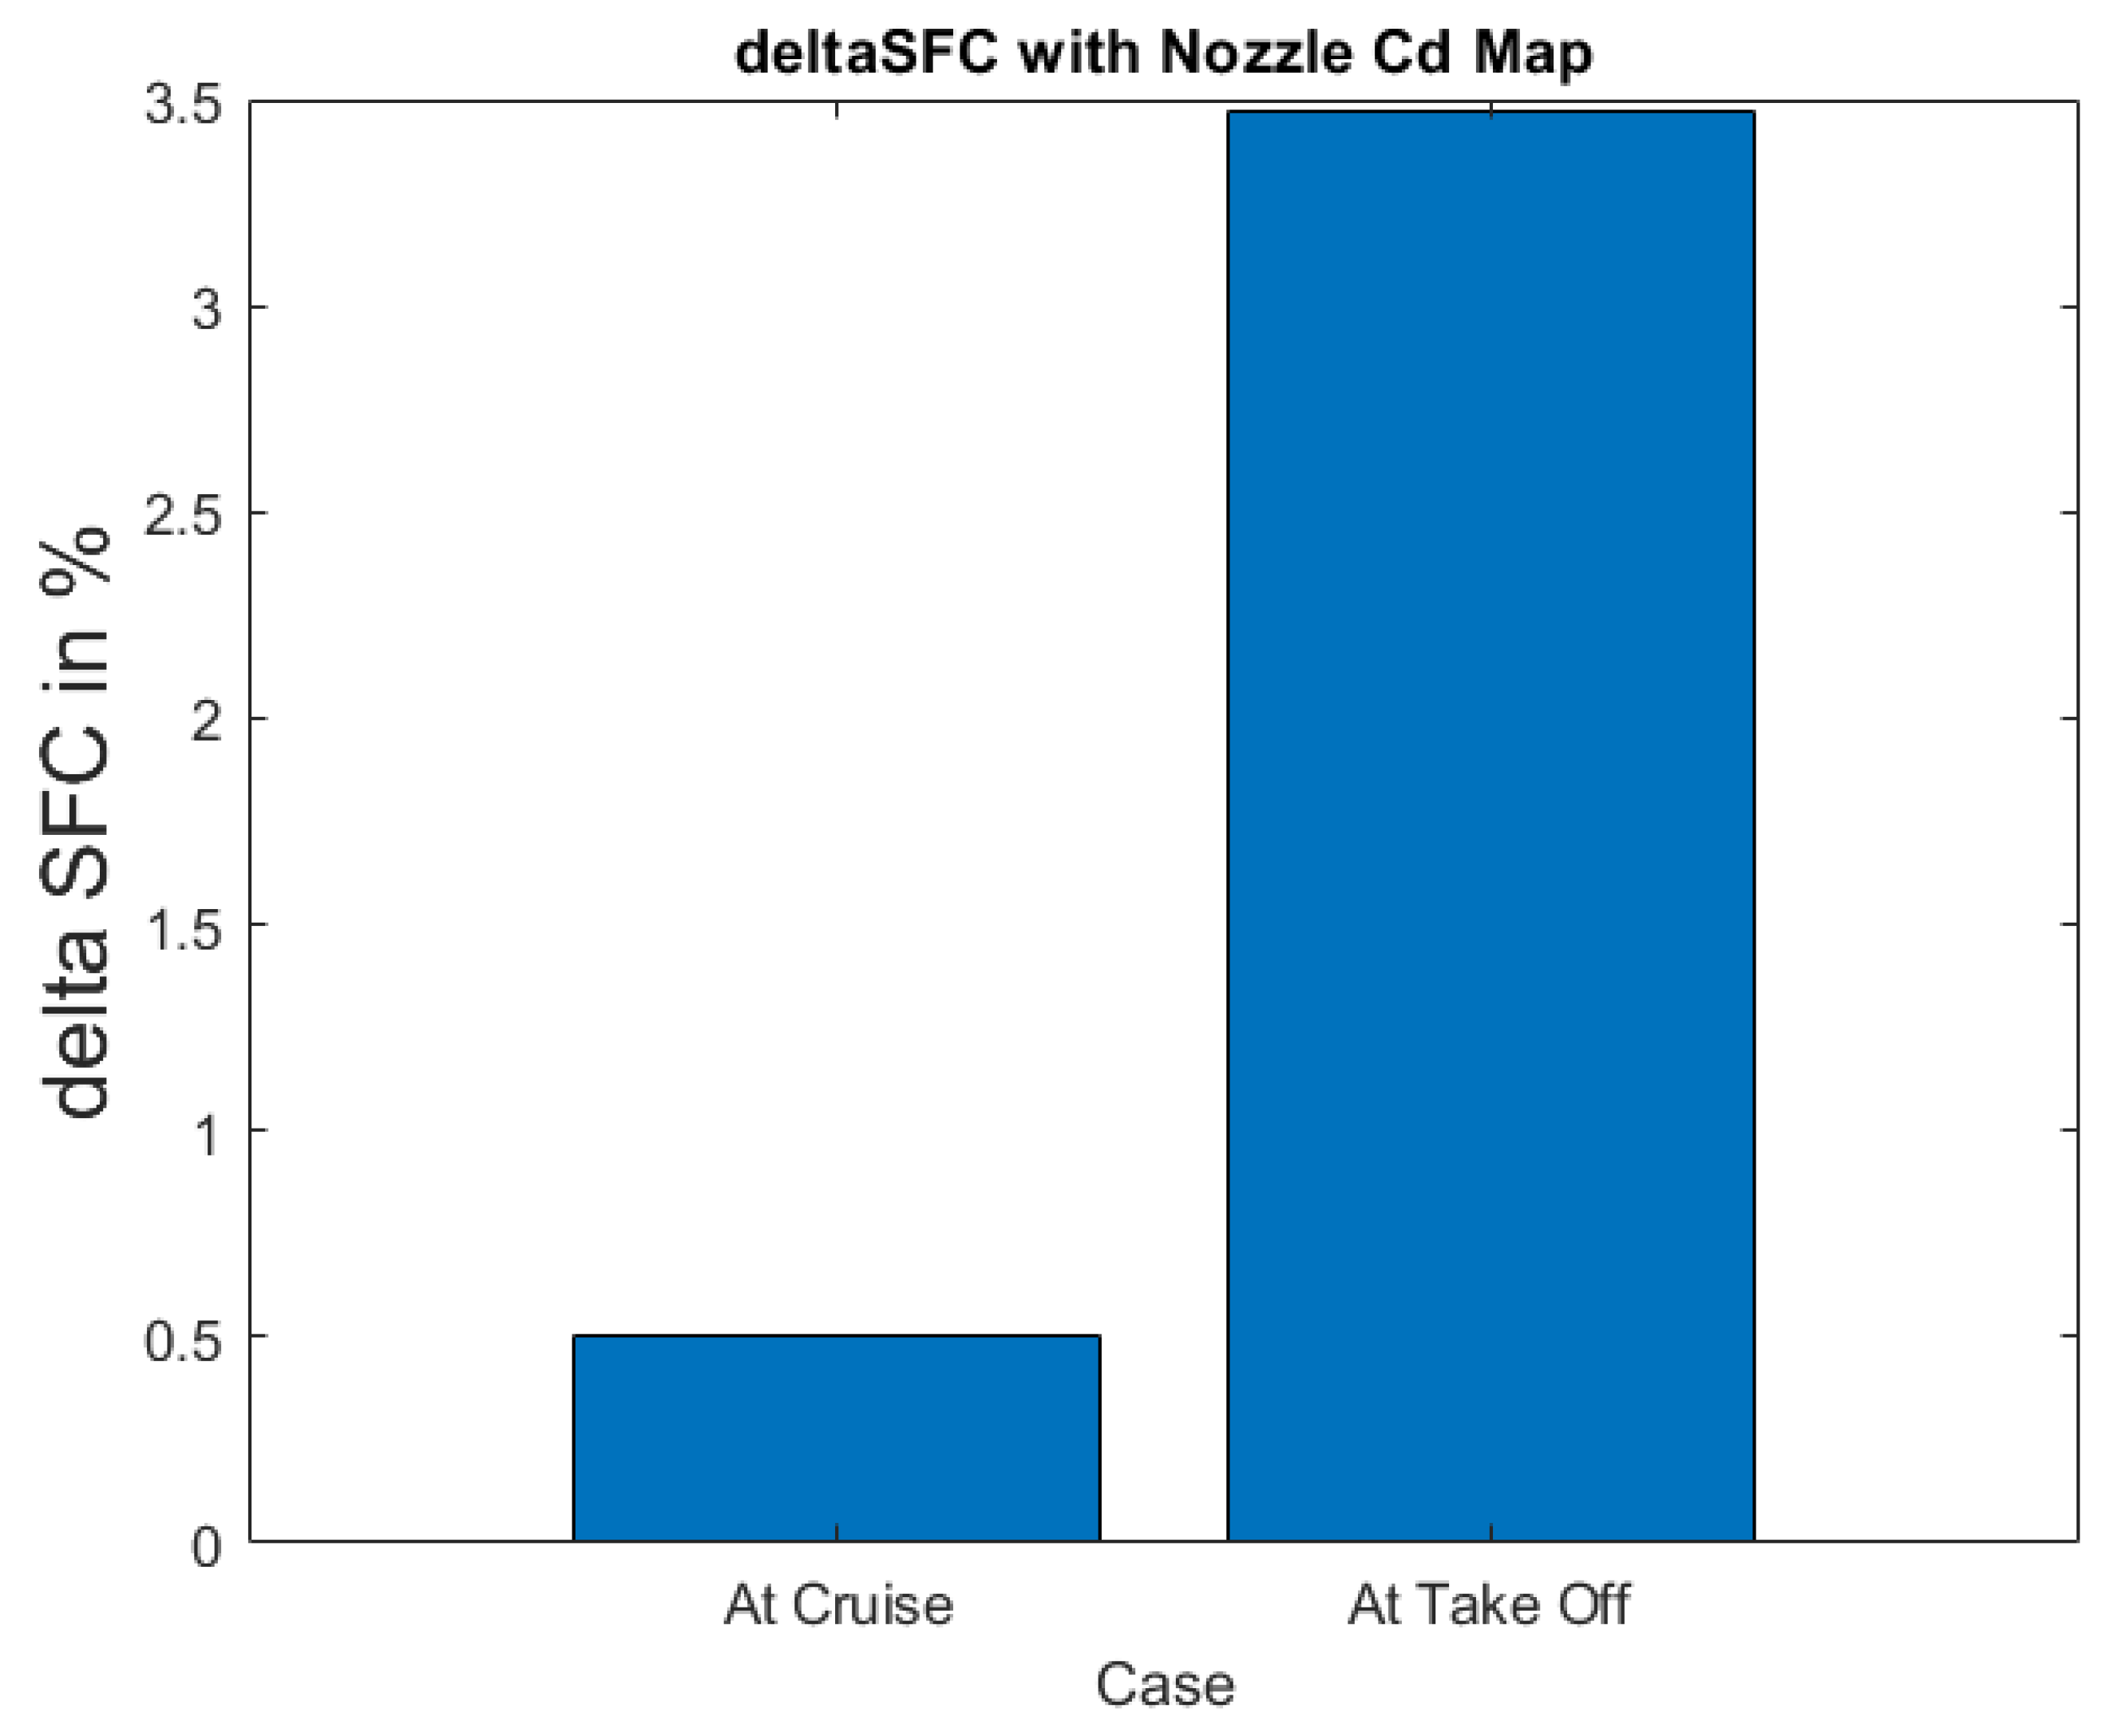
Compared with the design case, the fuel consumption is mildly increased by a rate of 0.51%, as displayed in Figure 10. However, a fuel consumption increase of 3.47% is required at take-off to generate the same level of thrust at the design point. This can be understood as a consequence of the significant deviation of C d from its design value of 0.9492 to 0.9088 in its map, which results from the distinct nozzle pressure reduction at take-off.
Similar effects also appear regarding the variation in fan stability. As can be observed in Figure 11, at the take-off point, the stalling risk of the fan is extremely high compared with the cruise scenario. As a result, the take-off point is more critical for nozzle optimization.

3.3.2. Installation Effect from BLI Configuration

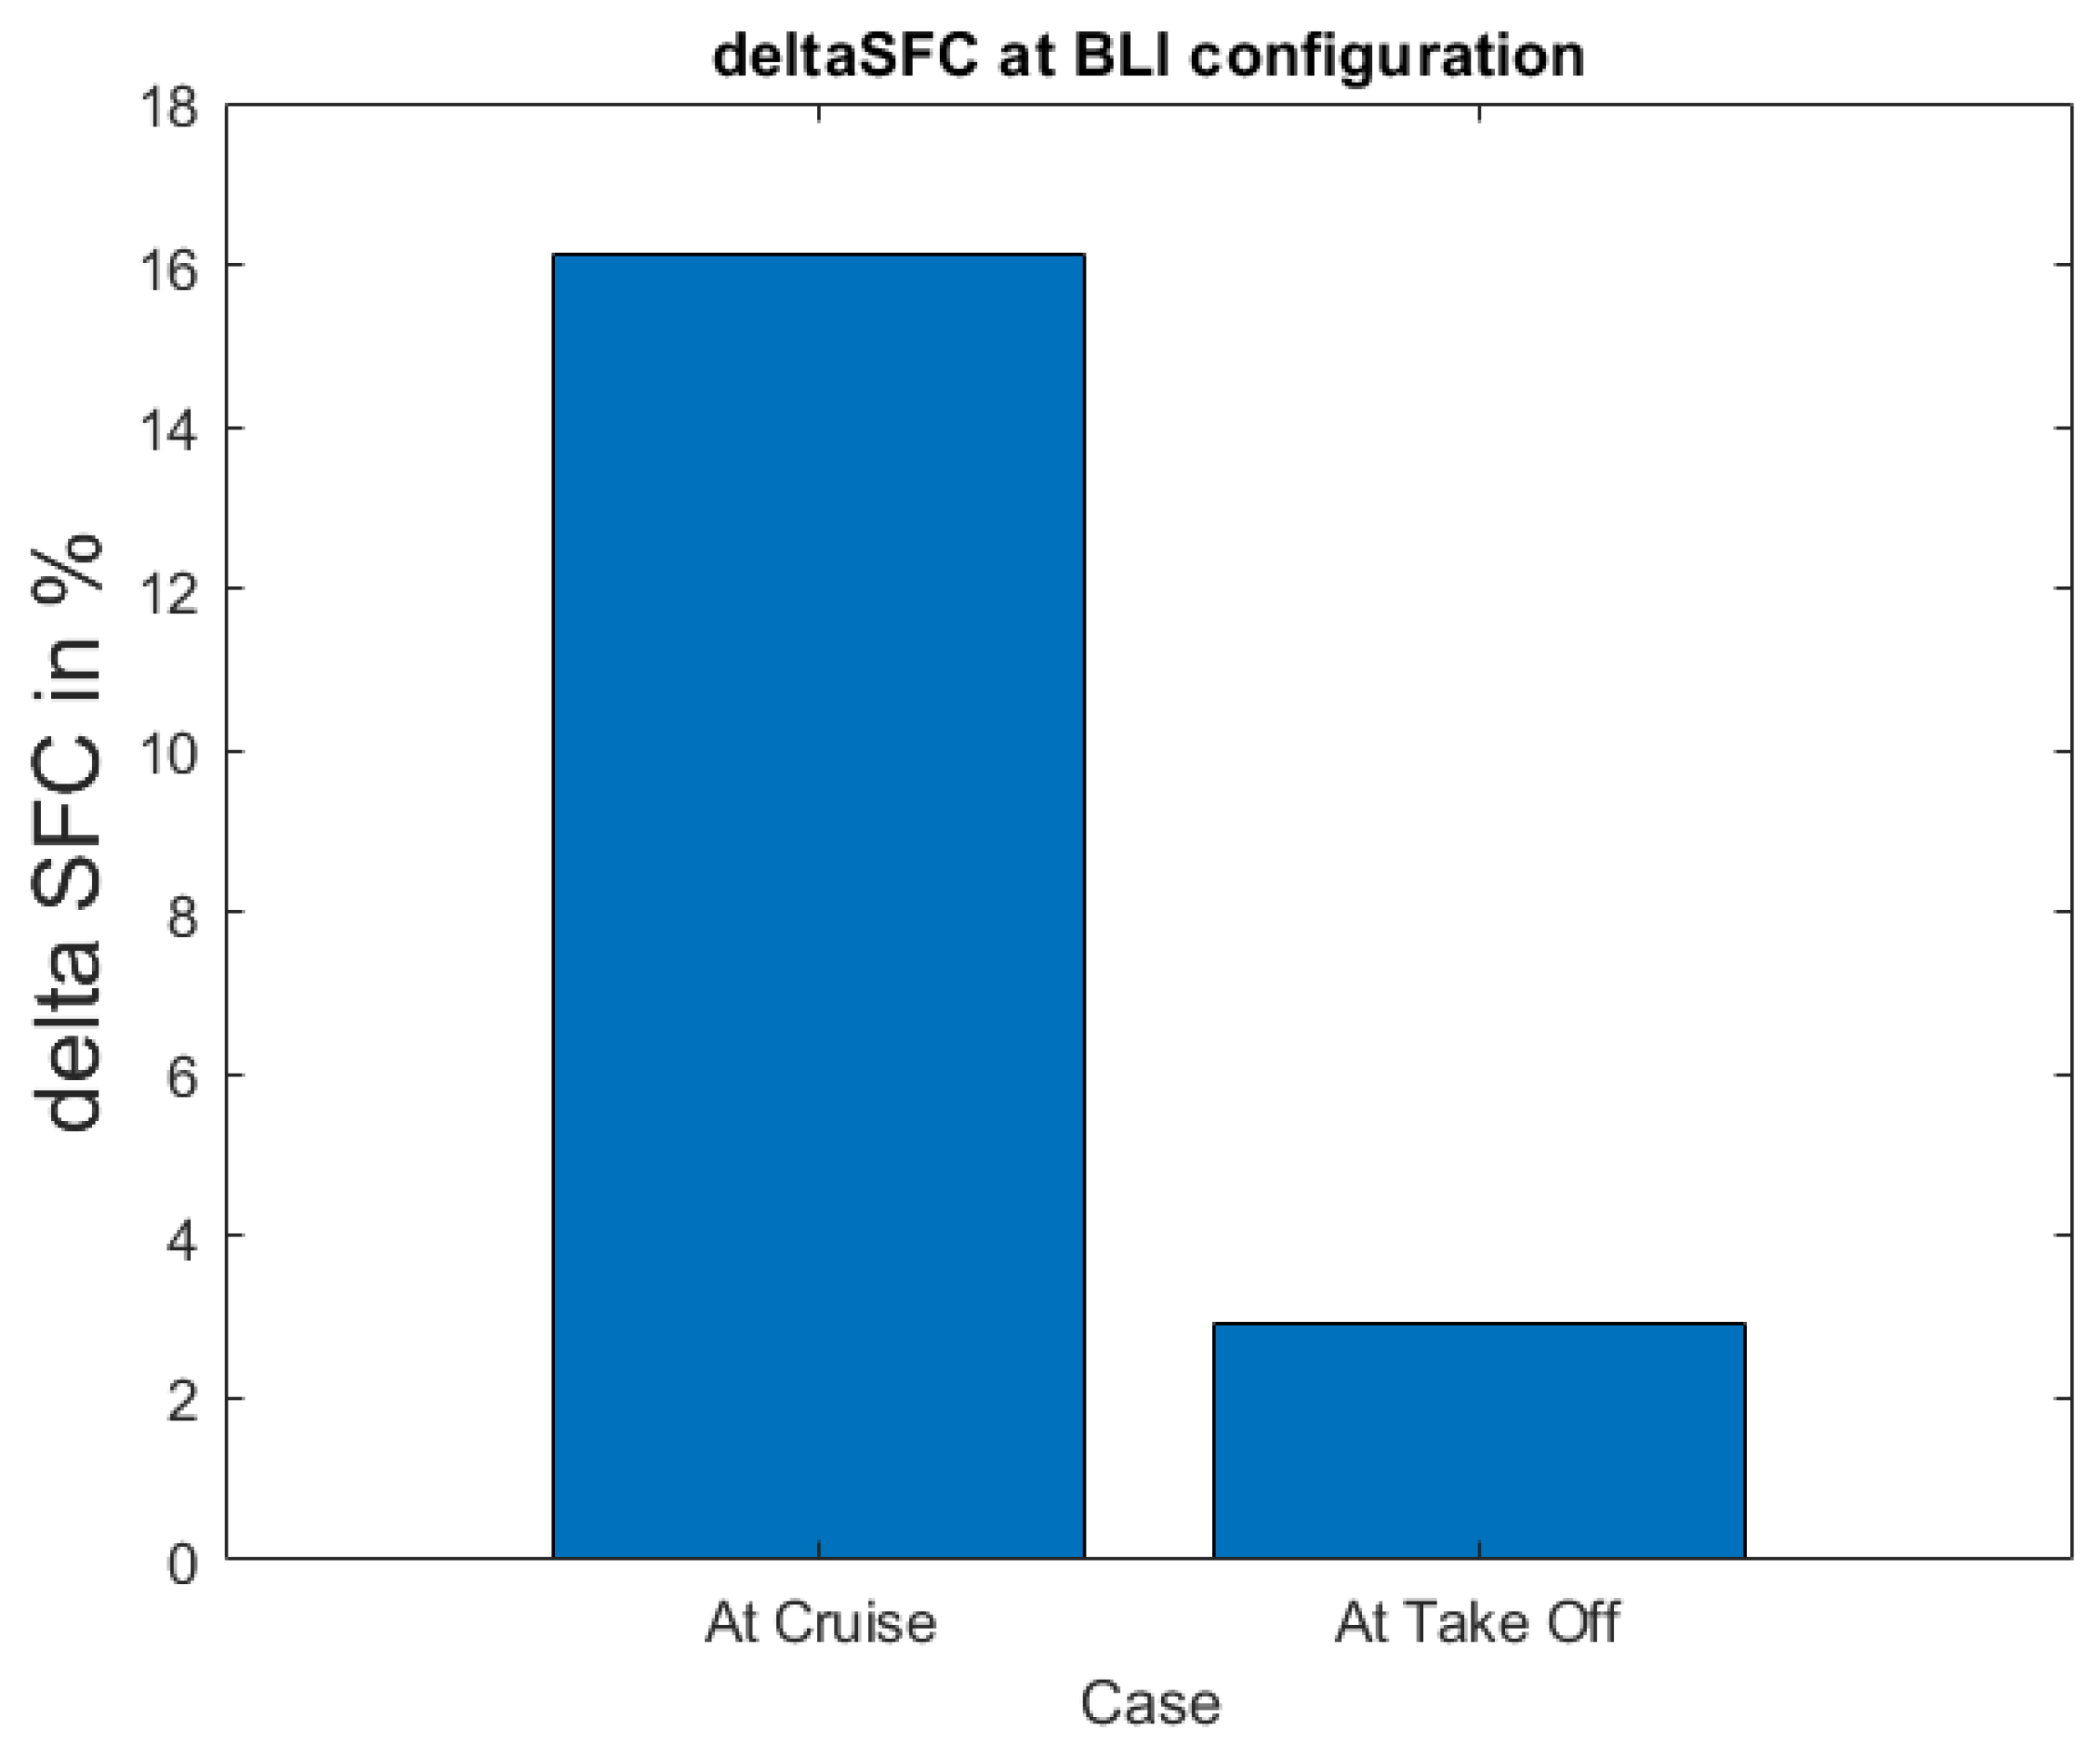
With the intake map for the BLI configuration presented in [12], an engine performance simulation is conducted for a fixed net thrust. The changes in SFC are shown in Figure 12. Compared with the intake recovery ratio assigned at the design point of 0.9984, it is increased to 0.9494 for the BLI configuration at the cruise point. This results in a significant increase in the SFC of 16 percent. This deterioration also corresponds with the results of the engine sensitivity analysis in the previous section; specifically, a 1% intake loss would lead to a 3.18% increase in fuel consumption under cruise conditions. Similar expected effects also appear for the take-off point. However, as a result of the severe pressure loss at the cruise point, the fuel consumption increase is more critical under these conditions compared with take-off.
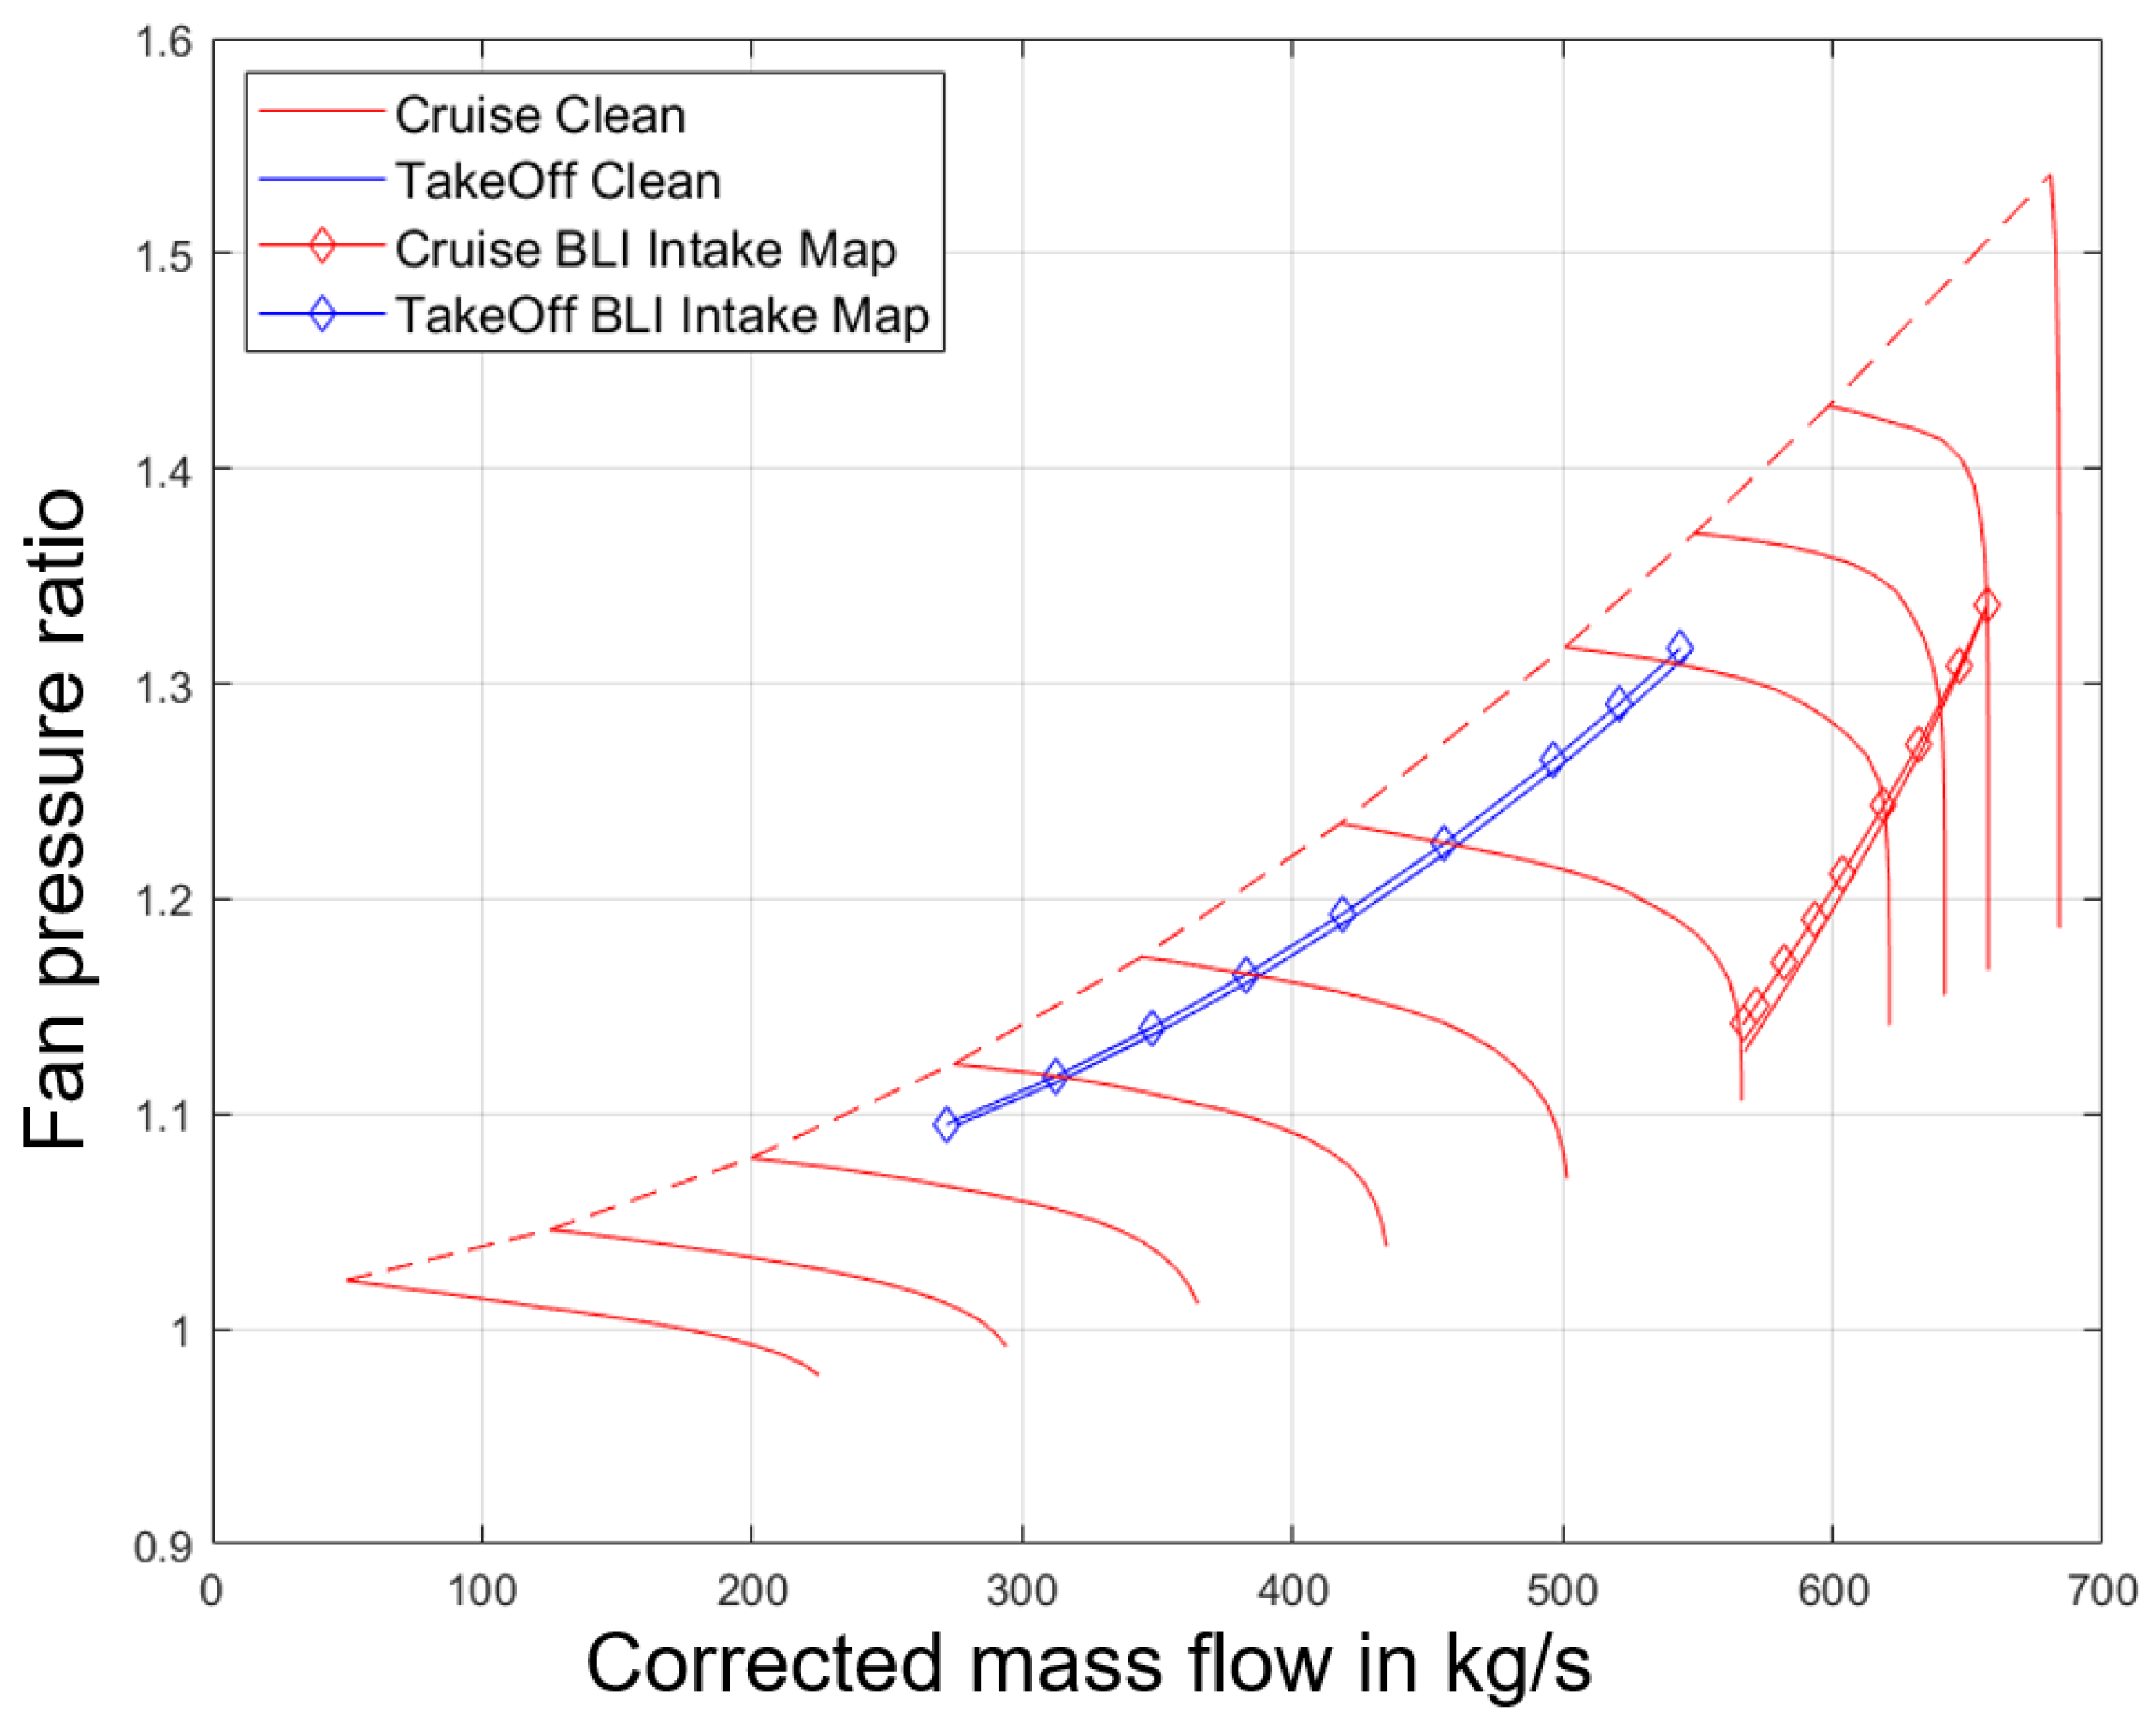
As another important impact resulting from the implementation of BLI, the fan also experiences a significant risk of instability. Figure 13 shows that, at both cruise and take-off, the fan working line is greatly elevated towards its stalling limit. As a potential solution to mitigate this risk, a variable-area nozzle can be utilized in conventional applications of UHBR fans.

3.4. An Approach to Including the Intake Fan Effect in the Fan Map

As described in the previous section, the incidence variation encountered by the fan blade leads to the invalidation of the fan map measured under clean test conditions. As a consequence, a reliable method for including this intake fan effect in fan characteristic assessment is required. Targeting this challenge, a possible method is presented as a preliminary idea in this article.
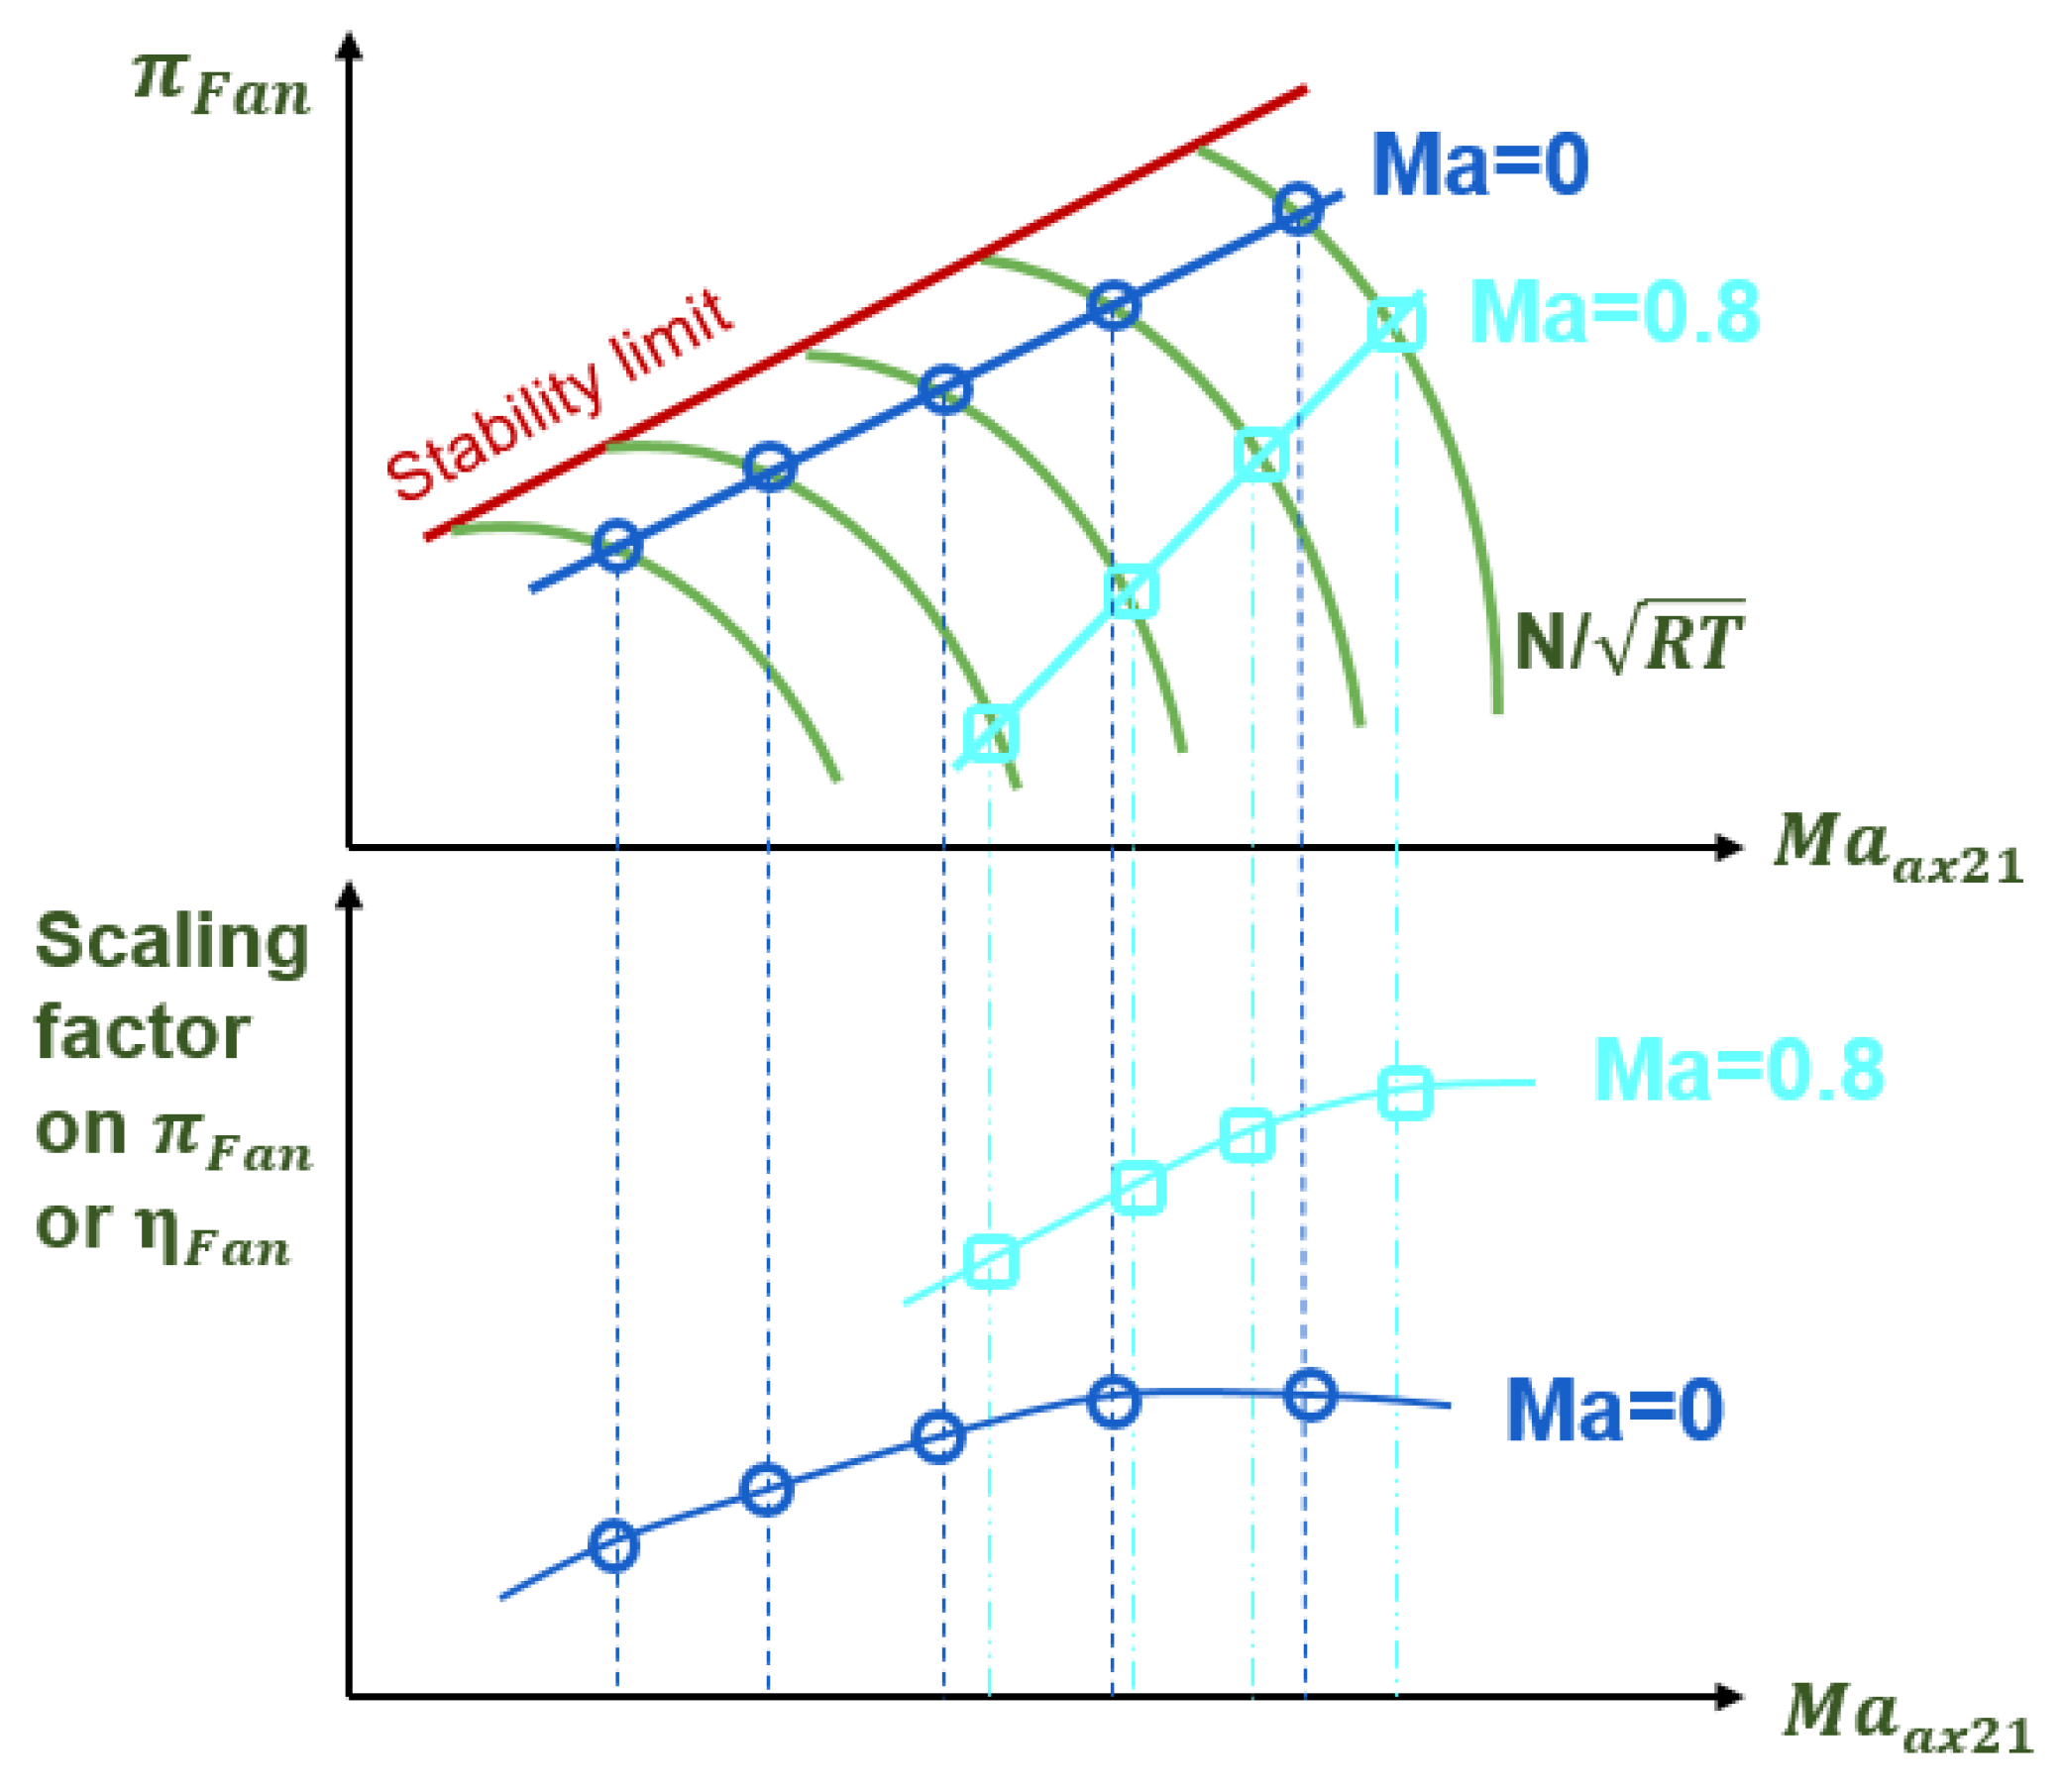
In this approach, scaling factors are investigated regarding the deformation effect on the fan map resulting from the BLI configuration. The acquisition of two scaling factors, namely for the fan pressure ratio and the efficiency, is considered. With the superposition of these two scaling factors on the measured clean fan map, a new map can be obtained in which it is possible to correct the fan characteristics by taking the intake fan effect into account. As shown in Figure 14, the scaling factors are investigated along different fan working lines. A linear relationship between the scaling factors and fan mass flow parameters is assumed. With this assumption, the obtained scaling factors for the complete fan map can be realized by the interpolation or extrapolation of the limit number of data points.
However, proof of the correctness of these assumptions is necessary for the implementation of this method. Therefore, this work is regarded as an initial step, and further investigation will be conducted in the future.

4. Conclusions

Based on the results and discussion in the previous sections, a number of conclusions can be drawn:
  • Choosing a UHBR engine amplifies installation challenges since the nozzle is operated at the steepest part of its characteristic curve.
  • The installation of the engine will lead to changes in the operating points, and this depends on the power settings of the engine.
  • Knowledge of the characteristics is of the utmost importance for the design and operability of the engine.

Author Contributions

Conceptualization, Y.Y. and S.S.; methodology, Y.Y. and S.S.; investigation, Y.Y.; resources, Y.Y. and N.I.; data curation, Y.Y. and N.I.; writing—original draft preparation, Y.Y. and N.I.; writing—review and editing, S.S.; visualization, Y.Y.; supervision, S.S. and J.F.; project administration, S.S. and J.F.; funding acquisition, S.S. and J.F. All authors have read and agreed to the published version of the manuscript.

Funding

This work was funded by the Deutsche Forschungsgemeinschaft (DFG, German Research Foundation)—Project ID 498601949—TRR 364 (Syntrac).

Data Availability Statement

The results and simulation data of the study are openly available in DaRUS at https://doi.org/10.18419/DARUS-5605.

Conflicts of Interest

The authors declare no conflicts of interest.

Abbreviations

BLIBoundary layer ingestion
UHBRUltra-high bypass ratio
SFCSpecific fuel consumption
NPSSNumerical Propulsion System Simulation
BPRBypass ratio
TSFCThrust specific fuel consumption
FPRFan pressure ratio
OPROverall pressure ratio

References

  1. Arend, D.J.; Tillman, G.; O’Brien, W.F. Generation After Next Propulsor Research: Robust Design for Embedded Engine Systems. In Proceedings of the 48th AIAA/ASME/SAE/ASEE Joint Propulsion Conference and Exhibit, Atlanta, GA, USA, 30 July–1 August 2021. [Google Scholar]
  2. Giesecke, D.; Lehmler, M.; Friedrichs, J.; Blinstrub, J.; Bertsch, L.; Heinze, W. Evaluation of ultra-high bypass ratio engines for an over-wing aircraft configuration. J. Glob. Power Propuls. Soc. 2018, 2, 493–515. [Google Scholar] [CrossRef] [Scilit]
  3. Mennicken, M.; Schoenweitz, D.; Schnoes, M.; Schnell, R. Fan design assessment for BLI propulsion systems. CEAS Aeronaut. J. 2022, 13, 3–19. [Google Scholar] [CrossRef] [Scilit]
  4. Kurzke, J. Gasturb 12—Design and Off-Design Performance of Gas Turbines; GasTurb GmbH: Aachen, Germany, 2015. [Google Scholar]
  5. Poll, D.I.A.; Schumann, U. An estimation method for the fuel burn and other performance characteristics of civil transport aircraft; part 3 full flight profile when the trajectory is specified. Aeronaut. J. 2025, 129, 825–861. [Google Scholar] [CrossRef] [Scilit]
  6. Koch, C. SynTrac-Engine Turbofan. DARUS. Available online: https://darus.uni-stuttgart.de/dataset.xhtml?persistentId=doi:10.18419/DARUS-5701 (accessed on 20 April 2026).
  7. Giesecke, D.; Friedrichs, J.; Stark, U. Preliminary Aerodynamic Design of a Fan Stage for an Ultra High Bypass Ratio Engine. In Proceedings of the 23rd ISABE Conference, Manchester, UK, 3–8 September 2017; pp. 3–8. [Google Scholar]
  8. Bijewitz, J.; Seitz, A.; Hornung, M. Architectural comparison of advanced ultra-high bypass ratio turbofans for medium to long range application. In Proceedings of the Deutsche Gesellschaft für Luft- und Raumfahrt-Lilienthal-Oberth e.V., Rostock, Germany, 22–24 September 2015. [Google Scholar]
  9. Sebastiampillai, J.; Jacob, F.; Mastropierro, F.S.; Rolt, A. Modelling Geared Turbofan and Open Rotor Engine Performance for Year-2050 Long-Range and Short-Range Aircraft. In Proceedings of the ASME Turbo Expo 2019: Turbomachinery Technical Conference and Exposition; American Society of Mechanical Engineers: New York, NY, USA, 2019; Volume 58547, p. V001T01A012. [Google Scholar]
  10. Benjamin, L.; Heykena, C.; Friedrichs, J.; Marquez, C. Design and Optimization of a Nacelle for a UHBR Turbofan engine using an Intuitive Class Shape Transformation based parameterization. In Proceedings of the Global Power and Propulsion Society Chania20 Technical Conference, Virtual, 7–9 September 2020. [Google Scholar]
  11. Benjamin, L.; Friedrichs, J.; Wegener, P.; Marquez Gutierrez, C.O.; Heykena, C. Nacelle 3D Aerodynamic Design and Airframe Integration for an Over Wing Configuration. In Proceedings of the AIAA Scitech 2023 Forum, National Harbor, MD, USA & Online, 23–27 January 2023; p. 1651. [Google Scholar]
  12. Hartmann, J.; Staudacher, S. Engine-Airframe Integration—From Froude Theorem to Numerical Flow Simulation. In Proceedings of the EASN International Conference 2025, Madrid, Spain, 14–17 October 2025. [Google Scholar]
  13. Grey, R.E.; Wilsted, H.D. Performance of Conical Jet Nozzles in Terms of Flow and Velocity Coefficients; Technical Note No.1757; National Advisory Committee for Aeronautics: Washington, DC, USA, 1948. [Google Scholar]
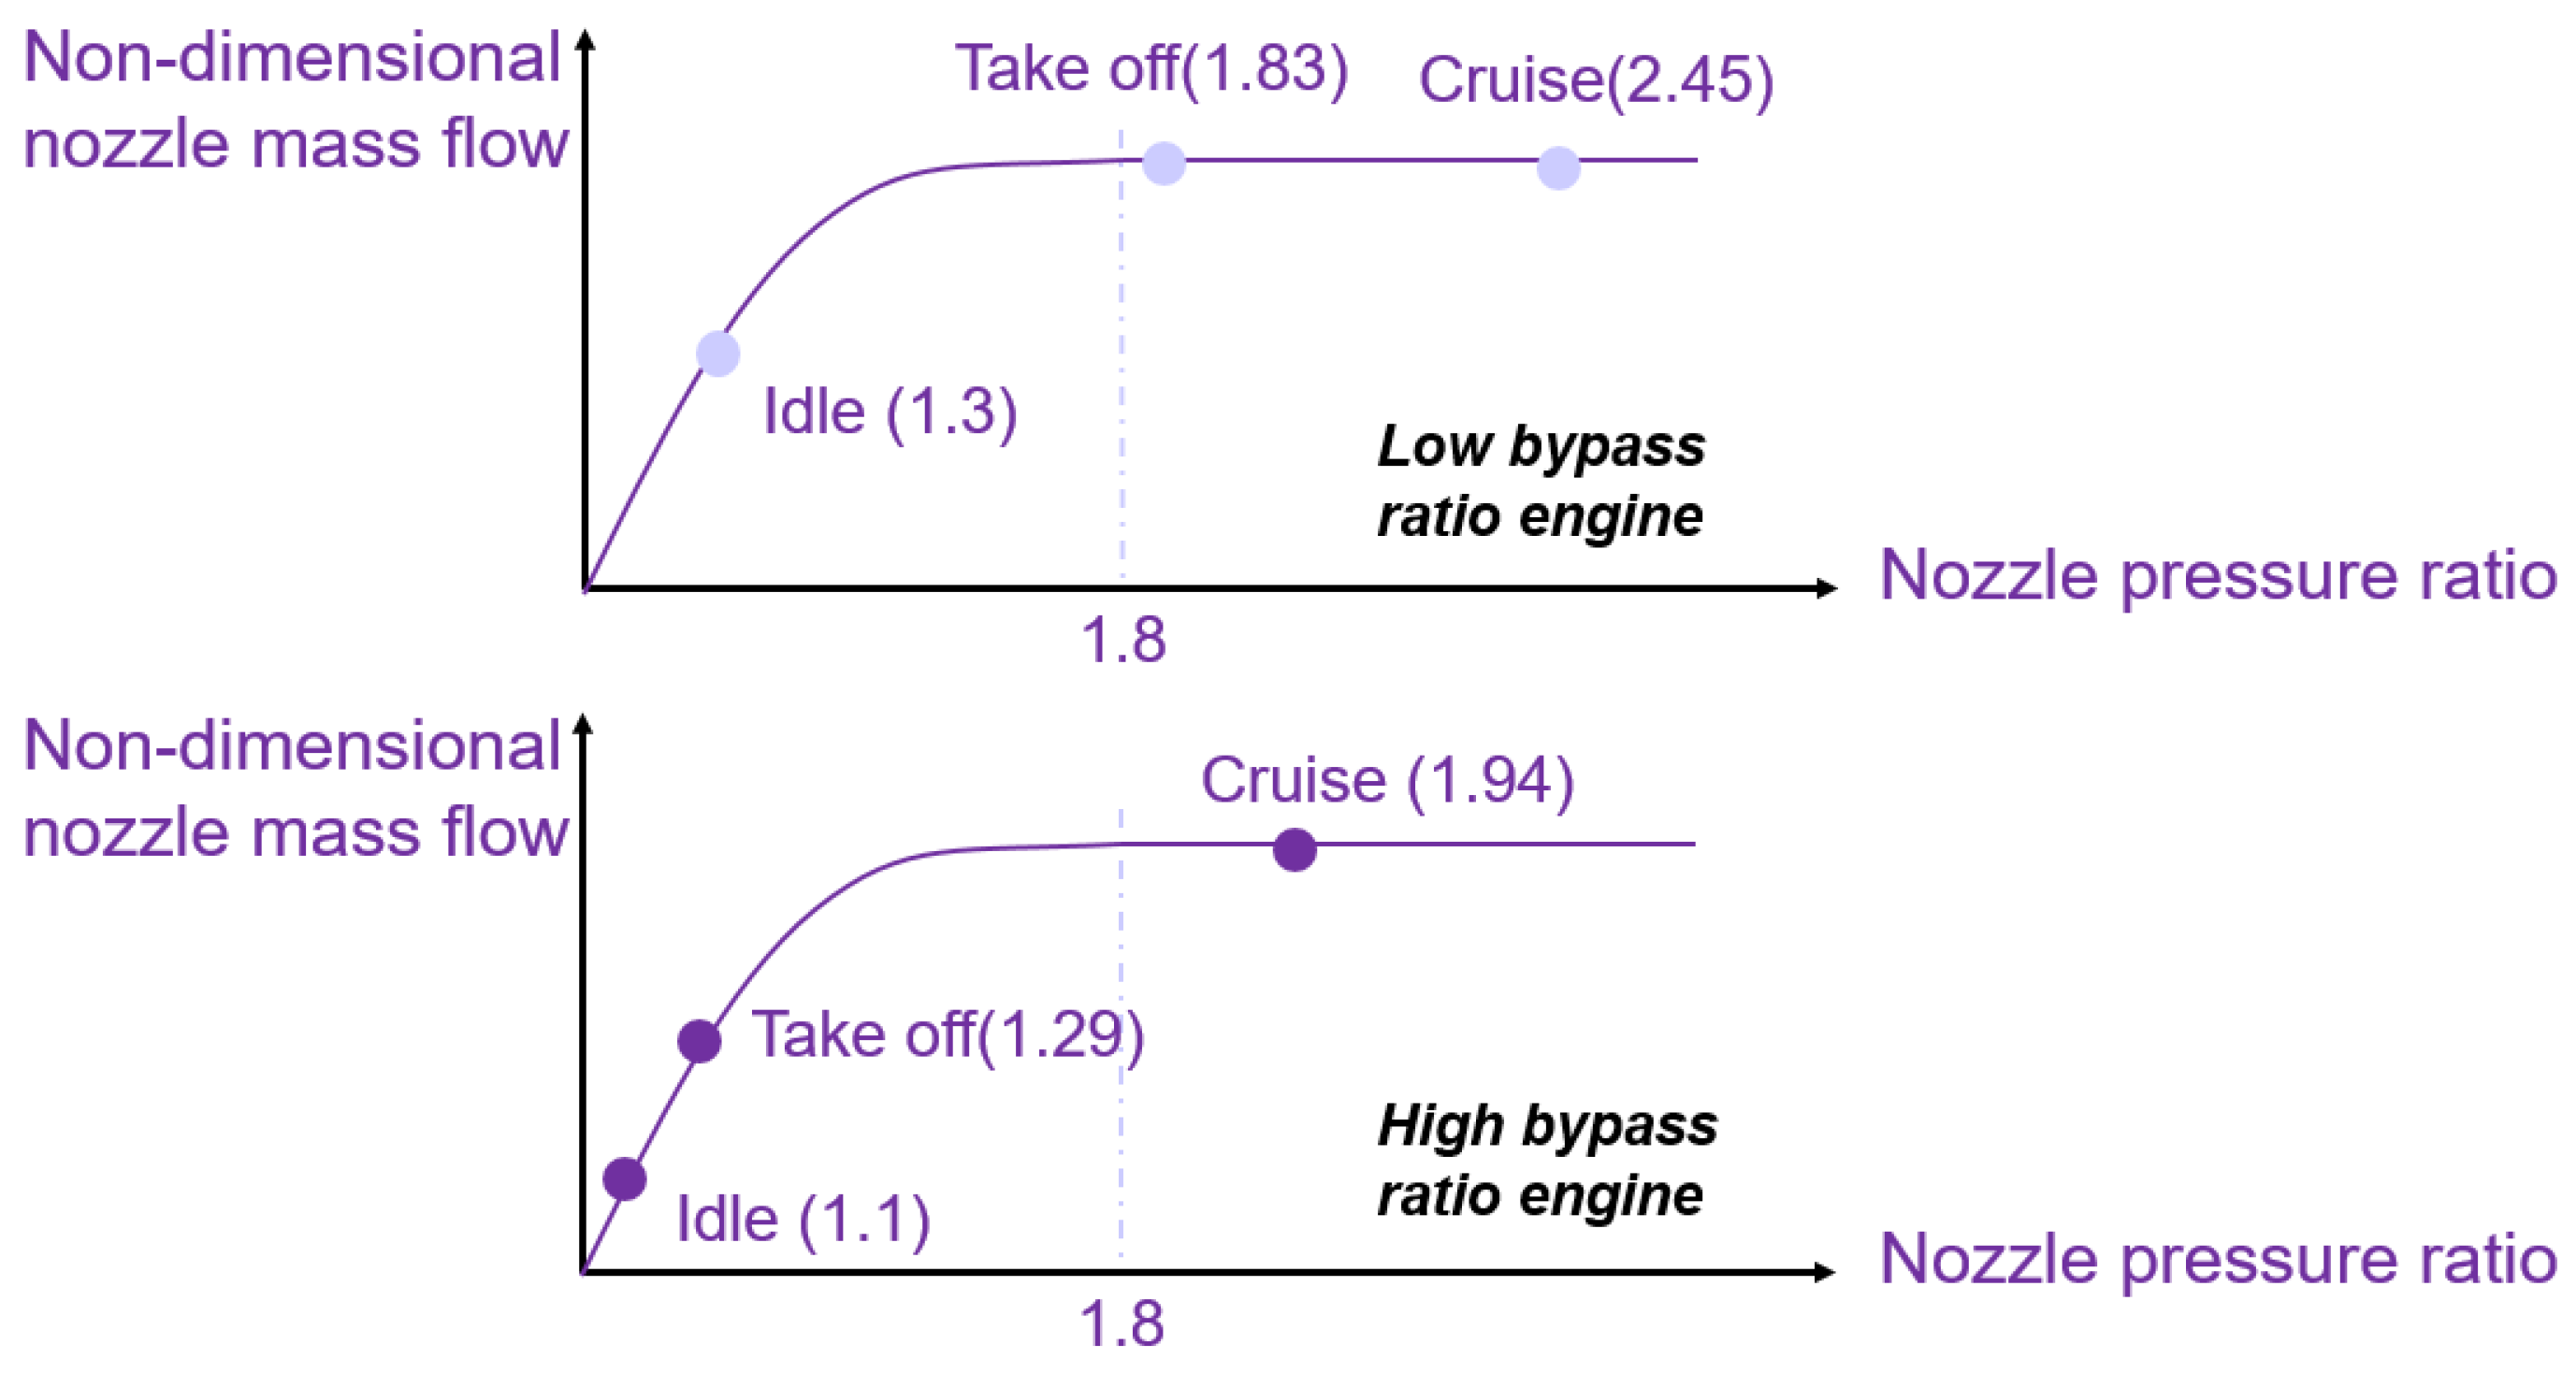
Figure 1. Nozzle characteristics.
Engproc 133 00181 g001
Figure 2. Preliminary UHBR engine geometry [6].
Engproc 133 00181 g002
Figure 3. Engine integration for an aft engine configuration with BLI.
Engproc 133 00181 g003
Figure 4. SFC increase under cruise conditions.
Engproc 133 00181 g004
Figure 5. SFC increase under take-off conditions.
Engproc 133 00181 g005
Figure 6. Fan working line variation with C d decrease.
Engproc 133 00181 g006
Figure 7. Fan working line variation with intake loss increase.
Engproc 133 00181 g007
Figure 8. Intake loss for BLI configuration [12].
Engproc 133 00181 g008
Figure 9. Nozzle discharge coefficient map [13].
Engproc 133 00181 g009
Figure 10. SFC increase with Cd map.
Engproc 133 00181 g010
Figure 11. Fan working line variation with Cd map.
Engproc 133 00181 g011
Figure 12. SFC increase with BLI intake map.
Engproc 133 00181 g012
Figure 13. Fan working line variation with BLI intake map.
Engproc 133 00181 g013
Figure 14. Scaling factors for fan map.
Engproc 133 00181 g014
Table 1. NPSS engine cycle data at cruise and take-off points.
Operating PointOveral Pressure RatioCombustor Exit TemperatureSFC
[-]Kg/(kN·s)
Cruise74.91699.913.13
Take-Off61.91849.216.02
Disclaimer/Publisher’s Note: The statements, opinions and data contained in all publications are solely those of the individual author(s) and contributor(s) and not of MDPI and/or the editor(s). MDPI and/or the editor(s) disclaim responsibility for any injury to people or property resulting from any ideas, methods, instructions or products referred to in the content.