1. Introduction
Understanding a structure dynamic behaviour is key to assessing its condition. System Identification (SI) provides these properties from measured data, forming the basis of structural health monitoring (SHM) for detecting and evaluating damage. Since modal parameters often differ between ground tests and real operating conditions, Operational Modal Analysis (OMA) enables their continuous estimation in service. As modern spacecraft become lighter and more flexible, the demand for autonomous, on-board monitoring grows, making SHM an increasingly important challenge for future aerospace structures.
SI methods aim to model system behaviour using measured data, a mathematical model, and a validation criterion [
1,
2]. Methods can be input–output or output-only, depending on the availability of excitation signals. This work uses a time-domain method, such as the Eigensystem Realization Algorithm (ERA), and introduces new frequency-domain approaches, such as the Fast and Relaxed Vector Fitting (FRVF), in an output-only context. Time-domain methods are efficient but may suffer from noise and short datasets, while frequency-domain methods generally yield more robust modal estimates. In aerospace, SI for OMA has been applied to Space Station Resource Node [
3] and Space Shuttle tail rudder [
4] structural analysis.
OMA estimates modal parameters from measured responses without applying controlled excitations. It is suitable for large or complex structures, including bridges, buildings, and aerospace vehicles [
5,
6,
7], which are excited by ambient loads modelled as Gaussian white noise [
8]. Usually these ambient responses are processed via the Natural Excitation Technique (NExT), here combined with FRVF and benchmarked against NExT–ERA [
9,
10]. It is relevant to note that OMA assumes linearity, stationarity, and sufficient sensor coverage.
SHM exploits SI by monitoring modal parameters over time to detect and quantify damage because of natural frequencies, and mode shapes are directly linked to mass and stiffness [
11]. Frequency changes indicate potential damage in the structure, while mode shapes help localise it [
12,
13]. Damping is not usually considered for SHM due to its intrinsic uncertainty. These are the foundations of vibration-based SHM as a non-destructive evaluation method [
14]. This work focuses on this by employing frequency-domain techniques based on frequency response functions (FRFs). The SHM workflow used in this work is summarised in
Figure 1.
The main aim of this work is to develop a robust output-only SI methodology with accuracy comparable to established techniques, validated via numerical and experimental data. More specific objectives are to:
Implement NExT–FRVF in a fully output-only setting;
Apply the method to aerospace structures where excitations are unmeasurable;
Contribute to non-destructive SHM using vibration-based monitoring.
The idea behind the use of FRVF in an output-only scenario is to exploit its robustness and accuracy in modal identification, as previously demonstrated for single-input multiple-output cases [
11,
16], and to extend these capabilities to cases with unknown inputs.
2. Methods
2.1. Natural Excitation Technique
The Natural Excitation Technique (NExT) extracts impulse response functions (IRFs) from output-only measurements to estimate modal parameters by using SI methods such as ERA [
17]. Initially developed for scenarios with unknown excitations [
18], NExT assumes that the system is linear, time-invariant (LTI), and excited by broadband random signals [
19]. The system can be represented as,
, with zero-mean covariance
.
NExT cross-correlation functions
approximate free-decay responses, yielding IRFs which are used directly in ERA or transformed via Fast Fourier Transform (FFT) for FRVF:
and are outputs at different locations, is the time lag, and is the observation time.
2.2. Fast and Relaxed Vector Fitting
Vector Fitting (VF) models frequency-domain responses using rational functions [
20]. Starting from a single degree-of-freedom (SDOF) system,
, the corresponding transfer function, the FRF in this case, is defined as follows:
where
are poles (related to natural frequencies and damping) and
are residues (related to mode shapes). A two-stage least-squares (LS) procedure iteratively identifies poles and residues:
FRVF introduces
to reduce large pole shifts and prevent trivial solutions [
21]:
FRVF exploits QR decomposition to handle large LS systems efficiently [
22]:
This FRVF variant was first applied to the modal identification of single-input multi-output systems in [
11,
16].
2.3. NExT-FRVF Implementation
NExT-FRVF is obtained by combining NExT and FRVF, as outlined in Algorithm 1.
| Algorithm 1 NExT-FRVF Algorithm |
- 1:
Input: Output signals , model order N, iterations , sampling frequency , reference channels, delay . - 2:
Output: Poles , residues , coefficients d, e, state-space model. - 3:
Compute IRFs via cross-correlation. - 4:
Transform IRFs to FRFs via FFT. - 5:
Initialize poles . - 6:
for to do - 7:
Solve LS (QR decomposition) and update poles using zeros of . - 8:
end for - 9:
Extract modal parameters from state-space representation.
|
3. Numerical Case Study
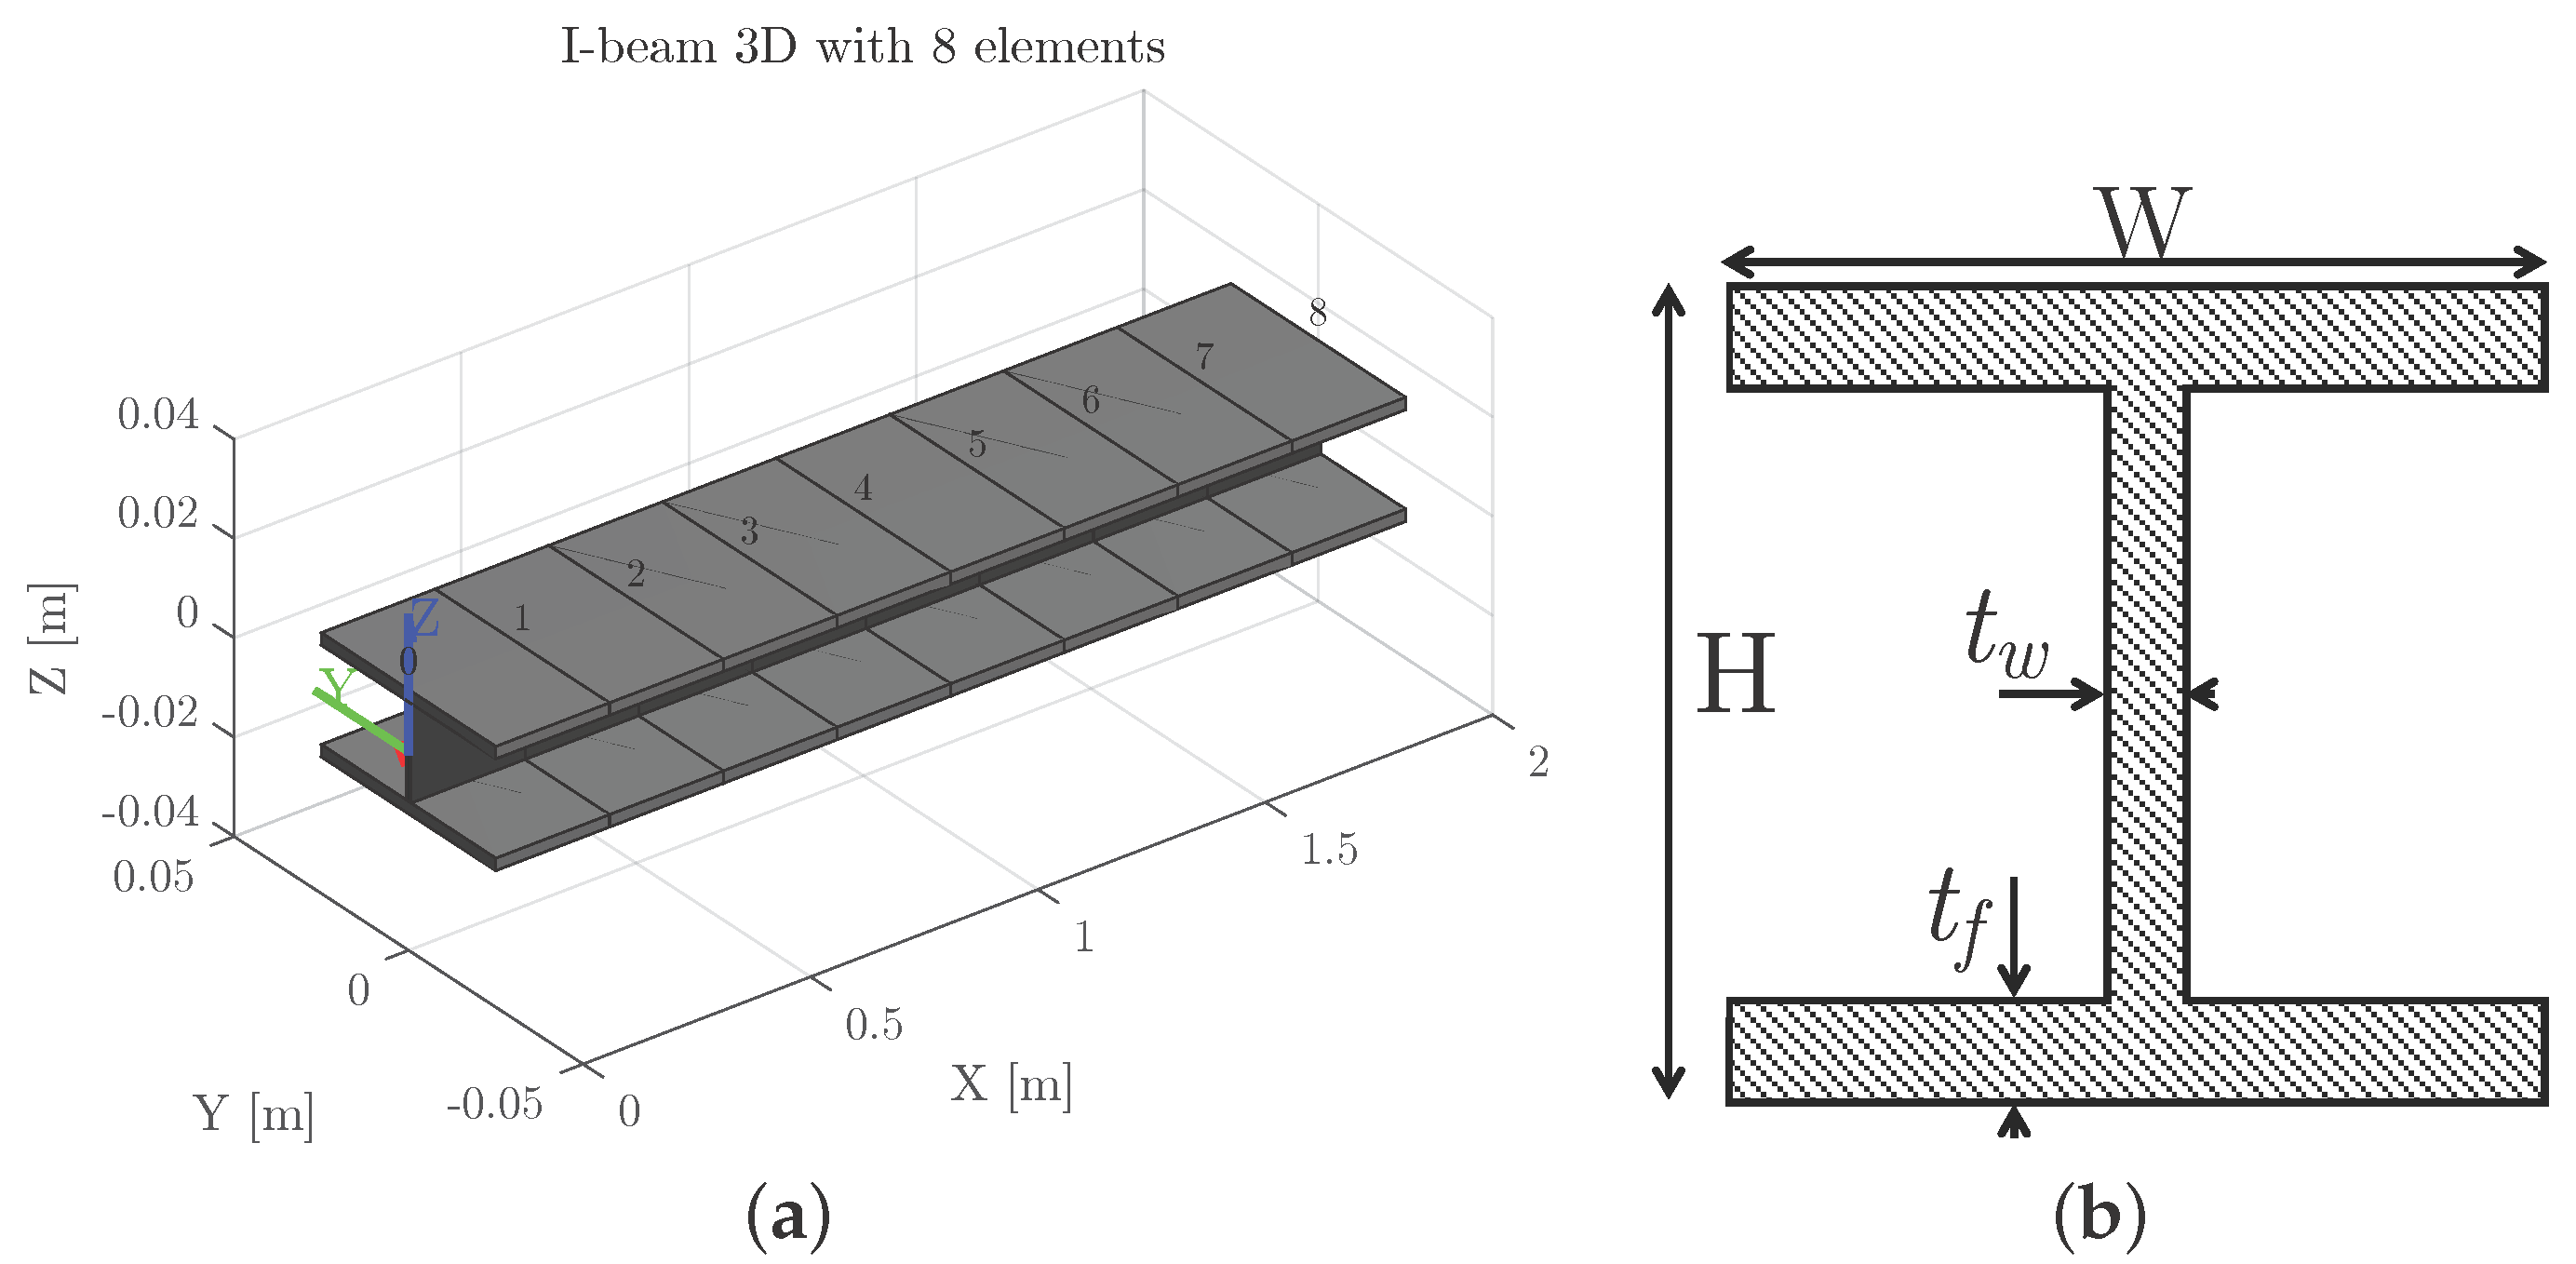
Numerical validation is based on an aluminium Euler–Bernoulli cantilever beam with an I-shaped cross-section (
Figure 2a). Its cross-sectional geometry is summarised in
Figure 2b, and standard aluminium properties (density
and Young’s Modulus
) are assumed.
The beam is discretised into eight Euler–Bernoulli elements with transverse DoFs only and uniform 3% modal damping. A 1 N vertical impulse is applied at node 1 at for one sampling period. The simulation uses and , providing a Nyquist frequency of to capture all modes.
The IRF is computed from the first displacement response using NExT correlation functions (see Algorithm 1). The resulting FRFs are then used as FRVF inputs.
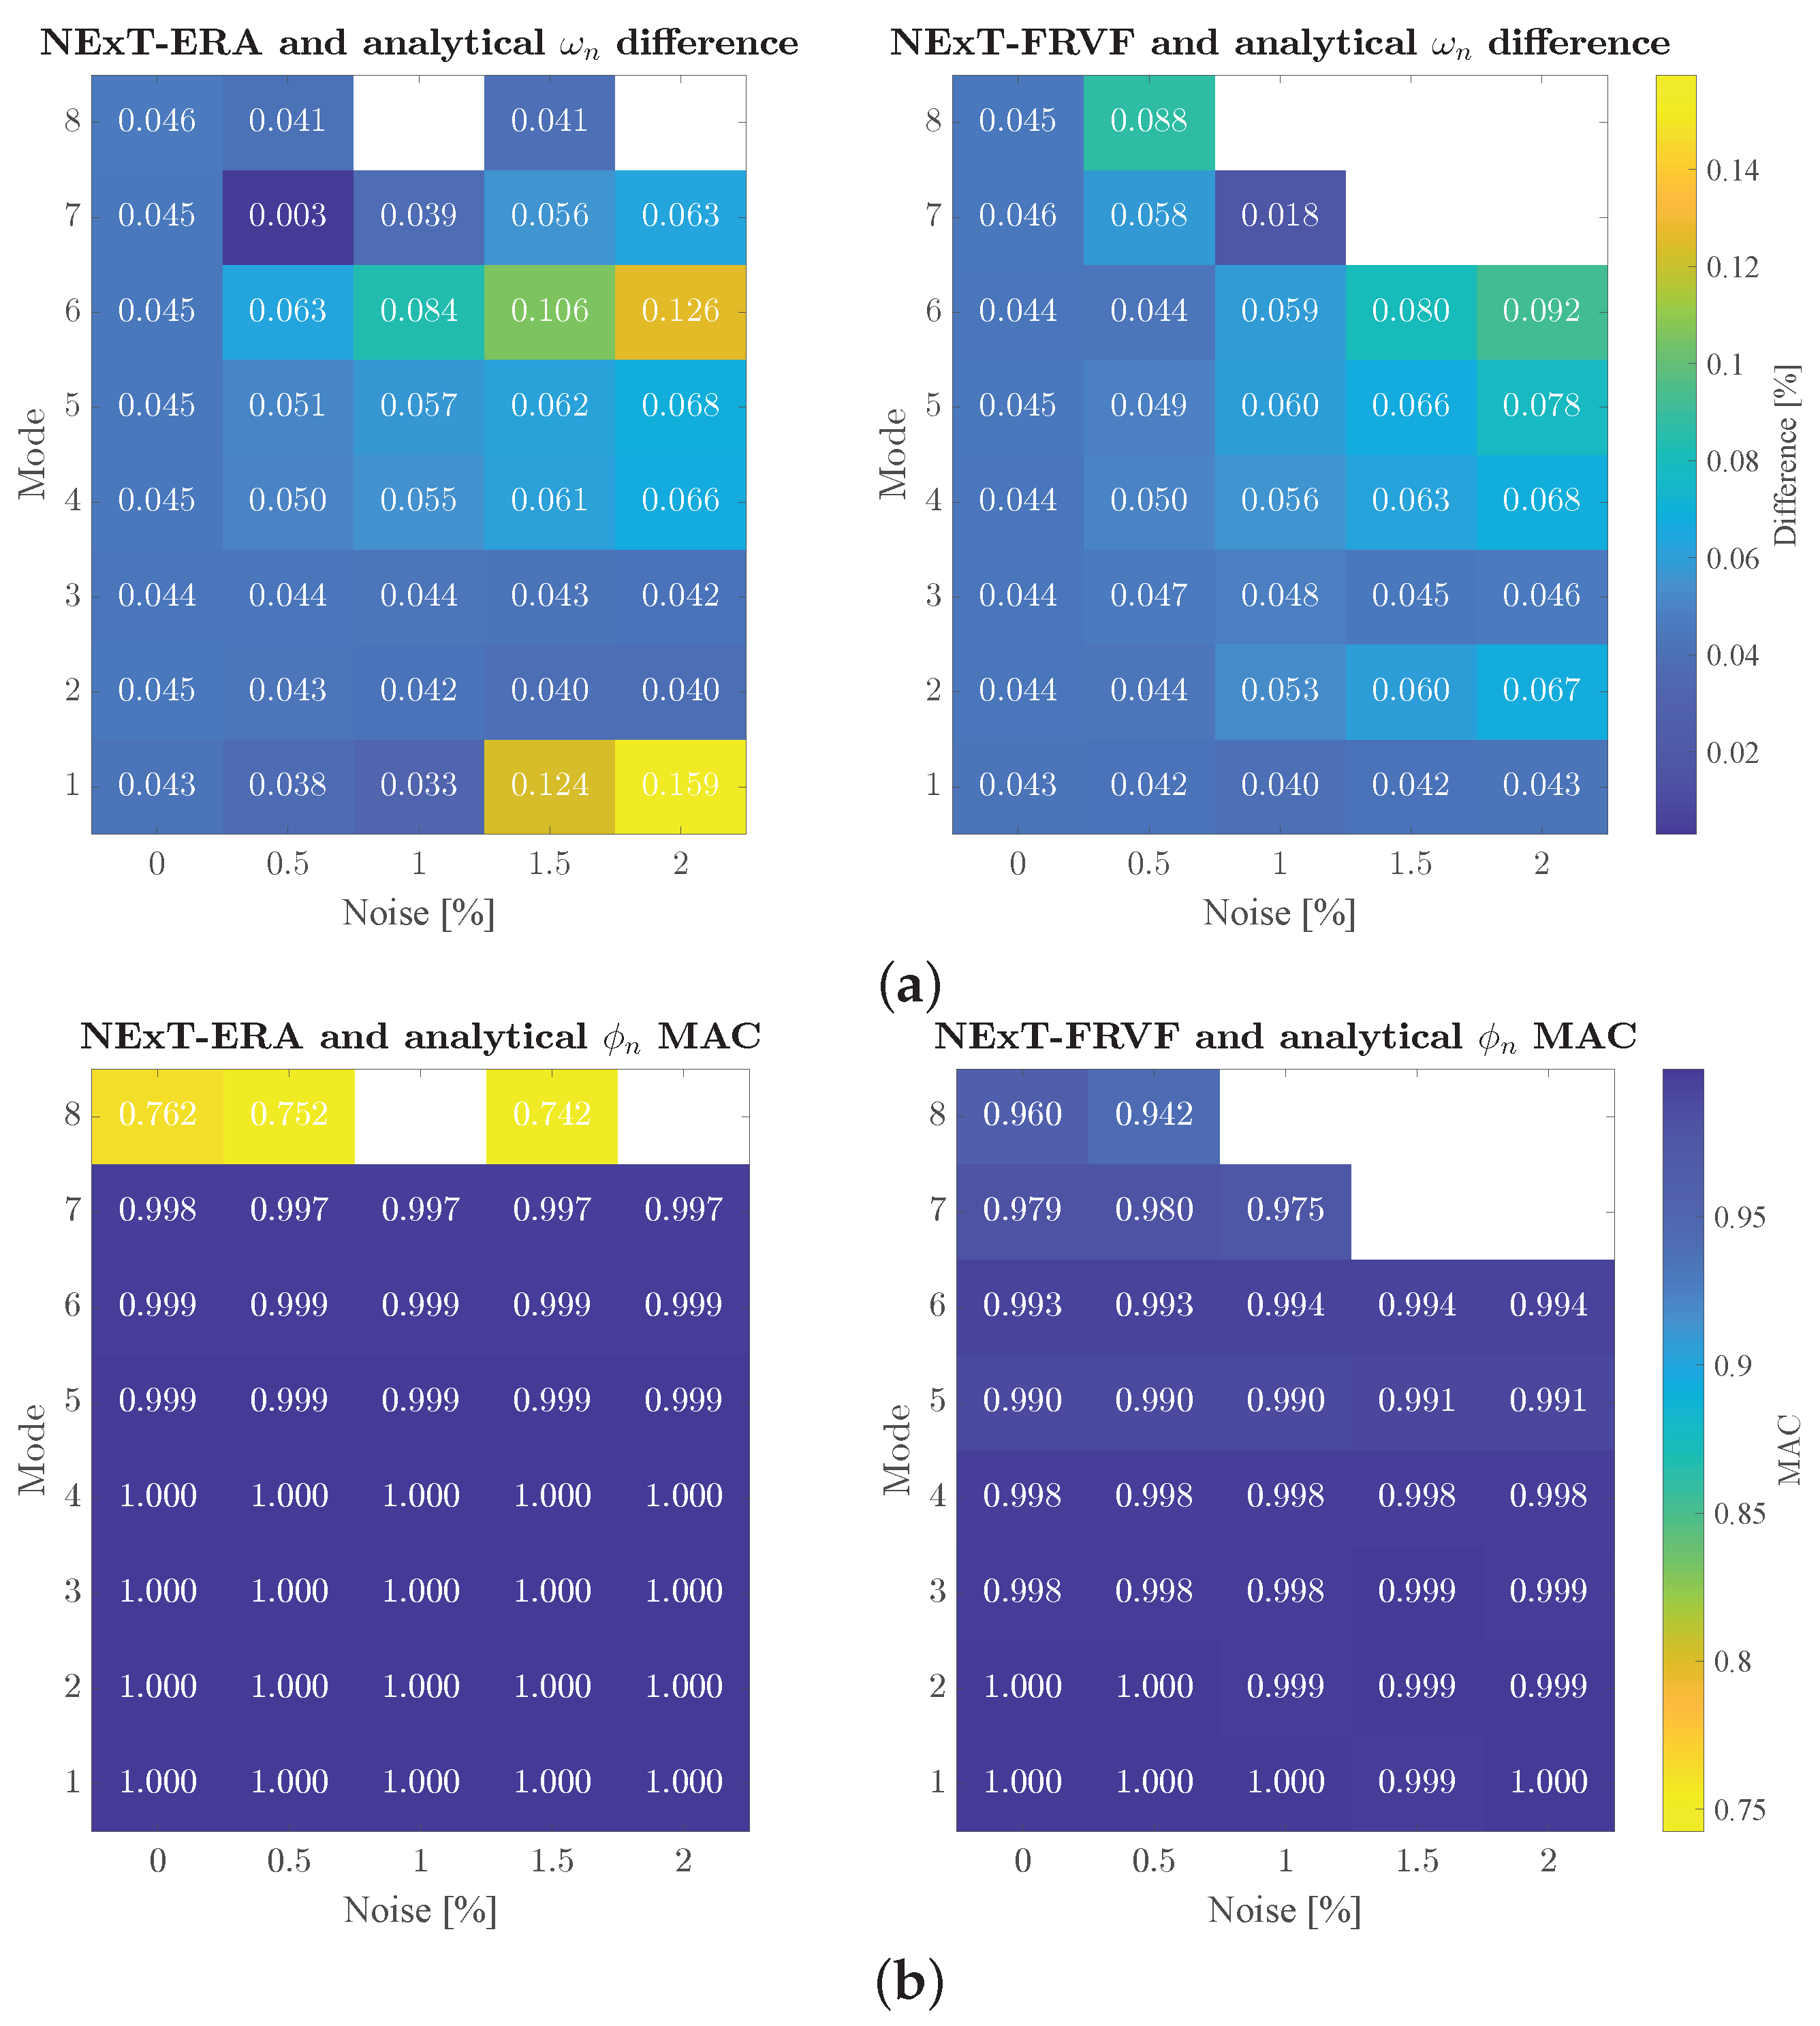
Figure 3 shows that both NExT-ERA and NExT-FRVF estimate modal frequencies and shapes with errors below 1%. Moreover, high Modal Assurance Criterion (MAC) values confirm the mode shapes correlation with the analytical results. Additionally, a parametric study is carried out to evaluate the influence of noise on identification accuracy. This is analysed by adding different noise levels to the output signal, showing that the increase in noise leads to missed modes and the appearance of spurious poles, particularly for higher-frequency modes (which are also the less excited ones).
Overall, the parametric analysis highlights how these four factors jointly shape the reliability and completeness of NExT-FRVF modal identification.
4. International Space Station Results
This section presents the validation of the NExT-FRVF algorithm using operational data from the International Space Station (ISS), an ideal case for output-only analysis due to the impracticality of laboratory testing.
The ISS provides a unique microgravity environment [
23], consisting of three main modules housing equipment for life support, data collection, and maintenance, contributing to a broad vibrational spectrum. Acceleration data are collected via the Space Acceleration Measurement System (SAMS) [
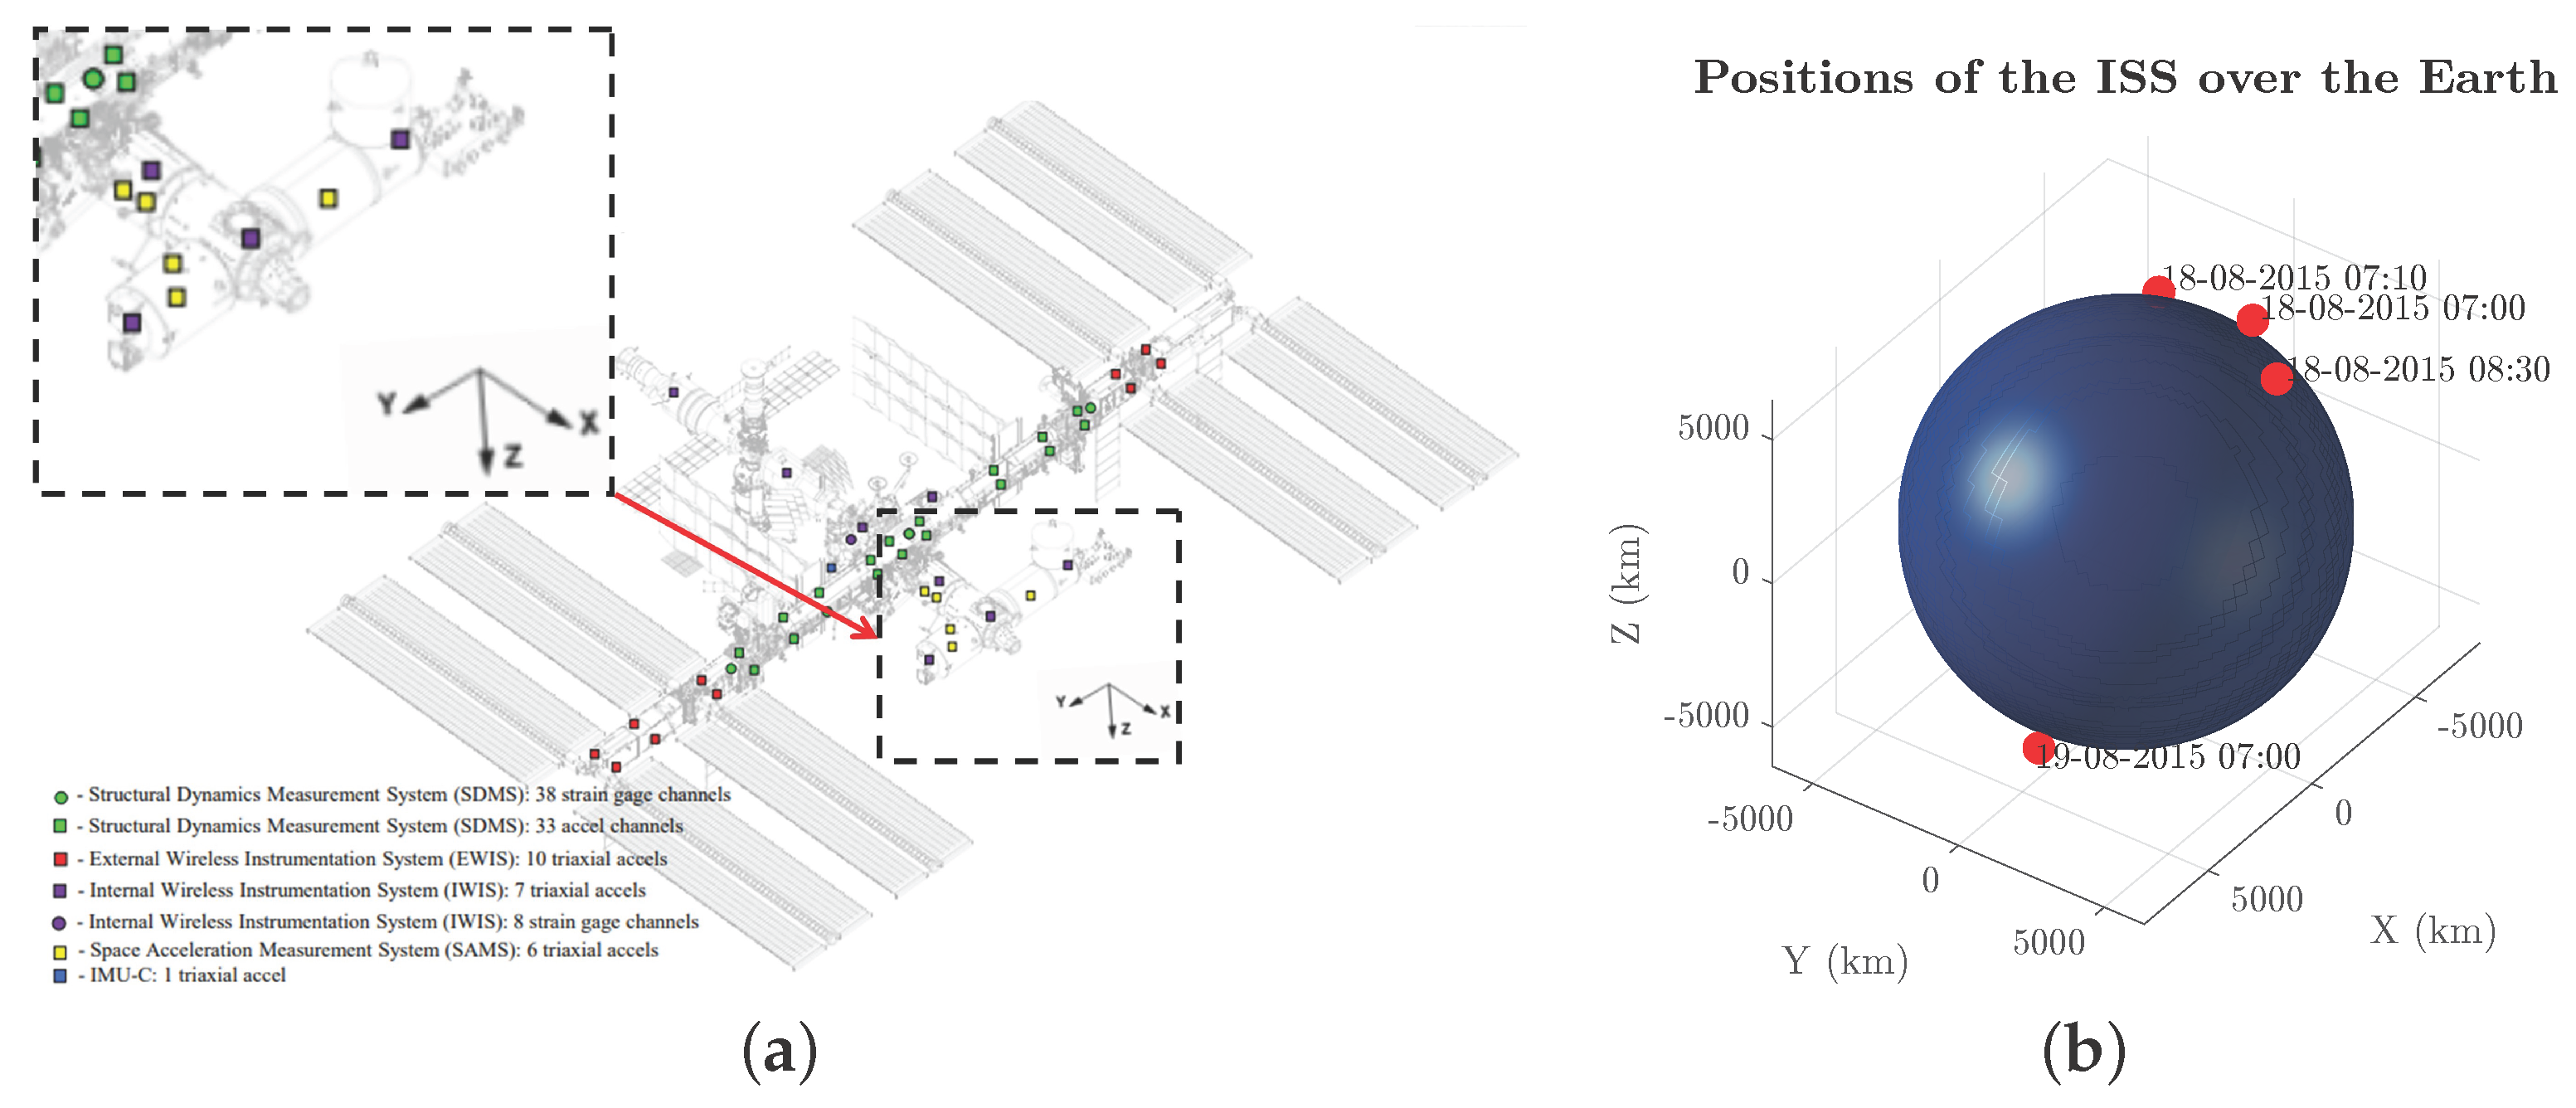
24], continuously recording small structural vibrations since 2001 under the supervision of the NASA Glenn Research Center. Sensors and ISS locations are shown in
Figure 4a,b, respectively.
Although the ISS centre of mass experiences near-zero gravity, its components vibrate due to mechanical connections. Accelerations originate from atmospheric drag, crew activity, system operations, and structural modes (e.g., truss and solar arrays). The microgravity environment includes quasi-steady, vibratory, and transient components, but this work focuses on the vibratory regime: .
This study analyses natural frequencies from 0.01 Hz to 2.5 Hz, corresponding to local vibrational modes. The dataset corresponds to a time series recorded on 18 August 2015, between 7:05:10.590 and 7:10:33.056 UTC, using five sensors with sampling frequency
Hz and duration
min and 22.466 s. Prior to the study, mode identification sensor signal sampling is aligned via interpolation to a common time vector and rotated to the global ISS reference frame [
26].
As explained for the numerical case, the NExT algorithm provides the FRF of the preprocessed acceleration signals to be fitted. Parameters of the fitting procedure are set following the numerical study: Unitary weighting and five iterations to ensure convergence despite noise. Before final processing, the signal is decimated to obtain a sampling frequency of 10 Hz, and the identification order is set between 20 and 100.
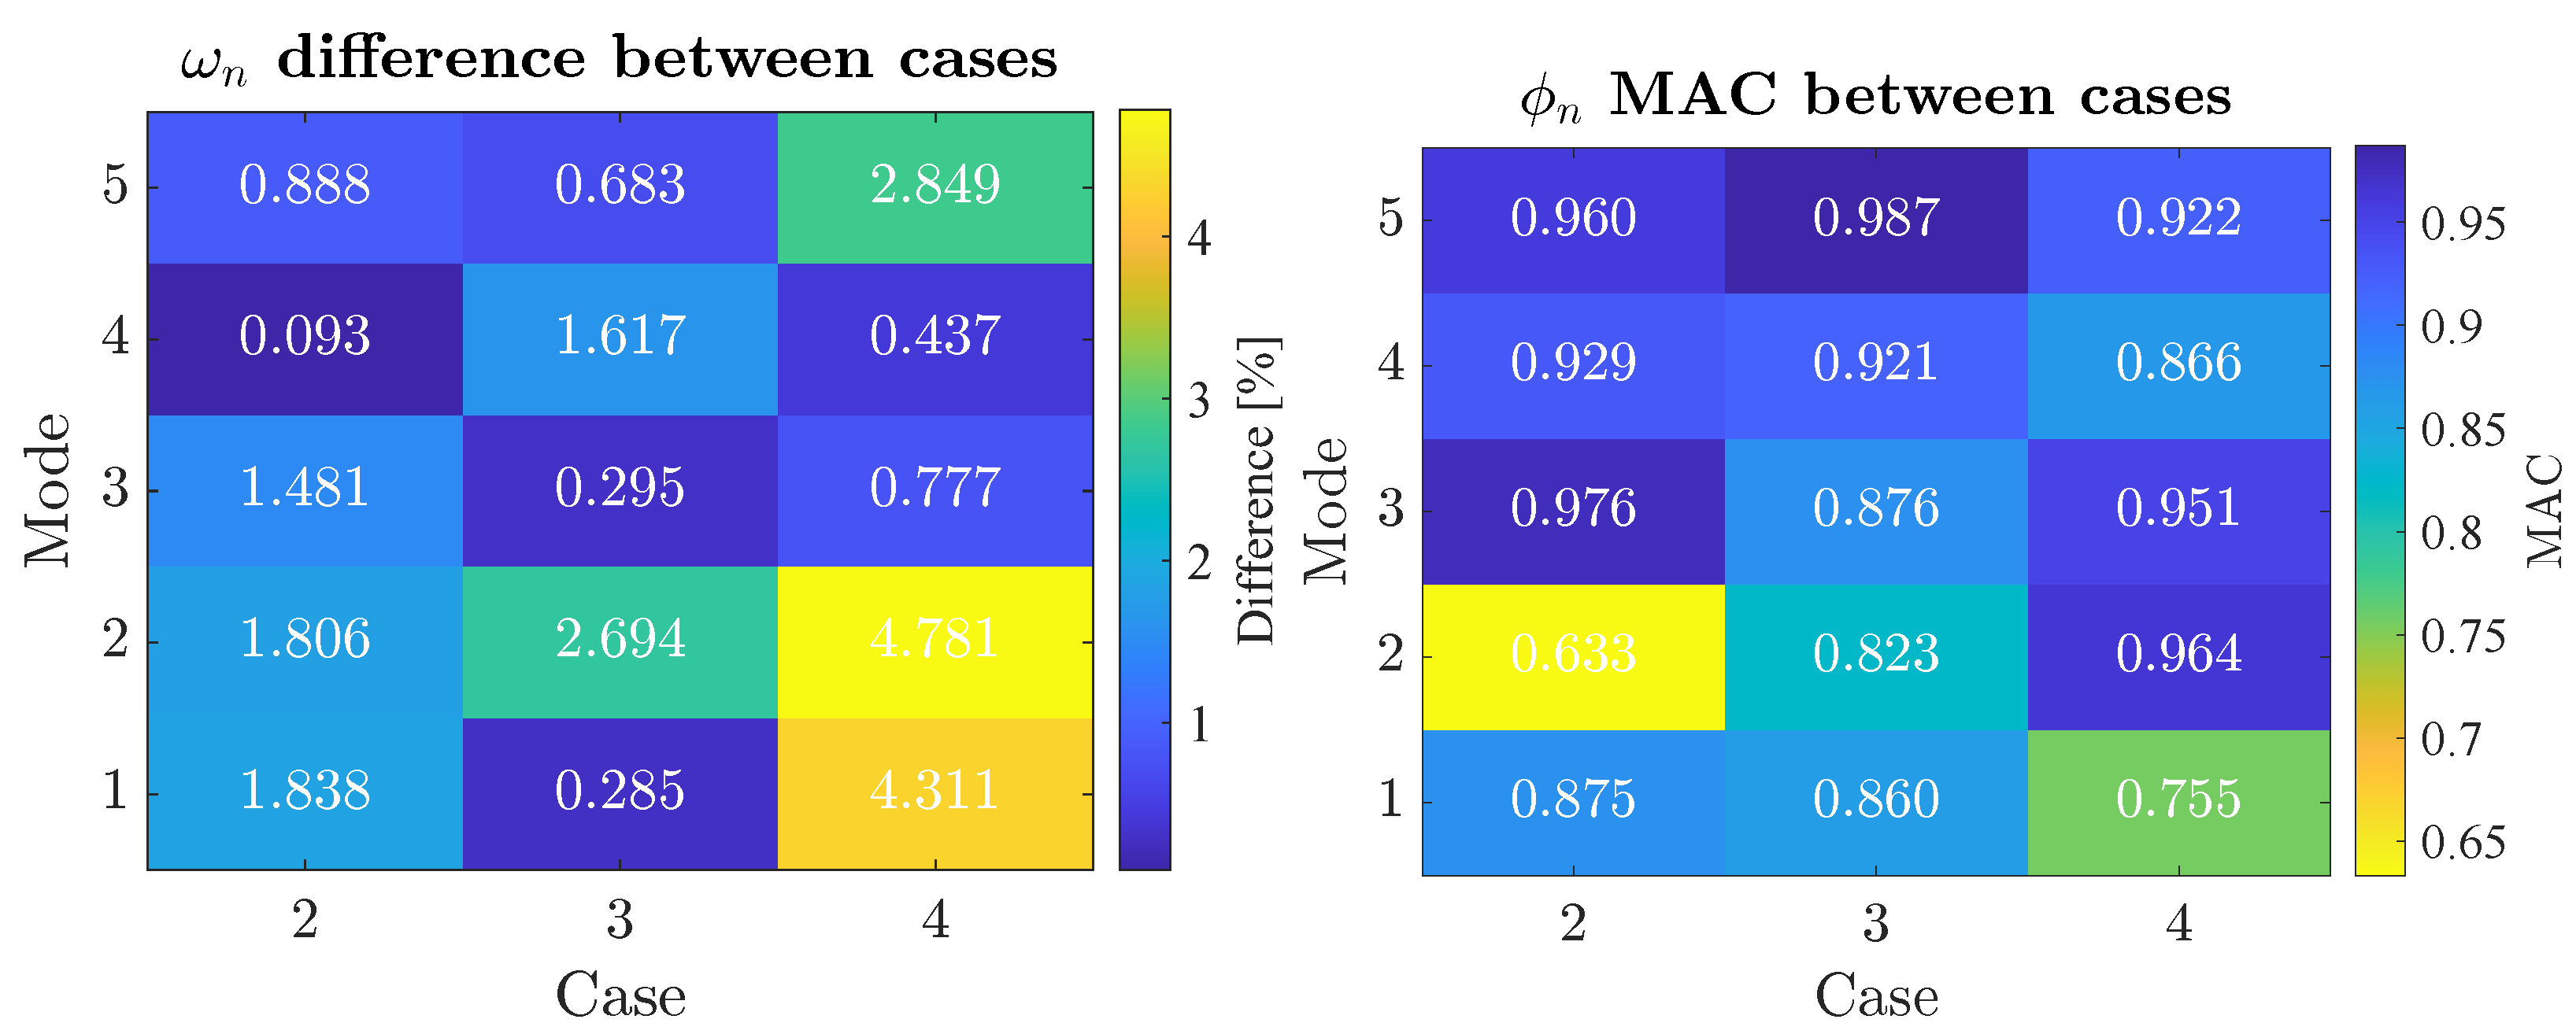
Comparisons with NExT-ERA reveal common modes, occasional duplicate identifications, and differences in mode shapes for similar frequencies. In order to address these potential problems, temporal consistency is used to retain robust modes. Mode consistency over time was also evaluated in the four cases displayed in
Figure 4b. Frequency deviations are below 4.33% (mostly 1%) and MAC values remain around 0.9, confirming robust mode identification (
Figure 5). Damping ratios were not used for validation due to inconsistent estimates.
Then, the NExT-FRVF results were benchmarked against NExT-ERA (
Table 1). It can be appreciated that most of the natural frequency deviations of NExT-FRVF with respect to NExT-ERA are below 1% and that the MAC values tend to exceed 0.98. These results remark again the consistency of the identified modes.
The physical consistency of the results is verified by examining the mode shapes results. In particular, the coupled motion of sensors 121f03 and 121f04 aligns with structural constraints, moving together and showing small displacement because they are positioned at the connection with the rest of the structure. Mode shapes are not visually reported in this work, as its main aim is monitoring, not visualisation.
5. Conclusions and Future Work
The NExT-FRVF algorithm, which integrates NExT and FRVF in an output-only framework, is first implemented for modal analysis, showing strong agreement with NExT-ERA under noiseless conditions. As noise increases, weakly excited modes become harder to identify because the fitting may capture noise. This results in NExT-FRVF identifying higher-frequency modes more accurately than NExT-ERA. Experimental validation on the International Space Station (ISS) Space Acceleration Measurement System (SAMS) data confirms that the extracted modes are temporally stable and consistent with NExT-ERA, yielding physically meaningful results.
Future work may focus on reducing computational cost, automating mode clustering, exploring machine learning-based tuning, and evaluating performance on damaged structures, as well as training data-driven and/or machine learning-based damage detection methods, which could potentially be applied to quasi-real-time modelling if unsupervised Operational Modal Analysis can be implemented. Overall, NExT-FRVF shows strong potential for the structural health monitoring of in-service aerospace structures.
Author Contributions
Conceptualisation, M.C.A., G.D., and M.C.; methodology, M.C.A., G.D., and M.C.; software, M.C.A. and M.C.; validation, M.C.A., M.C., and G.D.; formal analysis, M.C.A.; investigation, M.C.A.; resources, M.C., G.D., and O.E.B.-M.; data curation, M.C.A.; writing—original draft preparation, M.C.A.; writing—review and editing, M.C.A., M.C., G.D., and O.E.B.-M.; visualisation, M.C.A., M.C., and G.D.; supervision, M.C., and G.D.; project administration, M.C. and G.D.; funding acquisition, M.C., G.D., and O.E.B.-M. All authors have read and agreed to the published version of the manuscript.
Funding
The first author’s international research stay during her graduate thesis was funded by the Erasmus+ Programme of the European Union through a student mobility grant. The second and fourth authors are supported by the Madrid Government (Comunidad de Madrid, Spain) under the Multiannual Agreement with the UC3M (IA_aCTRl-CM-UC3M). The third author is supported by the Centro Nazionale per la Mobilità Sostenibile (MOST–Sustainable Mobility Center), Spoke 7 (Cooperative Connected and Automated Mobility and Smart Infrastructures), Work Package 4 (Resilience of Networks, Structural Health Monitoring and Asset Management).
Data Availability Statement
This study used third-party experimental data of the International Space Station from the National Aeronautics and Space Administration (NASA), accessible at
https://gipoc.grc.nasa.gov/wp/pims/home/ (accessed on 1 February 2025) under a license that does not permit redistribution by the authors.
Acknowledgments
The authors thank the National Aeronautics and Space Administration (NASA) for making the International Space Station acceleration recordings openly available.
Conflicts of Interest
The authors declare no conflicts of interest.
References
- Chakraborty, R.; Jain, H.; Seo, G.S. A review of active probing-based system identification techniques with applications in power systems. Int. J. Electr. Power Energy Syst. 2022, 140, 108008. [Google Scholar] [CrossRef] [Scilit]
- Ljung, L. System Identification: Theory for the User, 2nd ed.; Prentice Hall: Upper Saddle River, NJ, USA, 1999. [Google Scholar]
- Pappa, R.S. Independent analysis of the space station node modal test data. J. Guid. Control. Dyn. 1999, 22, 22–27. [Google Scholar] [CrossRef] [Scilit] [PubMed]
- Pappa, R.S.; James, G.H., III; Zimmerman, D.C. Autonomous modal identification of the space shuttle tail rudder. J. Spacecr. Rocket. 1998, 35, 163–169. [Google Scholar] [CrossRef] [Scilit] [PubMed]
- Magalhães, F.; Cunha, Á. Explaining operational modal analysis with data from an arch bridge. Mech. Syst. Signal Process. 2011, 25, 1431–1450. [Google Scholar] [CrossRef] [Scilit]
- Dessena, G.; Civera, M.; Zanotti Fragonara, L.; Ignatyev, D.I.; Whidborne, J.F. A Loewner-Based System Identification and Structural Health Monitoring Approach for Mechanical Systems. Struct. Control Health Monit. 2023, 2023, 1891062. [Google Scholar] [CrossRef] [Scilit]
- Sibille, L.; Civera, M.; Zanotti Fragonara, L.; Ceravolo, R. Automated operational modal analysis of a helicopter blade with a density-based cluster algorithm. AIAA J. 2023, 61, 1411–1427. [Google Scholar] [CrossRef] [Scilit]
- Reynders, E. System identification methods for (operational) modal analysis: Review and comparison. Arch. Comput. Methods Eng. 2012, 19, 51–124. [Google Scholar] [CrossRef] [Scilit]
- Siringoringo, D.M.; Fujino, Y. System identification of suspension bridge from ambient vibration response. Eng. Struct. 2008, 30, 462–477. [Google Scholar] [CrossRef] [Scilit]
- Moncayo, H.; Marulanda, J.; Thomson, P. Identification and monitoring of modal parameters in aircraft structures using the natural excitation technique (NExT) combined with the eigensystem realization algorithm (ERA). J. Aerosp. Eng. 2010, 23, 99–104. [Google Scholar] [CrossRef] [Scilit]
- Civera, M.; Calamai, G.; Fragonara, L.Z. System identification via fast relaxed vector fitting for the structural health monitoring of masonry bridges. In Structures; Elsevier: Amsterdam, The Netherlands, 2021; Volume 30, pp. 277–293. [Google Scholar]
- Hong-Ping, Z.; Bo, H.; Xiao-qiang, C. Detection of structural damage through changes in frequency. Wuhan Univ. J. Nat. Sci. 2005, 10, 1069–1073. [Google Scholar] [CrossRef] [Scilit]
- Porcu, M.; Patteri, D.; Melis, S.; Aymerich, F. Effectiveness of the FRF curvature technique for structural health monitoring. Constr. Build. Mater. 2019, 226, 173–187. [Google Scholar] [CrossRef] [Scilit]
- Balageas, D.; Fritzen, C.P.; Güemes, A. Structural Health Monitoring; John Wiley & Sons: Hoboken, NJ, USA, 2010; Volume 90. [Google Scholar]
- Civera, M.; Dessena, G.; Cózar Alcázar, M.; Undiano Echániz, S.; Bonilla-Manrique, O.E. International Space Station operational modal analysis via iterative pole relocation. arXiv 2026, arXiv:2605.26257. [Google Scholar] [CrossRef] [Scilit]
- Civera, M.; Calamai, G.; Zanotti Fragonara, L. Experimental modal analysis of structural systems by using the fast relaxed vector fitting method. Struct. Control Health Monit. 2021, 28, e2695. [Google Scholar] [CrossRef] [Scilit]
- Dessena, G.; Civera, M.; Yousefi, A.; Surace, C. NExT-LF: A Novel Operational Modal Analysis Method via Tangential Interpolation. Int. J. Mech. Syst. Dyn. 2025, 5, 401–414. [Google Scholar] [CrossRef] [Scilit]
- James, G.H., III; Carne, T.G.; Lauffer, J.P. The Natural Excitation Technique (NExT) for Modal Parameter Extraction from Operating Wind Turbines; Technical Report; Sandia National Labs.: Albuquerque, NM, USA, 1993. [Google Scholar]
- Peeters, B.; De Roeck, G. Reference-based stochastic subspace identification for output-only modal analysis. Mech. Syst. Signal Process. 1999, 13, 855–878. [Google Scholar] [CrossRef] [Scilit]
- Gustavsen, B.; Semlyen, A. Rational approximation of frequency domain responses by vector fitting. IEEE Trans. Power Deliv. 1999, 14, 1052–1061. [Google Scholar] [CrossRef] [Scilit]
- Gustavsen, B. Improving the pole relocating properties of vector fitting. IEEE Trans. Power Deliv. 2006, 21, 1587–1592. [Google Scholar] [CrossRef] [Scilit]
- Deschrijver, D.; Mrozowski, M.; Dhaene, T.; De Zutter, D. Macromodeling of multiport systems using a fast implementation of the vector fitting method. IEEE Microw. Wirel. Compon. Lett. 2008, 18, 383–385. [Google Scholar] [CrossRef] [Scilit]
- McPherson, K.; Hrovat, K.; Kelly, E.; Keller, J. A Researcher’s Guide to: Acceleration Environment; Technical Report NP-2015-11-040-JSC; NASA Glenn Research Center; NASA Publication: Greenbelt, MD, USA, 2015. [Google Scholar]
- Glenn Research Center NASA. Power and Attitude Determination (PAD) System. 2024. Available online: https://gipoc.grc.nasa.gov/pims/pub/pad/ (accessed on 11 June 2025).
- Krabbendam, P.G. Microgravity Acceleration Measurement Systems (MAMS & SAMS-II); Technical Report NASA/TM–2018–220013; NASA Glenn Research Center; NASA Publication: Greenbelt, MD, USA, 2018. [Google Scholar]
- International Space Station PIMS Acceleration Data File Description Document; Technical Report PIMS-ISS-101, NASA Glenn Research Center; NASA Publication: Greenbelt, MD, USA, 2001.
| Disclaimer/Publisher’s Note: The statements, opinions and data contained in all publications are solely those of the individual author(s) and contributor(s) and not of MDPI and/or the editor(s). MDPI and/or the editor(s) disclaim responsibility for any injury to people or property resulting from any ideas, methods, instructions or products referred to in the content. |