Proceeding Paper

Moderation Effects: How Body Length Modifies the Effect of Temperature on Parasite Abundance †

1
Department of Mathematics and Descriptive Geometry, Faculty of Civil Engineering, Slovak University of Technology, Radlinského 11, 81005 Bratislava, Slovakia
2
Department of Biology, Zaporizhzhia National University, Universytetska 66, 69011 Zaporizhzhia, Ukraine
3
Institute of Parasitology, Slovak Academy of Sciences, Hlinkova 3, 04001 Košice, Slovakia
*
Author to whom correspondence should be addressed.
Presented at the 6th International Electronic Conference on Applied Sciences, 9–11 December 2025; Available online: https://sciforum.net/event/ASEC2025.
Eng. Proc. 2026, 124(1), 51; https://doi.org/10.3390/engproc2026124051
Published: 2 March 2026
(This article belongs to the Proceedings of The 6th International Electronic Conference on Applied Sciences)

Abstract

Accurate testing and interpretation of interaction effects are essential for a robust understanding of the dynamics of biological systems. However, exclusive reliance on the statistical significance of the interaction term in regression models can lead to either an underestimation or an overestimation of interaction effects. Using empirical data of monogenean ectoparasite abundance in the Pacific so-iuy mullet host, Planiliza haematocheila (Temminck & Schlegel, 1845), we detected context-dependent patterns that standard coefficients failed to capture fully. Specifically, our findings suggest that the temperature–abundance relationship is not uniform across all body length–age classes but is modulated by host ontogeny/size, a pattern only resolved by explicitly evaluating conditional effects.

1. Introduction

In statistics, interaction effects (also known as moderation) describe how a third variable (the moderator) alters the strength or direction of the relationship between an independent variable and a dependent variable [1]. This is a common approach in research on the synergistic and cumulative effects of multiple ecosystem stressors, especially in the context of habitat loss, invasions, pollution, overexploitation, and climate variability [2,3].
Interaction (moderation) can be modeled by adding an interaction term, a multiplicative component (e.g., factor X × factor Z), to the statistical model and estimating its coefficient with corresponding uncertainty [4]. Some studies use ordinary linear regression, which is most suitable for continuous outcomes on an unbounded scale; these assumptions can be inappropriate for binary or count outcomes and for data with skewness or mean–variance relationships [5]. Generalized linear models (GLMs) address this by allowing the response distribution (e.g., binomial or Poisson/negative binomial) and a link function that relates the expected outcome to a linear predictor. In this framework, moderation is implemented by including the interaction term in the linear predictor, enabling the effects of predictors (e.g., host characteristics, environmental factors) to vary across levels of the moderator [4,6].
This paper emphasizes that a critical insight is that exclusive reliance on the statistical significance of the interaction term in regression models can lead to either an understatement or overstatement of interaction effects. Understatement arises when researchers omit interaction terms due to non-significant coefficients, potentially overlooking statistically significant marginal effects of the primary explanatory variable at specific values of the moderating variable. Conversely, overstatement may occur when a statistically significant interaction coefficient is reported without further probing, even though the marginal effects of the primary predictor may be non-significant at certain levels of the moderator [7,8].
Using empirical data, we show that an interaction term may be statistically non-significant even when the marginal effect of the primary predictor remains statistically detectable across part of the moderator’s range. Conversely, a statistically significant interaction coefficient may correspond to marginal effects that are reliably detectable only at specific values of the moderator. Here, we examine monogenean ectoparasite abundance in the Pacific so-iuy mullet host, Planiliza haematocheila (Temminck & Schlegel, 1845), under varying water temperature and seasonal timing, and fit interaction models to test whether host body size moderates the effects of temperature and seasonality on parasite abundance. Taken together, these issues motivate a reanalysis of the same host–parasite dataset previously examined by Shvydka et al. [9]. Rather than revisiting the existence of temperature- and season-associated patterns, we extend that work by focusing on whether these associations are size-related and may be obscured when effects are summarized at the population level.
Shvydka et al. [9] employed generalized additive models to describe size-, temperature-, and season-associated variation in monogenean abundance in P. haematocheila. While their results established temperature and host length as key correlates, they did not explicitly resolve whether the temperature–abundance relationship reflects a single population-level effect or an average of size-specific responses. This distinction is biologically important because body length can modify exposure, gill morphology, and physiological performance [10], potentially changing how temperature translates into realized infection levels. Therefore, we focus on interaction structure, specifically temperature × body length and months × body length, and interpret fitted models using marginal effects to identify the size ranges in which environmental drivers are most influential.

2. Materials and Methods

2.1. Used Data

Published database on abundance of specific monogenean parasite, Ligophorus llewellyni Dmitrieva, Gerasev & Pron’kina, 2007, in the Pacific so-iuy mullet, across localities in the Sea of Azov, and information on host body size, water temperature, seasons, and months [9] was used. The data covered 5444 parasite specimens from 535 fish hosts. The body length range for the fish was 11.6–71.5 cm, with a median of 37.9 cm.

2.2. Statistical Analysis

Before model fitting, a preliminary exploratory data analysis was conducted in accordance with the protocol of Ieno and Zuur [11] to evaluate outliers, homogeneity, zero inflation in the response variable, collinearity among explanatory covariates, and the functional form of the predictor–response relationships. Body length was negligibly correlated with months and water temperature (R = −0.13, p < 0.01 and 0.006, p > 0.05, respectively). Months and water temperature were moderately and negatively correlated (R = −0.5, p < 0.01).
Because parasite abundance data often follow a count distribution with high variance, the negative binomial distribution (NBD) is commonly used to model them [12]. The suitability of the parasite abundance data for an NBD was assessed using Pearson’s chi-square statistic in Quantitative Parasitology 3.0 [13]. As the untransformed count data did not conform to the NBD (p < 0.001), a square-root transformation followed by rounding to the nearest integer was applied. The transformed data exhibited an acceptable fit to the NBD (p = 0.0609) and were therefore retained for subsequent analyses. We acknowledge that the rounding process introduces a certain degree of rounding error into the data. However, we have adopted this approximation, noting that Clarke et al. [14] also found that rounded data provide a statistical result acceptable to biologists. This approach has also been successfully used by Jacobson et al. [15].
However, point estimates derived from interaction models—particularly those involving nonlinear link functions such as logit or probit—may be less reliable than the corresponding confidence interval estimates [16]. Consequently, greater emphasis should be placed on accurately presenting and evaluating confidence interval boundaries rather than relying solely on point estimates when assessing moderation effects. One approach uses marginal effect plots to estimate the focal variable’s marginal effect at substantively meaningful values of the moderating variable. Therefore, we also evaluated marginal effects plots for all interaction terms tested in the statistical analyses.
To analyze the effects of water temperature and months on the square root of parasite abundance (response), we applied GLMs with NBD, using MASS::glm.nb() [17]. Host body size was included as a moderator variable because it is one of the most important traits driving parasite infections [18]. In accordance with the recommendations of Armstrong [19], no correction for multiple testing was performed. To demonstrate how interaction effects can be either obscured or highlighted depending on the dataset context, we generated hypothetical scenarios by creating reduced versions of the original dataset. This approach was used to contrast cases in which the interaction term might be statistically significant in a standard regression table, despite the primary predictor’s marginal effects being non-significant at certain levels of the moderator. Reduced datasets were constructed by randomly removing a minimal number of observations to evaluate the threshold at which parameter estimates for moderating effects become statistically significant. All regression analyses were performed in R version 4.5.2 [20]. The marginal effects plots were performed using the interplot() function by Solt and Hu [21].

3. Results

We fitted the interaction model to the full dataset and to two reduced datasets:
√(parasite abundance) ~ temperature × body length + months × body length.
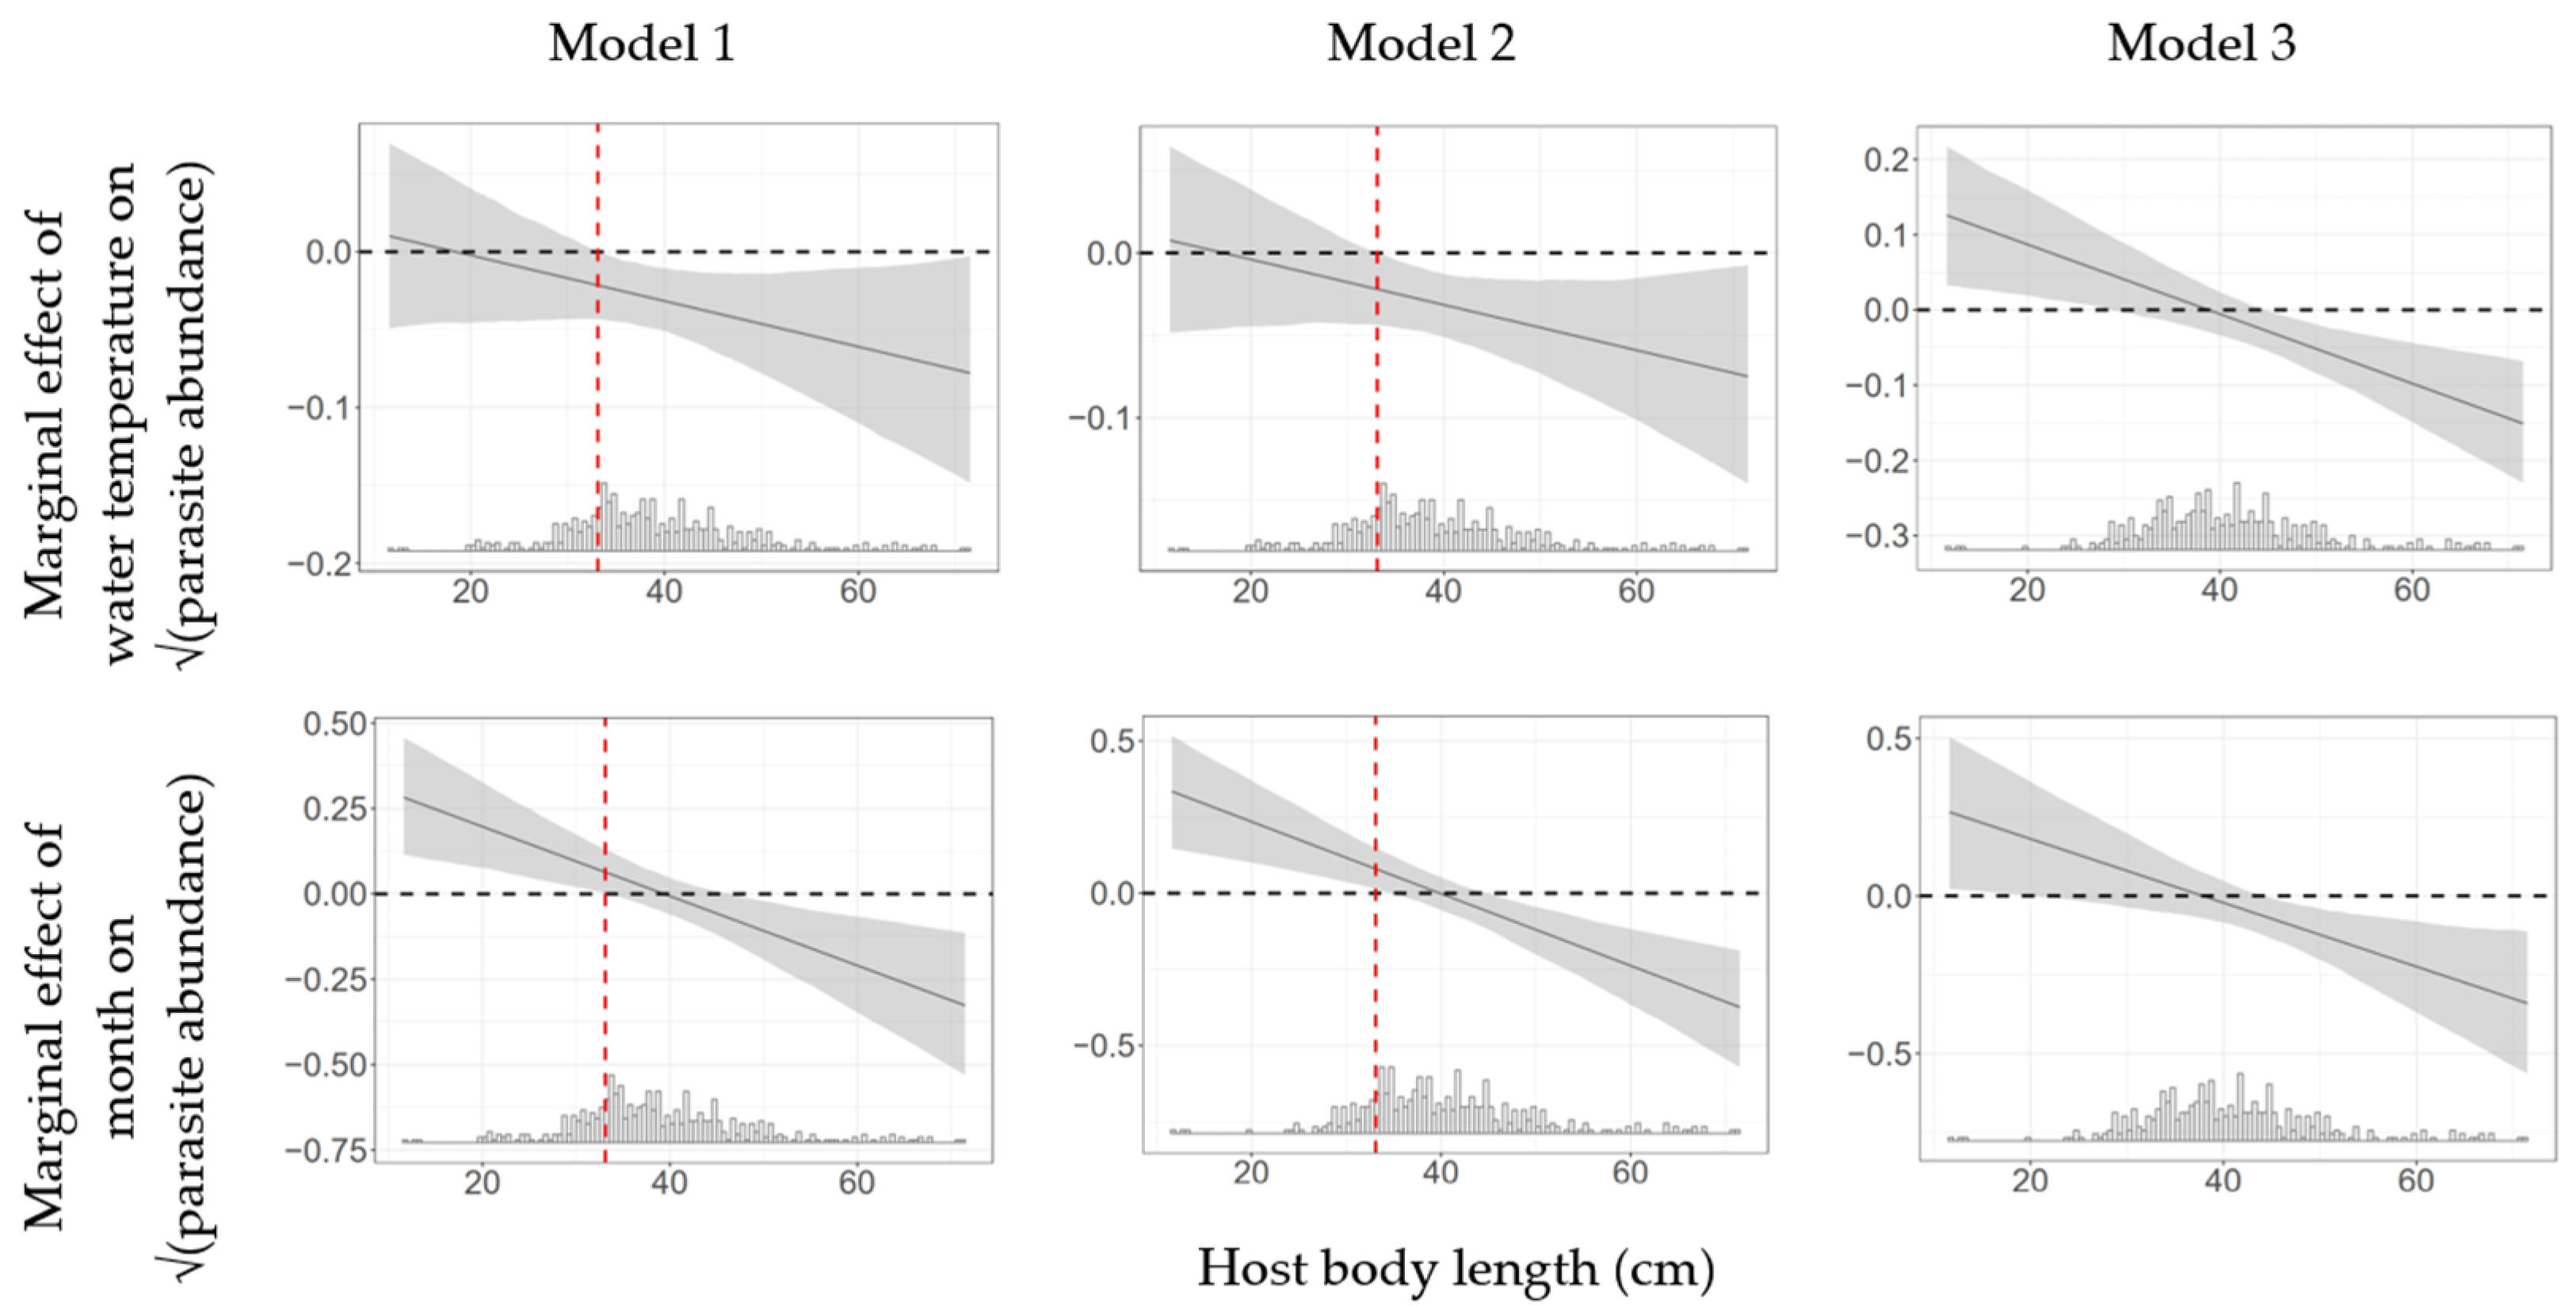
Model summaries are reported in Table 1, and the corresponding marginal effect patterns are shown in Figure 1.
In Model 1 (full dataset), months and the months × body length interaction were statistically significant, indicating pronounced size-dependent seasonality: the association between parasite abundance and the calendar month changes with host body size. Body length also showed a positive, statistically significant main effect, consistent with higher parasite abundance (on the transformed scale) in larger fish, all else equal.
By contrast, neither temperature (p = 0.56) nor temperature × body length (p = 0.19) reached statistical significance in the coefficient table. Nevertheless, the marginal effect displayed in Figure 1 suggests that the conditional effect of temperature becomes distinguishable from zero for fish measuring approximately 34–71.5 cm, and that this effect strengthens with increasing body length. The accompanying histogram further shows that about 74% of observations exceed 34 cm, indicating that this temperature-sensitive size range is well represented in the dataset rather than confined to a sparsely sampled tail.
Model 2, fitted to a subset approximately 15% smaller than the original dataset, also supported the same core seasonal pattern: months × body length remained statistically significant. In addition, the temperature × body length interaction became significant, while the main effect of temperature remained non-significant (p = 0.17). Marginal effect plots were qualitatively consistent with Model 1, again pointing to increasingly strong temperature effects as body length increases.
In Model 3 (21% reduced dataset), all main effects and interaction terms were statistically significant, including temperature, months, body length, temperature × body length, and months × body length. This model therefore indicates that both temperature and seasonality are related to parasite abundance, and that these relationships are strongly moderated by body length.
Across all three fits, the months × body length interaction was consistently negative (Table 1), implying that the month-related slope decreases as fish become larger. This aligns with Figure 1, which shows that smaller and larger fish exhibit opposite seasonal trajectories in parasite abundance. A similar pattern is suggested for temperature: the negative temperature × body length estimates in Models 2–3, together with the marginal effect curves in Figure 1, indicate that the temperature effect becomes progressively more negative with increasing host length, being weakest (or near zero) among smaller fish and strongest among larger individuals.

4. Discussion

The application of marginal effect plots to our empirical dataset highlights the limitations of conventional tabular interpretations of interaction models presented in Table 1. By distinguishing the focal effect of interest from the modifying variable, we detected context-dependent patterns that standard coefficients failed to capture fully. Specifically, our findings suggest that the effect of water temperature on parasite abundance is strongly driven by body length. We illustrate how analyzing interaction effects with a continuous moderating variable, beyond simple p-values, clarifies the interpretation of multiplicative regression models.
Previous research has shown that interaction coefficients estimated in regression analyses frequently possess limited informational content [7,16,22]. Regression interaction coefficients are commonly used to test whether the effect of an explanatory variable on an outcome depends on the value of a moderating variable. Simulation studies show that, in some cases where the interaction coefficient is statistically significant, the dependence often manifests only for specific values of the moderator, potentially leading to overstated conclusions about interaction effects. In contrast, moderation effects may be understated when the interaction term is statistically non-significant but marginal effects remain significant for a small, though non-trivial, fraction of observations [7,8].
Constructing marginal effect plots to visualize and interpret main effects and moderation helps examine the relationship between the independent and dependent variables at different values of the moderator [6,7,8].
Our analysis illustrates this issue perfectly. While the tabular results for the interaction between water temperature and body length were inconsistent across models (non-significant in Model 1, significant in Models 2 and 3), the visual inspection of marginal effects revealed a robust and biologically consistent pattern. The plots clarified that water temperature exerts a strong negative effect on parasite abundance, but this effect is strictly conditional: it is statistically detectable only for larger fish. Crucially, the confidence intervals indicate that this “temperature effect” is significant for hosts larger than 34 cm. Importantly, this size threshold (above 34 cm) is not just a statistical artifact—it likely corresponds to a biological transition in the introduced population. In the Azov–Black Sea region of introduction, so-iuy mullet mature markedly earlier (males at age 2+, females at 3+), and the culmination of linear growth is closely linked to the attainment of sexual maturity [23]. Thus, fish above ~34 cm are more likely to be at/after the maturation-related shift in energy allocation, physiology (including immune and endocrine status), and behavior/ecology (e.g., habitat use, feeding, movements), all of which can reshape parasite acquisition and persistence and, critically, make parasite dynamics more sensitive to temperature-dependent processes. This finding is substantively relevant because, as shown in the histograms, approximately 74% of the observed fish fall into this size range. Relying solely on the non-significant interaction coefficient in Model 1 would have led to the erroneous conclusion that temperature plays no role, thereby overlooking a relationship that affects nearly three-quarters of the population.
Our results refine the patterns reported by Shvydka et al. [9] by showing that the effect of temperature on monogenean abundance is size-contingent. In our interaction framework, the negative temperature × body length term indicates that warming is associated with lower parasite abundance, mainly in larger fish. This provides a plausible explanation for the mechanical “flushing effect”: in warmer water, the heightened physiological and swimming activity of mature fish increases gill ventilation rates, creating hydro-mechanical pressure that physically impedes parasite attachment. Crucially, this mechanism appears to be size-dependent. All else being equal, smaller individuals possess a significantly smaller gill surface area, but their locomotor activity and ventilation volume are likely insufficient to generate a flushing effect strong enough to effectively dislodge monogeneans. Thus, the dramatic temperature-driven shift in parasite abundance is observed only in larger individuals, who possess both the “resource” (large gills) and the mechanical capacity to clear parasites through high-intensity activity.
This interpretation is consistent with long-term evidence showing that temperature may appear to have little or no population-level effect when evaluated primarily as an averaged main effect. In a 32-year time series of Salmincola edwardsii (Olsson, 1869) on Arctic charr, Henriksen et al. [24] concluded that host body size was the dominant driver, while water temperature had negligible effects on parasite dynamics. However, their population-level analyses modeled temperature primarily as a year-level main effect (with optional lags) on annual mean abundance and transmission proxies, and the paper does not report an explicit evaluation of temperature × body length interactions via conditional predictions or marginal-effect diagnostics [24]. If the accurate thermal response is size-contingent, such an approach can mask temperature effects by pooling across the size distribution; thus, an apparent “no temperature effect” may partly reflect how conditional effects were summarized and visualized, rather than evidence that temperature cannot matter for particular host-size classes.
From a host’s perspective, individuals of different body sizes differ in gill surface area, ventilation hydrodynamics, and immune resistance [18]. In our system, the interaction between temperature and body length is the result of a synergistic process. During the warmer spawning season, the heightened activity and more robust immune response of mature fish override the risks associated with their aggregation in schools. The mechanical flushing effect effectively clears parasites, even at high host density. Conversely, in winter, a “perfect storm” for L. llewellyni accumulation is created on mature fish. When the flushing effect is absent due to low activity, the combination of increased resource availability (large gill surface area), the high host density resulting from winter schooling behavior [25], the inherent suppression of the ectotherm immune response at low temperatures [26], and reproductive trade-offs, where energy is diverted from mucosal immunity to gonad development [27], leads to significant parasite accumulation. For smaller fish, these dynamics are less pronounced because they lack the extreme seasonal shifts in both “space” (gill area) and “power” (ventilation force). Taken together, these lines of evidence support our interpretation that the temperature–abundance relationship is modulated by host ontogeny, a conclusion that is only resolved by explicitly evaluating conditional effects.

5. Conclusions

Visualizing interaction effects is essential for accurately interpreting regression models. Our results illustrate that relying solely on interaction coefficients can mask significant biological patterns, such as the size-dependent effect of temperature on parasite abundance found in our study. To avoid such pitfalls, we advocate the routine use of marginal effect plots to examine how the independent variable’s effect on the outcome varies across the range of the moderator. Adding the histogram of the moderating variable enables readers to better assess the substantive relevance of the findings. This approach allows for robust validation of model predictions across the relevant ranges of ecological data.

Author Contributions

Conceptualization, S.S. and V.S.; methodology, S.S.; validation, I.T. and M.K.; formal analysis, S.S.; investigation, V.S.; data curation, I.T.; writing—original draft preparation, S.S. and V.S.; writing—review and editing, I.T. and M.K.; visualization, S.S.; supervision, V.S.; project administration, M.K.; funding acquisition, S.S. and V.S. All authors have read and agreed to the published version of the manuscript.

Funding

S.S. is funded by the Ministry of Education, Research, Development, and Youth of the Slovak Republic (bilateral scholarship based on bilateral agreement between the ministries of the Slovak Republic and Ukraine, letter of award No. 2025/10152:5-A9161). V.S. is funded by the Seal of Excellence program of the Slovak Academy of Sciences (Project No. SoE/2025/61/MSCA4Uk), and by the International Visegrád Scholarship (No. 52510298). M.K. is supported by the grants VEGA 1/0036/23 and VEGA 2/0128/24.

Institutional Review Board Statement

Not applicable.

Informed Consent Statement

Not applicable.

Data Availability Statement

Data is available in Mendeley Data (https://data.mendeley.com/ (accessed on 1 September 2025)), https://doi.org/10.17632/4g45j835vw.1.

Conflicts of Interest

The authors declare no conflicts of interest.

References

  1. Muller, D.; Judd, C.M.; Yzerbyt, V.Y. When moderation is mediated and mediation is moderated. J. Personal. Soc. Psychol. 2005, 89, 852–863. [Google Scholar] [CrossRef] [Scilit]
  2. Brook, B.W.; Sodhi, N.S.; Bradshaw, C.J.A. Synergies among extinction drivers under global change. Trends Ecol. Evol. 2008, 23, 453–460. [Google Scholar] [CrossRef] [Scilit]
  3. Tomamichel, M.M.; Lowe, K.I.; Arnold, K.M.H.; Frischer, M.E.; Irwin, B.J.; Osenberg, C.W.; Hall, R.J.; Byers, J.E. Warmer Is Deadlier: A Meta-Analysis Reveals Increasing Temperatures Accentuate Disease Effects on Fisheries Hosts. Ecol. Lett. 2025, 28, e70156. [Google Scholar] [CrossRef] [Scilit]
  4. Duncan, R.P.; Kefford, B.J. Interactions in statistical models: Three things to know. Methods Ecol. Evol. 2021, 12, 2287–2297. [Google Scholar] [CrossRef] [Scilit]
  5. Guitard, J.L.J.; Chrétien, E.; Bonville, J.D.; Roche, D.G.; Boisclair, D.; Binning, S.A. Increased parasite load is associated with reduced metabolic rates and escape responsiveness in pumpkinseed sunfish. J. Exp. Biol. 2022, 225, jeb243160. [Google Scholar] [CrossRef] [Scilit] [PubMed]
  6. Spake, R.; Bowler, D.E.; Callaghan, C.T.; Blowes, S.A.; Doncaster, C.P.; Antão, L.H.; Nakagawa, S.; McElreath, R.; Chase, J.M. Understanding’ it depends’ in ecology: A guide to hypothesising, visualising and interpreting statistical interactions. Biol. Rev. 2023, 98, 983–1002. [Google Scholar] [CrossRef] [Scilit] [PubMed]
  7. Kingsley, A.F.; Noordewier, T.G.; Vanden Bergh, R.G. Overstating and understating interaction results in international business research. J. World Bus. 2017, 52, 286–295. [Google Scholar] [CrossRef] [Scilit]
  8. Busenbark, J.R.; Graffin, S.D.; Campbell, R.J.; Lee, E.Y. A marginal effects approach to interpreting main effects and moderation. Organ. Res. Methods 2022, 25, 147–169. [Google Scholar] [CrossRef] [Scilit]
  9. Shvydka, S.; Cadarso-Suárez, C.; Ballová, D.; Sarabeev, V. Patterns of monogenean abundance in native and invasive populations of Planiliza haematocheila (Teleostei: Mugilidae): Interactions between climate and host defence mechanisms explain parasite release. Int. J. Parasitol. 2020, 50, 1023–1031. [Google Scholar] [CrossRef] [Scilit]
  10. Lahnsteiner, F. Morphometric and Enzymatic Changes in Gills of Rainbow Trout after Exposure to Elevated Temperature-Indications for Gill Remodeling. Animals 2024, 14, 919. [Google Scholar] [CrossRef] [Scilit]
  11. Ieno, E.; Zuur, A. A Beginner’s Guide to Data Exploration and Visualisation with R, 1st ed.; Highland Statistics Limited: Newburgh, UK, 2015; p. 175. [Google Scholar]
  12. Shaw, D.J.; Dobson, A.P. Patterns of macroparasite abundance and aggregation in wildlife populations: A quantitative review. Parasitology 1995, 111, S111–S133. [Google Scholar] [CrossRef] [Scilit] [PubMed]
  13. Rózsa, L.; Reiczigel, J.; Majoros, G. Quantifying parasites in samples of hosts. J. Parasitol. 2000, 86, 228–232. [Google Scholar] [CrossRef] [Scilit]
  14. Clarke, K.R.; Gorley, R.N.; Somerfield, P.J.; Warwick, R.M. Change in Marine Communities: An Approach to Statistical Analysis and Interpretation, 3rd ed.; Primer-E Ltd.: Auckland, New Zealand; Plymouth Marine Laboratory: Plymouth, UK, 2014; p. 262. [Google Scholar]
  15. Jacobson, K.C.; Baldwin, R.; Reese, D.C. Parasite communities indicate effects of cross-shelf distributions, but not mesoscale oceanographic features on northern California Current mid-trophic food web. Mar. Ecol. Prog. 2012, 454, 19–36. Available online: http://www.jstor.org/stable/24875987 (accessed on 8 September 2025). [CrossRef] [Scilit]
  16. Brambor, T.; Clark, W.R.; Golder, M. Understanding interaction models: Improving empirical analyses. Political Anal. 2006, 14, 63–82. [Google Scholar] [CrossRef] [Scilit]
  17. Venables, W.; Ripley, B. Modern Applied Statistics with S, 4th ed.; Springer: New York, NY, USA, 2002; pp. 183–210. [Google Scholar] [CrossRef] [Scilit]
  18. Wunderlich, A.; Simioni, W.; Zica, É.; Siqueira, T. Experimental evidence that host choice by parasites is age-dependent in a fish-monogenean system. Parasitol. Res. 2022, 121, 115–126. [Google Scholar] [CrossRef] [Scilit] [PubMed]
  19. Armstrong, R.A. When to use the Bonferroni correction. Ophthalmic Physiol. Optic. 2014, 34, 502–508. [Google Scholar] [CrossRef] [Scilit]
  20. R Core Team. R: A Language and Environment for Statistical Computing; R Foundation for Statistical Computing: Vienna, Austria, 2025; Available online: http://www.R-project.org/ (accessed on 1 September 2025).
  21. Solt, F.; Hu, Y. Plot the Effects of Variables in Interaction Terms. 2021. Available online: https://cran.r-project.org/web/packages/interplot/vignettes/interplot-vignette.html (accessed on 1 September 2025).
  22. Frasier, T.R. A note on the use of multiple linear regression in molecular ecology. Mol. Ecol. Resour. 2016, 16, 382–387. [Google Scholar] [CrossRef] [Scilit]
  23. Царин, С.А.; Зуев, Г.В.; Бoлтачев, А.Р. Рoст пиленгаса Mugil so–iuy Basilewsky, 1855 (Mugilidae, Pisces). Экoлoгия мoря 1999, 48, 68–73. [Google Scholar]
  24. Henriksen, E.H.; Frainer, A.; Poulin, R.; Knudsen, R.; Amundsen, P. Ectoparasites population dynamics are affected by host body size but not host density or water temperature in a 32-year long time series. Oikos 2023, 2023, e09328. [Google Scholar] [CrossRef] [Scilit]
  25. Sabodash, V.M.; Semenenko, L.I. Ecologic–biological base of the acclimatization of far east mullet–pilengas (Mugil so–iuy) in the water basins of Ukraine. Vestn. Zool. 1998, 6, 53. Available online: http://mail.izan.kiev.ua/vz-pdf/suppl/Supplement%201998-06.pdf (accessed on 1 September 2025).
  26. Franke, A.; Beemelmanns, A.; Miest, J.J. Are fish immunocompetent enough to face climate change? Biol. Lett. 2024, 20, 20230346. [Google Scholar] [CrossRef] [Scilit] [PubMed]
  27. Atroch, F.; Rangel, L.F.; Ayra-Pardo, C.; Santos, M.J. Climate Change, Fish and Shellfish, and Parasite Dynamics: A Comprehensive Review. J. Mar. Sci. Eng. 2026, 14, 167. [Google Scholar] [CrossRef] [Scilit]
Figure 1. Marginal effects of water temperature (top) and month (bottom) on √(parasite abundance) across host body length (cm). Solid lines show the estimated marginal effect, shaded areas indicate 95% confidence bands, and histograms show the distribution of host body length. The dashed red lines denote the value corresponding to a host body length of 34 cm.
Engproc 124 00051 g001
Table 1. Summary of GLM regression analysis; SE—standard error.
Model 1Model 2Model 3
CoefficientsEstimateSEEstimateSEEstimateSE
Intercept−4.37 **1.55−5.40 ***1.56−7.29 ***2.02
temperature0.020.040.070.050.18 **0.06
months0.40 **0.130.47 ***0.140.39 *0.16
body length0.14 ***0.040.17 ***0.040.20 ***0.04
temperature: body length−0.0010.001−0.003 *0.001−0.005 **0.001
months: body length−0.01 **0.003−0.01 ***0.003−0.01 **0.004
p-values in parentheses. *** p < 0.001; ** p < 0.01; * p < 0.05.
Disclaimer/Publisher’s Note: The statements, opinions and data contained in all publications are solely those of the individual author(s) and contributor(s) and not of MDPI and/or the editor(s). MDPI and/or the editor(s) disclaim responsibility for any injury to people or property resulting from any ideas, methods, instructions or products referred to in the content.