Proceeding Paper

Systematic Analysis of Distribution Shifts in Cross-Subject Glucose Prediction Using Wearable Physiological Data †

1
College of Arts and Science, Ohio State University, Columbus, OH 43210, USA
2
Department of Mechanical and Electrical Systems Engineering, Kyoto University of Advanced Science, Kyoto 615-0096, Japan
*
Author to whom correspondence should be addressed.
Presented at the 12th International Electronic Conference on Sensors and Applications, 12–14 November 2025; Available online: https://sciforum.net/event/ECSA-12.
Eng. Proc. 2025, 118(1), 88; https://doi.org/10.3390/ECSA-12-26583
Published: 7 November 2025

Abstract

Wearable sensors offer a promising platform for non-invasive glucose monitoring by indirectly predicting glucose levels from physiological signals. However, machine learning models trained on such data often suffer degraded performance when applied to new individuals due to distribution shifts in physiological patterns. This study investigates how inter-subject distribution shifts impact the performance of glucose prediction models trained on wearable data. We utilized the BIGIDEAs dataset, which includes simultaneous recordings of glucose levels and multimodal physiological signals. Personalized XGBoost regression models were trained on data from 10 subjects and evaluated on 5 held-out subjects to assess cross-subject generalization. Distribution shifts in glucose profiles between training and test subjects were quantified using the Anderson–Darling (AD) statistic. The results showed that models trained on one individual performed poorly when tested on others. Repeated measures correlation analysis revealed significant positive correlations between the AD statistic and model performance metrics, including RMSE, NRMSE, and MARD. Our findings highlight the challenge of inter-individual generalization and the need for distribution-aware models. We propose personalized calibration and subject phenotyping as future directions to enhance model generalizability.

1. Introduction

Maintaining blood glucose within a narrow range is crucial for metabolic health. Persistently high glucose levels can damage blood vessels and nerves, increasing the risk of chronic conditions such as cardiovascular disease, stroke, neuropathy, and nephropathy [1]. In recent years, self-tracking of blood glucose has gained traction in both diabetic and non-diabetic populations, facilitated by advances in sensing technologies [2].
The traditional approach to self-monitoring blood glucose relies on finger-prick testing, where a lancet—a small needle—is used to obtain a blood sample for analysis. The sample is then placed into a glucose meter for analysis. More recently, continuous glucose monitoring (CGM) has gained popularity for its ability to provide regular readings and track long-term trends. CGM measures glucose levels in interstitial fluid using a small sensor inserted under the skin. Both methods are invasive, as they require penetration of the skin to obtain glucose readings [3].
There has been a growing interest in utilizing continuous wearable data such as heart rate, electrodermal activity, and skin temperature for non-invasive glucose prediction [4,5,6]. Such metrics can be collected with wearable devices like fitness trackers and smartwatches. This approach is advantageous because wearable devices are more affordable, accessible, and non-invasive. They also enable continuous, long-term monitoring of physiological changes in everyday environments.
A standing challenge in non-invasive glucose prediction is preventing data leakage, which occurs when training and testing sets share data from the same individuals [7]. This can lead to an overly optimistic model performance that does not generalize well when applied to unseen individuals, particularly when there are significant distribution shifts in glucose profiles. As such, these shifts raise a challenge in creating a global model that generalizes effectively to new individuals.
In this study, we investigate the impact of distribution shifts in glucose profiles on the generalizability of glucose prediction models trained on wearable physiological data. To avoid data leakage, we maintain a clear separation between training and testing subjects. Individual glucose prediction models are trained on 10 subjects and tested on 5 held-out test subjects. For each model, we quantify the distribution shift between the glucose profiles of the training and testing groups and analyze how these shifts impact model performance.

2. Materials and Methods

2.1. Dataset

We used the BIGIDEAs Lab dataset [8] with simultaneous glucose and wearable data from 16 participants (HbA1c: 5.2–6.4) collected over 8–10 days. Glucose was recorded every 5 min using Dexcom G6 CGMs (San Diego, CA, USA), and continuous wearable data were captured using Empatica E4 wristbands. Wearable data included blood volume pulse (BVP) sampled at 64 Hz, tri-axial acceleration (tri_ACC) sampled at 32 Hz, electrodermal activity (EDA), and skin temperature (sTemp) sampled at 4 Hz.

2.2. Pre-Processing and Feature Engineering

A unified data pre-processing pipeline was applied independently for each participant. The pipeline proceeded as follows: First, the vector magnitude of acceleration (ACC) was computed from the tri_ACC data. Next, BVP, EDA, and ACC signals were filtered to remove noise and baseline drift. All signals were then segmented into 5 min epochs aligned with glucose timestamps. Epochs with over 50% missing data in any signal were discarded, and missing values were imputed. Following these pre-processing steps, we discarded the data from Subject 15, as the number of cleaned data epochs was deemed insufficient compared to other subjects.
A total of 102 features were extracted: 22 statistical features from sTemp and ACC, 42 features from tonic and phasic EDA components, and 13 HRV-related metrics from BVP. Minutes from midnight and its sine and cosine transforms were derived from timestamps to account for the circadian rhythm. Features with many missing values or low variance were removed.

2.3. Model Training and Testing

Ten of the fifteen subjects were allocated to the training set, with the remaining five reserved for testing. Subjects were assigned based on demographic characteristics and HbA1c levels to ensure balance between the two groups (Table 1).
Regression models were trained independently on each of the training subjects. The eXtreme Gradient Boosting (XGBoost) algorithm was chosen as the regressor, since it consistently outperforms other shallow learning and deep learning methods on small tabular datasets [9]. Each model was trained using a pipeline that included an imputer, followed by a scaler, and the XGBoost regressor. Missing values were imputed using the median, and the features were standardized with a standard scaler to have zero mean and unit variance. Five-fold cross-validation with grid search was used to tune hyperparameters.
The resulting models were evaluated on all five held-out test subjects to assess cross-subject generalization. This ensured that there was strict avoidance of data leakage between the training and testing sets.

2.4. Cross-Subject Distribution Shift

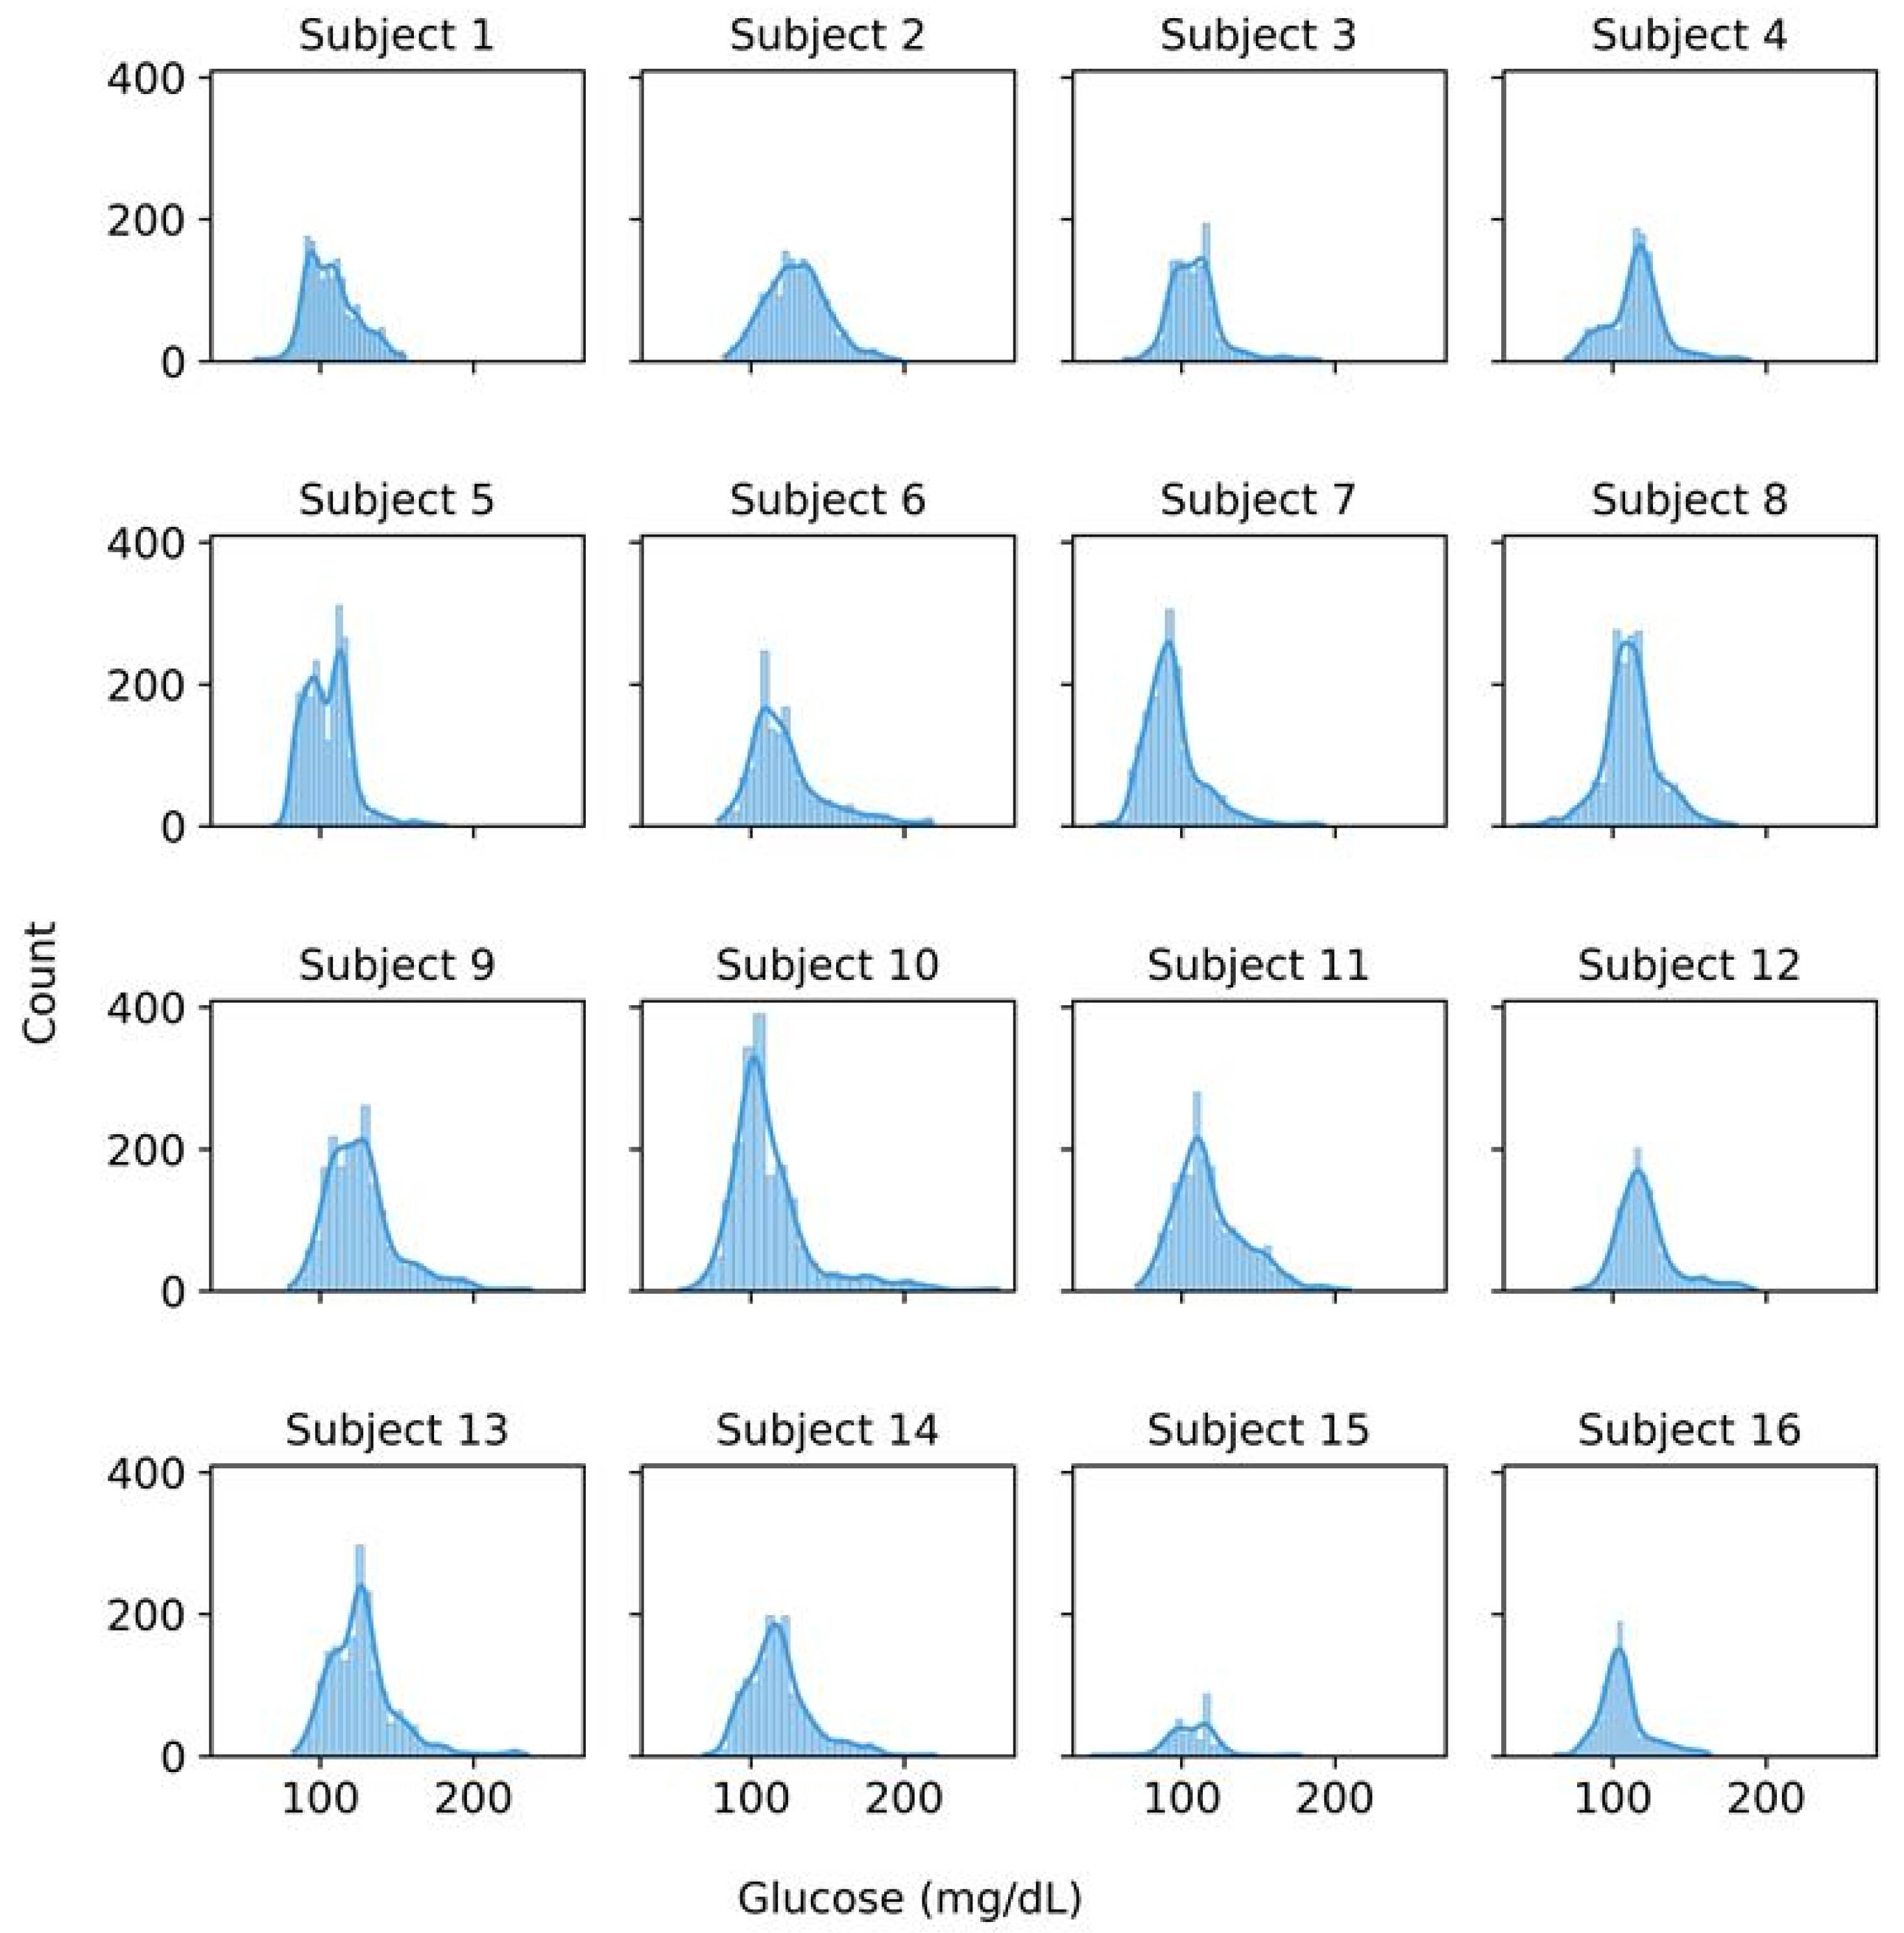
The glucose distribution profiles exhibited significant inter-subject variability, as illustrated in the histograms in Figure 1. To quantify the distributional differences, we used the 2-sample Anderson–Darling (AD) statistic [10]. The AD test is a non-parametric method used to assess whether two samples originate from the same underlying population. It does not require any prior knowledge about the population distribution, making it well-suited for this dataset, where the underlying glucose distributions are complex and differ across individuals. The AD statistic and the p-value were computed for all pairs of training and testing subjects.

2.5. Model Evaluation Metrics

Model performance was evaluated using root mean squared error (RMSE), normalized root mean squared error (NRMSE), and mean absolute relative difference (MARD). RMSE is a standard regression metric that measures the overall prediction error, while NRMSE normalizes this error to facilitate comparison across datasets of different scales [11]. MARD is a commonly used metric in glucose monitoring, which captures the relative difference between predicted and reference glucose values [12]. For all three metrics, lower values indicate better performance.
RMSE = i = 1 N ( y i y i ^ ) 2   N
NRMSE = RMSE   σ y  
MARD = 1 N i = 1 N y i y i ^   y i ^ × 100 %
where y i is the reference glucose level, y i ^ is the predicted glucose level, N is the total number of epochs, and σ y is the standard deviation of the reference glucose values.

3. Results

Table 2 summarizes the average performance metrics of the trained models tested on each of the five test subjects. Among the test subjects, the RMSE value ranged from 20.8 to 30.1 mg/dL. Subject 3 had the lowest, at 22.7 ± 3.2 mg/dL, while Subject 9 had the highest. For NRMSE, values ranged from 1.17 ± 0.15 (Subject 6) to 1.51 ± 0.26 (Subject 16). The best performance for MARD was 16.4 ± 2.4% (Subject 9), while the worst was 18.4 ± 4.6% (Subject 16), giving a range of 16.4–18.4% across all subjects.
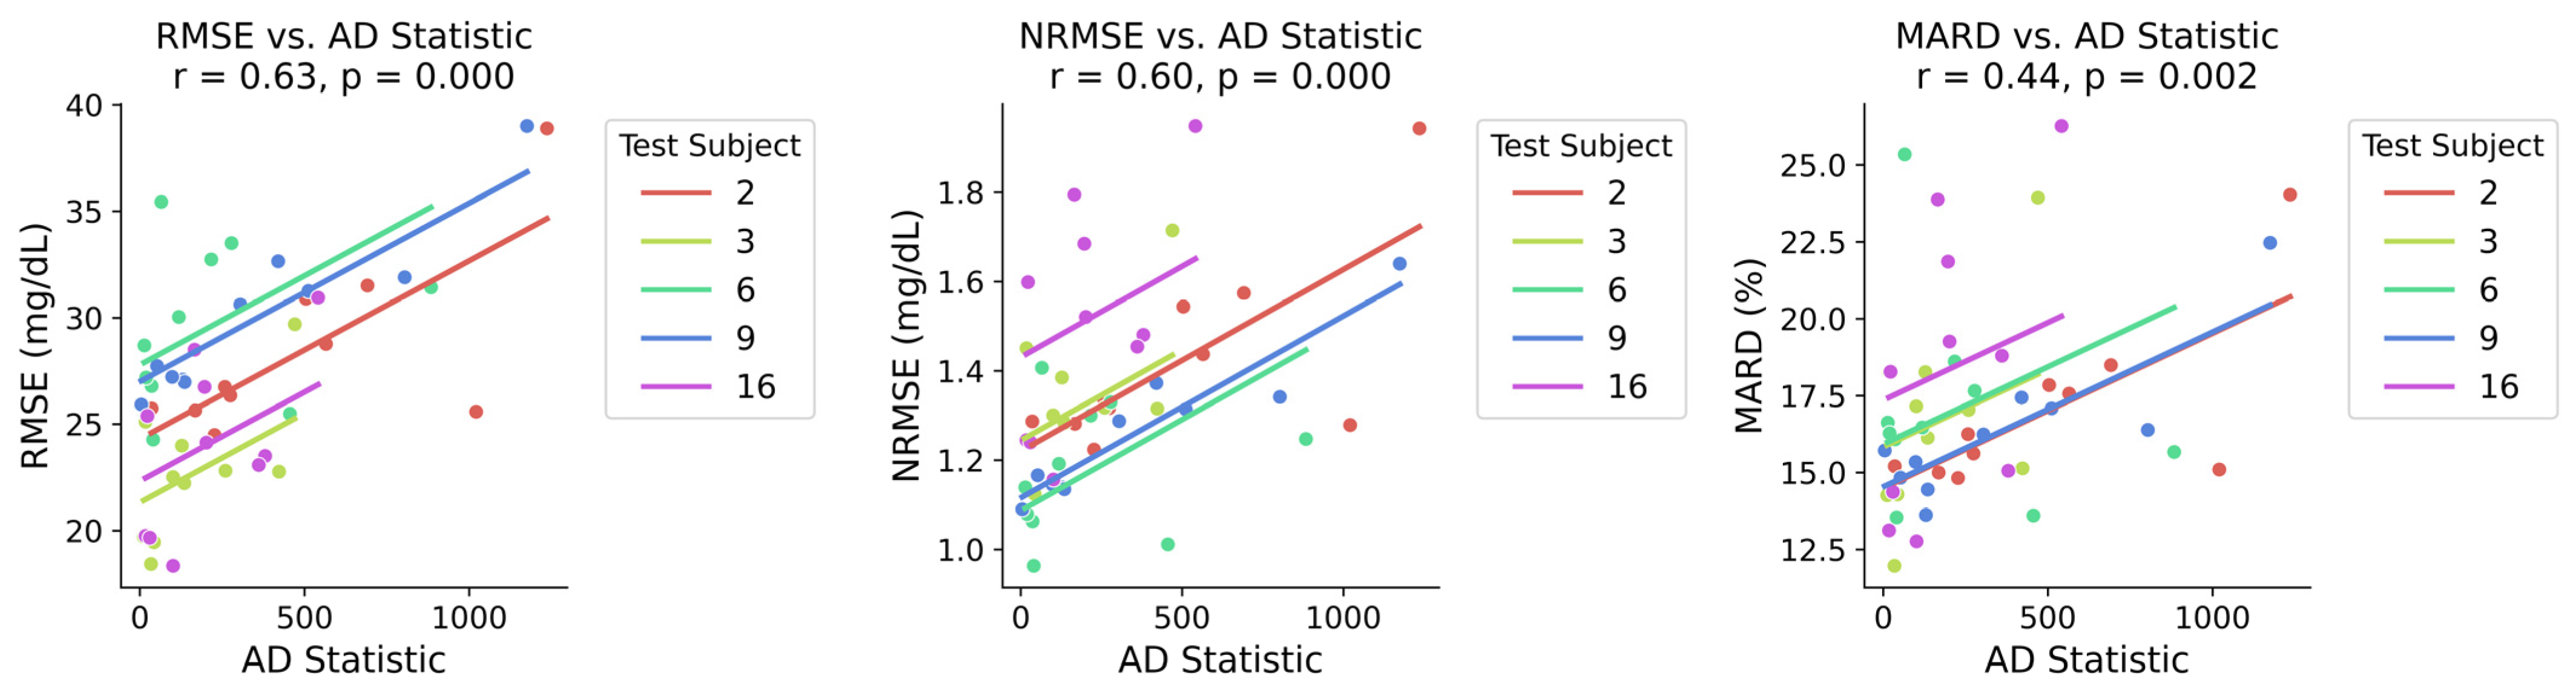
Since data from each test subject was used to evaluate multiple training models, the resulting observations were not independent. As such, the repeated measures correlation (rm_corr) [13] was computed to help study possible correlations between the distribution shift and performance metrics. The rm_corr analysis revealed a significant positive correlation between the AD statistic and each of the performance metrics (Table 3). The correlations were found to be 0.60, 0.55, and 0.42 for RMSE, NMRSE, and MARD, respectively. All 3 repeated measure correlations yielded statistically significant p-values (p ≤ 0.01). RMSE and NMRSE in particular saw the most significant correlations, with p = 0.000 for both.
The repeated measure correlation results were also visualized as scatterplots, as shown in Figure 2. Within each plot, the AD statistic is represented by the x-axis, and the values for the respective metrics are represented by the y-axis. Each point corresponds to a model trained on a specific subject and tested on another. Colors were used to differentiate between different test subjects. The colored lines through the points represent linear trends for each test subject. The plots, as the tables suggested, show significant linear correlations. The plots also show major variability between subjects, with some test subjects having points tightly clustered around the linear trend line, and others having points spread out across a larger range of values.

4. Discussion

4.1. Principal Findings

The positive correlation between the Anderson–Darling statistic and the model error metrics suggests that variability in glucose distribution across individuals is a key factor driving poor model performance. This is especially evident in the strong repeated measures correlation values for RMSE and NRMSE (both rm_corr ≥ 0.60, p = 0.000).

4.2. Comparison with Related Work

Our findings are consistent with prior studies in other physiological monitoring domains. Similar challenges have been reported for wearable-based sleep stage classification, where feature distribution shifts between training and test data were shown to correlate with decreased model accuracy [14]. This suggests that our observations reflect a broader pattern affecting machine learning applications in personalized health monitoring. Additionally, the inter-subject variability observed in our study aligns with the challenges addressed in meta-learning, where the goal is to train models that adapt rapidly to new tasks with limited data [15].

4.3. Limitations

This study comes with several limitations. First, our analysis focused solely on distribution shifts in the labels (glucose values) without considering other types of distribution shifts, such as covariate or concept shifts, which can also affect model performance [16]. Second, the Anderson–Darling test used to quantify distribution shifts only detects overall differences and does not specify the nature or source of the shift. Third, the median imputation of missing values in the model training pipeline may have introduced bias, particularly as timestamp-derived features capturing daily glucose rhythms could be smoothed, reducing the models’ ability to learn temporal patterns.

4.4. Future Directions

For future exploration, we recommend using explanation shift analysis to monitor how model behavior changes as new subject data is introduced [17]. Investigating domain-adaptive ensemble learning methods also offers a promising approach to improve performance under distribution shifts [18]. Personalized calibration combined with subject phenotyping may improve generalizability by tailoring models to individual physiological profiles.

4.5. Conclusions

Overall, our findings highlight the challenge of inter-individual generalization when strictly avoiding data leakage during the modeling process. Tackling this issue will likely require better modeling strategies that can adapt to distribution shifts, as well as a deeper understanding of which individual features (e.g., lifestyle, glucose variability, circadian rhythms) drive these differences.

Author Contributions

Conceptualization, T.K.; methodology, A.B. (Andrew Beten), L.L., A.B. (Ayaan Baig); validation, A.B. (Andrew Beten), L.L., A.B. (Ayaan Baig); formal analysis, A.B. (Andrew Beten), L.L.; writing—original draft preparation, A.B. (Ayaan Baig), A.B. (Andrew Beten), L.L., and T.K.; writing—review and editing, T.K., A.B. (Ayaan Baig), A.B. (Andrew Beten), L.L.; visualization, A.B. (Andrew Beten), L.L., T.K.; supervision, T.K. All authors have read and agreed to the published version of the manuscript.

Funding

This research was supported by the KUAS Advanced Research Grant.

Institutional Review Board Statement

Not applicable.

Informed Consent Statement

Not applicable.

Data Availability Statement

The dataset used in this work is publicly accessible at https://physionet.org/content/big-ideas-glycemic-wearable/1.1.2/ (accessed on 12 August 2025).

Acknowledgments

The authors thank Zilu Liang for her supervision and valuable guidance throughout this work.

Conflicts of Interest

The authors declare no conflicts of interest.

References

  1. Sun, B.; Luo, Z.; Zhou, J. Comprehensive Elaboration of Glycemic Variability in Diabetic Macrovascular and Microvascular Complications. Cardiovasc. Diabetol. 2021, 20, 9. [Google Scholar] [CrossRef] [Scilit] [PubMed]
  2. Klonoff, D.C.; Nguyen, K.T.; Xu, N.Y.; Gutierrez, A.; Espinoza, J.C.; Vidmar, A.P. Use of continuous glucose monitors by people without diabetes: An idea whose time has come? J. Diabetes Sci. Technol. 2023, 17, 1686–1697. [Google Scholar] [CrossRef] [Scilit] [PubMed]
  3. Mansour, M.; Darweesh, M.S.; Soltan, A. Wearable devices for glucose monitoring: A review of state-of-the-art technologies and emerging trends. Alex. Eng. J. 2024, 89, 224–243. [Google Scholar] [CrossRef] [Scilit]
  4. Bent, B.; Cho, P.J.; Henriquez, M.; Wittmann, A.; Thacker, C.; Feinglos, M.; Crowley, M.J.; Dunn, J.P. Engineering digital biomarkers of interstitial glucose from noninvasive smartwatches. npj Digit. Med. 2021, 4, 89. [Google Scholar] [CrossRef] [Scilit] [PubMed]
  5. Ali, H.; Niazi, I.K.; White, D.; Akhter, M.N.; Madanian, S. Comparison of machine learning models for predicting interstitial glucose using smart watch and food log. Electronics 2024, 13, 3192. [Google Scholar] [CrossRef] [Scilit]
  6. Huang, X.; Schmelter, F.; Uhlig, A.; Irshad, M.T.; Nisar, M.A.; Piet, A.; Grzegorzek, M. Comparison of feature learning methods for non-invasive interstitial glucose prediction using wearable sensors in healthy cohorts: A pilot study. Intell. Med. 2024, 4, 226–238. [Google Scholar] [CrossRef] [Scilit]
  7. Kapoor, S.; Narayanan, A. Leakage and the reproducibility crisis in machine-learning-based science. Patterns 2023, 4, 100779. [Google Scholar] [CrossRef] [Scilit] [PubMed]
  8. Cho, P.; Kim, J.; Bent, B.; Dunn, J. BIG IDEAs Lab glycemic variability and wearable device data. PhysioNet 2023, 101, e215–e220. [Google Scholar] [CrossRef]
  9. Shwartz-Ziv, R.; Armon, A. Tabular data: Deep learning is not all you need. Inf. Fus. 2022, 81, 84–90. [Google Scholar] [CrossRef] [Scilit]
  10. Engmann, S.; Cousineau, D. Comparing distributions: The two-sample Anderson-Darling test as an alternative to the Kolmogorov-Smirnov test. J. Appl. Quant. Methods 2011, 6, 1–17. [Google Scholar]
  11. Jacobs, P.G.; Herrero, P.; Facchinetti, A.; Vehi, J.; Kovatchev, B.; Breton, M.D.; Mosquera-Lopez, C. Artificial intelligence and machine learning for improving glycemic control in diabetes: Best practices, pitfalls, and opportunities. IEEE Rev. Biomed. Eng. 2023, 17, 19–41. [Google Scholar] [CrossRef] [Scilit] [PubMed]
  12. Heinemann, L.; Schoemaker, M.; Schmelzeisen-Redecker, G.; Hinzmann, R.; Kassab, A.; Freckmann, G.; Del Re, L. Benefits and limitations of MARD as a performance parameter for continuous glucose monitoring in the interstitial space. J. Diabetes Sci. Technol. 2020, 14, 135–150. [Google Scholar] [CrossRef] [Scilit] [PubMed]
  13. Bakdash, J.Z.; Marusich, L.R. Repeated measures correlation. Front. Psychol. 2017, 8, 456. [Google Scholar] [CrossRef] [Scilit] [PubMed]
  14. Sirithummarak, P.; Liang, Z. Investigating the effect of feature distribution shift on the performance of sleep stage classification with consumer sleep trackers. In Proceedings of the 2021 IEEE 10th Global Conference on Consumer Electronics (GCCE), Kyoto, Japan, 12–15 October 2021; pp. 242–243. [Google Scholar]
  15. Setlur, A.; Li, O.; Smith, V. Two sides of meta-learning evaluation: In vs. out of distribution. Adv. Neural Inf. Process. Syst. 2021, 34, 3770–3783. [Google Scholar]
  16. Cai, T.; Namkoong, H. Diagnosing model performance under distribution shift. arXiv 2023, arXiv:2303.02011. [Google Scholar] [CrossRef] [Scilit]
  17. Mougan, C.; Broelemann, K.; Masip, D.; Kasneci, G.; Thiropanis, T.; Staab, S. Explanation shift: How did the distribution shift impact the model? arXiv 2023, arXiv:2303.08081. [Google Scholar] [CrossRef] [Scilit]
  18. Zhou, K.; Yang, Y.; Qiao, Y.; Xiang, T. Domain adaptive ensemble learning. IEEE Trans. Image Process. 2021, 30, 8008–8018. [Google Scholar] [CrossRef] [Scilit] [PubMed]
Figure 1. Histograms illustrating the distribution of glucose profiles for each of the 16 subjects.
Engproc 118 00088 g001
Figure 2. Scatterplots of repeated measures correlation results.
Engproc 118 00088 g002
Table 1. Overview of Participant Demographics and Allocation to Training and Testing Sets.
Subject IDGenderHbA1cNo. of Epochs 1Group
1Female5.51796Training set
4Female6.41331
5Female5.72369
7Female5.31799
8Female5.61971
10Female6.01907
11Male6.02072
12Male5.61470
13Male5.71836
14Male5.51511
2Male5.61854Testing set
3Female5.91261
6Female5.81542
9Male6.12015
16Male5.51229
15Female5.5365Not Applicable
1 The number of epochs after applying the pre-processing pipeline.
Table 2. Average metrics of the ten models tested on the five held-out test subjects.
Test Subject IDRMSE (mg/dL)NRMSE (mg/dL)MARD (%)
228.5 ± 4.41.42 ± 0.22 17.0 ± 2.8
322.7 ± 3.21.31 ± 0.1916.6 ± 3.2
629.6 ± 3.71.17 ± 0.1517.0 ± 3.3
930.0 ± 4.01.26 ± 0.1716.4 ± 2.4
1624.0 ± 4.01.51 ± 0.2618.4 ± 4.6
Table 3. Repeated measures correlation results between the AD statistic and performance metrics.
AD_RMSEAD_NRMSEAD_MARD
rm_corr0.630.600.44
p-value0.0000.0000.002
Disclaimer/Publisher’s Note: The statements, opinions and data contained in all publications are solely those of the individual author(s) and contributor(s) and not of MDPI and/or the editor(s). MDPI and/or the editor(s) disclaim responsibility for any injury to people or property resulting from any ideas, methods, instructions or products referred to in the content.