
Proceeding Paper

Structure-Based Discovery of TEAD Protein Inhibitors Targeting the Hippo Pathway in Cancer: An Integrative Computational Study †
Department of Pharmaceutical Chemistry, Dr Rajendra Gode Institute of Pharmacy, University Mardi Road, Ghatkheda, Amravati 444602, Maharashtra, India
*
Authors to whom correspondence should be addressed.
Presented at the 29th International Electronic Conference on Synthetic Organic Chemistry, 14–28 November 2025; Available online: https://sciforum.net/event/ecsoc-29.
Chem. Proc. 2025, 18(1), 145; https://doi.org/10.3390/ecsoc-29-26882
Published: 13 November 2025

Abstract

The TEA domain (TEAD) transcription factors are important parts of the Hippo signaling cascade and are important therapeutic targets in cancer research because they help control cell growth, avoid apoptosis, and cause tumors to form. In this study, a structure-based virtual screening method was used to find new TEAD antagonists in the ChemDiv natural product database. Using the AutoDock platform for molecular docking, we ranked eight candidate ligands—16956, 726, 5271, 11768, 12384, 15598, 15641, and 3622—based on strong binding affinities, as shown by docking energies that ranged from −8.02 to −8.49 kcal/mol. Swiss ADME’s full in silico ADMET profile showed that all of the selected compounds had good pharmacokinetic properties and did not break Lipinski’s rule of five, which means they would be quite bioavailable when taken by mouth. Two lead candidates, 11768 and 15598, did not pass across the blood-brain barrier (BBB) and were not substrates for P-glycoprotein. This means that they had less exposure to the central nervous system and a lower chance of developing multidrug resistance. Later molecular dynamics (MD) simulations verified that the ligand TEAD complexes were stable in their shapes, and MMGBSA (Molecular Mechanics/Generalized Born Surface Area) free energy calculations indicated that they had high-affinity binding. Principal component analysis (PCA) and free energy landscape tests helped to explain even more the dynamic behavior and thermodynamic landscapes of the complexes. This integrated computational technique helped us find strong, drug-like TEAD inhibitors in a logical way. It also gave us a solid base for further preclinical testing and structural optimization in the creation of targeted anticancer drugs.

1. Introduction

The Hippo signaling pathway is an evolutionarily conserved kinase cascade that fundamentally regulates cellular growth, proliferation, apoptosis, and organ size. Its dysregulation is significantly associated with tumorigenesis in various malignancies, including hepatocellular carcinoma, mesothelioma, glioblastoma, and breast cancer. At the molecular level, the pathway works through a series of phosphorylation events that happen in a certain order. First, the upstream kinases MST1 and MST2 activate LATS1 and LATS2, which then phosphorylate and deactivate the transcriptional co-activators Yes-associated protein (YAP) and the transcriptional co-activator with PDZ-binding motif (TAZ) [1]. This keeps them in the cytoplasm and causes them to break down. Without Hippo signaling, unphosphorylated YAP/TAZ build up in the nucleus and attach to transcriptional enhancer activator domain (TEAD) proteins (TEAD1–TEAD4) [2]. This activates oncogenic transcriptional programs that control epithelial–mesenchymal transition, angiogenesis, survival signaling, and metabolic reprogramming [3,4,5].
TEAD is a very interesting target in precision oncology because the YAP/TAZ–TEAD complex plays a central role in promoting cell proliferation, stemness, and therapeutic resistance [6,7]. However, TEAD proteins have traditionally been deemed “undruggable” owing to their absence of enzymatic catalytic activity and relatively planar protein–protein interaction surfaces, which offer constrained prospects for high-affinity ligand binding [8]. The discovery of a palmitoylation pocket within TEAD, a hydrophobic cavity that allows for post-translational lipidation that is important for TEAD stabilization and transcriptional activity, has sparked new efforts to create small molecules that can change how TEAD works [7]. Current strategies for finding TEAD inhibitors use advances in structure-based drug design (SBDD) that have come about because of the availability of high-resolution TEAD crystal structures [8,9]. These structures let computational chemists use virtual screening, molecular docking, and molecular dynamics (MD) simulations [10] to predict ligand binding poses and stabilities [6,11]. After that, they use methods like Molecular Mechanics/Generalized Born Surface Area (MM/GBSA) to do rigorous free energy evaluations [12]. Complementary computational methodologies, including principal component analysis (PCA) and free energy landscape (FEL) mapping, elucidate the conformational dynamics of TEAD and the ligand-induced stabilization of specific protein states, thereby facilitating rational hit-to-lead optimization. The integration of in silico absorption, distribution, metabolism, excretion, and toxicity (ADME/Tox) predictions is important because it lets us prioritize compounds with good pharmacokinetic properties, oral bioavailability, metabolic stability, and lower toxicity risks [13]. It also lets us leave out molecules that are predicted to cross the blood-brain barrier unnecessarily or act as P-glycoprotein (P-gp) substrates, which could lead to multidrug resistance. Natural product libraries [14], like the ChemDiv database, have shown to be good sources of chemically diverse scaffolds with built-in bioactivity [14,15]. Several candidate TEAD inhibitors found through computational screening have strong docking scores, good MM/GBSA binding free energies, and pharmacokinetic profiles that are similar to those of oral drugs. These in silico results support experimental work that has led to the discovery of the first-in-class TEAD palmitoylation inhibitors, such as VT3989, which is currently in clinical trials. They also support the discovery of covalent ligands that target cysteine residues in the TEAD palmitate pocket and strongly and selectively inhibit YAP/TAZ–TEAD transcriptional activity. These advancements signify a transformative shift in cancer drug discovery, enabling previously intractable protein–protein interaction surfaces to become druggable through the integration of structural biology, computational modelling, and rational medicinal chemistry. The wider therapeutic implications go beyond cancer, since problems with the Hippo pathway are also linked to fibrosis, regeneration, and immune evasion. This means that TEAD inhibitors may be useful in a number of clinical situations [14].
Even with this promise, there are still problems to solve, such as making sure that TEAD isoforms are selective, stopping interactions with unrelated lipid-binding proteins, and getting enough systemic exposure while keeping safety. Despite this, combining high-throughput virtual screening, molecular simulations, binding free energy calculations, and ADME/Tox filtering is a strong way to speed up the search for drugs that target TEAD. The Hippo–YAP/TAZ–TEAD axis is an important oncogenic driver and a potential therapeutic weakness. Finding powerful, drug-like small-molecule inhibitors that can stop TEAD-mediated transcription could lead to a new type of precision therapy for cancers caused by problems with the Hippo pathway, giving patients with few other options new ways to get better.

2. Methodology

2.1. Molecular Docking

Using AutoDock 4.2 [16,17], molecular docking was done to guess how ligands would fit into the ATP-binding site of Phosphoinositide 3-kinase (PI3K; PDB ID: 7CNL) [18]. We obtained the crystal structure from the RCSB Protein Data Bank and got it ready by taking out the crystallographic water molecules and co-crystallized ligands. Using AutoDock Tools (ADT), polar hydrogens were added and Gasteiger charges were given. Before docking, the MMFF94 force field [19] was used to minimize the ligands (https://www.chemdiv.com/catalog/diversity-libraries/3d-diversity-natural-product-like-library/, accessed on 11 November 2025). The docking grid was 50 × 50 × 50 Å with a 0.345 Å space between each point. It was centered on the ATP-binding cleft. The Lamarckian Genetic Algorithm (LGA) was used with 50 independent runs. Based on the docking score and interaction profile [20], the pose with the highest score was chosen. We used PyMOL 3.1 and LigPlot 2.3 to see how proteins and ligands interacted with each other.

2.2. Molecular Dynamics Simulation

We used the Desmond v6.3 module (Schrodinger, LLC, New York, NY, USA) to run molecular dynamics (MD) simulations to see how stable docked complexes were. A TIP3P orthorhombic water box with a 10 Å buffer was used to solvate each protein–ligand system. To balance the charges, counterions were added, and 0.15 M NaCl was added to mimic normal body conditions. The OPLS_2005 force field was used to make the system as small as possible. After minimization, equilibration was performed under NVT (constant number, volume, temperature) and NPT (constant number, pressure, temperature) ensembles for 2 ns each [21,22,23]. Then, the Nose–Hoover thermostat and Martyna–Tobias–Klein barostat were used to run production simulations for 100 ns at 300 K and 1 atm. Desmond’s analysis tools were used to figure out the Root Mean Square Deviation (RMSD), Root Mean Square Fluctuation (RMSF), Radius of Gyration (Rg), and hydrogen bond occupancy for the trajectory analyses [11,24,25,26,27].

2.3. MM-GBSA Binding Free Energy Calculations

The MM-GBSA (Molecular Mechanics/Generalized Born Surface Area) method in Schrödinger’s Prime module was used to figure out the binding free energy [28]. Every 10 ns, snapshots were taken from MD trajectories, and then energy minimization was done on them. The VSGB 2.0 solvation model and the OPLS_2005 force field were used [29]. We used the following equation to figure out the binding free energy (ΔG_bind):
ΔGbind = Gcomplex − (Gprotein + Gligand) ΔG_{bind} = G_{complex} − (G_{protein} + G_{ligand}) ΔGbind = Gcomplex − (Gprotein + Gligand).
where GcomplexG_{complex} Gcomplex, GproteinG_{protein} Gprotein, and GligandG_{ligand}Gligand are the minimized free energies of the complex, protein, and ligand, respectively. Energy decomposition was conducted to assess the contributions from van der Waals, electrostatic, solvation, and lipophilic interactions [28].

2.4. Principal Component Analysis (PCA)

Principal Component Analysis (PCA) was employed to identify the predominant collective motions of the protein-ligand complexes during simulations. The trajectories were aligned with the reference structure, and a covariance matrix of atomic positional fluctuations (Cα atoms) was created [10]. Eigenvectors and eigenvalues were computed, and the initial two principal components (PC1 and PC2) were examined. We plotted projections of MD snapshots along the PC1–PC2 axes to find conformational clusters and metastable states [30,31].

2.5. Free Energy Landscape (FEL)

The Free Energy Landscape (FEL) was created by projecting conformation ensembles onto the first two principal components (PC1 and PC2) from MD trajectories [32]. We used the Boltzmann relation to find free energy (ΔG):
ΔG(x,y) = −RT ln P(x,y) ΔG(x,y) = −RT ln P(x,y) ΔG(x,y) = −RTlnP(x,y)
where P(x,y) is the probability distribution along PC1–PC2, R is the universal gas constant, and T is the temperature (300 K). Stable conformational states were linked to low-energy basins, while shallow local minima showed metastable states. GROMACS 2020.4 made the FEL plots, and OriginPro 2022 showed them [10,26,32].

3. Results and Discussion

3.1. Molecular Docking Analysis and MMGBSA

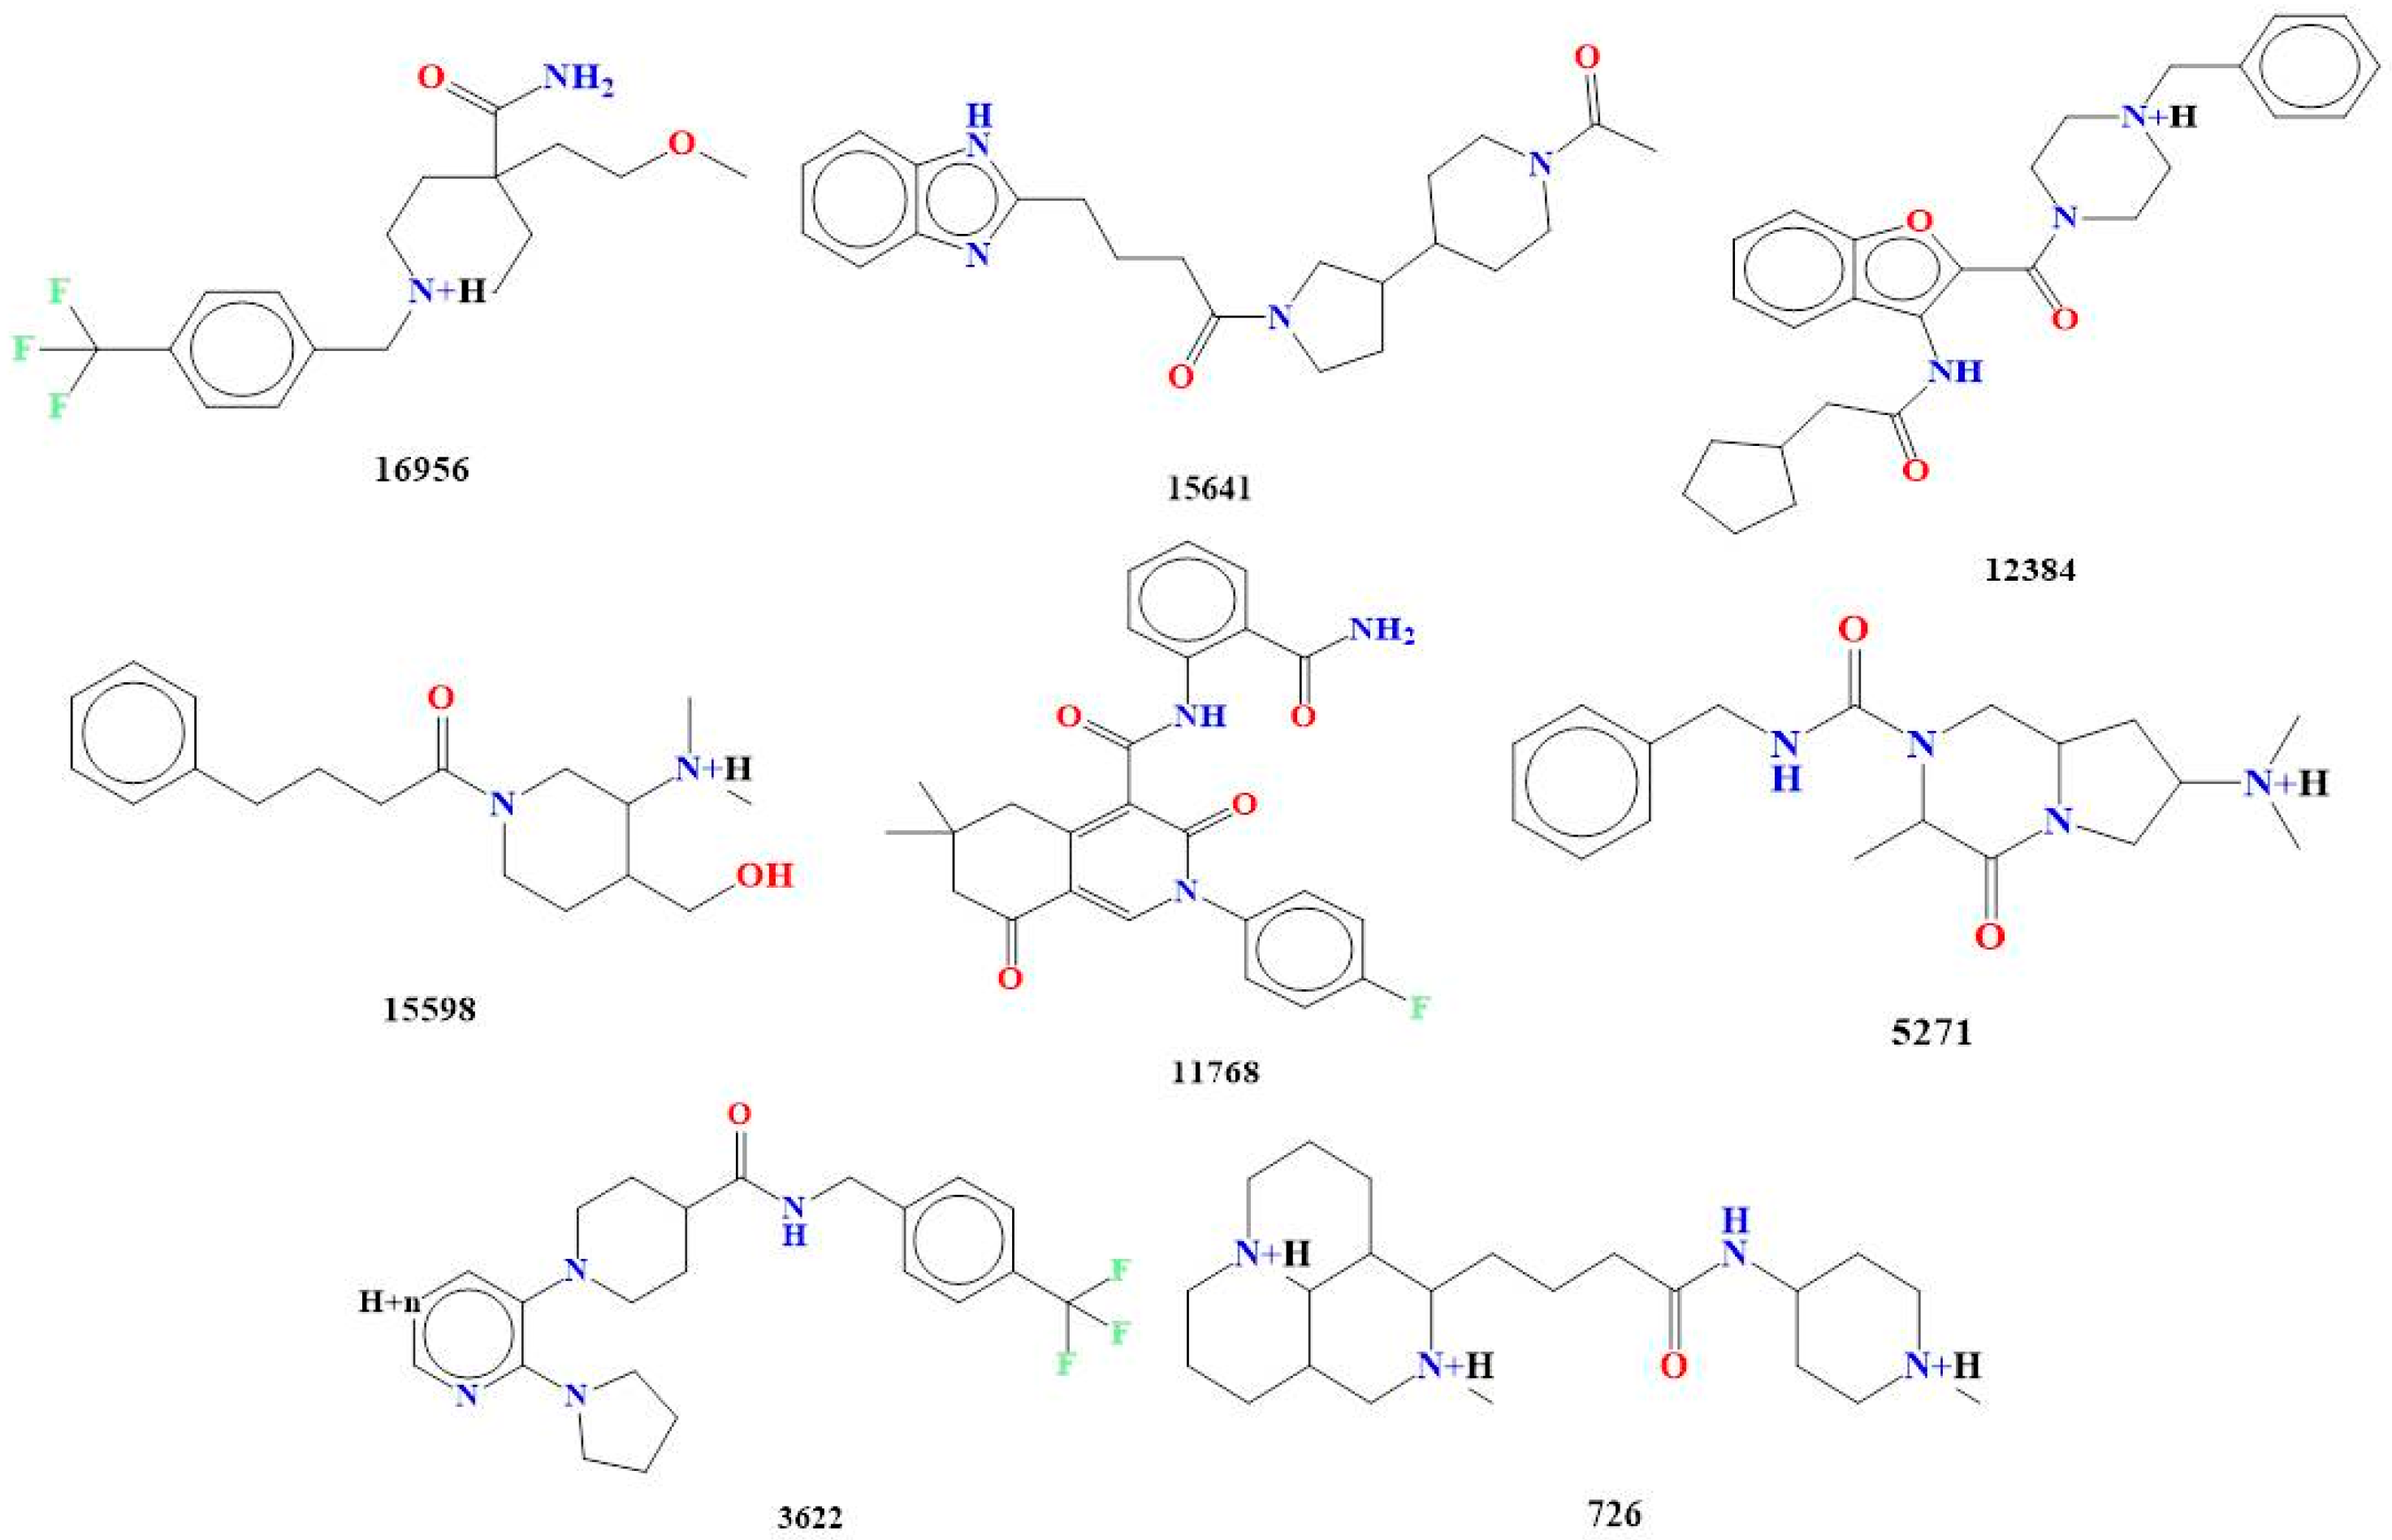
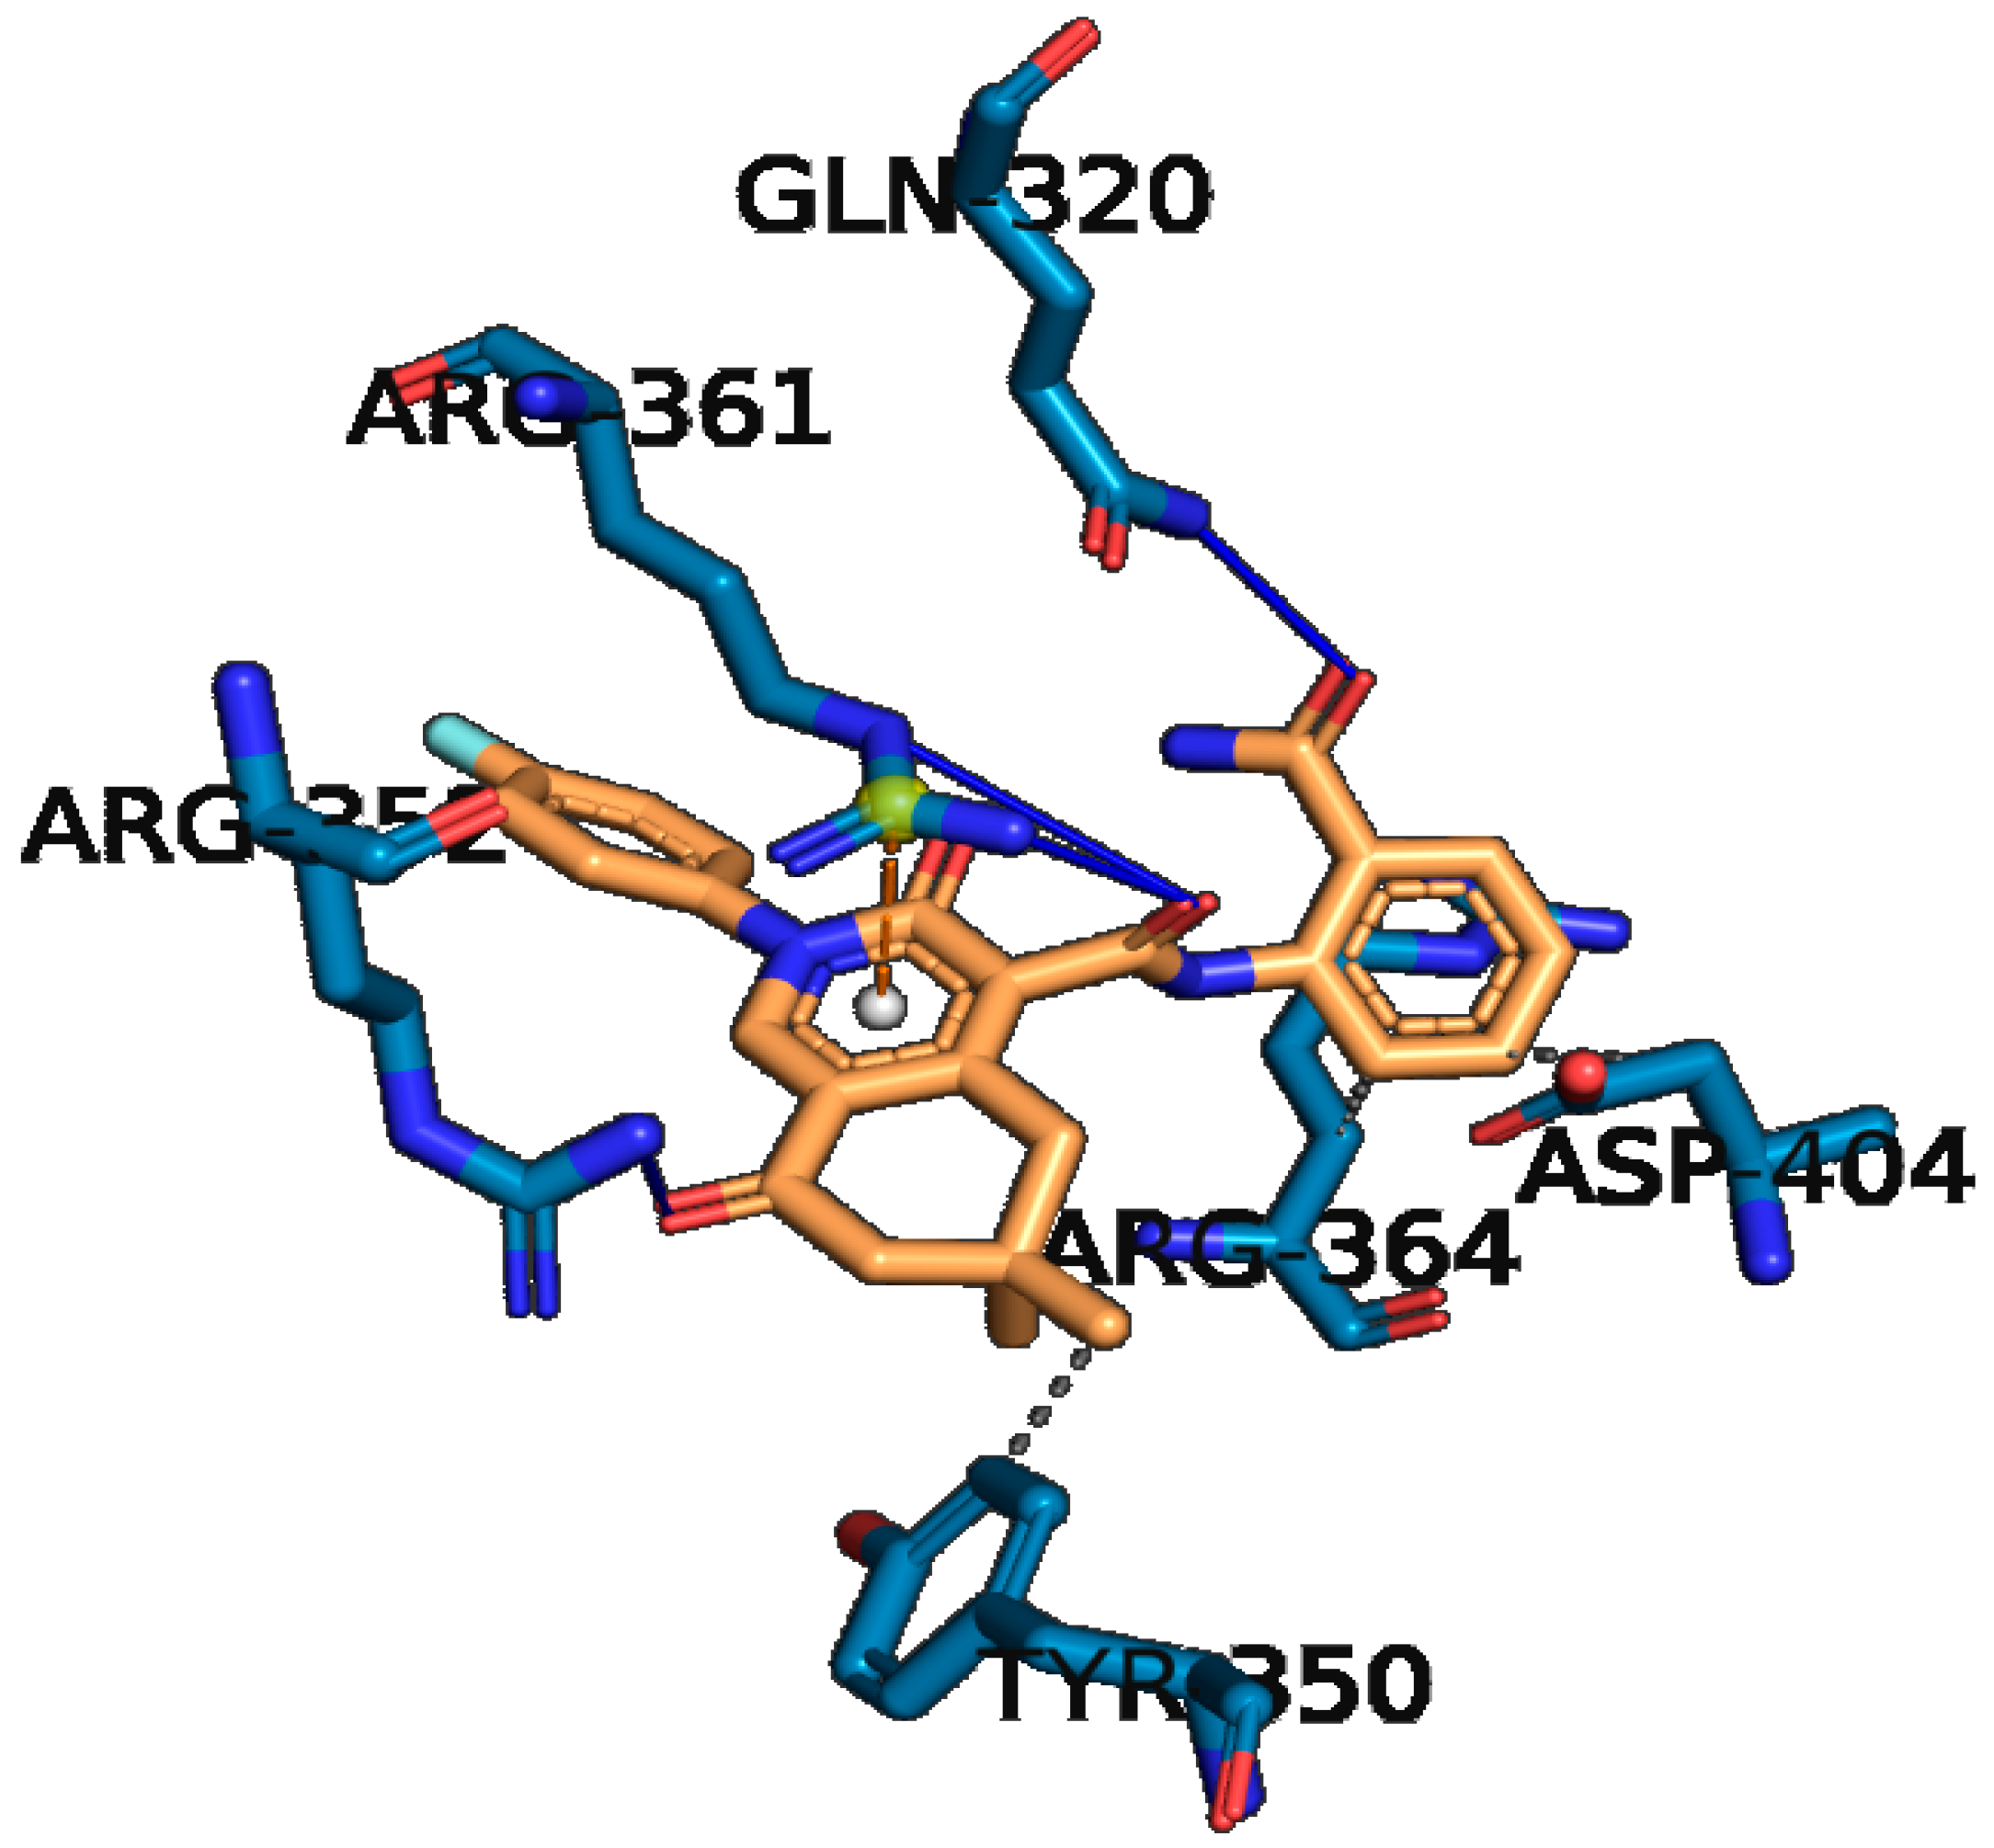
The molecular docking based virtual screening gave rise to identification of 16956, 726, 5271, 11768, 12384, 15598, 15641, and 3622 based on strong binding affinities, as shown by docking energies that ranged from −8.02 to −8.49 kcal/mol (see Figure 1). The molecular docking analysis of compounds 11768 and 15598 demonstrates unique interaction patterns with the receptor binding site, corroborated by MMGBSA (Molecular Mechanics Generalized Born Surface Area) binding free energy computations. The docking data for compound 11768 shows a lot of interactions that make it more stable (see Table 1 and Table 2 for docking interaction of ligand 11768 and 15598).
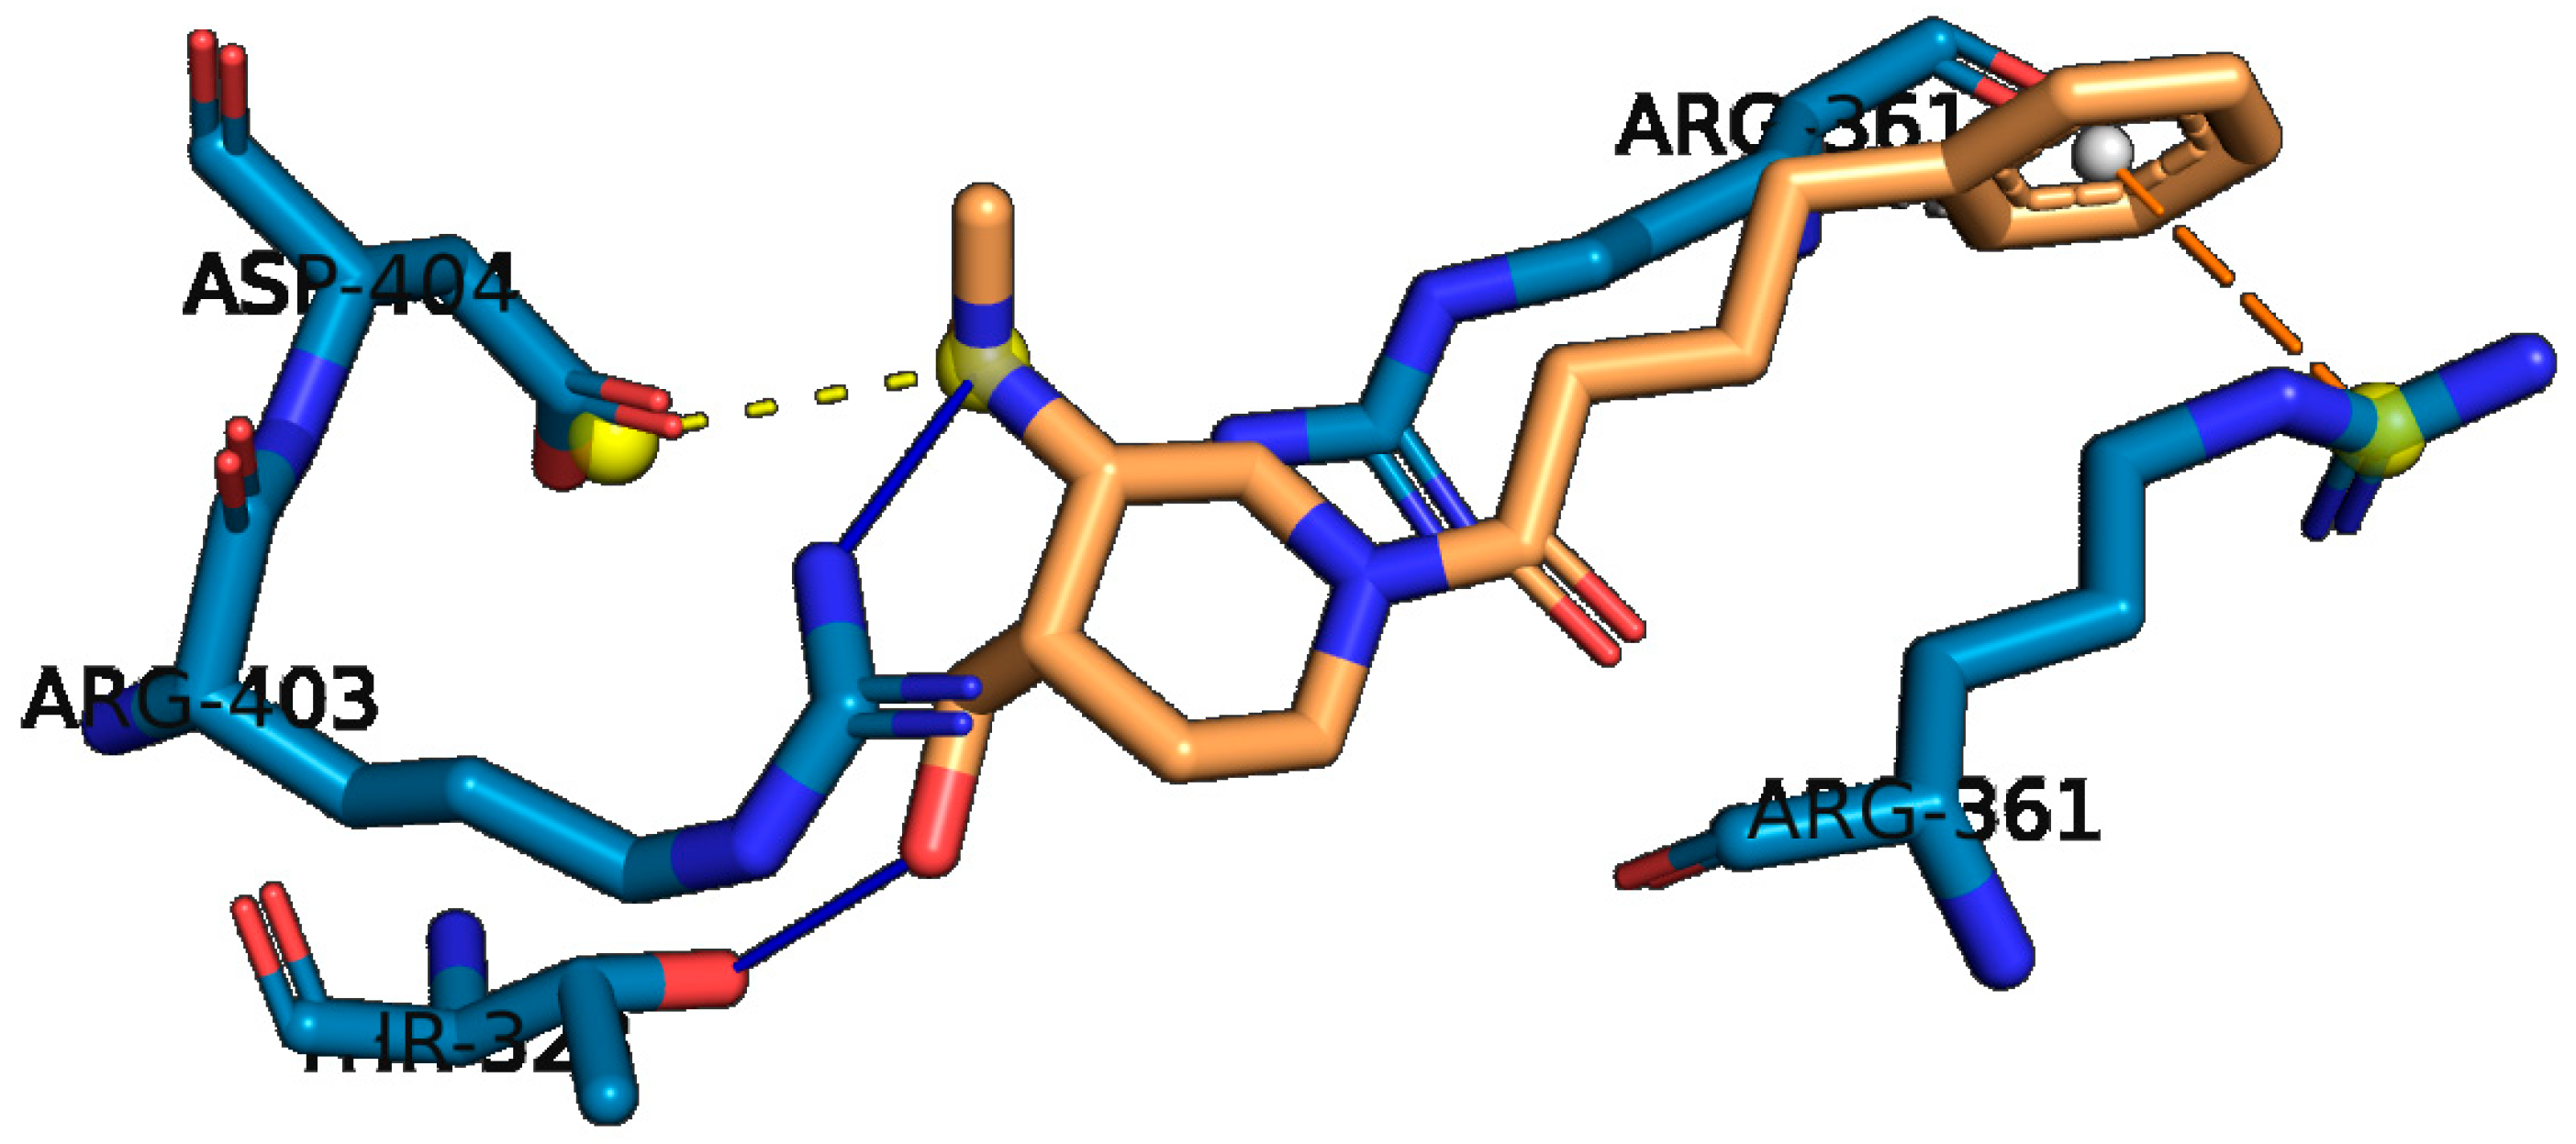
These include hydrophobic contacts with TYR350, ARG364, and ASP404; hydrogen bonds with GLN320, ARG352, and ARG361; and a strong π-cation interaction with ARG361. These interactions work together to make a strong and stable binding orientation. The hydrogen bonds that were found have good bond lengths (1.96–3.47 Å) and angles, which means they are stable in one direction. The π-cation interaction at ARG361, however, makes aromatic stabilization stronger. This big interaction network has a binding free energy (ΔGbind = −55.86 kcal/mol) that is better than that of compound 15598, which means it has a stronger affinity for the receptor. The van der Waals interactions (−51.84 kcal/mol) and the Coulombic forces (−17.24 kcal/mol) are the two things that have the biggest effect on this binding energy. Solvation effects (+27.32 kcal/mol) help to balance these out a little, which makes the net ΔGbind very negative. Conversely, compound 15598 exhibits a restricted interaction profile. It has hydrophobic contacts with ARG361, hydrogen bonds with THR328 and ARG403, a π-cation interaction with ARG361, and a salt bridge with ASP404 (see Figure 2).
The salt bridge makes the electrostatic stability better, but there are fewer interactions overall and fewer types of interactions than in 11768. So, its MMGBSA ΔGbind (−45.90 kcal/mol) is not as good as that of 11768, which means it has a lower binding affinity. For 15598, van der Waals forces (−35.95 kcal/mol) and lipophilic contributions (−11.92 kcal/mol) are important stabilizing factors. However, solvation penalties (+14.73 kcal/mol) lower the overall affinity (see Figure 3).
In contrast, compound 11768 has a stronger binding affinity because its strong hydrogen bonds, wide hydrophobic and electrostatic interactions, and beneficial van der Waals stabilization outweigh the solvation penalties. On the other hand, 15598 has less overall binding stability, which means that its MMGBSA energy is less favorable. This is because it forms important stabilizing interactions like the salt bridge. In summary, these data show that compound 11768 is the better choice for receptor binding because its docking profile and MMGBSA results consistently show that it has a higher binding affinity and may be more effective biologically than 15598.

3.2. MD Simulation Analysis

3.2.1. RMSD

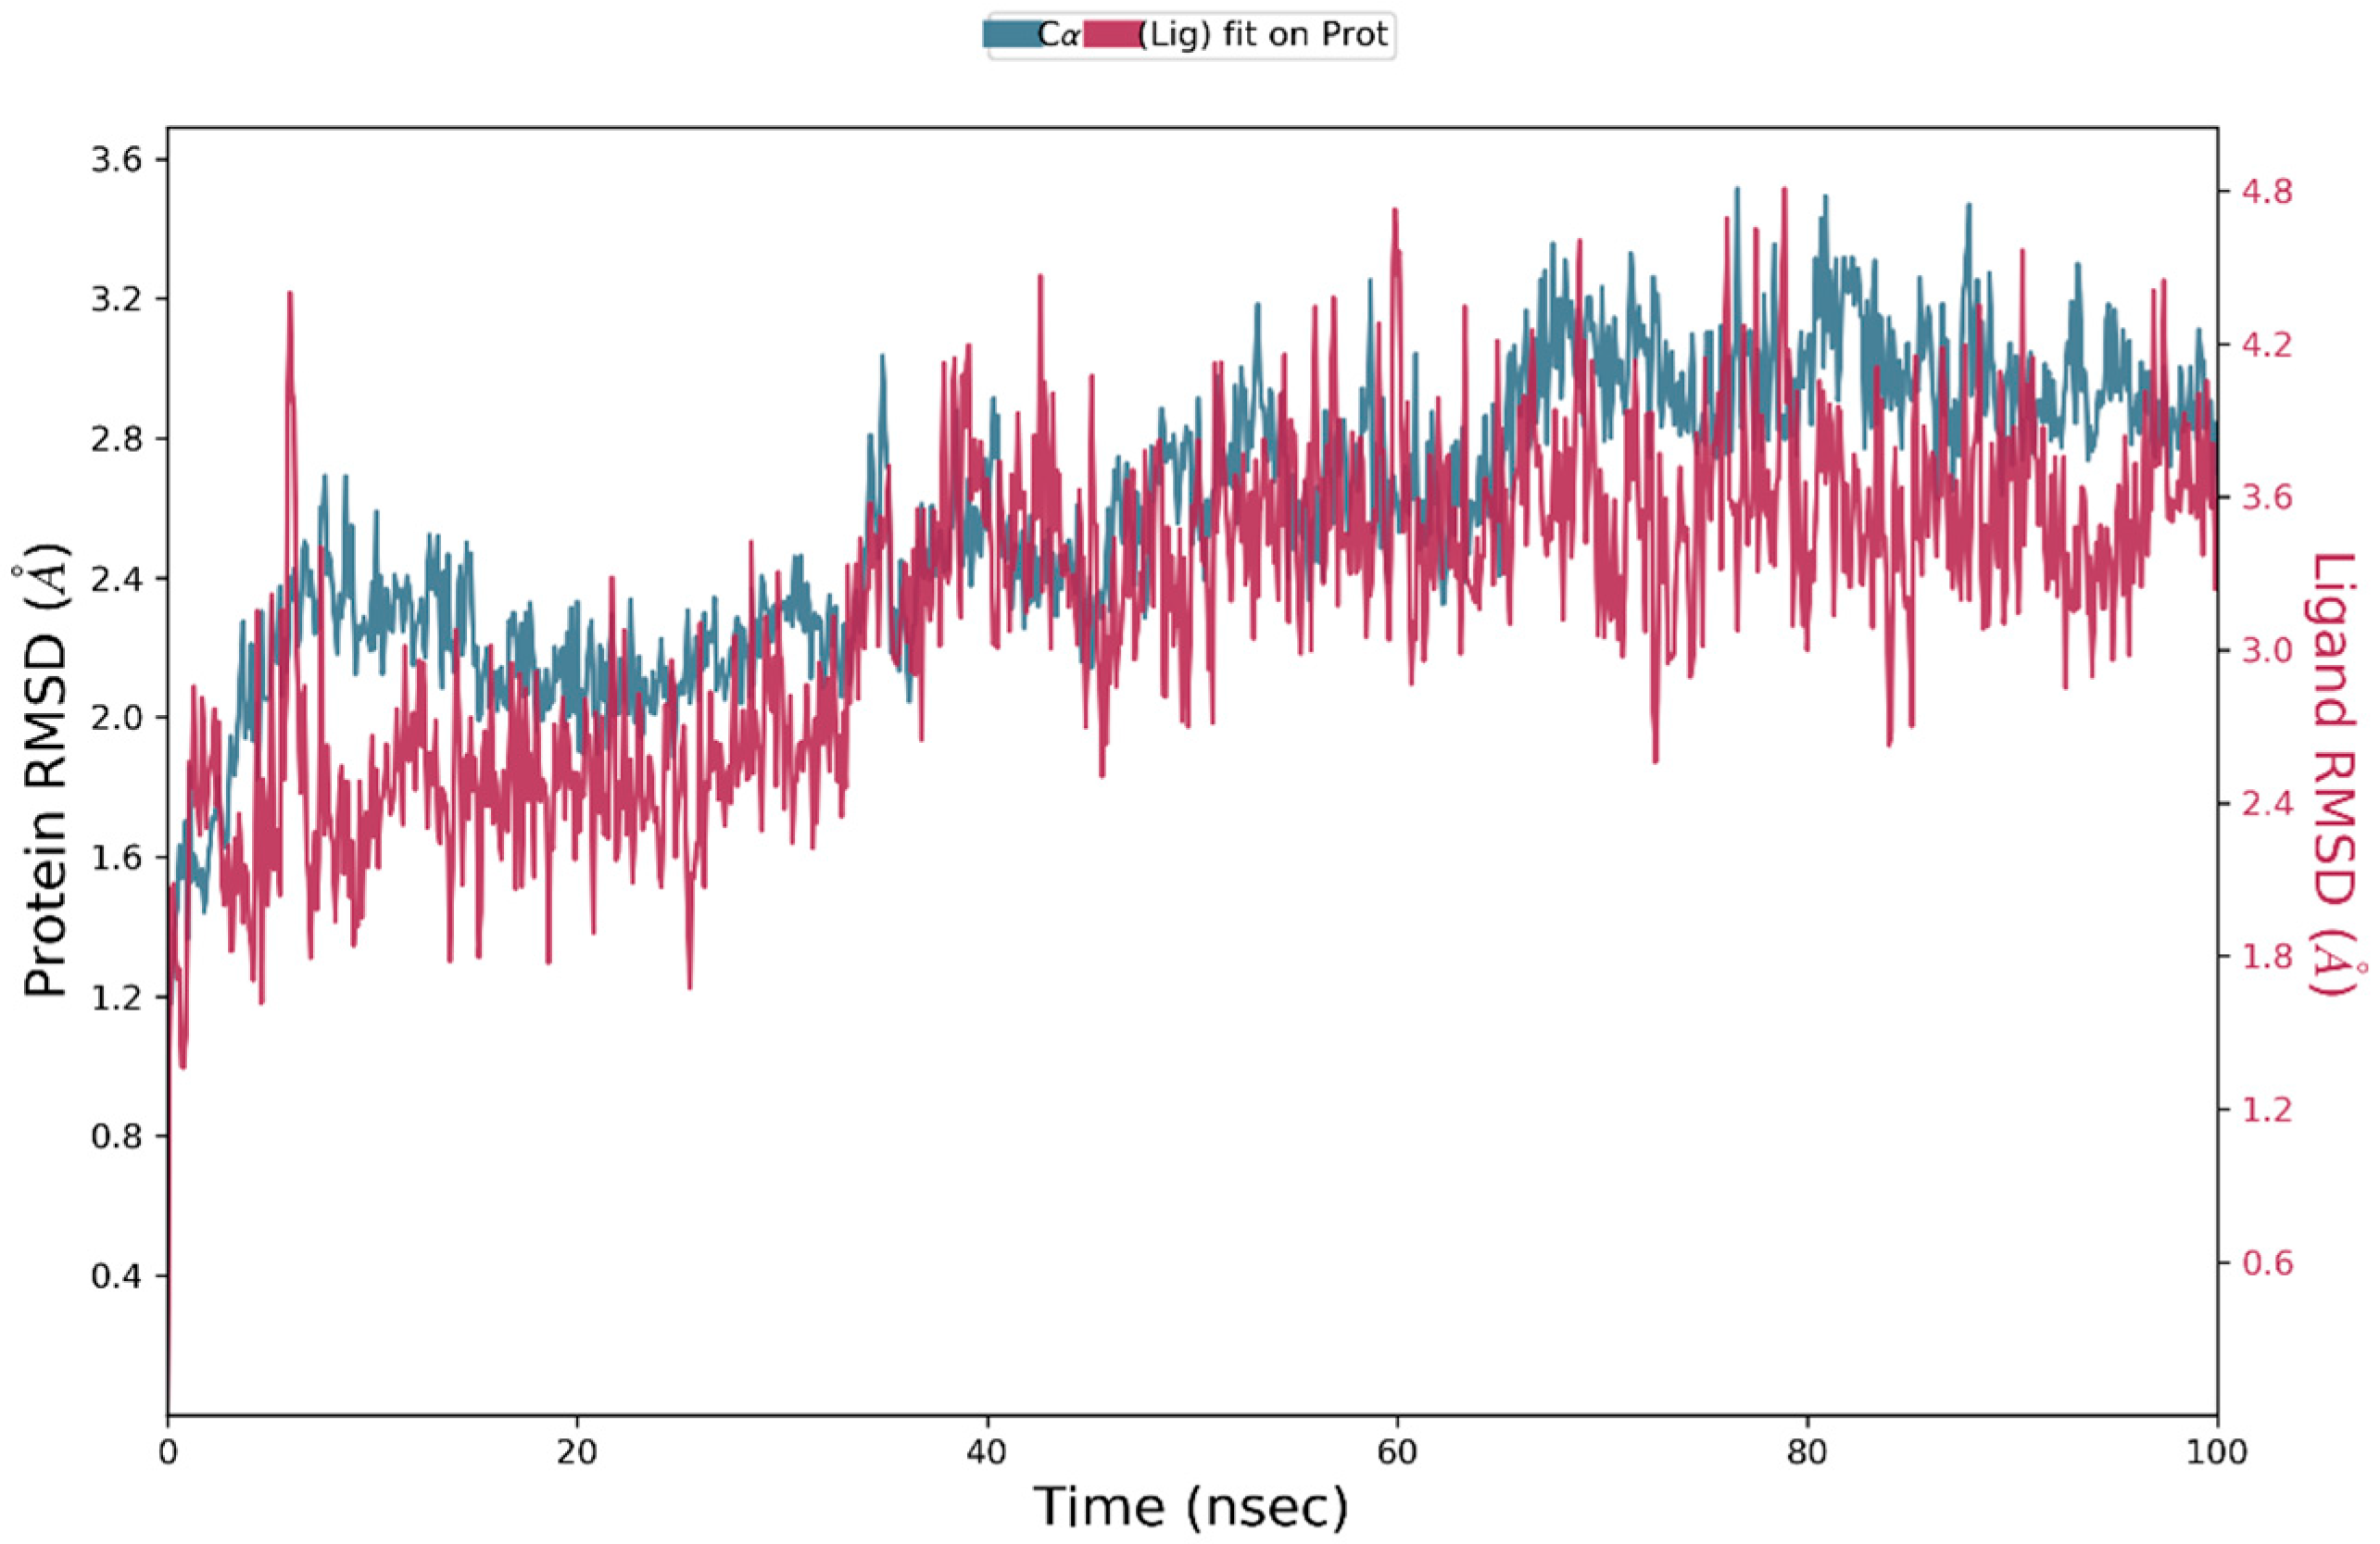
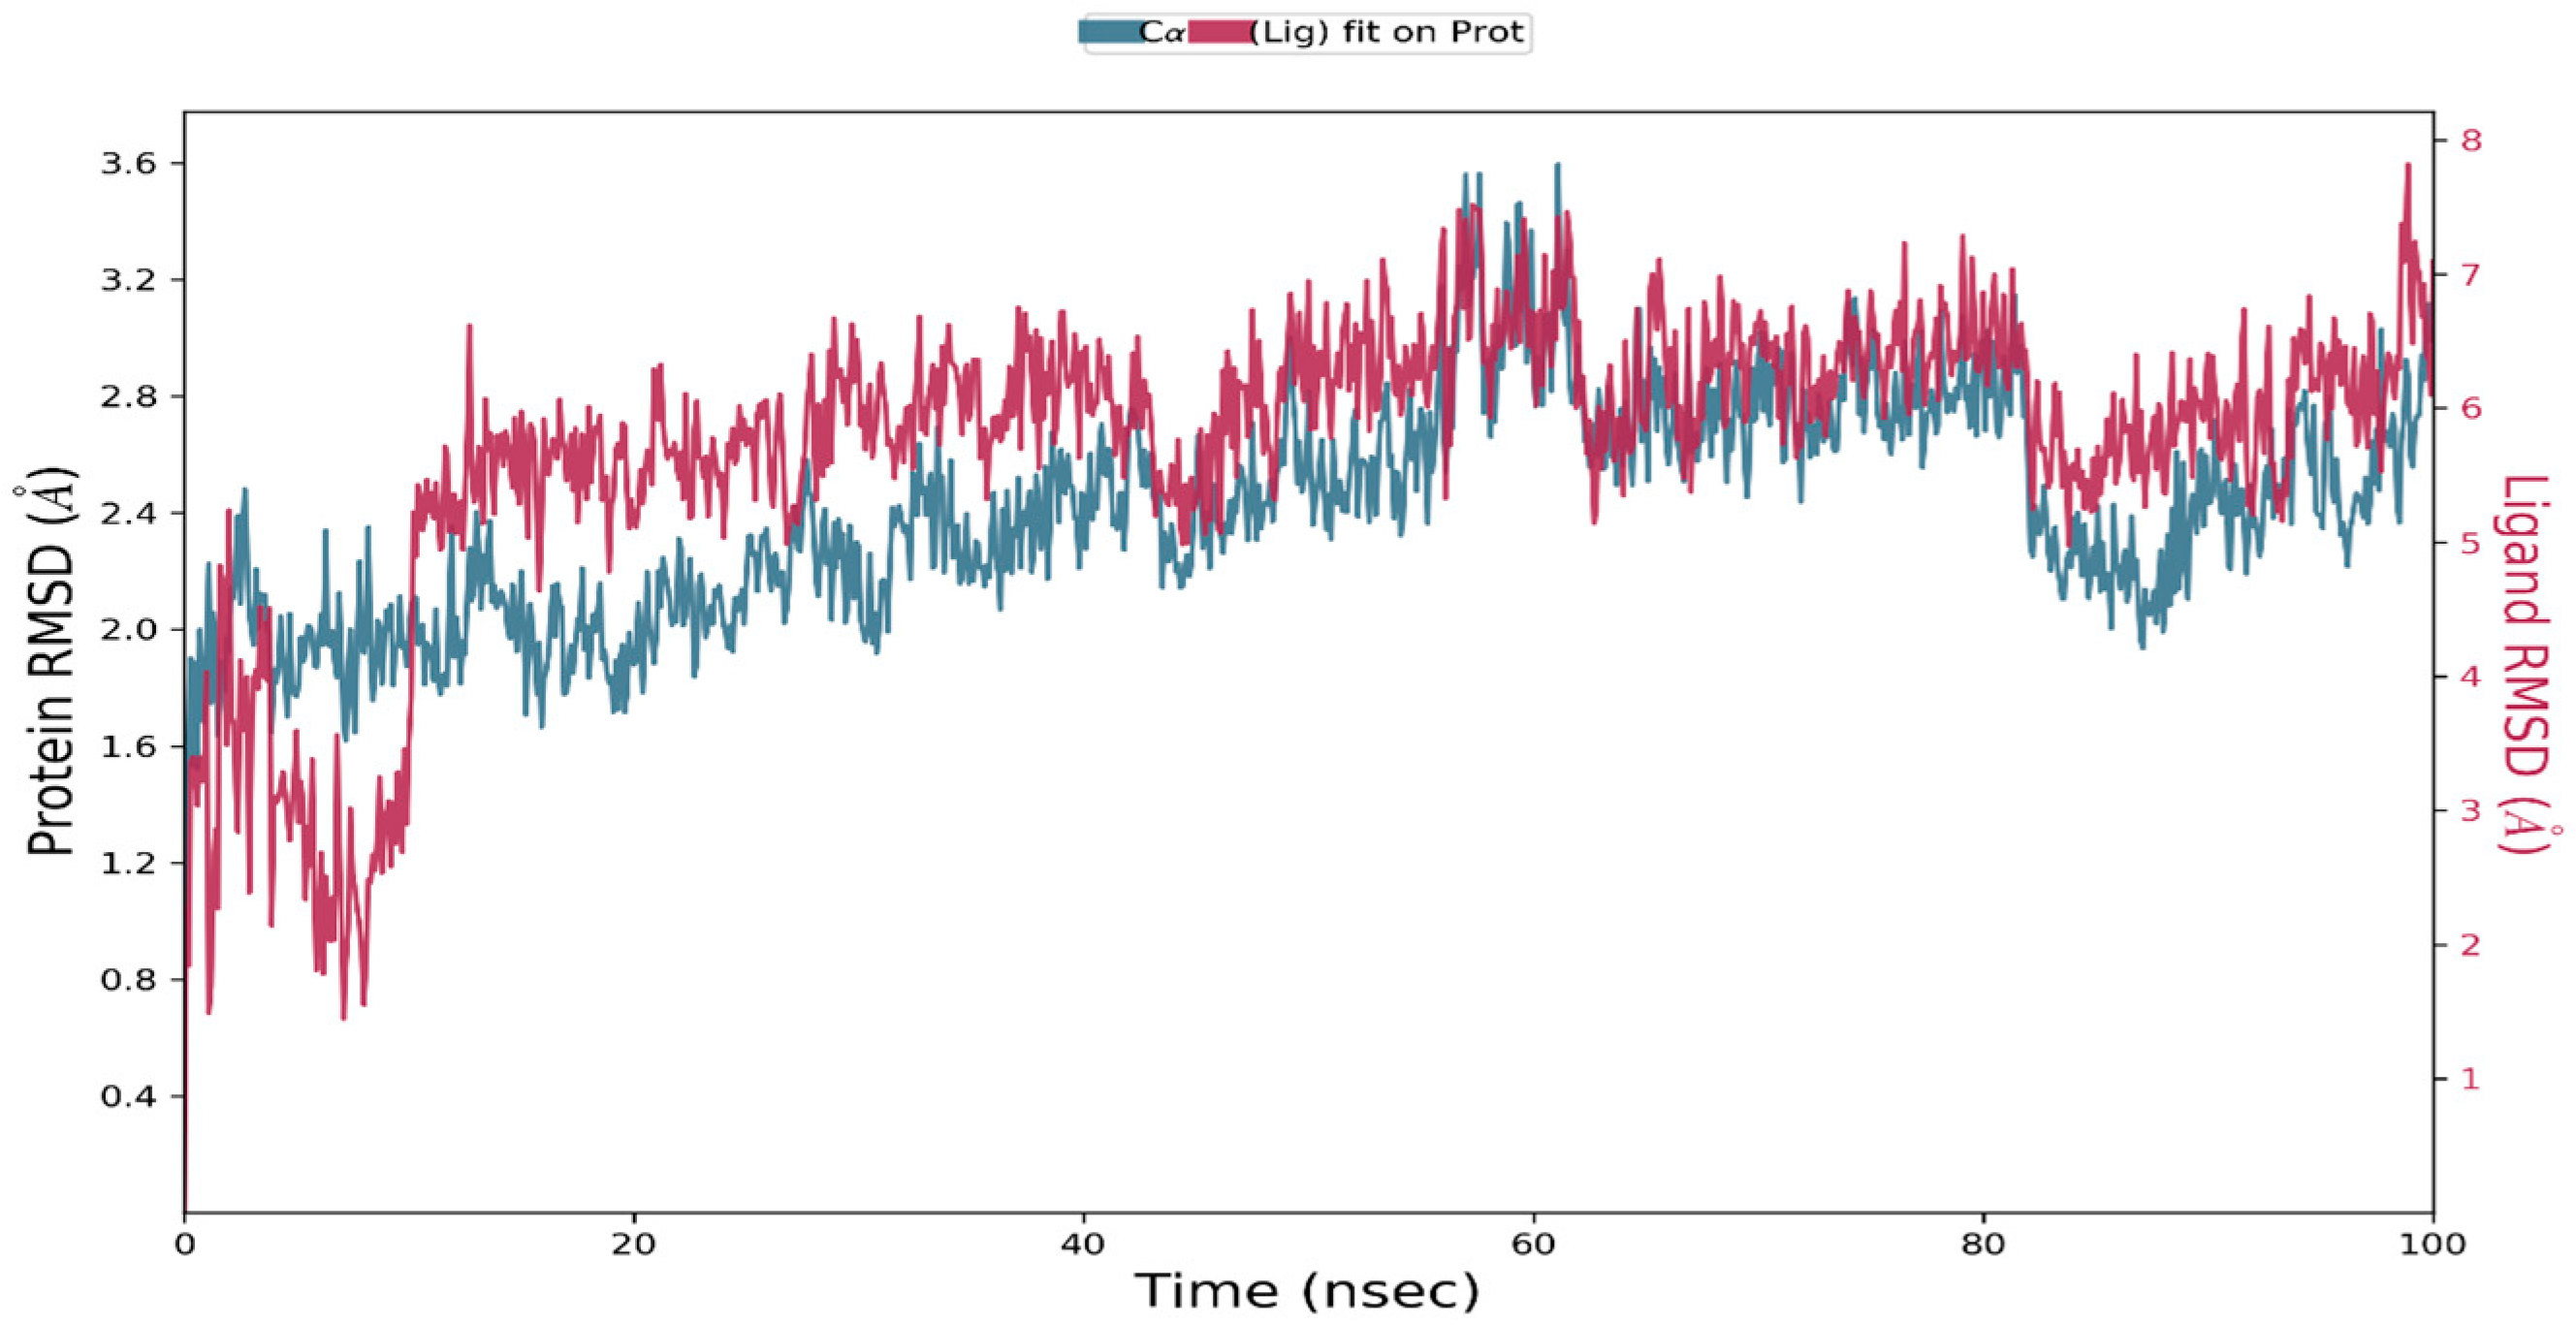
The 100 ns RMSD trajectories show that compound 11768 binds (see Figure 4). more stably and consistently than compound 15598. This is consistent with how they interact with each other when they dock. The protein Cα RMSD for 11768 (PL-RMSD 11768.png) goes from about 1.1–1.3 Å in the first nanoseconds to a plateau of about 2.7–3.1 Å after about 60 ns. This means that the receptor is balancing out normally and there are no signs that it is unfolding. The ligand RMSD (aligned with the protein) stays between 3.0 and 3.7 Å for most of the production phase. It only shows short spikes and no long-term drift. This means that the shape is stable and only changes a little bit, not completely. This dynamic stability is consistent with the docking results, which indicated that 11768 exhibits numerous interactions: three hydrophobic contacts (TYR350, ARG364, ASP404), four hydrogen bonds (GLN320, ARG352, ARG361×2) characterized by optimal donor–acceptor distances (approximately 2.0–3.5 Å) and angles, along with a π–cation clamp that stabilizes the aromatic ring system. The particular hydrogen bonds and cation–π interactions elucidate the reason the ligand remains in a singular basin on the RMSD landscape rather than exploring alternative conformations. For 15598 (PL-RMSD 15598.png), on the other hand, the protein Cα RMSD shows a steady equilibration (about 2.0–3.0 Å by mid-trajectory), while the ligand RMSD shows big changes, going up quickly after about 10 ns and staying at 5–7+ Å for long periods of time (see Figure 5).
The overall trajectory shows bigger changes in amplitude and several quasi-stable plateaus. This means that the pose is changing and that it is partially moving away from important interactions. It does stay stable around 3–4 Å at times. These dynamics are similar to the more streamlined docking footprint of 15598, which has one hydrophobic interaction (ARG361), two hydrogen bonds (THR328, ARG403), one π–cation interaction (ARG361), and one salt bridge to ASP404. The salt bridge has strong point electrostatics, but its interaction pattern is less redundant and more exposed to solvent than 11768. This means that 15598 is more likely to fight with water and change its side chains. The RMSD spikes happen when these connections break and then come back together, and when the search for new orientations happens. The narrow ligand-RMSD envelope of 11768 indicates that the pocket has superior kinetic retention due to its intricate docking interaction profile, characterized by multi-site hydrogen bonding and an ARG361 π–cation lock that collectively mitigate rotational drift. The wide multi-basin RMSD profile of 15598, on the other hand, suggests that it is a ligand with a more flexible binding mechanism that is less affected by complementary form and electrostatics. This is consistent with its few docking contacts. The RMSD test based on MD backs up the order shown by docking. 11768 stays the same shape with little change, but 15598 keeps changing its structure, which makes it less stable in its pose and more likely to partially unbind when the temperature changes.

3.2.2. RMSF

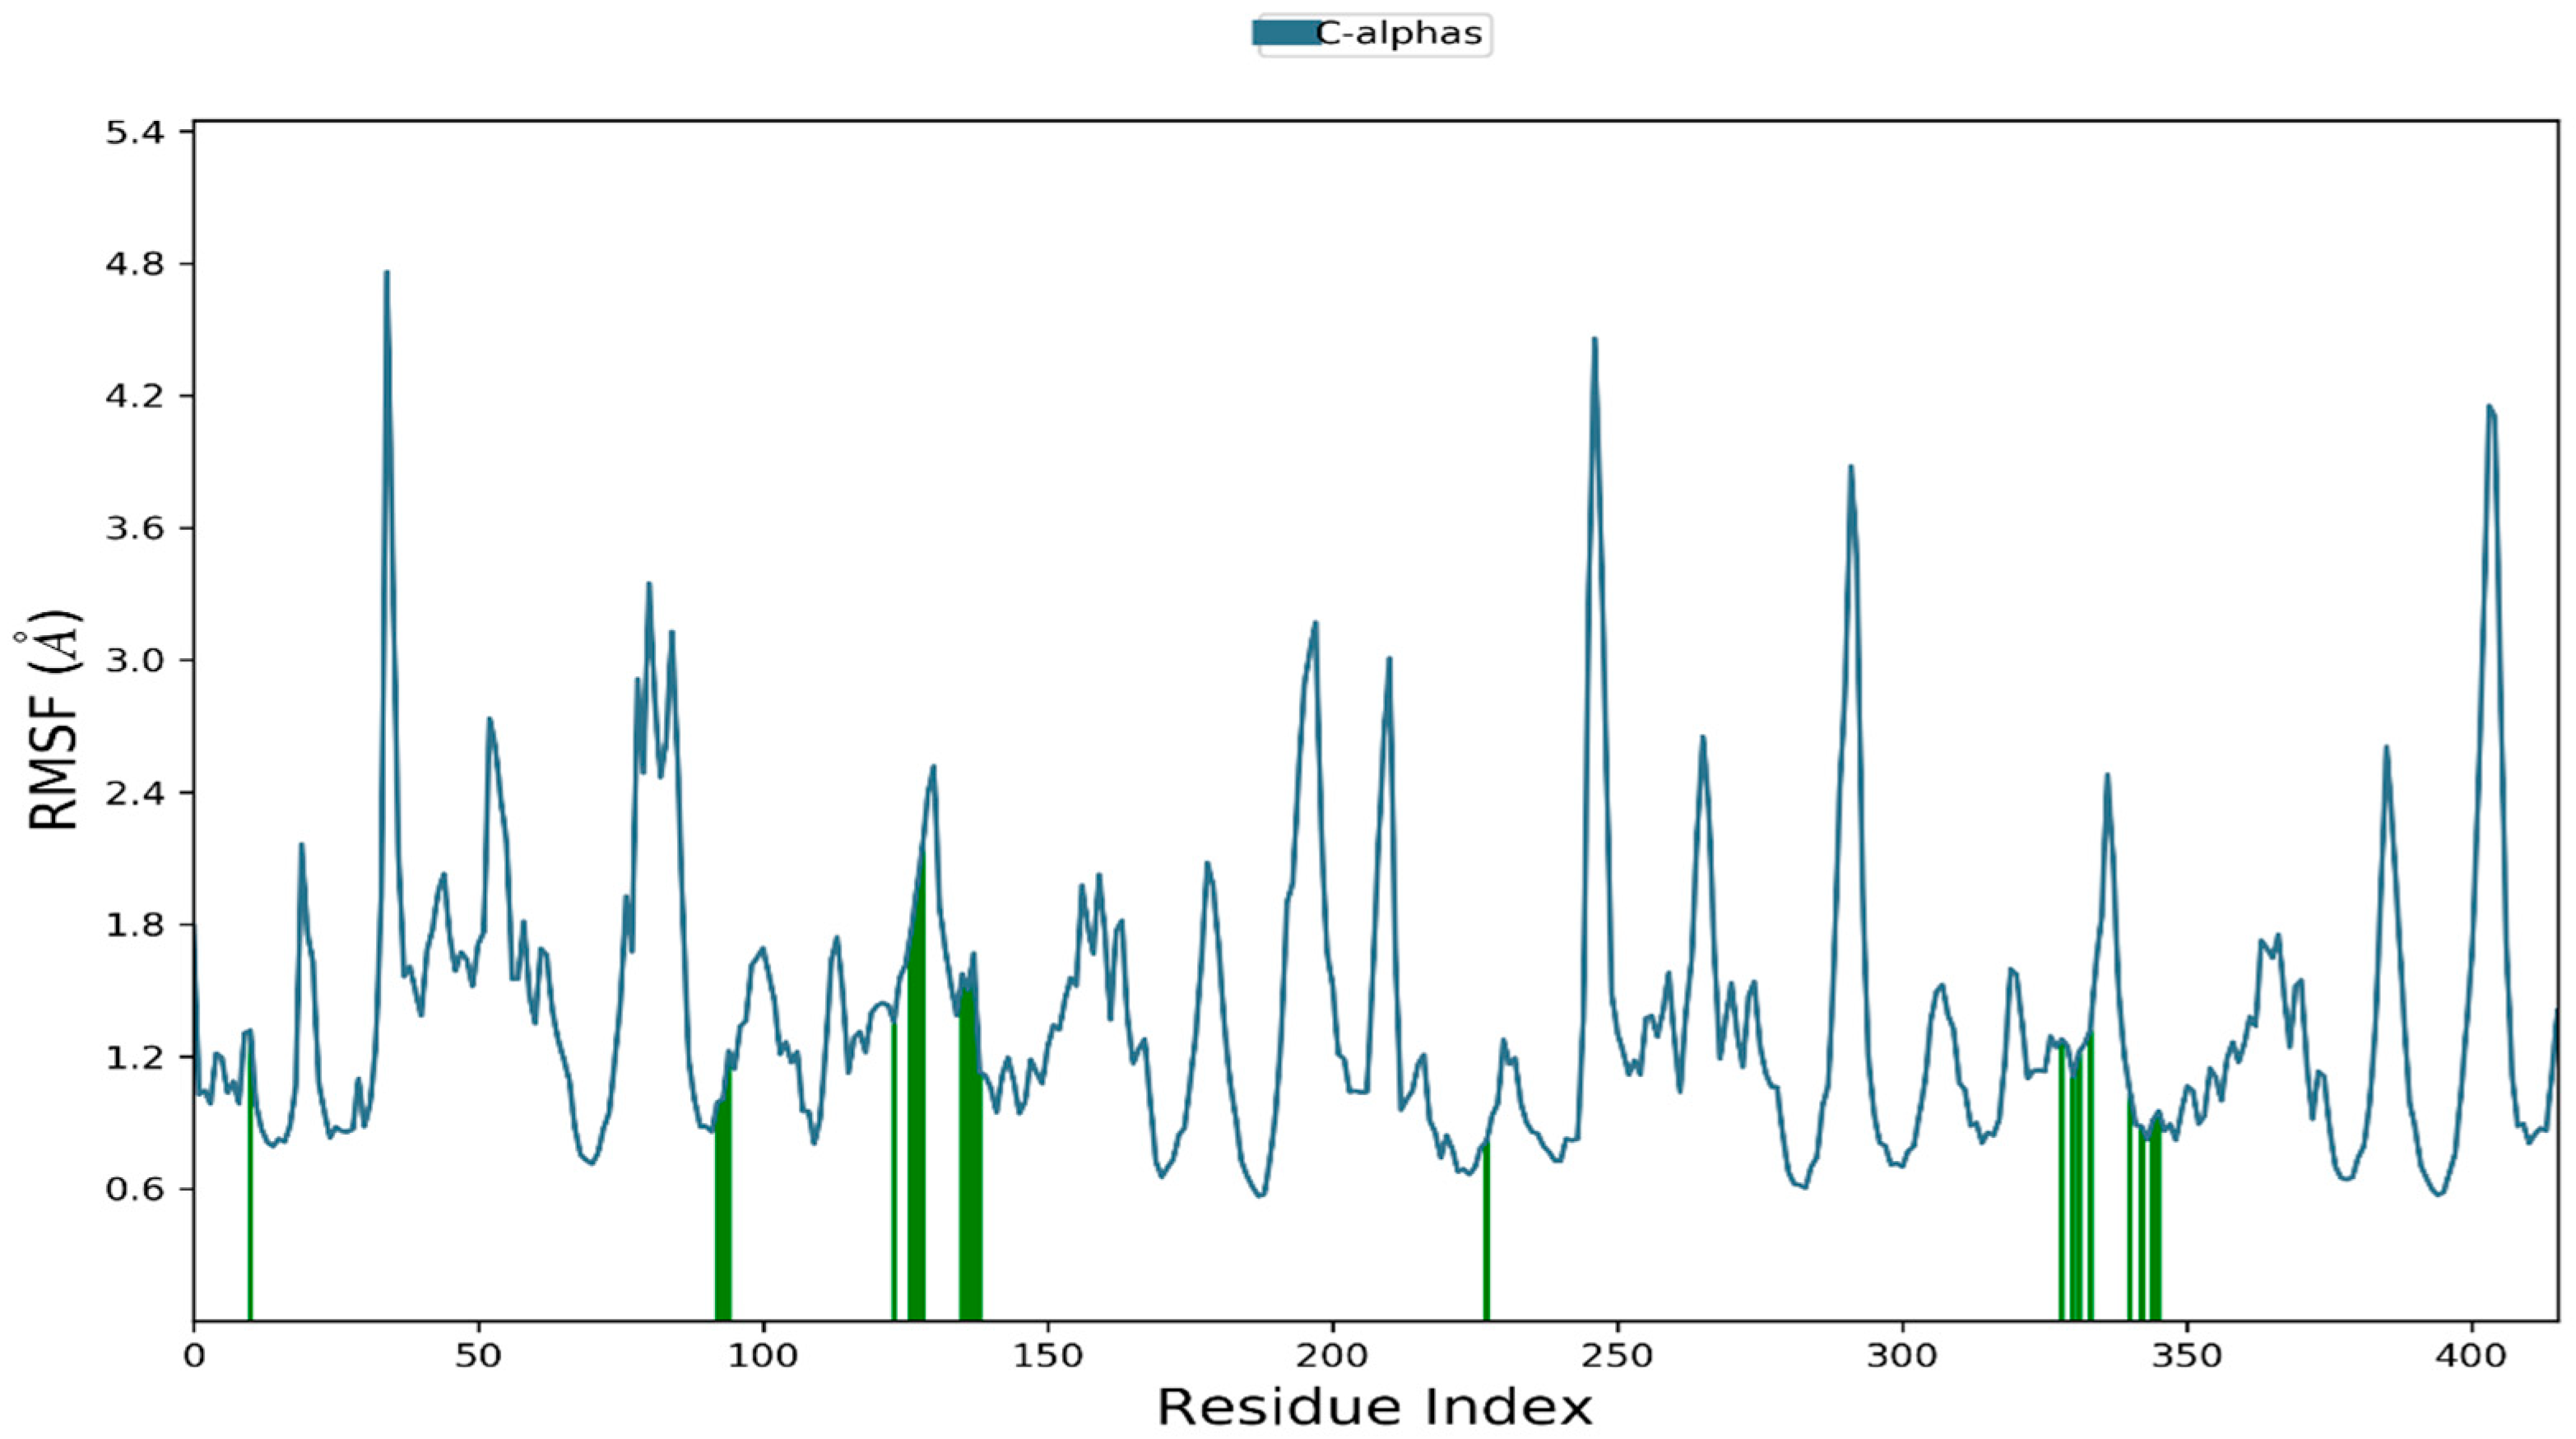
The root-mean-square fluctuation (RMSF) profiles for the Cα atoms of the protein show how the local flexibility changes when a ligand binds. When viewed alongside docking contacts, they reveal the dynamic imprint of each molecule within the pocket. The global trace for the 11768 complex (P-RMSF 11768) is moderate (baseline 0.8–1.4 Å) and has loop spikes (2.5–4.0 Å) that are typical of segments that are in contact with solvent (see Figure 6). The corridor that connects the binding sites from about 320 to 365 and goes up to about 404 does not move as much as the loops next to it.
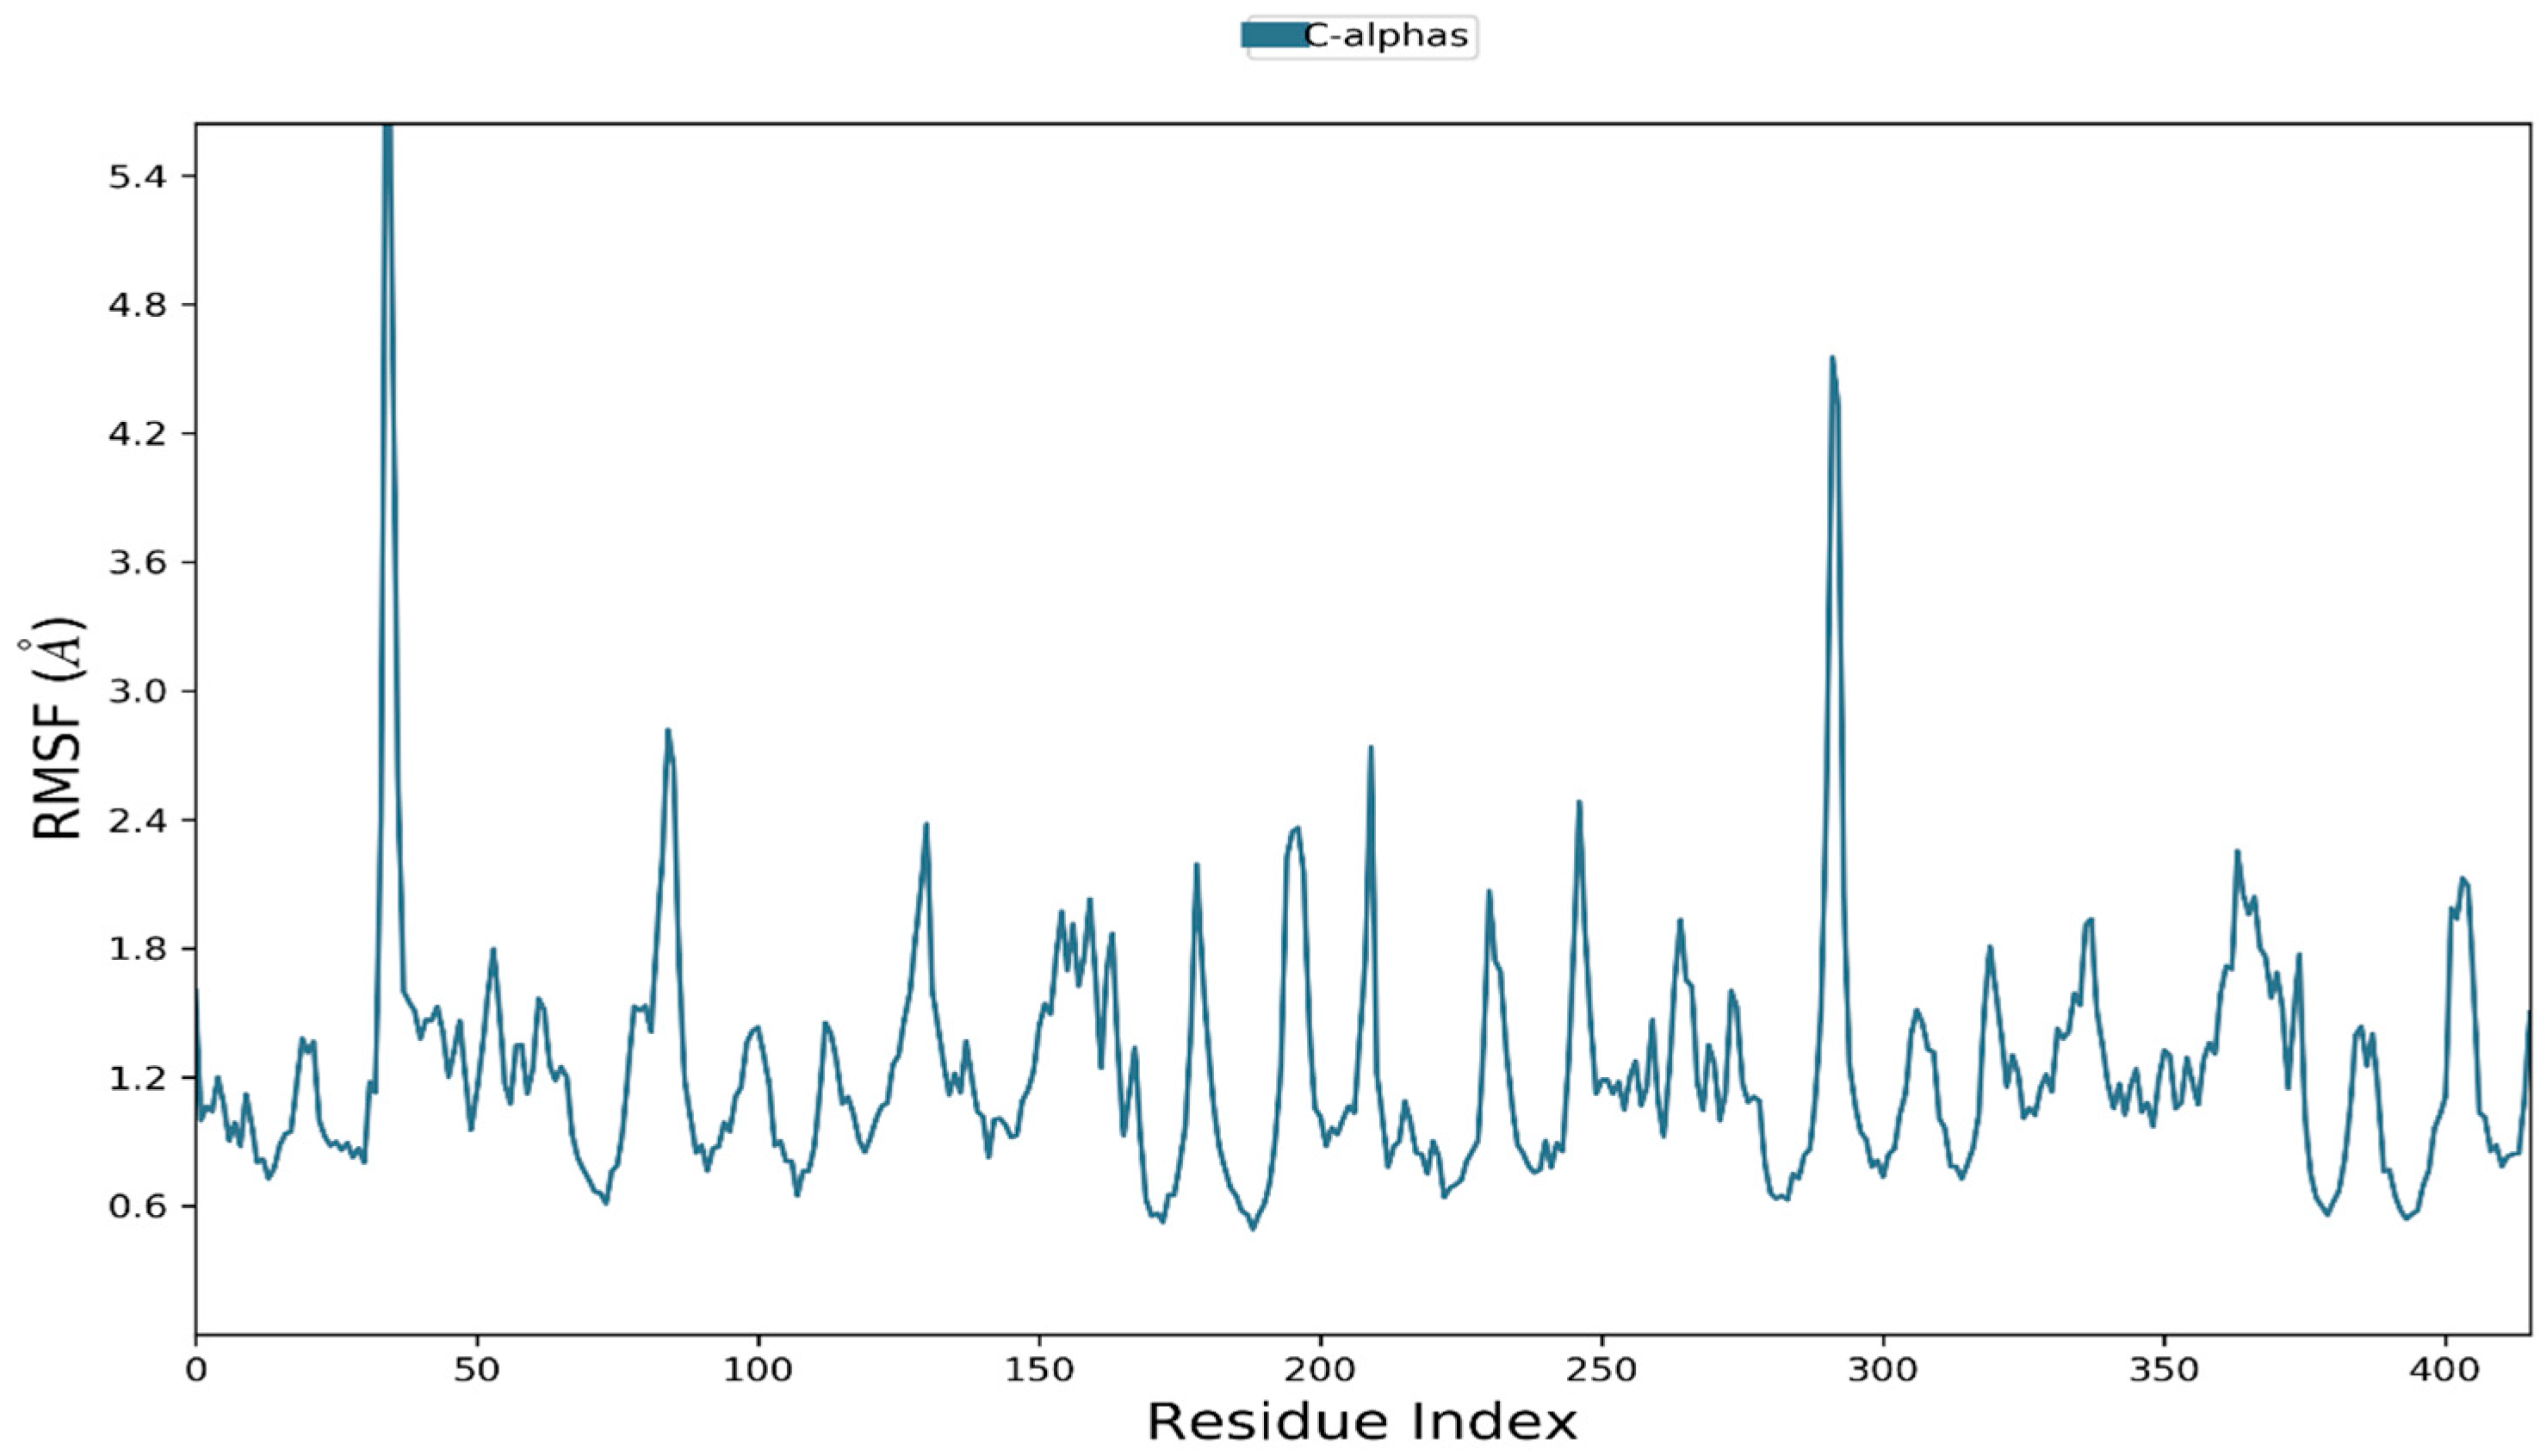
This means that a ligand is keeping the pocket stable in a mechanical way. The stabilization is due to the dense interaction network that is expected to form when the two molecules dock. The scaffold is held in place by three hydrophobic contacts (TYR350, ARG364, and ASP404) and four directional hydrogen bonds (to GLN320, ARG352, and twice to ARG361). A strong π–cation latch with ARG361 keeps the aromatic system in place. The interactions between the different parts of the cavity make it less flexible around the β/loop elements. The low RMSF band near residues ~350–365 and the moderate mobility at 404 show this. There are places where loop flexibility is higher (like distal to the site), but the pocket-lining residues are relatively stable, which means that the ligand is securely positioned and stable in its pose. The 15598 complex (P-RMSF 15598), on the other hand, has clear spikes in some places (like around 30 and 295–300, reaching Å) and, most importantly, the pocket region does not have a uniform attenuation. The baseline is still good (0.8–1.3 Å), but the area around the binding site has bigger and more random changes than 11768. This means that the pocket is more dynamic and can handle micro-rearrangements when 15598 is present. The difference is because it has a more compact docking profile, with one hydrophobic interaction (ARG361), two hydrogen bonds (THR328 and ARG403), one π-cation interaction (ARG361), and one salt bridge to ASP404. A salt bridge can be very strong, but it has limits and can be changed by solvation and side-chain rotamers. This means that it has fewer extra parts than the multivalent network in 11768. The RMSF of 15598 has gone up by about 328–361, which is in line with the random breaking and reformation of these limited connections. This gives local loops more room to move around (see Figure 7).
The RMSF comparison shows that 11768 strengthens the pocket allosterically by using different anchors that are spread out in space (H-bonds, π–cation interactions, and hydrophobic interactions). On the other hand, 15598 only partially stabilizes the pocket by focusing on ARG361 and ASP404. This is not enough to evenly reduce motion throughout the cavity. The dynamic signatures confirm that 11768 is the better binder based on the docking interpretation. When docking shows more and better interactions, RMSF shows less local movement and a binding site that stays stable. But when docking shows fewer, more solvent-exposed contacts (15598), RMSF shows more local plasticity, which means weaker pose enforcement and possibly shorter residence time.

3.2.3. Interaction Analysis of Ligands; 11768 and 15598 in Complex with Phosphoinositide-3-Kinase (PI3K; PDB:1e7u) Receptor Interactions Before and After MD Simulation

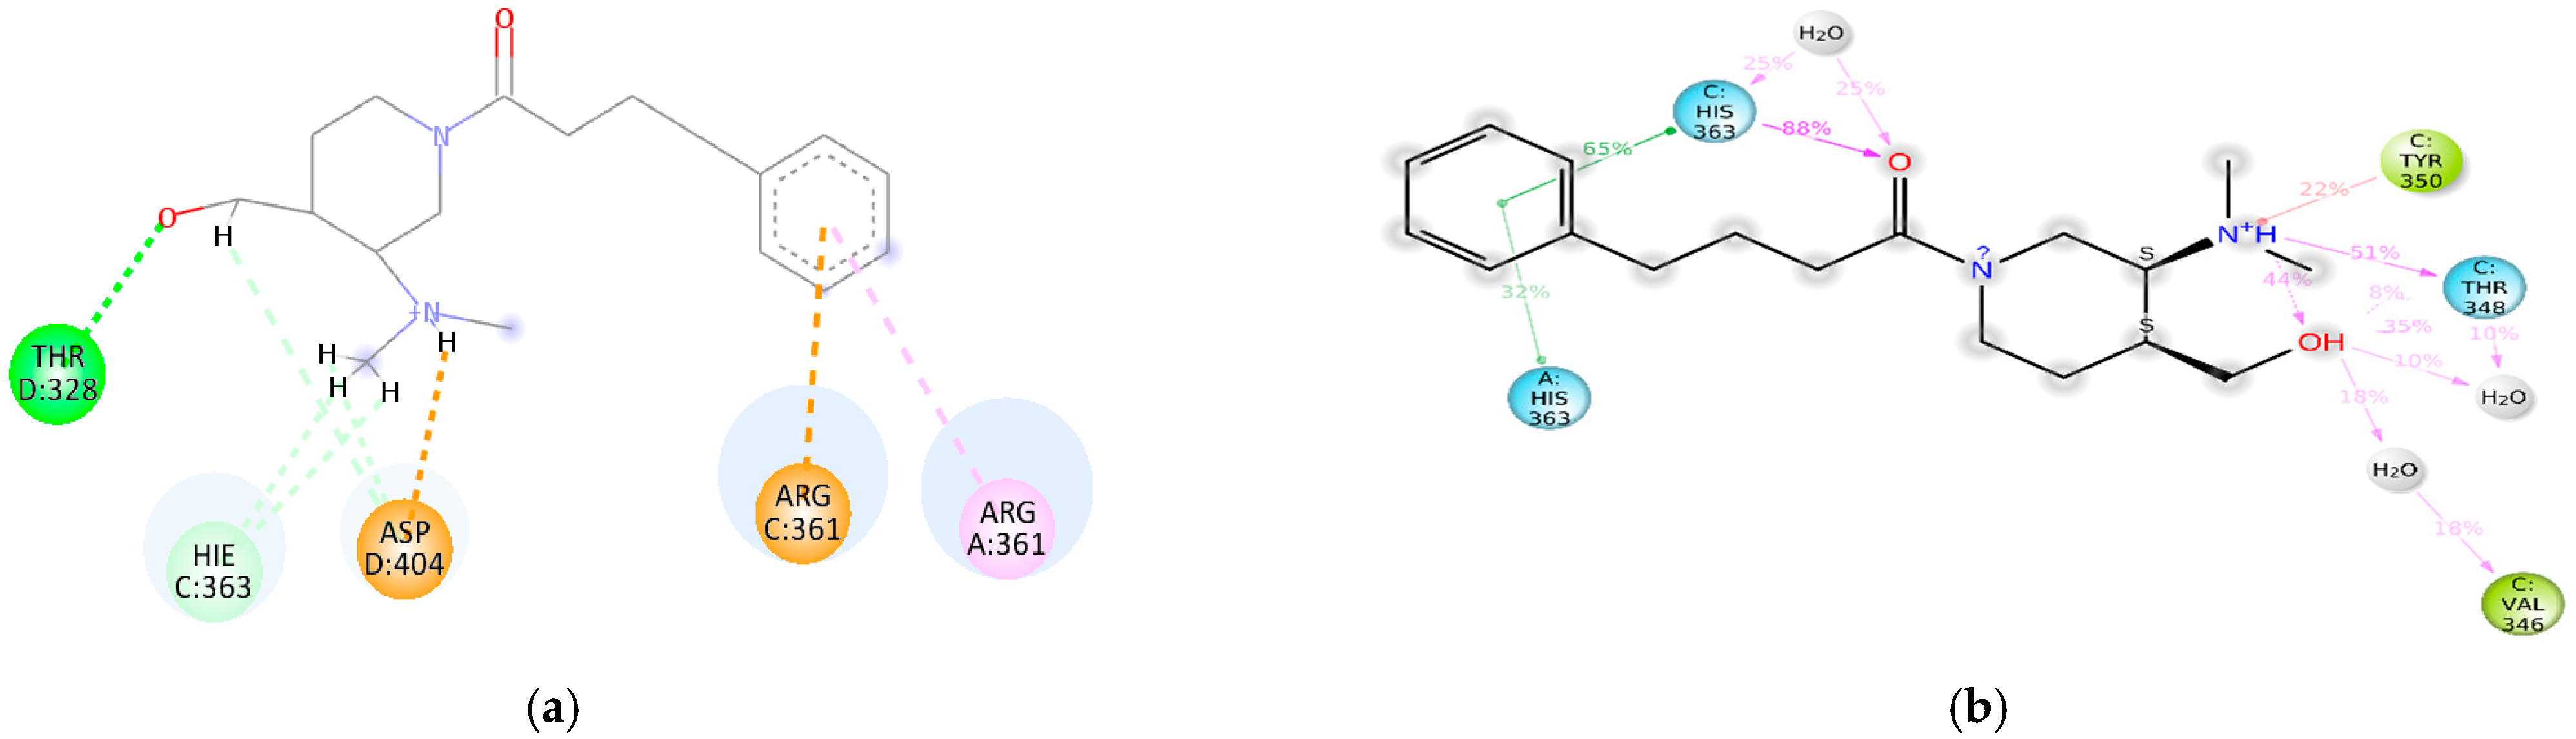
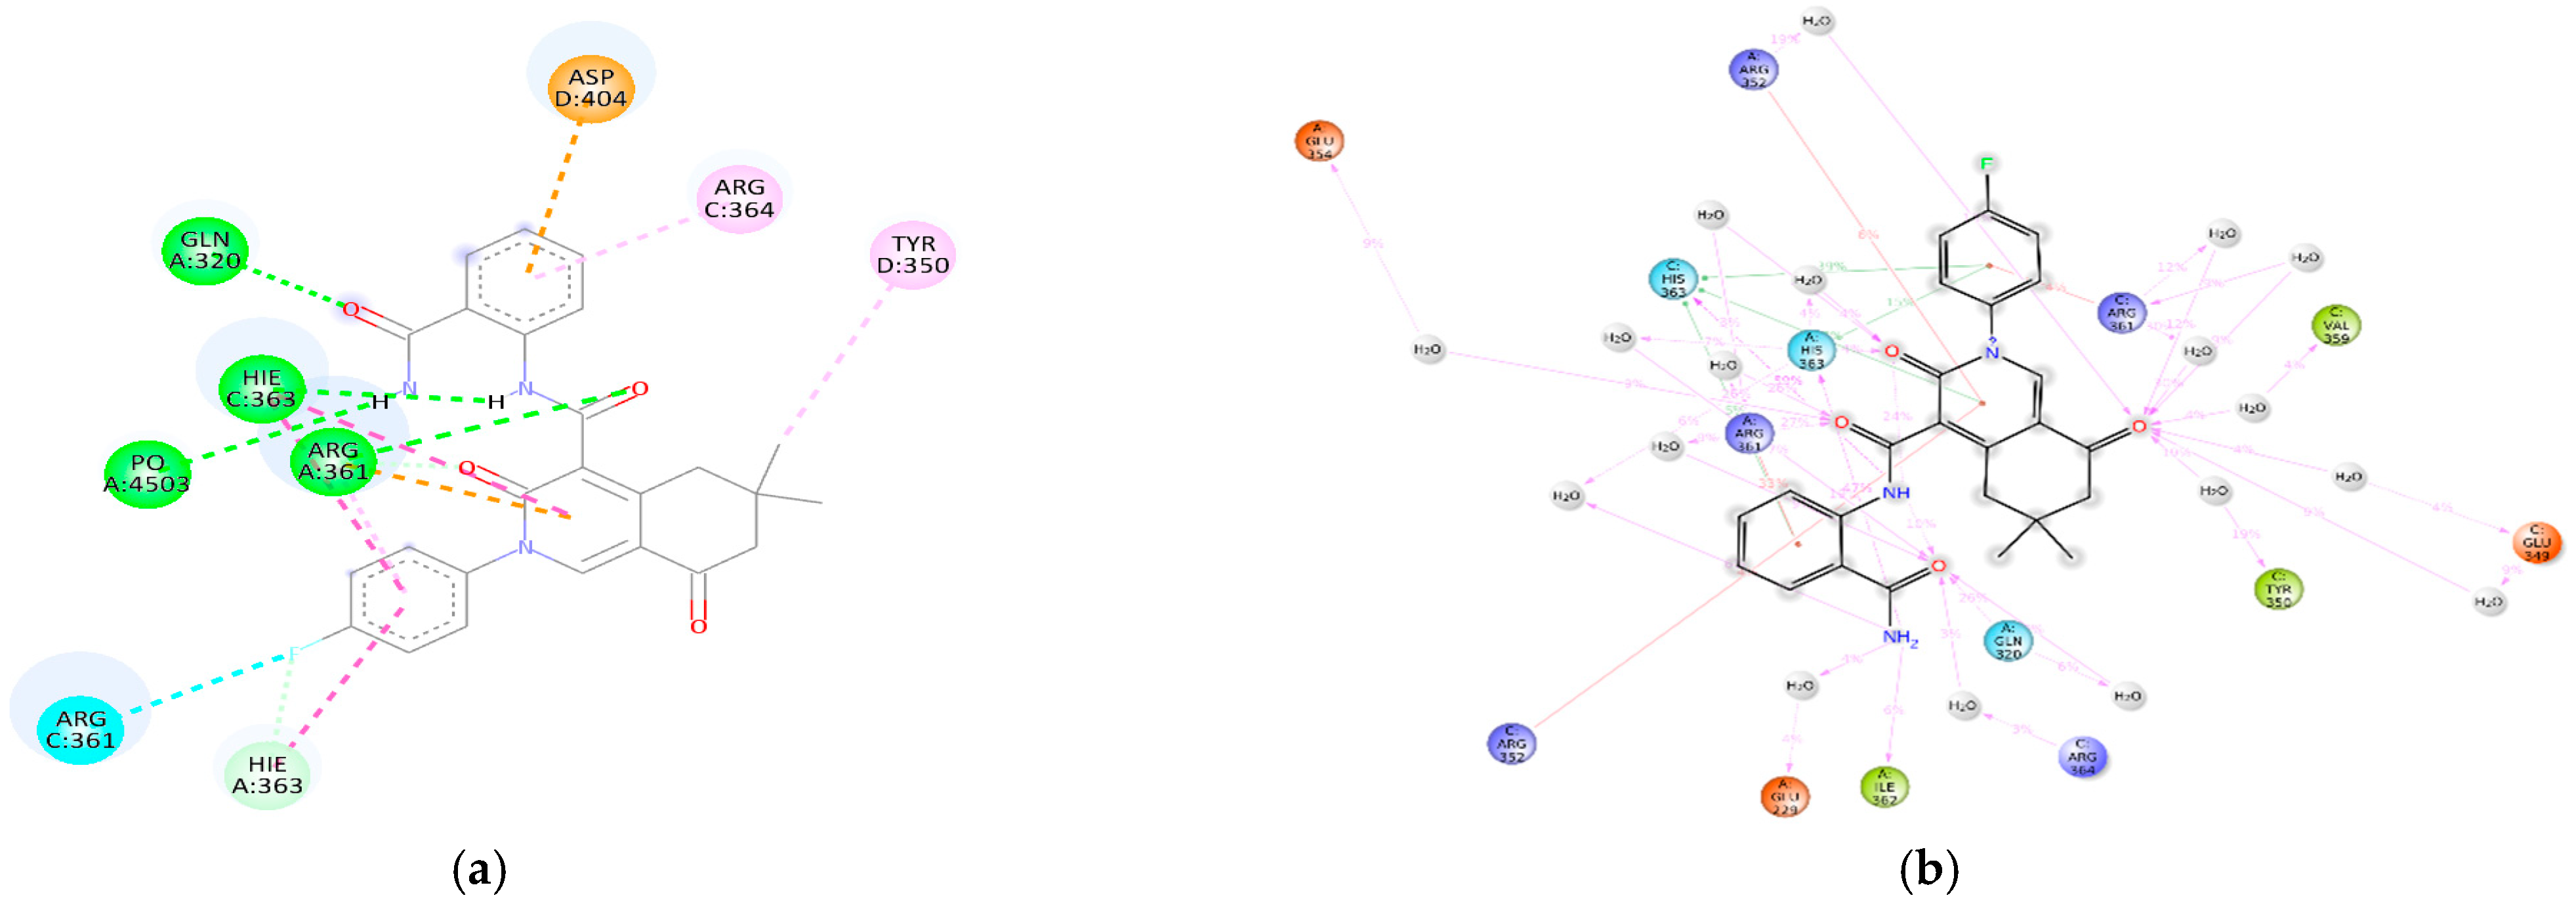
The comparative interaction study conducted before and after 100 ns molecular dynamics shows that ligand 11768 maintains and even improves its expected docking engagement pattern. In contrast, ligand 15598 partially restructures into a more solvent-dependent network with fewer direct connections. The docking of 11768 showed that there was a multivalent anchor in the pocket. This was made up of hydrophobic interactions with TYR350, ARG364, and ASP404; four hydrogen bonds that were best positioned to GLN320, ARG352, and two to ARG361; and a π-cation interaction with ARG361 (see Figure 8).
The post-MD 2D interaction map supports this structure and shows how it fits into a bigger microenvironment. For example, GLN320 and ARG352 have polar interactions that last, ARG361 is a dual electrostatic/π-cation hub, and TYR350/ARG364 stay connected through hydrophobic or edge-to-face contacts. The MD snapshot shows that HIS363 is more active (through aromatic/CH–π interactions and sporadic hydrogen bonding) and that there are bridges made of water that connect to GLU349, VAL359, and nearby residues. These solvent interactions frequently exhibit elevated occupancies, indicating that the ligand utilizes a semi-ordered hydration shell while maintaining its primary, direct interactions. The outcome is an unnecessary, regionally spread contact network that matches the previously mentioned damped RMSF between 320 and 365/404 and the compact ligand RMSD envelope. Both of these things show that the conformation is “locked” in place but can still move around inside the pocket. On the other hand, docking for 15598 expected a more streamlined set of anchors. There was one hydrophobic interaction (ARG361), two hydrogen bonds (THR328 and ARG403), a π-cation interaction with ARG361, and a salt bridge to ASP404 (see Figure 9).
The 2D map shows a clear change after MD. Most of the interactions are now focused on HIS363, which has strong hydrophobic/aromatic contacts and frequent carbonyl interactions. The cationic head group has temporary hydrogen bonds with THR348/TYR350 and interacts with nearby water molecules that connect to VAL346. This setup is held up by several water bridges (10% to 50%), but the original direct hydrogen bonds to THR328/ARG403 and the ASP404 salt bridge are either weak or not there at all. This suggests that the ARG361/ASP404 axis has moved slightly. This redistribution effectively substitutes robust, elongated tethers with a reduced number of direct anchors and solvent mediation. This fits with what was said before about the rise in multi-basin ligand RMSD and the less even RMSF drop in the binding corridor. The difference between before and after is clear: 11768 keeps its docking shape and makes it more stable by interacting with both canonical (GLN320/ARG352/ARG361/TYR350/ARG364) and auxiliary (HIS363, structured waters) molecules. This makes a strong network of interactions. On the other hand, 15598 is still compatible with the site, but it moves toward a water-assisted, HIS363-centered theme with less electrostatic binding. This is why it is less stable and more flexible overall. The MD-refined interaction patterns indicate that 11768 is the superior binder and imply that enhancing direct interactions (for instance, by engineering substitutions to restore ARG361/ASP404 engagement) could significantly augment 15598’s residence time and affinity.

4. ADME Study

Ligands 11678 and 15598 are great for studying ADME (Absorption, Distribution, Metabolism, and Excretion) because they have strong structural, physicochemical, and rule-based drug-likeness profiles that can help you figure out if they can be taken by mouth. There are 22 heavy atoms and 6 aromatic atoms in ligand 15598, which weighs 305.44 Da. Because it has a high sp3 carbon percentage (0.61), it is more complicated and three-dimensional. This helps the receptor stick and lowers the risk of side effects. The molecule is flexible because it has seven bonds that can move. It has some polarity because it has two hydrogen bond donors and two hydrogen bond acceptors. This means that it might dissolve in water without making the membrane less permeable. Ligand 15598 follows Lipinski’s Rule of Five and the rules set by Ghose, Veber, Egan, and Muegge. It does not break any of these rules. Its bioavailability score of 0.55 means that the body can only use it moderately well after it is taken by mouth. There are no PAINS or Brenk warnings, so false-positive activity and toxicophoric traits are not common. It can be done in a lab because synthetic accessibility is 2.98. Ligand 15598 is a good choice for ADME because it dissolves, passes through membranes, and stays stable during metabolism. That is why it would make a great medicine. Ligand 11678 is on the ADME screening shortlist because it meets the drug-likeness requirements. It does not break any pharmacokinetic rules because its molecular weight is between 200 and 500 Da and it does not have a lot of hydrogen bond donors or acceptors. 11678 could be a lead molecule without PAINS or Brenk warnings, just like ligand 15598. It is easy to make ligand 15598, and it dissolves and moves through membranes easily. Ligand 11678 may show better selectivity for binding or stability in the body because of its structure or pharmacological properties. These ligands demonstrate that in silico ADME tests may select compounds prior to costly in vitro or in vivo evaluations. This makes it easier to find safe, effective drugs that can be taken by mouth. Ligand 15598 is the best “lead-like” precursor because it has a lower molecular weight (MW 305.44 vs. 447.46 for 11768), fewer aromatic heavy atoms (6 vs. 18), and a higher three-dimensionality (Fraction Csp3 0.61). These things usually make promiscuity worse and selection better. It has seven rotatable bonds instead of five, which makes it more flexible and able to fit different shapes while still following the Veber/Egan rules. The polar surface area (TPSA 44.98 Å2) makes it easier for things to pass through and be absorbed by the mouth. There are no lead-likeness violations in 15598, and it has a great score of 2.98 for synthetic accessibility. It also does not break any of the Lipinski/Ghose/Veber/Egan/Muegge rules, have any PAINS/Brenk warnings, or show any signs of CYP inhibition in 1A2/2C19/2C9/2D6/3A4. All of this lowers the risks and liabilities of DMPK and DDI. Ligand 11768 is a drug-like molecule that does not break any Lipinski/Ghose/Veber/Egan/Muegge rules. It has a potency-optimized profile with a higher molecular weight, aromaticity, and topological polar surface area (111.26 Å2). This means it can better tell polar molecules apart, but people are worried about how well it can get through cells and P-glycopenia. There is one lead-likeness violation and a small rise in synthetic accessibility (3.41). Unlike 15598, which is all No, 11768 is likely to stop CYP (2C19, 2C9, 3A4 = Yes), which increases the risk of DDI and metabolic problems. But compound 11768 cannot cross membranes as easily because it has a higher TPSA, even though it has higher lipophilicity markers (iLOGP/XLOGP3/WLOGP/MLOGP). But Compound 15598 has a moderate lipophilicity and a low TPSA, which makes it easier for the skin to soak up and spread out on its own. This makes the negative log Kp for 15598 go up. In conclusion, compound 15598 is the best primary lead for quick in vivo progress with little chance of ADME. Compound 11768 is a good scaffold for firmly attaching to aromatic pockets and speeding up metabolism. However, its permeability and CYP liability may need to be lowered by changing its polarity, heteroatom distribution, or soft spot (see Supplementary Table S1 for ADMET results and Table S2 for MMGBSA results).

5. PCA and Free Energy Landscape Study of Ligand 11768

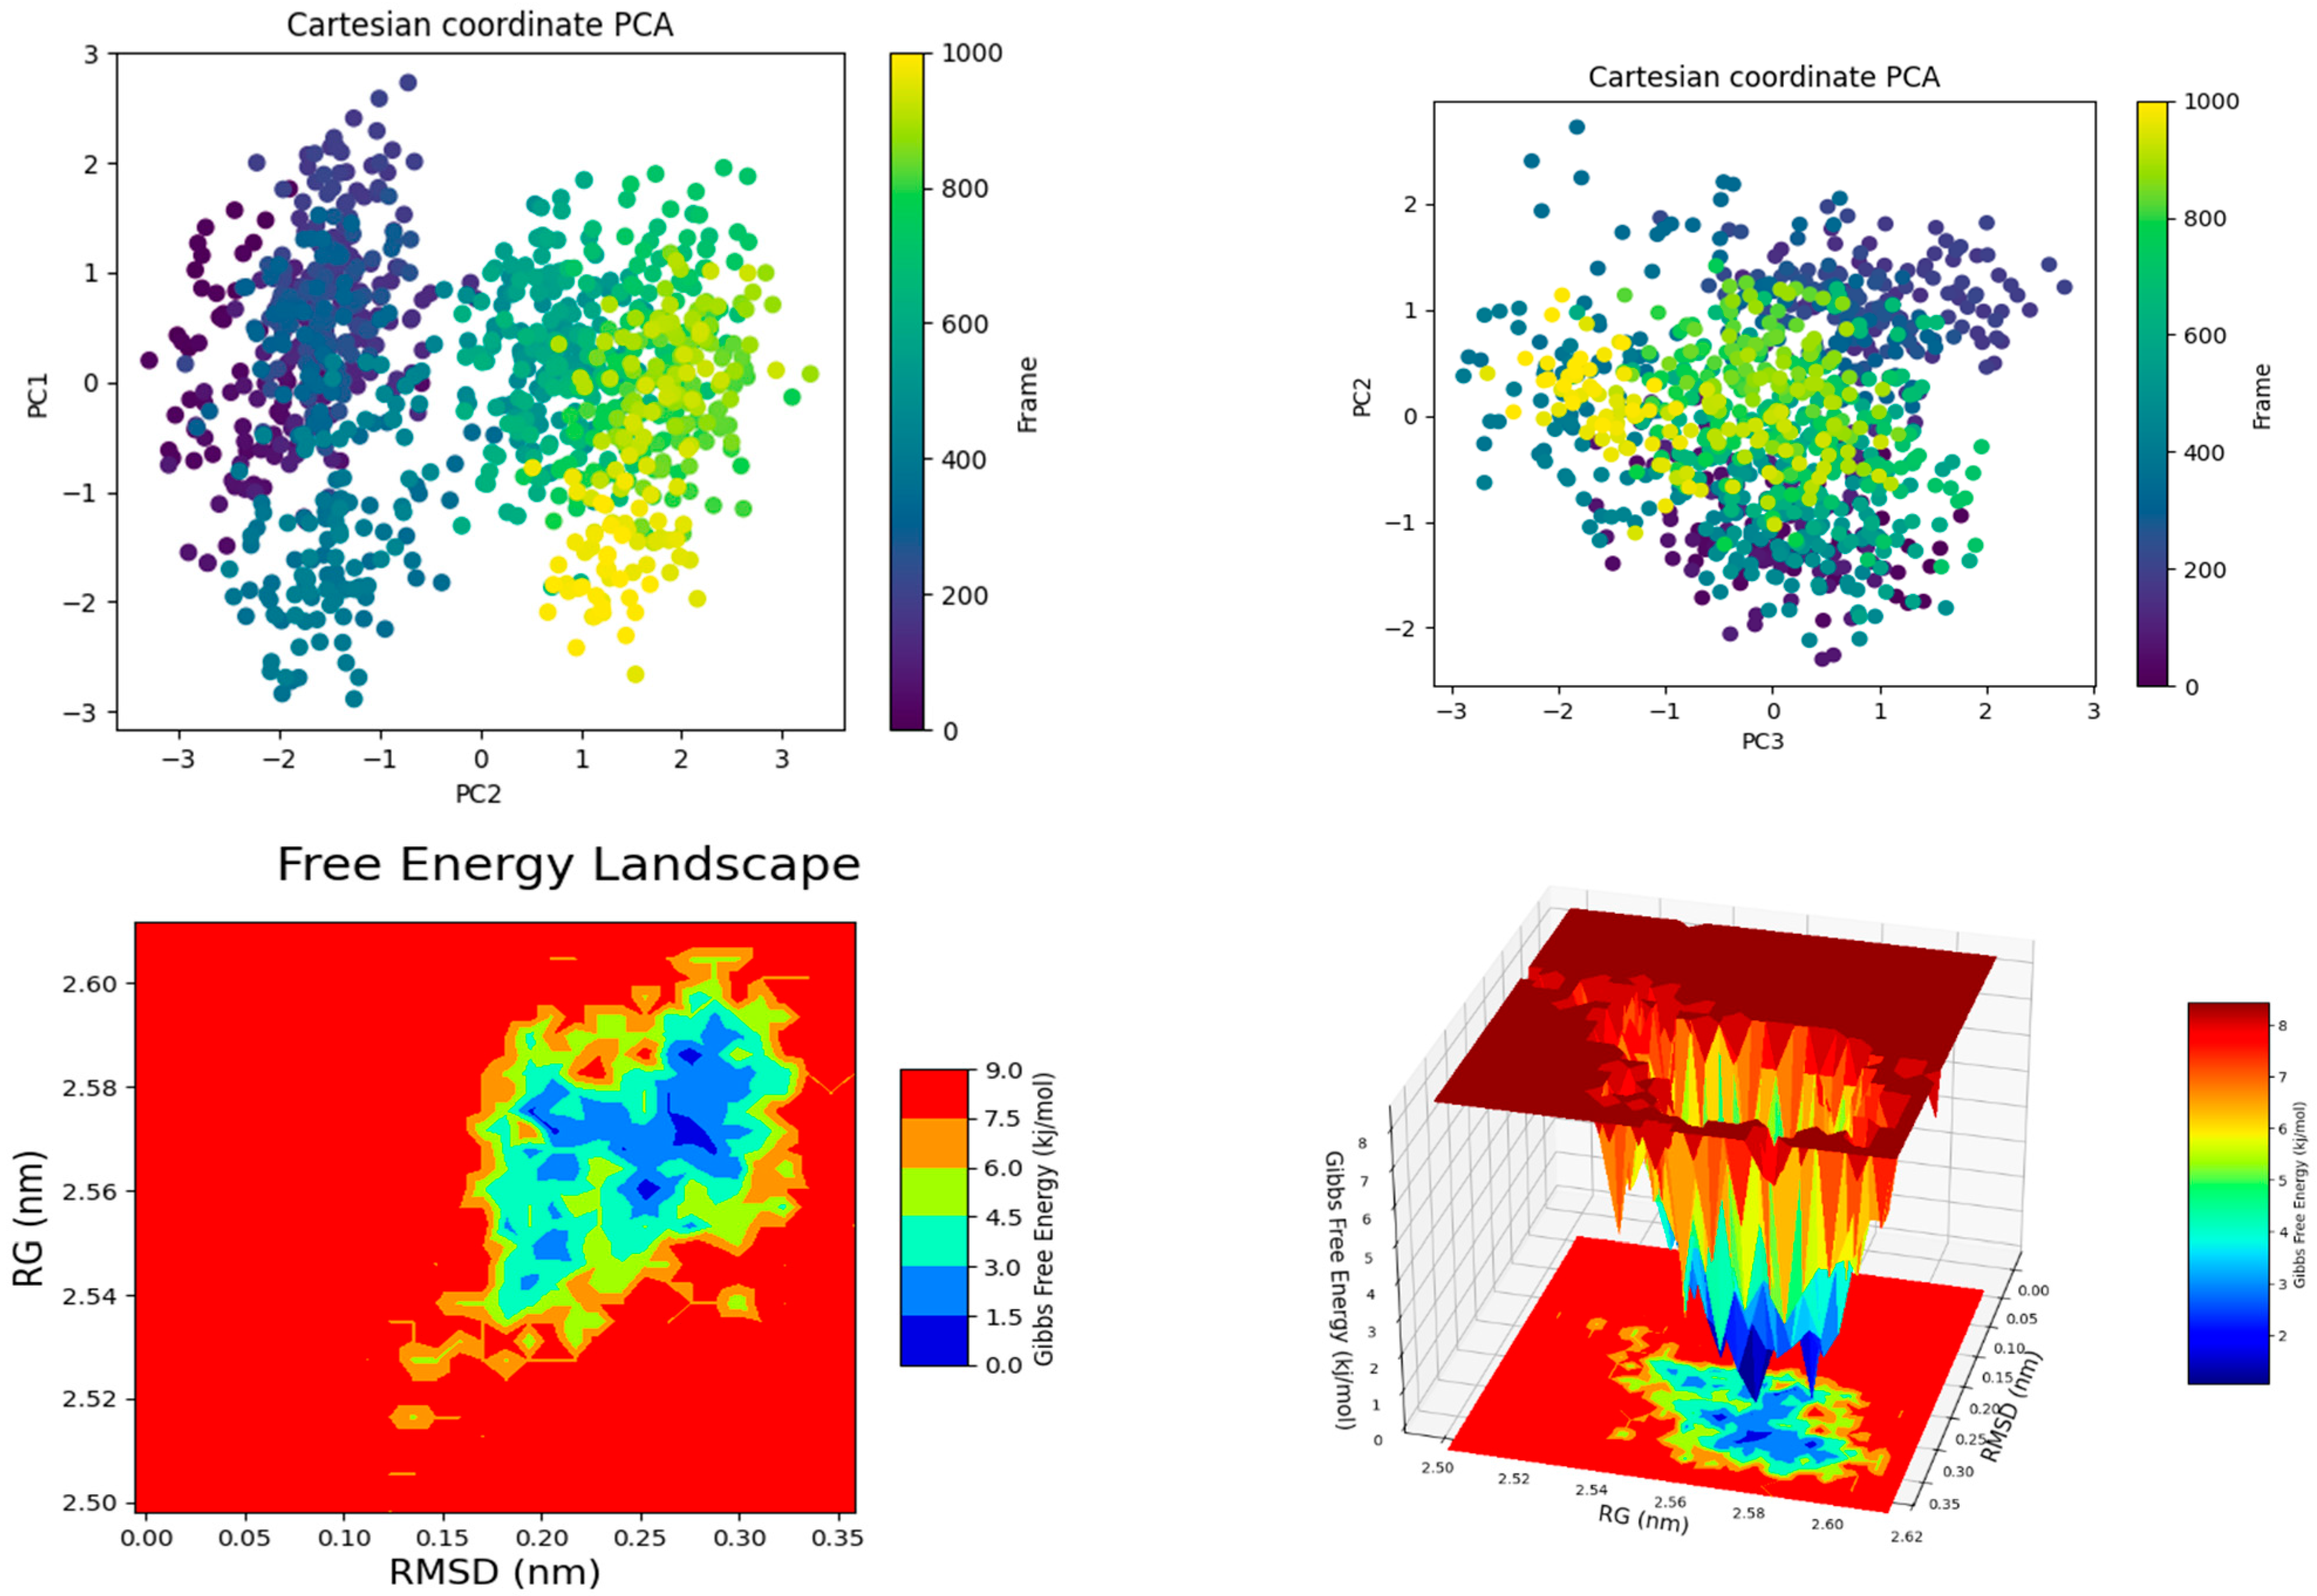
The principal component analysis (PCA) and free energy landscape (FEL) examination of ligand 11768 alongside its target protein provides substantial insights into the conformational dynamics and stability of the system during molecular dynamics simulation. The PCA, which was based on changes in Cartesian coordinates, showed that the first two principal components (PC1 and PC2) captured most of the changes in conformation. These components clearly divided conformational clusters. The PC1–PC2 projection showed two very close basins, which confirmed that there were separate metastable states. The PC2–PC3 projection, on the other hand, showed a wider distribution, which showed that states could change shape between adjacent states. The way the ligands are grouped together shows that ligand 11768 changes its shape during the simulation, moving between compact and slightly larger shapes in the protein-binding pocket (see Figure 10).
The free energy landscape supports this even more. The 2D FEL (RMSD vs. radius of gyration, Rg) shows a strong low-energy basin with RMSD values between 0.20 and 0.25 nm and Rg values between 2.55 and 2.58 nm. This means that the complex is in a stable shape that gives it more energy. The 3D FEL supports this by showing a clear global minimum well with higher-energy barriers around it that keep the system in a small conformational space. This indicates that ligand 11768 possesses a relatively stable binding mode. The protein and ligand both have stable structures over the 100 ns trajectory when compared to the RMSD time evolution. The protein Cα RMSD slowly goes up to about 2.5–3.0 Å and then levels off. The ligand RMSD stays between 2.0 and 3.5 Å. This means that the ligand stays tightly bound while the pocket makes small changes. The FEL’s areas of lowest Gibbs free energy are important because they match up with the RMSD plateau phase. This shows that the tested equilibrium conformations are energetically favorable binding states. The PCA clusters’ slight flexibility is in line with ligand 11768’s physicochemical profile. This is because it has a lot of aromatic compounds and a polar surface area, which lets it interact in many ways while keeping the core binding stable. PCA shows that there is only a little conformational sampling with preferred metastable states. The FEL maps show a strong global minimum that shows a stable binding conformation, and the RMSD trends show that the protein-ligand stability stays the same. This comprehensive study demonstrates that ligand 11768 possesses a precisely defined, energetically favorable binding conformation with constrained yet significant conformational adaptability. This balance is good for strong binding, but it also lets the protein pocket change shape over time.

6. PCA and Free Energy Landscape Study of Ligand 15598

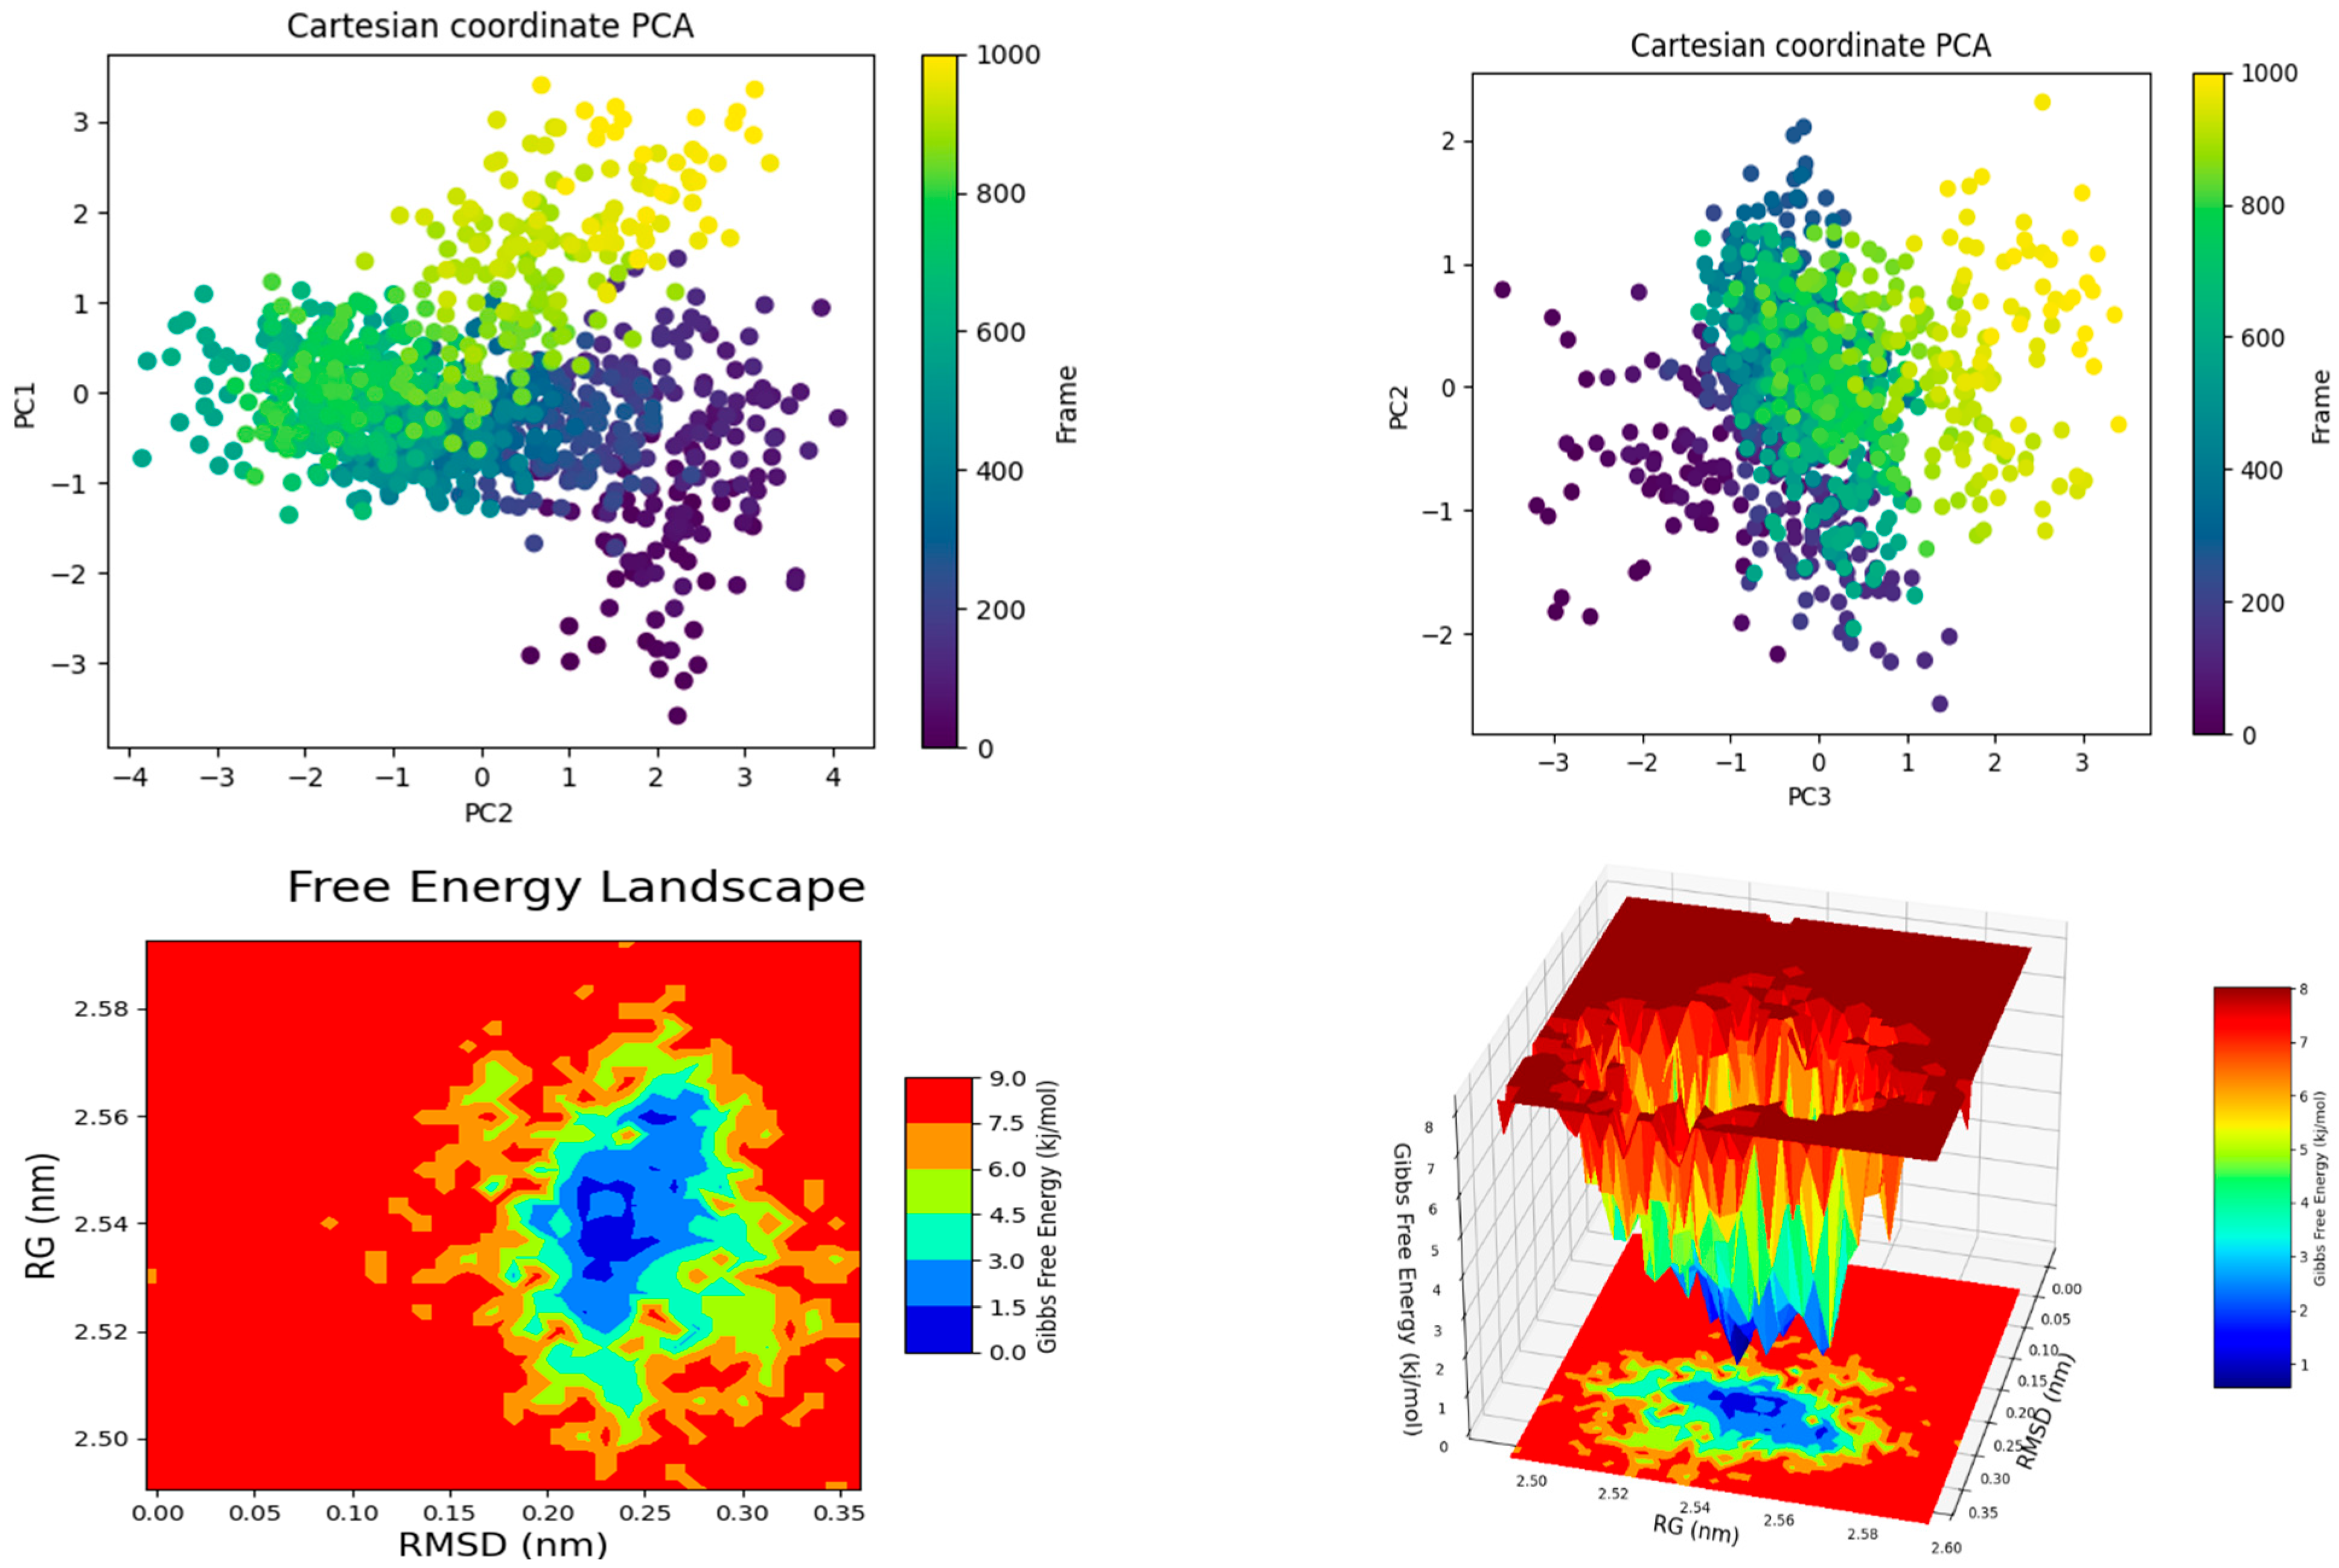
Principal component analysis (PCA) and free energy landscape (FEL) profiling were used to look at the conformational dynamics of ligand 15598 in relation to its target protein. The results were then linked to root mean square deviation (RMSD) trajectories. The component analysis of Cartesian coordinate fluctuations showed that the system’s dynamics are mostly shown in the first two main components (see Figure 11).
The PC1–PC2 projection shows a clear separation of clusters, which suggests that ligand 15598 explores two main conformational states during the simulation. The states are successively occupied along the route, as evidenced by the color progression of frames, indicating dynamic transitions between metastable conformations rather than confinement to a singular basin. The PC2–PC3 projection, on the other hand, has a more spread-out distribution, which means that there are intermediate structural changes without clear cluster boundaries. The FEL plotted against RMSD, and radius of gyration (Rg) shows a single global energy minimum at RMSD values of about 0.20–0.28 nm and Rg values of about 2.53–2.57 nm. There are also shallow local minima around this basin. The 3D FEL surface supports this by showing a deep, funnel-shaped well, which shows that a stable conformational ensemble is in charge and that ligand 15598 is safely inside the binding pocket. The free energy landscape (FEL) of 15598 shows that it is slightly more adaptable in terms of shape than ligand 11768. This is shown by the fact that the energy contours are wider but shallower, which means that the ligand is more flexible and has a higher sp3-rich composition. The RMSD analysis supports this interpretation: The protein Cα RMSD stabilizes between 2.2 and 3.0 Å after the first 20 ns, while the ligand RMSD changes between 3.0 and 6.5 Å. This means that the ligand stays attached to the binding site while it moves around in conformational space, dynamically reorienting to keep beneficial interactions. The RMSD plateaus match the free energy minima in the FEL, which means that the most energetically favorable states are also the ones where the binding conformations are stable.

7. Conclusions

In conclusion, this integrative computational study has shown that rational structure-based methods can successfully find strong, drug-like inhibitors of TEAD proteins in the Hippo signaling pathway, which is an important target in cancer progression and tumorigenesis. Using high-throughput virtual screening of the ChemDiv natural product library, eight compounds with good docking scores were chosen. Then, ADMET profiling showed that all of the candidates followed Lipinski’s rules, which means they have a lot of potential for oral bioavailability. Among these, ligands 11768 and 15598 were identified as the foremost candidates, exhibiting notably advantageous pharmacokinetic characteristics, such as impermeability to the blood-brain barrier and lack of P-glycoprotein substrate liability, consequently minimizing central nervous system exposure and the risk of multidrug resistance. Comprehensive docking interaction analyses demonstrated that compound 11768 exhibited an exceptional binding profile, characterized by numerous stabilizing hydrogen bonds with GLN320, ARG352, and ARG361, extensive hydrophobic interactions with TYR350, ARG364, and ASP404, and a robust π–cation interaction with ARG361, culminating in a significantly negative MMGBSA binding free energy (ΔGbind = −55.86 kcal/mol). On the other hand, compound 15598 had a more limited interaction spectrum. It relied on fewer hydrogen bonds, had fewer hydrophobic contacts, only one π–cation interaction, and a salt bridge to ASP404. This made it less favorable, with a ΔGbind of −45.90 kcal/mol, which shows that 11768 has a stronger affinity. Molecular dynamics simulations confirmed these results, showing that ligand 11768 maintained stable conformations with little change in RMSD, which meant that it was always interacting with the binding site. On the other hand, ligand 15598 showed more conformational variability and partial disengagement throughout the trajectory, which was in line with its lower binding stability. RMSF analysis showed that ligand 11768 significantly decreased local flexibility in the binding corridor, showing that the pocket-lining residues were mechanically stable. On the other hand, ligand 15598 allowed for more plasticity, showing that the interaction network was more flexible. Complementary PCA and FEL analyses confirmed that 11768 occupied deep global energy minima with restricted conformational transitions, indicating a highly favored binding mode, whereas 15598 navigated broader conformational states with multiple shallow minima, implying enhanced flexibility but reduced stability. ADME tests showed that compound 15598, which had a lower molecular weight, more sp3 character, and better solubility, was a better “lead-likeness” and had lower risks of metabolic liability. On the other hand, compound 11768 had a higher binding affinity, but it also had the potential to inhibit CYP and cause moderate permeability problems. The findings reveal two outcomes: compound 11768 functions as a high-affinity scaffold with exceptional binding stability, positioning it as an optimal candidate for optimization as a potent TEAD inhibitor; conversely, compound 15598 offers improved pharmacokinetic balance and synthetic accessibility, establishing it as a more druggable “lead-like” candidate for expedited translational advancement. The synergistic strengths of these molecules underscore the imperative to integrate binding energetics, conformational dynamics, and pharmacokinetic profiling during the preliminary stages of drug discovery, thereby creating a robust foundation for preclinical validation and optimization of TEAD-targeted therapeutics. This paper presents a framework for accelerating the development of TEAD inhibitors, a novel category of anticancer agents targeting the Hippo pathway, by demonstrating that scaffolds derived from natural products can achieve both stability and drug-likeness through systematic computational screening.

Supplementary Materials

The following supporting information can be downloaded at: https://www.mdpi.com/article/10.3390/ecsoc-29-26882/s1, Table S1: ADMET results; Table S2: Portrayal of MMGBSA results for the ligand 15598.

Author Contributions

P.R.B. and R.D.J. conceived and supervised this study. R.D.J. and P.V.B. accomplished drafting and review. P.R.B. and P.N.K. collected and curated the data. R.D.J. and P.V.B. processed the data and analysed the results. All authors have read and agreed to the published version of the manuscript.

Funding

This research received no external funding.

Institutional Review Board Statement

Not applicable.

Informed Consent Statement

Not applicable.

Data Availability Statement

Data will be made available upon request.

Acknowledgments

Authors are thankful to Yogendraji Gode, IBBS’S Buldana, Rajendra Gode Institute of Pharmacy, Amravati for extended support during entire course of research work.

Conflicts of Interest

Authors declares no conflict of interest.

References

  1. Hansen, C.G.; Moroishi, T.; Guan, K.-L. YAP and TAZ: A nexus for Hippo signaling and beyond. Trends Cell Biol. 2015, 25, 499–513. [Google Scholar] [CrossRef]
  2. Moya, I.M.; Halder, G. Hippo–YAP/TAZ signalling in organ regeneration and regenerative medicine. Nat. Rev. Mol. Cell Biol. 2018, 20, 211–226. [Google Scholar] [CrossRef] [PubMed]
  3. Zhao, B.; Tumaneng, K.; Guan, K.-L. The Hippo pathway in organ size control, tissue regeneration and stem cell self-renewal. Nat. Cell Biol. 2011, 13, 877–883. [Google Scholar] [CrossRef]
  4. Harvey, K.F.; Zhang, X.; Thomas, D.M. The Hippo pathway and human cancer. Nat. Rev. Cancer 2013, 13, 246–257. [Google Scholar] [CrossRef]
  5. Pan, D. The Hippo Signaling Pathway in Development and Cancer. Dev. Cell 2010, 19, 491–505. [Google Scholar] [CrossRef]
  6. Jureka, A.S.; Kleinpeter, A.B.; Cornilescu, G.; Cornilescu, C.C.; Petit, C.M. Structural Basis for a Novel Interaction between the NS1 Protein Derived from the 1918 Influenza Virus and RIG-I. Structure 2015, 23, 2001–2010. [Google Scholar] [CrossRef] [PubMed]
  7. Wei, T.; Liu, H.; Chu, B.; Blasco, P.; Liu, Z.; Tian, R.; Li, D.X.; Li, X. Phosphorylation-regulated HMGA1a-P53 interaction unveils the function of HMGA1a acidic tail phosphorylations via synthetic proteins. Cell Chem. Biol. 2021, 28, 722–732.e8. [Google Scholar] [CrossRef] [PubMed]
  8. Lin, K.C.; Park, H.W.; Guan, K.-L. Regulation of the Hippo Pathway Transcription Factor TEAD. Trends Biochem. Sci. 2017, 42, 862–872. [Google Scholar] [CrossRef]
  9. Holden, J.K.; Cunningham, C.N. Targeting the Hippo Pathway and Cancer through the TEAD Family of Transcription Factors. Cancers 2018, 10, 81. [Google Scholar] [CrossRef]
  10. Amadei, A.; Linssen, A.B.M.; Berendsen, H.J.C. Essential dynamics of proteins. Proteins Struct. Funct. Bioinform. 2004, 17, 412–425. [Google Scholar] [CrossRef]
  11. Hollingsworth, S.A.; Dror, R.O. Molecular Dynamics Simulation for All. Neuron 2018, 99, 1129–1143. [Google Scholar] [CrossRef]
  12. Barducci, A.; Bussi, G.; Parrinello, M. Well-Tempered Metadynamics: A Smoothly Converging and Tunable Free-Energy Method. Phys. Rev. Lett. 2008, 100, 020603. [Google Scholar] [CrossRef]
  13. Daina, A.; Michielin, O.; Zoete, V. SwissADME: A free web tool to evaluate pharmacokinetics, drug-likeness and medicinal chemistry friendliness of small molecules. Sci. Rep. 2017, 7, 42717. [Google Scholar] [CrossRef]
  14. Newman, D.J.; Cragg, G.M. Natural products as sources of new drugs over the nearly four decades from 01/1981 to 09/2019. J. Nat. Prod. 2020, 83, 770–803. [Google Scholar] [CrossRef]
  15. Cheng, F.; Li, W.; Zhou, Y.; Shen, J.; Wu, Z.; Liu, G.; Lee, P.W.; Tang, Y. admetSAR: A Comprehensive Source and Free Tool for Assessment of Chemical ADMET Properties. J. Chem. Inf. Model. 2012, 52, 3099–3105. [Google Scholar] [CrossRef]
  16. Morris, G.M.; Huey, R.; Olson, A.J. Using AutoDock for Ligand-Receptor Docking. Curr. Protoc. Bioinform. 2008, 24, 8–14. [Google Scholar] [CrossRef] [PubMed]
  17. Morris, G.M.; Huey, R.; Lindstrom, W.; Sanner, M.F.; Belew, R.K.; Goodsell, D.S.; Olson, A.J. AutoDock4 and AutoDockTools4: Automated docking with selective receptor flexibility. J. Comput. Chem. 2009, 30, 2785–2791. [Google Scholar] [CrossRef] [PubMed]
  18. Walker, E.H.; Pacold, M.E.; Perisic, O.; Stephens, L.; Hawkins, P.T.; Wymann, M.P.; Williams, R.L. Structural determinants of phosphoinositide 3-kinase inhibition by wortmannin, LY294002, quercetin, myricetin, and staurosporine. Mol. Cell 2000, 6, 909–919. [Google Scholar] [CrossRef]
  19. Halgren, T.A. Merck molecular force field. I. Basis, form, scope, parameterization, and performance of MMFF94. J. Comput. Chem. 1996, 17, 490–519. [Google Scholar] [CrossRef]
  20. Laskowski, R.A.; Swindells, M.B. LigPlot+: Multiple ligand–protein interaction diagrams for drug discovery. J. Chem. Inf. Model. 2011, 51, 2778–2786. [Google Scholar] [CrossRef]
  21. Jorgensen, W.L.; Maxwell, D.S.; Tirado-Rives, J. Development and Testing of the OPLS All-Atom Force Field on Conformational Energetics and Properties of Organic Liquids. J. Am. Chem. Soc. 1996, 118, 11225–11236. [Google Scholar] [CrossRef]
  22. Hoover, W.G. Canonical dynamics: Equilibrium phase-space distributions. Phys. Rev. A 1985, 31, 1695–1697. [Google Scholar] [CrossRef]
  23. Nosé, S. A molecular dynamics method for simulations in the canonical ensemble. Mol. Phys. 2006, 52, 255–268. [Google Scholar] [CrossRef]
  24. Bowers, K.J.; Sacerdoti, F.D.; Salmon, J.K.; Shan, Y.; Shaw, D.E.; Chow, E.; Xu, H.; Dror, R.O.; Eastwood, M.P.; Gregersen, B.A.; et al. Scalable Algorithms for Molecular Dynamics Simulations on Commodity Clusters. In Proceedings of the 2006 ACM/IEEE Conference on Supercomputing—SC ’06, Tampa, FL, USA, 11–17 November 2006. [Google Scholar]
  25. Jorgensen, W.L.; Chandrasekhar, J.; Madura, J.D.; Impey, R.W.; Klein, M.L. Comparison of simple potential functions for simulating liquid water. J. Chem. Phys. 1983, 79, 926–935. [Google Scholar] [CrossRef]
  26. Kumar, S.; Rosenberg, J.M.; Bouzida, D.; Swendsen, R.H.; Kollman, P.A. THE weighted histogram analysis method for free-energy calculations on biomolecules. I. The method. J. Comput. Chem. 2004, 13, 1011–1021. [Google Scholar] [CrossRef]
  27. Grant, B.J.; Rodrigues, A.P.; ElSawy, K.M.; McCammon, J.A.; Caves, L.S. Bio3d: An R package for the comparative analysis of protein structures. Bioinformatics 2006, 22, 2695–2696. [Google Scholar] [CrossRef] [PubMed]
  28. Wang, E.; Sun, H.; Wang, J.; Wang, Z.; Liu, H.; Zhang, J.Z.H.; Hou, T. End-Point Binding Free Energy Calculation with MM/PBSA and MM/GBSA: Strategies and Applications in Drug Design. Chem. Rev. 2019, 119, 9478–9508. [Google Scholar] [CrossRef] [PubMed]
  29. Genheden, S.; Ryde, U. The MM/PBSA and MM/GBSA methods to estimate ligand-binding affinities. Expert Opin. Drug Discov. 2015, 10, 449–461. [Google Scholar] [CrossRef]
  30. David, C.C.; Jacobs, D.J. Principal Component Analysis: A Method for Determining the Essential Dynamics of Proteins. In Protein Dynamics; Humana Press: Totowa, NJ, USA, 2014; pp. 193–226. [Google Scholar]
  31. Maisuradze, G.G.; Liwo, A.; Scheraga, H.A. Principal Component Analysis for Protein Folding Dynamics. J. Mol. Biol. 2009, 385, 312–329. [Google Scholar] [CrossRef]
  32. Abraham, M.J.; Murtola, T.; Schulz, R.; Páll, S.; Smith, J.C.; Hess, B.; Lindahl, E. GROMACS: High performance molecular simulations through multi-level parallelism from laptops to supercomputers. SoftwareX 2015, 1–2, 19–25. [Google Scholar] [CrossRef]
Figure 1. Display of 2D structure of ligands; 16956, 726, 5271, 11768, 12384, 15598, 15641, and 3622 identified in molecular docking based virtual screening.
Chemproc 18 00145 g001
Figure 2. Structural representation of the three-dimensional binding interactions between ligand 11768 and TEAD protein (PDB: 2CNL).
Chemproc 18 00145 g002
Figure 3. Depiction of 3D interaction of ligand 15598 with TEAD Protein (pdb:2cnl).
Chemproc 18 00145 g003
Figure 4. RMSD plot for 11768 ligands in complex with the PDB 3CNL.
Chemproc 18 00145 g004
Figure 5. RMSD plot for 15598 ligands in complex with the PDB 3CNL.
Chemproc 18 00145 g005
Figure 6. RMSF plot for 11768 ligands in complex with the PDB 3CNL.
Chemproc 18 00145 g006
Figure 7. RMSF plot for 15598 ligands in complex with the PDB 3CNL.
Chemproc 18 00145 g007
Figure 8. Depiction of 2D interaction of ligand 11768 before and after simulation (a) Ligand 11768 Before Simulation (b) Ligand 11768 After Simulation.
Chemproc 18 00145 g008
Figure 9. Depiction of 2D interaction of ligand 15598 before and after simulation (a) 15598 Before Simulation (b) Ligand 15598 After Simulation.
Chemproc 18 00145 g009
Figure 10. Portrayal of PCA plot and Free energy 2D and 3D plots for the ligand 11768.
Chemproc 18 00145 g010
Figure 11. Portrayal of PCA plot and Free energy 2D and 3D plots for the ligand 15598.
Chemproc 18 00145 g011
Table 1. Presentation of docking interactions for the ligand 11768.
1.1 Hydrophobic Interactions
1350DTYR3.531376812235
2364CARG3.87137669077
3404DASP3.751377013165
1.2 Hydrogen Bonds
1320AGLN1.962.85144.351509 [Nam]13757 [O2]
2352AARG2.993.52115.051993 [Ng+]13756 [O2]
3361AARG3.473.89106.802150 [Ng+]13755 [O2]
4361AARG2.422.98113.732153 [Ng+]13755 [O2]
1.3 π-Cation Interactions
1361AARG3.380.66Aromatic13738, 13739, 13740, 13741, 13742, 13744
Table 2. Presentation of docking interactions for the ligand 15598.
2.1 Hydrophobic Interactions
1361AARG3.56137562147
2.2 Hydrogen Bonds
1328DTHR1.842.78175.5511891 [O3]13750 [O3]
2403DARG3.293.86116.4313743 [N3]13147 [Ng+]
2.3 π-Cation Interactions
1361CARG3.631.65Aromatic13748, 13755, 13756, 13757, 13758, 13759
2.4 Salt Bridges
1404DASP3.45Tertamine13743
Disclaimer/Publisher’s Note: The statements, opinions and data contained in all publications are solely those of the individual author(s) and contributor(s) and not of MDPI and/or the editor(s). MDPI and/or the editor(s) disclaim responsibility for any injury to people or property resulting from any ideas, methods, instructions or products referred to in the content.