Abstract
Merlot red wines rank among the most distinguished varietals globally. This study aimed to characterize the phenolic compound profiles of Merlot wines and assess the influence of geographical origin and vintage on samples from two Albanian wine regions. Using liquid chromatography coupled with tandem mass spectrometry, a total of 31 phenolic compounds were identified and quantified. These were classified into hydroxybenzoic acids and flavan-3-ols (13 compounds), phenolic acids (9), flavonols (5), and stilbenoids (4). The total phenolic content ranged from 294 mg L−1 in wines from the Mati–Mirdita region to 480 mg L−1 in those from the Durrës–Kavaja region, demonstrating significant regional variation. Notably, the hydroxybenzoic acids and flavan-3-ols exhibited the most pronounced differences, with gallic acid concentrations varying from 123 mg L−1 (Mati–Mirdita) to 170 mg L−1 (Durrës–Kavaja). Both regions’ wines were rich in catechin, epicatechin, procyanidin derivatives, trans-caftaric acid, and ethyl gallate. However, procyanidins were found in higher concentrations in the Mati–Mirdita wines, while other phenolics were more abundant in Durrës–Kavaja samples. These findings underscore the influence of geographical and climatic factors on phenolic composition, offering a robust chemical fingerprinting approach for assessing wine authenticity and quality.
Keywords:
Merlot wine; phenolics; catechins; epicatechins; flavonoids; stilbenes; Mediterranean region; Albania 1. Introduction
Vinecultivation and winemaking trace back to early human societies in the Middle East and the Mediterranean basin. The common grape plant, Vitis vinifera L. (Vitaceae) comprises roughly 1000 species, and 15,000 grapevine cultivars. Cultivars such as Merlot are grown worldwide for red wine production [1]. Beyond its two main components—water and ethanol—wine contains over 1600 recognized compounds originating from various grape varieties, with phenolic compounds being the most notable. These phenolics mainly come from grape berries and significantly influence wine quality [2,3].
Phenolic compounds are a diverse group of secondary metabolites found in grapes and wine, recognized for their varied solubility in water and their significant impact on wine composition. These compounds are broadly classified into two main categories: flavonoids and non-flavonoids. The flavonoid group includes a wide range of compounds such as flavan-3-ols, flavonols, flavones, flavanones, flavanonols, isoflavones, anthocyanins, and tannins. Conversely, non-flavonoids encompass phenolic acids, hydroxycinnamates, hydroxybenzoates, coumarins, stilbenes, and lignans [3,4] Biochemically, these compounds are synthesized via the shikimate/phenylpropanoid or polyketide pathways and serve crucial functions in plant growth and reproduction [4]. They may occur freely or as conjugates linked to mono- and polysaccharides, amines, lipids, or organic acids [5].
Various factors, including grape variety, fruit ripeness, climate, soil quality, winemaking techniques, and aging, influence the phenolics levels in wine [6]. Furthermore, phenolics are crucial in determining wine color, flavor, bitterness, and astringency [2]. Gallic acid (GA), the most abundant phenolic compound, is a precursor to all hydrolyzable and condensed tannins, impacting the wine’s astringency [7]. Another significant group, hydroxycinnamic acids (HCAs), is involved in wine browning and serves as precursors to volatile phenolic compounds. Key HCAs found in grapes and wines include caftaric, p-coutaric, and fertaric acid, which exist in two forms: cis- and trans-isomers [8]. Collectively, these compounds encompass a variety of secondary metabolites recognized for their health benefits [9].
Plant polyphenols have garnered increasing attention from the scientific community due to their potent antioxidant properties and significant effects in preventing oxidative-stress-associated diseases [10,11,12]. Consuming wine in moderation, particularly red wine, may enhance overall well-being [4]. Positive effects have been observed in the prevention and treatment of coronary heart disease, atherosclerosis, neurodegenerative disorders, ischemic stroke, cancer, and even aging [13,14]. Anthocyanins, flavonols, and procyanidins effectively reduce cardiovascular risk, primarily through their anti-hypertensive properties, which improve endothelial function and decrease platelet aggregation [15,16]. Red wine and grapes are the primary dietary sources of the most well-known and studied stilbene, resveratrol. Resveratrol can exist as monomers or complex oligomers resulting from the oxidative coupling of monomeric stilbenes, with structural variations that include different substituent patterns in the aryl rings [17].
This study aimed to investigate the extent to which geographical origin and vintage influence the phenolic composition of Albanian Merlot wines. We hypothesize that regional environmental factors and vintage-specific climatic variability contribute to distinct phenolic profiles, providing a chemical basis for wine differentiation, authenticity assessment and quality control.
2. Materials and Methods
2.1. Chemicals
Methanol, acetonitrile, and formic acid of HPLC-grade (Merck, Darmstadt, Germany) were used following filtration through a 0.45 μm pore-size membrane. Chemical standards, including procyanidins B1, B2, B3, and B4, trans-resveratrol, and protocatechuic acid, were purchased from Extrasynthese (Genay, France). Caffeic acid, caftaric acid, coutaric acid, (+)-catechin, and (−)-epicatechin, fertaric acid, gallic acid, gallocatechin, isorhamnetin-3-O-glucoside, kaempferol-3-O-glucoside, p-coumaric acid, quercetin, quercetin-3-O-glucoside, and quercetin-3-O-galactoside standards were purchased from Sigma Aldrich Chemical Co. (St. Louis, MO, USA).
2.2. Wine Sampling
The Merlot wines from two regions, Durrës–Kavaja and Mati–Mirdita, belonging to the 2019 and 2020 vintages, were supplied by local wineries. The wine samples were stored in their original bottles in a cold, dark environment at 4 °C until analysis. The vineyards in the Mati–Mirdita region (41.662525 N, 19.946947 E; Mat, Albania) and Durrës–Kavaja (41.114014 N, 19.60745 E; Durrës–Kavaja, Albania) show distinct pedological features, indicating that luvisols are the dominant soils, widely distributed in the northern Mediterranean region, including Portugal, Spain, Italy, Greece, Albania, Croatia, Turkey, and Cyprus [18]. The Durrës–Kavaja region, located in Western Albania across the Adriatic Sea, is characterized by a typical Mediterranean climate classified as Csa. In contrast, the Mati–Mirdita region is classified as Csb based on the Köppen–Geiger system [19].
2.3. Liquid Chromatography–Tandem Mass Spectrometry Analysis
High-performance liquid chromatography equipment (Agilent 1260 HPLC; Agilent Tech., Palo Alto, CA, USA) and a diode-array detector (G1351D 1260 DAD VL) were used for the qualitative and quantitative analysis of phenolic compounds. The analytical approach established by Kelebek and colleagues, which involves using LC-DAD-ESI-MS/MS in negative ionization mode (see Table 1), was employed to examine the phenolic compounds in the samples [20,21]. Initially, the wine samples were filtered through a membrane filter with a pore size of 0.45 μm before injection into the LC system. The system consisted of a binary pump (G1312 B, 1260 Bin pump), a degasser (G1322 A, 1260 Degasser), and an autosampler (G1367 E, 1260 HIP ALS). A reverse-phase C-18 column (Phenomenex Luna), measuring 5 μm and 250 × 4.6 mm (Torrance, CA, USA), was used. Two mobile phases were employed: solvent A, a mixture of water and formic acid at a 99:1 v/v ratio, and solvent B, a mixture of acetonitrile and water at a 60:40 v/v ratio. Calibration curves were plotted using commercial standard concentrations typically found in extracts (approximately 1–100 mg L−1) with regression values (r2) exceeding 0.995. The calibration process for structurally similar chemical compounds was performed without the reference compound by applying the molecular weight correction factor. The limit of quantification (LOQ) and limit of detection (LOD) were determined by calculating signal-to-noise (S/N) ratios of 10 and 3, respectively.

Table 1.
Specifications for identifying wine phenolics via LC-ESI-MS/MS in negative ionization mode.
2.4. Wine Phenolics Screening
A total of thirty-one phenolic compounds, including flavonoids and non-flavonoids, were identified and quantified using liquid chromatography with diode-array detection and Electrospray Ionization Tandem Mass Spectrometry (LC–DAD–ESI/MSn). Method specifications, compound retention times, specific UV absorption, molecular ions, and characteristic fragmentation patterns are detailed in Table 1. These compounds were grouped into hydroxybenzoic acids and flavan-3-ols, phenolic acids, flavonols, and stilbenoids (Table 2 and Table 3). Mean values and standard deviations from three replicates for specific wine phenolics, combined with total content classified by subgroup, region, and vintage, are presented.
Table 2.
Phenolic compounds in Merlot wines from two wine regions for the 2019 and 2020 vintages (Mean ± STDev, mg L−1).
Table 3.
Selected phenolic compounds in Merlot wines from two Albanian wine regions.
2.5. Statistical Analysis
Principal component analysis (PCA) was conducted using XLSTAT 2023 software to evaluate the effects of vintage, wine region, and grape variety. In addition, the color characteristics of mono-varietal wines were compared, and the results were interpreted using a biplot representation. One-way ANOVA was performed using R (version 4.4.0) to evaluate the effect of geographical origin on individual phenolic compound concentrations across Merlot wine samples. Each compound was treated as a dependent variable, with region as the independent factor. Statistical significance was set at p < 0.05.
2.6. Viticulture Regions of Albania and Meteorological Data
Based on the official European Union (EU) viticulture classification applicable to neighboring countries, the producing areas of Albania are divided into three viticulture subzones: C IIIB, C IIIA, and C II (Figure 1) [22,23]. The C IIIB viticulture subzone encompasses the lowlands up to 300 m above sea level (asl). It is characterized by a typical Mediterranean climate with average annual temperatures ranging from 15 to 16 °C, in which the temperature during the coldest month averages between 5.6 and 7.5 °C and that of the warmest month reaches 26.4 °C, providing optimal conditions for vineyard plantations [24]. The C IIIA viticulture subzone covers hilly regions, rising from 300 to 600 m, and pre-mountainous areas that experience transitional Mediterranean and continental climate influences. The subzone’s proximity to the sea significantly affects its climate characteristics, resulting in prolonged hours of sunshine and low humidity, which create ideal conditions for grape cultivation. In this subzone, the annual average temperature ranges from 12 to 13 °C, with the coldest month averaging between 2 and 4 °C and the warmest month reaching approximately 25 °C. While the C IIIB zone is projected to experience temperature rises due to climate change, the IIIA zone is not expected to experience significant impacts [25]. The C II viticulture subzone includes the eastern regions at altitudes between 600 and 850 m. A typical continental climate, low precipitation, dry summers, and cold winters characterize this subzone. The average annual temperature ranges from 10 to 11 °C, the temperature during the coldest month averages between 0.5 and 2 °C, and that during the warmest month ranges from 19 to 20 °C. The C IIIB viticulture subzone receives between 2500 and 2700 h of solar radiation; C IIIA receives between 2300 and 2500 h; and C II receives between 2100 and 2300 h [25].
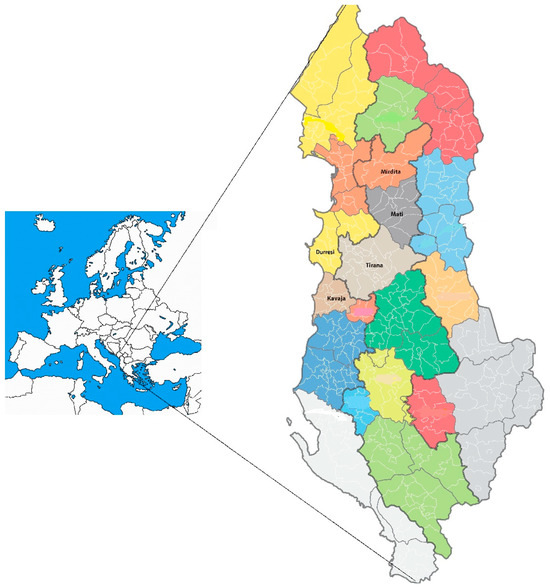
Figure 1.
Map of Albania depicting three viticultural subzones—C IIIB, C IIIA, and C II—outlined with bold lines. Wine regions are proposed based on administrative divisions, each represented in a distinct color. The highlighted zones include Durrës–Kavaja (C IIIB) and Mati–Mirdita (C IIIA), which are focal areas for this study.
3. Results and Discussions
3.1. Phenolic Profile of Merlot Wines
Acclimatized to almost all wine regions around the globe, the Merlot grape is recognized for its adaptation to diverse climates and soil conditions and is distinguished by its presence in high-quality wines. Merlot wine samples from the Durrës–Kavaja (CIIIa) and Mati–Mirdita (CIIIb) wine regions (Figure 1) in two consecutive vintages, 2019 and 2020, were examined to qualitatively and quantitatively determine their phenolic compound profiles. The coastal zone is characterized by a typical Temperate (C), Dry Summer (s), Hot Summer (a) [Csa] Mediterranean climate, which presents optimal grape cultivation and wine production conditions. Transition patterns to Temperate (C), Dry Summer (s), Warm Summer (b) [Csb] type, from the Mediterranean to a continental climate, indicate lower levels of solar radiation, up to 2500 h annually, characterizing the inland CIIIB wine zone, including the Mati–Mirdita wine region [24].
LC-MS/MS identified 31 phenolic compounds, groupedinto 13 hydroxybenzoic acids and flavan-3-ols, 9 phenolic acids, 5 flavonols, and 4 stilbenoids (Table 2). The total phenolic content (TPC), presented as the mean value, revealed a significant difference between the two wine regions, with the TPC of the Durrës–Kavaja samples reaching 415 mg L−1 compared to 274 mg L−1 for the Mati–Mirdita samples. Vintage influence was insignificant in the Durrës–Kavaja wine samples, at 424 mg L−1 for the 2019 vintage and 406 mg L−1 for the 2020 vintage, in addition to the Mati–Mirdita wines, with values of 299 mg L−1 compared to 281 mg L−1 in the two consecutive vintages. Compared to other red wines from Albania, the TPC of Merlot wines was found to be lower than that of Shesh i zi (1037 mg L−1) and Kallmet (539 mg L−1) wines [26].
3.2. Non-Flavonoid Phenolics
3.2.1. Hydroxybenzoic Acid Derivatives
Phenolic acids are typically categorized into two main types: hydroxybenzoic acid (with seven carbon atoms, C6-C1) and cinnamic acid (with nine carbon atoms, C6-C3) derivatives. Different forms of hydroxybenzoic acids (HBAs) have been detected in grapes and wine, with p-hydroxybenzoic, protocatechuic, vanillic, gallic, and syringic acids being the most abundant [27]. Wine quality and authenticity were evaluated by analyzing hydroxybenzoic acids (containing seven carbon atoms) and hydroxycinnamic acids (containing nine carbon atoms and phenylpropanoid derivatives), as these groups represent the primary phenolic acids. The primary phenolic composition of wine samples consists of hydroxybenzoic acids and flavan-3-ols. A significant difference in their contributions was observed between the two wine regions, Durrës–Kavaja (86.1%) and Mati–Mirdita (96.5%). The mean values from both vintages stood at 406 mg L−1 for Durrës–Kavaja and 284 mg L−1 for Mati–Mirdita. Among the identified phenolics, gallic acid (GA) was found to have the highest concentration (120–175 mg L−1), with reference to both wine region and vintage, as a hydrolysis product of condensed and hydrolysable tannins [2]. The highest levels were recorded in the samples from the Durrës–Kavaja wine region. Our findings are consistent with those of a recent study on Merlot wines from various European countries, including France, Italy, Spain, Slovenia, North Macedonia, and Serbia, with the authors identifying GA as the most abundant phenolic compound in their samples, with values ranging from 14.3 to 58.3 mg L−1 [9]. In comparison with wines from native cultivars, Kallmet wines exhibited high levels, ranging from 205 to 271 mg L−1; in comparison, the levels in Shesh izired wine reached 524 mg L−1 [26]. However, these levels exceeded the GA levels found in Vlosh red wines (118 mg L−1) and Shesh I bardhë white wines (27.5 mg L−1) [28]. Vintage showed no apparent effect on the GA levels found in this study for both wine regions.
The second most abundant phenolic compound identified was ethyl gallate, with levels ranging from 25.9 to 61.3 mg L−1, with considerable differences observed between the two wine regions: Durrës–Kavaja (57.6 mg L−1) and Mati–Mirdita (29.5 mg L−1). A similar pattern was observed in other wines produced from native grape cultivars, specifically Kallmet and Shesh i zi red wines, when comparing the two regions [26].
The third subgroup of compounds in the wine samples consisted of catechin and epicatechin galloyl esters, with gallocatechin reaching maximum concentrations of 15.4 mg L−1 in Durrës–Kavaja and 14.1 mg L−1 in Mati–Mirdita.
3.2.2. Hydroxycinnamic Acid and Phenolic AcidDerivatives
Classified as non-flavonoids, hydroxycinnamic acids—derivatives of (E)-3-phenylprop-2-enoic acid—include various phenolic acids, such as the tartaric acid esters of caffeic, coumaric, and ferulic acids, found in grape berries and wines [2]. The concentration of the free forms of hydroxycinnamic acids primarily increases during malolactic fermentation [29]. Our study results indicate that phenolic acids represent the second most abundant group of phenolic compounds in wine samples. Wines from the Durrës–Kavaja region exhibited a higher proportion (8.0%) of phenolic compounds than those from Mati–Mirdita (1.5%). The highest concentration observed was that of trans-caftaric acid (21.2 mg L−1), based on the mean value from the two vintages. The second most abundant phenolic acid, trans-coutaric acid (5.8 mg L−1), was also identified in the same wine region, followed by cis-fertaric acid (2.4 mg L−1). Coumaric acid and cis-coutaric acid were quantified at similar concentrations, reaching 2.20 mg L−1 and 2.10 mg L−1, respectively.
Given the minimal phenolic acid content in the wine samples from the Mati–Mirdita region, the concentrations of individual phenolic acids were considerably lower. Among them, caffeic acid was identified at the lowest concentration (1.27 mg L−1) compared to the other phenolic acids in this group.
Compared to other red wines from Albania, the phenolic acid content in Merlotwines was lower (11.08%) but was higher (8.0%) than that in Shesh i zi red wines (4.1%) from the same region. trans-Caftaric acid content was measured at a level of 27.7 mg L−1, which was higher, whereas the trans-coutaric acid content of 5.72 mg L−1 fell within the same range as that of Kallmet wines [26]. trans-Caftaric acid (26.1 mg L−1) was the main phenolic compound found in both wines; of note, however, is that the Shesh i zi wines exhibited higher levels. When comparing Kallmet and Shesh i zi red wines, the phenolic acid group levels were found to be higher, at (48.8 ± 9.9 mg L−1) and (38.9 ± 3.4 mg L−1), respectively, in contrast with Merlot wines from the Durrës–Kavaja wine region (38.5 mg L−1), and significantly higher than that in Merlot wines (4.02 mg L−1) from the Mati–Mirdita area.
Caffeic acid was detected at a lower concentration (1.27 mg L−1) in the studied Merlot wines compared to European Merlot wines, where reported levels range from 2.6 to 8.6 mg L−1 in samples from France, Italy, Serbia, Spain, Slovenia, and North Macedonia [9]. Similarly, the Greek red wine Xinomavro was shown to contain 4.3 mg L−1 of caffeic acid [30]. Caffeic acid is one of the most abundant hydroxycinnamic acids in grapes and plays a crucial role in wine quality. It contributes not only to the antioxidant capacity of wine but also to its color stability and sensory attributes, particularly bitterness and astringency. Therefore, the relatively low concentration observed in these Merlot samples may influence the wine’s oxidative stability and phenolic complexity, potentially distinguishing it from other regional or international Merlot wines.
3.2.3. Stilbenoid Content in Merlot Wines
Stilbenoids are naturally occurring polyphenols in various edible plants, including grapes (Vitis vinifera L.). Classified as non-flavonoids and is defined by the general structure C6-C2-C6, they have garnered considerable interest over the years due to their potential health-promoting properties. Research suggests that stilbenoids function as “phytoalexins” in response to microbial or abiotic stress, particularly fungal infections and UV radiation, —playing a key role in plant defense mechanisms [31].
Resveratrol is the most common compound in its two isomeric forms (cis- and trans-), with only trans-resveratrol demonstrating various biological activities. This compound is associated with the prevention of cancer, Alzheimer’s disease, and metabolic and cardiovascular disorders by reducing oxidative stress and displaying estrogenic activity [32]. Additionally, it offers anti-inflammatory, anti-aging, and hepatoprotective benefits, along with the ability to inhibit the oxidation of low-density lipoproteins through copper chelation or free radical scavenging [33,34]. The cardioprotective effects of resveratrol are linked to the “French Paradox” which refers to the observed low incidence of coronary heart disease in populations with high dietary fat intake but regular red wine consumption [17].
Four stilbenoids were identified and quantified in the Merlot wines. The total concentration of stilbenoids in the wine samples from the Durrës–Kavaja wine region was higher than that in the Mati–Mirdita wine region, reaching 0.88 versus 0.14 mg L−1. Non-glucoside forms, cis- and trans-resveratrol, were identified in samples from both wine-producing regions; however, their glycosylated form, cis-piceid, was not detected in Mati–Mirdita wines. The differences among the vintages were not significant. Trans-resveratrol levels were similar between the two wine regions, Durrës–Kavaja and Mati–Mirdita, at 0.14 versus 0.13 mg L−1, respectively. Trans-piceid was found at the highest level of 0.41 mg L−1 compared to 0.01 mg L−1 among the wine regions. These levels are significantly lower than those reported for Merlot wines from various European countries, ranging from 0.18 to 3.32 mg L−1, with the highest levels of 4.7 mg L−1 noted in Merlot wines from Serbia [9] and 2.21 mg L−1 noted in Merlot wines from Brazil [35]. Stilbenoids, though present in lower concentrations, impart subtle bitterness and may influence longevity through their oxidative resilience. The regional variation in these compounds suggests not only climatic and edaphic differentiation but also potential typicity in sensory expression.
3.3. Flavonoid Content in Merlot Wines
3.3.1. Flavan-3-Ol Monomers
Flavan-3-ols are phenolic compounds commonly found in grape seeds, stems, and skins as monomers, oligomers, and polymers. They are widely distributed in fruits and wines. The main monomers include (+)-catechin and (−)-epicatechin. Oligomers and polymers are recognized as condensed tannins or procyanidins, which are chemically composed of two or more flavan-3-ol monomers [36,37]. These compounds play an essential role in the sensory properties of red wine, contributing to its color and mouthfeel [36,38]. Catechin and epicatechin are abundant in red European and international wines [39,40,41].
In Merlot wines, levels of catechin are relatively higher than those of epicatechin. Wine samples from Durrës–Kavaja exhibit higher catechin levels (50.0–57.0 mg L−1) compared to those from Mati–Mirdita (12.6–17.4 mg L−1), in addition to higher epicatechin levels of 27.5–32.4 mg L−1 versus 11.9–17.7 mg L−1. This increased concentration may be attributed to the longer duration of solar radiation in the Durrës–Kavaja wine region (CIIIa/Csa) [42]. The flavan-3-ol levels identified in our samples were higher than those found in the Greek Amynteo red wines, which contain catechin (35.0 mg L−1) and epicatechin (15.0 mg L−1) [30], when compared to the samples from the Durrës–Kavaja wine region. However, they differ from those in the Mati–Mirdita wine region, which correlates with its climate conditions.
Compared to other red wines from native grape cultivars of Albania, catechin levels in Merlot wines (53.3 mg L−1) and Kallmet red wine are similar in wine samples from the same Lezha source (50.1 mg L−1). This pattern was not the case for wine samples from Mati–Mirdita (14.6 mg L−1) compared with Kallmet wines from Mirdita (27.7 mg L−1) [26]. These regional discrepancies underscore the influence of local environmental conditions and grape genotype on flavan-3-ol accumulation.
The concentrations of catechin and epicatechin, two major flavan-3-ol monomers, varied significantly among the wine samples analyzed. In Shesh i zi red wine, catechin and epicatechin levels were quantified at 13.4 mg L−1 and 6.51 mg L−1, respectively—substantially lower than those found in Merlot wines from the Durrës–Kavaja region [26]. Specifically, vintage-based variation in epicatechin levels was observed in Merlot wines from Durrës–Kavaja, with concentrations of 32.2 mg L−1 and 27.9 mg L−1, while samples from the Mati–Mirdita region showed comparatively lower levels of 17.3 mg L−1 and 12.8 mg L−1. Similarly, catechin levels reached 27.0 mg L−1 in Durrës–Kavaja Merlot wines, surpassing the levels reported in Spanish Merlot wines (19 mg L−1), with comparable epicatechin concentrations [43]. In Merlot wines from Rio Grande do Sul, Brazil, catechin (16.6 mg L−1) and epicatechin (9.1 mg L−1) were found at the highest levels among South American samples [35].
When considered in the broader European context, catechin and epicatechin levels in Merlot wines generally fell within the range of 11.3 to 32.2 mg L−1 [9], confirming the comparability of the Albanian wines with established international standards. Catechin and epicatechin are critical components of the phenolic fraction due to their strong antioxidant properties and their influence on sensory characteristics such as astringency and bitterness. These compounds also play a pivotal role in the long-term stability and aging potential of red wines. Higher concentrations are typically associated with enhanced mouthfeel complexity and potential health benefits. Quantitative analysis further confirmed the analytical reliability of the results, with epicatechin and catechin showing limits of detection and quantification in the ranges of 0.13–0.47 μg mL−1 and 0.11–0.37 μg mL−1, respectively (R2 = 0.995 for both compounds).
Phenolic variation across vintages and regions in our Merlot samples appears to be strongly influenced by environmental factors, particularly temperature, sunlight exposure, and rainfall. Elevated temperatures in the Durrës–Kavaja region were associated with increased levels of flavan-3-ols (e.g., catechin, epicatechin) and stilbenoids (e.g., resveratrol, piceid), consistent with temperature-induced upregulation of phenylpropanoid biosynthetic enzymes such as PAL and STS [44,45]. Sunlight intensity also plays a critical role: field studies in Chardonnay and Cabernet Sauvignon have shown that ambient light exposure enhances flavonol and hydroxycinnamic acid accumulation through transcriptomic reprogramming of biosynthetic genes and transcription factors [46]. Conversely, reduced rainfall during key phenological stages may limit nutrient transport and berry expansion, concentrating phenolics but also increasing oxidative stress, which can degrade hydroxycinnamic acids like caftaric acid [27]. These abiotic stressors, acting in concert, likely contributed to the compound-specific shifts observed in our PCA and ANOVA analyses, reinforcing the ecological sensitivity of phenolic biosynthesis and its potential as a biomarker for region and vintage.
3.3.2. Procyanidin Dimer Profiles in Merlot Wines
Procyanidins, a subclass of condensed tannins formed by flavan-3-ol monomers such as catechin and epicatechin, play a crucial role in the astringency, bitterness, and antioxidant capacity of red wines. These compounds are mainly present in oligomeric and polymeric forms, with monomeric flavan-3-ols accounting for less than 10% of the total proanthocyanidins [47]. Due to their strong antioxidant activity and demonstrated safety, procyanidins have attracted significant attention in the fields of health, nutrition, and medicine [48].
In the analyzed Merlot wine samples, four procyanidin dimers—B1, B2, B3, and B4—were identified, with procyanidins B2 and B3 being the most prevalent in wines from both regions (Figure 2). Interestingly, their distribution patterns differed from those observed for other phenolic compounds. The total concentration of flavan-3-ol dimers was higher in wines from the Mati–Mirdita region (56.2 mg L−1) compared to those from the Durrës–Kavaja region (54.4 mg L−1), although the difference was marginal. A region-specific pattern was observed in the dominant procyanidin type. In wines from Durrës–Kavaja, procyanidin B2 was the most abundant, ranging from 29.4 to 31.1 mg L−1. Conversely, in wines from the Mati–Mirdita region, procyanidin B3 was found at the highest concentrations, ranging from 23.8 to 24.6 mg L−1. These findings suggest that geographical origin influences not only the overall concentration but also the specific profile of procyanidin dimers in Merlot wines.
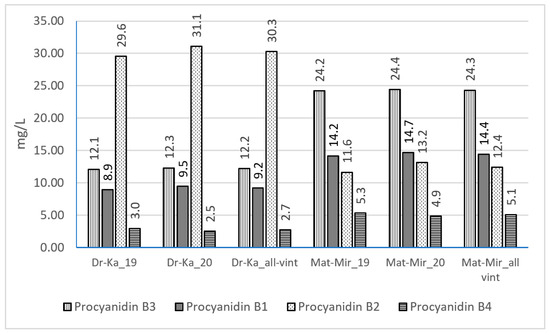
Figure 2.
Procyanidin concentrations in Merlot wines, based on wine region and vintage (mg/L; used acronyms: Dr-Ka_19, Durrës–Kavaja_2019; Dr-Ka_20, Durrës–Kavaja_2020; Mat-Mir_19, Mati–Mirdita_2019; Mat-Mir_20, Mati–Mirdita_2020).
Compared to Kallmet wines (40.4 mg L−1), the total levels of procyanidins B3, B1, B2, and B4 were found to be higher, similar to those identified in Vlosh red wines (58.3 mg L−1) [28]. However, compared to Shesh i zi red wines (152 mg L−1), Merlot wines exhibited lower levels of total procyanidins [26]. During wine aging, anthocyanin–flavanol condensation reactions contribute to the formation of stable pigment–tannin complexes, enhancing color stability and mouthfeel [49]. Malolactic fermentation promotes the polymerization of tannins and anthocyanins, resulting in stable color complexes [29]. Anthocyanin fingerprints of varietal wines were suggested as a tool for analytical authenticity certification [22,50].
3.3.3. Flavonol Levels in Merlot Wines
Regarding flavonoid content (Table 2), quercetin, quercetin-3-O-galactoside, quercetin-3-O-glucoside, quercetin-3-O-glucuronide, and isorhamnetin-3-O-glucoside comprised the identified flavonols. The total flavonol concentration in Merlot wines from the Durrës–Kavaja region was 25.9 mg L−1, which aligns with the two-vintage data and is substantially higher than that of wines from the Mati–Mirdita region (2.13 mg L−1), corresponding to 5.2% and 0.7%, respectively. Among the flavonols, quercetin-3-O-glucuronide was found at the highest concentration (13.5 mg L−1). No significant differences were observed between the two vintages within the same wine region.
The second most abundant flavonol in the Durrës–Kavaja samples was quercetin-3-O-glucoside (6.86 mg L−1), whereas in the Mati–Mirdita samples, quercetin-3-O-galactoside (0.88 mg L−1) was the predominant compound. Flavonols represent the most structurally diverse group of non-polymeric flavonoids in grapes and wines, encompassing both aglycones and glycosylated derivatives. Among the glycosides, 3-O-glucosides and 3-O-glucuronides are the most prevalent forms in wines. Flavonol concentrations are primarily dependent on grape skin content, explaining why red wines typically contain higher levels than white wines [51]. Located in the berry skin, flavonols function as UV-protective compounds [2].
In Albanian wines, the identified flavonol glycosides included quercetin-3-O-galactoside, quercetin-3-O-glucoside, quercetin-3-O-glucuronide, and isorhamnetin-3-O-glucoside. The total levels of these glycosides were consistent with values previously reported for red wines [2,52]. Among the samples, Kallmet red wine from the Mirdita region showed the highest glycoside content at 5.33 mg L−1, which was significantly lower than that of Merlot wines from the Durrës–Kavaja region (25.8 mg L−1) but higher than that of wines from the Mati–Mirdita region. Quercetin was the only aglycone detected, with concentrations below the reported range for red wines [2].
In Shesh izired wine, the total flavonol concentration was 2.31 mg L−1. The quercetin concentration was also lower than in Merlot wines from France (8.25 mg L−1), Spain (7.98 mg L−1), and North Macedonia (7.84 mg L−1) but higher than that reported for Italian Merlot (2.25 mg L−1) and Serbian wines (ranging from 0 to 1.78 mg L−1) [9]. A study on Croatian wines found higher quercetin concentrations in samples from warmer climates [53]. This finding was corroborated in a recent study on Greek wines [30]. Similarly, a study on wines from Brazil reported a mean quercetin concentration of 9.84 mg L−1 [35].
Flavonols are a subclass of flavonoid phenolics located in the skins of Vitis vinifera grape berries. They act as natural UV blockers and are synthesized in a light-dependent manner. As yellow pigments, flavonols contribute to the color of white wines. However, in red wines, their visual impact is masked by anthocyanins, the dominant red pigments [22]. Flavonols are also recognized as key phenolic compounds responsible for the antioxidant activity of wines.
The elevated levels of flavonol glycosides in the Durrës–Kavaja region, particularly quercetin derivatives, likely stem from increased UV exposure, known to upregulate flavonol biosynthesis as a photoprotective response. Conversely, the higher catechin and epicatechin concentrations in the Mati–Mirdita region may reflect cooler temperatures and moderate rainfall, which slow berry ripening and concentrate flavan-3-ols through reduced dilution. Soil composition—especially clay-rich substrates—may also influence stilbenoid expression, as water retention and microbial activity modulate vine stress and resveratrol synthesis.
These phenolic compounds are not merely biochemical markers; they shape the sensory and aging potential of the wines. Catechin and epicatechin contribute to bitterness and astringency, while flavonols stabilize color and enhance antioxidant capacity.
3.3.4. Influence of Temperature on Phenolic Composition
The elevated average temperatures recorded in the Durrës–Kavaja region during the ripening period appear to have modulated the phenolic profile of Merlot wines (Figure S1). Notably, higher concentrations of flavan-3-ols such as catechin and epicatechin, as well as stilbenoids including resveratrol and piceid, were observed in these samples. This aligns with previous findings that warmer growing conditions can enhance the activity of key enzymes in the phenylpropanoid pathway, promoting the biosynthesis of flavonoids and stilbenes [44,45]. In contrast, hydroxycinnamic acids such as caftaric acid tended to decrease under elevated thermal conditions, potentially due to increased enzymatic degradation or altered transport dynamics within the berry [27]. These temperature-linked shifts were particularly evident in the PCA loadings and ANOVA results, supporting the role of climate as a modulating factor in regional phenolic differentiation.
3.3.5. Regional Differentiation of Phenolic Compounds
To assess the influence of geographical origin on phenolic composition, one-way ANOVA was applied to each compound across the three viticultural zones. Gallic acid (F = 9.82, p = 0.0031), catechin (F = 6.47, p = 0.0124), and epicatechin (F = 8.15, p = 0.0057) exhibited statistically significant variation across regions, with higher concentrations observed in Durrës–Kavaja wines. Resveratrol showed marginal significance (F = 4.21, p = 0.0389), while quercetin did not differ significantly (F = 2.87, p = 0.0712), revealing distinct regional profiles for gallic acid and flavan-3-ols. These compounds are proposed as candidate biomarkers for geographic authentication given their consistent expression and discriminatory power [31,32,34,54]. Previous studies have demonstrated the potential of phenolic compounds as geographic biomarkers including Albanian, Australian, Croatian and Greek wines where flavonol profiles enabled origin-based classification [3,26,30,50,51,53]. Although our sampling included multiple wineries per region, the number remains limited for a formal assessment of winery-specific effects. It is plausible that winemaking practices—such as maceration duration, fermentation temperature, or oak usage—may influence phenolic profiles alongside geographical and vintage factors. Future studies with expanded winery representation and controlled vinification metadata would be valuable to isolate these contributions.
Table 3 summarizes the concentrations (mg/L) of selected phenolic compounds, highlighting statistically significant differences between the two regions, Durrës–Kavaja and Mati–Mirdita. One-way ANOVA followed by Tukey’s HSD posthoc test confirmed significant regional differences (p < 0.05) for all listed compounds, supporting their potential use as geographic biomarkers.
Multivariate analyses such as PCA have been successfully applied to distinguish wines based on soil, altitude, and viticultural practices [39,41,42]. Principal component analysis (PCA) was conducted on the entire matrix of individual phenolic compounds and grouped totals across Merlot wine samples from Durrës–Kavaja and Mati–Mirdita regions, covering vintages 2019 and 2020. The first two principal components (PC1 and PC2) explained most of the variation, with PC1 mainly driven by flavanols (catechin, epicatechin, epicatechin gallate) and their totals (Σ-flavanols, Σ-total phenolics). Meanwhile, PC2 reflected influences from flavonols (quercetin, myricetin) and stilbenoids (resveratrol, piceid). PCA plots showed a distinct regional separation along PC2, with Mati–Mirditasamples having higher scores, indicating increased levels of flavonol and stilbenoid compounds, possibly linked to terroir-specific stress responses. Vintage effects were more subtle, with 2020 samples displaying a slight shift along PC1, suggesting climatic effects on flavanol accumulation. These results support the potential use of specific phenolic compounds and totals as biomarkers for geographic authentication and vintage differentiation in Albanian Merlot wines. Multivariate approaches such as PCA have previously been used to distinguish wines based on soil type, grape variety, and vinification parameters [6,10,28].
Anthocyanins, although central to red wine color and co-pigmentation, were not included in the present analysis due to methodological constraints. The LC-DAD-ESI-MS/MS protocol employed was optimized for non-anthocyanin phenolics, with detection wavelengths and mobile phase conditions unsuitable for accurate anthocyanin quantification. Similar methodological constraints have been noted in studies focusing on anthocyanin quantification under varying vinification strategies [21,29,43,49]. Given this study’s focus on profiling stable phenolic compounds for geographic differentiation and potential authentication, we prioritized classes such as flavan-3-ols, phenolic acids, flavonols, and stilbenoids. The absence of anthocyanin data, due to chromatographic incompatibility, narrows the phenolic scope but enhances the stability of the selected markers for geographic differentiation. Future work will incorporate anthocyanins to provide a more comprehensive phenolic fingerprint and explore their role in regional typicity.
4. Conclusions
This study provided a detailed characterization of the phenolic profiles of Merlot wines from two key Albanian wine-producing regions—Durrës–Kavaja and Mati–Mirdita—across two consecutive vintages. Using LC-DAD-ESI-MS/MS, 31 phenolic compounds were identified and quantified, spanning hydroxybenzoic acids, flavan-3-ols, phenolic acids, flavonols, and stilbenoids. Distinct regional variation emerged, with Durrës–Kavaja wines showing higher levels of catechin, epicatechin, ethyl gallate, and quercetin derivatives, while procyanidins predominated in Mati–Mirdita samples. These differences underscore the primacy of terroir—including soil composition, altitude, and climate—over vintage in shaping phenolic expression.
Compared to Merlot wines from other European and international regions, Albanian wines demonstrated comparable or elevated concentrations of several bioactive compounds, emphasizing their antioxidant potential and highlighting Albania’s viticultural value. Importantly, phenolic profiling proved effective for geographic differentiation and could serve in wine authentication, regulatory traceability, and quality labeling.
Future research should broaden the scope to include additional grape varieties and vintages, incorporate sensory evaluation, and investigate climate-driven shifts in phenolic composition. Such efforts will deepen our understanding of the dynamic relationship between chemical profile and wine quality across Albania’s diverse viticultural landscapes.
Supplementary Materials
The following supporting information can be downloaded at: https://www.mdpi.com/article/10.3390/analytica6030032/s1. Figure S1. Average Yearly Temperatures for three regions included in the study. Durrës (left), and Lezhë’ Gjadër’ (right) (Source: Meteorological Service of the Armed Forces of Albania).
Author Contributions
Conceptualization, D.T. and G.S.; methodology, D.T. and G.S.; software, H.K. and G. G.; validation, H.K. and G.G.; formal analysis, H.K.; investigation, D.T.; resources, D.T. and H.K.; data curation, D.T. and H.K.; writing—original draft preparation, D.T., G.G. and S.S.; writing—review and editing, D.T., H.K., G.S. and S.S.; visualization, G.G.; supervision, S.S. and H.K.; project administration, D.T.; funding acquisition, D.T. All authors have read and agreed to the published version of the manuscript.
Funding
This study received no external funding.
Data Availability Statement
The original contributions presented in this study are included in the article. Further inquiries can be directed to the corresponding author.
Conflicts of Interest
The authors declare no conflict of interest.
Correction Statement
This article has been republished with a minor correction to the Data Availability Statement. This change does not affect the scientific content of the article.
References
- De Luca, V. Wines. In Comprehensive Biotechnology, 3rd ed.; Moo-Young, M., Ed.; Elsevier: Pergamon, Turkey, 2011; pp. 260–274. [Google Scholar] [CrossRef]
- Waterhouse, A.L.; Sacks, G.L.; Jeffery, D.W. Non-flavonoid phenolics. In Understanding Wine Phenolics; John Wiley & Sons: Hoboken, NJ, USA, 2024; pp. 126–130. [Google Scholar] [CrossRef]
- Gutiérrez-Escobar, R.; Aliaño-González, M.J.; Cantos-Villar, E. Wine Polyphenol Content and Its Influence on Wine Quality and Properties: A Review. Molecules 2021, 26, 718. [Google Scholar] [CrossRef]
- Tresserra-Rimbau, A.; Lamuela-Raventos, R.M.; Moreno, J.J. Polyphenols, food, and pharma. Current knowledge and directions for future research. Biochem. Pharmac. 2018, 156, 186–195. [Google Scholar] [CrossRef]
- Ajila, C.M.; Brar, S.K.; Verma, M.; Tyagi, R.D.; Godbout, S.; Valéro, J.R. Extraction and analysis of polyphenols: Recent trends. Crit. Rev. Biotechnol. 2011, 31, 227–249. [Google Scholar] [CrossRef]
- Fang, F.; Li, J.M.; Zhang, P.; Tang, K.; Wang, W.; Pan, Q.H.; Huang, W.D. Effects of grape variety, harvest date, fermentation vessel and wine ageing on flavonoid concentration in red wines. Food Res. Int. 2008, 41, 53–60. [Google Scholar] [CrossRef]
- Cosme, F.; Aires, A.; Pinto, T.; Oliveira, I.; Vilela, A.; Gonçalves, B. A Comprehensive Review of Bioactive Tannins in Foods and Beverages: Functional Properties, Health Benefits, and Sensory Qualities. Molecules 2025, 30, 800. [Google Scholar] [CrossRef]
- Berscheneider, B.; Winterhalter, P. Isolation and Characterization of novel benzoates, Cinnamates, Flavonoids, and Lignans, from Riesling wine and Screening for Antioxidant Activity. J. Agric. Food Chem. 2001, 49, 2788–2798. [Google Scholar] [CrossRef] [PubMed]
- Majkić, T.M.; Torović, L.D.; Lesjak, M.M.; Četojević-Simin, D.D.; Beara, I.N. Activity profiling of Serbian and some other European Merlot wines in inflammation and oxidation processes. Food Res. Int. 2019, 121, 151–160. [Google Scholar] [CrossRef]
- Prado, R.A.; Yuste-Rojas, M.; Sort, X.; Andrea Lacueva, C.; Torres, M.; Lamuela-Raventoa, R.M. Effect of soil type on wines produced from Vitis vinifera L. Cv. Grenache in commercial vineyards. J. Agric. Food Chem. 2007, 55, 779–786. [Google Scholar] [CrossRef]
- Valavanidis, A.; Vlachogianni, T. Plant Polyphenols: Recent Advances in Epidemiological Research and Other Studies on Cancer Prevention. In Studies in Natural Products Chemistry; Atta-ur-Rahman, Ed.; Elsevier: Amsterdam, The Netherlands, 2013; Volume 39, pp. 269–295. [Google Scholar] [CrossRef]
- Genebra, T.; Santos, R.R.; Francisco, R.; Pinto-Marijuan, M.; Brossa, R.; Serra, A.T.; Duarte, C.; Chaves, M.; Zarrouk, O. Proanthocyanidin accumulation and biosynthesis are modulated by the irrigation regime in Tempranillo seed. Int. J. Mol. Sci. 2014, 15, 11862–11877. [Google Scholar] [CrossRef] [PubMed]
- Guilford, J.M.; Pezzuto, J.M. Wine and health: A review. Am. J. Enol. Vitic. 2011, 62, 471–486. [Google Scholar] [CrossRef]
- Tekos, F.; Makri, S.; Skaperda, Z.-V.; Patouna, A.; Terizi, K.; Kyriazis, I.D.; Kotseridis, Y.; Mikropoulou, E.V.; Papaefstathiou, G.; Halabalaki, M.; et al. Assessment of Antioxidant and Antimutagenic Properties of Red and White Wine Extracts In Vitro. Metabolites 2021, 11, 436. [Google Scholar] [CrossRef]
- Habauzit, V.; Milenkovic, D.; Morand, C. Chapter 68—Vascular Protective Effects of Fruit Polyphenols. In Polyphenols in Human Health and Disease; Ross Watson, R., Preedy, V.R., Zibadi, S., Eds.; Academic Press: Cambridge, MA, USA, 2014; pp. 875–893. [Google Scholar] [CrossRef]
- Llupa, J.; Gašić, U.; Brčeski, I.; Demertzis, P.; Tešević, V.; Topi, D. LC-MS/MS characterization of phenolic compounds in the quince (Cydonia oblonga Mill.) and sweet cherry (Prunus avium L.) fruit juices. Agric. For. 2022, 68, 193–205. [Google Scholar] [CrossRef]
- Duarte, N.; Ramalhete, C.; Rijo, P.; Reis, M.A.; Ferreira, M.J.U. Stilbenoids in Grapes and Wine. In Handbook of Dietary Phytochemicals; Xiao, J., Sarker, S.D., Asakawa, Y., Eds.; Springer: Singapore, 2021. [Google Scholar] [CrossRef]
- Zdruli, P. Soil Survey in Albania. In European Soil Bureau Research Report No. 9; Jones, R.J.A., Houšková, B., Bullock, P., Montanarella, L., Eds.; EUR 20559 EN, (p. 420); Office for Official Publications of the European Communities: Luxembourg, 2005; pp. 39–45. [Google Scholar]
- Beck, H.E.; McVicar, T.R.; Vergopolan, N.; Berg, A.; Lutsko, N.J.; Dufour, A.; Zeng, Z.; Jiang, X.; van Dijk, A.I.J.M.; Miralles, D.G. High-resolution (1 km) Köppen-Geiger maps for 1901–2099 based on constrained CMIP6 projections. Sci. Data 2023, 10, 724. [Google Scholar] [CrossRef] [PubMed]
- Kelebek, H.; Canbas, A.; Jourdes, M.; Teissedre, P.-L. Characterization of colored and colorless phenolic compounds in Öküzgözü wines from Denizli and Elazig regions using HPLC-DAD–MS. Ind. Crop. Prod. 2010, 31, 499–508. [Google Scholar] [CrossRef]
- Kelebek, H.; Selli, S.; Canbas, A. Öküzgözü Üzümlerinden Kırmızı Sarap Üretiminde Soğuk Maserasyon Uygulamasının Antosiyaninler Üzerine Etkisi. J. Agric. Sci. 2010, 16, 287–294. [Google Scholar] [CrossRef]
- European Commission. Council Regulation (EC) No 479/2008 of 29 April 2008 on the common organisation of the market in wine. Off J. Eur. Commun. L. 2008, 51, 1–61. Available online: http://eur-lex.europa.eu/LexUriServ/LexUriServ.do?uri=OJ:L:2008:148:0001:0061:EN:PDF (accessed on 31 July 2025).
- WVS. Wine and Vine Search: Albania’s Wine Regions. 2018. Available online: http://www.wineandvinesearch.com/albania/wine_regions.php (accessed on 3 March 2024).
- Topi, D.; Arapi, D.; Seiti, B. Vine Pruning Residues and Wine Fermentation By-Products, a Non-Exploited Source, Albania Case. Resources 2025, 14, 29. [Google Scholar] [CrossRef]
- Zorba, P.; Hoxha, E.; Çomo, E. Evaluation of Hourly Temperatures Referring to the Maximal and Minimal Daily Air Temperatures. In Monthly Climate Bulletin No. 93; UPT, IGEWE: Tirana, Albania, 2024; ISSN 2521-831X. [Google Scholar]
- Topi, D.; Topi, A.; Guclu, G.; Selli, S.; Uzlasir, T.; Kelebek, H. Targeted analysis for detecting phenolics and authentication of Albanian wines using LC-DAD/ESI–MS/MS combined with chemometric tools. Heliyon 2024, 10, e31127. [Google Scholar] [CrossRef]
- Garrido, J.; Borges, F. Wine and grape polyphenols—A chemical perspective. Food Res. Int. 2013, 54, 1844–1858. [Google Scholar] [CrossRef]
- Topi, D.; Kelebek, H.; Güçlü, G.; Selli, S. LC-DAD-ESI-MS/MS characterization of phenolic compounds in wines from Vitis vinifera ‘Shesh ibardhë’ and ‘Vlosh’ cultivars. J. Food Process. Preserv. 2022, 466, e16157. [Google Scholar] [CrossRef]
- Devi, A.; Archana, K.M.; Bhavya, P.K.; Anu-Appaiah, K.A. Non-anthocyanin polyphenolic transformation by native yeast and bacteria co-inoculation strategy during vinification. J. Sci. Food Agric. 2017, 98, 1162–1170. [Google Scholar] [CrossRef]
- Gialouris, P.; Nastoua, E.; Preza-Mayo-Kataki, D.; Goulioti, E.; Kotseridis, Y.; Thomaidis, N.; Dasenaki, M. Greek PDO Xinomavro wines: A deep dive into their chemical composition and geographical origin using UHPLC-TIMS-QTOF-MS. Anal. Sens. 2025, e202400120. [Google Scholar] [CrossRef]
- Pawlus, A.D.; Waffo-Teguo, P.; Shaver, J.; Merillion, J.-M. Stilbenoid Chemistry from wine and the genus Vitis: A review. Int. J. Wine Sci. 2012, 46, 57–111. [Google Scholar] [CrossRef]
- Zhang, L.X.; Li, C.X.; Kakar, M.U.; Khan, M.S.; Wu, P.F.; Amir, R.M.; Dai, D.F.; Naveed, M.; Li, Q.Y.; Saeed, M.; et al. Resveratrol (RV): A pharmacological review and call for further research. Biomed. Pharmacother. 2021, 143, 112164. [Google Scholar] [CrossRef] [PubMed]
- Alexandru, L.; Cristea, M.; Dinu, M. Antioxidant, anti-inflammatory and hepatoprotective effects of bioactive compounds through copper chelation and free radical scavenging. Appl. Biochem. Biotechnol. 2014, 173, 1023–1035. [Google Scholar]
- Salehi, B.; Mishra, A.P.; Nigam, M.; Sener, B.; Kilic, M.; Sharifi-Rad, M.; Fokou, P.V.T.; Martins, N.; Sharifi-Rad, J. Resveratrol: A Double-Edged Sword in Health Benefits. Biomedicines 2018, 6, 91. [Google Scholar] [CrossRef]
- Kaltbach, S.B.D.A.; Kaltbach, P.; Santos, C.G.; Cunha, W.; Giacomini, M.; Domingues, F.; Malgarim, M.; Herter, F.G.; Costa, V.B.; Couto, J.A. Influence of manual and mechanical grape harvest on Merlot wine composition. J. Food Compos. Anal. 2022, 110, 104548. [Google Scholar] [CrossRef]
- Jordão, A.M.; Ricardo-da-Silva, J.M. Influence of grape proanthocyanidins on wine chemistry and quality: Condensed tannins as oligomers and polymers. In Wine Chemistry and Biochemistry; Bordiga, M., Ed.; Springer: Berlin/Heidelberg, Germany, 2019; pp. 123–145. [Google Scholar]
- Ruan, Q.; Yang, X.; Li, X.; Wang, L. Procyanidins: From agro-industrial waste to food as bioactive molecules. Foods 2021, 10, 3152. [Google Scholar] [CrossRef]
- Gómez-Míguez, J.; Gómez-Míguez, M.; Vicario, I.M.; Heredia, F.J. Assessment of colour and aroma in red wine using a sensory and instrumental approach. Food Chem. 2007, 100, 751–758. [Google Scholar] [CrossRef]
- Fermo, P.; Comite, V.; Sredojević, M.; Ćirić, I.; Gašić, U.; Mutić, J.; Baošić, R.; Tešić, Ž. Elemental Analysis and Phenolic Profiles of Selected Italian Wines. Foods 2022, 10, 158. [Google Scholar] [CrossRef] [PubMed]
- Dias, L.; Milheiro, J.; Ribeiro, M.; Fernandes, C.; Neves, N.; Filipe-Ribeiro, L.; Cosme, F.; Nunes, F.M. Fast and Simple UPLC–Q-TOF MS Method for Determination of Bitter Flavan-3-ols and Oligomeric Proanthocyanidins: Impact of Vegetable Protein Fining Agents on Red Wine Composition. Foods 2023, 12, 3313. [Google Scholar] [CrossRef]
- Allebrandt, R.; Wurz, D.A.; Brighenti, A.F.; Rufato, L. Agronomic performance and wine phenolic composition of ‘Merlot’ grown in altitude region with different rootstocks. Cienc. Tec. Vitivinic. 2024, 39, 19–29. [Google Scholar] [CrossRef]
- Nicolli, K.P.; Biasoto, A.C.T.; Guerra, C.C.; dos Santos, H.P.; Correa, L.C.; Welke, J.E.; Zini, C.A. Effects of Soil and Vineyard Characteristics on Volatile, Phenolic Composition and Sensory Profile of Cabernet Sauvignon Wines of CampanhaGaúcha. J. Braz. Chem. Soc. 2020, 31, 1110–1124. [Google Scholar] [CrossRef]
- Monagas, M.; Suarez, R.; Gomez-Cordoves, C.; Bartolome, B. Simultaneous determination of nonanthocyanin phenolic compounds in red wines by HPLC-DAD/ESI-MS. Am. J. Enol. Vitic. 2005, 56, 139–147. [Google Scholar] [CrossRef]
- Downey, M.O.; Dokoozlian, N.K.; Krstic, M.P. Cultural practice and environmental impacts on the flavonoid composition of grapes and wine: A review of recent research. Am. J. Enol. Vitic. 2006, 57, 257–268. [Google Scholar] [CrossRef]
- Conde, A.; Pimentel, D.; Neves, A.; Dinis, L.-T.; Bernardo, S.; Correia, C.M.; Gerós, H.; Moutinho-Pereira, J. Kaolin foliar application has a stimulatory effect on phenylpropanoid and flavonoid pathways in grape berries. Front. Plant Sci. 2016, 7, 1150. [Google Scholar] [CrossRef]
- Šebela, D.; Turóczy, Z.; Olejničkova, J.; Kumšta, M.; Sotolář, R. Effect of ambient sunlight intensity on the temporal phenolic profiles of Vitis vinifera L. Cv. Chardonnay during the ripening season: A field study. S. Afr. J. Enol. Vitic. 2017, 38, 94–102. [Google Scholar] [CrossRef]
- Oliveira, J.; Mateus, N.; de Freitas, V. Flavanols: Catechins and proanthocyanidins. In Comprehensive Natural Products II: Chemistry and Biology; Ramawat, K., Mérillon, J.M., Eds.; Springer: Berlin/Heidelberg, Germany, 2013; Volume 3, pp. 1753–1801. [Google Scholar] [CrossRef]
- Xu, J.; Rong, S.; Xie, B.; Sun, Z.; Zhang, L.; Wu, H.; Yao, P.; Zhang, X.; Zhang, Y.; Liu, L. Rejuvenation of antioxidant and cholinergic systems contributes to the effect of procyanidins extracted from the lotus seedpod ameliorating memory impairment in cognitively impaired aged rats. Eur. Neuropsychopharmacol. 2009, 19, 851–860. [Google Scholar] [CrossRef] [PubMed]
- Santos-Buelga, C.; González-Paramás, A.M. Anthocyanins. In Encyclopedia of Food Chemistry; Melton, L., Shahidi, F., Varelis, P., Eds.; Academic Press: Cambridge, MA, USA, 2019; pp. 10–21. [Google Scholar] [CrossRef]
- Merkytė, V.; Longo, E.; Windisch, G.; Boselli, E. Phenolic Compounds as Markers of Wine Quality and Authenticity. Foods 2020, 9, 1785. [Google Scholar] [CrossRef] [PubMed]
- Hermosín-Gutiérrez, I.; Castillo-Muñoz, N.; Gómez-Alonso, S.; García-Romero, E. Flavonol Profiles for Grape and Wine Authentication. In Progress in Authentication of Food and Wine; Ebeler, S., Takeoka, G., Winterhalter, P., Eds.; American Chemical Society: Washington, DC, USA, 2011; pp. 113–129. [Google Scholar]
- Jeffery, D.W.; Parker, M.; Smith, P.A. Flavonol composition of Australian red and white wines determined by high-performance liquid chromatography. Aust. J. Grape Wine Res. 2008, 14, 153–161. [Google Scholar] [CrossRef]
- Rastija, V.; Srečnik, G.; Marica-Medić-Šarić. Polyphenolic composition of Croatian wines with different geographical origins. Food Chem. 2009, 115, 54–60. [Google Scholar] [CrossRef]
- Etiévant, P.; Schlich, P.; Bertrand, A.; Symonds, P.; Bouvier, J.-C. Varietal and geographic classification of French red wines in terms of pigments and flavonoid compounds. J. Sci. Food Agric. 1988, 42, 39–54. [Google Scholar] [CrossRef]


Disclaimer/Publisher’s Note: The statements, opinions and data contained in all publications are solely those of the individual author(s) and contributor(s) and not of MDPI and/or the editor(s). MDPI and/or the editor(s) disclaim responsibility for any injury to people or property resulting from any ideas, methods, instructions or products referred to in the content. |
© 2025 by the authors. Licensee MDPI, Basel, Switzerland. This article is an open access article distributed under the terms and conditions of the Creative Commons Attribution (CC BY) license (https://creativecommons.org/licenses/by/4.0/).