Article

Multi-Modal Characterization of Wheat Bread Enriched with Pigweed and Purslane Flour Using Colorimetry, Spectral Analysis, and 3D Imaging Techniques

1
Faculty of Technics and Technologies, Trakia University, 38 Graf Ignatiev Street, 8602 Yambol, Bulgaria
2
Faculty of Agriculture, Trakia University, Studentski grad Street, 6000 Stara Zagora, Bulgaria
3
Faculty of Economics, Trakia University, Students Campus, 6000 Stara Zagora, Bulgaria
*
Author to whom correspondence should be addressed.
Analytica 2025, 6(3), 31; https://doi.org/10.3390/analytica6030031
Submission received: 15 June 2025 / Revised: 2 July 2025 / Accepted: 1 September 2025 / Published: 2 September 2025

Abstract

The growing demand for functional bakery products necessitates research on the enrichment of wheat bread with pigweed (Amaranthus spp.) and purslane (Portulaca oleracea) flour. Although these plant-based raw materials offer nutritional and environmental benefits, their inclusion in wheat bread formulations poses challenges in the creation of formulations that may compromise the sensory and structural qualities of the final product. The main objective of this work is to systematically determine the optimal amounts of these alternative flour using multimodal bread characterization techniques that include physicochemical, organoleptic, geometric, and optical evaluations, supported by advanced data reduction techniques and regression models. A total of 70 features were analyzed and reduced to 22 for pigweed flour and 15 for purslane flour informative features. Predictive models (R2 = 0.85 for pigweed flour, R2 = 0.84 for purslane flour) were developed to optimize the inclusion of alternative flour, resulting in appropriate concentrations of 3.69% for pigweed flour and 7.13% for purslane flour. These formulations balance improved nutritional profiles with acceptable sensory and structural properties. The results obtained not only complement the potential of pigweed and purslane as sustainable functional raw materials but also demonstrate the efficacy of an automated, image-based approach to formulating recipes in food manufacturing.

1. Introduction

Bread is one of the world’s staple foods, and besides its local composition the quality is important for nutritional value and consumer perception. The inclusion of plant additives such as Pigweed (Amaranthus) and purslane (Portulaca oleracea) in wheat bread and bakery products is an approach that enhances their functionality by providing additional nutrients, antioxidants, and bioactive compounds. This is particularly important for modern nutrition, where healthy alternatives and sustainable sources of raw materials are sought. The appropriate amount of these additives should be determined through a complex analysis including 3D structural characteristics, physicochemical and organoleptic properties, as well as spectral and color indicators. These characteristics help to quickly assess the quality of bread, and also complement product analyses through classic technological characteristics. In this way, a balance between nutritional value and taste qualities is found [1].
Pigweed (Amaranthus spp.) and purslane (Portulaca oleracea) are ancient but increasingly popular food supplements with a rich content of beneficial substances. Pigweed is known for its high content of protein, fiber, and essential amino acids, while purslane is valued for its high levels of omega-3 fatty acids, antioxidants, and vitamins [2]. Their inclusion in food products such as wheat bread significantly improves nutritional value, increases antioxidant potential, and adds additional flavor (which could not be always the pleasant) and texture [3]. Due to their ability to thrive in poor soils with minimal inputs, pigweed and purslane are considered sustainable crops [2,3]. This makes them a suitable choice from both ecological and nutritional standpoints. Investigating their optimal inclusion levels in wheat bread is crucial for balancing nutritional value, functional properties, and sensory quality of the final product.
Functional foods are products that, in addition to their primary nutritional purpose, provide health benefits by helping to prevent diseases and improve the general physical condition of a human [4]. They contain natural bioactive compounds, probiotics, antioxidants, essential fatty acids, and amino acids, all of which contribute to improved metabolism, immune support, and cellular regeneration. The inclusion of pigweed and purslane in wheat bread turns it into a functional product that enriches the diet with vitamins, minerals, and other health-promoting components [5]. Given the interest in healthier eating, research in this area supports the development of sustainable and beneficial food solutions that deliver both quality and functionality as well as it, at the same time, extends offered portfolio of bakery products.
With the development of food science and bread production technologies, the need for more precise analysis methods appears to ensure optimal quality and functionality of products. Traditional approaches to food additive evaluation are complemented, but quite frequently in history, some research directions, including 3D analyses [6] and spectral and color measurements [7] provide more complete and informative analyses of the texture, composition, and organoleptic characteristics of the final product. The application of new analysis methods not only improves the quality of the final product but also provides information on the industrial and consumer applicability of plant additives.
The aim of the study is to determine the optimal amount of pigweed and purslane additives in wheat bread through an integrated 3D image analysis, physicochemical properties, organoleptic qualities, color parameters, and spectral indicators. This approach will ensure a balance between nutritional value, sensory characteristics, and technological applicability of the final product. The results of the study will contribute to sustainable nutrition and reveal the potential of these plant raw materials to improve the quality and functionality of bread.

2. Related Works

In recent years, there has been considerable interest in the use of plant additives such as pigweed or purslane flour in breadmaking, but they also reveal challenges that need to be overcome. The study by Olusanya et al. [8] highlights the potential of pigweed flour to improve the nutritional profile of traditional African Ujeqe wheat bread, with a recommended amount for good organoleptic characteristics of 2%. Higher concentrations (4–6%) increased the nutritional value but not preferred by tasters, indicating the need for a more precise balance between nutritional and sensory qualities (fermentation potentially could help to solve this unbalance). Other studies have examined the use of pigweed seeds as a substitute for wheat flour at significantly higher concentrations. Chaquilla-Quilca et al. [9] recommend level of 20% of pigweed flour in wheat bread, and Ayo [10] considers 15% of pigweed flour in wheat bread as an acceptable amount. These values indicated good nutritional efficiency, but their application remains limited to certain formulations. The use of flour from the whole pigweed stalk, as found by Havugimana et al. [11], lead to lower acceptable amounts (up to 4%), since the bitterness caused by saponins, tannins and oxalates significantly affected the taste characteristics. These compounds are a natural defense mechanism of the plant, but their intense taste limits their use in bakery products without further processing.
Purslane flour addition also shows diverse effects on bread, as shown by studies by Melilli et al. [12] and Delvarianzadeh et al. [13]. At a 5% addition level, there were improved rheological properties, increased antioxidant activity, and a more favorable ratio of omega-6/omega-3 fatty acids were observed. Higher concentrations from 10% to 15% lead to changes in chemical composition, including an increase in protein, fat, and dietary fibers contents, but also a decrease in organoleptic evaluations, especially for taste, color, and texture. Di Cagno et al. [14] noted that at 10% purslane, wheat bread remained acceptable to consumers, while at 15% negative sensory reactions began to occur. Bahar et al. [15] investigated the functional impact of purslane flour on health and demonstrated its positive effect on metabolic parameters, especially in diabetes.
The results presented show that the use of plant-based additives in bread and bakery products has significant technological and nutritional advantages but requires careful consideration of the amount for an optimal balance between nutritional, sensory, and technological characteristics. High concentrations of some raw materials improve the nutritional profile but may compromise the taste qualities, which makes it imperative to apply additional measures for formulating the recipe of bakery products with plant-based additives.
Basile et al. [16] and Abeshu and Kasahun [17] investigated NIR and hyperspectral techniques for the analysis of bakery products and raw materials. The authors focused on the spectral signatures of finished bread and also proposed a method for predicting baking parameters by spectroscopic examination of whole grains. The advantages included high accuracy and rapid evaluation, but the limitations are related to the need for specialized equipment as well as well-trained laborant (operator).
Olakanmi et al. [18] analyzed the quality characteristics of wheat bread using machine vision systems, assessing its porosity, color, and shape. Mehdizadeh et al. [19] used hyperspectral images to monitor bread aging, tracking textural changes and moisture loss. Both methods provided fast and objective analysis but depended on the quality of the images and processing algorithms.
El-Mesery et al. [20] emphasized the importance of multisensory assessment, combining spectroscopy, machine vision, and acoustic analysis for a more complete and reliable quality assessment. Although this approach increased the reliability of the results, its application required a complex integration of different technologies.
In recent years, non-contact methods for assessing the quality of bread using 3D digital technologies have developed significantly. Research can be grouped into several main areas—geometric characterization of food products, quantitative determination of warehouse resources, digitization of baked goods, and marking using laser technologies.
Uyar et al. [21] and Yang et al. [22] focused on improving of measurement accuracy and reducing errors in modeling irregularly shaped bakery products. This allowed more reliable simulations of baking and cooling processes, improving engineering solutions in the food sector. They also considered 3D laser scanning as a method for quantifying bulk food products, demonstrating its high precision and the potential for automated inventory control. Although these methods are reliable, they still require technological adaptation for large-scale application. Rodríguez-Parada et al. [23] expanded on the topic by focusing on the digitalization of the shape and volume of food products. They highlighted the importance of 3D scanning for improved modeling and personalized packaging design. This contributes to the sustainability of production processes, reducing waste and the environmental footprint (because some modern analysis techniques consume a large amount of energy). However, a limitation of this approach is the need for high-quality and precise scanners.
The study by Gulak et al. [24] introduced laser marking as an additional component to 3D digitization. The authors proposed high-speed food product scanning systems that improved the traceability and safety of bread without adding harmful substances. Although this method improves production efficiency, its integration into existing production lines may require significant investments.
It can be summarized that 3D digital technologies offer sufficiently high precision and efficiency in the evaluation and processing of bread and bakery products. They reduce errors, optimize production, and improve sustainability.

3. Material and Methods

3.1. Raw Materials

Pigweed (Amaranthus spp.) and purslane (Portulaca oleracea), using crushed whole stalks (Bulgarian Bio Product Ltd., Simitli, Bulgaria), were obtained commercially. These plants came from a production facility located in the village of Filipovo, Bansko Municipality (southwestern Bulgaria). The pigweed and purslane were finely milled using a CASO Design SP-7437 grinder (Braukmann GmbH, Arnsberg, Germany).
White wheat flour, Sofia Mel type 500 (GoodMills Bulgaria Ltd., Sofia, Bulgaria), was also used. According to the manufacturer, its composition includes flour type 500, a flour treatment agent (ascorbic acid), and added enzymes. The nutritional value of the flour is presented in Table 1.
Drinking water, according to Bulgarian Regulation No. 9/2001 (promulgated, State Gazette, issue 30, 2001).
Baker’s yeast (Saccharomyces cerevisiae), yeast for bread, vital dry Picantina instant yeast for bread and fine pastries (Kendi Ltd., Bankya, Bulgaria). Country of origin—Turkey.
Iodized cooking salt (Khimsnab-Orbel Ltd., Lom, Bulgaria), according to Bulgarian Regulation on the requirements for the composition and characteristics of salt for food purposes. According to the manufacturer, cooking salt contains: Sodium chloride (NaCl) 99.5%; Potassium iodate (KIO3) 28–55 mg/kg; anti-caking agent E917.

3.2. Bread Making Technology

Owing to carrying out the baking trials in semi-industrial scale (in laboratory conditions) the wheat bread with additives of pigweed and purslane flour was prepared according to the methodology presented in Bulgarian approved standard AS02/2011 “White bread”. Part of wheat flour was replaced with pigweed and purslane flour.
Table 2 presents the recipe and composition of the bread samples with added pigweed and purslane flours. The original recipe in AS02/2011 is for 100 kg of flour. The amount of wheat flour and that of the additives (pigweed or purslane flour) were stepwise changed, while the amounts of the other raw materials were maintained.
The test bread samples were prepared in FlexiForm Mini Lump molds (LURCH AG, Hildesheim, Germany). They have dimensions of 9.1 × 5.6 × 3.9 cm. They are made of “Premium-Platinum-Silicone” material, intended for heat treatment of food products, and resistant to temperatures in the range from −40 to +240 °C.
Table 3 shows the technology for preparing bread with the stepwise addition of pigweed or purslane flour. The technology is based on the approved standard AS 02/2011 (Approved standard “Bulgaria”, “white” bread). It is adapted for bread with additives and consists of 10 stages. Part of the technological operations are carried out at room temperature, and those in which fermentation occurs are realized at 25–30 °C and air humidity 65–85%RH. The total time for preparing bread using the technology presented in this way is 5.0–5.5 h.

3.3. Determination of Basic Characteristics of Bread

The preparation of samples for measurement followed the AACC 02-52.01 methodology for hydrogen-ion activity (pH) using the electrometric method. Distilled water was heated to 70 °C, and the bread sample was mixed with the water in a 1:10 ratio (5 g of bread in 50 mL of water). The mixture was stirred by hand periodically until a homogeneous solution was formed, then allowed to cool to room temperature. Each parameter was measured three times consecutively, and the average value along with the standard deviation was calculated.
The temperature of the solutions was measured using a digital thermometer (V&A VA6502, Shanghai Vihua V&A Instrument Co., Ltd., Shanghai, China). The mass of the raw materials was measured using a technical scale (Pocket Scale MH-200, ZheZhong Weighing Apparatus Factory, Yongkang City, Zhejiang Province, China), with a maximum capacity of 200 g and a resolution of 0.02 g.
The active acidity (pH), total dissolved solids (TDS, ppm), and electrical conductivity (EC, µS/cm) were determined using a multiparameter measuring device (PH-3508, Hangzhou Lohand Biological Co., Ltd., Jiubao Town, Jianggan District, China). The oxidation-reduction potential (ORP, mV) was measured with a dedicated ORP meter (ORP-2069, Shanghai Longway Optical Instruments Co., Ltd., Shanghai, China).
Thermal losses of bread TL,% were calculated using the following formula:
T L = W d W b W d × 100 ,   %
where Wd is the mass of the dough and Wb is the mass of the bread.

3.4. Organoleptic Evaluation of Bread

The organoleptic assessment was conducted in accordance with the methodology for sensory analysis of foods and the BNS EN ISO 13299:2016 standard (Sensory analysis—Methodology—General guidance for establishing a sensory profile). Following the specified procedures, the bread samples were evaluated for appearance, volume, crust and crumb color, chewiness, porosity, taste, and aroma.
A panel consisting of nine trained assessors—lecturers and students from the Department of Food Technologies at the Faculty of Food Technology, Yambol—participated in the sensory evaluation. All participants had prior training in conducting this type of food product analysis.
The ethical requirements outlined in the university’s Code of Ethics (https://trakia-uni.bg/wp-content/uploads/2024/04/EtichenKodeks.pdf, accessed on 10 February 2025) were strictly followed. Informed consent was obtained from each participant. The respondents were selected without consideration of educational background, age, or gender, and they performed their evaluations independently.
Bread samples were rated using a five-point Likert scale (1 = does not correspond at all to the indicator; 5 = completely corresponds to the indicator) [25]. This scale was selected based on the recommendations of Aybek et al. [26]. An overall average score was calculated to summarize the organoleptic characteristics of the bread enriched with pigweed or purslane flour.

3.5. Determining the Main Characteristics of Bread from Three-Dimensional Images

The resulting loaf of bread was scanned with a 3D scanner, model SOL CA73A (Scan Dimension, Alleroed, Denmark), with a rotating work table. The scanning was performed with the SOL Creator Ver. 22 software (Scan Dimension, Alleroed, Denmark). A laptop was used that met the technical requirements for working with the 3D scanner (CPU 4 core; RAM 16 GB; GPU 2 GB, Open GL 3.3; OS Win 10). The laptop has a microprocessor, model i5-1240p (Intel Corp., Santa Clara, CA, USA). RAM with a capacity of 32 GB (ADATA Technology Co., Ltd., New Taipei City, Taiwan). SSD disk with a capacity of 512 GB, model 2450 NVMe (Micron Technology, Inc., Boise, ID, USA). Video card model GeForce RTX 2050 Mobile (NVIDIA Corp., Santa Clara, CA, USA).
Figure 1 shows a general view of the experimental setup with the SOL CA73A 3D scanner. When scanning, the space around the object must be darkened with the included cover.
The 3D images of the object—bread, are stored in the *.OBJ file format. Its conversion to *.STL was performed with the online tool ImageToSTL (https://imagetostl.com, accessed on 15 January 2025).
In the STL file, the 3D object is represented as a series of connected triangles [27]. Each triangle is uniquely defined by its three vertices and one normal vector. These triangles together describe the surface of the object with a sufficiently high degree of detail. The greater the number of triangles used to depict the object, the finer and more accurate its representation.
The volume (V) from the 3D image of the bread is calculated using the following formula:
V = 1 6 i = 1 N v 1 ( i ) v 2 ( i ) v 3 ( i ) ,   m 3
where N is the number of triangular surfaces of the three-dimensional object; v1, v2 and v3 are the vertices of the ith triangle.
The surface area (S) of a 3D object (bread) is defined as the sum of the areas of all triangles of the 3D object, according to the following formula:
S = i = 1 N S i ,   m 2
where the area of the ith triangle is:
S i = 1 2 c i ,   m 2
c i = e 1 ( i ) e 2 ( i )
where e1 and e2 are vectors from the edges of the triangles and ci is the cross product of these vectors.
The density (D) of the three-dimensional object (loaf) is determined by the formula:
D = m V ,   k g / m 3
where m is the mass of the object in kg and V is the volume of the object in m3.
The dimensional profile of the loaf of bread is the minimum parallelepiped that can be described around its three-dimensional image. The vertices vi of the three-dimensional object are defined as:
v i = x i , y i , z i
where x, y and z are three-dimensional vertices and i = 1, …, N; N is the number of vertices of the three-dimensional object.
The maximum and minimum coordinates along all axes can be defined as:
x m i n = m i n x 1 , x 2 x N ,   m ;   x m a x = m a x x 1 , x 2 x N , m y m i n = m i n y 1 , y 2 y N ,   m ;   y m a x = m a x y 1 , y 2 y N , m z m i n = m i n z 1 , z 2 z N ,   m ;   y m a x = m a x z 1 , z 2 z N , m
where N is the number of vertices of the three-dimensional object.
The three main dimensions—length (L), width (W) and height (H) of the minimal parallelepiped, are determined by the following formulas:
L = x m a x x m i n ,   m
W = y m a x y m i n ,   m
H = z m a x z m i n ,   m
The volume (Vbb) of the minimal parallelepiped is determined by:
V b b = L × W × H ,   m 3
The surface area (Sbb) of the minimal parallelepiped circumscribed around the three-dimensional image of the bread is calculated by:
S b b = 2 ( L × W + L × H + W × H ) ,   m 2

3.6. Obtaining Color Digital Images

The color digital images of bread were obtained with a video sensor of a mobile phone model E32S (Motorola, Inc., Schaumburg, IL, USA). The microprocessor is a CPU ARM Cortext A53 and a chipset Mediatek MT6765V/CB Helio G37 (12 nm), video sensor PowerVR GE8320 (OmniVision Technologies Inc., Santa Clara, CA, USA). The characteristics of the video sensor are: Focal length 26 mm; Maximum resolution 16 MP, pixel size 1 µm; Aperture size F2.2.
The homogeneous illumination of the captured scene is provided by a light source, which consists of a dome-shaped part, in which white LEDs with cold white light (6400 K) are installed, model VT-3528-60 (V-TAC Europe Ltd., Plovdiv, Bulgaria), with a maximum intensity of the emitted light at 450 nm.
The color adjustment was made with a 24-color field color chart Danes Picta Color chart BST11 (Danes-Picta, Praha, Czech Republic).
Color digital images in RGB color model were obtained, which were converted to Lab color model according to CIE 1976. Functions for converting color components at observer 2° and illuminance D65 were used.
The color difference ΔE was determined [28].
The color difference (ΔE) for bread with additives was calculated using the following formula:
E = ( L c L a ) 2 + ( a c a a ) 2 + ( b c b a ) 2
where Lc, ac, bc are color components from Lab color model of the control sample; La, aa, ba—color components from Lab color model of the sample with alternative flour.
ΔE is widely used in various industries, including printing, photography and display manufacturing, food technology, automotive industry, etc., to ensure color accuracy and consistency. The lower the ΔE value, the smaller the color difference and the more accurate the color reproduction. ΔE measures the “distance” between two colors in the CIE Lab color space. ΔE values range from 0 to 100, with 0 indicating no difference and 100 indicating maximum difference. ΔE values below 1.0 are usually imperceptible to the human eye, while values above 3.0 are noticeable.

3.7. Calculating Color Indices

The values obtained from the Lab and LCh color models (LCh is color model that consists of three components L-lightness, C-Chroma and h-hue) were used to calculate color indices. The indices were determined according to the formulas summarized by Pathare et al. [29]. These indices reflect the changes in the brown, yellow, and white colors of the studied samples. They also represent relationships between the color components of the specified models.
The color indices were used in terms of which color changes they correspond to, regardless of the objects for which they were intended in their original form. Their advantage over direct use of color components (for example L, a and b from Lab color model) is that they show the color changes in the object more precisely. Indices from ci1 to ci5 are the color components L(Lab), a (Lab), b(Lab), C(LCh), and h(LCh), according to International Commission on Illumination CIE 1976. The meaning of the remaining indices is as follows: ci6 measures the degree of yellowness; ci7 quantifies how close the color of the object is to white.; ci8 measures the change in the brown color of the object; ci9 reflects the saturation or intensity of the color; ci10 indicates changes in the green color; ci11 reflects the illuminance or brightness level; ci12 quantifies the chromaticity of the object, which is the ratio of green-red “a” to blue-yellow “b”; ci13 is based on the balance between chromaticity and brightness; ci14 reflects the degree of fading or loss of color; ci15 evaluates the level of whiteness; ci16 quantifies changes in the green color of the object.
The C and h components of the LCh color model were calculated using the formulas:
C = a 2 + b 2 h = tan 1 b a
where a and b are the color components from the Lab model. The L-component in LCh corresponds to the same as the Lab model.
The color indices used are calculated using the following formulas:
c i 1 = L
c i 2 = a
c i 3 = b
c i 4 = C
c i 5 = h
c i 6 = 142.86 × b L
c i 7 = 100 ( 100 L ) 2 + a 2 + b 2
c i 8 = x 0.31 0.17 x = a + 1.75 × L 5.645 × L + a 0.012 × b
c i 9 = a 2 + b 2
c i 10 = 180 h L + C
c i 11 = 2000 × a L × C
c i 12 = a b
c i 13 = a b + a L
c i 14 = L b
c i 15 = L b
c i 16 = 1000 × a L + h

3.8. Determination of Bread Porosity

Methods for obtaining, processing and analyzing color digital images (in particular, image thresholding) are successfully used to assess the quality of bread by counting and distributing the pores [30,31,32,33,34].
The RGB image was converted to HSV. Data for the three components H, S and V of the HSV color model were used.
The HSVi index was calculated from the HSV model, which represents the image of the bread crumb:
H S V i = H S V
where H, S and V are the three color components of the HSV model.
The resulting image was converted to black and white by binarization thresholding. The automatic determination of the binarization threshold of the resulting image was performed using the Otsu method.
T = a r g m i n t w 1 t σ 1 2 t + w 2 t σ 2 2 t
where w1(t) and w2(t) are the weights of the two classes (the pixels below and above the binarization threshold); σ12(t) and σ22(t) are the variances of the two classes.
The number of black (Nb) and white (Nw) pixels in the image is determined. The porosity (P) of the bread is determined by the following formula:
P = 1 N w N w + N b × 100 ,   %
Figure 2 shows the steps in implementing the proposed algorithm for determining bread porosity. The original RGB image is concatenated to HSV. The three components H, S and V are extracted and an HSVi index is calculated for each pixel of the image. A binarization threshold is determined using the Otsu method. The black-and-white image from which the bread porosity is calculated is presented.
Prioritizing the V component is only appropriate when comparing calculations from images obtained under identical lighting conditions. In this work, a homogeneous lighting system was used when capturing the bread samples.

3.9. Obtaining Spectral Characteristics

Obtaining spectral characteristics of diffuse reflectance for bread was performed by converting the values from the LMS color model into reflectance spectra in the VIS spectral region, in the range 390–730 nm, according to mathematical relationships, in which the conversion is possible in both directions of the equality [35]. The mathematical relationships for conversion from RGB to spectra in the visible spectral region SVIS are:
X Y Z = R G B × M X Y Z
M X Y Z = 0.5767 0.2974 0.027 0.1855 0.6273 0.0707 0.1882 0.0753 0.9911
L M S = X Y Z × M L M S
M L M S = 0.7328 0.4296 0.1624 0.7036 1.6975 0.0061 0.0030 0.0136 0.9834
L = 380 780 A λ L ¯ λ d λ ; M = 380 780 A λ M ¯ λ d λ ;   S = 380 780 A λ S ¯ λ d λ
R V I S = L 2 + M 2 + S 2
where M is a transformation matrix for the specified observer and illumination conditions. XYZ to LMS color model transformation functions [36] are used. A color to VIS reflectance spectrum transformation matrix is A(λ) for the specified observer and illumination. These matrices are available in [37] for the VIS region (CIE 1931, 2°, modified 1951 and 1978). The transformation functions used are for observer 2° (Stiles and Burch 2°, RGB) and illuminance D65 [average daylight with UV component (6500 K)].

3.10. Calculation of Spectral Indices

Spectral indices are calculated according to Atanassova et al. [38]. These indices reflect the changes in the red, green, blue and orange colors of the sample. Also, photochemical processes, as well as statistical relationships between them, which are determined by kurtosis, normalization, mean value.
Spectral indices are used in terms of which changes in the spectrum of the studied products correspond to, regardless of the objects for which they are intended in their original form: SI1, measures the relative amount of red color in the object; SI2 shows changes in the color of the object; SI3, assesses the presence of yellow-orange color in the object; SI4, combines the reflection in different spectral wavelengths; SI5, reflects the intensity of the green color; SI6, improves the information about the green color; SI7, calculates the difference between the green and red zones in the reflection spectra; SI8, shows changes in the RGB color channels; SI9, quantifies the intensity of green; SI10, corrects for the effects of visible light noise; SI11, enhances the green color signal.
These indices are calculated from the reflectance values in the VIS range of the spectrum (380–780 nm) and have the following mathematical formulas:
S I 1 = R 740 R 720
S I 2 = R 530 R 570 R 530 + R 570
S I 3 = 1 R 510 1 R 550
S I 4 = 0.5 × ( 120 × R 750 R 550 200 × R 670 R 550 )
S I 5 = R 550 R 680
S I 6 = 2 × R 520 R 620 R 420 R 520 + R 620 + R 420
S I 7 = R 520 R 620 R 520 + R 620
S I 8 = R 520 2 R 620 × R 420 R 520 2 + R 620 × R 420
S I 9 = 2 × R 520 R 620 R 420 2 × R 520 + R 620 + R 420
S I 10 = R 520 R 620 R 520 + R 620 R 420
S I 11 = 2 × R 520 R 620 R 420

3.11. Method Used for Selection of Informative Features

RReliefF is an extension of the ReliefF algorithm, designed for feature selection in both classification and regression tasks. It estimates the relevance of features by assessing how well they differentiate between instances with varying response values. Unlike ReliefF, which is typically applied to classification problems, RReliefF handles continuous dependent variables. The algorithm prioritizes features that display similar values among neighbors with similar responses and differing values among neighbors with different responses. Additionally, RReliefF introduces a weighting mechanism that uses intermediate weights during the evaluation process to compute the final feature importance scores [39,40].

3.12. Methods Used to Reduce the Volume of Data in Feature Vectors

Principal Component Analysis (PCA). The task of PCA is to separate variables that are linear combinations of orthogonal variables and are uncorrelated with each other. Principal components can be considered geometrically as an axis of rotation around the original data in coordinates relative to an orthogonal axis, the amount of variation in the data determines their arrangement [41].
In the sample (x, y), x is an input variable, and y is a dependent variable relative to x and y must be determined from x ϵ [yIx], the regression line is described by the dependence:
y = m x + c
representing the sum of the squares of the perpendicular distances from the points with coordinates (x, y) to this line, the variable defined by the line is the first principal component, while the second component is the variable defined by a line orthogonal to the first [42].
The method PCA generates an orthogonal coordinate system, with axes ordered according to the variance in the original data to which the corresponding principal component refers. In the covariance matrix K of the data:
K = E [ ( x x ¯ ) T ( x x ¯ ) ]
where x is an input variable, one can see the variances for each dimension in the main diagonal and the covariances of the one not in the diagonal [43].
Latent variables (LV). PLS regression is a technique that combines the functions of PCA and multiple linear regression (MLR) [44]. In this method, the predictors of a set of orthogonal factors, known as latent variables, are extracted. They can be used for prediction. Latent variables can be used to create datasets similar to those of PCA. Latent variables are obtained as linear combinations of predictors X that best explain the response matrix Y. The goal is to maximize the covariance between X and Y.

3.13. Determining the Influence of the Addition of Pigweed and Purslane on the Characteristics of Bread

The PCA method was used to determine which of the wheat bread characteristics are affected by the addition of pigweed and purslane flour. Table 4 presents the combinations of the feature-amount of alternative flour. Before processing with the PCA method, the data in the table were normalized in the interval [0; 1].

3.14. Regression Methods Used

The data from the obtained feature vectors describing the characteristics of bread are not used directly, but new regression factors are created that summarize information from the entire spectrum of the data used [45]. For this purpose, the most commonly used methods are principal component regression (PCR) and partial least squares regression (PLSR). The sequence of operations for creating and evaluating PLSR and PCR predictive models is available in the Matlab 2017b Statistics Toolbox. The methods PCR and PLSR were used as a preliminary analysis of the possibility of predicting the bread characteristics.
The results from PCR and PLSR models are obtained by similar procedures:
  • Model creation. The functions plsregress and pca are used for PLS and PCR regressions;
  • The required number of components is determined. The number of latent variables or principal components is determined graphically, and this number determines whether an adequate model will be obtained;
  • Evaluation of the resulting model. It is evaluated by the coefficient of determination R2, the SSE and RMSE errors.
For analysis and evaluation of PCR and PLSR results, the following statistical parameters are used: coefficient of determination (R2), root mean square error (MSE), root mean square error (RMSE). These evaluation criteria are calculated according to the following mathematical relationships:
R 2 = r s s t s s t s s = i = 1 n ( y i y m e a n ) 2 r s s = i = 1 n ( y i y i   f i t ) 2
M S E = 1 n i = 1 n ( y i   p r e d y i ) 2
R M S E = 1 n i = 1 n ( y i   p r e d y i ) 2
where yi are measured values; ymean—arithmetic mean of measured values; yfit—values from the obtained model; n—number of measurements; yi pred—predicted values.
A regression model, more often applied for food product analysis [46], was used, which has the form:
z = b 0 + b 1 x + b 2 y + b 3 x 2 + b 4 x y + b 5 y 2
where z is the dependent variable. The independent variables are x and y; the model coefficients are denoted b.
The model is evaluated based on:
  • Coefficient of Determination (R2). Measures the proportion of variance in the dependent variable explained by the model; the closer the value of this coefficient is to 1, the better the fit.
  • p-value. Indicates the statistical significance of the model coefficients, with lower values (p < α) suggesting stronger evidence against the null hypothesis.
  • Standard Error (SE). Reflects the mean deviation of the observed values from the predicted values, indicating the precision of the model.
  • Fisher’s Exact Test. Assesses the overall significance of the regression model by comparing the explained and unexplained variance. The F-value should be much less than its critical value Fcr.
  • Analysis of Residuals. It shows the differences between observed and predicted values, evaluating assumptions such as normality, homoscedasticity, and independence.

3.15. Determining the Appropriate Amount of Alternative Flour

To determine the appropriate amount of pigweed and purslane flour in bread, a linear programming algorithm was used, implemented using the linprog function [47] in the Matlab 2017b programming system (The Mathworks Inc., Natick, MA, USA). To determine the appropriate levels of pigweed and purslane flour in the bread formulation, the optimization aimed to minimize the deviation from predefined nutritional targets (such as protein, fiber, and energy content), while also meeting constraints related to ingredient proportions and sensory acceptability. The objective function was designed to select the combination that achieved the best nutritional balance without compromising the overall quality and structure of the final product.
Linear programming is a problem-solving for finding a vector x such that the linear function fTx has linear constraints:
min x f T x
to be executed under one of the following conditions:
A x b               A e q x = b e q                 l x u
An “Interior-point-legacy” algorithm is used. The algorithm reaches a suitable solution by traversing the interior of the data domain [48].
The Interior-point-legacy method in Matlab is based on LIPSOL [49], which is a variant of the “predictor-corrector” algorithm [50].
The algorithm starts by applying preprocessing steps. Then, the problem has the form:
min x f T x ,   s o   t h a t   A x = b 0 x u
The upper bound constraints are implicitly included in the constraint matrix A. With the addition of primary variables s, the equation becomes:
min x f T x ,   s o   t h a t   A x = b x + s = u x 0 ,     s 0
which is called the primary problem. x consists of the primary variables; s also consists of the primary variables. The dual problem is defined as:
m a x b T y u T w ,   s o   t h a t   A T y w z = f z 0 ,     w 0
where y and w consist of the double variables; z consists of the double gaps. The optimality conditions for this linear program, i.e., the previous two primary and dual equations, are:
F x , y , z , s , w = A x b x + s w A T y w + z f x i z i s i w i = 0 x 0 , z 0 , s 0 , w 0
where xizi and siwi are component-wise multiplications.
The linprog algorithm uses a different sign convention for the returned Lagrange multipliers than described here.
The quadratic equations xizi = 0 and siwi = 0 are completion conditions for the linear program. The other (linear) equations are feasibility conditions. The quantity:
x T z + s T w
is the duality gap, which measures the remainder of the complement part of F when (x, z, s, w) ≥ 0.
The algorithm is a “primal-dual algorithm”, meaning that both the primal and dual programs are solved simultaneously. It can be considered a Newton-like method applied to the linear-quadratic system F(x, y, z, s, w) = 0, while preserving the iterations x, z, w and being positive, hence the name “interior-point”.
The algorithm is a variant of the “predictor-corrector” algorithm proposed by Mehrotra. For example, for the iteration v = [x; y; z; s; w], where [x; z; s; w] > 0, the so-called predictor direction is first calculated:
v p = F t v 1 F ( v )
which is the Newton direction. Then, the so-called corrector direction:
v c = F t v 1 F ( v + v p μ e ^ )
where μ > 0 is a centering parameter and should be chosen carefully. A zero-one vector “e” with those corresponding to the quadratic equations in F(v), i.e., the perturbations are applied only to the complementarity conditions, all of which are quadratic, but not to the feasibility conditions, which are linear. The two directions are combined with a step length parameter α > 0 and update v to obtain the new iteration v+:
v + = x + ; y + ; z + ; s + ; w +
satisfying the condition:
x + ; y + ; z + ; s + ; w + > 0
When solving the previous predictive/corrective directions, the algorithm computes a (thin) direct factorization on a modification of the Cholesky factors of AAT. If A has dense columns, it uses the Sherman–Morrison formula instead. If this solution is not adequate (the residual is too large), it performs an LDL factorization [51] of the extended system form of the step equations to find a solution. The algorithm then loops until the iterations converge. The main criterion for stopping the loop is:
m a x r b m a x 1 , b , r f m a x 1 , f , r u m a x 1 , u , f T x b T y + u T w m a x 1 , f T x , b T y u T w t o l
where
r b = A x b ,     r f = A T y w + z f ,     r u = x + s u
are the principal residual, the double residual, and the upper bound, respectively ({x} denotes those x with finite upper bounds), and:
f T x b T y + u T w
is the difference between the primary and dual objective values, and tol is a certain tolerance. The sum in the loop stopping criteria measures the total relative errors under optimality conditions.
The primary infeasibility measure is ||rb||, and the dual infeasibility measure is ||rf||, where the norm is Euclidean.
The statistical data processing and visualization of the obtained results was performed with the following software products:
  • MS Office Ver. 2016 (Microsoft Corp., Redmond, WA, USA). An office suite containing tools such as Word, Excel, and PowerPoint for document creation, data analysis, and presentations;
  • Matlab Ver. 2017b (The mathworks Inc., Natick, MA, USA). A high-performance programming environment for numerical analysis, data visualization, and algorithm development.
  • Statistica Ver. 12 (TIBCO Software Inc., Palo Alto, CA, USA). Statistical data processing software offering tools for data visualization, advanced analysis, and modeling.
  • SOL Creator Ver. 22 (Scan Dimension, Alleroed, Denmark). Software for working with a 3D scanner.
One-Way ANOVA was used to analyze the data. A post hoc LSD test was also performed to determine the degree of significance of differences between average values after statistically significant differences (p < 0.05) were found. The Kruskal–Wallis test, which is non-parametric, was used when there was no normal distribution. The obtained values are represented in tables as mean ± standard deviation of triplicate samples. All data were processed at an accepted level of statistical significance α = 0.05.

4. Results and Discussion

The results and discussion part are separated into two main sections. Group of sections 1 (Section 4.1, Section 4.2, Section 4.3 and Section 4.4) includes sections that experimentally characterize the physical, chemical, sensory, and visual properties of bread with pigweed and purslane flour. Group of sections 2 (Section 4.5, Section 4.6, Section 4.7 and Section 4.8) includes sections that analyze, reduce, and model the data to identify key features and determine the optimal additive levels for bread formulation.

4.1. Main Physicochemical and Organoleptic Characteristics of Bread with Pigweed and Purslane Flour

The characteristics of flour from the main raw materials, pigweed and purslane, used as alternative flour in wheat bread, are presented in Table 5. The flour from both raw materials has a slightly acidic pH, with purslane having a slightly higher pH of 5.56 compared to pigweed (5.4). Purslane flour also has higher values for total dissolved solids (2652 ppm) and electrical conductivity (5355 µS/cm), indicating a higher ionic content compared to pigweed, which has a TDS of 2390 ppm and an EC of 4789 µS/cm. On the other hand, a higher oxidation-reduction potential is shown by the flour from pigweed (192 mV) compared to that from purslane (147 mV), which means that pigweed is more oxidizing in nature. These differences indicate the different physicochemical properties of the two main raw materials, which will have an impact when used in bread.
Table 6 shows data on the mass of bread, depending on the amount of pigweed or purslane flour. With increasing amounts of alternative flour, bread with pigweed shows a consistently higher mass, reaching a maximum at 15% of the additive (87.83 ± 0.89 g), while bread with purslane has a lower mass increase, reaching 82.44 ± 0.14 g at 15% additive.
The physicochemical properties of wheat bread prepared with different percentages of pigweed flour compared to the control sample are presented in Table 7. With increasing pigweed flour content, pH decreased from 6.15 for the control to 5.84 at 15% addition, while TDS values increased highly statistically significantly with the addition of pigweed from 1341 ppm in the control sample to 1692 ppm at 15% addition. EC also increased significantly from 2713 µS/cm in the control to 3439 µS/cm at the highest level of pigweed addition. On the other hand, ORP showed a highly significant decrease with increasing additive levels from 262 mV in the control to 169 mV at 15% pigweed flour.
Table 8 summarizes the physicochemical properties of wheat bread enriched with varying levels of purslane flour (5%, 10%, and 15%) in comparison to a control sample without purslane (0%). A gradual decline in pH is observed with increasing purslane flour content—from 6.15 in the control to 6.01 at 15%—indicating a slight rise in acidity. Total dissolved solids (TDS) show a notable increase, rising from 1341 ppm in the control to 1801 ppm at the highest level of addition. Similarly, electrical conductivity increases proportionally, from 2713 µS/cm in the control sample to 3594 µS/cm at 15% purslane inclusion. A marked reduction in oxidation-reduction potential (ORP) is also recorded, dropping from 262 mV in the control to 175 mV in the sample with 15% purslane, suggesting enhanced reducing properties with higher purslane content.
Table 9 presents the results of the organoleptic evaluation of bread with added pigweed flour. The control bread sample showed the highest scores according to all characteristics, which have relatively equal scores (4.97) for appearance, structure, chewiness, aroma, taste, and overall score. The values decrease more categorically with the addition of 5% pigweed, with a total value of 4.36, which indicates a slightly lower acceptance by the sensory panel. Increasing the amount of pigweed flour, a sharp drop in ratings is observed. The bread with 10% addition has low scores for appearance and taste, 1.5 and 1.7, respectively, with a total value of 1.86. For all categories, the lowest results were at 15% additive, with an overall rating of 1.53, indicating a very unfavorable sensory perception at higher levels of the additive. According to Havugimana et al. [11], the reason is that the bitterness caused by saponins, tannins and oxalates significantly affected the taste characteristics.
The results of the organoleptic evaluation of the bread with the addition of purslane flour are shown in Table 10. The highest score is for the control sample. At 5% purslane, the scores decreased to 4.36, showing a slight decrease in the organoleptic parameters, but the bread is still acceptable to the evaluators. In the case of 10% purslane, the scores significantly decreased to 2.5 for appearance and 2.37 for structure, resulting in an overall score of 2.47. The bread with 15% addition has the lowest scores for all characteristics, as seen from the overall score of 1.53, indicating very poor sensory qualities and low acceptability by the evaluators.

4.2. Determining the Main Characteristics of Bread from Its Three-Dimensional (3D) Images

Using the basic mathematical relationships presented in the previous chapter, a Matlab script was created to determine the volume of the bread, surface area, density, minimum parallelepiped, its surface area, and volume.
The stlread function [STL File Reader, 2025] was applied in the Matlab environment to read the STL file.
Table 11 presents a description of the proposed algorithm for determining the main characteristics of bread from its three-dimensional image. After scanning, the dimensions of the three-dimensional image of the bread are in mm, which requires converting its dimensions into basic SI units (e.g., m, kg).
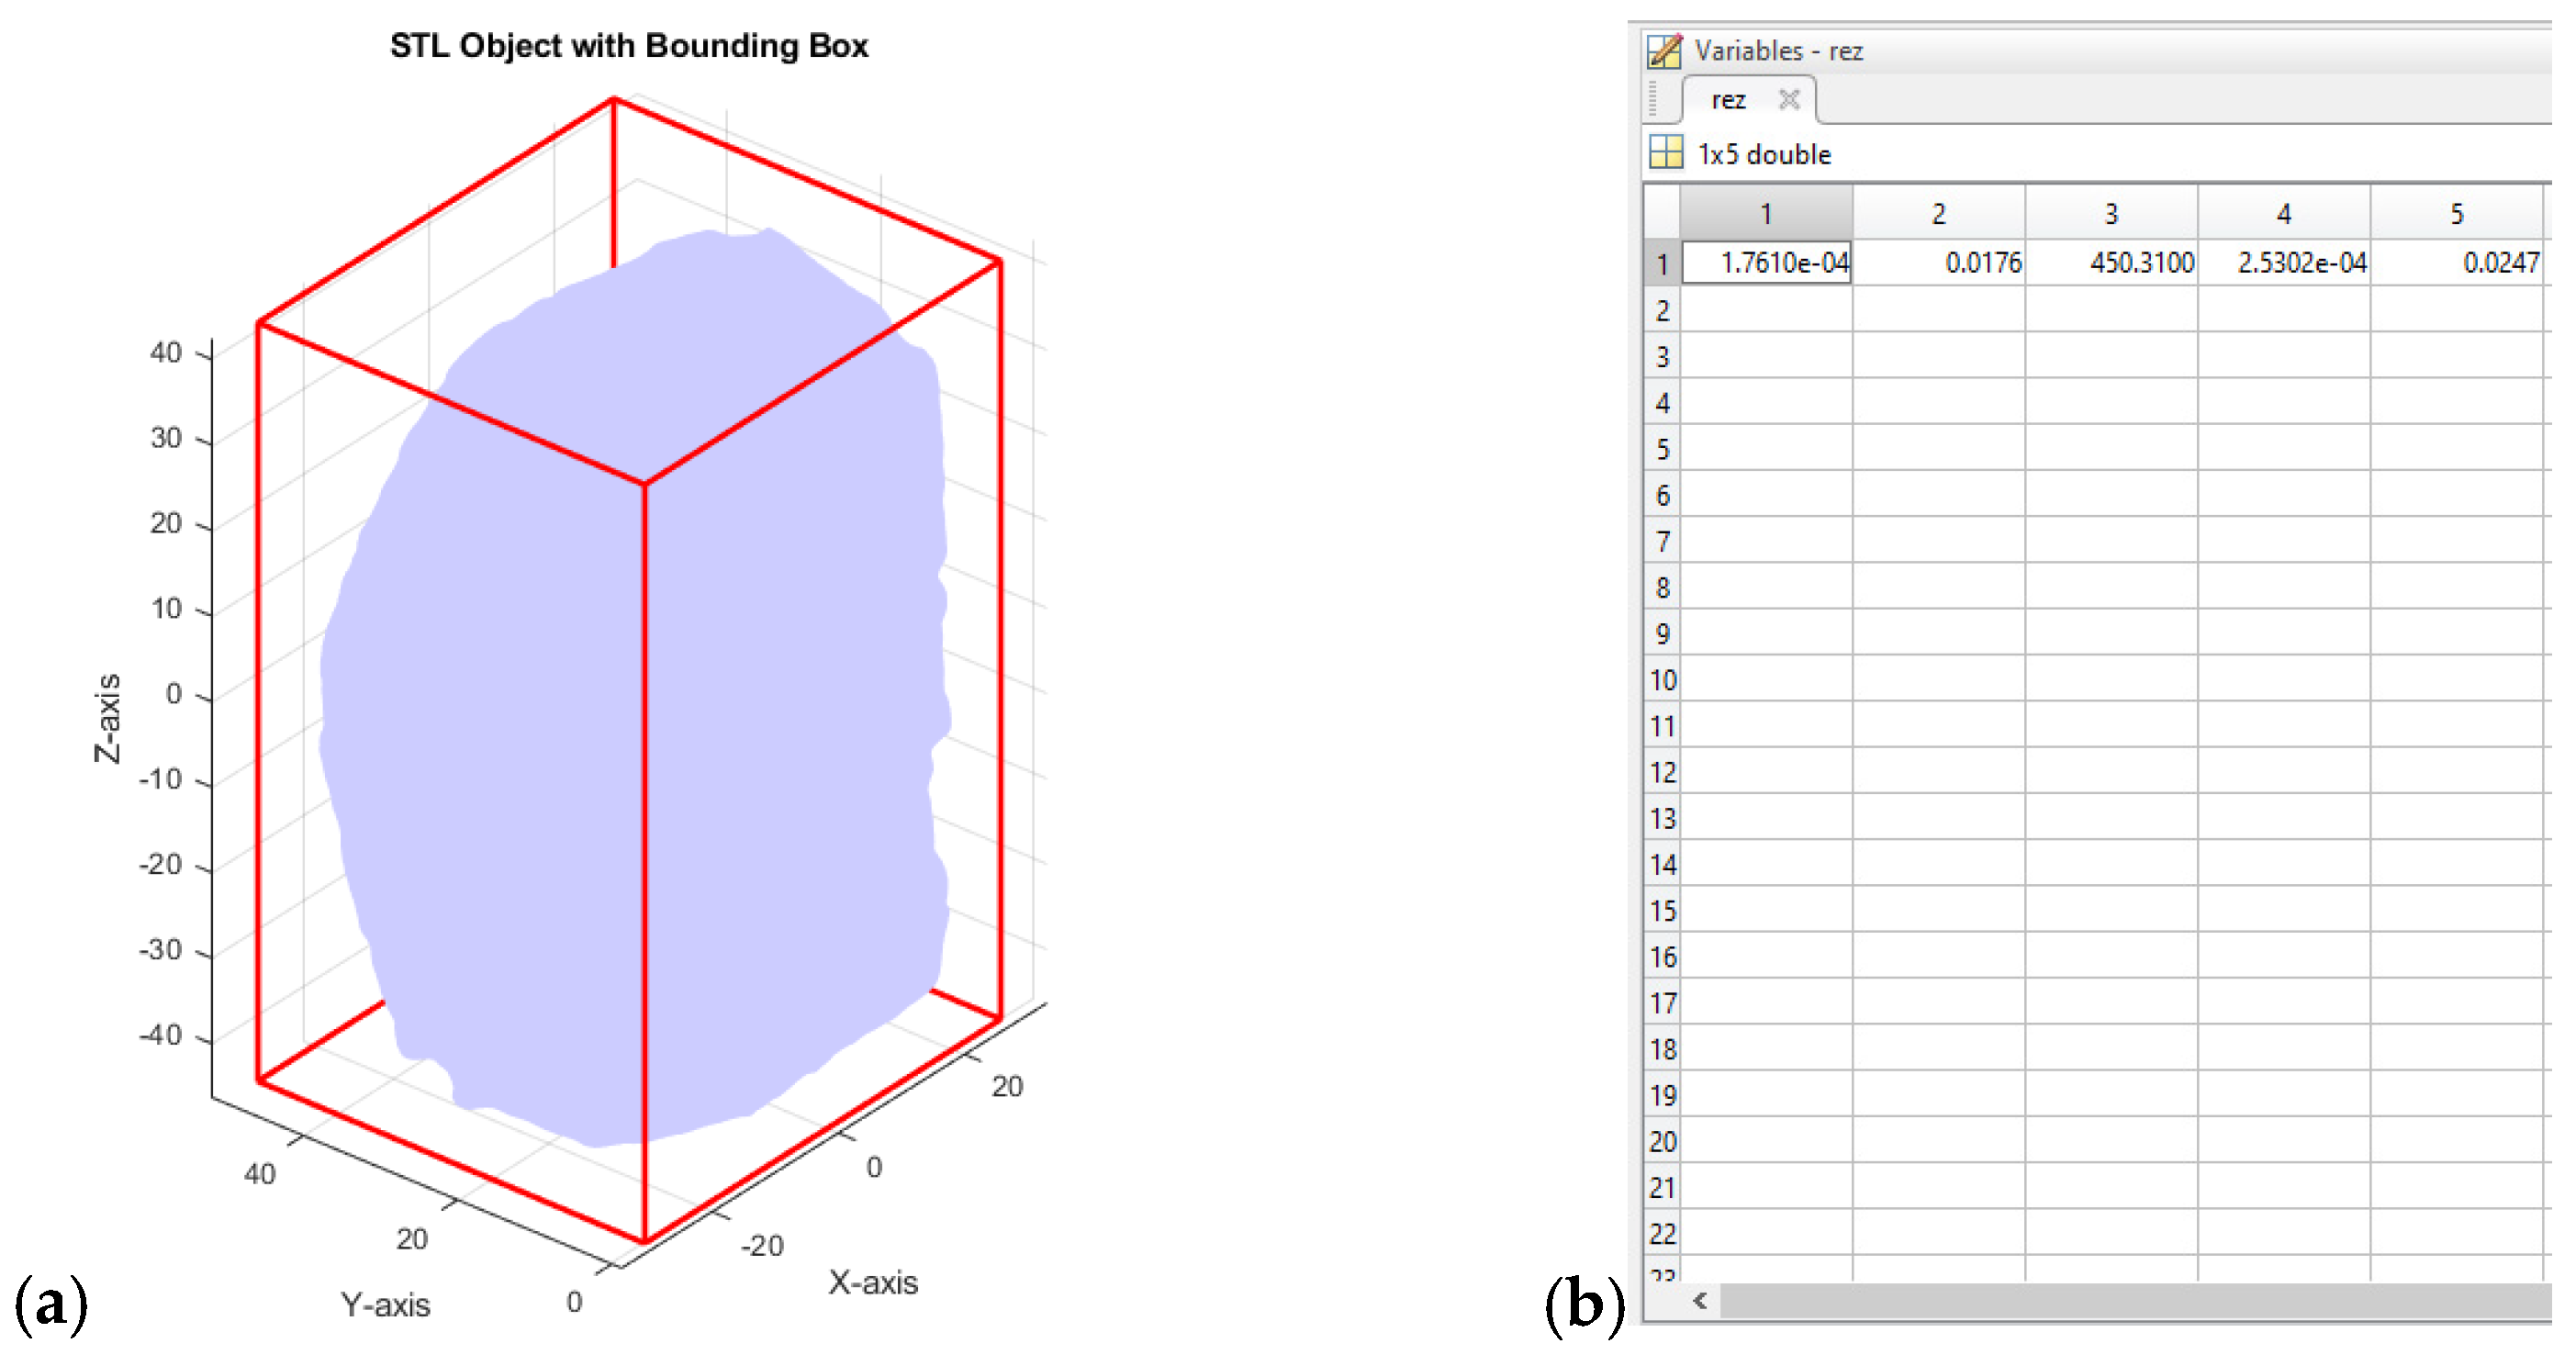
Figure 3 shows the result of the algorithm execution. A three-dimensional scanned image of a loaf of bread with a minimal parallelepiped described around it, in red, and its calculated characteristics are shown. The object has a smooth surface with a light blue coloring, which, through dense coloring, hides the mesh STL model. In cells 1 to 5, the results of calculating V, S, D, Vbb, and Sbb are entered.
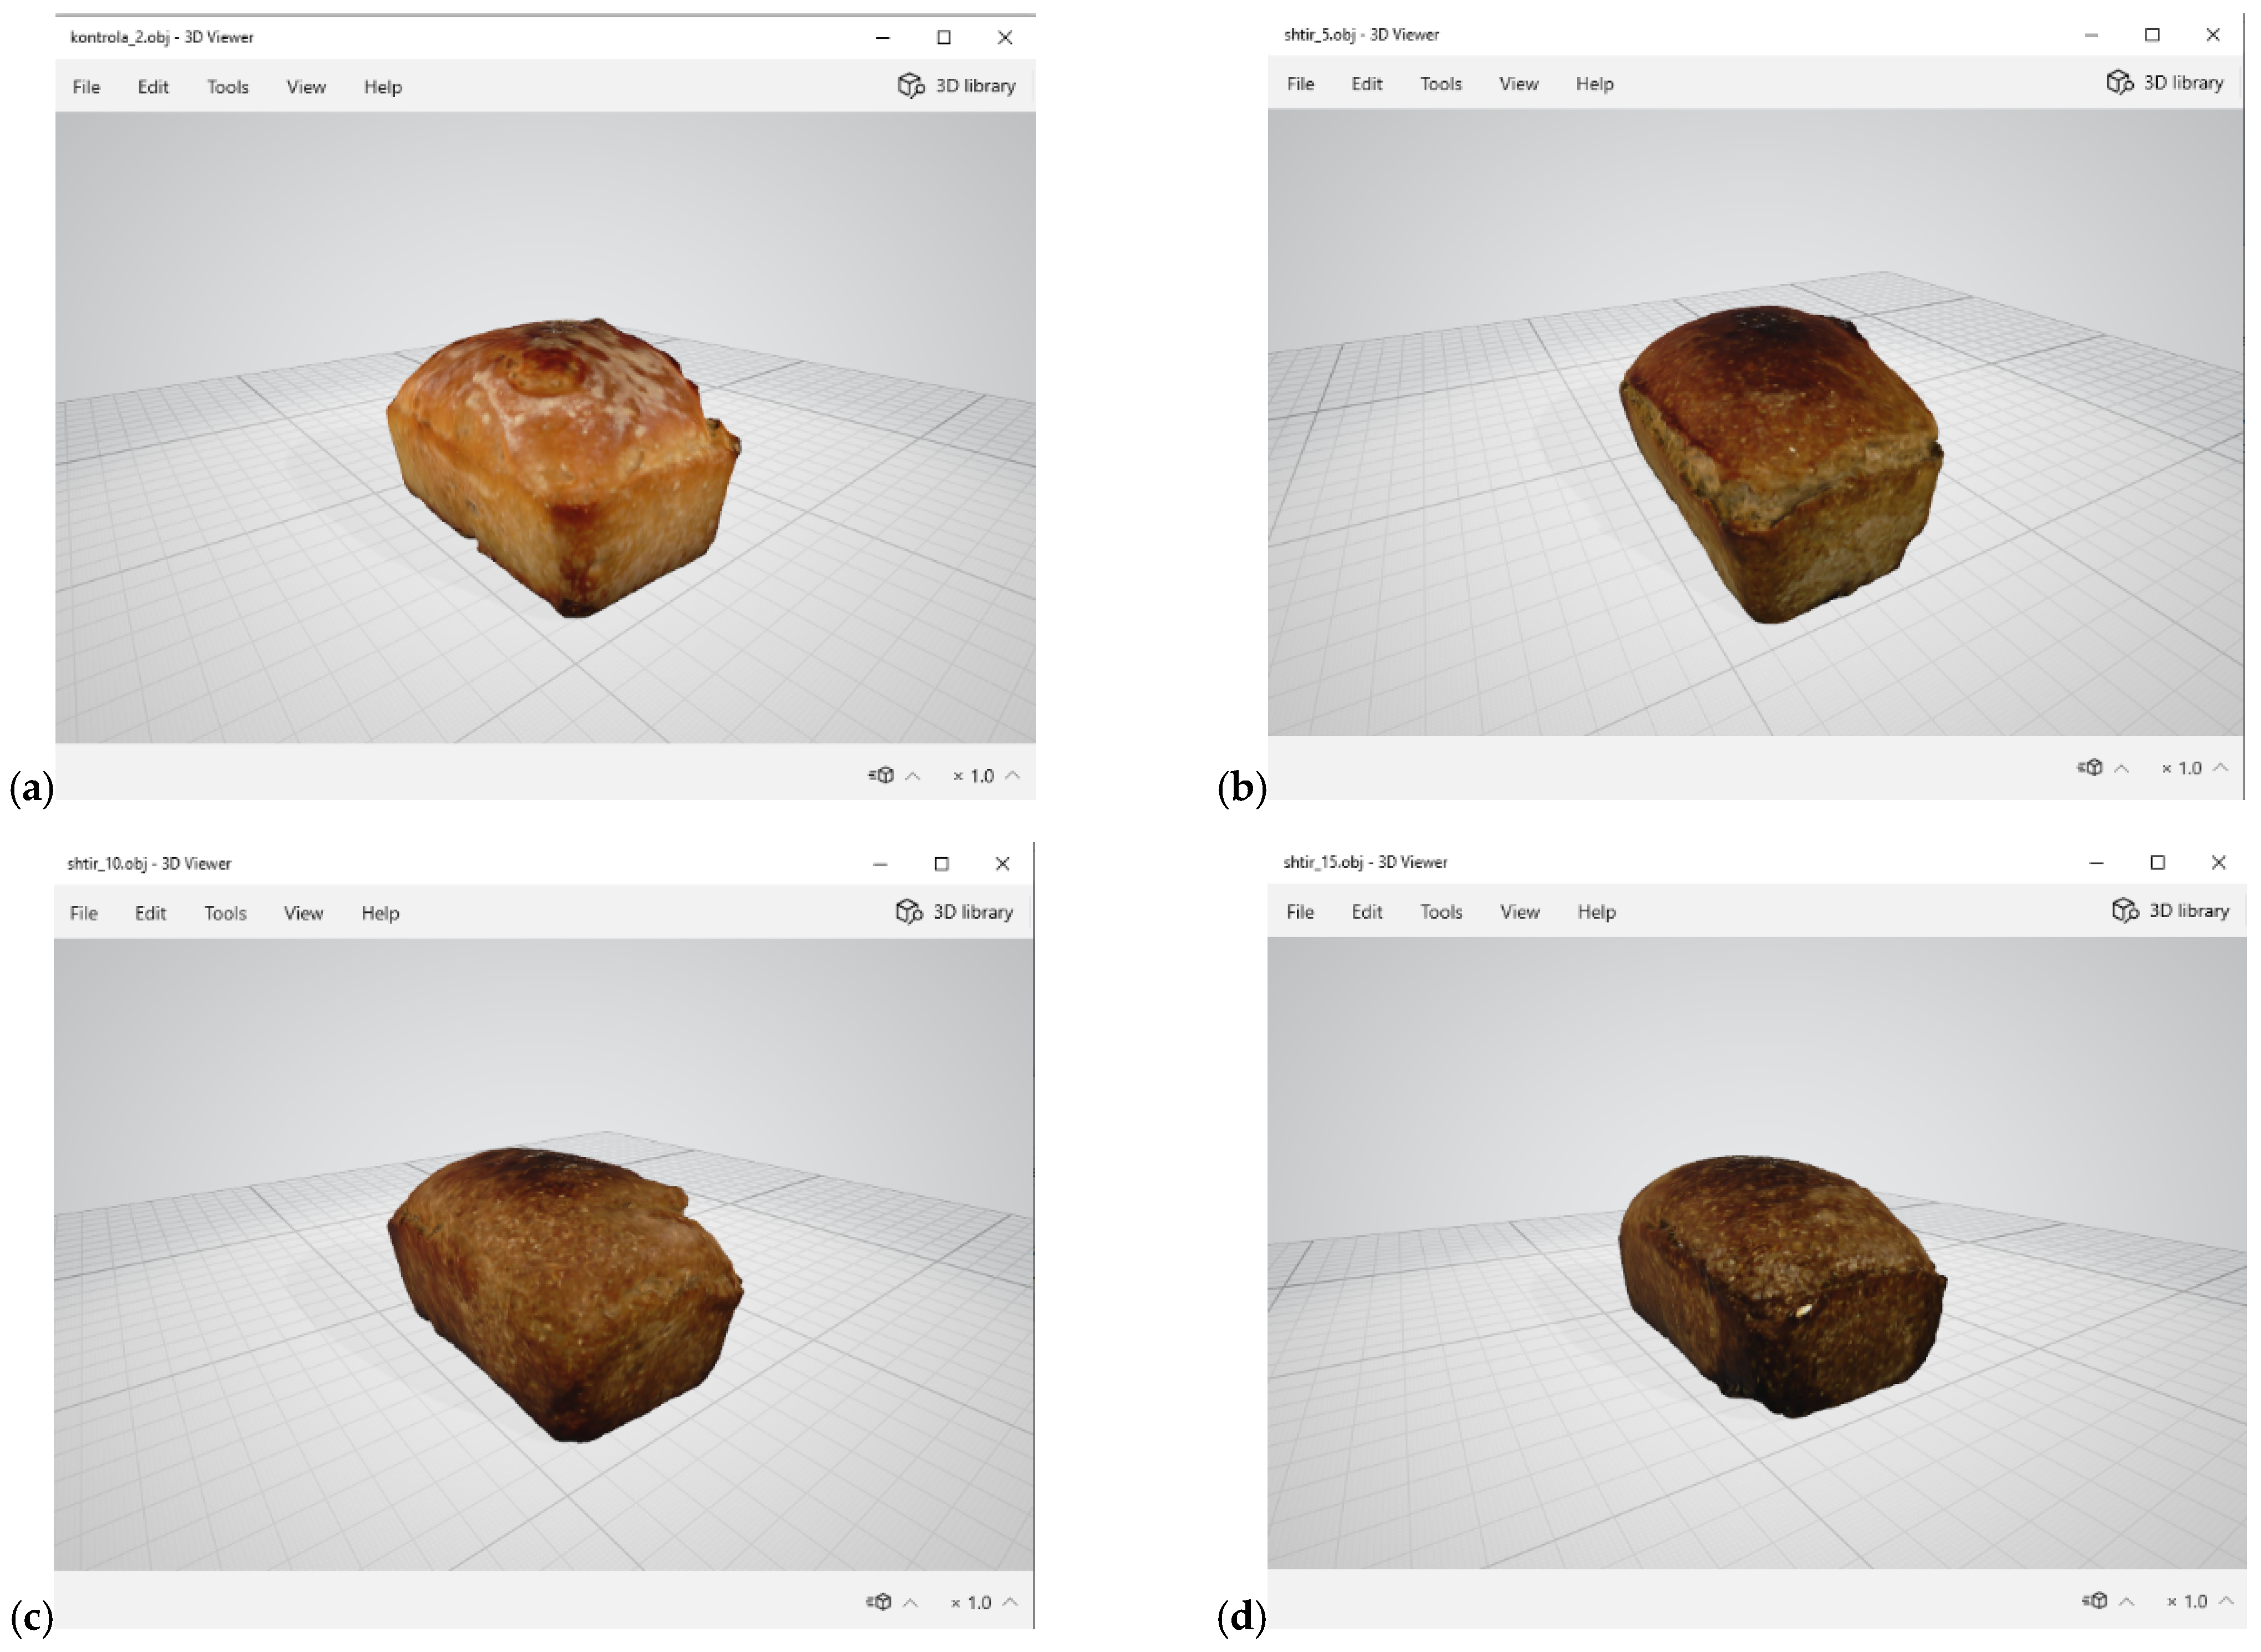
Figure 4 shows 3D-scanned images of bread with different percentages of added pigweed. The objects are presented on a horizontal flat surface. The visualization is textured, which allows analysis of the outer surface of the bread. The objects are centered in the image, viewed from a slightly elevated angle.
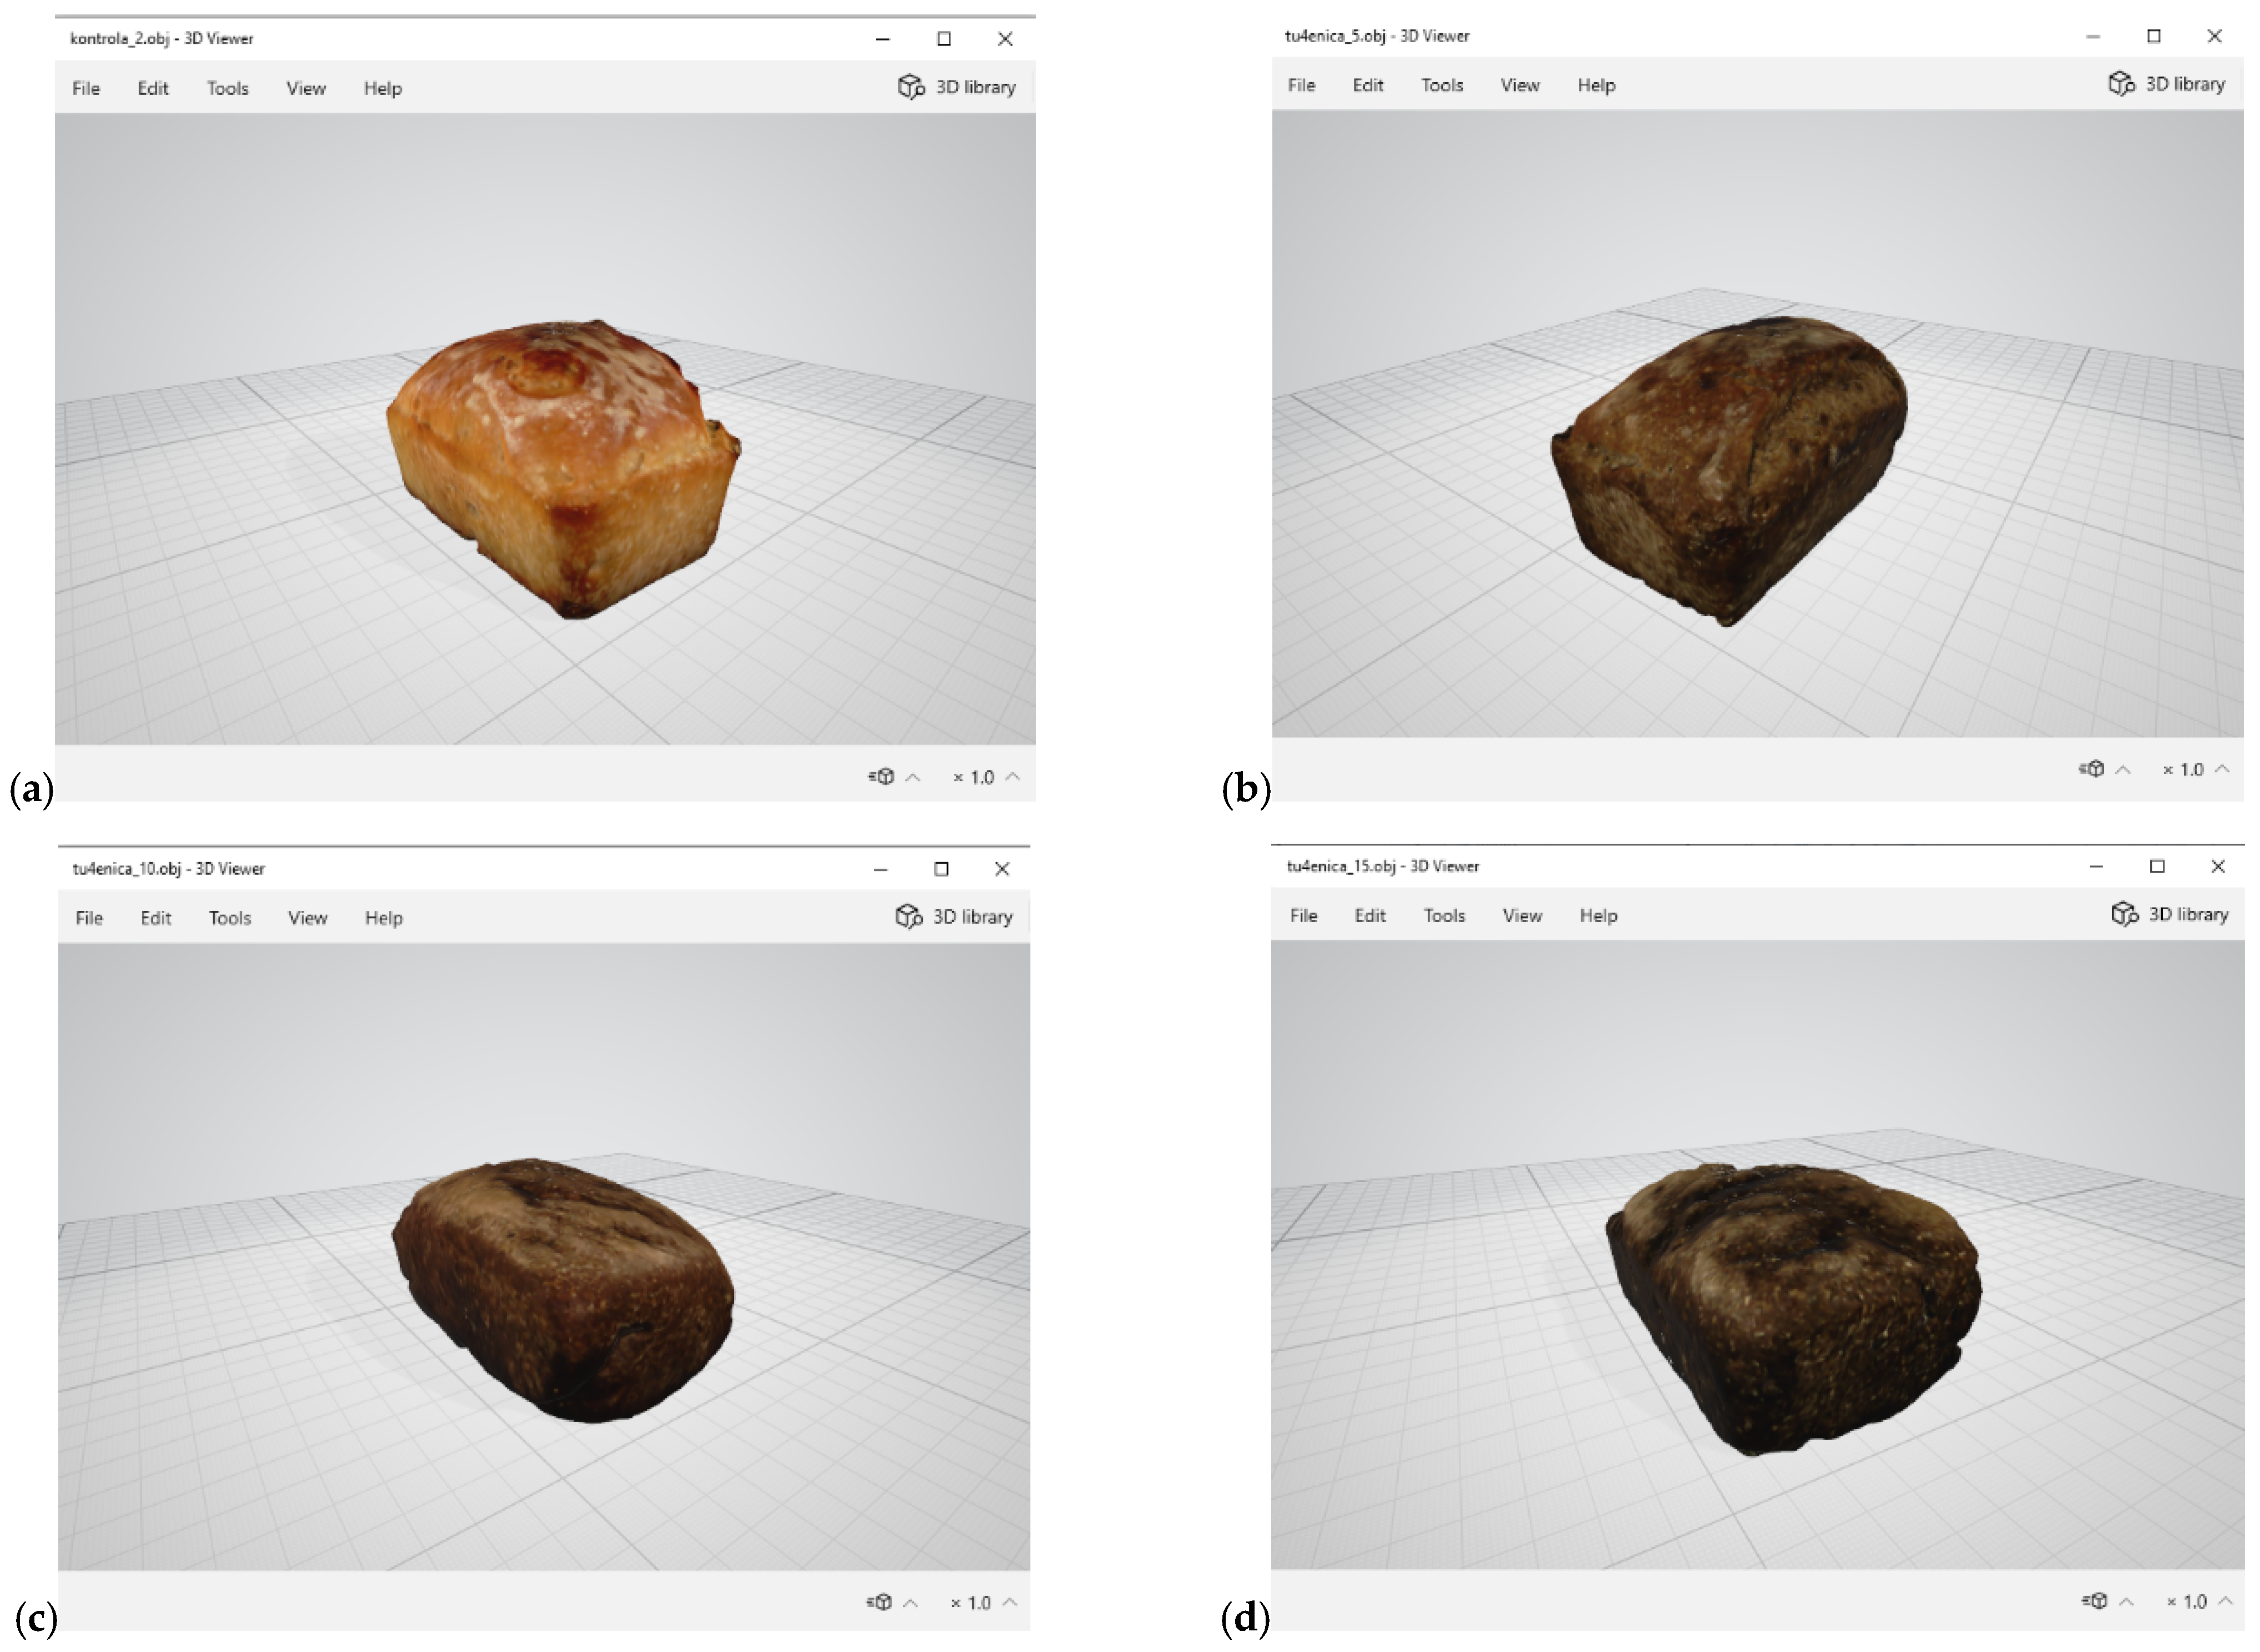
Figure 5 shows 3D-scanned images of bread with different percentages of purslane flour addition. The objects are presented on a horizontal flat surface. The visualization is textured, which allows analysis of the outer surface of the bread. The objects are centered in the image, viewed from a slightly raised angle.
Using the developed algorithm, the main characteristics of bread with pigweed were determined from its three-dimensional images.
Table 12 shows the results of these measurements. Compared to the control sample with 0% pigweed, changes in the physical characteristics of the bread samples are observed with increasing the amount of flour from the plant. The volume for all samples is the same at 0.0002 m3, showing no significant changes. The surface area increases slightly at 5% pigweed to 0.0196 m2 (+8.9%) and 10% pigweed to 0.019 m2 (+5.6%) compared to the control (0.018 m2), but returns to the same value as the control at 15% pigweed. The density decreases gradually for the sample with 5% pigweed—430.08 kg/m3 (−3.1%)—and 10% addition—418.55 kg/m3 (−5.7%), showing a steep slope at 15% pigweed—482.37 kg/m3 (+8.6%), making it denser compared to the control. The volume of the enclosing parallelepiped is constant (0.0003 m3) for all samples. The surface area of the minimum parallelepiped increases for the samples with 5% pigweed (0.026 m2, +4%) and 10% (0.027 m2, +8%), but drops to 0.025 m2 at 15% addition, which is not significantly different from the control. These results show that up to 10% and 5% addition of pigweed increases the surface area, thus making the bread lighter, while 15% addition leads to structural densification, making the density higher at the same volume.
Using the developed algorithm, the main characteristics of purslane bread were determined from its three-dimensional images.
Table 13 shows the results of these measurements. Increasing the purslane content in the bread samples leads to a significant change in their physical characteristics. The volume in all samples (0–10%) remains at 0.0002 m3; it decreases to 0.0001 m3 at 15%, which indicates a shrinkage in size when the purslane level is relatively high. The surface area decreases gradually with increasing purslane content from 0.018 m2 for the control sample to 0.0178 m2 at 5% (−1.1%), 0.016 m2 at 10% (−11.1%), and 0.015 m2 at 15% (−16.7%), reflecting a gradually smoother and more compact structure of the bread.
Density increased with higher purslane content from 444 kg/m3 for the control to 462 kg/m3 for 5% (4%), 531 kg/m3 for 10% (19.6%), and 626 kg/m3 for 15% (41%), reflecting a denser structure after the addition of purslane. The volume of the enclosed parallelepiped remained constant (0.0003 m3) for 0 and 5% and then decreased to 0.0002 m3 at 10 and 15%, reflecting the reduction in bread volume. Furthermore, the surface area of the enclosed parallelepiped decreased from 0.025 m2 in the control to 0.026 m2 at 5% (+4%), then decreased at 10% addition to 0.022 m2 (−12%) and at 15% purslane to 0.021 m2 (−16%), indicating an overall densification of the external dimensions of the bread. Increasing purslane content in the bread made it denser, with a smaller volume and smoother, with a significant decrease in both the surface area and the dimensions of the enclosing parallelepiped at higher levels of addition.

4.3. Results of Analysis of Color Digital Images of Bread

Figure 6 shows images of bread with different percentages of added pigweed flour. In the control sample, the crust is golden brown in color and lighter in the crumb. With the addition of 5% pigweed, the color of the crust is slightly darker, and the crumb is denser with a slight greenish tint. In the sample with 10% pigweed, the crust darkens, and the crumb acquires a more distinct greenish-brown color and becomes denser. The crust is significantly darker in the sample with 15% pigweed. The crumb is very dense and uniform, in a saturated greenish-brown color.
Figure 7 shows images of bread with different percentages of purslane flour addition. With increased percentages of purslane, the appearance of the bread changes significantly. At 5% addition, the crust becomes slightly darker in color compared to the control, with an increasingly rough texture, while the crumb appears denser and grayish in color. At 10% addition, the crust becomes even darker and more matte, with a rough texture, while the crumb is darker and harder, with a uniform brown-gray color. At 15% addition, the crust is much darker with a rough surface, and the crumb becomes significantly denser, with a saturated brown-gray color.
Figure 8 shows the Lab color characteristics of the crust and the center of a bread with pigweed. In the Lab color space, comparing the bread with the additive with the control sample, the one with pigweed has a lower “L” value, therefore a darker color, a higher “a” value, which is redder in color, and a higher “b” value, which indicates a more yellowish hue. They are a consequence of the interaction and chemical reactions between the additive and the other raw materials during the baking process. The samples containing the additive appear darker, redder, and yellower than the control sample. The control sample and the one with 5% pigweed have similar characteristics, both in the crust and the crumb. Also, the data for the samples with 10% and 15% additive visibly overlap.
Figure 9 shows Lab color characteristics of the crust and crumb of bread with purslane. In the crust, the values of the Lab color components are close, but separable, especially for the control sample and those with up to 5% purslane flour. The values change mainly along the vertical axis, in the direction from b = 25 to the beginning of the coordinate system. In the color components of the crumb of the bread, the control sample and the one with 5% purslane flour are highly distinguishable from the other samples. When increasing the amount of the additive, the color components visibly overlap, which is indicative that they are close to each other. In addition, when increasing the amount of purslane flour, the values of the color components are at their low levels, close to the beginning of the coordinate system.
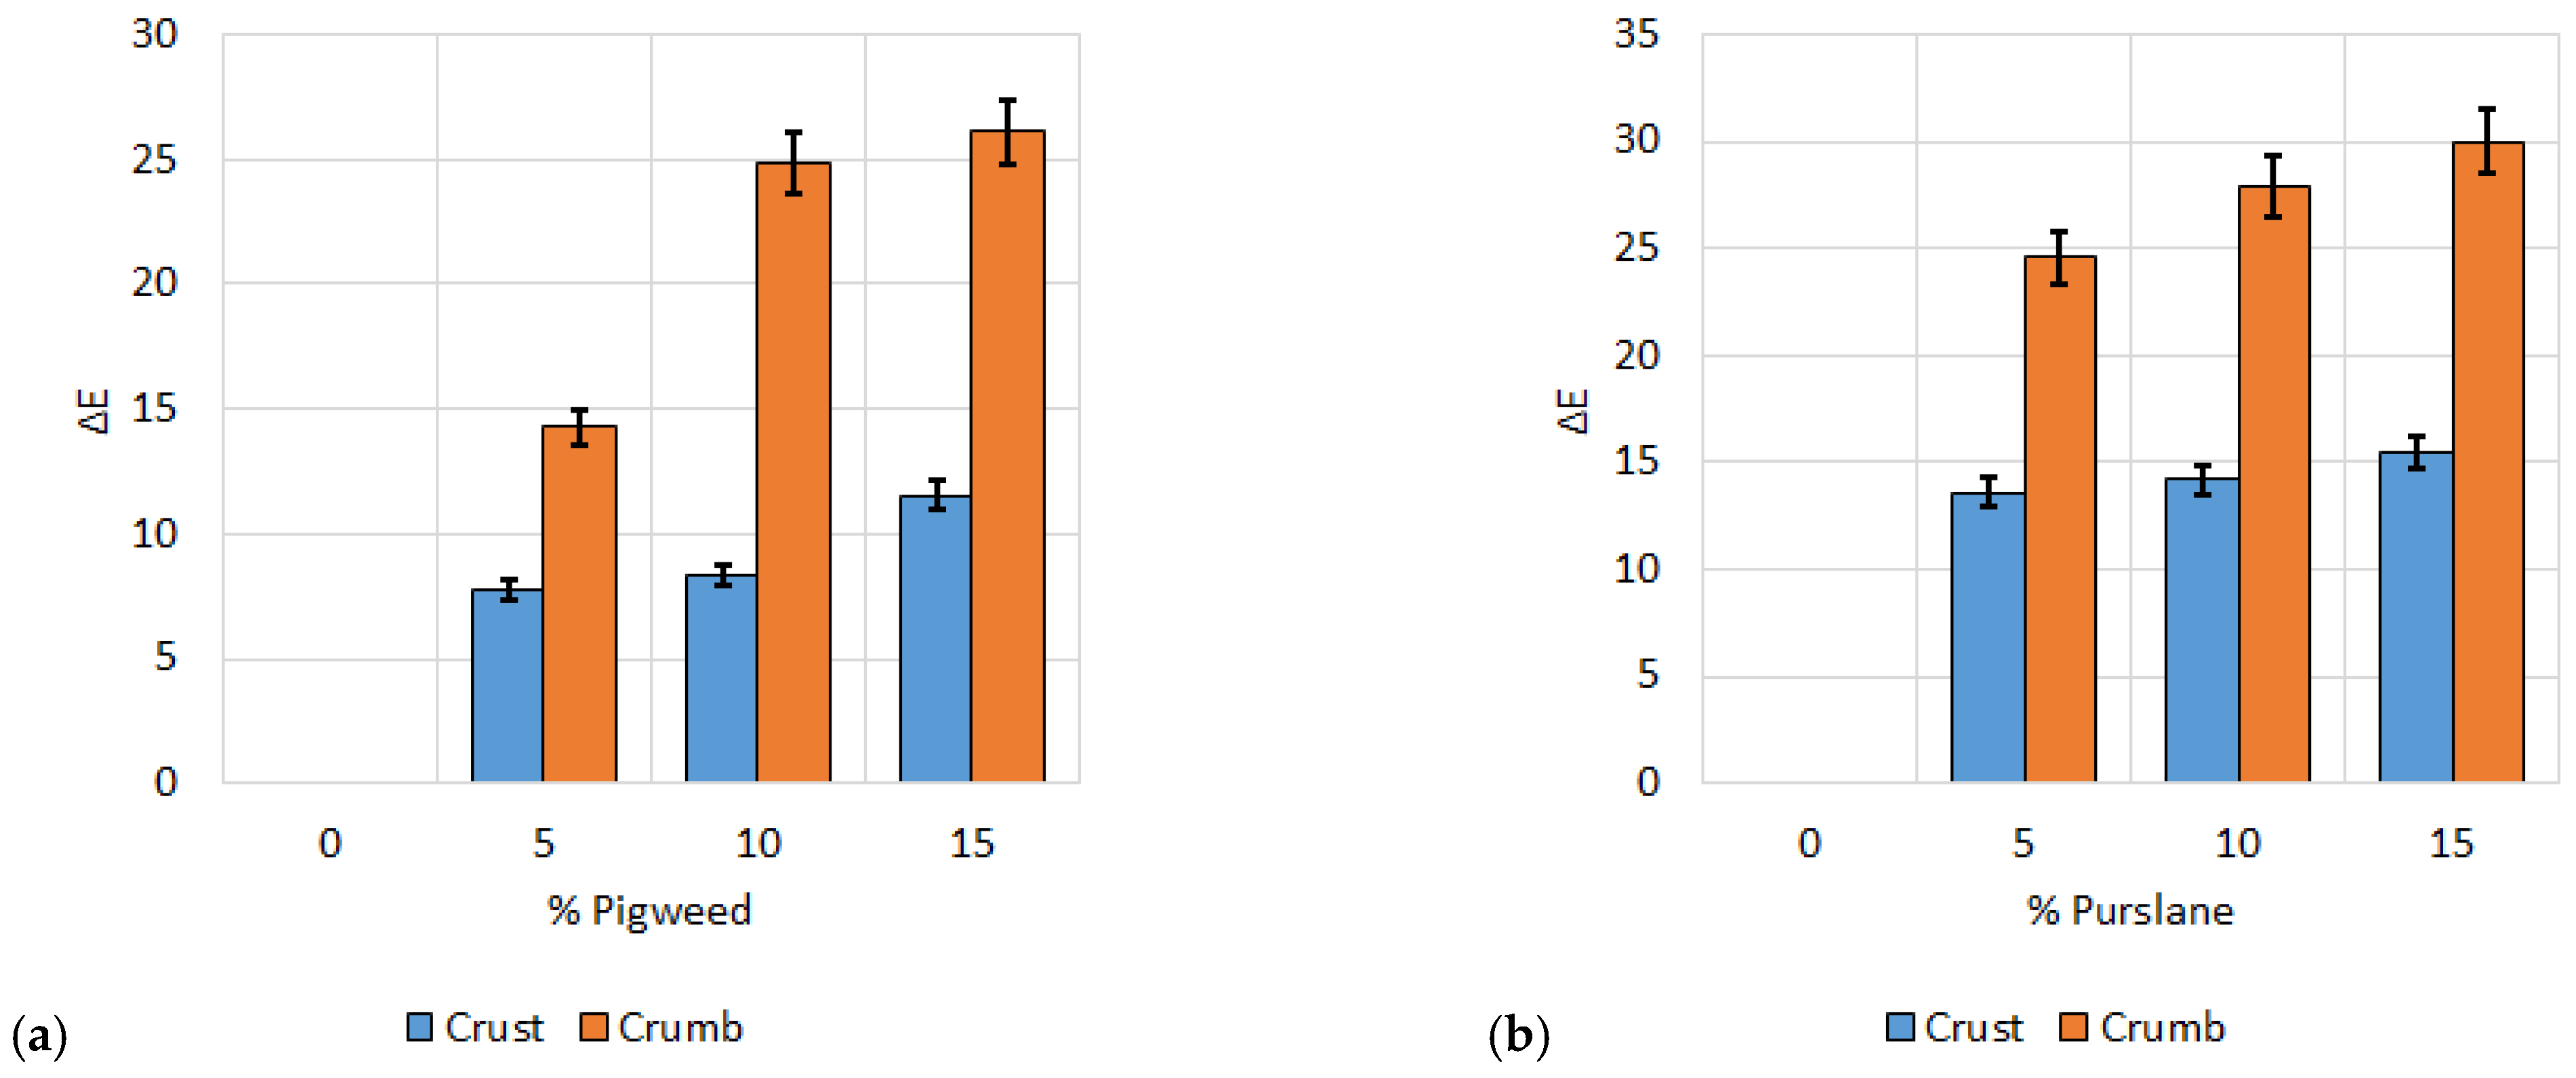
Figure 10 presents data on the color difference between the crust and the crum of bread with the addition of pigweed and purslane. As the amount of the additive increases, the color difference values increase. This difference is greater for the crumb of the bread and slightly smaller for the crust. All color difference values are above ΔE > 3, which indicates that they can be observed with the naked human eye. The greater color difference in the crumb of the bread is due to the changes that occur during baking.
Table 14 shows the results of calculating the color indices of bread with pigweed. BP denotes the part of the bread—crust and crumb; A is the additive in percent; and CI is the color index. Increasing the content of pigweed flour in the bread significantly changes its color indices compared to the control sample (0%).
In the crumb, L (Lab) decreases from 34.54 ± 10.42% at 0% to 23.41 ± 6.4% at 15%, reflecting a darker coloration, while a* and b* progressively decrease, reflecting less saturated red and yellow colors. The values of the color component C (LCh) decrease, and h (LCh) shifts to more yellowish shades. The color indices ci1, ci6 and ci11 show a maximum value at 5%, with a general trend of decreasing with increasing amounts of additive. L (Lab) decreases linearly from 55.08 ± 5.33 at 0% to 28.97 ± 2.33 at 15%. The significant decrease in (a*) values and yellowing (b*) indicate a change towards browning. Changes in the saturation and hue angle of the color indices of the crumb indicate a color imbalance. The remaining color indices also show significant changes. ci1 changes up to a 10% addition, and ci3, from 769.91 ± 550.49 at 0%, decreases to 38.81 ± 4.38 at a 15% addition.
Table 15 shows the results of calculating color indices of bread with purslane. BP denotes the part of the bread—crust and crumb; A is additive in percentage, and CI is color index. For the crust, L (Lab) decreases from 34.54 ± 10.42 at 0% addition to 20.03 ± 7.47 at 15% purslane flour, which indicates darkening, while the redness drops from 8.58 ± 2.95 at 0% addition to a minimum of 0.87 ± 0.75 at 5% addition and slightly increases with further increase in the amount of the additive. The yellowness b decreases linearly from 17.83 ± 3.74 at 0% addition to 7.95 ± 1.24 at 15%, while the chromaticity decreases slightly and the hue angle increases, which accounts for the less bright and more yellow shades. The values of indices ci1 and ci3 visibly decrease. ci1 decreases from 78.57 ± 22.46 at 0% addition to 64.77 ± 25.2 at 15% addition. ci3 shows a slight maximum at 5% with a value of 38.36 ± 18.99 and then decreases. At the mean, L (Lab) decreases more strongly from 55.08 ± 5.33 at 0% addition to 24.93 ± 3.66 at 15%, indicating a strong darkening. The values of redness (a) and yellowness (b) decrease significantly. The redness values tend to 0 at 5% addition, with 0.98 ± 0.34, and then increase slightly at 15% purslane, while the yellowness continuously decreases from 24.18 ± 1.73 at 0% to 11.93 ± 0.29 at 15%. The chroma (C) values remain relatively stable, while the hue angle (h) increases gradually, reflecting a consistent shift towards yellow shades. The ci3 index values decrease from 769.91 ± 550.49 at 0% addition to 32.04 ± 5.19 at 15% purslane, and ci11 decreases at 5%, then increases again until reaching 15% addition.
The porosity of the bread crumb was determined using a Matlab script for image processing. Table 16 presents the results of the analysis of the porosity of bread, using the porosity values (p, %). The control sample has a porosity p = 79 ± 1.54%. The addition of pigweed increases the p value. At 5%, p is 81.92 ± 1.8%. Then the porosity values decrease. At 10%, it is 77.27 ± 1.2%, and at 15%, it is 73.16 ± 1.01. The addition of purslane also leads to an increase in the p value at 5%, which is 83.2 ± 1.37. Then the p begins to decrease at 10% to 77.54 ± 1.25%, and at 15% to 77.37 ± 3.76. Compared to the control sample, low percentages of both additives significantly increased the porosity index value, with the effect being more pronounced in purslane. After that, the porosity values gradually decreased.

4.4. Results of Analysis of Spectral Characteristics of Bread

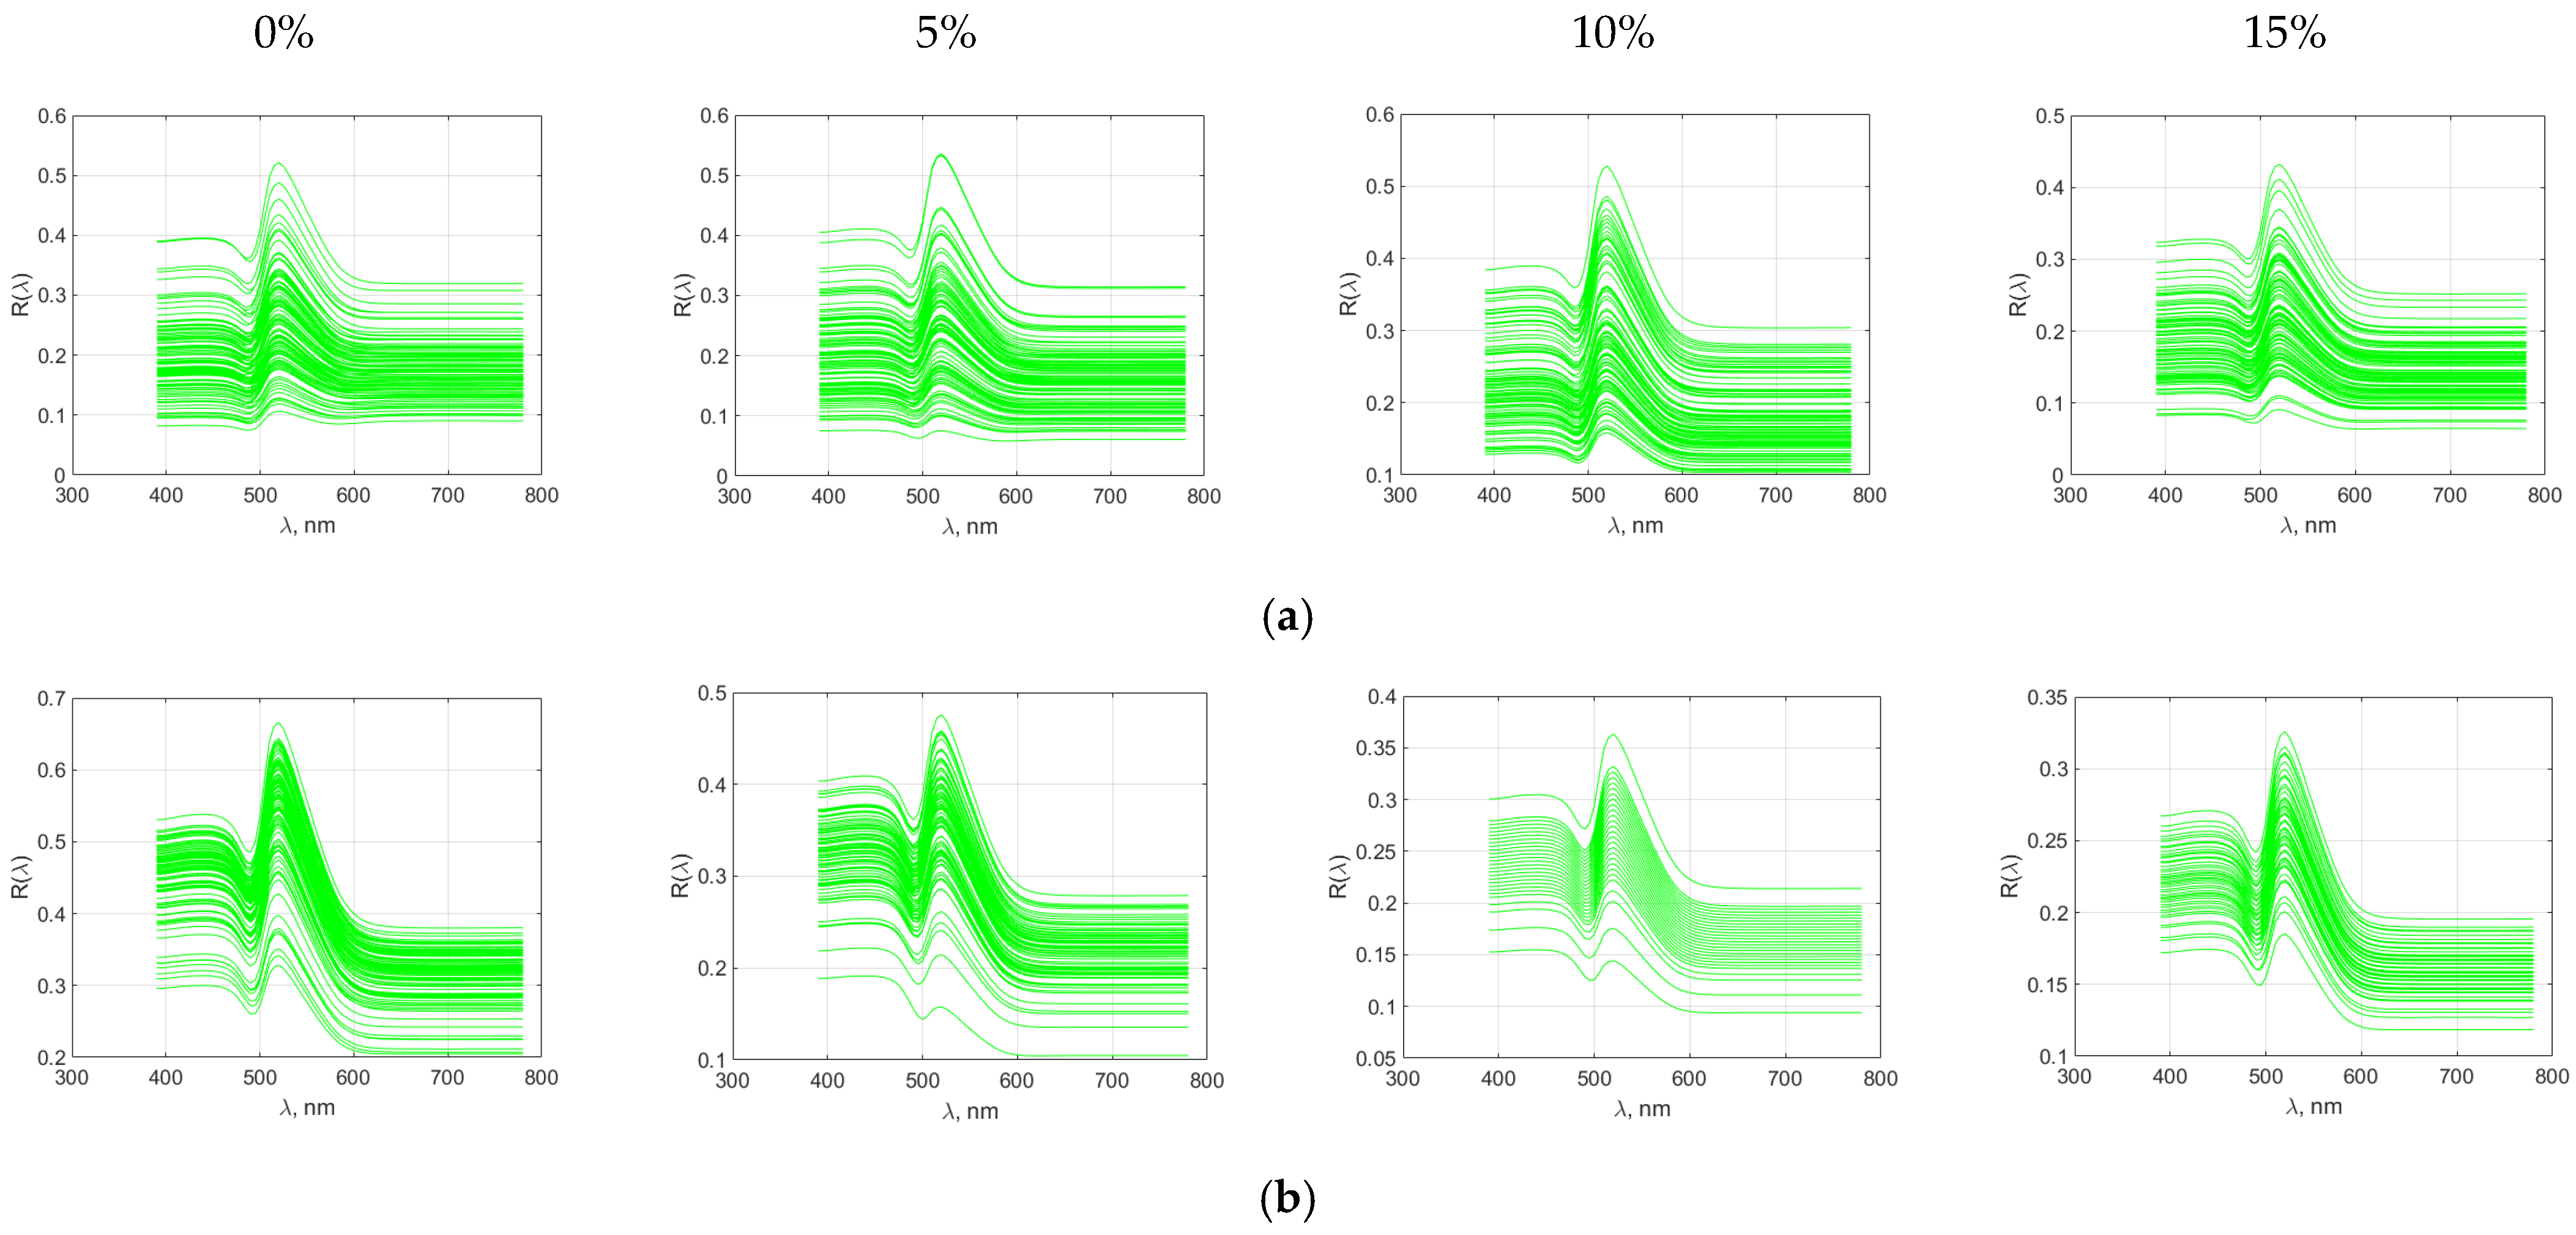
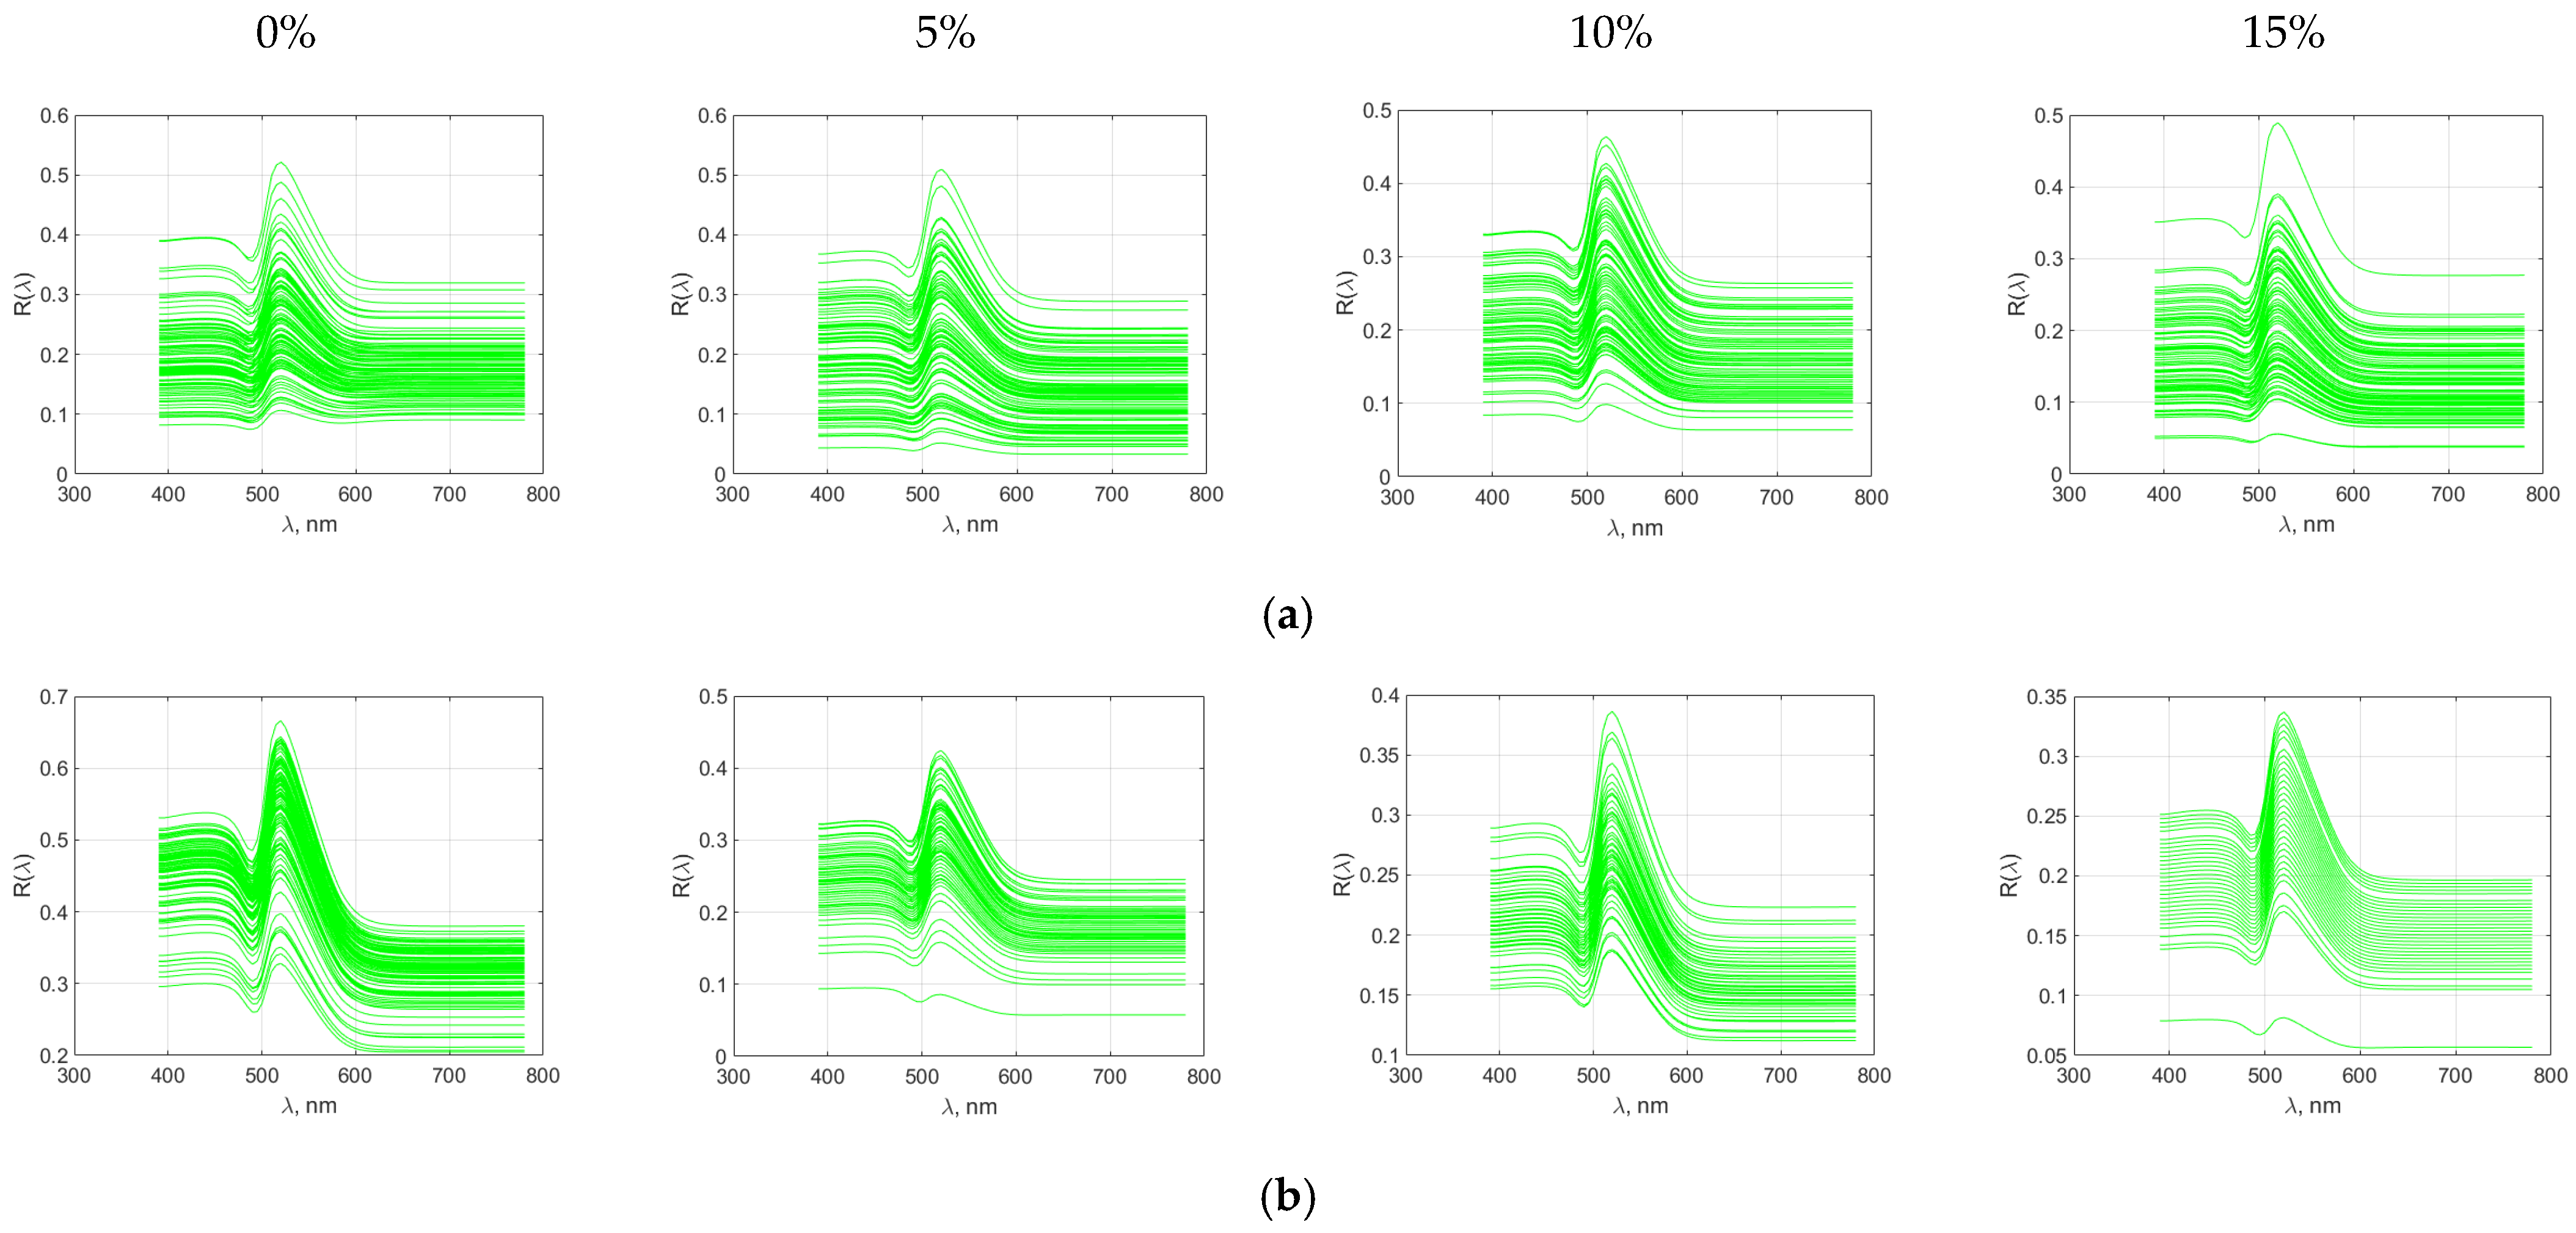
Figure 11 shows the spectral characteristics of bread with the addition of pigweed flour. The spectral characteristics of bread with the addition of pigweed flour present the reflection values at different wavelengths. Both in the crust and in the crumb, the influence of the additive is observed in the reflection peaks compared to the control sample. As can be seen from the figure, increasing the amount of the additive reduces the reflection values. Especially in the crumb spectra, this decrease in reflection values with increasing the amount of pigweed flour is significantly higher compared to the data for the bread crust. This is due to the influence of specific chemical groups present in the additive and their interaction with the chemical compounds of the main raw materials of the bread.
Figure 12 shows the spectral characteristics of bread with purslane flour added. For the crust, it can be seen that for the control sample, the reflectance values change in a narrower range compared to the samples with the additive. As the amount of the additive increases, the range of change in the reflectance values of the bread crust also narrows.
An additional influence on the spectral characteristics of the crust of baked bread is exerted by the processes of melanoidin formation, non-enzymatic browning, and caramelization, which occur during baking of the product. In the crumb, the change in spectral characteristics is similar to that of the crust, but here it is observed more clearly. Increasing the amount of the additive leads to a decrease in the reflection values, and the spectral characteristics change within narrower limits compared to the control sample.
Table 17 shows the results of calculating spectral indices of bread with pigweed. BP denotes the part of the bread—crust and crumb; “A” is the additive in percent; and “si” is the spectral index. In the crust, the value of si1 increases without significant changes with the level of additive, which means that there is no change in the associated spectral property. si2 does not change with the change in the percentage of additive; it remains constant (0.03 ± 0). si3 increases at 5% addition, to 0.16 ± 0.06, and then undergoes minor changes for higher levels of pigweed. Index si4 decreases from 7.98 ± 2.85 at 0% pigweed to 5.05 ± 1.73 at 15% addition, indicating a lower intensity of its corresponding spectral feature. Index si5 shows a slight positive slope, starting at 0.79 ± 0.03 at 0% pigweed and increasing to 0.85 ± 0.05 at 5% pigweed, then stabilizing slightly lower at higher percentages. Spectral indices si6 to si9 have a steady decline from 0.05 ± 0.01 and 0.07 ± 0.02 at 0% addition, both decreasing to approximately 0.01 ± 0.01 at 15% pigweed. si10 and si11 have the largest decrease, with si10 varying from 0.13 ± 0.03 at 0% addition to 0.10 ± 0.03 at 15%, and si11 going from 0.04 ± 0.02 to 0.02 ± 0.01 within the same range. In the bread crumb, si1 remains almost constant at all percentages of pigweed flour addition at around 0.93, while si2 increases slightly at 5% and 10% addition, from 0.04 ± 0, and then returns to 0.03 ± 0 at 15% pigweed. The indices si3 and si4 decrease significantly, with si4 falling from 11.54 ± 1.65 at 0% addition to 5.02 ± 0.77 at 15% pigweed. si6 to si11 show progressive decreases in their values, with si10 and si11 falling sharply from their initial levels.
Table 18 shows the results of calculating spectral indices of bread with purslane. BP denotes the part of the bread—crust and crumb; “A” is the additive in percent; and “si” is the spectral index. In the crust, the values of si1 remain relatively constant when changing the amount of purslane flour addition (0.92–0.93). si2 remains the same value (0.03) in all cases. The index si3 increases at higher levels of the addition, ranging from 0.12 ± 0.05 to 0.19 ± 0.08, from 0% to 15% purslane. The index si4 decreases from 7.98 ± 2.85 to 5.29 ± 2.17 at 0% and 15% addition, respectively, which indicates a decrease in this spectral property for increased purslane flour content. The si5 index shows minimal variation, remaining in the range of 0.79 to 0.81 and showing no visible change with increasing purslane flour content. The values of the si6 to si9 indices remain relatively low, with a slight increase at higher percentages of addition. si7, si8, and si9 have constant values around 0.07–0.08. si10 shows variation, from 0.13 ± 0.03 at 0% addition to 0.14 ± 0.03 at 15%. si11 remains almost constant at 0.03 ± 0.02 for all levels of addition. In the mean, si1 remains constant at 0.92–0.93. si2 remains constant at 0.03, with a slight increase to 0.04 at 10% addition. si3 increased moderately from 0.06 ± 0.01 at 0% purslane to 0.13 ± 0.01 at 15%, while si4 decreased significantly, from 11.54 ± 1.65 to 5.02 ± 0.77, with increasing purslane flour addition. The si5 index stabilized around 0.87–0.95, with small variations between the different levels of addition. si6 to si9 showed low values, with a slight decrease at higher levels of purslane addition in the bread. si10 and si11 showed a decrease in their values, with si10 going from 0.06 ± 0.02 at 0% addition to 0.04 ± 0.02 at 15%, while si11 remained constant at 0.03 ± 0.01, showing a slight decrease at the highest levels of addition.

4.5. Selection of Informative Features for Bread with the Addition of Pigweed and Purslane Flour

In this study, a total of 70 characteristics were used, which describe the change in the characteristics of bread when adding pigweed and purslane flour. The characteristics are presented in Table 19. Characteristic F1 is the mass of the bread. F2–F6 are the geometric characteristics determined from data measured with a 3D scanner. F7–F10 are the physicochemical characteristics of the bread. F11–F16 are the organoleptic characteristics. F17–F32 are the color indices of the bread crust. F33–F48 are the color indices of the bread crumb. F49–F59 are the spectral indices of the bread crust. The last characteristic F60–F70 are the spectral indices of the bread crumb. The feature vectors presented in the table should be reduced using appropriate data reduction methods to ensure efficient analysis and avoid data redundancy, as the set contains a significant number of interconnected and potentially correlated features.
Table 20 shows data on the weight coefficients of the features for bread with added pigweed flour and bread with purslane. The informative characteristics with weight coefficient values above 0.6 are underlined. For bread with pigweed flour, the main informative features (with the highest weight coefficient values compared to the other compared features) are F1, F3, F6, F34, and F37. For bread with purslane flour, the most informative features compared to the others are F2, F3, F9, F34, and F43.
Vectors of informative features FVS for bread with pigweed flour and FVT for bread with purslane flour were formed. The vectors have the following form:
FVS = [F1 F3 F6 F10 F15 F18 F19 F20 F25 F34 F36 F37 F43 F45 F48 F61 F62 F64 F65 F66 F67 F68]
FVT = [F1 F2 F9 F10 F12 F16 F34 F37 F43 F44 F45 F48 F59 F61 F62]

4.6. Determining the Effect of the Additive on the Selected Traits

Table 21 shows the normalized values in the interval [0; 1] of the characteristics that are most affected by the change in the content of pigweed and purslane flour in bread. Since the number of rows for pigweed bread is 22 and the number of columns is 4, the data can be reduced to 21 principal components in rows and 3 in columns. Similarly, since the number of rows for purslane flour bread is 15 and the number of columns is 4, the data can be reduced to 14 principal components in rows and 3 in columns. The number of necessary components is determined according to the condition that the sum of the principal components must describe over 95% of the variance in the data.
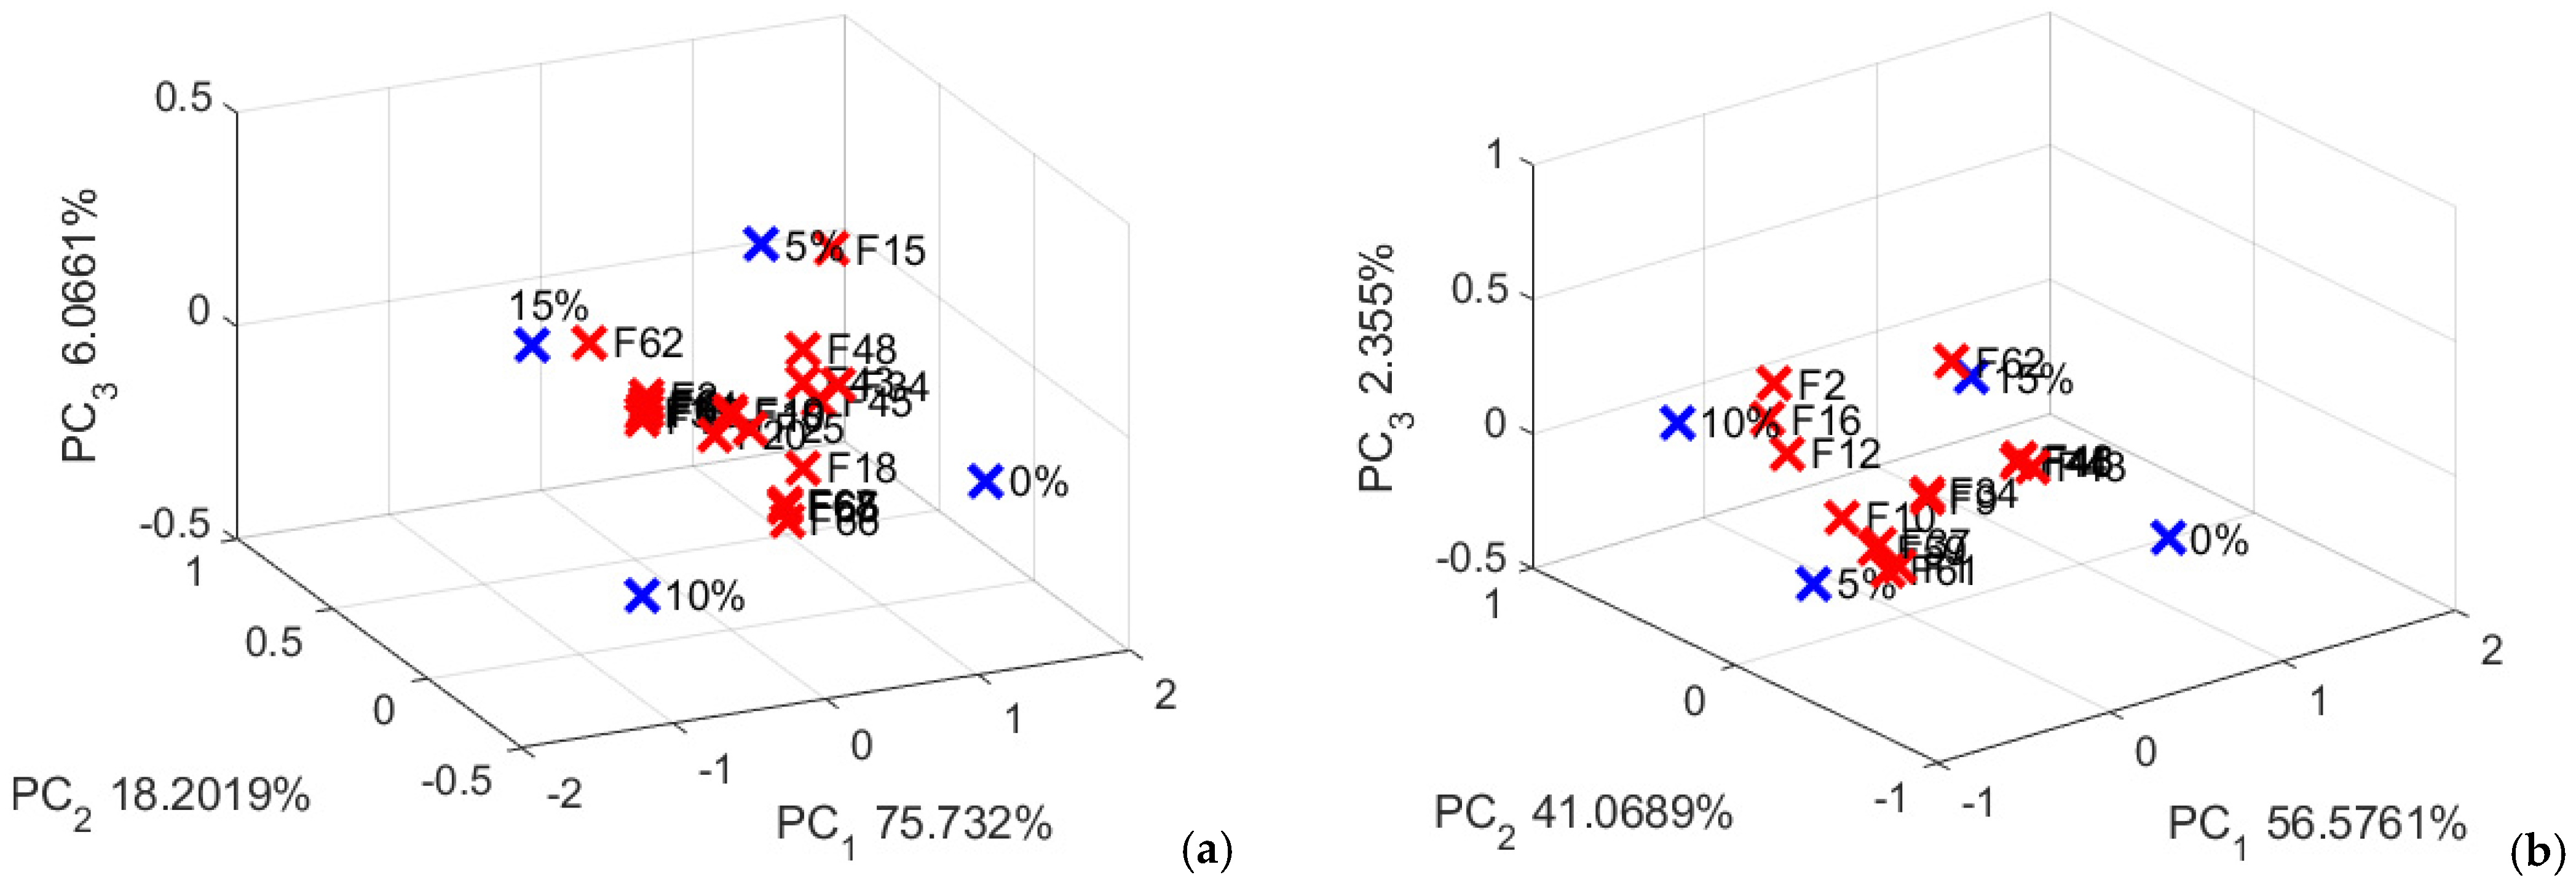
Figure 13 shows the results of PCA of the influence of the amount of pigweed and purslane addition on the technological characteristics of bread. In bread with pigweed, 0% and 10% additions affect all studied characteristics. A 5% addition affects the organoleptic indicator “taste” (F15), and 15% of the addition mainly affects the spectral index SI3 (F62). For bread with purslane, it is evident that 0% and 5% of the addition affect all studied characteristics, while 10% addition affects the volume (F2) and the organoleptic characteristics “structure” (F12) and “overall assessment” (F16). As in bread with pigweed, here too 15% of the addition mainly affects the spectral index SI3 (F62).

4.7. Determining the Appropriate Amount of Addition of Pigweed and Purslane Flour in Bread

Figure 14 shows the results of determining the required number of principal components and latent variables. For both types of additives, it can be seen that two principal components and two latent variables are sufficient to describe over 98% of the variance in the data. It follows that to create a regression model to determine the appropriate amount of purslane and pigweed additives in bread, two latent variables and two principal components are required. Additional analysis is needed to determine which of the two methods to reduce the feature vectors.
Table 22 shows the results of testing the ability to determine the influence of the percentage of additive on the reduced data from the vectors with selected features. For pigweed bread, both methods achieve identical values of the coefficient of determination (R2) of 0.83, with PLSR slightly outperforming PCR in terms of a lower value of the sum of squared errors (SSE—1.77 vs. 1.79) and the root mean square error (RMSE—2.11 vs. 2.12). For purslane bread, PLSR has an advantage, with a higher value of R2 (0.82 vs. 0.72), along with lower values of SSE (1.85 vs. 2.54) and RMSE (2.15 vs. 2.53). Based on these results, it can be stated that PLSR is better than PCR due to the higher values of the coefficient of determination and lower values of errors, which is especially evident for purslane bread.
Regression models have been developed and used to determine the appropriate amount of additives in bread. After removing the insignificant coefficients with a p > α level, for bread with the addition of pigweed flour, a model of the following type was derived:
S = 7.11 + 95.56 L V 1 + 21.57 L V 2 + 154.47 L V 2 2 + 323.41 L V 1 L V 2
The coefficient of determination is R2 = 0.85. According to Fisher’s exact test, the calculated value of F(4, 395) = 560.96 is much larger than the critical value (Fcr = 2.39). The p-value for the model (p < 0.00) is less than the accepted significance level α = 0.05. The standard error (SE) has a relatively low value (2.01). The results of the analysis of the residuals of the regression model are presented graphically in Figure 15. As can be seen from the distribution of the residuals and their location around the normal line, they are close to the normal distribution, and according to this criterion, it can be considered that the assumptions of the regression analysis are met.
After removing the insignificant coefficients with level p > α, for bread with the addition of purslane flour, a model of the following type was derived:
T = 8.32 + 92.1 L V 1 + 44.13 L V 2 222.78 L V 1 2 104.38 L V 2 2
The coefficient of determination is R2 = 0.84. According to Fisher’s exact test, the calculated value of F(4, 395) = 505.36 is much larger than the critical value (Fcr = 2.39). The p-value for the model (p < 0.00) is less than the accepted significance level α = 0.05. The standard error (SE) is relatively low (2.27).
The results of the analysis of the residuals of the regression model are presented graphically in Figure 16. As can be seen from the distribution of the residuals and their location around the normal line, they are close to the normal distribution, and according to this criterion, it can be considered that the assumptions of the regression analysis are met.
Figure 17 shows the results of determining the appropriate amount of pigweed and purslane flour in bread.
The appropriate amount of pigweed flour in bread (S = 3.69%) was determined. The values of LV1 and LV2 are significantly affected by the appropriate percentage, with LV1 showing a slightly stronger relationship. The tendency of decreasing LV1 and LV2 as the percentage of the additive increases suggests that higher amounts of it are associated with lower values of the latent variables. In the case of bread with purslane flour, the appropriate percentage of the additive (T = 7.13%) is located in the positive levels of both latent variables. This indicates that the additive improves the main characteristics of the bread. The results obtained show that with the calculated appropriate amounts of the additives, the characteristics of the bread, such as texture, moisture content, and fiber, are preserved, which remain without extreme changes to the product. When using the appropriate amounts of the additives of pigweed and purslane flour, a product is obtained that neither excessively increases nor under-modifies its beneficial properties.
Bread was prepared with the calculated appropriate amounts of purslane and pigweed flour additives.
Table 23 shows the results of determining the physicochemical characteristics of bread with appropriate amounts of pigweed and purslane additives. The comparison of the physicochemical characteristics of bread with pigweed (3.49%) and purslane (7.13%) additives compared to the control sample shows that the additives have a significant impact on the parameters. The addition of purslane leads to the strongest changes, reducing pH to 6.07, increasing TDS to 1835 ppm, and increasing electrical conductivity (EC) to 3674 µS/cm. In addition, it reduces ORP to 204 mV. The addition of pigweed also changed the characteristics, but to a lesser extent, by decreasing the pH to 6.21, increasing the TDS to 1655.5 ppm and the EC to 3350 µS/cm, and decreasing the ORP to 211 mV. The control sample had the highest pH (6.33) and ORP (232.5 mV) and the lowest TDS (1606 ppm) and EC (3207 µS/cm) values. The results show that the additions of pigweed and purslane significantly affected the physicochemical characteristics of the bread, with the addition of purslane leading to more significant changes compared to that of pigweed.
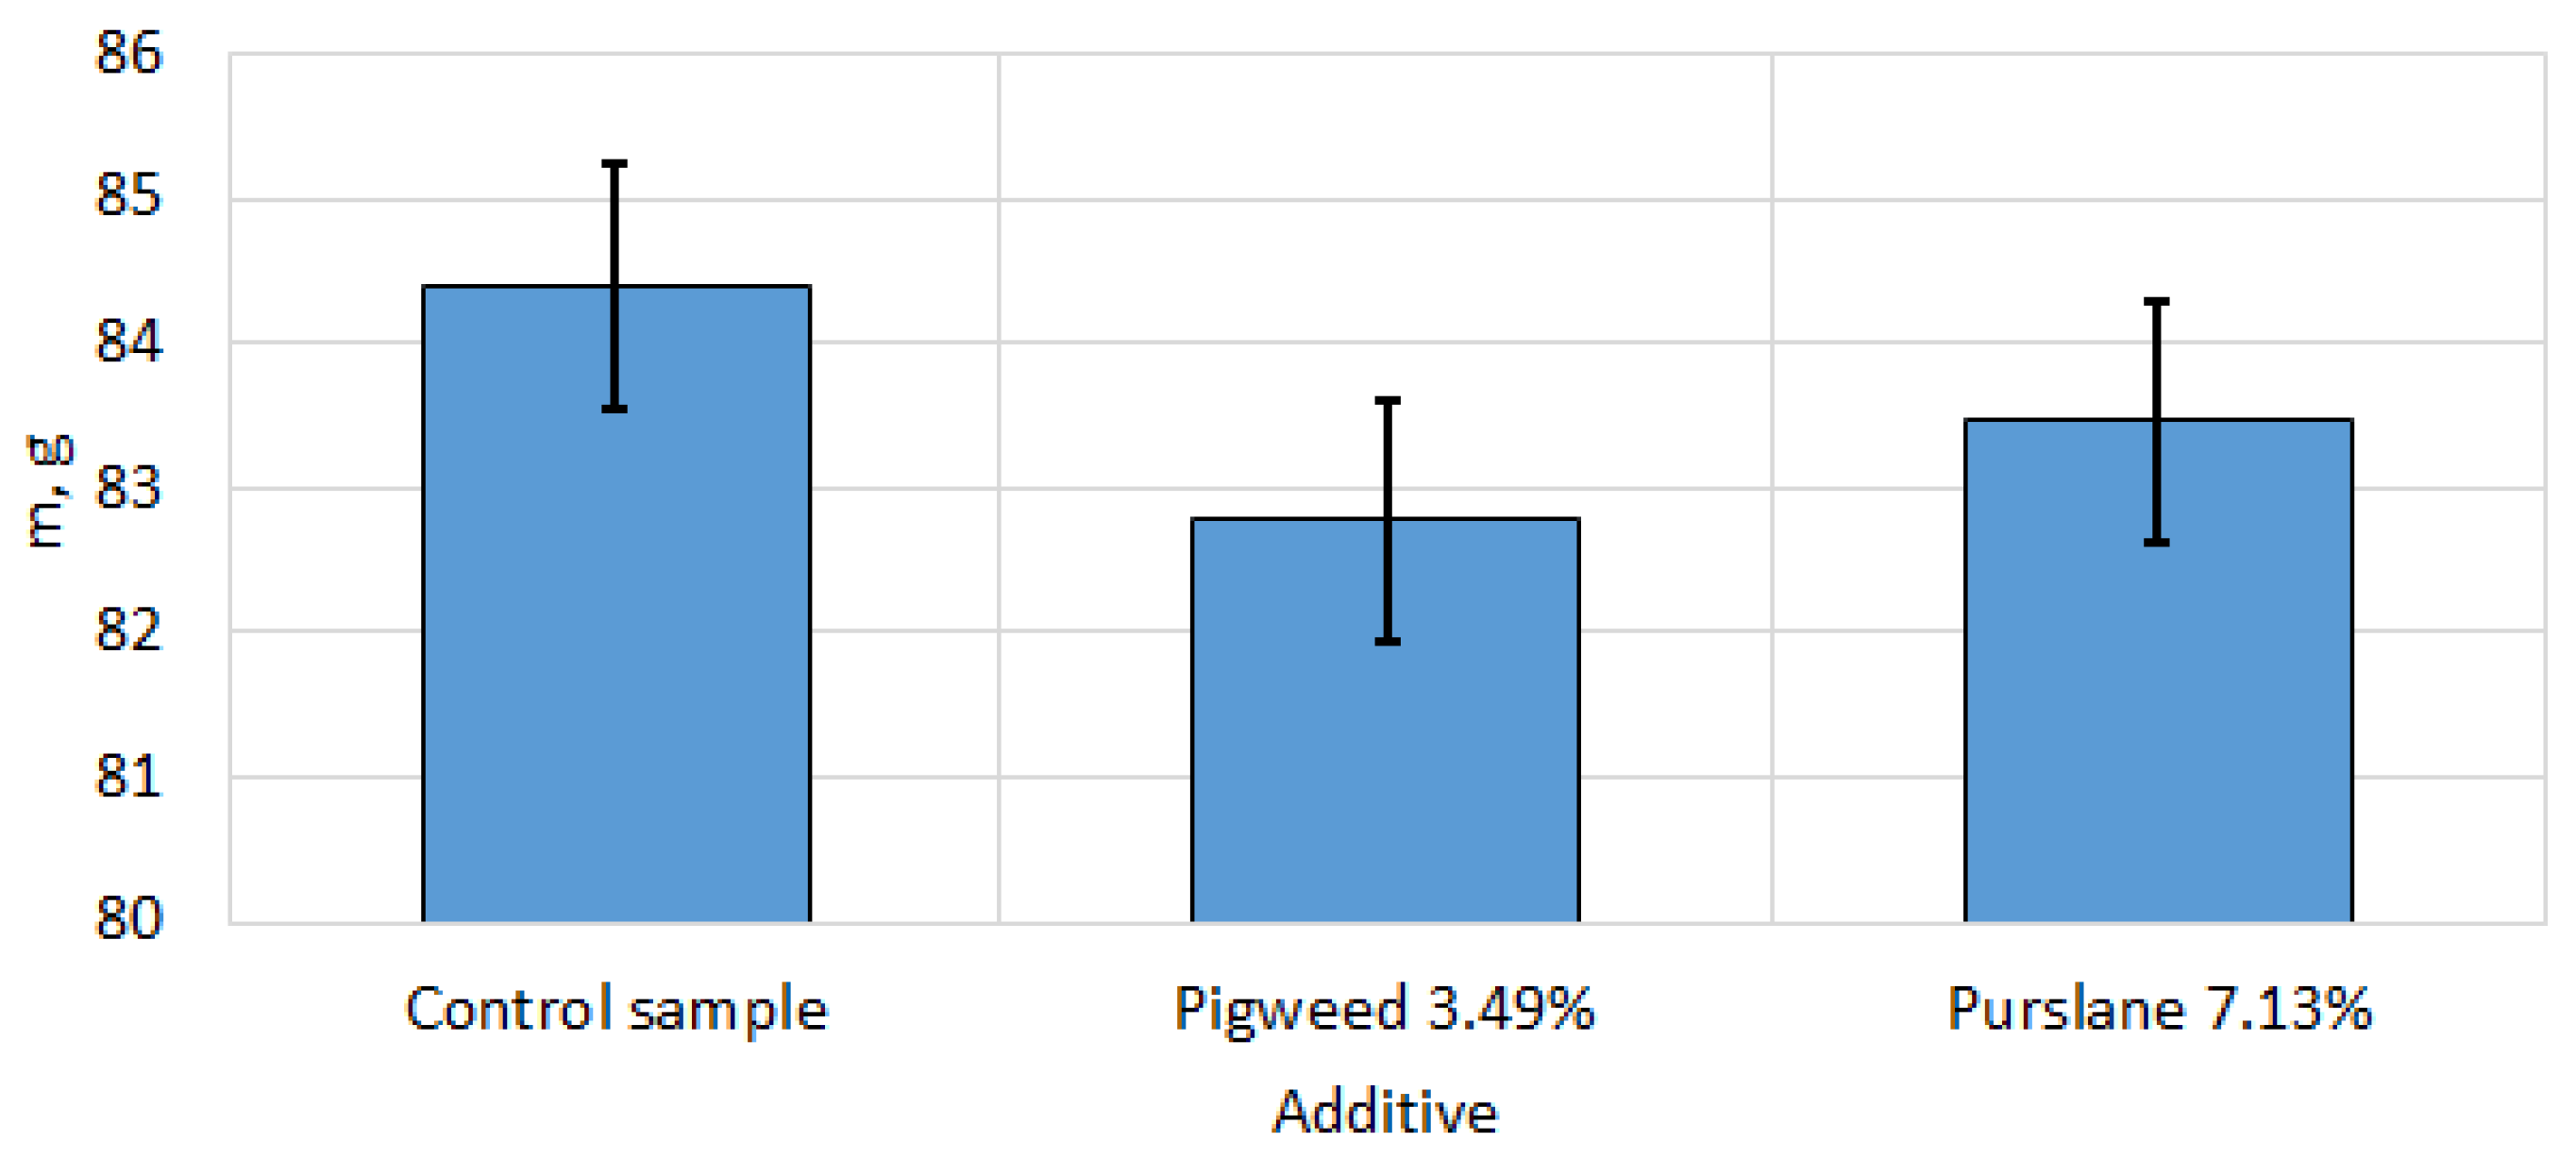
Figure 18 shows the change in the mass of the bread, depending on the additive. The control sample has a mass of 84.39 ± 1.46 g, while with the addition of pigweed the mass is slightly lower—82.78 ± 2.63 g. The bread with the addition of purslane has a mass of 83.46 ± 1.36 g, which is also slightly lower than the control sample, but higher than that with pigweed. The differences in mass may be due to the different influence of the additives on the structure and moisture content of the bread.
Table 24 shows the results of the organoleptic analysis of the resulting bread. The results of the organoleptic analysis show that the addition of pigweed and purslane has a different impact on the qualities of the product. The control sample has the highest scores in all characteristics, while the addition of pigweed leads to a slight decrease in the values of appearance, structure, and chewiness, but a significant decrease in taste (due to the residual bitter taste). Purslane leads to a significant decrease in appearance and structure but has a smaller impact on aroma and chewiness. The overall score is also lower for both additives compared to the control sample, with purslane having a stronger impact.
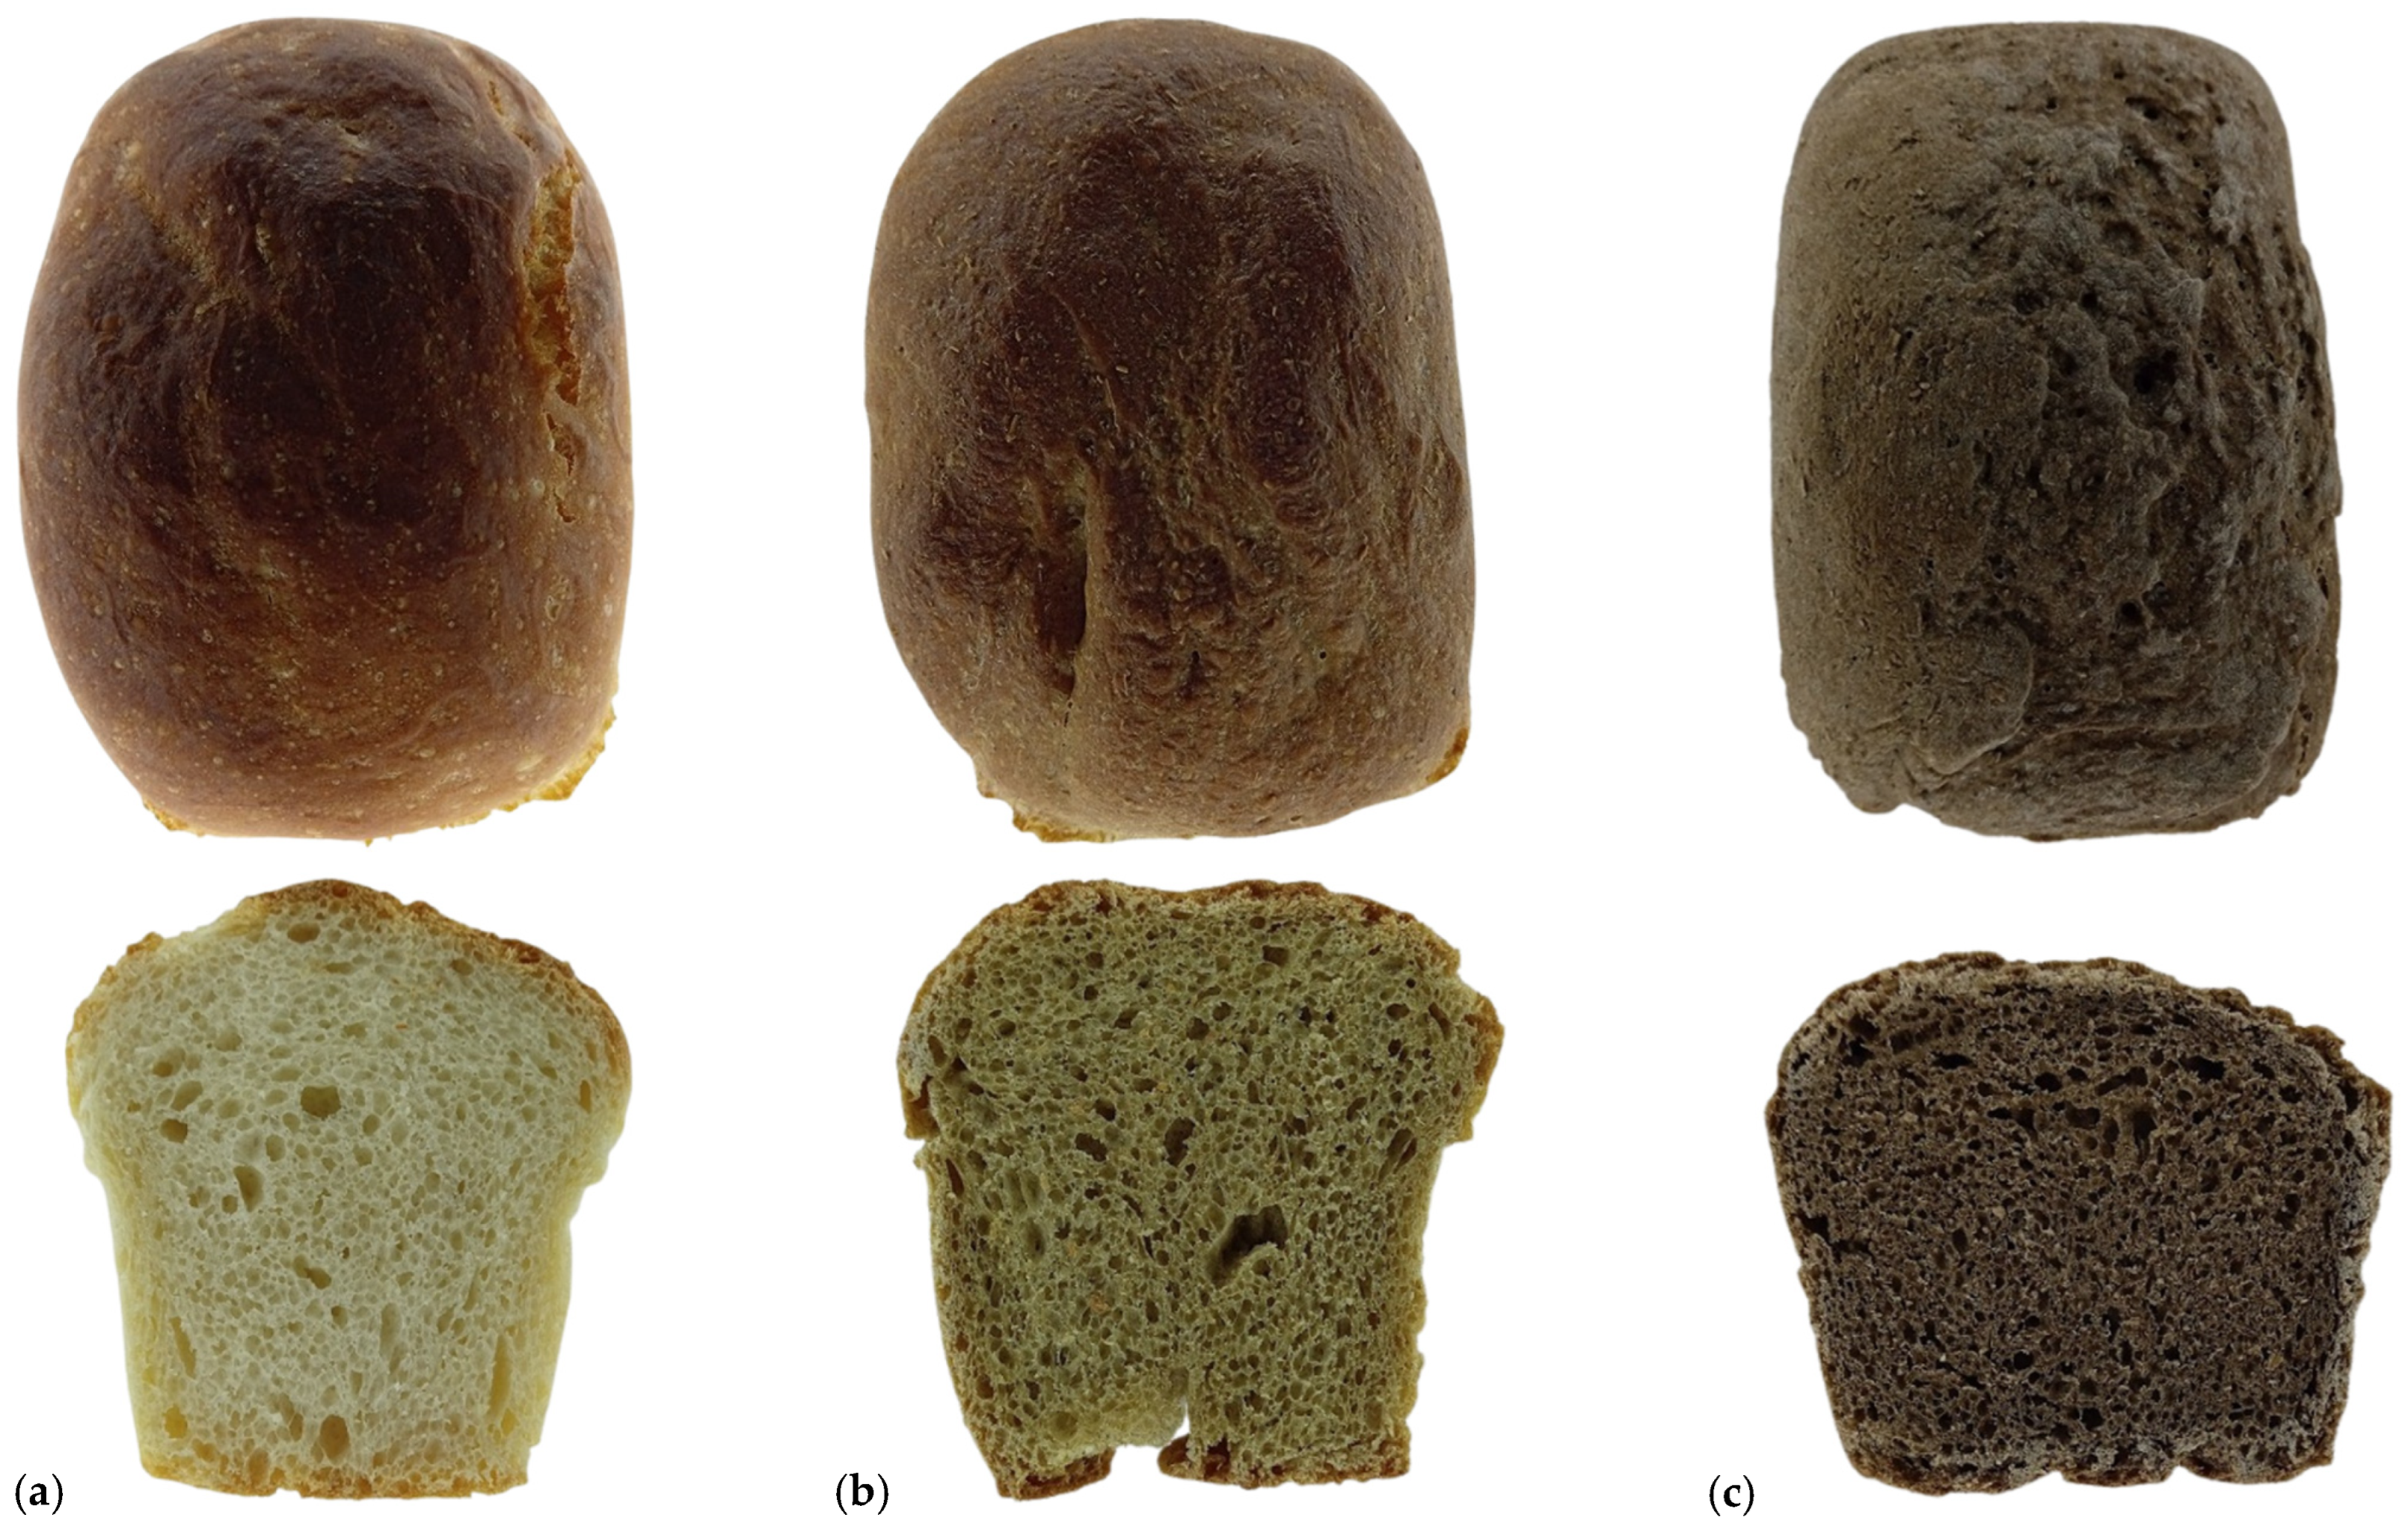
Figure 19 shows the overall appearance of the obtained samples. The control sample has a golden-brown crust color with a light, uniform texture of the crumb. This is the reference sample without any additives. The sample with 3.69% pigweed flour shows a slightly darker crust color compared to the control. The crumb has a denser consistency and a slight greenish and yellowish tint. The sample with 7.13% purslane flour has the darkest crust of the three, with a visibly darker and denser crumb structure, which is significantly more compact and dark brown.
Figure 20 shows the Lab color characteristics of bread with appropriate amounts of pigweed and purslane additives. The control sample (red dots) shows different color values compared to the added samples. The addition of pigweed and purslane leads to visible changes in the color coordinates L, a, and b, with the addition of pigweed shifting the points to higher values of a and b, and the addition of purslane mainly affecting the L and b components.
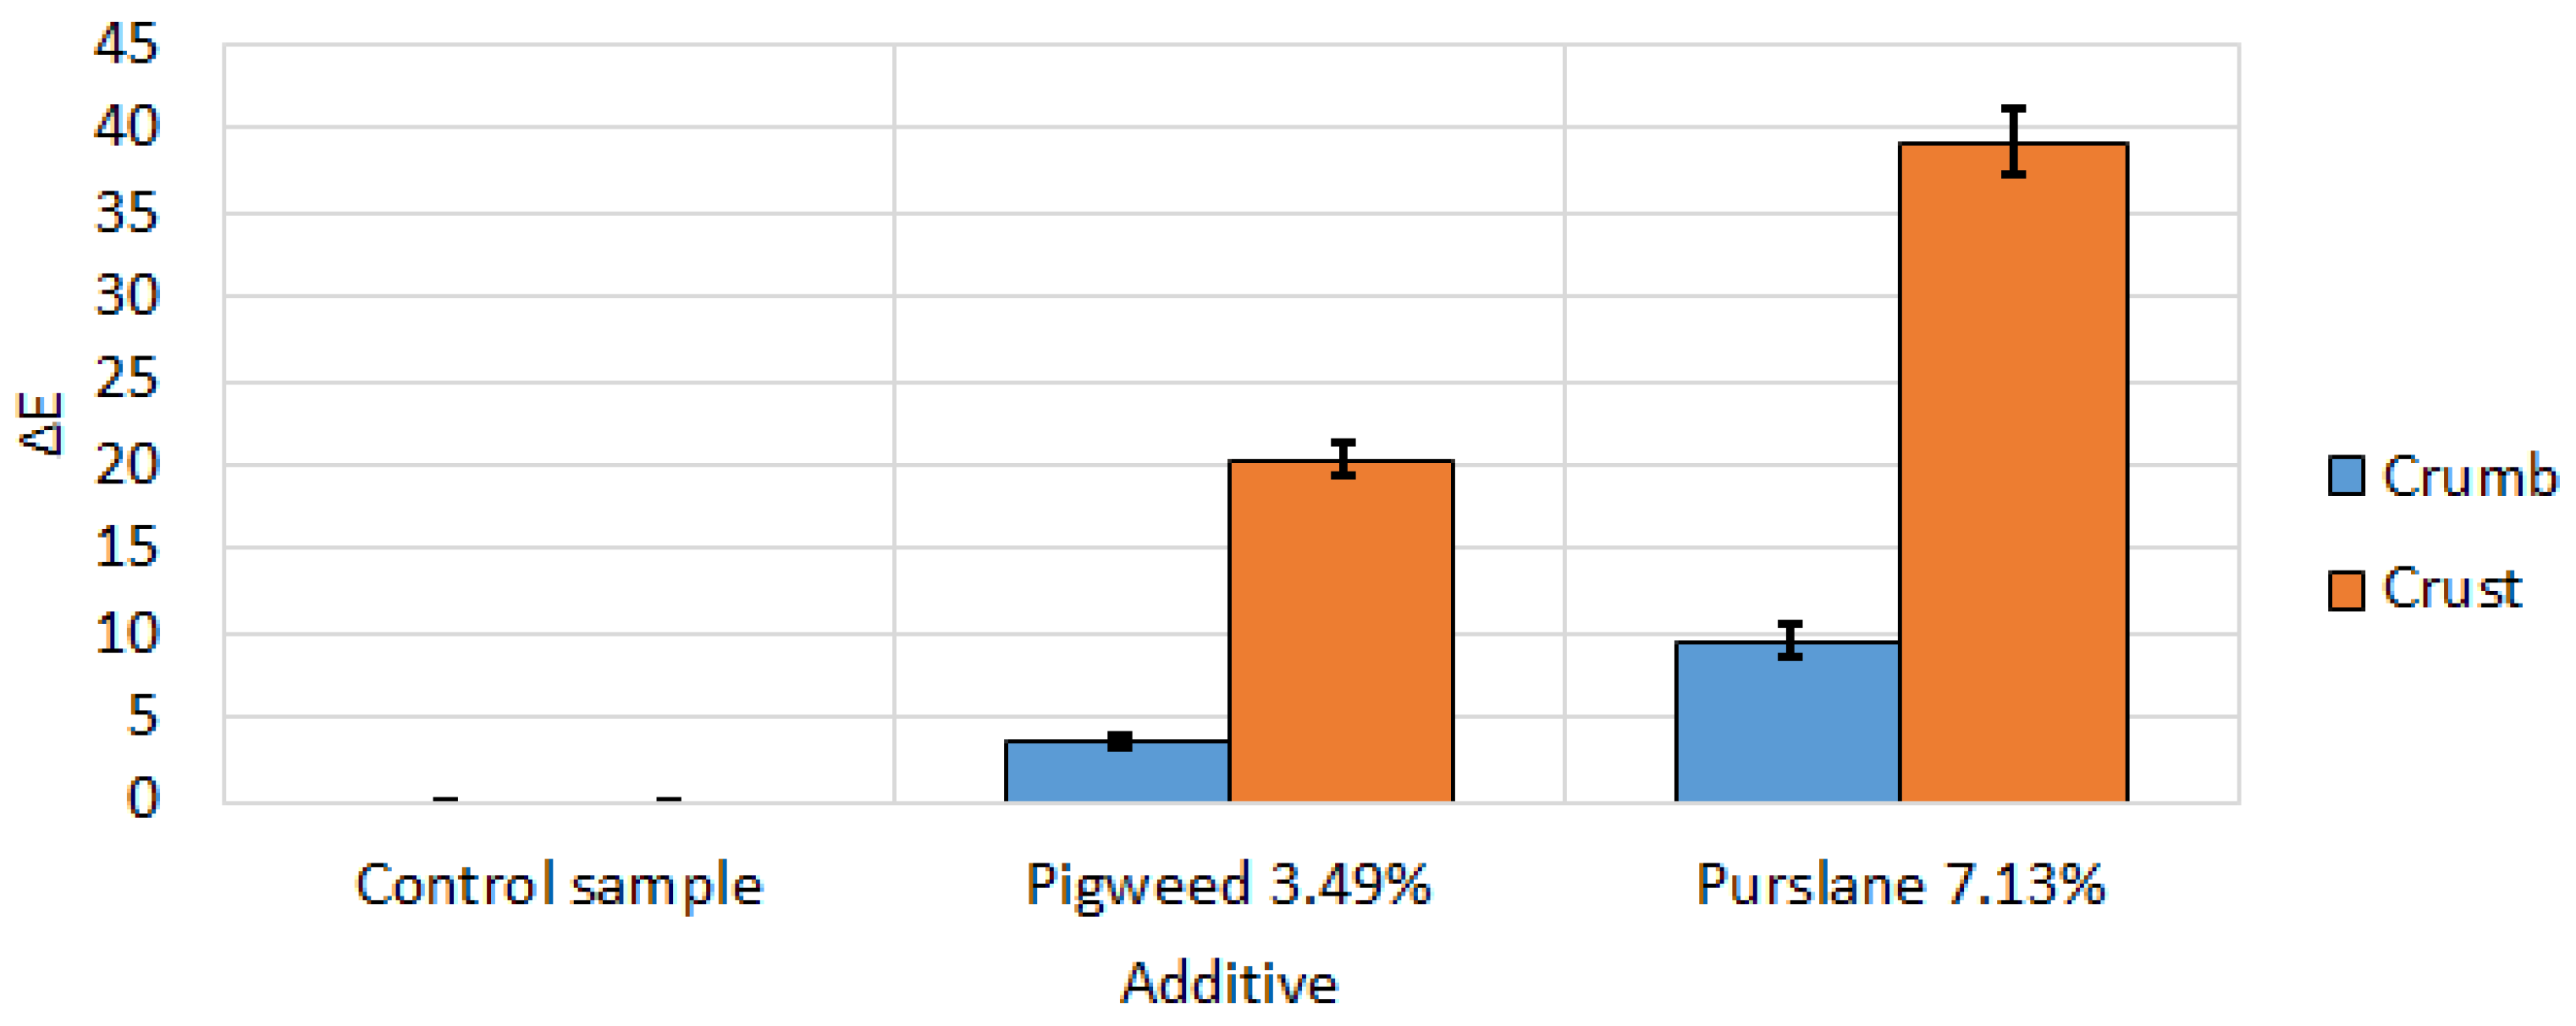
Figure 21 shows the color difference between bread samples with appropriate amounts of additives. The color difference in the crumb of the bread is much greater compared to that of the crust of the bread.
The porosity of bread with appropriate amounts of additives was determined. The porosity indicator p, % was used. Figure 22 shows the results of this analysis. The addition of additives to bread increases the value of p, the most significant being in bread with pigweed flour (p = 84.03 ± 1.02).
Figure 23 shows 3D scanned images of bread with appropriate amounts of pigweed and purslane flour additives. The objects are presented on a horizontal flat surface. The visualization is textured, which allows analysis of the outer surface of the bread. The objects are centered in the image, observed from a slightly raised angle. In the control sample, the bread has a uniform and light color with a smooth texture. The addition of pigweed (3.69%) leads to a slight darkening of the color and small changes in the texture, with the surface becoming slightly rougher. The most noticeable changes are observed in the sample with purslane (7.13%), where the color of the bread is significantly darker and the texture is much rougher and uneven.
Figure 24 displays screens that illustrate the main characteristics of bread as determined from its 3D images. The bread sample and the minimum parallelepiped are visualized. Dimensions are in millimeters (mm). The control sample shows the largest and most uniform volume enclosed by its minimum parallelepiped. The sample with pigweed (3.69%) has a slightly reduced volume, and smaller deviations in shape are observed. The largest difference is observed in the sample with purslane (7.13%), which has the smallest volume and the most pronounced changes in shape compared to the other samples.
Table 25 shows the results of determining the characteristics of bread with appropriate amounts of additives based on 3D scanning images. The control sample without additive has a volume of 300 cm3, a surface area of 242 cm2, a density of 301.27 kg/m3, an external volume of 300 cm3, and an external surface area of 374 cm2. With the addition of pigweed, the volume and surface area slightly decrease, while the density increases to 314.13 kg/m3. With the addition of purslane, the volume and surface area decrease significantly, and the density increases to 464.5 kg/m3.

4.8. Comparative Analysis of the Results Obtained

Table 26 provides a summary analysis of the results obtained from the analysis of bread with pigweed flour and bread with purslane. In both types of bread, increasing the additives leads to a decrease in pH and ORP, an increase in EC and TDS, a deterioration in organoleptic indicators, a decrease in volume and surface area, and a darkening of the color. Bread with purslane is darker and denser than that with pigweed. Spectral analysis shows a reduced reflectivity for the crust and crumb with increasing additives. Bread with pigweed has more informative features (22 compared to 15 for purslane), and in both breads, data reduction is possible with two latent variables. The appropriate amount of additives are 3.69% for pigweed and 7.13% for purslane, with similar regression models (R2 = 0.85 and 0.84).
Comparative analysis with available literature sources shows that Olusanya et al. [8] use pigweed flour—from the leaves of the plant—in traditional African Ujeqe bread. According to the authors, the sample with 2% pigweed is acceptable for consumers. Samples with 4–6% are not acceptable for tasters, but on the other hand, they improve the nutritional value of the bread. The value obtained in this work of 3.69%, an appropriate amount of the additive, improves the results indicated in the available literature by specifying the amount of pigweed flour added to bread.
The use of pigweed seed flour allows the introduction of significantly higher amounts to replace the main raw material—wheat flour. Chaquilla-Quilca et al. [9] indicate levels of 20% compared to the withdrawal of wheat flour. Ayo [10] indicates that an acceptable level is 15% pigweed grain flour. In the present work, it was found that when using whole pigweed stalk flour, the permissible levels are up to 4%. The low value of the additive amount is due to the fact that the whole pigweed stalk has a bitter taste, which is due to the content of saponins, phenolic compounds, and oxalates, which are natural defense mechanisms against herbivores and pathogens. Saponins and tannins impart a distinct bitterness and astringency, while oxalates increase bitterness indirectly through interaction with other compounds [11].
The addition of purslane flour to bread has significant technological, nutritional, and sensory advantages. Enriching white wheat flour with 5% purslane improves rheological characteristics, increases antioxidant activity, and reduces the ratio of omega-6/omega-3 fatty acids in bread [12,13]. Bread containing up to 0–15% purslane flour showed improvements in water absorption, dough stability, and softening with increasing percentage of addition, as well as improved chemical composition, including protein, fat, ash, moisture, and dietary fiber content. However, sensory evaluations showed reduced results for color, flavor, and texture at 15% addition, while bread with 10% purslane flour was suitable for human consumption and had relatively good organoleptic properties [14]. Similarly, Bahar et al. [15] demonstrated that the addition of 10% purslane flour had a beneficial effect on blood sugar and improved lipid profile and greater stability of metabolic parameters in people with diabetes.
These results indicate that the appropriate amount of purslane in bread is in the range of 5% to 10%. The value of 7.13% obtained in this study corresponds to this range, the advantage being that the amount of the additive is precise through appropriate calculation procedures.

5. Conclusions

Within the framework of this study, a systematic approach was applied to analyze the composition of bread with additives of pigweed and purslane flour. Using automated information processing systems, the physicochemical, organoleptic, geometric, and spectral characteristics of the products were analyzed. The results obtained were processed using statistical methods and regression models, which have a sufficiently high predictive ability (R2 = 0.85 for bread with pigweed and R2 = 0.84 for bread with purslane).
It was found that increasing the amount of additives leads to specific changes in the properties of bread—a decrease in pH and oxidation-reduction potential (ORP), an increase in electrical conductivity (EC) and concentration of dissolved solids (TDS), as well as a deterioration in organoleptic indicators.
The analysis of geometric characteristics shows a decrease in the volume and area of the bread, and in spectral analysis, a decrease in the values of the reflection of the crust and crumb is observed with an increase in the amount of additives.
The appropriate amounts of additives were determined in an automated manner. It was found that 3.69% for pigweed flour and 7.13% for purslane flour maintain the balance between the technological and organoleptic qualities of the bread, offering a solution adapted to the needs of consumers and the production process. The refinement of the amounts was achieved by reducing the volume of informative features through two latent variables, which proves the effectiveness of the data processing methods used.
In the study, an algorithm was developed and applied to determine the geometric characteristics of bread based on data obtained from a 3D scanner. The algorithm provides a sufficiently accurate analysis of the volume, surface area, and density of bread, integrating data in the process of their automated processing. In addition, an algorithm was proposed to determine the porosity of bread from color digital images, which allows for analysis of the internal structure of the product related to its quality and perception by consumers.
Comparative analysis with available literature sources proves the effectiveness of applying and achieving higher accuracy when using automated data analysis systems compared to classical methods for food product analysis. These systems allow integrated processing of multiple characteristics and offer technological solutions that preserve the nutritional and organoleptic qualities of the product. The results obtained are a scientific and practical basis for the implementation of automated systems in the production of functional foods.

Author Contributions

Conceptualization, Z.Z., N.G. and D.O.; methodology, N.G. and D.O.; software, Z.Z., A.N. and M.V.; validation, A.N., M.V. and Z.Z.; formal analysis, D.O.; investigation, A.N., Z.Z. and M.V.; resources, D.O. and N.G.; data curation, Z.Z. and A.N.; writing—original draft preparation, Z.Z. and A.N.; writing—review and editing, M.V. and N.G.; visualization, Z.Z.; supervision, Z.Z. and N.G.; project administration, D.O.; funding acquisition, Z.Z. and D.O. All authors have read and agreed to the published version of the manuscript.

Funding

This work was administrative and technically supported by the Bulgarian national program “Development of scientific research and innovation at Trakia University, Bulgaria in the service of health and sustainable well-being”—BG-RRP-2.004-006-C02.

Data Availability Statement

The data is presented within the paper.

Conflicts of Interest

The authors declare no conflicts of interest.

Abbreviations

The following abbreviations are used in this manuscript:
3DThree-dimensional
AACCAmerican Association of Cereal Chemists
ANOVAAnalysis of variance
ASApproved standard
BNSBulgarian national standard
CIColor index
CIEInternational Commission on Illumination (Commission Internationale de l’Éclairage)
CPUCentral processing unit
ECElectrical conductivity
GBGigabyte
GPUGraphic processing unit
HSVHSV color model
LabLab color model (according to CIE 1976)
LChLCh color model
LDLLower-diagonal-linear (matrix decomposition technique)
LIPSOLLinear programming Interior-Point SOLvers
LSDLeast Significant Difference
Ltd.Limited company
MLRMultiple linear regression
MSEMean squared error
ORPOxidation reduction potential
PCAPrincipal component analysis
PCRPrincipal component regression
pHActive acidity
PLSRPartial least-squares regression
ppmParts per million
RAMRandom access memory
RGBRGB color model
RMSERoot-mean squared error
SEStandard error
SISpectral index
SSDSolid state drive
STL3D file format
TDSTotal dissolved solids
TLThermal losses
USAUnited States of America
Ver.Version
VISVisible spectrum of light

References

  1. Chauhan, P.; Kaushal, M.; Vaidya, D.; Gupta, A.; Kashyap, S.; Suthar, P. Personalized Nutrition to Intelligent Foods with 3D and 4D Printing. Appl. Food Res. 2025, 5, 100863. [Google Scholar] [CrossRef]
  2. Montoya-García, C.O.; García-Mateos, R.; Becerra-Martínez, E.; Toledo-Aguilar, R.; Volke-Haller, V.H.; Magdaleno-Villar, J.J. Bioactive Compounds of Purslane (Portulaca oleracea L.) According to the Production System: A Review. Sci. Hortic. 2023, 308, 111584. [Google Scholar] [CrossRef]
  3. Kumar, A.; Sreedharan, S.; Kashyap, A.K.; Singh, P.; Ramchiary, N. A Review on Bioactive Phytochemicals and Ethnopharmacological Potential of Purslane (Portulaca oleracea L.). Heliyon 2022, 8, e08669. [Google Scholar] [CrossRef] [PubMed]
  4. Dixit, V.; Joseph, K.S.; William, S.; Chole, B.; Pranjali; Dayal, D.; Chaubey, K.K.; Pal, A.K.; Xavier, J.; Manjunath, B.T.; et al. Functional Foods: Exploring the Health Benefits of Bioactive Compounds from Plant and Animal Sources. J. Food Qual. 2023, 2023, 5546753. [Google Scholar] [CrossRef]
  5. Lyons, G.; Dean, G.; Tongaiaba, R.; Halavatau, S.; Nakabuta, K.; Lonalona, M.; Susumu, G. Macro- and Micronutrients from Traditional Food Plants Could Improve Nutrition and Reduce Non-Communicable Diseases of Islanders on Atolls in the South Pacific. Plants 2020, 9, 942. [Google Scholar] [CrossRef]
  6. Mesta-Corral, M.; Gómez-García, R.; Balagurusamy, N.; Torres-León, C.; Hernández-Almanza, A.Y. Technological and Nutritional Aspects of Bread Production: An Overview of Current Status and Future Challenges. Foods 2024, 13, 2062. [Google Scholar] [CrossRef]
  7. Olakanmi, S.J.; Bharathi, V.S.K.; Jayas, D.S.; Paliwal, J. Innovations in Nondestructive Assessment of Baked Products: Current Trends and Future Prospects. Compr. Rev. Food Sci. Food Saf. 2024, 23, e13385. [Google Scholar] [CrossRef]
  8. Olusanya, R.; Kolanisi, U.; Ngobese, N. Mineral Composition and Consumer Acceptability of Amaranthus Leaf Powder Supplemented Ujeqe for Improved Nutrition Security. Foods 2023, 12, 2182. [Google Scholar] [CrossRef] [PubMed]
  9. Chaquilla-Quilca, G.; Islas-Rubio, A.; Vásquez-Lara, F.; Salcedo-Sucasaca, L.; Silva-Paz, R.J.; Luna-Valdez, J.G. Chemical, Physical, and Sensory Properties of Bread with Popped Amaranth Flour. Pol. J. Food Nutr. Sci. 2024, 74, 137–146. [Google Scholar] [CrossRef]
  10. Ayo, J.A. The Effect of Amaranth Grain Flour on the Quality of Bread. Int. J. Food Prop. 2001, 4, 341–351. [Google Scholar] [CrossRef]
  11. Havugimana, S.; Kiseleva, I.; Artemyeva, E.; Nsengumuremyi, D. Antioxidant Potential in Leaf and Stem Extracts of Different Amaranth Cultivars. Int. J. Innov. Sci. Res. Technol. 2022, 7, 780–785. [Google Scholar]
  12. Melilli, M.G.; Di Stefano, V.; Sciacca, F.; Pagliaro, A.; Bognanni, R.; Scandurra, S.; Virzì, N.; Gentile, C.; Palumbo, M. Improvement of Fatty Acid Profile in Durum Wheat Breads Supplemented with Portulaca oleracea L.: Quality Traits of Purslane-Fortified Bread. Foods 2020, 9, 764. [Google Scholar] [CrossRef]
  13. Delvarianzadeh, M.; Nouri, L.; Mohammadi Nafchi, A.; Ebrahimi, H. Physicochemical, Rheological and Sensory Evaluation of Voluminous Breads Enriched by Purslane (Portulaca oleracea L.). Ital. J. Food Sci. 2020, 32, 815–828. [Google Scholar] [CrossRef]
  14. di Cagno, R.; Filannino, P.; Vincentini, O.; Cantatore, V.; Cavoski, I.; Gobbetti, M. Fermented Portulaca oleracea L. Juice: A Novel Functional Beverage with Potential Ameliorating Effects on the Intestinal Inflammation and Epithelial Injury. Nutrients 2019, 11, 248. [Google Scholar] [CrossRef]
  15. Bahar, A.; Ebrahimi, H.; Mohammadi Nafchi, A.; Talebi, S.S.; Delvarianzadeh, M. Effect of Bread Fortified with Portulaca oleracea on Diabetic Patients with Metabolic Syndrome: A Randomized Clinical Trial. J. Knowl. Health Basic Med. Sci. 2021, 16, 32–40. [Google Scholar] [CrossRef]
  16. Basile, T.; Mallardi, D.; Cardone, M.F. Spectroscopy, a Tool for the Non-Destructive Sensory Analysis of Plant-Based Foods and Beverages: A Comprehensive Review. Chemosensors 2023, 11, 579. [Google Scholar] [CrossRef]
  17. Abeshu, Y.; Kasahun, C. Fast and Non-Destructive Multivariate Test Method to Predict Bread Wheat Grain Major Quality Parameters. Int. J. Food Prop. 2024, 27, 400–410. [Google Scholar] [CrossRef]
  18. Olakanmi, S.J.; Jayas, D.S.; Paliwal, J. Applications of Imaging Systems for the Assessment of Quality Characteristics of Bread and Other Baked Goods: A Review. Compr. Rev. Food Sci. Food Saf. 2023, 22, 1817–1838. [Google Scholar] [CrossRef]
  19. Mehdizadeh, S.A.; Noshad, M.; Nouri, S.F. Non-Destructive Detection of Bread Staleness Using Hyperspectral Images. Innov. Food Technol. 2023, 10, 299–317. [Google Scholar]
  20. El-Mesery, H.S.; Mao, H.; Abomohra, A.E. Applications of Non-Destructive Technologies for Agricultural and Food Products Quality Inspection. Sensors 2019, 19, 846. [Google Scholar] [CrossRef] [PubMed]
  21. Uyar, R.; Erdogdu, F. Potential Use of 3-Dimensional Scanners for Food Process Modeling. J. Food Eng. 2009, 93, 337–343. [Google Scholar] [CrossRef]
  22. Yang, F.; Zhang, A.; Dai, Y.; Li, K. Application of Three-Dimensional Laser Scanning Technology in Granary Reserve Detection. Chin. J. Lasers 2010, 37, 317. [Google Scholar]
  23. Rodríguez-Parada, L.; Pardo-Vicente, M.Á.; Mayuet-Ares, P.F. Digitizing Fresh Food: 3D Scanning for Custom Packaging Design. DYNA Ing. Ind. 2018, 93, 156–162. [Google Scholar] [CrossRef] [PubMed]
  24. Gulak, S.V.; Cherkashin, A.I.; Balashov, I.; Zarytskyi, V.I.; Kurskoy, Y.S.; Zhdanova, Y.V. Development of a High-Resolution Laser Marking System for Plastic and Food Industry Applications. In Proceedings of the 2019 IEEE 8th International Conference on Advanced Optoelectronics and Lasers (CAOL), Sozopol, Bulgaria, 6–8 September 2019; IEEE: Piscataway, NJ, USA, 2019; pp. 1–7. [Google Scholar] [CrossRef]
  25. Guerra, A.L.; Gidel, T.; Vezzetti, E. Toward a Common Procedure Using Likert and Likert-Type Scales in Small Groups Comparative Design Observations. In Proceedings of the International Design Conference—DESIGN 2016, Dubrovnik, Croatia, 16–19 May 2016; pp. 23–32. [Google Scholar]
  26. Aybek, E.C.; Toraman, C. How Many Response Categories Are Sufficient for Likert-Type Scales? An Empirical Study Based on the Item Response Theory. Int. J. Assess. Tools Educ. 2022, 9, 534–547. [Google Scholar] [CrossRef]
  27. Lee, G.-H.; Nam, J.-H.; Han, H.-S.; Kwon, S.-C. A Study on 3D File Format for Web-Based Scientific Visualization. Int. J. Adv. Cult. Technol. 2019, 7, 243–247. [Google Scholar] [CrossRef]
  28. Habekost, M. Which Color Differencing Equation Should Be Used? Int. Circ. Graph. Educ. Res. 2013, 6, 20–33. [Google Scholar]
  29. Pathare, P.; Opara, U.; Al-Said, F. Colour Measurement and Analysis in Fresh and Processed Foods: A Review. Food Bioprocess Technol. 2013, 6, 36–60. [Google Scholar] [CrossRef]
  30. Danev, A.; Bosakova-Ardenska, A.; Apostolov, M. Application of Thresholding Algorithms for Brown Bread Porosity Evaluation. Food Sci. Appl. Biotechnol. 2019, 2, 99–109. [Google Scholar] [CrossRef]
  31. Bosakova-Ardenska, A. Application of Global Thresholding in Bread Porosity Evaluation. Int. J. Intell. Syst. Appl. Eng. 2015, 3, 111–115. [Google Scholar] [CrossRef]
  32. Bosakova-Ardenska, A.; Danev, A. An Algorithm for Histogram Median Thresholding. In Proceedings of the CompSysTech 2018, Ruse, Bulgaria, 13–14 September 2018; pp. 62–67. [Google Scholar] [CrossRef]
  33. Bosakova-Ardenska, A.; Danev, A.; Gogova, T. White Bread Porosity Evaluation by Image Processing with HisMedian Algorithm. J. Fundam. Sci. Appl. 2019, 25, 1–7. [Google Scholar]
  34. Bosakova-Ardenska, A.; Danev, A.; Andreeva, H.; Gogova, T. Bread Porosity Evaluation by Histogram Analysis. In Proceedings of the CompSysTech 2018, Ruse, Bulgaria, 13–14 September 2018; pp. 68–72. [Google Scholar] [CrossRef]
  35. Wyman, C.; Sloan, P.-P.; Shirley, P. Simple Analytic Approximations to the CIE XYZ Color Matching Functions. J. Comput. Graph. Tech. 2013, 2, 1–11. [Google Scholar]
  36. CIE 2006. Physiologically-Relevant LMS Functions. Available online: http://www.cvrl.org/ (accessed on 16 January 2025).
  37. Mather, J. Spectral and XYZ Color Functions. Available online: https://www.mathworks.com/matlabcentral/fileexchange/7021-spectral-and-xyz-color-functions (accessed on 14 January 2025).
  38. Atanassova, S.; Nikolov, P.; Valchev, N.; Masheva, S.; Yorgov, D. Early Detection of Powdery Mildew (Podosphaera xanthii) on Cucumber Leaves Based on Visible and Near-Infrared Spectroscopy. AIP Conf. Proc. 2019, 2075, 160014. [Google Scholar] [CrossRef]
  39. Wei, W.; Wang, D.; Liang, J. Accelerating ReliefF Using Information Granulation. Int. J. Mach. Learn. Cybern. 2022, 13, 29–38. [Google Scholar] [CrossRef]
  40. ReliefF. Rank Importance of Predictors Using ReliefF or RReliefF Algorithm. Available online: https://www.mathworks.com/help/stats/relieff.html (accessed on 16 January 2025).
  41. Simankov, V.; Lutsenko, E. Adaptive Management of Complex Systems Based on Pattern Recognition Theories; TU KubGTU: Krasnodar, Russia, 1999. (In Russian) [Google Scholar]
  42. Kumar, E.; Annamalai, K. Investigation into Optimal Fixturing Cost of an Assembly Using Genetic Algorithm. Eng. Rev. 2014, 34, 85–91. [Google Scholar]
  43. Lazarova, G.; Koychev, I. Sentiment Analysis Using Multiple Sources of Information. In Big Data in eLearning and Digital Collections International Workshop; IICT-BAS: Sofia, Bulgaria, 2015. [Google Scholar]
  44. Pohjalainen, J.; Räsänen, O.; Kadioglu, S. Feature Selection Methods and Their Combinations in High-Dimensional Classification of Speaker Likability, Intelligibility and Personality Traits. Comput. Speech Lang. 2015, 29, 145–171. [Google Scholar] [CrossRef]
  45. Partial Least Squares Regression and Principal Components Regression. Available online: https://www.mathworks.com/help/stats/partial-least-squares-regression-and-principal-components-regression.html (accessed on 3 January 2025).
  46. Georgieva, T.; Mihaylova, A.; Daskalov, P. Research of the Possibilities for Determination of Some Basic Soil Properties Using Image Processing. In Proceedings of the 7th International Conference on Energy Efficiency and Agricultural Engineering (EE&AE), Ruse, Bulgaria, 11–13 June 2020; pp. 1–4. [Google Scholar]
  47. Linprog. Solve Linear Programming Problems. Available online: https://www.mathworks.com/help/optim/ug/linprog.html (accessed on 15 January 2025).
  48. Linear Programming Algorithms. Available online: https://www.mathworks.com/help/optim/ug/linear-programming-algorithms.html#brnpenw (accessed on 16 January 2025).
  49. Zhang, Y. User’s Guide to LIPSOL Linear-Programming Interior Point Solvers V0.4. Optim. Methods Softw. 1999, 11, 385–396. [Google Scholar] [CrossRef]
  50. Mehrotra, S. On the Implementation of a Primal-Dual Interior Point Method. SIAM J. Optim. 1992, 2, 575–601. [Google Scholar] [CrossRef]
  51. Duff, I. MA57—A Code for the Solution of Sparse Symmetric Definite and Indefinite Systems. ACM Trans. Math. Softw. 2004, 30, 118–144. [Google Scholar] [CrossRef]
Figure 1. Experimental setup with 3D scanner—general view. (a) Without dark box; (b) with dark box.
Analytica 06 00031 g001
Figure 2. Steps of the algorithm for determining the HSVi index. (a) RGB image; (b) HSVi image; (c) Histogram of HSVi; (d) binary image.
Analytica 06 00031 g002
Figure 3. Determining the main characteristics of bread from its three-dimensional image. (a) three-dimensional image of bread with a minimal parallelepiped; (b) calculated bread characteristics V, S, D, Vbb, Sbb.
Analytica 06 00031 g003
Figure 4. 3D-scanned images of pigweed bread (a) control sample; (b) 5%; (c) 10% (d) 15%.
Analytica 06 00031 g004
Figure 5. 3D-scanned images of purslane bread (a) control sample; (b) 5%; (c) 10% (d) 15%.
Analytica 06 00031 g005
Figure 6. Images of the top crust and crumb of wheat-pigweed bread (a) control sample; (b) 5% pigweed flour; (c) 10% pigweed flour; (d) 15% pigweed flour.
Analytica 06 00031 g006
Figure 7. Images of the top crust and crumb of wheat-purslane bread (a) control sample; (b) 5% purslane flour; (c) 10% purslane flour; (d) 15% purslane flour.
Analytica 06 00031 g007
Figure 8. Lab color components of wheat-pigweed bread. (a) crust; (b) crumb.
Analytica 06 00031 g008
Figure 9. Lab color components of wheat-purslane bread. (a) crust; (b) crumb.
Analytica 06 00031 g009
Figure 10. Color difference for crust and middle of wheat bread with: (a) pigweed flour; (b) purslane flour. All data have statistically significant differences at p < 0.05.
Analytica 06 00031 g010
Figure 11. Spectral characteristics of wheat bread with pigweed flour addition (a) crumb; (b) crust.
Analytica 06 00031 g011
Figure 12. Spectral characteristics of wheat bread with purslane flour addition (a) crumb; (b) crust.
Analytica 06 00031 g012
Figure 13. Determining the effect of the alternative flour on the selected features. (a) pigweed bread; (b) purslane bread.
Analytica 06 00031 g013
Figure 14. Determining the required number of components to reduce the volume of data. (a) wheat-pigweed bread; (b) wheat-purslane bread.
Analytica 06 00031 g014
Figure 15. Distribution and normal probability plot of the residuals for a model of the type S = f(LV1,LV2) for wheat-pigweed bread. (a) distribution of residuals; (b) normal probability plot of residuals.
Analytica 06 00031 g015
Figure 16. Distribution and normal probability plot of the residuals for a model of the type T = f(LV1,LV2) for wheat bread with purslane flour. (a) distribution of residuals; (b) normal probability plot of residuals.
Analytica 06 00031 g016
Figure 17. Determining the appropriate amount of pigweed and purslane flour in wheat bread. (a) wheat-pigweed bread; (b) wheat-purslane bread.
Analytica 06 00031 g017
Figure 18. Bread mass with appropriate amount of pigweed and purslane flour. All data have statistically significant differences at p < 0.05.
Analytica 06 00031 g018
Figure 19. Wheat bread with the appropriate amount of alternative flour. (a) Control sample; (b) 3.69% Pigweed flour; (c) 7.13% Purslane flour.
Analytica 06 00031 g019
Figure 20. Lab color characteristics of wheat bread samples with appropriate amounts of pigweed and purslane flour. (a) crust; (b) crumb.
Analytica 06 00031 g020
Figure 21. Color difference between wheat bread samples with appropriate amounts of alternative flour. All data have statistically significant differences at p < 0.05.
Analytica 06 00031 g021
Figure 22. Determination of wheat bread porosity with appropriate amounts of alternative flour. All data have statistically significant differences at p < 0.05.
Analytica 06 00031 g022
Figure 23. Three-dimensional scanned images of wheat bread with appropriate amount of alternative flour. (a) Control sample; (b) 3.69% Pigweed flour; (c) 7.13% Purslane flour.
Analytica 06 00031 g023
Figure 24. Three-dimensional images of a loaf of wheat bread with a minimal parallelepiped circumscribed around it. (a) Control sample; (b) 3.69% Pigweed flour; (c) 7.13% Purslane flour.
Analytica 06 00031 g024
Table 1. Nutritional value of type 500 flour (according to manufacturer’s data).
CharacteristicValueCharacteristicValue
Energy value, KJ/KCal1439/339Of which sugars, g2.1
Fat, g0.9Fiber, g1.5
Of which saturated fatty acids, g0.3Proteins, g11.8
Carbohydrates, g70.2Salt, g0.02
Table 2. Recipe composition of wheat bread samples with pigweed and purslane flour.
Alternative Flour, %051015
Raw Material
Wheat Flour, kg100959085
Drinking water, L80808080
Compressed (dry) Baker’s yeast, kg2222
Table salt, kg1.651.651.651.65
Alternative flour, kg051015
Dough yield, kg184184184184
Table 3. Description of the technological process for wheat bread with the addition of pigweed or purslane flour.
StageTime
t, min
Temperature
T, °C
Stage NameDescription
1-20–22Preliminary preparation of raw materialsSifting the flour, tempering the drinking water and pressed baker’s yeast
2-20–22Manually dosing of raw materialsAccording to the working recipe
310–1518–20Preparation of bread dough using a single-phase dough kneading methodMixing the wheat flour, the enrichment component, the solution of cooking salt and the suspension of water and dry baker’s yeast
435–5030–32Rising of the main doughFermentation of the prepared main dough at a certain technological regime—maturation temperature of the main dough (32 °C) for a certain time (35–50 min)
5-20–25Dividing the main doughThe dough is manually divided into pieces of a certain mass
6-20–25Shaping the dough pieceDose 230 g for bread
7-20–25Arranging in baking trays and moldsDose 440 g for bread
840–4535Final fermentationFinal round shape for bread
920–25180Baking the dough piecesBaguette shape for molded bread
1018020–22CoolingPre-prepared baking trays for flat bread
Table 4. Table of Feature/Additive Combinations.
Feature (F)F1F2Fm
Alternative Flour (A), %
A0A0F1A0F2A0Fm
A1A1F1A1F2A1Fm
AnAnF1AnF2AnFm
Table 5. Physico-chemical characteristics of a basic raw material used as an additive in wheat bread.
Raw Material
CharacteristicPigweed FlourPurslane Flour
pH5.4 ± 0.035.56 ± 0.08
TDS, ppm2389.5 ± 15.52651.5 ± 43.5
EC, µS/cm4788.5 ± 99.55354.5 ± 93.5
ORP, mV191.5 ± 4.5146.5 ± 12.5
All data have statistically significant differences at p < 0.05; pH-active acidity; TDS-totally dissolved solids; EC-electrical conductivity; ORP-oxidation-reduction potential.
Table 6. Mass of bread with additions of pigweed and purslane.
Type of Wheat Breadwith Pigweed Flour
Mass, g
with Purslane Flour
Mass, g
Alternative Flour, %
0%79.03 ± 0.2779.03 ± 0.27
5%85.47 ± 0.6682.78 ± 0.4
10%83.34 ± 0.981.14 ± 0.37
15%87.83 ± 0.8982.44 ± 0.14
All data have statistically significant differences at p < 0.05; pH-active acidity; TDS-totally dissolved solids; EC-electrical conductivity; ORP-oxidation-reduction potential.
Table 7. Main physicochemical characteristics of wheat-pigweed bread.
Pigweed Flour, %051015
Characteristic
pH6.15 ± 0.175.93 ± 05.84 ± 0.025.84 ± 0.01
TDS, ppm1341.25 ± 67.751467 ± 111699 ± 161691.5 ± 3.5
EC, µS/cm2712.5 ± 1332953 ± 43430.5 ± 0.53439.5 ± 8.5
ORP, mV261.75 ± 11.75206.5 ± 7.5183.5 ± 5.5168.5 ± 4.5
All data have statistically significant differences at p < 0.05; pH-active acidity; TDS-totally dissolved solids; EC-electrical conductivity; ORP-oxidation-reduction potential.
Table 8. Main physicochemical characteristics of wheat-purslane bread.
Purslane Flour, %051015
Characteristic
pH6.15 ± 0.176.12 ± 06.08 ± 06.01 ± 0.01
TDS, ppm1341.25 ± 67.751627.5 ± 1.51621.5 ± 0.51800.5 ± 15.5
EC, µS/cm2712.5 ± 1333253.5 ± 0.53242.5 ± 0.53594 ± 23
ORP, mV261.75 ± 11.75227 ± 8200.5 ± 7.5174 ± 5
All data have statistically significant differences at p < 0.05; pH-active acidity; TDS-totally dissolved solids; EC-electrical conductivity; ORP-oxidation-reduction potential.
Table 9. Results of organoleptic evaluation of wheat-pigweed bread.
Sensory Attribute
Pigweed Flour, %AppearanceStructureChewinessAromaTasteOverall
Assessment
0%4.83 ± 0.244.97 ± 0.054.93 ± 0.094.93 ± 0.094.97 ± 0.054.93 ± 0.1
5%4.3 ± 0.224.33 ± 0.244.33 ± 0.244.5 ± 0.414.33 ± 0.474.36 ± 0.28
10%1.5 ± 0.411.73 ± 0.92.03 ± 1.392.33 ± 1.251.7 ± 0.921.86 ± 0.96
15%1 ± 0.451.33 ± 0.722 ± 1.522.33 ± 1.51 ± 0.451.53 ± 0.87
All data have statistically significant differences at p < 0.05.
Table 10. Results of organoleptic evaluation of purslane bread.
Sensory Attribute
Purslane Flour, %AppearanceStructureChewinessAromaTasteOverall
Assessment
0%4.83 ± 0.244.97 ± 0.054.93 ± 0.094.93 ± 0.094.97 ± 0.054.93 ± 0.1
5%4.23 ± 0.174.33 ± 0.244.37 ± 0.264.57 ± 0.424.3 ± 0.54.36 ± 0.28
10%2.5 ± 0.412.37 ± 0.452.5 ± 0.412.67 ± 0.472.33 ± 0.472.47 ± 0.41
15%1.37 ± 0.721.83 ± 1.11.53 ± 0.771.8 ± 1.11.1 ± 0.511.53 ± 0.81
All data have statistically significant differences at p < 0.05.
Table 11. Algorithm of a Matlab script for determining basic characteristics of bread from its three-dimensional (3D) image.
StageNameDescription
1Input variablesSTL file, mass of bread (m, kg)
2Initializing the programming environmentClear variables, command window, and figures using clc, clear all, and close all commands
3Entering the mass value of the breadEnter the mass of the loaf of bread (m), in kilograms (kg)
4Loading the STL fileLoad the STL file using the stlread function to obtain the faces and vertices of the 3D model
5Calculating the volumeView each face of a triangle, calculate the signed volume of the tetrahedra formed by the origin, and sum the absolute values to calculate the total volume V
6Calculating the surface areaGo through each face, calculate the area of each triangle using cross product and accumulation to calculate the total surface area of the 3D object S
7Determining dimensions (dimensional profile)Calculate the minimum and maximum coordinates along each axis, then calculate the length, width, and height of the bounding box in meters
8Calculating the volume of the enclosing parallelepipedCalculate the volume of the bounding box (Vbb) as Vbb = LWH
9Calculating the surface area of the enclosing parallelepipedCalculate the surface area of the bounding box (Sbb) as Sbb = 2(LW + LH + WH)
10Calculating the densityCalculate the density (D) as m/V, where V is the calculated volume of the 3D object.
11Visualizing the STL objectDraw the STL object with its minimal parallelepiped for visualization
12Converting units of measurementConvert the surface area S to square meters and the volume V to cubic meters
13Storing results in an output variableCombine the calculated values V, S, D, Vbb, Sbb into an output array
14Measuring the execution time of the algorithmUse the tic and toc commands to determine the script execution time
15Output variablesV, S, D, Vbb, Sbb, time (t, s) for algorithm execution
Table 12. Main characteristics of wheat-pigweed bread, determined from its 3D images.
CharacteristicV, cm3S, cm2D, kg/m3Vbb, cm3Sbb, cm2
Pigweed Flour, %
0%200 ± 2180 ± 0.4444.02 ± 6.29300 ± 5250 ± 2
5%200 ± 2196 ± 0.4430.08 ± 5.76300 ± 7260 ± 1
10%200 ± 0.2190 ± 0.2418.55 ± 4.87300 ± 1270 ± 1
15%200 ± 0180 ± 0.6482.37 ± 2.31300 ± 6250 ± 1
V-volume of the bread; S-surface area of the bread; D-density of the bread; Vbb-volume of minimum parallelepiped; Sbb-surface area of minimum parallelepiped. All data have statistically significant differences at p < 0.05.
Table 13. Main characteristics of wheat-purslane bread, determined from its 3D images.
CharacteristicV, cm3S, cm2D, kg/m3Vbb, cm3Sbb, cm2
Purslane, %
0%200 ± 2180 ± 0.4444.02 ± 6.29300 ± 5250 ± 2
5%200 ± 1178 ± 0.4461.67 ± 2.45300 ± 7260 ± 3
10%200 ± 1.4160 ± 0.1530.83 ± 5.7200 ± 2220 ± 2
15%100 ± 1150 ± 0.4625.82 ± 4.06200 ± 4210 ± 3
V-volume of the bread; S-surface area of the bread; D-density of the bread; Vbb-volume of minimum parallelepiped; Sbb-surface area of minimum parallelepiped. All data have statistically significant differences at p < 0.05.
Table 14. Color index values for wheat bread with the addition of pigweed flour.
BPCrustCrumb
A, %0%5%10%15%0%5%10%15%
CI
L34.54 ± 10.4226.93 ± 8.5428.85 ± 7.7923.41 ± 6.455.08 ± 5.3340.98 ± 4.2430.45 ± 2.9728.97 ± 2.33
a8.58 ± 2.956.98 ± 1.115.36 ± 1.095 ± 1.014.21 ± 1.762.59 ± 0.890.31 ± 0.142.3 ± 0.43
b17.83 ± 3.7417.97 ± 1.8514.93 ± 1.5514.18 ± 1.4124.18 ± 1.7326.41 ± 0.7920.88 ± 0.2919.68 ± 0.8
C5.12 ± 0.494.99 ± 0.234.5 ± 0.244.38 ± 0.154.47 ± 0.384.88 ± 0.114.54 ± 0.054.69 ± 0.06
h1.12 ± 0.161.2 ± 0.061.23 ± 0.061.23 ± 0.081.4 ± 0.081.47 ± 0.031.56 ± 0.011.45 ± 0.03
ci178.57 ± 22.46104.79 ± 32.7178.81 ± 19.9392.16 ± 23.1263.66 ± 10.993.24 ± 12.3499.09 ± 12.0597.76 ± 9.67
ci231.34 ± 9.6424.36 ± 8.1627.06 ± 7.5921.92 ± 6.248.73 ± 5.0935.26 ± 3.9327.38 ± 2.9326.25 ± 2.29
ci329.53 ± 14.3224.38 ± 8.8929.28 ± 9.924.73 ± 8.52769.91 ± 50.49170.18 ± 81.8559.53 ± 7.6838.81 ± 4.38
ci420.02 ± 3.6319.31 ± 1.8215.9 ± 1.6115.09 ± 1.2224.62 ± 1.5726.55 ± 0.8120.88 ± 0.2819.82 ± 0.75
ci54.85 ± 1.396.04 ± 1.745.64 ± 1.266.78 ± 1.613.07 ± 0.293.99 ± 0.415.22 ± 0.455.33 ± 0.37
ci6111.21 ± 6.12118.94 ± 54.6390.59 ± 34.26110.34 ± 52.1734.86 ± 15.2125.99 ± 8.954.4 ± 1.8134.37 ± 8.35
ci70.5 ± 0.210.39 ± 0.070.36 ± 0.070.36 ± 0.090.18 ± 0.080.1 ± 0.030.01 ± 0.010.12 ± 0.03
ci80.79 ± 0.350.69 ± 0.190.57 ± 0.150.6 ± 0.20.25 ± 0.110.16 ± 0.050.02 ± 0.010.2 ± 0.04
ci916.76 ± 9.19.55 ± 7.4513.92 ± 7.679.28 ± 5.7930.9 ± 6.3914.64 ± 4.29.61 ± 3.149.29 ± 2.58
ci101.97 ± 0.581.5 ± 0.481.94 ± 0.551.65 ± 0.42.3 ± 0.321.55 ± 0.171.46 ± 0.161.48 ± 0.14
ci11275.96 ± 47.21281.12 ± 121.44195.6 ± 74.98227.96 ± 104.8877.15 ± 30.9365.44 ± 21.6210.41 ± 4.1476.65 ± 18.37
BP-bread part; A-alternative flour; CI-Color index. All data have statistically significant differences at p < 0.05.
Table 15. Color index values for wheat bread with purslane flour addition.
BPCrustCrumb
A, %0%5%10%15%0%5%10%15%
CI
L34.54 ± 10.4222.99 ± 9.6124.97 ± 6.9520.03 ± 7.4755.08 ± 5.3330.56 ± 4.6627.23 ± 3.0324.93 ± 3.66
a8.58 ± 2.950.87 ± 0.752.18 ± 0.822.32 ± 1.034.21 ± 1.760.98 ± 0.340.49 ± 0.652.55 ± 0.19
b17.83 ± 3.749.24 ± 2.059.98 ± 0.87.95 ± 1.2424.18 ± 1.7315.19 ± 0.6512.78 ± 0.3611.93 ± 0.29
C5.12 ± 0.493.14 ± 0.333.48 ± 0.153.2 ± 0.184.47 ± 0.383.98 ± 0.113.64 ± 0.093.81 ± 0.05
h1.12 ± 0.161.47 ± 0.11.35 ± 0.081.28 ± 0.151.4 ± 0.081.51 ± 0.021.53 ± 0.051.36 ± 0.01
ci178.57 ± 22.4666.64 ± 25.8562.22 ± 19.9964.77 ± 25.263.66 ± 10.973.19 ± 15.667.95 ± 8.8770.47 ± 14.96
ci231.34 ± 9.6422.38 ± 9.424.27 ± 6.9319.58 ± 7.4148.73 ± 5.0928.9 ± 4.5826.12 ± 3.0223.95 ± 3.66
ci329.53 ± 14.3238.36 ± 18.9934.04 ± 11.427.16 ± 12.38769.91 ± 550.4951.84 ± 14.6346.15 ± 7.4232.04 ± 5.19
ci420.02 ± 3.639.32 ± 2.0210.25 ± 0.788.37 ± 1.0724.62 ± 1.5715.22 ± 0.6612.8 ± 0.3612.2 ± 0.3
ci54.85 ± 1.398.24 ± 4.286.67 ± 1.718.63 ± 3.323.07 ± 0.295.3 ± 0.955.85 ± 0.576.34 ± 1.05
ci6111.21 ± 60.1238.56 ± 52.8856.78 ± 32.6691.28 ± 67.2234.86 ± 15.2116.47 ± 6.610.15 ± 13.4155.98 ± 18.5
ci70.5 ± 0.210.1 ± 0.10.22 ± 0.080.31 ± 0.170.18 ± 0.080.06 ± 0.020.04 ± 0.050.21 ± 0.02
ci80.79 ± 0.350.16 ± 0.170.32 ± 0.140.46 ± 0.260.25 ± 0.110.1 ± 0.030.06 ± 0.080.32 ± 0.05
ci916.76 ± 9.113.75 ± 8.4615 ± 7.2212.08 ± 7.1830.9 ± 6.3915.42 ± 4.6314.46 ± 3.213.03 ± 3.76
ci101.97 ± 0.582.45 ± 0.872.54 ± 0.822.53 ± 0.912.3 ± 0.322.02 ± 0.332.14 ± 0.272.1 ± 0.34
ci11275.96 ± 147.2153.04 ± 66.5594.21 ± 55.24134.3 ± 92.8377.15 ± 30.9331.65 ± 12.9217.98 ± 24.16100.79 ± 31.77
BP-bread part; A-additive; CI-Color index. All data have statistically significant differences at p < 0.05.
Table 16. Results of determining porosity (%) of wheat bread with alternative flour.
Type of the Wheat BreadPigweed Flour, %Purslane Flour, %
Alternative Flour, %
0%79.06 ± 2.0479.06 ± 2.04
5%81.92 ± 1.883.2 ± 1.37
10%77.27 ± 1.277.54 ± 1.25
15%73.16 ± 1.0177.37 ± 3.76
All data have statistically significant differences at p < 0.05.
Table 17. Spectral index values for wheat bread with the addition of pigweed flour.
BPCrumbCrust
A, %0%5%10%15%0%5%10%15%
SI
si10.93 ± 00.93 ± 0.010.93 ± 00.93 ± 00.92 ± 00.93 ± 00.93 ± 00.93 ± 0
si20.03 ± 00.03 ± 00.03 ± 00.03 ± 00.03 ± 00.04 ± 00.04 ± 00.03 ± 0
si30.12 ± 0.050.16 ± 0.060.13 ± 0.040.16 ± 0.050.06 ± 0.010.09 ± 0.010.12 ± 0.020.13 ± 0.01
si47.98 ± 2.855.35 ± 2.526.59 ± 2.335.05 ± 1.7311.54 ± 1.656.4 ± 1.414.88 ± 0.985.02 ± 0.77
si50.79 ± 0.030.85 ± 0.050.81 ± 0.020.83 ± 0.030.87 ± 0.020.95 ± 0.050.93 ± 0.030.9 ± 0.02
si60.05 ± 0.010.03 ± 0.010.04 ± 0.010.04 ± 0.010.02 ± 0.010.01 ± 0.010.01 ± 0.010.01 ± 0.01
si70.07 ± 0.020.04 ± 0.020.06 ± 0.010.05 ± 0.010.03 ± 0.010.01 ± 0.020.01 ± 0.010.02 ± 0.01
si80.07 ± 0.020.04 ± 0.020.06 ± 0.010.05 ± 0.010.03 ± 0.010.01 ± 0.020.01 ± 0.010.02 ± 0.01
si90.07 ± 0.020.04 ± 0.020.06 ± 0.010.05 ± 0.010.03 ± 0.010.01 ± 0.020.01 ± 0.010.02 ± 0.01
si100.13 ± 0.030.08 ± 0.040.12 ± 0.020.1 ± 0.030.06 ± 0.020.03 ± 0.040.02 ± 0.020.04 ± 0.02
si110.04 ± 0.020.02 ± 0.020.03 ± 0.010.02 ± 0.010.03 ± 0.010.01 ± 0.010.01 ± 00.01 ± 0.01
BP-bread part; A-alternative flour; si-spectral index. All data have statistically significant differences at p < 0.05.
Table 18. Spectral indices values for bread with purslane flour addition.
BPCrumbCrust
A, %0%5%10%15%0%5%10%15%
SI
si10.93 ± 00.92 ± 00.92 ± 00.93 ± 00.92 ± 00.93 ± 00.93 ± 00.93 ± 0
si20.03 ± 00.03 ± 00.03 ± 00.03 ± 00.03 ± 00.04 ± 00.04 ± 00.03 ± 0
si30.12 ± 0.050.17 ± 0.10.14 ± 0.050.19 ± 0.080.06 ± 0.010.09 ± 0.010.12 ± 0.020.13 ± 0.01
si47.98 ± 2.855.73 ± 2.636.3 ± 2.175.29 ± 2.1711.54 ± 1.656.4 ± 1.414.88 ± 0.985.02 ± 0.77
si50.79 ± 0.030.81 ± 0.030.8 ± 0.030.79 ± 0.040.87 ± 0.020.95 ± 0.050.93 ± 0.030.9 ± 0.02
si60.05 ± 0.010.04 ± 0.010.05 ± 0.010.05 ± 0.010.02 ± 0.010.01 ± 0.010.01 ± 0.010.01 ± 0.01
si70.07 ± 0.020.06 ± 0.020.07 ± 0.010.08 ± 0.020.03 ± 0.010.01 ± 0.020.01 ± 0.010.02 ± 0.01
si80.07 ± 0.020.06 ± 0.020.07 ± 0.010.08 ± 0.020.03 ± 0.010.01 ± 0.020.01 ± 0.010.02 ± 0.01
si90.07 ± 0.020.06 ± 0.020.07 ± 0.010.08 ± 0.020.03 ± 0.010.01 ± 0.020.01 ± 0.010.02 ± 0.01
si100.13 ± 0.030.12 ± 0.040.13 ± 0.030.14 ± 0.030.06 ± 0.020.03 ± 0.040.02 ± 0.020.04 ± 0.02
si110.04 ± 0.020.03 ± 0.020.03 ± 0.010.03 ± 0.010.03 ± 0.010.01 ± 0.010.01 ± 00.01 ± 0.01
BP-bread part; A-alternative flour; SI-spectral index. All data have statistically significant differences at p < 0.05.
Table 19. Features of wheat bread with alternative flour and their meaning.
FeatureMeaningFeatureMeaningFeatureMeaningFeatureMeaningFeatureMeaning
F1m, kgF15TasteF29ci13F43ci11F57SI9
F2V, m3F16Overall assessmentF30ci14F44ci12F58SI10
F3S, m2F17ci1F31ci15F45ci13F59SI11
F4D, kg/m3F18ci2F32ci16F46ci14F60SI1
F5Vbb, m3F19ci3F33ci1F47ci15F61SI2
F6Sbb, m2F20ci4F34ci2F48ci16F62SI3
F7pHF21ci5F35ci3F49SI1F63SI4
F8TDS, ppmF22ci6F36ci4F50SI2F64SI5
F9EC, µS/cmF23ci7F37ci5F51SI3F65SI6
F10ORP, mVF24ci8F38ci6F52SI4F66SI7
F11AppearanceF25ci9F39ci7F53SI5F67SI8
F12StructureF26ci10F40ci8F54SI6F68SI9
F13ChewinessF27ci11F41ci9F55SI7F69SI10
F14AromaF28ci12F42ci10F56SI8F70SI11
Table 20. Results of selection of informative features.
Pigweed BreadPurslane Bread
F10.61F290.03F570.03F10.63F290.07F570.05
F20.02F300.00F580.03F21.00F300.06F580.05
F31.00F310.03F590.00F30.00F310.08F590.61
F40.07F320.01F600.06F40.63F320.06F600.01
F50.06F330.12F610.61F50.02F330.02F610.60
F60.61F340.61F620.61F60.06F340.62F620.60
F70.05F350.13F630.10F70.06F350.03F630.00
F80.05F360.62F640.61F80.07F360.04F640.01
F90.05F370.61F650.62F90.63F370.63F650.01
F100.63F380.11F660.62F100.63F380.03F660.01
F110.10F390.11F670.62F110.21F390.02F670.01
F120.09F400.01F680.62F120.62F400.06F680.01
F130.01F410.12F690.17F130.17F410.02F690.01
F140.08F420.14F700.16F140.17F420.03F700.03
F150.61F430.64--F150.14F430.61--
F160.10F440.13--F160.64F440.63--
F170.09F450.62--F170.03F450.62--
F180.62F460.11--F180.06F460.00--
F190.62F470.07--F190.01F470.03--
F200.62F480.63--F200.01F480.61--
F210.05F490.00--F210.08F490.05--
F220.03F500.03--F220.08F500.04--
F230.03F510.01--F230.03F510.02--
F240.01F520.03--F240.06F520.05--
F250.63F530.02--F250.01F530.04--
F260.03F540.03--F260.01F540.05--
F270.01F550.03--F270.05F550.05--
F280.03F560.03--F280.07F560.05--
Table 21. Normalized values of the characteristics of wheat bread with the addition of pigweed and purslane flour.
Type of BreadPigweed BreadPurslane Bread
Alternative Flour, %0%5%10%15% Alternative Flour, %0%5%10%15%
Feature Feature
F10.000.070.040.10F10.000.040.020.04
F30.000.100.070.01F20.500.500.500.00
F60.000.080.070.00F90.000.160.150.25
F100.360.160.060.00F100.340.210.100.00
F150.800.670.140.00F120.630.500.100.00
F180.680.130.020.00F160.700.580.200.00
F190.350.170.030.00F340.880.110.000.49
F200.280.100.020.00F370.020.100.110.00
F250.440.160.030.00F430.440.110.000.82
F340.930.510.000.44F440.650.120.000.82
F360.000.090.020.05F450.610.120.000.82
F370.000.060.110.04F480.590.140.000.82
F430.880.580.000.81F590.340.000.130.04
F450.910.510.000.65F610.060.040.020.00
F480.880.660.000.79F620.000.390.460.56
F610.000.070.060.04-----
F620.000.220.470.52-----
F640.000.080.070.03-----
F650.640.070.000.16-----
F660.660.050.000.20-----
F670.640.070.000.16-----
F680.640.070.000.16-----
Table 22. PCR and PLSR results.
Type of BreadPigweed BreadPurslane Bread
MethodPCRPLSRPCRPLSR
Assessment Criteria
R20.830.830.720.82
SSE1.791.772.541.85
RMSE2.122.112.532.15
Table 23. Main physicochemical characteristics of wheat bread with appropriate amounts of pigweed and purslane flour.
Alternative FlourControl SamplePigweed Flour 3.49%Purslane Flour 7.13%
Characteristic
pH6.33 ± 0.026.21 ± 0.016.07 ± 0.02
TDS, ppm1605.5 ± 1.51655.5 ± 40.51834.5 ± 25.5
EC, µS/cm3207 ± 23349.5 ± 23.53673.5 ± 55.5
ORP, mV232.5 ± 3.5211 ± 3204 ± 3
All data have statistically significant differences at p < 0.05.
Table 24. Organoleptic evaluation of wheat bread with appropriate amount of pigweed and purslane flour.
Alternative Flour, %0%Pigweed Flour 3.49%Purslane Flour 7.13%
Characteristic
Appearance4.97 ± 0.054.57 ± 0.172.73 ± 0.52
Structure4.97 ± 0.054.67 ± 0.122.77 ± 0.56
Chewability4.97 ± 0.054.53 ± 0.054.17 ± 0.24
Aroma4.97 ± 0.054.83 ± 0.124.57 ± 0.17
Taste4.97 ± 0.053.77 ± 0.884.63 ± 0.12
Overall assessment4.97 ± 0.054.47 ± 0.153.77 ± 0.15
All data have statistically significant differences at p < 0.05.
Table 25. Main characteristics of wheat bread with appropriate amounts of alternative flour, determined from its 3D images.
Alternative Flour, %0%Pigweed Flour 3.49%Purslane Flour 7.13%
Characteristic
V, cm3300 ± 1300 ± 1200 ± 4
S, cm2242 ± 0.12234 ± 0.46182 ± 0.08
D, kg/m3301.27 ± 4.5314.13 ± 11.12464.5 ± 3.68
Vbb, cm3500 ± 4400 ± 3300 ± 2
Sbb, cm2374 ± 4.1351 ± 4.8258 ± 3.0
All data have statistically significant differences at p < 0.05.
Table 26. Comparative analysis of wheat bread with pigweed and purslane flour.
Compared CharacteristicWheat-Pigweed BreadWheat-Purslane Bread
Physicochemical characteristicsIncreasing the amount of the additive leads to a decrease in pH and ORP. EC and TDS increase their valuesIncreasing the amount of the additive leads to a decrease in pH and ORP. EC and TDS increase their values
Organoleptic evaluationIncreasing the amount of the additive leads to a deterioration in organoleptic indicatorsIncreasing the amount of the additive leads to a deterioration in the organoleptic indicators
Geometric characteristicsReduction in volume and surface area, increase in density compared to the control sampleReduction in volume and surface area, density is higher compared to the control sample and bread with pigweed
Color characteristicsDarker color compared to the control sampleColor much darker compared to the control sample and samples with pigweed
Spectral characteristicsIncreasing the amount of the additive reduces the reflectance values for both the crust and the coreIncreasing the amount of the additive reduces the reflectance values for both the crust and the core
Selection of informative features22 informative features15 informative signs
Data volume reductionPossible with two latent variablesPossible with two latent variables
Model for determining the appropriate amount of additiveR2 = 0.85R2 = 0.84
Appropriate amount of additive3.69% of the total amount of wheat flour7.13% of the total amount of wheat flour
Disclaimer/Publisher’s Note: The statements, opinions and data contained in all publications are solely those of the individual author(s) and contributor(s) and not of MDPI and/or the editor(s). MDPI and/or the editor(s) disclaim responsibility for any injury to people or property resulting from any ideas, methods, instructions or products referred to in the content.