Abstract
The contamination of food and beverages with heavy metals, such as Cd, presents significant health risks, underscoring the need for reliable and sensitive analytical methods. This study introduces the development of a rapid, cost-effective, and environmentally friendly method for Cd determination in cachaça, a traditional Brazilian sugarcane spirit. Magnetic nanoparticles (Fe3O4) functionalized with tetraethyl orthosilicate are synthesized and employed as adsorbents in a dispersive magnetic solid-phase extraction procedure. The extracted Cd is quantified using flame atomic absorption spectrometry. A full factorial experimental design is used to optimize key parameters, including the sorbent mass, adsorption time, desorption time, and acid concentration. The method demonstrates excellent analytical performance, with a linear calibration range (R2 = 0.99), detection limit of 0.0046 mg L−1, and quantification limit of 0.0200 mg L−1. Moreover, validation results show high precision (coefficient of variation < 9.10%) and accuracy (recovery rates between 92.00% and 120.00%). When analyzing commercial cachaça samples, cadmium was detected in all five specimens. Notably, in one sample the cadmium concentration exceeded Brazil’s maximum permissible limit of 0.0200 mg kg−1, underscoring the importance of this work for ensuring food safety. The proposed method offers a sensitive, reproducible, and sustainable approach for analysis of potentially toxic trace metals in alcoholic beverages, reinforcing its potential for routine monitoring and regulatory compliance.
1. Introduction
Cachaça, a traditional Brazilian spirit with an alcohol content ranging from 38.00% to 48.00%, is made through the fermentation and distillation of fresh sugarcane juice [1,2]. It is the second most consumed spirit in Brazil and holds significant cultural and economic importance. The production process includes sugarcane cultivation, fermentation, distillation, and optional aging in wooden barrels to enhance its sensory characteristics [2]. While artisanal production, using Cu pot stills, prioritizes quality and aromatic complexity, industrial methods emphasize large-scale production [1]. Although historically associated with lower social classes, cachaça has gained international recognition, including as a Geographical Indication product exclusive to Brazil [3]. Maintaining quality control is essential, as contamination with heavy metals threatens both safety and authenticity [1,3].
Contamination of cachaça, particularly with heavy metals, presents significant challenges for both public health and product quality. Metals such as Cu, Fe, and Mn can originate from production equipment, including Cu stills, which are favored for their heat conductivity and role in enhancing sensory characteristics [4,5]. While Cu positively influences the aroma and flavor of the beverage, excessive amounts can catalyze the formation of toxic compounds, such as ethyl carbamate, which is recognized as a potential carcinogen [6]. Another contaminant is cadmium (Cd), which, although less commonly detected, poses serious health risks due to its toxic effects [5,6]. Regulatory standards in Brazil impose strict limits on these elements, such as 5.00 mg L−1 for Cu and 0.02 mg kg−1 for Cd, to ensure consumer safety [5,7]. However, achieving compliance requires rigorous monitoring and the adoption of good manufacturing practices to mitigate contamination risks during fermentation, distillation, and storage [4,5].
The production and quality control of cachaça face significant challenges due to the absence of standardized, sensitive, and accessible methods for detecting chemical contaminants. Although research has advanced in characterizing the chemical profile of cachaça, studies frequently highlight gaps in the detection and quantification of toxic elements such as Cd, Pb, and Cu, as well as organic contaminants such as ethyl carbamate and polycyclic aromatic hydrocarbons [8,9]. Existing methodologies often rely on expensive and resource-intensive techniques that are not feasible for many small-scale producers [7,8]. In addition, traditional approaches do not align with modern sustainability and environmental responsibility principles [1,4,8,10,11]. Therefore, the development of sensitive and reliable analytical methods is crucial.
To address these challenges, recent advancements in analytical chemistry have focused on developing innovative extraction techniques that are both efficient and environmentally friendly. Liquid–liquid microextraction methods, such as hollow-fiber liquid-phase microextraction and dispersive liquid–liquid microextraction, integrate sampling, extraction, and pre-concentration into a single step to minimize solvent consumption and achieve high enrichment factors for trace analytes [12,13]. In contrast, solid-phase microextraction and dispersive magnetic solid-phase extraction (DMSPE) represent solid–liquid approaches that employ functionalized adsorbents, such as magnetic nanoparticles, to enhance selectivity and simplify separation processes. In particular, DMSPE has emerged as a promising technique due to its operational simplicity, high sensitivity, and alignment with green chemistry principles, making it highly suitable for the determination of heavy metals in complex matrices [12,13].
Magnetic solid-phase extraction (MSPE) is an effective technique for the detection and pre-concentration of heavy metals in complex matrices, offering advantages such as simplified sample preparation, reduced solvent consumption, and compatibility with green chemistry principles. This method utilizes magnetic nanoparticles as sorbents, which can be separated using an external magnetic field, eliminating the need for filtration or centrifugation. The functionalization of magnetic nanoparticles with materials such as silica, graphene oxide, or metal–organic frameworks enhances their selectivity and reusability. Among these functionalization strategies, tetraethyl orthosilicate (TEOS) plays a critical role in creating silica-coated magnetic nanoparticles, improving their chemical stability, increasing their surface area, and enabling additional modifications to target analytes. MSPE has demonstrated detection limits in the ng L−1 range for metals such as Cd and Pb, establishing itself as a sensitive, efficient, and environmentally sustainable method for trace-metal analysis [14,15,16].
This study introduces a sensitive, rapid, and environmentally sustainable analytical method for Cd determination in cachaça using DMSPE with Fe3O4 nanoparticles functionalized with TEOS. Coupled with flame atomic absorption spectrometry (FAAS), the method ensures efficient analyte extraction and selective quantification while adhering to green chemistry principles. By optimizing key extraction parameters, the proposed approach minimizes reagent consumption, simplifies sample preparation, and enhances method sensitivity. Given the limited availability of cost-effective and scalable analytical techniques for Cd monitoring in alcoholic beverages, this study advances food safety protocols and regulatory compliance, supporting the quality control of cachaça.
2. Materials and Methods
2.1. Chemical and Reagents
All reagents used in this study were of analytical grade. TEOS (98%), sodium hydroxide (NaOH, 99%), iron(II) sulfate tetrahydrate (FeSO4·4H2O, ≥99%), iron(III) chloride hexahydrate (FeCl3·6H2O, ≥98%), and Cd standard solutions (1000.00 mg L−1, ≥99%) were purchased from Sigma-Aldrich® (Steinheim, Germany). Ammonium hydroxide (NH4OH, 28%) and isopropyl alcohol (99.9%) were obtained from Isofar® (Rio de Janeiro, Brazil), while nitric acid (HNO3, 65%) and hydrochloric acid (HCl, 37%) were supplied by Exodus Scientifica (São Paulo, Brazil).
All solvents, including ethanol and deionized water, were of analytical grade. High-purity deionized water (resistivity 18.2 MΩ cm) was obtained using a Milli-Q water purification system (Millipore RiOs-DI™, Bedford, MA, USA) and used for solution preparation, sample dilution, and cleaning procedures. Standard working solutions of Cd were freshly prepared daily by diluting the stock solution with deionized water to the required concentrations. These solutions were stored in amber glass containers at 4 °C until use. All chemicals and solvents were used without further purification.
2.2. Synthesis and Functionalization of Magnetic Sorbent
Magnetite nanoparticles (Fe3O4) were synthesized using the co-precipitation method, following the procedure described by Henrique da Silva Cavalcanti et al. [17]. Two 50.00 mL aqueous solutions were prepared separately: one containing FeSO4·4H2O (3.50 g) and the other containing FeCl3·6H2O (4.00 g) These solutions were mixed in a three-neck round-bottom flask under constant stirring and an inert nitrogen atmosphere for 3.00 h. Simultaneously, a 10.00 M NaOH solution (25.00 mL) was added dropwise at a rate of 0.20 mL min−1. Upon completion of the synthesis, the resulting black precipitate was transferred to a beaker and separated using an external magnetic field for recovery and purification. Then, the nanoparticles were washed with ultrapure water until the washing solution reached a neutral pH, followed by vacuum drying at 60 °C for 24.00 h.
The dried Fe3O4 nanoparticles were ground, sieved, and functionalized with tetraethyl orthosilicate (TEOS) to form functionalized magnetite nanoparticles (Fe3O4@TEOS). For this step, Fe3O4 (300.00 mg) was dispersed in a 5:1 v:v isopropanol/water mixture with ultrasonic agitation for 20.00 min to ensure proper dispersion. Subsequently, a 28% NH4OH solution (5.00 mL) and TEOS (2.00 mL) were added to the reaction mixture. The functionalization reaction was conducted at room temperature under horizontal stirring for 12.00 h to ensure complete surface modification. Then, the Fe3O4@TEOS nanoparticles were separated using an external magnetic field, washed with ultrapure water until a neutral pH was reached, and dried under vacuum at 60 °C for 24 h.
2.3. Characterization of Magnetic Sorbent
The Fe3O4@TEOS were characterized using Fourier-transform infrared (FTIR) spectroscopy to confirm their synthesis and silica coating. FTIR spectra were recorded using a Prestige-21 spectrometer equipped with a DLATGS high-sensitivity detector, operating within a wavenumber range of 4000.00–400.00 cm−1 at a resolution of 4.0 cm−1. Data acquisition was performed using IR Solution version 1.10 software, and spectral analysis was conducted with Origin 2018 (64-bit). The characteristic absorption bands observed at approximately 580.0 (Fe–O stretching) and 1100.0 cm−1 (Si–O–Si stretching vibrations) confirmed the successful functionalization of Fe3O4 nanoparticles with TEOS.
Zeta potential measurements were conducted using a Zetasizer Nano ZS equipped with an MPT-2 Titrator (Malvern, Worcestershire, UK) to evaluate the surface charge and stability of the nanoparticles. Aqueous suspensions (10.00 mL) of Fe3O4 and Fe3O4@TEOS (5.00 mg mL−1) were individually prepared and subjected to ultrasonic agitation for 30 min to ensure proper dispersion. Subsequently, 1.00 mL of each suspension was added to a 0.02 mol L−1 phosphate-buffered solution (10.00 mL), and the zeta potential was measured over a pH range of 3.0 to 10.0 to assess the influence of pH on nanoparticle stability.
2.4. Adsorption Kinetics and Isotherm
To perform the adsorption kinetics, Cd solution with concentration equivalent to 1.00 mg L−1 was prepared. The following experimental times were used: 0, 0.25, 0.50, 0.75, 1.00, 5.00, 10.00, 20.00, 30.00, 45.00, 60.00 and 90.00 min, with 75.00 mg of Fe3O4@TEOS. The experiments were performed in triplicate, and a blank sample containing water was also analyzed. For the procedure, 1.50 mL of standard Cd solution was prepared at a concentration of 1.00 mg L−1 using ultrapure water and placed in contact with the material in glass tubes, which were kept under agitation at 1000 rpm for the periods mentioned above. After the corresponding times, the solutions were separated with the help of a magnet, and, subsequently, the supernatants were collected, filtered and analyzed by FAAS to determine the concentration of Cd in the remaining solutions. The mass of the analyte adsorbed by the material was calculated considering the difference between the total analyte mass before adsorption, the mass remaining in the supernatants and the total mass of Fe3O4@TEOS used, according to Equation (1):
where Co (mg L−1) is the initial concentration, Cf (mg L−1) is the analyzed concentration, V (L) is the Cd2+ solution volume and m (g) is the mass of the sorbent [18].
The data were treated according to pseudo-first-order, pseudo-second-order, chemisorption (Elovich) and fractional order models fitted with a nonlinear fitting method using OriginPro 2018 64-bit software (OriginLab®, Buckinghamshire, UK), taking into consideration the value of the linear correlation coefficient (R2). To confirm the best fit, the models were statistically evaluated based on the error function (Ferror) (Equation (2)), which correlates the theoretical amount of Cd adsorbed by the material with that measured experimentally, considering the number of parameters of the fitted model [18]:
where n is the number of experiments performed; p is the number of parameters of the fitted model; qi, exp is each value of q measured experimentally; and qi, theoretical is each value of q predicted by the fitted model.
The adsorption isotherm was constructed using a Cd solution and 75.00 mg Fe3O4@TEOS. The following concentrations were evaluated: 1.00, 1.50, 2.00, 2.50, 4.00, and 6.00 mg L−1 (triplicate of each concentration). A total of 1.50 mL of Cd standard solution at the previously mentioned concentrations was placed into contact with Fe3O4@TEOS into test tubes and stirred at 1000 rpm for 1 min. After the corresponding times, the solutions were separated with the help of a magnet, and the supernatant was collected, filtered and analyzed by FAAS. The mass adsorbed by the material was calculated considering the difference between the total analyte mass before adsorption, the mass remaining in the supernatant and the total mass of NPMS@TEOS used (Equation (1)). All data were treated according to Langmuir, Freundlich, Sips, Khan, Toth and Redlich–Peterson isotherm models (nonlinear fitting) using OriginPro 2019 64-bit Software (OriginLab®, UK), based on the value of the linear correlation coefficient (R2) and Ferror (Equation (2)).
2.5. Microextraction Procedure
The cachaça samples analyzed in this study were commercially available and selected to represent a range of production styles. Before analysis, the samples were visually inspected for inconsistencies and stored under refrigeration at 4 °C to preserve their chemical integrity. All experimental steps were conducted at room temperature to minimize potential interferences caused by temperature fluctuations.
The optimized DMSPE procedure was applied for Cd determination in cachaça samples. In this protocol, Fe3O4@TEOS nanoparticles (20.00 mg) were used as the sorbent. The cachaça samples were treated with the nanoparticles and subjected to ultrasonic agitation for 1.00 min to enhance dispersion and interaction. Subsequently, the samples were vortexed for 5 min at 1000 rpm to ensure thorough adsorption of Cd onto the sorbent material. After extraction, the magnetic nanoparticles were separated using an external magnetic field, and Cd was desorbed using 0.10 M nitric acid (1.00 mL). This desorption step was performed under vortex agitation for an additional 5.00 min at 1000 rpm to ensure complete release of Cd into the solution. Then, the resulting supernatant was analyzed using FAAS to quantify Cd concentrations in the samples.
2.6. Instrumentation
The determination of Cd was performed using a flame atomic absorption spectrometer (AA-7000, Shimadzu, Kyoto, Japan). The instrument was equipped with a Cd hollow-cathode lamp as the radiation source, operating at a current of 8.00 mA and wavelength of 228.80 nm with a bandwidth of 0.70 nm. A deuterium lamp was used for background correction to minimize matrix interferences. All measurements were performed using an acetylene/air flame, with flow rates of 1.80 L min−1 for acetylene and 15.00 L min−1 for air, ensuring optimal atomization conditions.
2.7. Experimental Design and Statistical Analysis
A full factorial experimental design (24) was employed to optimize the DMSPE procedure for Cd determination in cachaça samples. The design evaluated four critical factors: sorbent mass (10.00–30.00 mg), adsorption time (5.00–15.00 min), desorption time (5.00–15.00 min), and nitric acid concentration for desorption (0.10–1.00 M). Each parameter was tested at two levels, with additional triplicate experiments at the central point and blank analyses performed to assess the reproducibility and baseline signals.
The experiments were conducted using FAAS, with Cd absorbance as the analytical response. Statistical analysis was performed using analysis of variance to evaluate the significance of individual factors and their interactions. A Pareto chart was generated to visually represent the influence of each variable, identifying sorbent mass as the most significant factor affecting Cd absorbance (p < 0.05). Based on these findings, further optimization experiments were conducted by varying the sorbent mass from 30.00 to 100.00 mg to determine the most effective adsorption conditions.
All statistical analyses and data processing were performed using Excel 2013 and Statistica version 12.5.192.7 software. Results were considered statistically significant at a 95.0% confidence level (p < 0.05).
2.8. Analytical Performance
Linearity, precision, accuracy, and the lower limits of detection (LOD) and quantification (LOQ) were evaluated. These studies were conducted using a pool of five cachaça samples spiked with Cd at concentrations ranging from 0.02 to 1.00 mg L−1. Linearity and sensitivity were assessed by the correlation coefficient (r) and the slope of the calibration curve, respectively. These parameters were established using calibration curves (prepared in sextuplicate) at six different concentrations (0.02, 0.10, 0.30, 0.50, 0.75, and 1.00 mg L−1).
Intraday precision was evaluated by performing six replicates at three concentration levels (0.02, 0.50, and 1.00 mg L−1) on the same day. Interday precision was assessed by analyzing six replicates at the same concentration levels on three different days. The results were expressed as the coefficient of variation (CV).
Intraday accuracy was determined by six replicates at three concentration levels (0.02, 0.50, and 1.00 mg L−1) on the same day, while interday accuracy was evaluated in the same manner over three different days. The accuracy studies were performed using the standard addition and recovery method, and the results were expressed as recovery percentages.
The LOD and LOQ were determined experimentally. The lowest concentration at which acceptable accuracy and precision were achieved was defined as the LOQ, while the lowest detectable concentration distinguishable from the baseline noise was defined as the LOD. All analytical performance studies were performed using cachaça samples to account for potential matrix effects.
2.9. Study of the Interfering Ions
The influence of interfering ions was analyzed individually by comparing the analytical signal obtained for Cd in solutions doped with interfering ions and the signal obtained for a solution containing only the ion of interest (Cd). The analyses were performed according to the previously optimized conditions using binary solutions containing Cd at a concentration of 0.50 mg L−1 and Ca2+, Na+, K+, Mg2+, Fe2+, Zn2+, Cu2+, SO42−, and HCO3−, each at a concentration of 1.00 mg L−1 [19,20]. Recoveries between 85.0 and 115.0% were considered to indicate no interference from the interfering ions.
2.10. Evaluation of Matrix Effect
The presence of matrix effects in the method was assessed by constructing calibration curves for Cd using standard solutions in ultrapure water and in the corresponding cachaça matrix. Qualitatively, the matrix effect was assessed by comparing the linear regression lines of the respective calibration curves. Quantitatively, the matrix effect was determined according to Equation (3).
where Swater refers to the slope of the calibration curve constructed from Cd standards prepared in ultrapure water, and Scachaça refers to the slope of the calibration curve constructed from Cd standards prepared in the matrix cachaça.
3. Results and Discussion
3.1. Synthesis and Characterization
Magnetic nanoparticles (MNPs) based on Fe3O4 exhibit different physical and chemical properties compared to bulk materials, molecules, or isolated atoms. Their single-domain structure, high surface-area-to-volume ratio, and ability to be coated with different ligands justify their widespread use as a core for preparing various magnetic materials [21]. Furthermore, Fe3O4 has a high tendency to adhere to and aggregate with other particles, resulting in a loss of magnetism [22]. Therefore, coating with TEOS has been widely explored, as it improves their chemical stability and provides better protection against toxicity. At the same time, the surfaces of the MNPs are replete with silanol groups, which can be modified with various coupling agents to covalently attach specific bioligands to the surfaces of the magnetic nanoparticles [21].
The synthesis of Fe3O4 magnetic nanoparticles was successfully achieved using the co-precipitation method, yielding approximately 2.50 g of black powder after drying. Following surface modification with TEOS, Fe3O4@TEOS nanoparticles were obtained with an average mass of 3.00 g, exhibiting a brownish color. The reduced yield compared with those of the theoretical expectations was attributed to the loss of uncoated Fe3O4 during the washing steps. The purification process involved repeated washing, agitation, and magnetic separation to remove uncoated Fe3O4, which exhibited stronger magnetization and faster sedimentation. While some functionalized nanoparticles were inevitably lost during purification, the resulting material demonstrated higher purity, which was essential for achieving reproducible adsorption performance.
FTIR analysis was conducted to confirm the successful synthesis and functionalization of the nanoparticles. The spectra, presented in Figure S1 (in the Supplementary Material), revealed structural modifications on the nanoparticle surfaces while preserving the integrity of the magnetic core after TEOS coating. The characteristic Fe–O stretching vibration was observed at approximately 580 cm−1 in both the Fe3O4 and Fe3O4@TEOS samples, confirming that the magnetic core remained intact after functionalization. Additional peaks at approximately 802.00, 950.00, and 1085.00 cm−1 corresponded to the Si–O symmetric stretching, Si–OH asymmetric stretching, and Si–O–Si vibrations, respectively, and these values are consistent with the literature. These spectral features validated the successful coating of Fe3O4 with silica, which was crucial for improving the stability and adsorption properties of the nanoparticles [21,23].
Zeta potential measurements were performed to evaluate the surface charge and colloidal stability of Fe3O4 and Fe3O4@TEOS nanoparticles. The zeta potential is a key parameter influencing nanoparticle aggregation and dispersion behavior in aqueous media. Typically, nanoparticles with zeta potential values exceeding ±30.00 mV exhibit good stability due to electrostatic repulsion, which minimizes particle aggregation. In this study, Fe3O4 nanoparticles exhibited a zeta potential of 33.10 mV, indicating a positively charged surface before functionalization (Figure S2 and Table S1, in the Supplementary Material). Following TEOS coating, the zeta potential shifted to 18.10 mV, reflecting the presence of silica functional groups on the nanoparticle surface (Figure S2). This shift confirmed the successful modification of Fe3O4 with TEOS, as the introduction of Si–OH and Si–O–Si bonds altered the surface charge, enhancing the colloidal stability. Improved stability reduces nanoparticle aggregation, thereby maximizing surface area and adsorption capacity for efficient DMSPE applications. In addition, zeta potential variation as a function of pH was evaluated, revealing isoelectric points of 3.6, and 4.4 for Fe3O4 and Fe3O4@TEOS, respectively. These changes in isoelectric point values indicated the incorporation of Fe3O4 nanoparticles within the structure and confirmed the presence of the TEOS layer on Fe3O4 @TEOS, as reported in the literature [24]. These results validated successful synthesis of the Fe3O4@TEOS sorbent, demonstrating that it retained its magnetic properties while possessing a functionalized silica surface, making it well-suited for DMSPE applications. Previous studies have generated particle size histograms of Fe3O4@TEOS and Fe3O4 using scanning electron microscopy (SEM) [23]. The Fe3O4@TEOS nanoparticles exhibited a hydrodynamic diameter of 18.4 ± 3.6 nm—approximately 7.00 nm larger than that of pure Fe3O4—indicating the formation of a uniform silica layer rather than uncontrolled aggregation. When combined with a zeta potential more negative than –30.00 mV, these particles benefit from enhanced electrostatic repulsion that prevents aggregation and ensures colloidal stability over time.
3.2. Adsorption Kinetics and Isotherms
Different adsorption kinetic models were adjusted to the experimental data. Equations and the estimated parameters are presented in Table 1. The curves obtained for the fitted models are shown in Figure 1. The pseudo-second-order model is better able to predict the adsorption kinetics for Cd by Fe3O4@TEOS because it presents the lowest values for the error function (Ferror) and the highest value for R (Table 1). The equilibrium time was established at 1 min, as shown in Figure 1. The pseudo-second-order model assumes that the adsorption rate is proportional to the square of the number of available sites, suggesting that the adsorption process involves chemical interactions between the adsorbent and the ion. Moreover, adsorption is dependent on the concentration of the adsorbate and is governed by chemisorption, which implies the formation of chemical bonds or electron sharing between Cd2+ and Fe3O4@TEOS [25].

Table 1.
Models, equations and estimated parameters for the kinetics models.
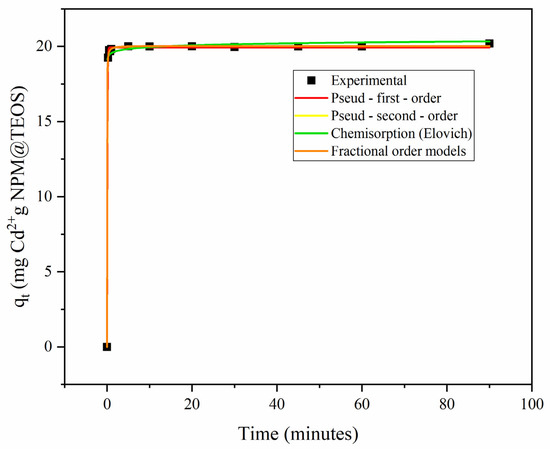
Figure 1.
Adjusted kinetic models. Pseudo-first-order (PFO), pseudo-second-order (PSO), fractional-order (Avrami), chemisorption (Elovich).
The experimental data obtained for the adsorption isotherms were analyzed using the Langmuir, Freundlich, Sips, Khan, Redlich–Peterson, and Toth mathematical models (Figure 2). Among these, the Sips model provided the best fit for the adsorption of Cd onto Fe3O4@TEOS, as indicated by the lowest values of the error function (Ferror) and the highest correlation coefficient (R2) (Table 2). As a hybrid of the Langmuir and Freundlich models, the Sips isotherm is particularly suitable for systems with heterogeneous adsorption surfaces. It assumes adsorption occurs on a surface with sites of varying affinities and energies, exhibiting Freundlich-like behavior at low concentrations and approaching Langmuir behavior at higher concentrations. The excellent fit of the Sips model suggests that the adsorbent surface is energetically heterogeneous, and that the adsorption mechanism deviates from the idealized monolayer model proposed by Langmuir [26].
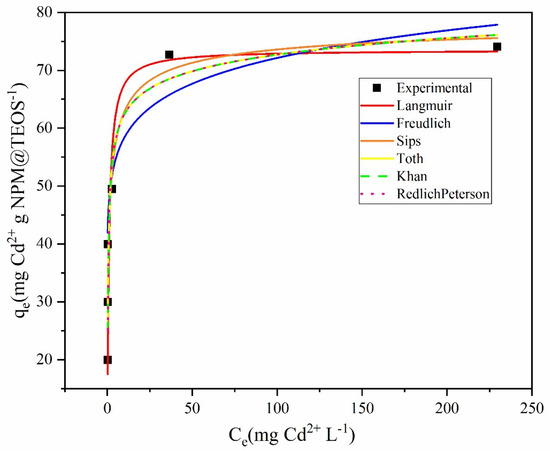
Figure 2.
Adjusted isotherm models: Langmuir, Freundlich, Sips, Khan, Toth and Redlich–Peterson fits.
Table 2.
Models, equations and estimated parameters for the adjusted adsorption isotherm models.
3.3. Optimization of the Extraction Conditions
The optimization of the DMSPE procedure was conducted using a full factorial experimental design (24) to evaluate the influence of four key parameters: sorbent mass (10.00–30.00 mg), adsorption time (5.00–15.00 min), desorption time (5.00–15.00 min), and nitric acid concentration (0.10–1.00 M). A total of 22 experiments were performed, including triplicate central points and blank analyses, to ensure the reproducibility and reliability of the results. The experimental responses were analyzed using analysis of variance, and the statistical significance of each factor was assessed using a Pareto chart at a 95% confidence level (p < 0.05) (Figure 3).
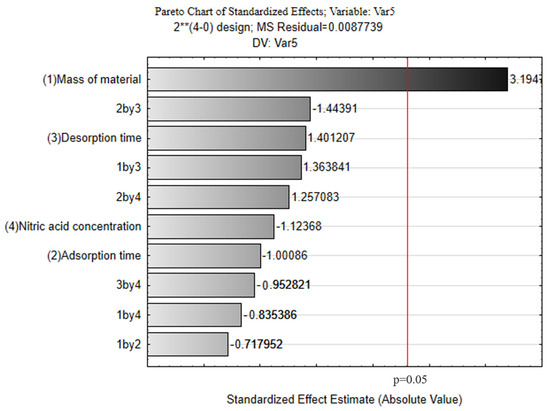
Figure 3.
Pareto chart for the optimization of extraction conditions.
The results indicated that the sorbent mass had the most significant effect on Cd extraction, showing a positive correlation with absorbance values. In contrast, adsorption and desorption times, as well as the nitric acid concentration, exhibited no statistically significant influence. Further experiments varying the sorbent mass from 30.00 to 100.00 mg revealed that absorbance plateaued beyond 75.00 mg, which was selected as the optimal sorbent mass. Under the optimized conditions, ultrasonic agitation was applied for 1.00 min, vortex agitation was performed for 5.00 min at 1000 rpm, and desorption was conducted using 0.50 M nitric acid.
3.4. Analytical Performance of the Proposed Method
The analytical performance of the proposed method was evaluated in terms of linearity, intraday and interday precision, intraday and interday accuracy, limit of detection (LOD), and limit of quantification (LOQ).
The method exhibited a linear response for Cd concentrations ranging from 0.02 to 1.00 mg L−1, with a coefficient of determination (R2) of 0.9991. The linear regression equation was established as:
where ABS is the absorbance and [Cd] is the cadmium concentration in mg L−1.
ABS = (0.339 ± 0.0052) [Cd] + (0.0030 ± 0.0029),
Both intraday and interday precision and accuracy were found to be satisfactory. The coefficients of variation for intraday and interday precision ranged from 0.84% to 9.09% and from 0.16% to 3.68%, respectively. Recovery rates, reflecting accuracy, ranged from 97.05% to 115.10% (intraday) and from 91.64% to 119.79% (interday).
There are several approaches to calculate LOD and LOQ; however, because this method is intended for the analysis of a complex matrix (cachaça), we opted to determine these limits experimentally. This was achieved by progressively decreasing the analyte concentration in the matrix until the detection and quantification limits were reached. As a result, the LOD and LOQ were established at 0.0046 and 0.02 mg L−1, respectively. Table 3 summarizes the main results obtained from the analytical performance evaluation.
Table 3.
Analytical performance.
As a proof of principle, the recently developed DMSPE-FAAS method was applied to determine Cd levels in five commercially available cachaça samples from Alfenas, Brazil (Table S2 in the Supplementary Material). The results showed that Cd was detected in one sample at a concentration above the permitted residual value in Brazil, which is 0.02 mg L−1 [5,6]. The other four samples had cadmium concentrations below the method’s detection limit; thus, Cd was detectable but not quantifiable in these cases. The method demonstrated low variability, with standard deviations (SDs) below 25.00%, confirming its accuracy and suitability for trace-level analysis. These findings highlight the applicability of the method for routine monitoring of Cd in cachaça and underscore its potential role in regulatory compliance and quality control within the alcoholic beverage industry.
3.5. Comparison of the Proposed Method with Previously Reported Methods
In order to assess the analytical performance of our DMSPE–FAAS method for Cd determination in cachaça, we compared it against several previously published protocols (Table 4), focusing on sensitivity, detection limits, extraction efficiency and real-sample applicability. Although our method’s LOD (0.0046 mg L−1) is higher than those reported by Soylak et al. (2023) [27] and Camba et al. (2015) [28], it still outperforms most alternative approaches in environmental sustainability and cost-effectiveness. Uniquely, our protocol is validated directly in the complex cachaça matrix—an alcoholic beverage rich in organic interferents—and employs widely available FAAS instrumentation, featuring a linear range (0.02–1.00 mg L−1) that coincides with Brazil’s regulatory limit of 0.02 mg L−1.
Compared to air-assisted liquid–liquid dispersive microextraction (LOD = 0.51 mg L−1) and square-wave anodic stripping voltammetry (≈0.10 mg L−1), our DMSPE–FAAS approach achieves superior sensitivity. While fluorescent chemosensors deliver high selectivity, they demand specialized equipment, impeding routine use. In contrast, the present method enhances Cd adsorption onto Fe3O4@TEOS nanoparticles, thus improving extraction efficiency and minimizing matrix effects versus direct-introduction techniques such as ICP-OES and ETAAS. Furthermore, FAAS offers lower operational costs, simpler maintenance, faster throughput, reduced specialty-gas consumption and broader accessibility in standard laboratories.
Adhering to green-chemistry principles, our DMSPE protocol eliminates the need for organic-solvent-based extraction, significantly reducing reagent use and waste generation. Consequently, the method not only meets rigorous sensitivity and reproducibility criteria but also aligns with sustainable practices, making it particularly suitable for routine Cd monitoring in cachaça.
Finally, to highlight the innovative aspect of our work, we constructed a bibliometric map. Bibliometrics is a quantitative method for analyzing scientific literature, used to provide insights into current research trend [29]. To evaluate which methods have already been developed for cadmium determination in cachaça, a search was conducted in the Web of Science database covering the period from 2012 to 2022. This search identified ten relevant studies focused on the development of analytical methods for cadmium determination in cachaça.
Using VOSviewer version 1.6.20 software, a conceptual map was generated based on the keywords from these studies, as shown in Figure S3 (Supplementary Material). The map included only keywords that appeared at least four times across the publications. The result clearly indicates that “cachaça” is directly associated with the terms “cadmium” and “magnetic solid-phase extraction.” However, no direct correlation was observed between “cadmium” and “magnetic solid-phase extraction” within the current literature.
This highlights a notable gap that our proposed DMSPE-FAAS method addresses. To the best of our knowledge, our work is the first to develop a method that directly relates these concepts for the determination of cadmium in cachaça. Moreover, the limited number of studies identified emphasizes the relevance of this topic and the existence of important scientific gaps that remain unexplored.
In addition, some of the previously published methods do not validate their protocols using the actual matrix, thereby overlooking the matrix effect [5]. This reinforces the strength of our approach, as we not only optimized and validated the method directly in the cachaça matrix but also employed a pool of five different samples. This strategy ensured matrix compatibility and enhanced the reliability of our results.
3.6. Study of the Interfering Ions
The analyses were conducted according to subtopic 2, Study of Interfering Ions, in Topic 2, Materials and Methods. Figure 4 shows the recovery percentages for the Cd2 analytical signal in the presence of Cu2+, Ca2+, Na+, K+, Mg2+, Fe3+, Zn2+, SO42−, and HCO3−.
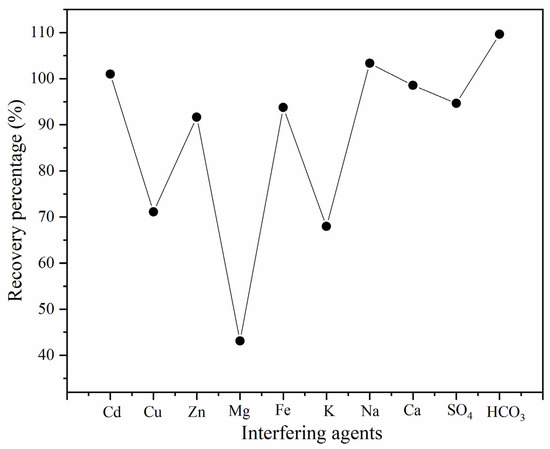
Figure 4.
Effect of interfering ions on the recovery percentages for the Cd2+ analytical signal using NPMs@TEOS as adsorbents in the FAAS system. Conditions: Cd2+ (0.50 mg L−1) Cu2+, Zn2+, Mg2+, Fe3+, K+, Na+, Ca2+, SO4, and HCO3 (1.00 mg L−1).
Analyzing the results, it is evident that the interfering effect is more pronounced for Cu2+, Mg2+, and K+, which exhibit a negative impact—probably due to competition for complexation or adsorption sites. This is attributed to the fact that metal ions such as Zn2+ and Cu2+ share similar chemical properties to Cd2+. They can compete with cadmium for active sites in the NPM@TEOS material, thus decreasing the analytical signal or making it difficult to distinguish between ions using the applied method [30]. Furthermore, the increased ionic strength caused by the presence of K+ can also negatively influence the Cd2+ removal efficiency [31].
3.7. Evaluation of the Matrix Effect
To assess the presence of matrix effects in the developed analytical method, a qualitative evaluation was initially performed by comparing the slopes of the calibration curves prepared in ultrapure water and cachaça. A matrix effect is confirmed when the calibration curves exhibit significantly different slopes. As illustrated in Figure 5, a matrix effect was observed in the proposed method for determining cadmium in cachaça, as evidenced by the distinct slopes of the calibration curves.
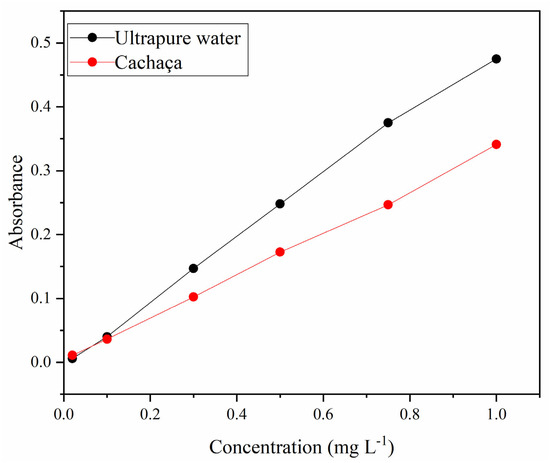
Figure 5.
Matrix effect results for cadmium in cachaça.
In addition to the qualitative evaluation, a quantitative assessment of the matrix effect was carried out by calculating the percentage matrix effect (%ME) as described by the following equation. According to Economou et al. (2010), variations below 20% are considered insignificant, those between 20% and 50% moderate, and those above 50% strong matrix effects [32]. Our results yielded a %ME of 57.23%, indicating a strong matrix effect. Given this finding, quantification should be performed using the calibration curve constructed in cachaça to adequately compensate for the effect. It is important to note that matrix effects are frequently reported in analyses involving complex matrices. The preconcentration factor was determined as the ratio of the slopes of the calibration curves obtained with and without the preconcentration step, resulting in a value of 1.54. This value indicates that the developed method increases analytical sensitivity for cadmium determination by 54% [33].
Table 4.
Comparison of the proposed method with previously reported methods.
Table 4.
Comparison of the proposed method with previously reported methods.
| Method | Detection | Analytes | LOD (mg L−1) | LOQ | Extraction Method | Advantages | Reference |
|---|---|---|---|---|---|---|---|
| DM- µSPE | ETAAS | Cd | 2.3 × 10⁻⁶ | - | Fe3O4 | High sensitivity, and fast | [28] |
| Md-µSPE | FAAS | Cd | 0.0013 | 0.043 mg L−1 | Fe3O4-SiO2-MIL-53 | High sensitivity | [27] |
| SWASV | Electrochem. | Cd, Cu, Zn, Pb | 0.10–0.50 | - | CNE & GE | Fast, cost-effective, and suitable for multi-metal detection | [34] |
| Fluor-chemosensor | Fluorescence | Cd | 0.0099 | 33.31 nmol L−1 | Supramolecular interaction | Highly selective and rapid but requires fluorescence equipment | [35] |
| AA-DLLME | FAAS | Cd, Mn | 0.51 | - | Trichlorethylene + PAN | Efficient but relies on organic solvents | [5] |
| ICP-OES | ICP-OES | Cd, Cu, Zn | 0.50–1.00 | - | Direct sample injection | Highly accurate and multi-element capable but expensive | [20] |
| Proposed method | FAAS | Cd | 0.0046 | 0.02 mg L−1 | DMSPE using Fe3O4@TEOS | High sensitivity, green chemistry, with minimal reagent consumption | This study |
DM- µSPE: Magnetic dispersive micro-solid phase; SWASV: Square Wave Anodic Stripping Voltammetry; CNE: Carbon Nanotube Electrode; GE: Graphite Electrode; AA-DLLME: Air-Assisted Dispersive Liquid–Liquid Microextraction; FAAS: Flame Atomic Absorption Spectrometry; ICP-OES: Inductively Coupled Plasma Optical Emission Spectrometry; ETAAS: Electrothermal Atomic Absorption Spectrometry; DMSPE: Dispersive Magnetic Solid-Phase Extraction; PAN: 1-(2-Pyridylazo)-2-Naphthol (chelating agent).
4. Conclusions
In this study, a DMSPE method utilizing Fe3O4@TEOS nanoparticles was successfully developed and optimized for the determination of Cd in cachaça. Coupled with FAAS, the method demonstrated high sensitivity, achieving an LOD of 0.0046 mg L−1, making it one of the most effective techniques reported for trace Cd analysis in alcoholic beverages.
The optimization process identified the sorbent mass as the most significant factor, leading to an efficient and environmentally friendly procedure that minimized reagent consumption and the sample preparation time. Compared with previously reported methods, DMSPE-FAAS offers a cost-effective alternative to more complex and expensive techniques, such as ICP-OES and electrothermal atomic absorption spectrometry, while providing superior sensitivity compared with those of voltametric and fluorescence-based approaches. In addition, the green chemistry principles applied in this study, including reduced solvent use and simplified sample handling, reinforced the sustainability of the method.
Moreover, the successful application to commercial cachaça samples confirmed the reliability of the proposed methodology for the routine monitoring of heavy metals, ensuring compliance with regulatory standards for food safety. Given its high efficiency, ease of use, and affordability, this method holds significant potential for implementation in quality control laboratories and regulatory agencies, contributing to the improved monitoring of Cd contamination in alcoholic beverages. Further studies could explore its application to other toxic metals across various beverage matrices and potential modifications to further enhance its selectivity for different contaminants.
Supplementary Materials
The following supporting information can be downloaded at: https://www.mdpi.com/article/10.3390/analytica6030033/s1, Figure S1. Fourier-transform infrared spectra of Fe3O4 and Fe3O4@tetraethyl orthosilicate (TEOS) nanoparticles. Figure S2. Zeta potential measurements of Fe3O4 and Fe3O4@TEOS nanoparticles as a function of pH. Table S1: Zeta potential values obtained for Fe3O4 and Fe3O4@TEOS nanoparticles. Table S2. The concentration of Cd2+found in commercial cachaça samples using the developed method. Average concentration (mg L−1) of n = 3.
Author Contributions
Conceptualization, S.A.d.S., C.d.R.F., G.C.d.L., Í.A.d.S.G., N.C.C., B.A.R. and M.G.S.; methodology, S.A.d.S., C.d.R.F., G.C.d.L. and N.C.C.; formal analysis, S.A.d.S., C.d.R.F., G.C.d.L., Í.A.d.S.G. and N.C.C.; investigation, S.A.d.S., C.d.R.F., G.C.d.L., Í.A.d.S.G., N.C.C., B.A.R. and M.G.S.; writing—original draft, S.A.d.S., C.d.R.F., G.C.d.L., Í.A.d.S.G., N.C.C., B.A.R. and M.G.S.; writing—review and editing, S.A.d.S., C.d.R.F., G.C.d.L., Í.A.d.S.G., N.C.C., B.A.R. and M.G.S.; visualization, S.A.d.S., C.d.R.F., G.C.d.L., Í.A.d.S.G., N.C.C., B.A.R. and M.G.S.; supervision, B.A.R. and M.G.S.; project administration, M.G.S.; funding acquisition, M.G.S. All authors have read and agreed to the published version of the manuscript.
Funding
The authors gratefully acknowledge financial support and use of facilities provided by Universidade Federal de Alfenas, Conselho Nacional de Desenvolvimento Científico e Tecnológico, Fundação de Amparo à Pesquisa do Estado de Minas Gerais [grant number APQ-00782-18] and Coordenação de Aperfeiçoamento de Pessoal de Nível Superior [financial code 001].
Institutional Review Board Statement
Not applicable.
Informed Consent Statement
Not applicable.
Data Availability Statement
Not applicable.
Conflicts of Interest
The authors declare no known financial or personal conflicts of interest that could have influenced the research reported in this study.
References
- Ratkovich, N.; Esser, C.; de Resende Machado, A.M.; Mendes, B.D.A.; Cardoso, M.D.G. The Spirit of Cachaça Production: An Umbrella Review of Processes, Flavour, Contaminants and Quality Improvement. Foods 2023, 12, 3325. [Google Scholar] [CrossRef]
- Da Silva, V.P.; De Souza, J.B.; De Queiroz, A.L.M.; Ribeiro-Filho, N.; Bezerra, T.K.A. Cachaça Production: From Sugar Cane to Spirit. J. Inst. Brew. 2023, 129, 259–275. [Google Scholar] [CrossRef]
- Bortoletto, A.M. Rum and Cachaça. In Distilled Spirits; Elsevier: Amsterdam, The Netherlands, 2023; pp. 61–74. [Google Scholar] [CrossRef]
- Marcondes Pereira, A.d.A.; Acevedo, M.S.M.S.F.; Alcarde, A.R. Improvement of the Chemical Quality of Cachaça. Beverages 2024, 10, 79. [Google Scholar] [CrossRef]
- Fontes, A.S.; Romero, J.C.; Guimarães, L.B.; da Silva, E.G.P.; de Lima, C.D.; Amorim, F.A.C. Development of Method Based on Dispersive Liquid-Liquid Microextraction Air-Assisted for Multi-Element Determination of Cadmium and Manganese in Sugarcane Spirit (Brazilian Cachaça) by FAAS. Food Anal. Methods 2020, 13, 222–229. [Google Scholar] [CrossRef]
- Penteado, J.C.P.; Masini, J.C. Multivariate Analysis for the Classification Differentiation of Brazilian Sugarcane Spirits by Analysis of Organic and Inorganic Compounds. Anal. Lett. 2009, 42, 2747–2757. [Google Scholar] [CrossRef]
- Ministério da Agricultura e Pecuária, Secretaria de Política Agrícola. PROJEÇÕES DO AGRONEGÓCIO: Brasil 2022/23 a 2032/33 Projeções de Longo Prazo; MAPA: Brasilia, Brazil, 2022. Available online: https://www.gov.br/agricultura/pt-br/assuntos/noticias/producao-de-graos-brasileira-devera-chegar-a-390-milhoes-de-toneladas-nos-proximos-dez-anos/ProjeesdoAgronegcio20232033.pdf (accessed on 18 June 2025).
- Bortoletto, A.; Alcarde, A. Assessment of Ethyl Carbamate Contamination in Cachaça (Brazilian Sugar Cane Spirit). Beverages 2016, 2, 28. [Google Scholar] [CrossRef]
- de Resende Machado, A.M.; Cardoso, M.d.G.; Saczk, A.A.; dos Anjos, J.P.; Zacaroni, L.M.; Dórea, H.S.; Nelson, D.L. Determination of Ethyl Carbamate in Cachaça Produced from Copper Stills by HPLC. Food Chem. 2013, 138, 1233–1238. [Google Scholar] [CrossRef]
- Bortoletto, A.M.; Silvello, G.C.; Alcarde, A.R. Chemical and Microbiological Quality of Sugar Cane Juice Influences the Concentration of Ethyl Carbamate and Volatile Congeners in Cachaça. J. Inst. Brew. 2015, 121, 251–256. [Google Scholar] [CrossRef]
- Santiago, W.D.; Cardoso, M.d.G.; Zacaroni, L.M.; Rodrigues, L.M.A.; Duarte, F.C.; de Fátima e Silva Ribeiro, C.; Nelson, D.L. Multivariate Analysis for the Characterization of Physico-Chemical Profiles of Cachaça Produced in Copper Stills over a Period of Six Years in Minas Gerais State. J. Inst. Brew. 2015, 121, 244–250. [Google Scholar] [CrossRef]
- Aguirre, M.Á.; Baile, P.; Vidal, L.; Canals, A. Metal Applications of Liquid-Phase Microextraction. TrAC Trends Anal. Chem. 2019, 112, 241–247. [Google Scholar] [CrossRef]
- Kocot, K.; Pytlakowska, K.; Zawisza, B.; Sitko, R. How to Detect Metal Species Preconcentrated by Microextraction Techniques? TrAC Trends Anal. Chem. 2016, 82, 412–424. [Google Scholar] [CrossRef]
- Hemmati, M.; Rajabi, M.; Asghari, A. Magnetic Nanoparticle Based Solid-Phase Extraction of Heavy Metal Ions: A Review on Recent Advances. Microchim. Acta 2018, 185, 160. [Google Scholar] [CrossRef] [PubMed]
- Susanti, I.; Holik, H.A. Review: Application of Magnetic Solid-Phase Extraction (Mspe) in Various Types of Samples. Int. J. Appl. Pharm. 2021, 13, 59–68. [Google Scholar] [CrossRef]
- Corps Ricardo, A.I.; Abujaber, F.; Guzmán Bernardo, F.J.; Rodríguez Martín-Doimeadios, R.C.; Ríos, Á. Magnetic Solid Phase Extraction as a Valuable Tool for Elemental Speciation Analysis. Trends Environ. Anal. Chem. 2020, 27, e00097. [Google Scholar] [CrossRef]
- Henrique da Silva Cavalcanti, M.; Bueno Alves, L.; Duarte, A.; Aguiar Mendes, A.; Maurício Schneedorf Ferreira da Silva, J.; José Freitas da Silveira, N.; Tsuyama Escote, M.; Sindra Virtuoso, L. Immobilization of Thermomyces Lanuginosus Lipase via Ionic Adsorption on Superparamagnetic Iron Oxide Nanoparticles: Facile Synthesis and Improved Catalytic Performance. Chem. Eng. J. 2022, 431, 134128. [Google Scholar] [CrossRef]
- dos Santos, R.C.; Kakazu, A.K.; Santos, M.G.; Belinelli Silva, F.A.; Figueiredo, E.C. Characterization and Application of Restricted Access Carbon Nanotubes in Online Extraction of Anticonvulsant Drugs from Plasma Samples Followed by Liquid Chromatography Analysis. J. Chromatogr. B Anal. Technol. Biomed. Life Sci 2017, 1054, 50–56. [Google Scholar] [CrossRef]
- Mimura, A.M.S.; Sousa, R.A.; Silva, J.C.J. Critical Evaluation of As, Cd, Cu, Mn, Pb, and Zn Concentrations in Brazilian Artisanal Sugar Cane Spirits by FAAS and GFAAS Using Matrix-Matched Calibration. At. Spectrosc. 2017, 38, 25–31. [Google Scholar] [CrossRef]
- Junior Ferreira, R.; Ramon Rosa, T.; Tagarro Tomaz, A.; Ribeiro, J.; Cristina Barthus, R. Simultaneous Determination of Metals in Cachaça: A Study on Comparison of Multivariate Methods and Quality Control. Orbital Electron. J. Chem. 2022, 14, 228–233. [Google Scholar] [CrossRef]
- Santos, M.G.; de Carvalho, D.T.; Caminitti, L.B.; de Lima, B.B.A.; Cavalcanti, M.H.d.S.; dos Santos, D.F.R.; Virtuoso, L.S.; Hirata, D.B.; Figueiredo, E.C. Use of Magnetic Fe3O4 Nanoparticles Coated with Bovine Serum Albumin for the Separation of Lysozyme from Chicken Egg White. Food Chem. 2021, 353, 129442. [Google Scholar] [CrossRef]
- Laurent, S.; Forge, D.; Port, M.; Roch, A.; Robic, C.; Vander Elst, L.; Muller, R.N. Magnetic Iron Oxide Nanoparticles: Synthesis, Stabilization, Vectorization, Physicochemical Characterizations, and Biological Applications. Chem. Rev. 2008, 108, 2064–2110. [Google Scholar] [CrossRef]
- Mendes Alvarenga, L.; dos Reis Feliciano, C.; Giordano Alvarenga, B.; Maximiler Campos de Paula, H.; Luiza Coelho, Y.; Henrique Mendes da Silva, L.; Fernando Gorup, L.; Gonçalves Santos, M.; Sindra Virtuoso, L. Preparation of a Composite Sensor Based on a Fluorescent and Magnetic Molecular Imprint Polymer for Metronidazole Extraction–Detection. J. Mol. Liq. 2023, 390, 123027. [Google Scholar] [CrossRef]
- de Carvalho, D.T.; Santos, M.G.; Hirata, D.B.; Gorup, L.F.; Figueiredo, E.C. Interaction between Modified Magnetic Nanoparticles and Human Albumin: Kinetics and Isotherm Studies and Application in Protein Depletion. Int. J. Biol. Macromol. 2024, 280, 135763. [Google Scholar] [CrossRef] [PubMed]
- Wang, J.; Guo, X. Adsorption Kinetic Models: Physical Meanings, Applications, and Solving Methods. J. Hazard. Mater. 2020, 390, 122156. [Google Scholar] [CrossRef] [PubMed]
- Mozaffari Majd, M.; Kordzadeh-Kermani, V.; Ghalandari, V.; Askari, A.; Sillanpää, M. Adsorption Isotherm Models: A Comprehensive and Systematic Review (2010–2020). Sci. Total Environ. 2022, 812, 151334. [Google Scholar] [CrossRef]
- Soylak, M.; Uzcan, F.; Goktas, O.; Gumus, Z.P. Fe3O4-SiO2-MIL-53 (Fe) Nanocomposite for Magnetic Dispersive Micro-Solid Phase Extraction of Cadmium (II) at Trace Levels Prior to HR-CS-FAAS Detection. Food Chem. 2023, 429, 136855. [Google Scholar] [CrossRef]
- Camba, M.; Romero, V.; Lavilla, I.; Bendicho, C. In Situ Growth of Fe3O4 Nanoparticles for Dispersive Magnetic Micro-Solid Phase Extraction of Cadmium Followed by ETAAS Detection. Anal. Methods 2015, 7, 1154–1160. [Google Scholar] [CrossRef]
- Su, H.-N.; Lee, P.-C. Mapping Knowledge Structure by Keyword Co-Occurrence: A First Look at Journal Papers in Technology Foresight. Scientometrics 2010, 85, 65–79. [Google Scholar] [CrossRef]
- Ebrahim, S.E.; Sulaymon, A.H.; Saad Alhares, H. Competitive Removal of Cu2+, Cd2+, Zn2+, and Ni2+ Ions onto Iron Oxide Nanoparticles from Wastewater. Desalination Water Treat. 2016, 57, 20915–20929. [Google Scholar] [CrossRef]
- Salmani, M.H.; Davoodi, M.; Ehrampoush, M.H.; Ghaneian, M.T.; Fallahzadah, M.H. Removal of Cadmium (II) from Simulated Wastewater by Ion Flotation Technique. Iran. J. Environ. Health Sci. Eng. 2013, 10, 16. [Google Scholar] [CrossRef]
- Economou, A.; Botitsi, H.; Antoniou, S.; Tsipi, D. Determination of Multi-Class Pesticides in Wines by Solid-Phase Extraction and Liquid Chromatography-Tandem Mass Spectrometry. J. Chromatogr. A 2009, 1216, 5856–5867. [Google Scholar] [CrossRef]
- Ferreira, S.; Deandrade, J.; Korn, M.; Pereira, M.; Lemos, V.; Santos, W.; Rodrigues, F.; Souza, A.; Ferreira, H.; Dasilva, E. Review of Procedures Involving Separation and Preconcentration for the Determination of Cadmium Using Spectrometric Techniques. J. Hazard. Mater. 2007, 145, 358–367. [Google Scholar] [CrossRef]
- Ferreira, R.J.; Rosa, T.R.; Ribeiro, J.; Barthus, R.C. Simultaneous Metal Determination in Artisanal Cachaça by Using Voltammetry and Multivariate Calibration. Food Chem. 2020, 314, 126126. [Google Scholar] [CrossRef]
- dos Santos Carlos, F.; da Silva, L.A.; Zanlorenzi, C.; Souza Nunes, F. A Novel Macrocycle Acridine-Based Fluorescent Chemosensor for Selective Detection of Cd2+ in Brazilian Sugarcane Spirit and Tobacco Cigarette Smoke Extract. Inorg. Chim. Acta 2020, 508, 119634. [Google Scholar] [CrossRef]


Disclaimer/Publisher’s Note: The statements, opinions and data contained in all publications are solely those of the individual author(s) and contributor(s) and not of MDPI and/or the editor(s). MDPI and/or the editor(s) disclaim responsibility for any injury to people or property resulting from any ideas, methods, instructions or products referred to in the content. |
© 2025 by the authors. Licensee MDPI, Basel, Switzerland. This article is an open access article distributed under the terms and conditions of the Creative Commons Attribution (CC BY) license (https://creativecommons.org/licenses/by/4.0/).