Article

Induction of Salt Stress Tolerance in Strawberries Using a Chitosan–Maltodextrin System

by
Judith Isabel Torres-de la Cruz
1,
Eneida Adilene Pérez-Velasco
2,
Aida Isabel Leal-Robles
3 and
Alonso Méndez-López
1,*
1
Department of Horticulture, Antonio Narro Autonomous Agrarian University, Saltillo 25315, Mexico
2
Department of Advanced Materials, Center for Research in Applied Chemistry, Saltillo 25294, Mexico
3
Departament of Botany, Antonio Narro Autonomous Agrarian University, Saltillo 25315, Mexico
*
Author to whom correspondence should be addressed.
Polysaccharides 2026, 7(3), 80; https://doi.org/10.3390/polysaccharides7030080
Submission received: 20 May 2026 / Revised: 22 June 2026 / Accepted: 29 June 2026 / Published: 3 July 2026

Abstract

Salinity is a major abiotic constraint limiting strawberry (Fragaria × ananassa) productivity by disrupting water relations, nutrient uptake, and photosynthetic processes. Biopolymer-based biostimulants have emerged as a sustainable strategy to enhance crop performance under stress conditions. The objective of this study was to evaluate the effect of a chitosan–maltodextrin (CHTMD) formulation on growth, physiological response, and fruit quality in strawberry plants under saline conditions at the Universidad Autonoma Agraria Antonio Narro in Saltillo, Mexico. A randomized complete block design with a 2 × 4 factorial arrangement was established, including two salinity levels (0 and 45 mM NaCl) and four CHTMD concentrations (0, 250, 500, and 1000 mg L−1). The application of CHTMD significantly mitigated the adverse effects of salinity and improved plant growth, biomass accumulation, gas exchange, yield, and fruit quality. Under saline conditions, 250 mg L−1 increased total fresh weight by 148.5% compared with the saline control, while root length increased by up to 58.5% under non-saline conditions. Yield was enhanced by 87.3% and 71.4% with 250 and 1000 mg L−1, respectively, whereas fruit number increased by up to 63.8% under salinity. Photosynthetic rate increased from 12.58 to 16.19 μmol CO2 m−2 s−1 and stomatal conductance from 0.235 to 0.325 mol H2O m−2 s−1. Fruit quality was also enhanced, with soluble solids increasing from 5.9 to 7.1 °Brix, vitamin C from 50.58 to 115.42 mg 100 g−1 FW, and total anthocyanins from 65.7 to 106.2 C3G 100 g−1 FW, indicating a substantial enhancement to the fruit’s nutraceutical quality, particularly at 500 mg L−1 and 1000 mg L−1. These findings demonstrate that the CHTMD system is an effective biostimulant capable of improving tolerance to salt stress by modulating key physiological and biochemical responses, as well as enhancing the functional quality of the fruit. This approach represents a promising and sustainable strategy for strawberry production in agricultural systems affected by salinity.

1. Introduction

Global agricultural production faces the challenge of increasing productivity in the context of climate change and progressive soil degradation, where abiotic factors—particularly salinity—represent one of the main constraints on crop growth and yield [1,2]. It is estimated that, by 2050, up to 30% of farmland will be affected by salinization processes, which seriously compromises global food security [3,4].
Saline stress affects plants through multiple mechanisms, including osmotic stress, ionic toxicity, and redox imbalance. These processes lead to reduced water uptake, alterations in ionic homeostasis—particularly in the Na+/K+ ratio—and the accumulation of reactive oxygen species (ROS), which cause damage to cell membranes, proteins, and photosynthetic systems, as well as growth abnormalities and reduced yield [5,6,7]. Although plants have developed adaptive mechanisms to counteract these effects, these systems are inadequate under conditions of severe stress, which has driven the search for exogenous strategies to improve tolerance to abiotic stress.
In this context, biostimulants have emerged as sustainable tools capable of modulating physiological and metabolic processes in plants, improving nutrient use efficiency, stress tolerance, and crop quality [2]. Unlike conventional fertilizers, biostimulants act primarily by regulating metabolic and physiological pathways, including the activation of the antioxidant system, photosynthetic efficiency, and optimization of water status [8].
Within this group, natural polysaccharides have gained particular importance due to their biodegradability, biocompatibility, and ability to act as bioactive molecules [9,10]. These compounds have demonstrated efficacy in mitigating the effects of salt stress through various mechanisms, such as the regulation of ion transport, Na+ compartmentalization, stabilization of cell membranes, and activation of antioxidant systems [11,12].
Chitosan (CHT), one of the most extensively studied polysaccharides, has demonstrated consistent effects in improving tolerance to various types of abiotic stress. Its application induces the activation of antioxidant enzymes such as superoxide dismutase (SOD), catalase (CAT), peroxidase (POX), and glutathione reductase (GPX), contributing to the reduction in oxidative damage and the maintenance of cellular integrity [11,13,14].
Furthermore, it has been documented that CHT improves growth parameters, yield, and osmolite accumulation in different species under saline and water stress conditions. For example, in sunflower plant (Helianthus annuus L.) plants subjected to 4000 mg/L salinity stress, CHT application recorded the highest values of all the studied growth and yield quantity and quality via enhancing photosynthetic pigments and the studied physiological aspects [15]. Durum wheat (Triticum durum Desf.) treated with chitosan showed an increase in shoot biomass in seedlings stressed with 200 mM NaCl [13]. In sorghum (Sorghum bicolor L.) plants stressed with 300 mM NaCl, the application of chitosan effectively reversed the negative effects of salinity by stimulating increases in proline, total soluble sugars, and the activities of the SOD and APX enzymes [16].
Furthermore, the use of combined polymeric systems represents an emerging strategy for optimizing the efficacy of biostimulants. In particular, the incorporation of hydrophilic polysaccharides such as maltodextrin (MD) may improve the stability, solubility, and controlled release of bioactive compounds, thereby enhancing their persistence and interaction whit plant tissues. Recent studies have demonstrated that maltodextrin-based formulations can positively influence plant growth, physiological performance, and crop productivity. For example, maltodextrin-containing biostimulants have been reported to improve biomass accumulation, photosynthetic activity, and fruit quality in horticultural crops, while formulations based on dextrose and maltodextrin have promoted plant growth under both optimal and stressful conditions. Likewise, chitosan–maltodextrin and other chitosan-based composite systems have enhanced growth, yield, and fruit quality in crops such as chili pepper and tomato, suggesting a synergistic interaction between these polysaccharides in the modulation of plant physiological responses [17,18]. Beyond agricultural applications, chitosan–maltodextrin systems have also been successfully used as encapsulating matrices for bioactive compounds, improving their stability, bioavailability, and antioxidant activity [19,20]. Despite these promising findings, information regarding the effectiveness of chitosan–maltodextrin formulations in mitigating salinity stress in strawberry plants remains scarce. Therefore, the present study was conducted to address this knowledge gap and to evaluate the potential of CHTMD formulation as a biostimulant for improving strawberry performance under saline conditions. The aim was to evaluate the effect of a CHTMD formulation on plant growth, physiological performance, fruit yield, and fruit quality of strawberry plants cultivated under salinity stress.
We hypothesized that the application of CHTMD would enhance salinity tolerance by improving water relations, gas exchange, and physiological performance, thereby increasing plant growth, productivity, and fruit quality under saline conditions.

2. Materials and Methods

2.1. Experimental Location

The study was conducted in a shade-house from January through November 2025 at Departamento de Botanica of Universidad Autonoma Agraria Antonio Narro (UAAAN) in Saltillo, Coahuila, Mexico, geographically located at coordinates 25°21′26.40″ N 101°02′01.44″ W and 1763 m above sea level. Environmental variables were recorded using a data logger (Watch Dog 1000 Series, Spectrum Technologies, Inc., Aurora, IL, USA). During the experimental period, the average temperature was 18.1 °C (maximum 23.4 °C, minimum 14.4 °C), the average relative humidity was 68% (maximum 92%, minimum 45%), and the average photosynthetically active radiation was 375 µmol m−2 s−1.

2.2. Preparation and Characterization of the CHTMD System

Chitosan (CAS 9012-76-4) was purchased from Sigma-Aldrich (Merck KGaA, Darmstadt, Germany); the biopolymer was of low molecular weight, with a degree of deacetylation ≥75% and low viscosity, and was derived from chitin obtained from the shells of shrimp (Pandalus borealis). Commercial food-grade maltodextrin (MD) (DE value < 20) was obtained from the hydrolysis of corn starch (Manuchar Inc., Monterrey, Mexico).
To prepare the solutions, CHT was dissolved in 1% (v/v) acetic acid under constant stirring for 48 h until completely solubilized. Subsequently, the MD was added, and the mixture was stirred for 24 h at room temperature to promote homogenization. The CHTMD formulation was prepared at a 1:1 (w/w) ratio. The concentrations evaluated (0, 250, 500, and 1000 mg L−1) corresponded to the CHT concentration, with MD added at the same concentration to maintain the 1:1 ratio. Final solutions were prepared at different concentrations (0, 250, 500, and 1000 mg L−1). The CHTMD formulation was characterized using Fourier-transform infrared spectroscopy (FTIR) (Thermo Scientific-Nicolet iS50, Waltham, MA, USA) to identify individual functional groups and possible functional groups between the polysaccharides. Scanning electron microscopy (SEM) was performed to characterize the morphology of the CHTMD formulation. Images were obtained using a scanning electron microscope (JEOL JCM-6000, Akishima, Tokyo, Japan) at different magnifications to evaluate the surface morphology of the sample.

2.3. Salinity Application and Crop Management

Bare-root strawberry seedlings of the Victory variety, provided by INAPI (Agricultural Supplies for Greenhouses, Guanajuato, Mexico), were used. The plants were established in 4 L containers with a mixture of sphagnum peat (60% v/v; Premier Tech, Rivière-du-Loup, QC, Canada) and horticultural perlite (40% v/v; Hortiperl, Durango, Mexico). The plants were irrigated with a complete nutrient solution (Steiner, 1961) [21]. Two solutions were prepared: one without NaCl and another with 45 mM NaCl. This concentration was selected because it represents a moderate salinity stress level previously used in strawberry studies, capable of inducing physiological and productive alterations without severely compromising plant survival [22,23,24]. The macronutrient composition (meq L−1) was 12 NO3−, 1 H2PO4−, 7 K, 9 Ca, 4 Mg, and 7 SO42−. The micronutrients (mg L−1) were 5.3 Fe-EDTA, 0.4 Zn-EDTA, 2.6 Mn-EDTA, 0.5 Cu-EDTA, 0.2 B, and 0.2 Mo. The pH of the nutrient solution without salinity was 6.1 and the electrical conductivity (EC) was 1.99 dS m−1 (Hanna Combo HI 98129, Woonsocket, RI, USA). The solution with the addition of NaCl had a pH of 6.3 and an EC of 4.09 dS m−1. Irrigation was applied via a drip system (Netafim, Irrigation Inc., Fresno, CA, USA), with two emitters per container (1 L h–1). Water was supplied for 6 min/day during the vegetative phase and 15 min/day during the reproductive phase.

2.4. Application of the CHTMD System

Saline stress was initiated 21 days after transplanting (DAT). The first application of CHTMD treatment was carried out seven days after the start of saline treatment. The biostimulant was applied via the root zone (0, 250, 500, and 1000 mg L−1) at a rate of 100 mL per container at 15-day intervals during the growing cycle. Water (0 mg L−1) was applied as a control treatment.

2.5. Plant Growth and Development

At the end of the experimental period, plant height, number of leaves, total fresh weight, total dry weight, and root length were determined. Plant height (cm) was measured from the crown of the plant to the tip of the longest leaf using a measuring tape. The total number of leaves per plant was recorded by counting all leaves produced during the experimental period, including those that had senesce or were removed during routine management. After the final harvest, the aerial and root tissues of each plant were collected and weighed immediately to determine total fresh weight (g). Subsequently, the plant material was dried in a forced-air oven (Novatech, HS45-AIA, Murrieta, CA, USA) at 70 °C for 72 h until constant weight and weighed to determine total dry weight (g). Root length was measured after carefully washing the root system and recording the length of the longest root using a measuring tape.

2.6. Fruit Size and Yield

The equational and polar diameters of the fruits were measured using a digital caliper. Total yield was calculated as the sum of the fruit weight (Rhino, BAPRE-3, Cuautitlán Izcalli, Mexico) per plant harvested over 105 days, and the total number of fruits per plant was recorded.

2.7. Gas Exchange

The photosynthetic rate, stomatal conductance, internal CO2 concentration, and transpiration rate were measured using a portable photosynthesis system (LI-COR 6400XT, Biosciences, Lincoln, NE, USA) on fully expanded, visibly healthy leaves. Measurements were taken between 11:30 a.m. and 1:00 p.m. under controlled conditions (CO2: 373.5 µmol moL−1; temperature: 27.2 °C; RH: 54.9%). The SPAD index was recorded every 15 days (KONICA MINOLTA, SPAD-502, Chiyoda-ku, Tokyo, Japan).

2.8. Fruit Quality and Bioactive Compounds

Total soluble solids (°Brix) was determined using a refractometer (ATAGO ATC−1E). Vitamin C content was determined using the AOAC 967.21 method, based on titration with 2,6-dichloroisophthol (DCPIP). To do this, 10 g of a previously homogenized fresh sample was weighed and extracted with 50 mL of hydrochloric acid. The extract was filtered, and a 10 mL aliquot was taken, which was titrated with the standardized DCPIP solution until a faint, persistent pink color appeared, indicating the endpoint. The results were expressed as mg of ascorbic acid per 100 g of fresh weight (mg 100 g−1 FW). Titratable acidity was determined by acid–base titration. Ten grams of previously homogenized fresh pulp was weighed and diluted in 50 mL of distilled water. The mixture was filtered to obtain a clear extract, from which 10 mL was taken and titrated with 0.1 N NaOH, using phenolphthalein as an indicator. The results were expressed as a percentage of citric acid (% citric acid).
The total anthocyanin content was determined using 100 mg of dried plant tissue, to which 2 mL of an ethanol/water/concentrated HCl extraction solution (70:29:1, v/v/v) was added. The mixture was homogenized using a vortex mixer and then centrifuged at 12,000 rpm for 10 min. The supernatant was analyzed at 525 nm using a spectrophotometer (JENWAY 6320D, Staffordshire, UK), and the concentration was expressed in malvidin-3-glucoside equivalents. The fruits used for the evaluation of quality and bioactive compounds were harvested at commercial maturity, defined by uniform red coloration (≥90%), approximately 30–35 days after flowering, to ensure sample homogeneity.

2.9. Experimental Design and Statistical Analysis

A completely randomized block design with a 4 × 2 factorial arrangement was used, resulting in a total of 8 treatments. Four replicates per treatment and 4 plants per replicate were considered, for a total of 16 plants for each of the variables evaluated in the experiment. The factors were four CHTMD concentrations (0, 250, 500, and 1000 mg L−1) and two salinity levels (0 and 45 mM NaCl). Statistical analysis was performed using ANOVA. Prior to ANOVA, data normality was evaluated using the Shapiro–Wilk test through the UNIVARIATE procedure in SAS (Version 9.4). Based on the balanced experimental design and equal replication among treatments, the data were subsequently analyzed using factorial ANOVA followed by Tukey’s multiple-range test (p ≤ 0.05), using SAS software version 9.4 (SAS Institute, Cary, NC, USA).

3. Results and Discussion

3.1. Characterization of the CHTMD System

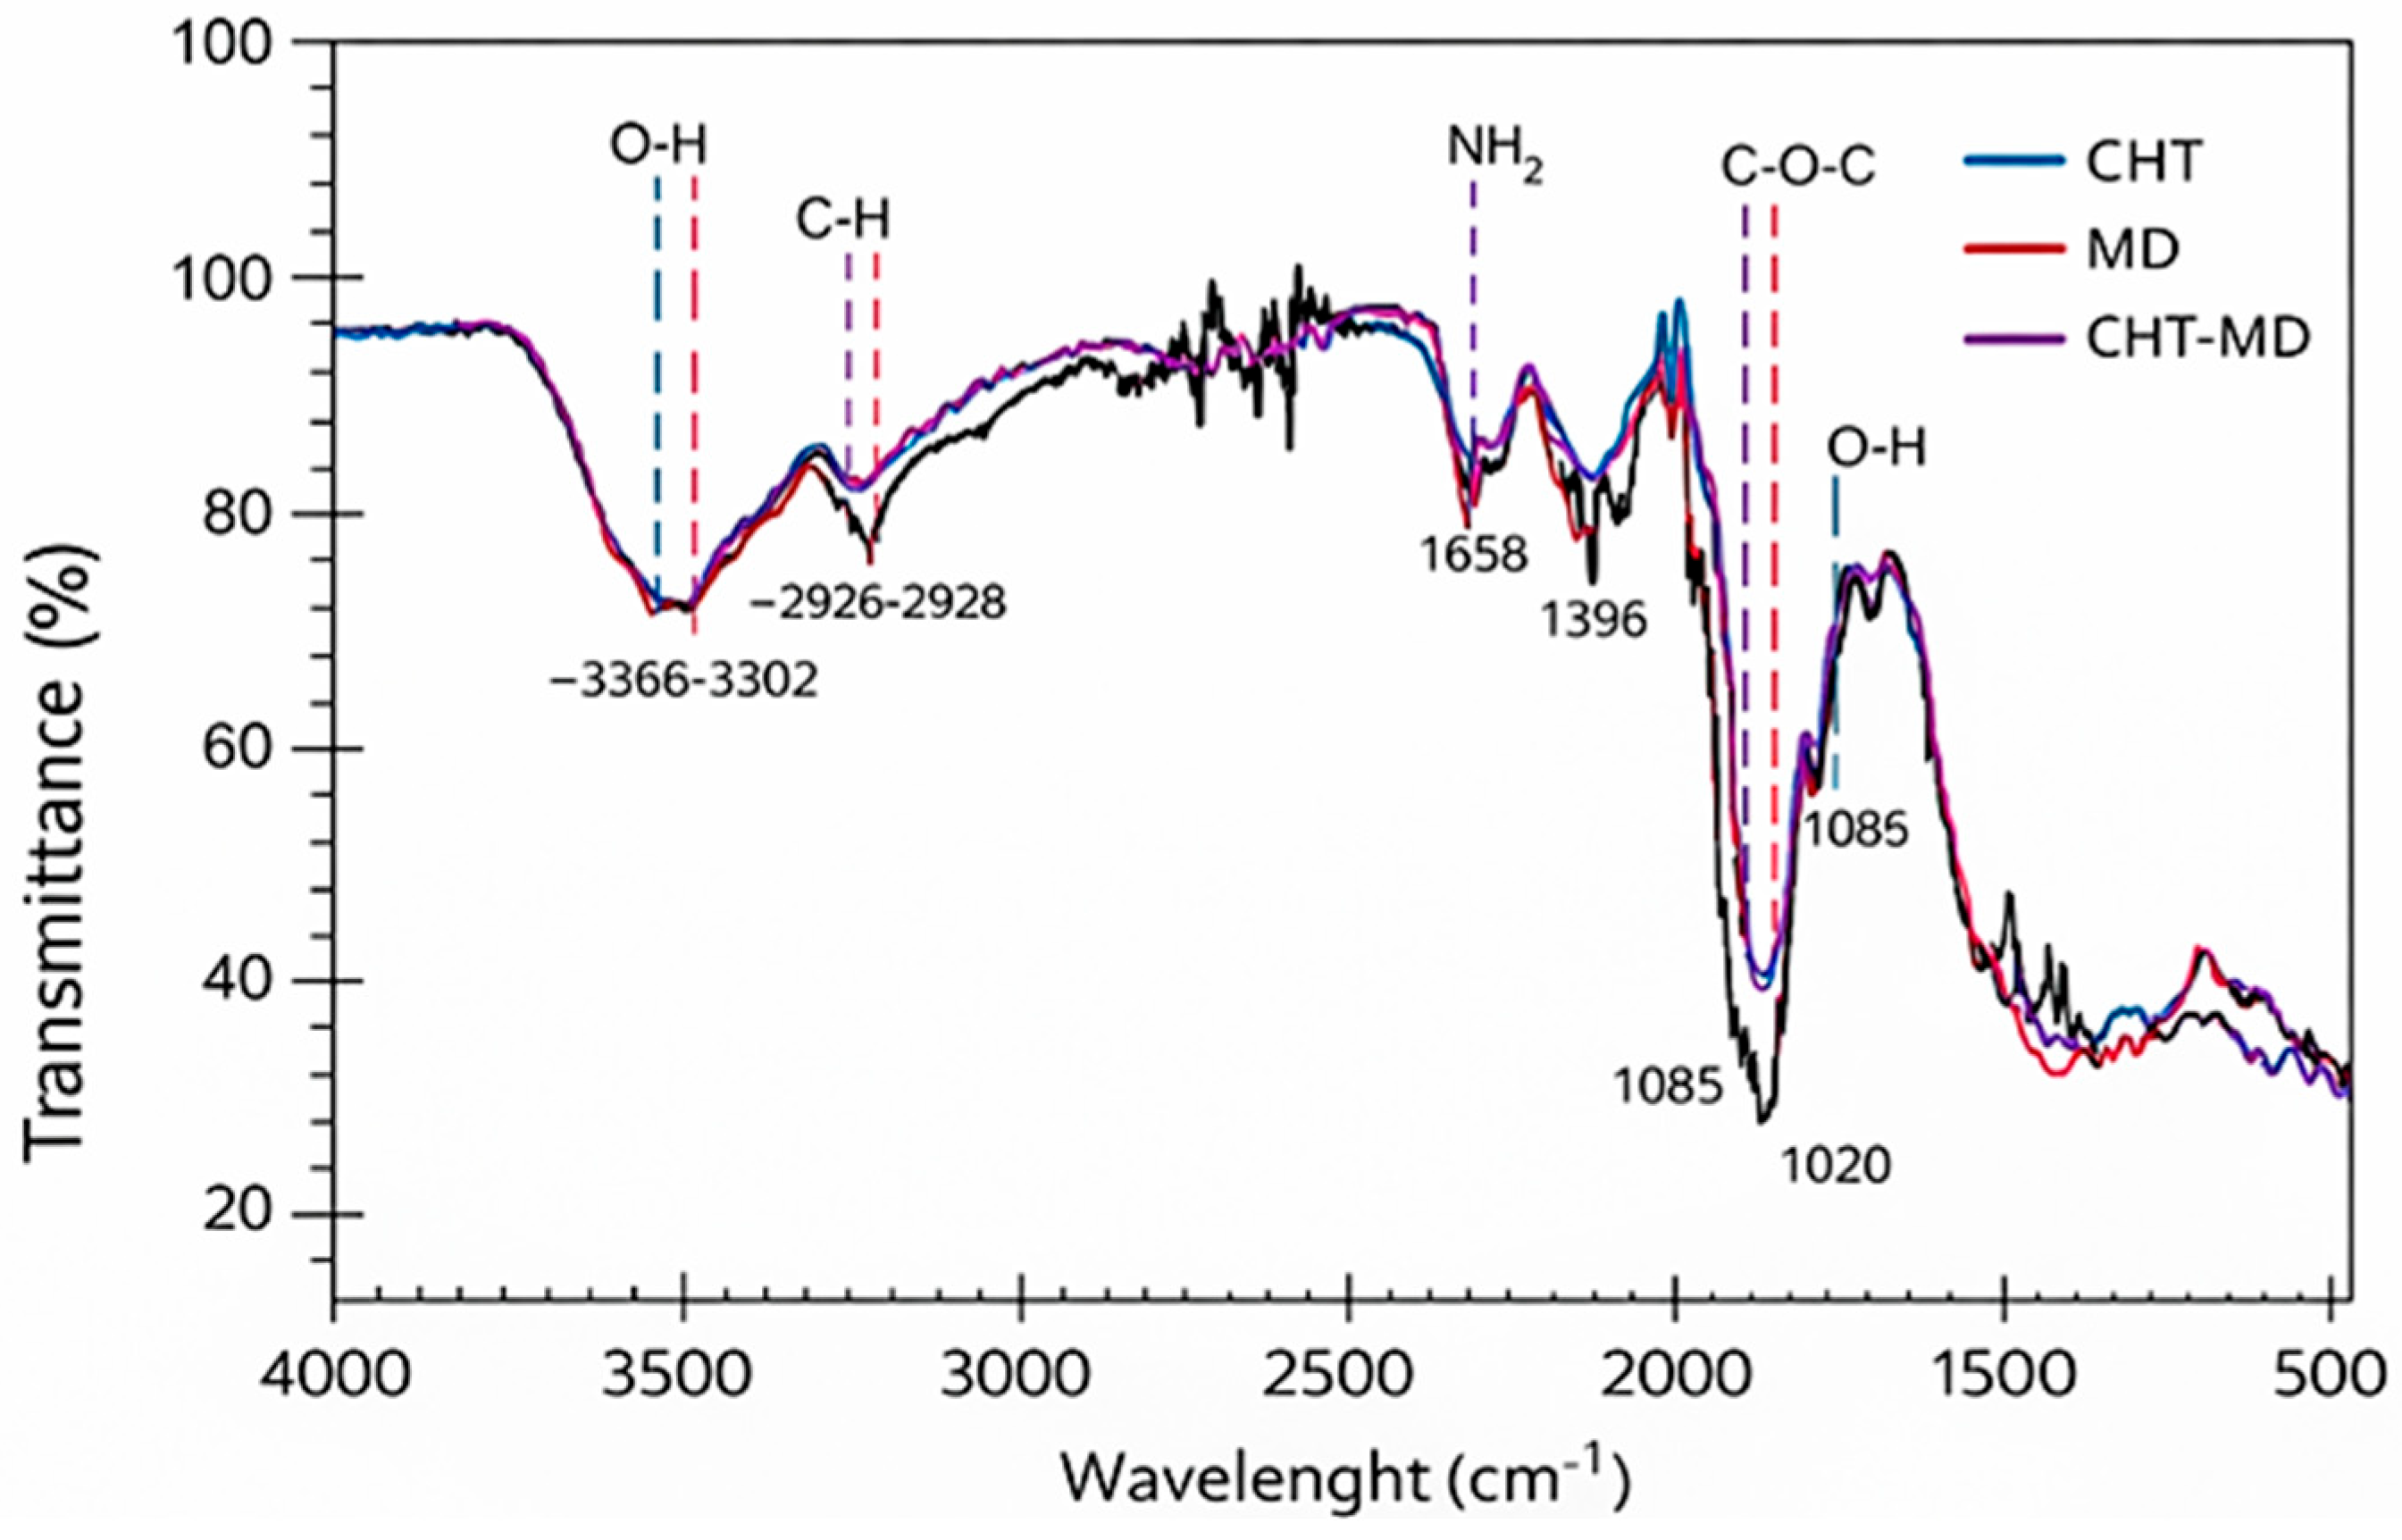
FTIR analysis confirmed the presence of functional groups characteristic of the polysaccharides chitosan (CHT) and maltodextrin (MD). Bands associated with the stretching of hydroxyl groups (–OH) in the 3366–3302 cm−1 region, C–H vibrations at 2926–2928 cm−1, and signals associated with glycosidic bonds (C–O–C) and alcohol groups (C–O) between 1396 and 1020 cm−1 were detected (Figure 1). The band around 1658 cm−1 confirmed the presence of amino groups (–NH2) characteristic of chitosan, derived from the deacetylation process of chitin.
In the CHT–MD formulation, changes in band intensity and broadening were observed, particularly in the regions associated with –OH and C–O groups, suggesting the formation of intermolecular interactions, primarily hydrogen bonds. The absence of new bands indicates that the interaction between the two polysaccharides is physical in nature and non-covalent. This behavior is consistent with reports from similar polymeric systems, where compatibility between biopolymers is reflected in spectral shifts without the formation of new chemical bonds [25,26].
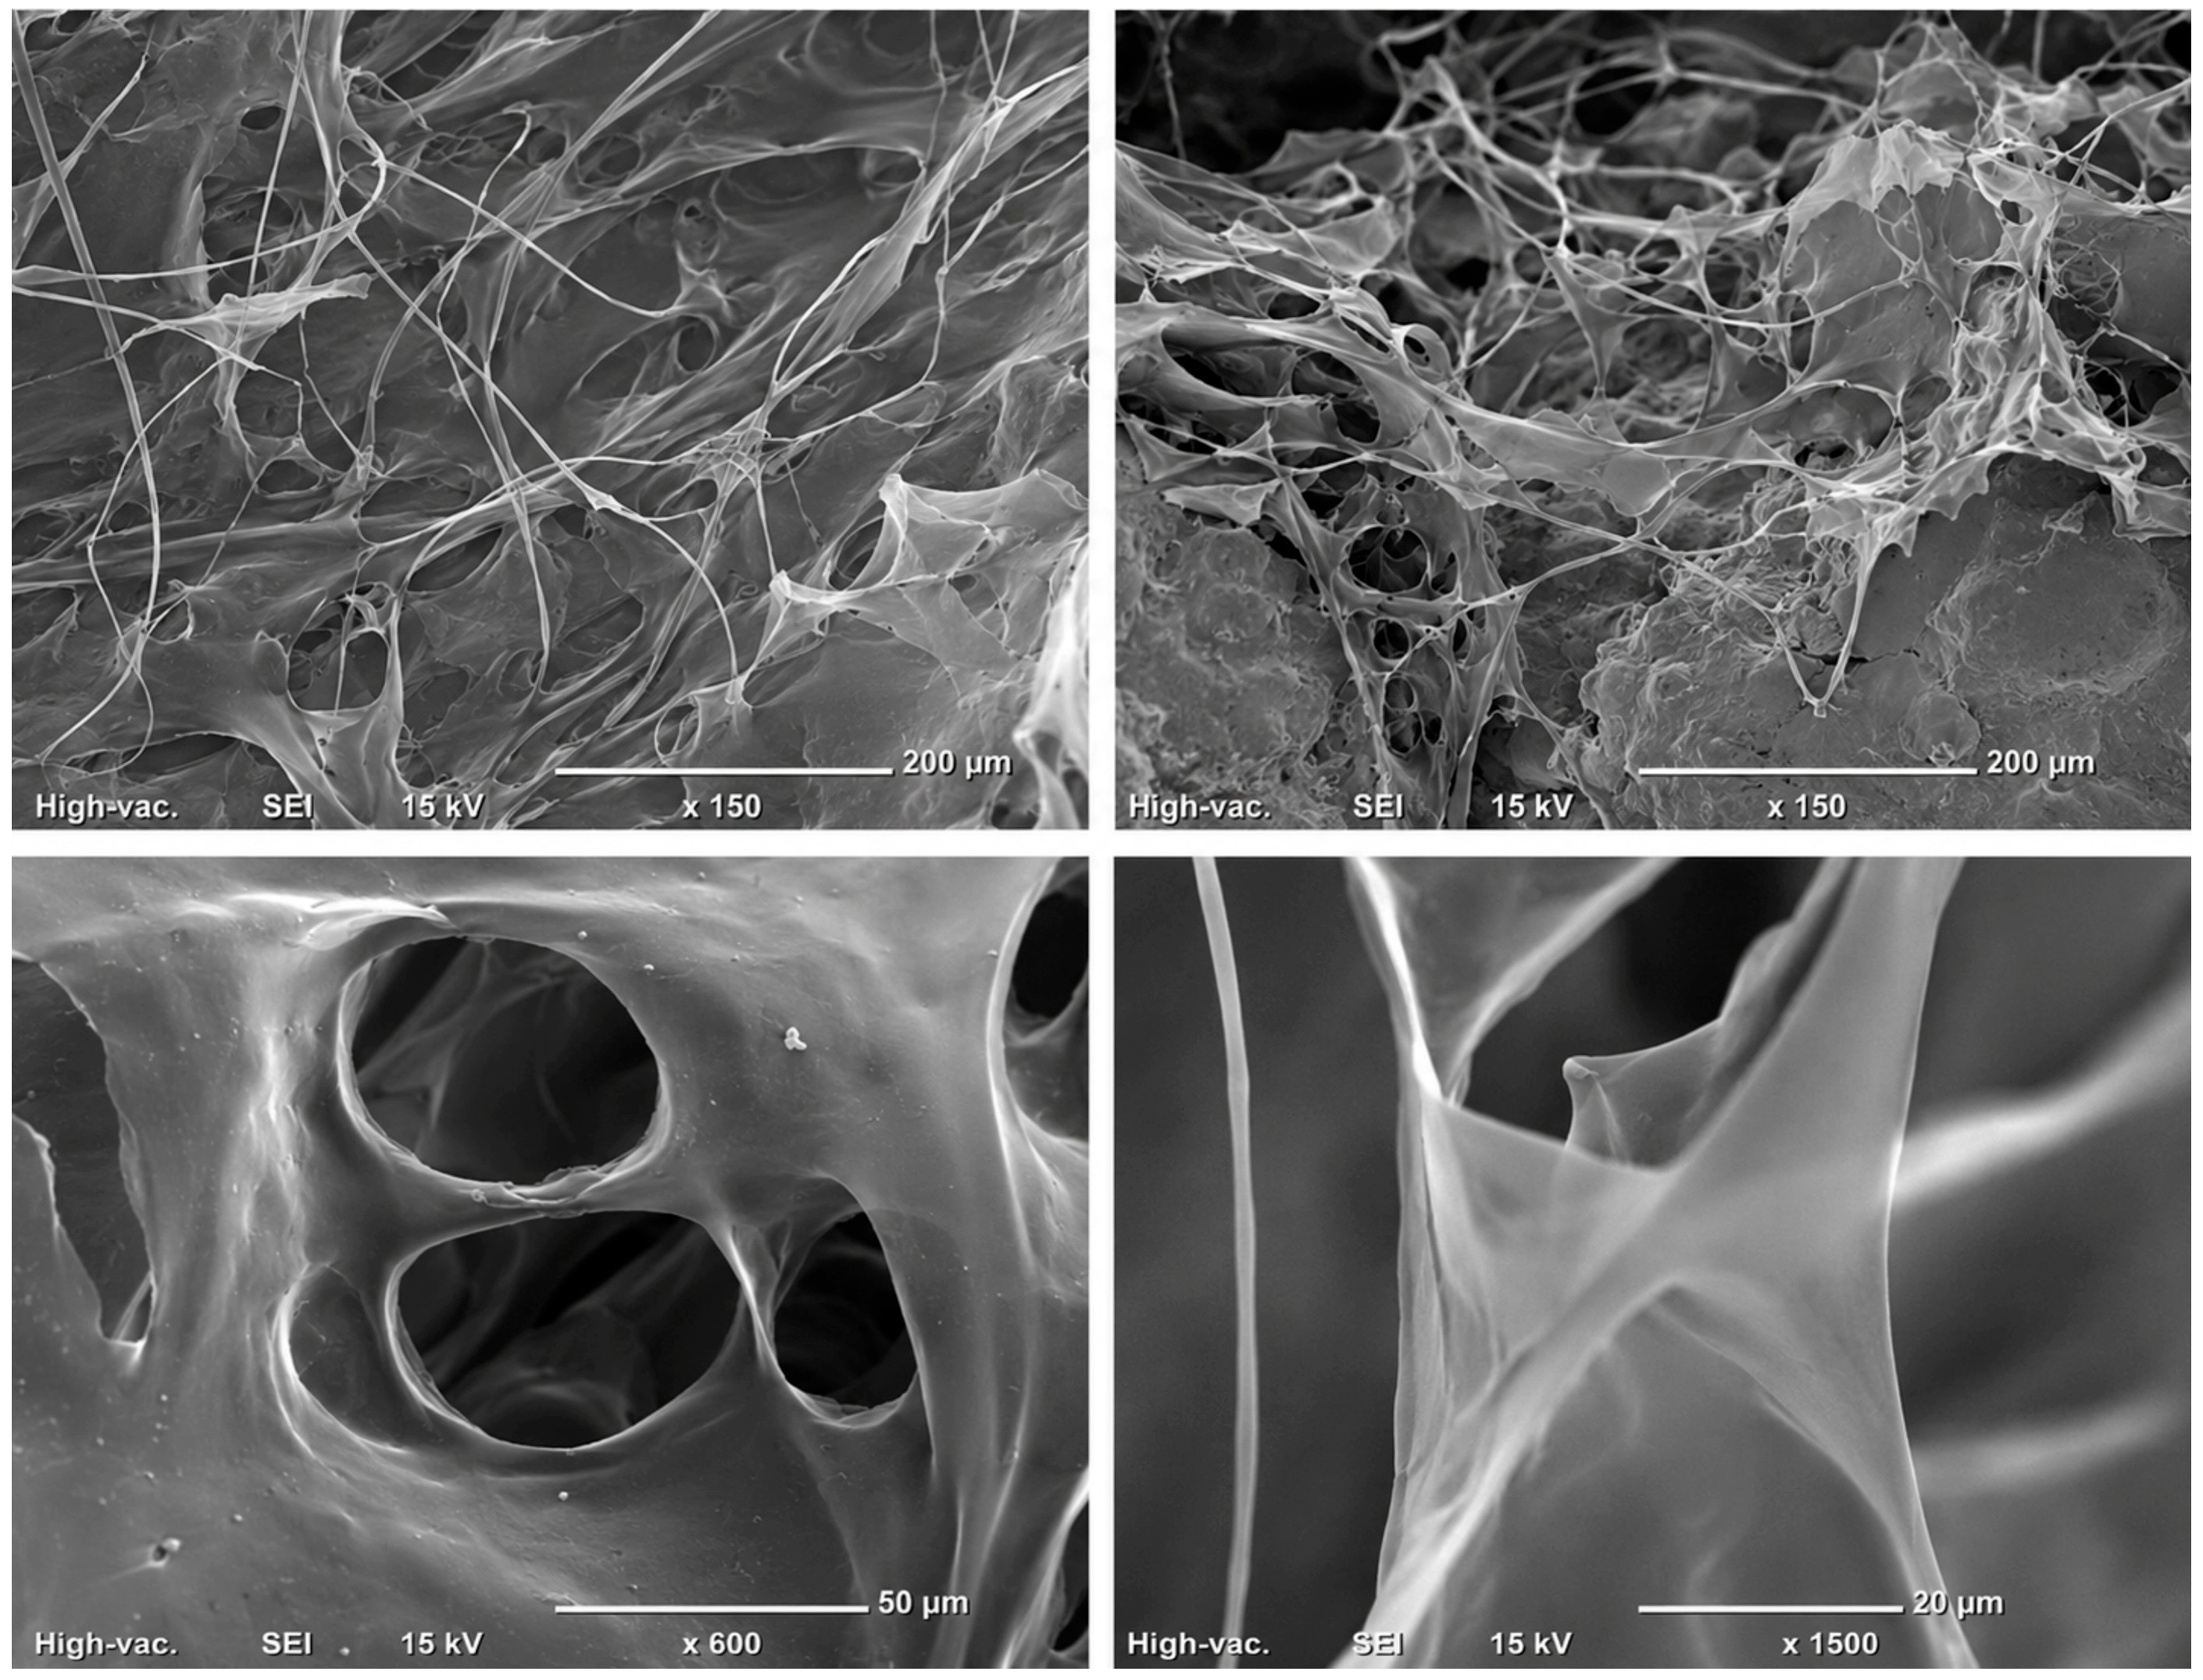
The SEM micrographs of the CHTMD formulation revealed the formation of a continuous and heterogeneous polymeric matrix with an irregular surface morphology (Figure 2). The structure exhibited sheet-like regions interconnected by thin filamentous strands, forming an entangled network throughout the material. No discrete particles or crystalline structures were observed, suggesting a homogeneous physical dispersion of both polysaccharides within the matrix. In addition, the surface showed a rough texture with overlapping layers and localized folds, characteristics commonly associated with dried polysaccharide-based films. These observations indicate that the chitosan and maltodextrin components formed an interconnected polymeric network after the preparation process.

3.2. Effect of the CHTMD System on Plant Growth and Development

The application of the CHTMD system significantly affected all growth-related variables evaluated (Table 1), although the magnitude of the response varied according to the concentration applied and the salinity condition.
Plant height. Plant height was significantly influenced by CHTMD concentration (p < 0.001), with the highest value recorded at 250 mg L−1 (38.76 cm), representing an increase of 10.1% compared with the control (35.21 cm). No additional increases were observed at higher concentrations, suggesting that low doses were sufficient to stimulate shoot elongation. Salinity had no significant effect on plant height (p = 0.0716), and no significant interaction between factors was detected.
Number of leaves. Leaf production increased significantly in response to CHTMD application (p < 0.001). The highest value was observed at 1000 mg L−1 (36.69 leaves plant−1), whereas the control produced only 13.12 69 leaves plant−1. Salinity significantly reduced leaf number (24.1 vs. 28.4 69 leaves plant−1), indicating a negative effect on vegetative development. However, the significant interaction between salinity and CHTMD (p < 0.001) demonstrated that the biostimulant partially mitigated this reduction under stress conditions. Saline stress negatively affected growth, particularly the number of leaves and root length, which is consistent with osmotic and ionic effects that limit water uptake and cell expansion [27,28].
Fresh and dry biomass. Total fresh weight was strongly influenced by CHTMD concentration (p < 0.001), with the highest value observed at 250 mg L−1 (414.46 g plant−1), corresponding to a 30.2% increase compared with the control. Dry weight also increased significantly, reaching its maximum value at 1000 mg L−1 (94.71 g plant−1). This result indicates that lower concentrations favored biomass accumulation in fresh tissues, whereas higher concentrations promoted greater dry matter production. Significant CHTMD x salinity interactions for both variables suggest that the response depended on environmental conditions.
Root length. Root development responded positively to CHTMD application (p < 0.001). The greatest root length was observed at 1000 mg L−1 (30.43 cm), representing a 75.8% increase relative to the control (17.31 cm). In contrast, salinity significantly reduced root growth (23.4 cm) compared whit non-saline conditions (27.7 cm). Nevertheless, CHTMD-treated plants maintained longer roots under stress, indicating that the formulation promoted root development and potentially improved water and nutrient acquisition.
Overall, the results demonstrate that CHTMD enhances plant growth through distinct effects on shoot and root development. Lower concentrations were more effective in stimulating shoot growth and fresh biomass accumulation, whereas higher concentrations promoted root growth and dry matter production. These responses suggest differential biomass allocation patterns and support the role of CHTMD as a biostimulant capable of mitigating the adverse effects of salinity on strawberry development.
Under saline stress, the application of CHTMD promoted substantial increases in key variables. Notable among these were the increase in total fresh weight in plants treated with 250 mg L−1 under saline conditions, as well as the improvement in dry weight with 500 mg L−1. Furthermore, root development showed significant increases in the absence of salinity, confirming the system’s baseline biostimulant effect. These results suggest that CHTMD acts not only as a stress mitigator but also as a growth promoter under non-limiting conditions, which is consistent with the behavior reported for polysaccharide-based biostimulants [29].
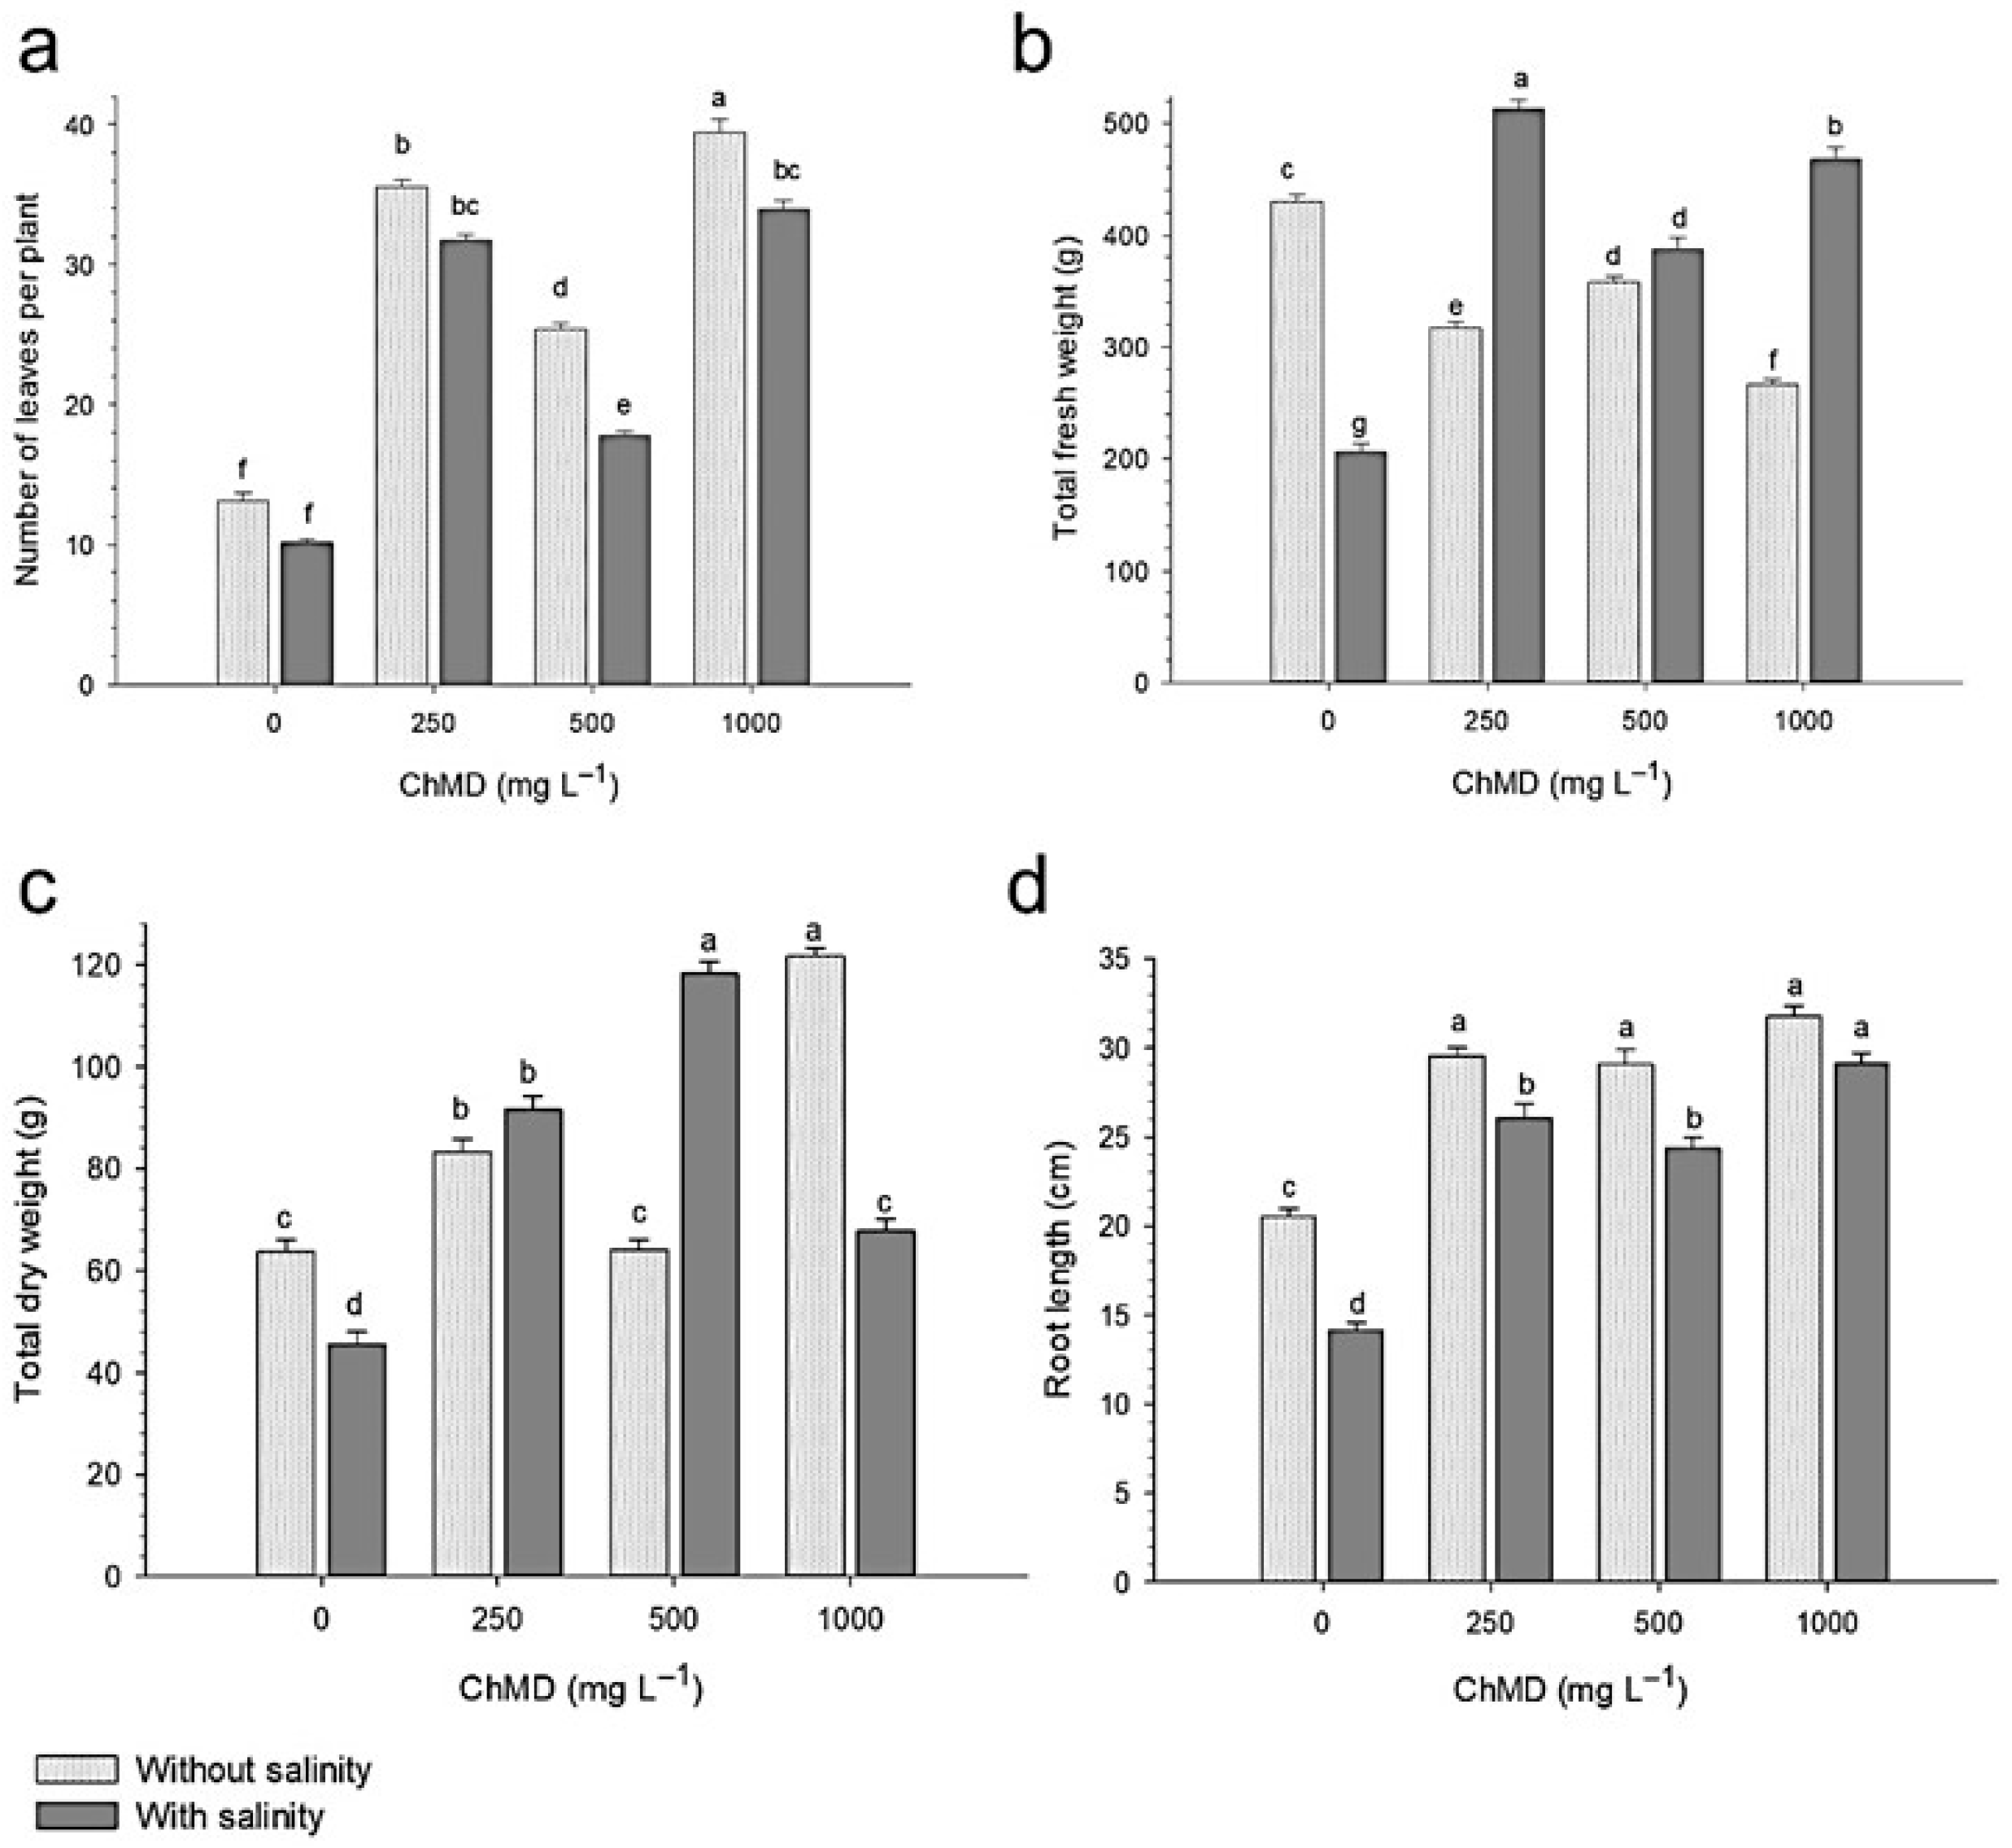
Under saline conditions, the number of leaves decreased in all treatments (Figure 3); however, in the absence of salinity, the application of 1000 mg L−1 of CHTMD yielded the highest value compared to the control, representing an approximate threefold increase (Figure 3a). In contrast, under saline conditions, the application of 250 mg L−1 of CHTMD promoted a 148.5% increase in total fresh weight compared to the corresponding control (Figure 3b). Total dry weight showed its highest value with the application of 500 mg L−1 of CHTMD under salinity; however, this behavior was similar to that observed with 1000 mg L−1 under non-saline conditions (Figure 3c).
Root length was one of the clearest indicators of the biostimulant effect of the CHTMD system, as, in the absence of salinity, significant increases of 58.5%, 45.5%, and 47.5% were observed at concentrations of 250 mg L−1, 500 mg L−1, and 1000 mg L−1, respectively, compared to the control (Figure 3d). The results are consistent with previous studies. In strawberry, the application of 60 mmol L−1 NaCl reduced growth and biomass accumulation; however, the application of chitosan at low concentrations (1–2 mg L−1) significantly increased leaf dry weight (14.08%) and total biomass by up to 45.45% [30]. In maize (Zea mays L.), it was reported that the application of chitosan at 140 mg L−1 improved yield and growth parameters [31]. In rice (Oryza sativa), the application of chitosan nanoparticles (300 ppm) reduced the use of synthetic fertilizers by up to 30% without affecting yield [32]. In sorghum (Sorghum bicolor L. Moench), the application of CHT increased biomass, plant height, and fresh and dry weight [33].
Under saline conditions, the mitigating effect of CHTMD was particularly evident, as treated plants showed significant recovery in all evaluated variables compared to the saline control, suggesting the activation of physiological stress tolerance mechanisms [34]. This effect may be associated with physiological mechanisms previously reported for chitosan under saline conditions, including the maintenance of ionic homeostasis through reduced Na+ accumulation and enhanced K+ retention [12]. Recent studies have demonstrated that chitosan can improve the K+/Na+ ratio and partially restore ionic homeostasis under salinity stress; for example, in Lallemantia iberica plants, chitosan was reported to increase the K+/Na+ ratio under salinity stress, indicating a partial restoration of ionic balance [35]. Similarly, reduced Na+ accumulation and enhanced K+ retention were observed in Phaseolus vulgaris plants treated with chitosan under saline conditions [36]. Likewise, chitosan application was reported to improve nutrient homeostasis and mineral balance in Moringa oleifera plants exposed to salinity stress [37].
The inclusion of MD in the formulation likely played a key role in the observed effects by improving the physicochemical properties of the system, such as solubility, stability, and availability of chitosan [38,39]. Previous studies support this finding. In cucumber (Cucumis sativus L.), the application of maltodextrin at a concentration of 1000 mg L−1 increased dry weight by 26.74% [40]. Similarly, commercial products based on dextrose and MD have been shown to improve plant growth at doses of 0.4 g L−1 [41]. In tomatoes (Solanum lycopersicum Mill.), the application of formulations containing maltodextrin, humic acids, and sucrose increased total fresh weight by up to 21%, in addition to improving fruit quality [42].

3.2.1. Effect of the CHTMD System on Crop Quality and Yield

The CHTMD concentration had a significant effect on all variables related to fruit quality and yield (Table 2). In general, the 250 mg L−1 concentration resulted in the highest values for equatorial diameter, polar diameter, fruit weight, number of fruits, and total yield, suggesting greater physiological efficiency at low concentrations of the biostimulant. This result is consistent with the widely reported dose-dependent response for biostimulants, where optimal concentrations induce improvements in photoassimilate partitioning and metabolic efficiency [3,4,8].
On the other hand, the 1000 mg L−1 concentration also improved most of the evaluated variables, although it did not improve stem diameter (Table 2), which could indicate a physiological saturation effect or a differential redistribution of resources toward other yield components [43]. In contrast, the intermediate dose of 500 mg L−1 yielded moderate values, confirming a nonlinear response of the crop to the application of the CHTMD system, a phenomenon common in the use of naturally derived compounds [44].
Under saline conditions, a significant increase was observed in equatorial diameter, number of fruits, and yield, while polar diameter decreased, without significantly affecting fruit weight (Table 2). This pattern suggests a morphological adjustment of the fruit under saline stress, in which the plant prioritizes fruit production and transverse development as an adaptive strategy to maintain yield [45]. Likewise, the maintenance of fruit weight indicates a physiological compensation that allows commercial quality to be sustained despite adverse conditions.
The significant interaction between CHTMD concentration and salinity for most of the variables evaluated indicates that the crop’s response to the biostimulant is closely dependent on the level of environmental stress. This result supports the hypothesis that biostimulants do not act in isolation but rather modulate the plant’s physiological response based on its metabolic state and environmental conditions [43,46]. The absence of a significant interaction in polar diameter suggests that this parameter exhibits lower physiological plasticity in response to the combination of evaluated factors (Table 2).
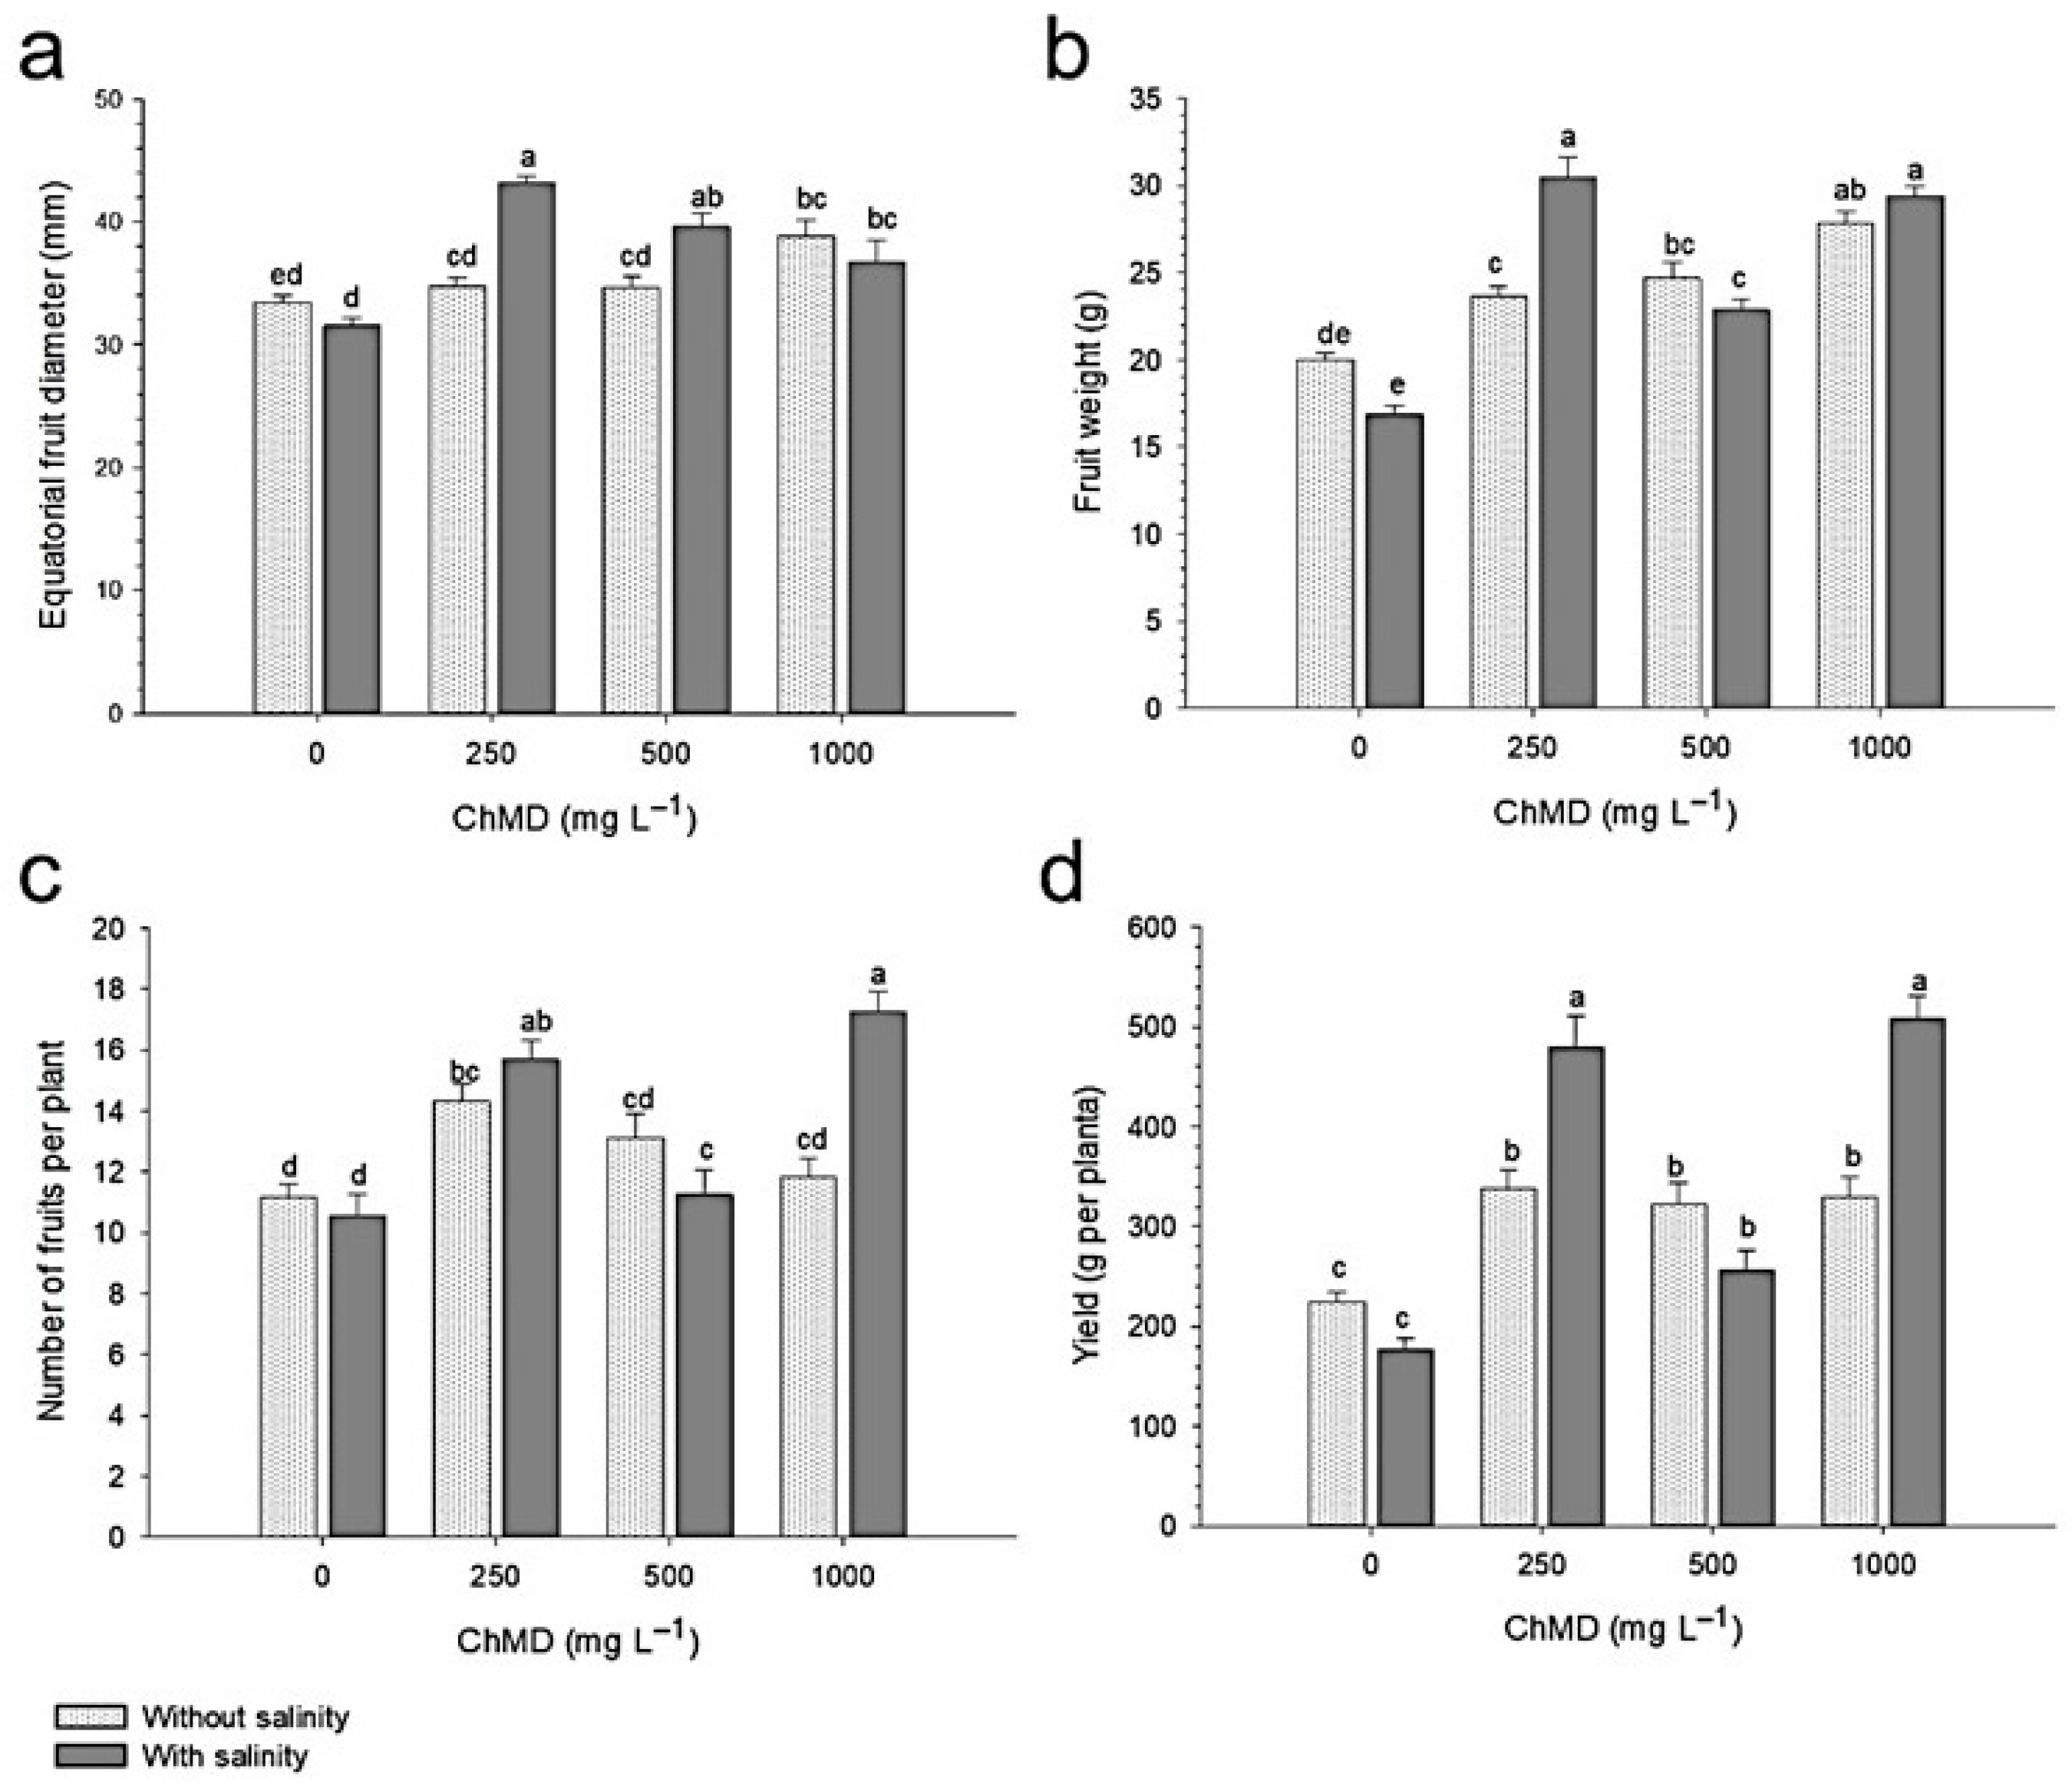
The application of CHTMD significantly increased yield components in strawberry plants, including fruit diameter and weight, number of fruits, and total yield, both under optimal conditions and under salt stress (Figure 4). In particular, the 250 mg L−1 dose promoted equatorial diameter and fruit weight under saline conditions (Figure 4a), while 1000 mg L−1 showed comparable effects in the absence of stress (Figure 4b), demonstrating a biostimulant effect independent of salinity. Fruit number increased by up to 63.8% with 1000 mg L−1 under salinity (Figure 4c). Total yield increased by 87.3% and 71.4% with the application of 250 mg L−1 and 1000 mg L−1 of CHTMD, respectively (Figure 4d). These results suggest a dose-dependent response, where low concentrations optimize physiological efficiency and high concentrations maintain positive effects without proportional increases.
The findings are consistent with previous studies on strawberries, tomatoes (Solanum lycopersicum) [47], and melons (Cucumis melo), in which chitosan significantly improved fruit yield and quality [48,49]. This effect is associated with increased photosynthetic efficiency and improved allocation of photoassimilates to reproductive organs, processes regulated by chitosan at the metabolic and genetic levels [50,51].
Overall, the CHTMD system improves crop performance and physiological response under saline conditions, establishing itself as an effective strategy for optimizing productivity under abiotic stress.

3.2.2. Effect of the CHTMD System on Gas Exchange

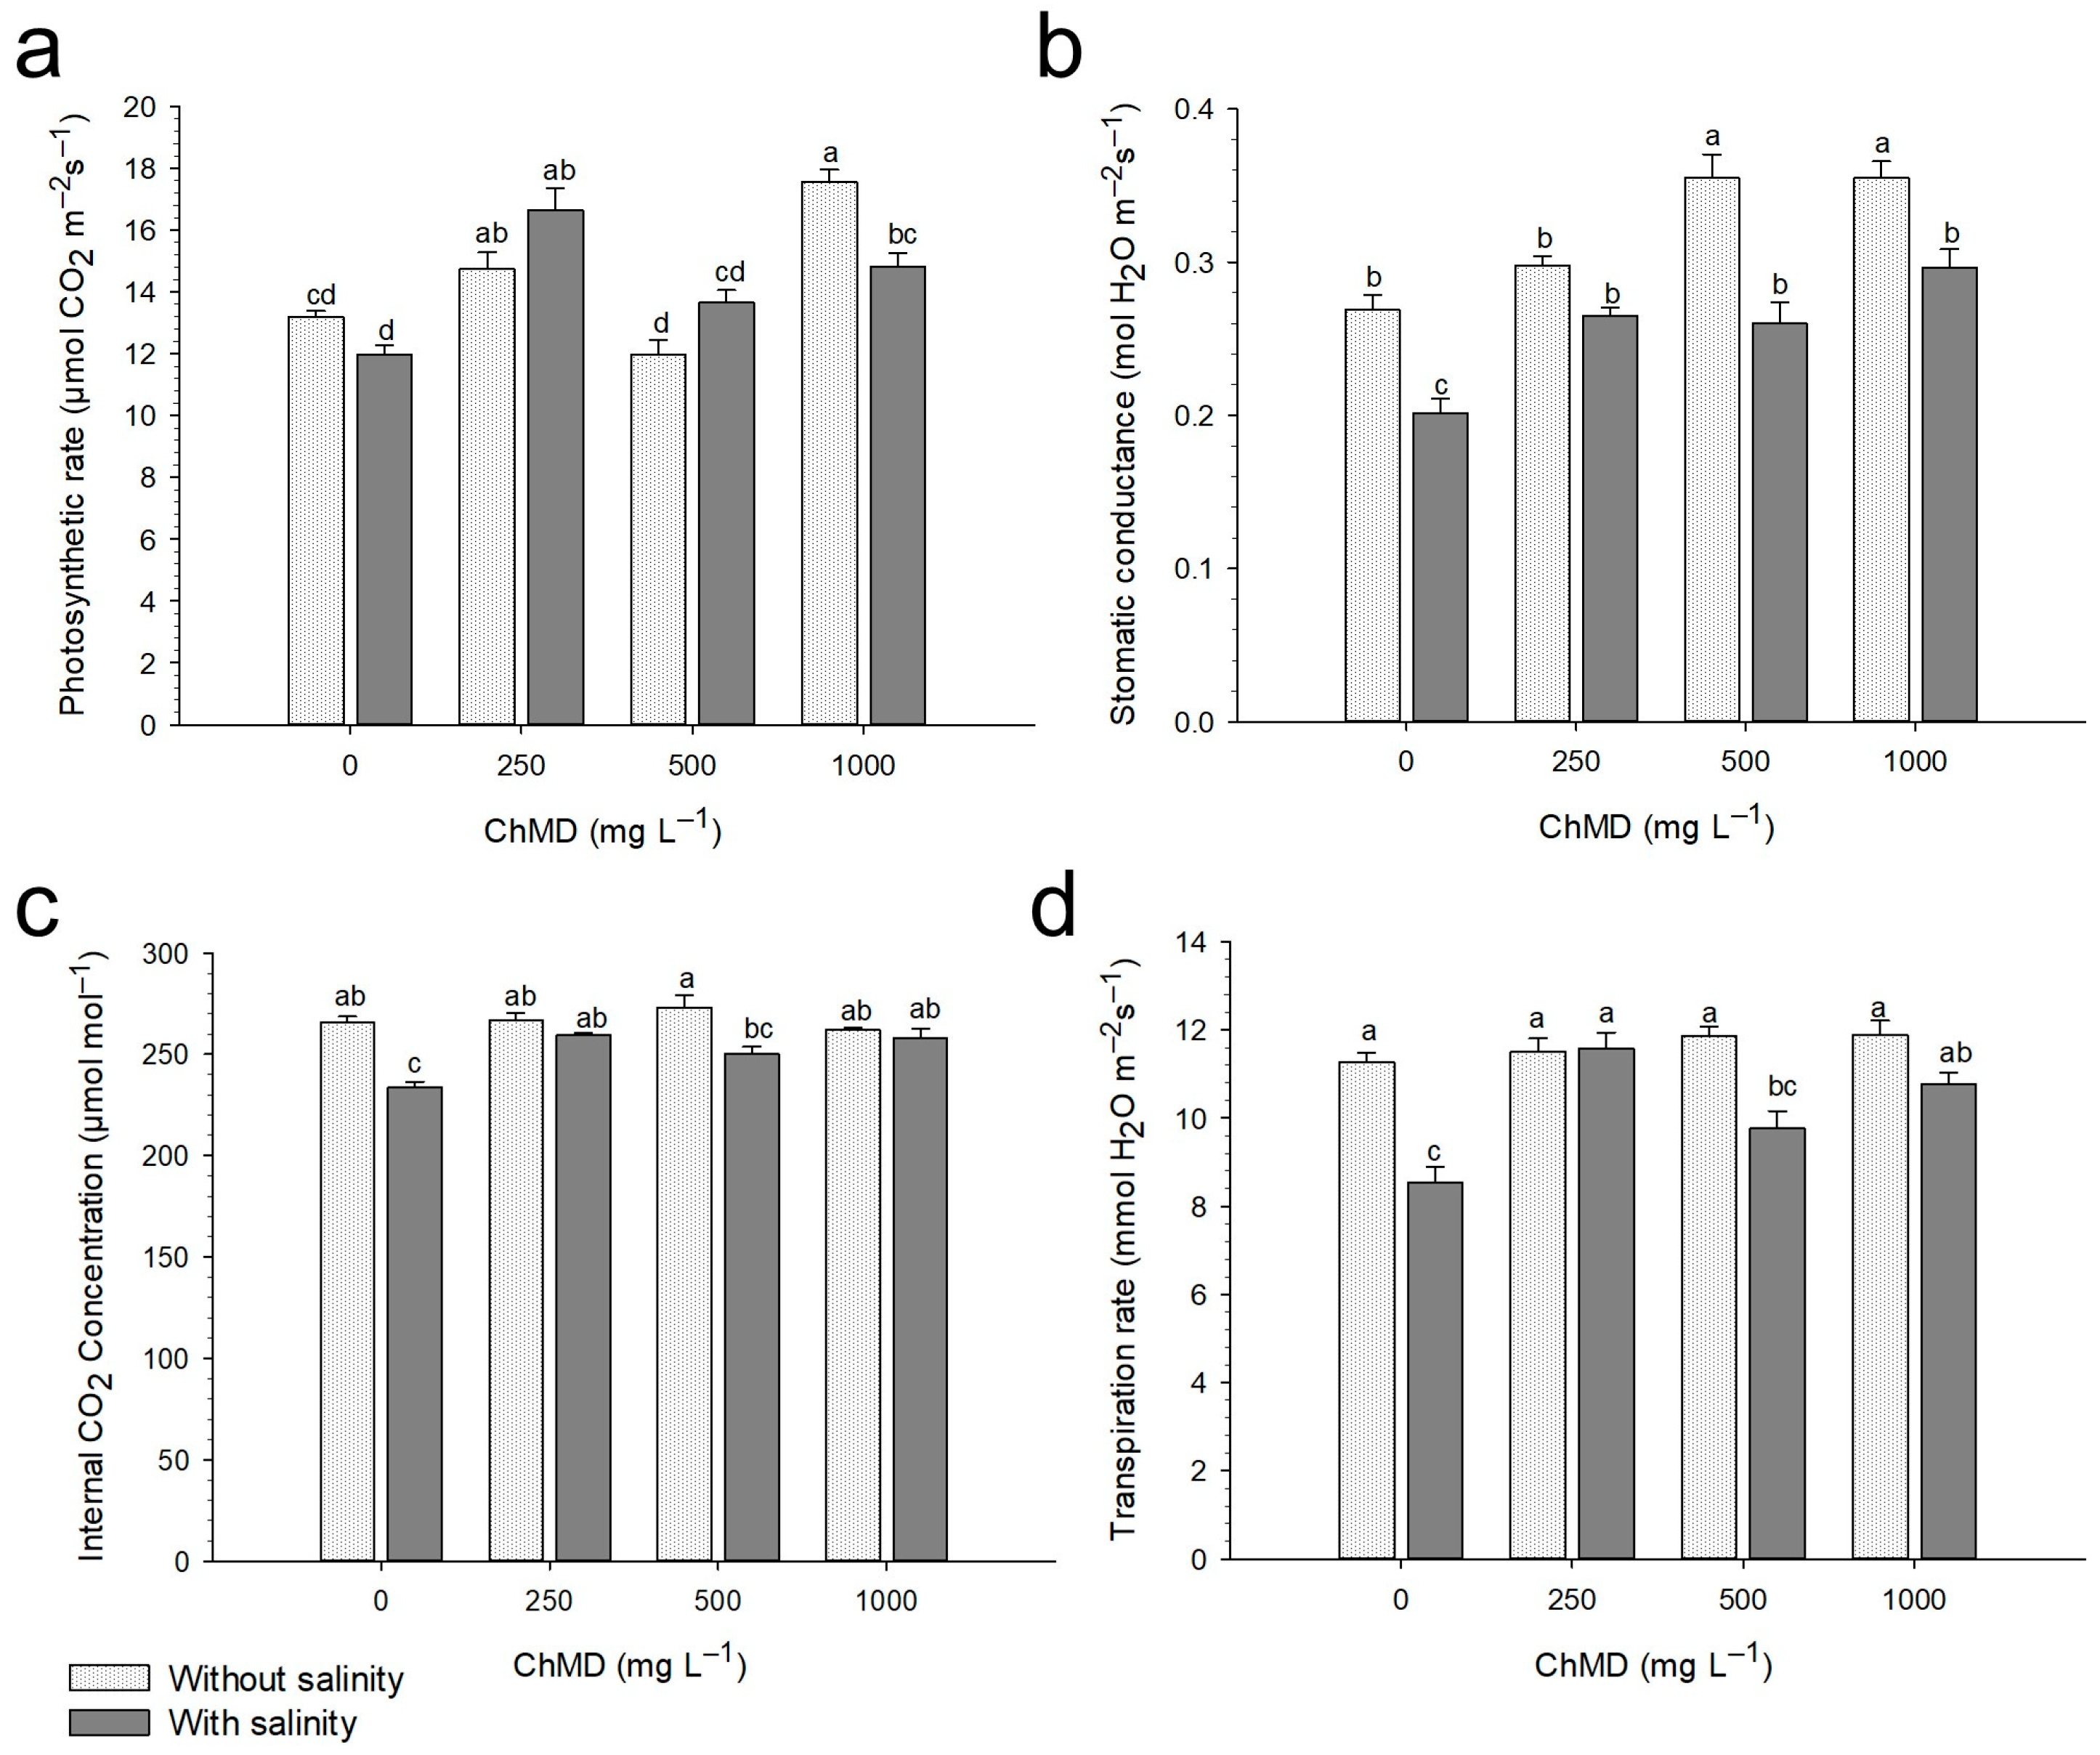
The application of the CHTMD system led to significant improvements in gas exchange parameters, particularly in the photosynthetic rate and stomatal conductance, suggesting an optimization of photosynthetic function. The photosynthetic rate showed a significant increase at 250 mg L−1, while stomatal conductance reached its maximum value at 1000 mg L−1 (Table 3). Meanwhile, the internal CO2 concentration, transpiration rate, and SPAD units showed consistent increases compared to the control at all evaluated concentrations, although no statistically significant differences were observed between treatments. This behavior is consistent with recent reports on chitosan-based biostimulants, which improved photosynthetic efficiency by activating photochemical processes and regulating cellular redox balance [52,53].
The increase in stomatal conductance observed in plants treated with 1000 mg L−1 CHTMD suggests more efficient stomatal regulation, promoting CO2 diffusion into the mesophyll and maintaining adequate levels of internal CO2 concentration. This effect indicates greater efficiency in carbon fixation and a reduction in stomatal limitations, even under stress conditions. Recent studies have shown that chitosan can modulate hormonal signals, particularly those related to abscisic acid, promoting more controlled and efficient stomatal opening [54,55]. Additionally, the increase in the transpiration rate in the CHTMD treatments suggests an improvement in water uptake and transport, which is particularly relevant under saline conditions, where soil water potential is reduced. This behavior reflects better coordination between stomatal opening and the plant’s water status, which has been associated with greater water-use efficiency in plants treated with biopolymers [56,57].
In contrast, salinity did not significantly affect the photosynthetic rate, but it significantly reduced stomatal conductance, internal CO2 concentration, transpiration rate, and SPAD units, which is consistent with the presence of stomatal and metabolic limitations induced by salt stress. These limitations are characterized by reduced CO2 diffusion, alterations in photosystem II efficiency, and disruption of carbon metabolism [58,59]. Furthermore, the reduction in SPAD units suggests a possible degradation of chlorophyll or inhibition of its biosynthesis, a phenomenon widely reported under salinity stress due to increased oxidative damage [60]. The interaction between factors was significant for most variables, with the exception of stomatal conductance and SPAD, suggesting a differential response depending on the physiological parameter evaluated and highlighting the complexity of stress response mechanisms and their modulation by biostimulants.
In general, salinity had a depressive effect on physiological activity, while the application of CHTMD promoted an overall improvement in gas exchange (Figure 5). Under non-saline conditions, the photosynthetic rate reached its maximum value at 1000 mg L−1 (17.68 µmol CO2 m−2 s−1). Under saline stress, the photosynthetic rate decreased in the control but increased significantly with the application of CHTMD, with 250 mg L−1 standing out as one of the most efficient treatments (Figure 5a). Stomatal conductance showed a similar trend, with higher values at 500 and 1000 mg L−1 in the absence of salinity (Figure 5b). With regard to internal CO2 concentration, no differences were detected under non-saline conditions; however, under saline conditions, all CHTMD treatments outperformed the control (Figure 5c), a pattern consistent with that observed for the transpiration rate (Figure 5d).
The reduction in the photosynthetic rate under saline conditions is consistent with recent studies, which have documented that salt stress induces stomatal closure, limits CO2 diffusion, and, consequently, decreases photosynthetic activity [45]. Furthermore, this type of stress generates photochemical and biochemical alterations that affect the efficiency of the photosynthetic apparatus. In this context, the observed increase in photosynthetic rate in the CHTMD treatments suggests an improvement in photosynthetic efficiency and a possible mitigation of the adverse effects of salinity stress.
This effect has been widely reported for chitosan (CHT), which acts as a biostimulant by promoting the activity of key enzymes in the Calvin cycle, such as RuBisCO, and by protecting chloroplasts from oxidative damage [61]. Furthermore, various studies have demonstrated positive responses in different crops. For example, in okra (Hibiscus esculentus L.), the application of chitosan increased parameters such as plant height, number of leaves, dry biomass, photosynthetic rate, and yield by up to 27.9% [62]. In soybeans (Glycine max L.), an 18% increase in the photosynthetic rate was reported compared to the control [63]. In lettuce (Lactuca sativa L.), the application of chitosan at concentrations of 0.15%, 0.20%, and 0.30% progressively increased both photosynthesis and stomatal conductance, demonstrating a dose-dependent response [64]. These findings support the hypothesis that the effects observed in the present study are associated with a positive modulation of photosynthetic metabolism induced by chitosan.
With regard to maltodextrin (MD), the results obtained are consistent with previous studies describing its role as a biostimulant, either alone or in combination with other compounds. This polysaccharide has been shown to promote plant growth, yield, and fruit quality. In tomato, for example, the application of MD at 1500 mg L−1 increased the photosynthetic rate, transpiration, stomatal conductance, and leaf temperature, in addition to improving the nutritional content of the fruits [65]. These effects could be related to an improvement in the plant’s water and nutritional status.
The increase in stomatal conductance observed in the CHTMD treatments indicates more efficient stomatal regulation, which promotes the flow of CO2 into the leaf. This behavior is reflected in the slightly higher values of internal CO2 concentration compared to the control, suggesting greater efficiency in carbon fixation. Under saline conditions, the reduction in stomatal conductance constitutes an adaptive mechanism to reduce water loss; however, this response limits photosynthesis. In this regard, the application of CHTMD appears to mitigate this effect, allowing for a balance between CO2 uptake and water conservation, as has been reported in horticultural crops treated with chitosan-based biostimulants [53,66].
Furthermore, the increase in transpiration rates in the CHTMD treatments suggests an improvement in water uptake and transport within the plant. This effect is particularly relevant under saline conditions, where water availability is compromised by the low osmotic potential of the soil. In this context, MD could play a key role, as polysaccharides have been shown to improve water retention in the rhizosphere and enhance water availability for plants [67,68]. In fact, it has been reported that these polysaccharides can increase soil water-holding capacity by up to 116% and maintain moisture levels close to 30% for prolonged periods [69]. Likewise, polysaccharides such as alginate and starch can form hydrogel-like structures that improve water retention and support plant physiological activity under stress conditions [57,70,71].

3.2.3. Effect of the CHTMD System on Bioactive Compounds in Strawberries

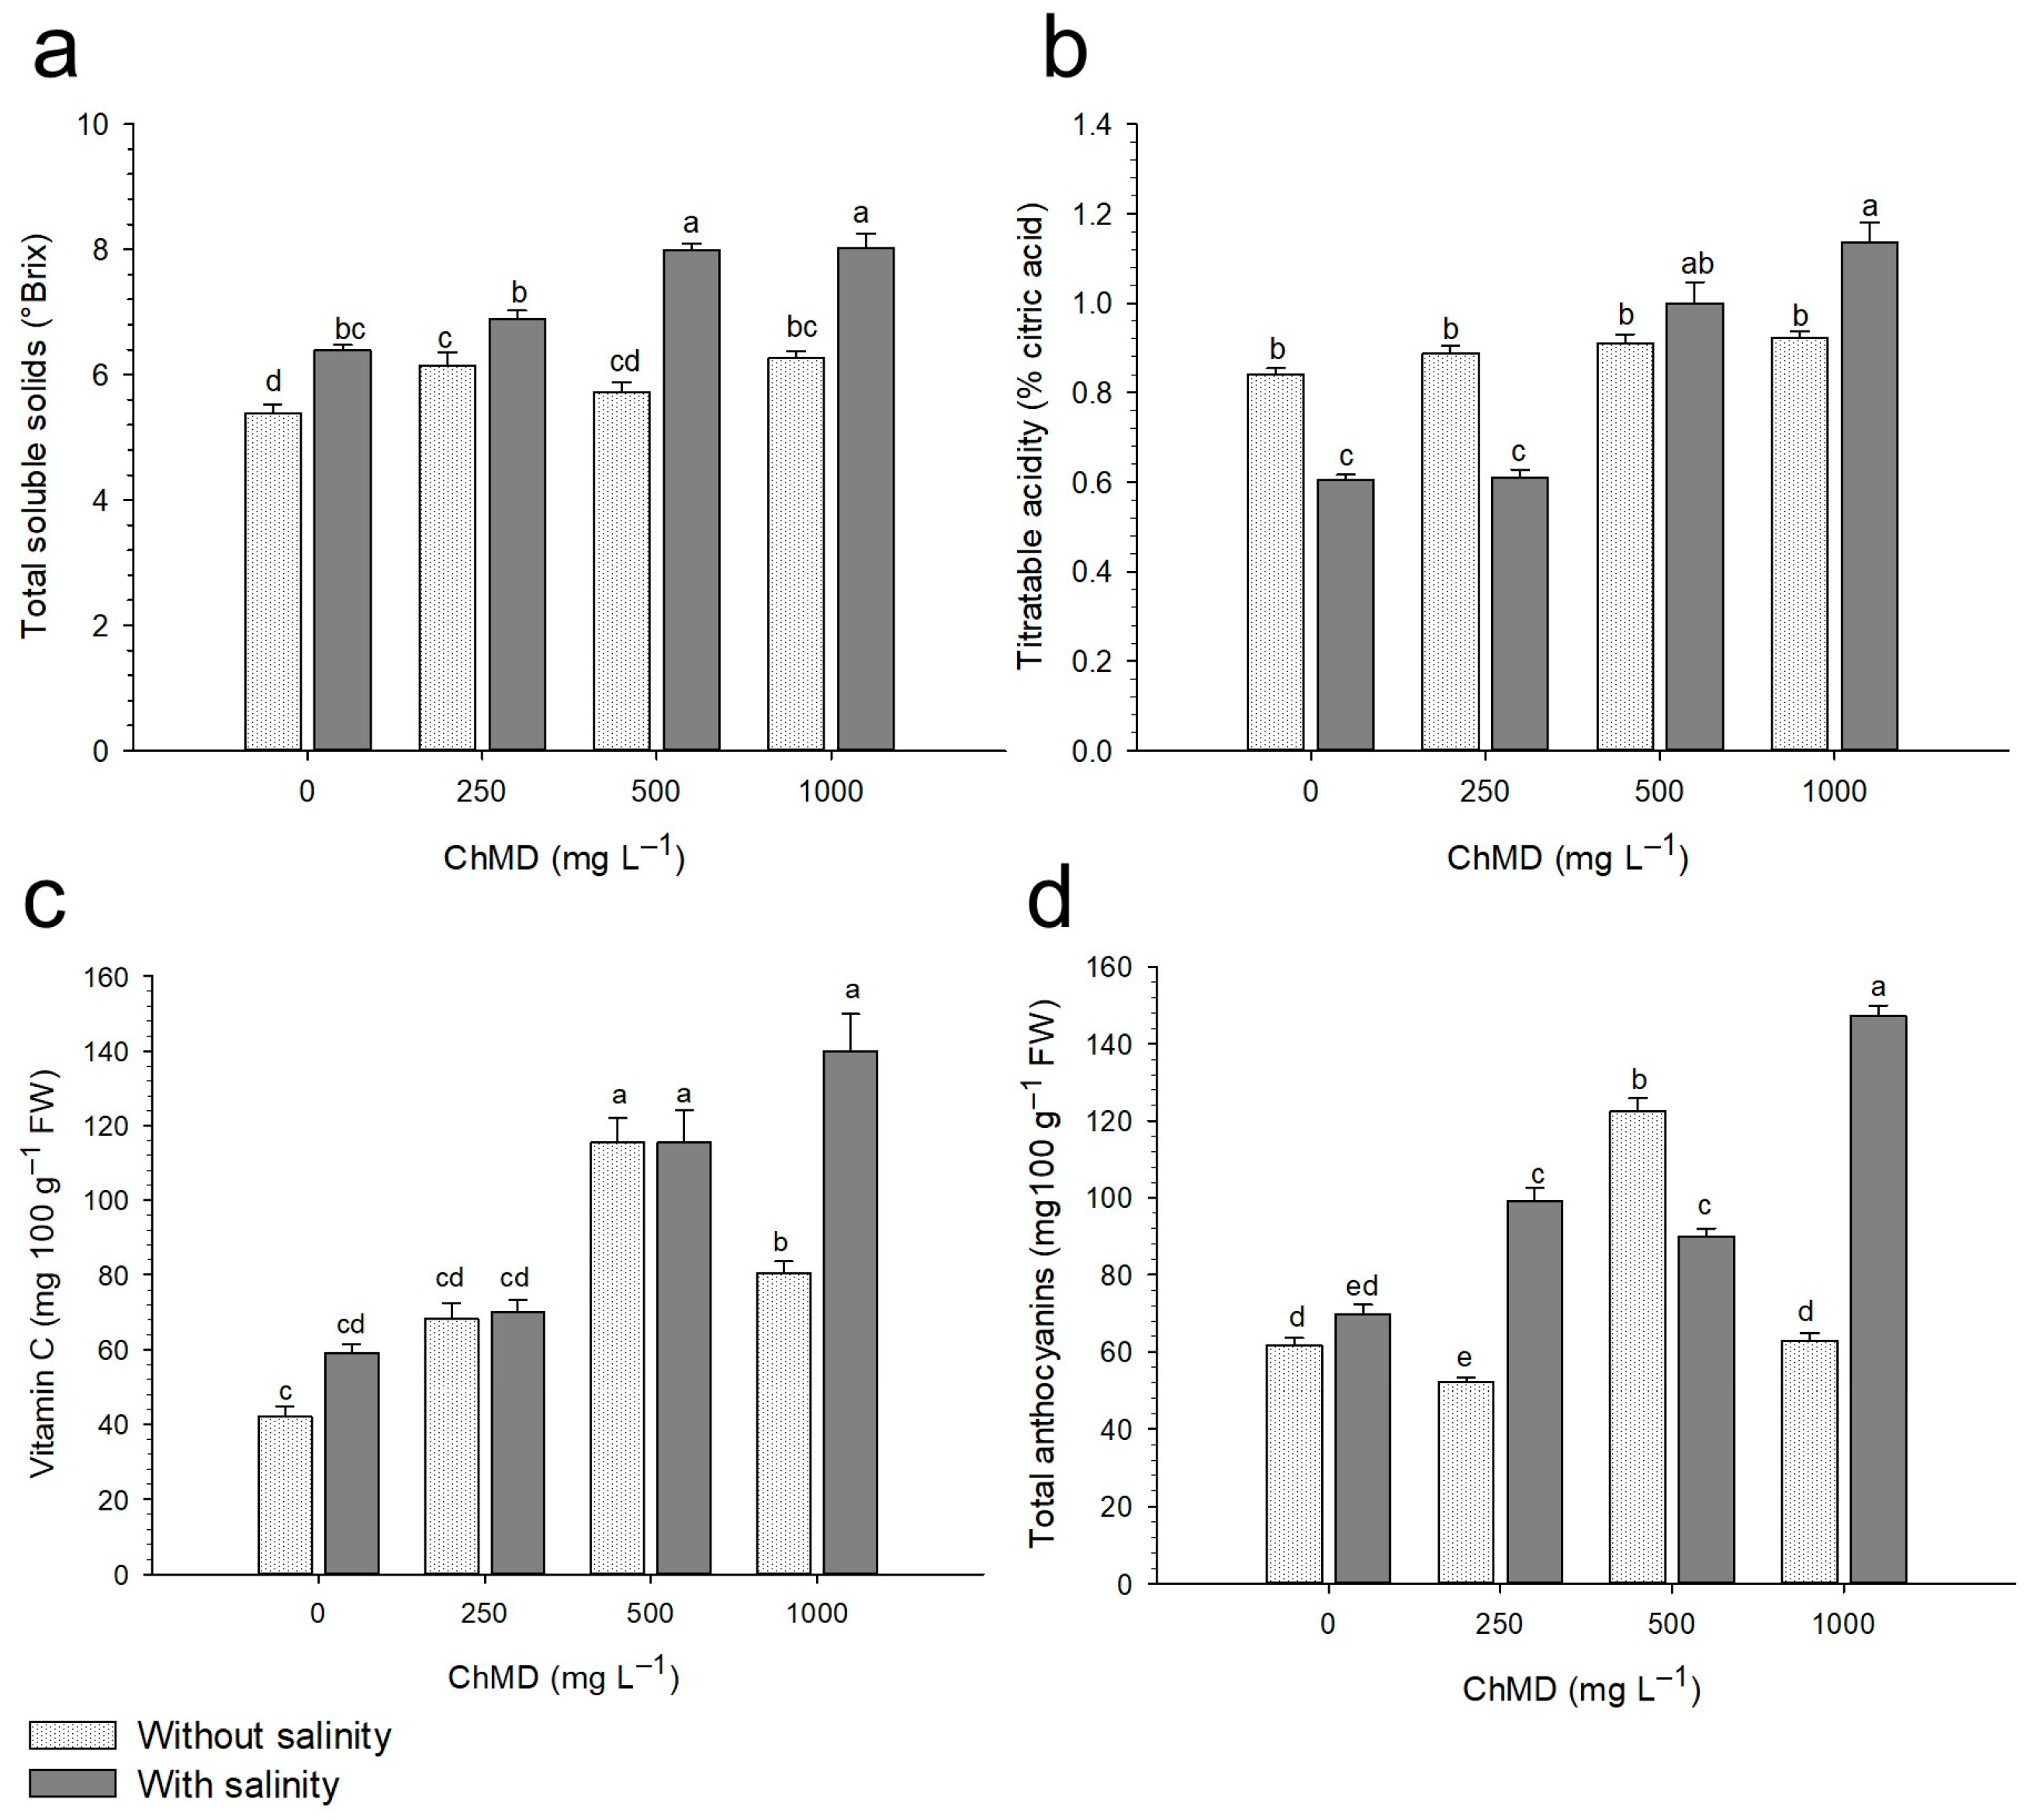
The application of the CHTMD system led to significant increases in the bioactive compounds of strawberry fruits. In particular, the highest values for total soluble solids (°Brix), citric acid, vitamin C, and total anthocyanins were recorded at concentrations of 500 and 1000 mg L−1 (Table 4). Regarding the effect of salinity, a general increase was observed in most of the evaluated parameters, with the exception of titratable acidity, which showed no significant changes in concentration. Furthermore, the interaction between the evaluated factors was significant for all analyzed variables, indicating a complex response dependent on growing conditions.
A dose-dependent increase in CHTMD was observed. The highest °Brix values were recorded in the 500 and 1000 mg L−1 treatments under saline conditions, exceeding those of the corresponding control (Figure 6a). This behavior was consistent with that observed for titratable acidity and vitamin C content (Figure 6b,c), although it is important to note that the 500 mg L−1 treatment in the absence of salinity also had a significant effect on ascorbic acid accumulation. Regarding total anthocyanins, the greatest increase was observed with the application of 1000 mg L−1 under saline conditions (Figure 6d), suggesting a synergistic response between the biostimulant and abiotic stress.
Our results are consistent with previous studies reporting positive effects of chitosan (CHT) on the nutraceutical quality of fruits. In strawberries, it has been shown that the application of CHT increases firmness, total soluble solids, and titratable acidity [72]. In grapevines (Vitis vinifera L.), CHT treatment promoted a significant increase in anthocyanin accumulation in the berry skin, associated with the activation of key genes involved in their biosynthesis and transport [73]. Similarly, in strawberries, increases of up to 2.6-fold in carotenoids, anthocyanins, flavonoids, and phenolic compounds have been reported, as well as a significant increase in total antioxidant capacity in response to the application of CHT at 500 and 1000 mg L−1 [47]. These findings support CHT’s ability to modulate secondary metabolic pathways related to fruit quality.
In addition, studies on crops such as spinach (Spinacia oleracea L.) have shown that foliar application of CHT stimulates the production of both enzymatic (peroxidase (POX), catalase (CAT), and phenylalanine ammonia–lyase (PAL)) and non-enzymatic (total phenols and total flavonoids) defense metabolites, demonstrating its role as an inducer of the antioxidant system [74]. In this regard, the positive effects of polysaccharides, including maltodextrin (MD), may be related to the activation of biosynthetic metabolic pathways for flavonoids and other phenolic compounds, which play key roles in antioxidant defense and the neutralization of reactive oxygen species (ROS) [75].
The increase in bioactive compounds observed in this study can also be interpreted as part of an osmotic adjustment mechanism, which has been widely reported as an adaptive response of plants to salt stress. This process maintains cell turgor and water balance through the accumulation of compatible solutes, including sugars and secondary metabolites [69,76,77]. In this context, salinity acts not only as a limiting factor but also as a stimulus that induces the synthesis of compounds with nutraceutical value.
This effect has been documented for chitosan, which acts as an elicitor capable of inducing the biosynthesis of phenolic compounds and ascorbic acid, contributing to the mitigation of oxidative damage and the improvement in fruit quality [34,52].
Taken together, these findings suggest that the CHTMD system not only improves the plant’s physiological response to stress but also enhances the functional and nutraceutical value of the fruit, which is a highly significant attribute from both agronomic and commercial perspectives. Although the beneficial effects of chitosan on plant growth and stress tolerance have been extensively documented, studies evaluating CHTMD formulations in strawberry plants under saline stress remain limited. Furthermore, most previous reports have focused on growth and yield responses, whereas comprehensive assessments integrating physiological performance, gas exchange, fruit quality, and bioactive compounds are scarce. Therefore, the present study provides new evidence regarding the potential of a chitosan–maltodextrin formulation to improve salinity tolerance and fruit quality in strawberry plants through the simultaneous evaluation of agronomic, physiological, and nutraceutical parameters.

4. Conclusions

The chitosan–maltodextrin (CHTMD) formulations proved to be an effective biostimulant for improving strawberry performance under both normal and saline conditions. The response depended on the concentration applied and the agronomic trait evaluated. For vegetative growth, 250 mg L−1 produced the highest plant height (38.76 cm) and total fresh weight (414.46 g plant−1), whereas 1000 mg L−1 promoted the greatest number of leaves (36.69 leaves plant−1), root length (30.43 cm), and dry weight (94.71 g plant−1). Under saline conditions, 250 mg L−1 increased fresh biomass by 148.5% relative to the saline control and enhanced yield by 87.3%, while 1000 mg L−1 increased fruit number by up to 63.8%.
The physiological improvements induced by CHTMD were reflected in higher photosynthetic performance, with photosynthetic rate increasing from 12.58 to 16.19 μmol CO2 m−2 s−1 and stomatal conductance from 0.235 to 0.325 mol H2O m−2 s−1. Fruit quality was also enhanced, particularly at 500 and 1000 mg L−1, where soluble solids increased from 5.9 to 7.1 °Brix, vitamin C from 50.58 to 115.42 mg 100 g−1 FW, and total anthocyanins from 65.7 to 106.2 mg C3G 100 g−1 FW. These results demonstrate that lower concentrations were more effective for biomass accumulation and yield, whereas higher concentrations favored fruit nutraceutical quality.
The main strength of this study is the comprehensive evaluation of agronomic, physiological, and nutraceutical responses to a novel chitosan–maltodextrin formulation under salinity stress. Additionally, the work provides one of the first integrated assessments of this biopolymer system in strawberry cultivation. However, the study was conducted under controlled experimental conditions, using a single salinity level and a single crop species, which limits the direct extrapolation on the results to commercial production systems. Furthermore, the molecular and biochemical mechanisms underlying the observed responses were not directly investigated.
Future research should evaluate the performance of CHTMD under field conditions, different salinity levels, and diverse horticultural crops, and investigate its effects on ion homeostasis, antioxidant metabolism, gene expression, and long-term crop productivity. Economic feasibility studies and optimization of dosage and application strategies are also required before large-scale adoption.
A SWOT assessment highlights the potential of the CHTMD system as an agricultural biostimulant. Its strengths include biodegradability, biocompatibility, and the ability to simultaneously improve growth, yield, and fruit quality. Weaknesses include the limited understanding of its molecular mode of action and lack of field-scale validation. Opportunities involve the increasing demand for sustainable agricultural technologies and the management of salinity-affected soils. Potential threats include variability in environmental conditions, differences among crop species, and regulatory challenges associated with the commercialization of new biostimulant formulations.

Author Contributions

Conceptualization, A.M.-L. and E.A.P.-V., methodology, E.A.P.-V., A.M.-L. and A.I.L.-R.; formal analysis, A.M.-L. and E.A.P.-V.; validation, A.M.-L. and E.A.P.-V.; investigation, A.M.-L., J.I.T.-d.l.C. and E.A.P.-V.; resources, A.M.-L., J.I.T.-d.l.C. and E.A.P.-V.; data curation E.A.P.-V.; writing—original draft preparation, J.I.T.-d.l.C., E.A.P.-V. and A.M.-L.; writing—review and editing, J.I.T.-d.l.C., E.A.P.-V. and A.M.-L.; visualization, A.I.L.-R., E.A.P.-V. and A.M.-L.; supervision, A.I.L.-R., E.A.P.-V. and A.M.-L.; project administration, A.M.-L. All authors have read and agreed to the published version of the manuscript.

Funding

This research received no external funding.

Institutional Review Board Statement

Not applicable.

Data Availability Statement

The original contributions presented in this study are included in the article. Further inquiries can be directed to the corresponding author.

Acknowledgments

The authors thank the Secretaría de Ciencia, Humanidades, Tecnología e Innovación of México (SECIHTI) for supporting Judith Isabel Torres de la Cruz PhD Scholarship (CVU 2053740), to the Universidad Autonoma Agraria Antonio Narro (UAAAN) and Centro de Investigacion en Quimica Aplicada (CIQA) for support to produce this work.

Conflicts of Interest

The authors declare no conflicts of interest.

Abbreviations

The following abbreviations are used in this manuscript:
CHTChitosan
ROSReactive Oxygen Species
CHTMDChitosan–Maltodextrin
SODSuperoxide Dismutase
CATCatalase
POXPeroxidase
GPXGlutathione Reductase
MDMaltodextrin
FTIRFourier-Transform Infrared Spectroscopy
ECElectrical Conductivity
DATDays After Transplanting
DCPIP2,-Dichloroisophthol
°BRIXSoluble Solids
PALPhenylalanine Ammonia–Lyase

References

  1. Munns, R.; Tester, M. Mechanisms of Salinity Tolerance. Annu. Rev. Plant Biol. 2008, 59, 651–681. [Google Scholar] [CrossRef] [PubMed]
  2. Tarafdar, J.C. Biostimulants for sustainable crop production. In New and Future Developments in Microbial Biotechnology and Bioengineering; Elsevier: Amsterdam, The Netherlands, 2022; pp. 299–313. [Google Scholar] [CrossRef]
  3. Aragüés, R.; Medina, E.T.; Zribi, W.; Clavería, I.; Álvaro-Fuentes, J.; Faci, J. Soil salinization as a threat to the sustainability of deficit irrigation under present and expected climate change scenarios. Irrig. Sci. 2015, 33, 67–79. [Google Scholar] [CrossRef]
  4. Van Oosten, M.J.; Silletti, S.; Guida, G.; Cirillo, V.; Di Stasio, E.; Carillo, P.; Woodrow, P.; Maggio, A.; Raimondi, G. A Benzimidazole Proton Pump Inhibitor Increases Growth and Tolerance to Salt Stress in Tomato. Front. Plant Sci. 2017, 8, 1220. [Google Scholar] [CrossRef] [PubMed]
  5. Rivero, R.M.; Mestre, T.C.; Mittler, R.; Rubio, F.; Garcia-Sanchez, F.; Martinez, V. The combined effect of salinity and heat reveals a specific physiological, biochemical and molecular response in tomato plants. Plant Cell Environ. 2014, 37, 1059–1073. [Google Scholar] [CrossRef] [PubMed]
  6. Zou, P.; Lu, X.; Jing, C.; Yuan, Y.; Lu, Y.; Zhang, C.; Meng, L.; Zhao, H.; Li, Y. Low-Molecular-Weightt Polysaccharides From Pyropia yezoensis Enhance Tolerance of Wheat Seedlings (Triticum aestivum L.) to Salt Stress. Front. Plant Sci. 2018, 9, 427. [Google Scholar] [CrossRef] [PubMed]
  7. Kohli, S.K.; Khanna, K.; Bhardwaj, R.; Abd, E.F.; Ahmad, P.; Corpas, F.J. Assessment of Subcellular ROS and NO Metabolism in Higher Plants: Multifunctional Signaling Molecules. Antioxidants 2019, 8, 641. [Google Scholar] [CrossRef] [PubMed]
  8. Calvo, P.; Nelson, L.; Kloepper, J.W. Agricultural uses of plant biostimulants. Plant Soil 2014, 383, 3–41. [Google Scholar] [CrossRef]
  9. Parađiković, N.; Vinković, T.; Vrček, I.V.; Žuntar, I.; Bojić, M.; Medić-Šarić, M. Effect of natural biostimulants on yield and nutritional quality: An example of sweet yellow pepper (Capsicum annuum L.) plants. J. Sci. Food Agric. 2011, 91, 2146–2152. [Google Scholar] [CrossRef] [PubMed]
  10. García, M.A.; de la Paz, N.; Castro, C.; Rodríguez, J.L.; Rapado, M.; Zuluaga, R.; Gañán, P.; Casariego, A. Effect of molecular weight reduction by gamma irradiation on the antioxidant capacity of chitosan from lobster shells. J. Radiat. Res. Appl. Sci. 2015, 8, 190–200. [Google Scholar] [CrossRef]
  11. Rojas-Pirela, M.; Carillo, P.; Lárez-Velásquez, C.; Romanazzi, G. Effects of chitosan on plant growth under stress conditions: Similarities with plant growth promoting bacteria. Front. Plant Sci. 2024, 15, 1423949. [Google Scholar] [CrossRef] [PubMed]
  12. Geng, W.; Li, Z.; Hassan, M.J.; Peng, Y. Chitosan regulates metabolic balance, polyamine accumulation, and Na+ transport contributing to salt tolerance in creeping bentgrass. BMC Plant Biol. 2020, 20, 506. [Google Scholar] [CrossRef] [PubMed]
  13. Quitadamo, F.; De Simone, V.; Beleggia, R.; Trono, D. Chitosan-Induced Activation of the Antioxidant Defense System Counteracts the Adverse Effects of Salinity in Durum Wheat. Plants 2021, 10, 1365. [Google Scholar] [CrossRef] [PubMed]
  14. Balusamy, S.R.; Rahimi, S.; Sukweenadhi, J.; Sunderraj, S.; Shanmugam, R.; Thangavelu, L.; Mijakovic, I.; Perumalsamy, H. Chitosan, chitosan nanoparticles and modified chitosan biomaterials, a potential tool to combat salinity stress in plants. Carbohydr. Polym. 2022, 284, 119189. [Google Scholar] [CrossRef] [PubMed]
  15. Bakhoum, G.S.; Sadak, M.S.; Badr, E.A.E.M. Mitigation of Adverse Effects of Salinity Stress on Sunflower Plant (Helianthus annuus L.) by Exogenous Application of Chitosan. Bull. Natl. Res. Cent. 2020, 44, 79. [Google Scholar] [CrossRef]
  16. Mulaudzi, T.; Nkuna, M.; Sias, G.; Doumbia, I.Z.; Njomo, N.; Iwuoha, E. Antioxidant Capacity of Chitosan on Sorghum Plants under Salinity Stress. Agriculture 2022, 12, 1544. [Google Scholar] [CrossRef]
  17. Méndez-López, A.; Sánchez-Vega, M.; Betancourt-Galindo, R.; Leal-Robles, A.I.; Pérez-Hernández, H. Foliar application of chitosan–alginate and chitosan–maltodextrin composites improves growth and fruit quality of ‘Anaheim chili’ pepper in arid soils. J. Soils Sediments 2025, 25, 3857–3873. [Google Scholar] [CrossRef]
  18. Sánchez-Vega, M.; Pérez-Hernández, H.; Méndez-López, A.; Betancourt-Galindo, R.; Leal-Robles, A.I.; Pérez-Velasco, E.A. Nanoformulations of Chitosan Alter Growth, Yield, and Metabolic Signatures in Tomato Plants. J. Soil Sci. Plant Nutr. 2026, 26, 1893–1908. [Google Scholar] [CrossRef]
  19. Azizkhani, M.; Sodanlo, A. Antioxidant activity of Eryngium campestre L., Froriepia subpinnata, and Mentha spicata L. polyphenolic extracts nanocapsulated in chitosan and maltodextrin. J. Food Process. Preserv. 2021, 45, e15120. [Google Scholar] [CrossRef]
  20. Guebebia, S.; Gharsallaoui, A.; Dumas, E.; Baghi, F.; Zourgui, L.; Romdhane, M.; Agusti, G.; Ghnimi, S. Microencapsulation of Phenolic Compounds Extracted from Okra (Abelmoschus esculentus L.) Leaves, Fruits and Seeds. Appl. Sci. 2023, 13, 12273. [Google Scholar] [CrossRef]
  21. Steiner, A.A. A universal Method for Preparing Nutrient Solutions of a Certain Desired Composition. Plant Soil 1961, 15, 134–154. [Google Scholar] [CrossRef]
  22. Keutgen, A.J.; Keutgen, N. Influence of NaCl Salinity Stress on Fruit Quality in Strawberry. In ISHS Acta Horticulturae 609: International Symposium on Managing Greenhouse Crops in Saline Environment; ISHS: Pisa, Italy, 2003; pp. 155–157. [Google Scholar] [CrossRef]
  23. Haghshenas, M.; Nazarideljou, M.J.; Shokoohian, A. Phytochemical and Quality Attributes of Strawberry Fruit under Osmotic Stress of Nutrient Solution and Foliar Application of Putrescine and Salicylic Acid. Int. J. Hortic. Sci. Technol. 2020, 7, 263–278. [Google Scholar] [CrossRef]
  24. Shorafa, A. Evaluation for salt stress tolerance in two strawberry cultivars. Am. J. Agric. Biol. Sci. 2014, 9, 334–341. [Google Scholar] [CrossRef]
  25. Garcia, S.; Mabarroh, N.; Cuana, R.; Ardiyanti, H.; Istiqomah, N.I.; Suharyadi, E. Detection of Green-Synthesized Fe3O4/Chitosan Using Spin Valve GMR Sensor with Wheatstone Bridge Circuit. Mater. Sci. Forum 2024, 1114, 9–14. [Google Scholar] [CrossRef]
  26. Hunsub, P.; Ngamprasertsith, S.; Prichapan, N.; Sakdasri, W.; Karnchanatat, A.; Sawangkeaw, R. Life cycle assessment of spray-drying encapsulation of crude peptides produced from defective green coffee beans. Clean Technol. Environ. Policy 2025, 27, 1535–1550. [Google Scholar] [CrossRef]
  27. Balasubramaniam, T.; Shen, G.; Esmaeili, N.; Zhang, H. Plants’ Response Mechanisms to Salinity Stress. Plants 2023, 12, 2253. [Google Scholar] [CrossRef] [PubMed]
  28. Parihar, P.; Singh, S.; Singh, R.; Singh, V.P.; Prasad, S.M. Effect of salinity stress on plants and its tolerance strategies: A review. Environ. Sci. Pollut. Res. 2015, 22, 4056–4075. [Google Scholar] [CrossRef] [PubMed]
  29. Shahrajabian, M.H.; Chaski, C.; Polyzos, N.; Tzortzakis, N.; Petropoulos, S.A. Sustainable Agriculture Systems in Vegetable Production Using Chitin and Chitosan as Plant Biostimulants. Biomolecules 2021, 11, 819. [Google Scholar] [CrossRef] [PubMed]
  30. Kocaman, B. Effects of Foliar Application of Chitosan on Some Vegetative Growth and Biochemical Parameters of Strawberry Under Salt Stress. Indian J. Pharm. Educ. Res. 2024, 58, s1242–s1249. [Google Scholar] [CrossRef]
  31. Almeida, L.G.; Magalhães, P.C.; Karam, D.; da Silva, E.M.; Alvarenga, A.A. Chitosan application in the induction of water deficit tolerance in maize plants. Acta Sci. Agron. 2019, 42, e42463. [Google Scholar] [CrossRef]
  32. Elshayb, O.M.; Ghazy, H.A.; Wissa, M.T.; Farroh, K.Y.; Wasonga, D.O.; Seleiman, M.F. Chitosan-based NPK nanostructure for reducing synthetic NPK fertilizers and improving rice productivity and nutritional indices. Front. Sustain. Food Syst. 2024, 8, 1464021. [Google Scholar] [CrossRef]
  33. Mahmoud, N.E.; Abdel-Gawad, H.; Abdelhameed, R.M. Post-synthetic modification of nano-chitosan using gibberellic acid: Foliar application on sorghum under salt stress conditions and estimation of biochemical parameters. Plant Physiol. Biochem. 2024, 211, 108655. [Google Scholar] [CrossRef] [PubMed]
  34. Hidangmayum, A.; Dwivedi, P.; Katiyar, D.; Hemantaranjan, A. Application of chitosan on plant responses with special reference to abiotic stress. Physiol. Mol. Biol. Plants 2019, 25, 313–326. [Google Scholar] [CrossRef] [PubMed]
  35. Nadimi, S.; Farida, S.H.M. Chitosan nanoparticles enhance salinity tolerance in Lallemantia iberica by modulating physiological and biochemical responses. Plant Nano Biol. 2026, 15, 100245. [Google Scholar] [CrossRef]
  36. Alenazi, M.M.; El-Ebidy, A.M.; El-shehaby, O.A.; Seleiman, M.F.; Aldhuwaib, K.J.; Abdel-Aziz, H.M.M. Chitosan and Chitosan Nanoparticles Differentially Alleviate Salinity Stress in Phaseolus vulgaris L. Plants. Plants 2024, 13, 398. [Google Scholar] [CrossRef] [PubMed]
  37. Elkarmout, A.F.; Yang, M.; Hassan, F.A.S. Chitosan Treatment Effectively Alleviates the Adverse Effects of Salinity in Moringa oleifera Lam via Enhancing Antioxidant System and Nutrient Homeostasis. Agronomy 2022, 12, 2513. [Google Scholar] [CrossRef]
  38. Velasco, E.A.P.; Galindo, R.B.; Aguilar, L.A.V.; Fuentes, J.A.G.; Urbina, B.A.P.; Morales, S.A.L.; Valdés, S.S. Effects of the morphology, surface modification and application methods of ZnO-NPs on the growth and biomass of tomato plants. Molecules 2020, 25, 1282. [Google Scholar] [CrossRef] [PubMed]
  39. Kumar, S.; Bhushan, B.; Kumar, S.; Chandra, A.; Malakar, S.; Nema, P.K. Selective formulation of maltodextrin and fructooligosaccharide enhanced the physicochemical and functional characteristics of spray-dried synbiotic powder. Bioact. Carbohydr. Diet. Fibre 2026, 35, 100529. [Google Scholar] [CrossRef]
  40. Ucan-Tucuch, O.; Betancourt-Galindo, R.; Juárez-Maldonado, A.; Sánchez-Vega, M.; Sandoval-Rangel, A.; Méndez-López, A. Efecto de maltodextrina y nanoparticulas de óxido de zinc sobre biomasa y rendimiento en pepino. Ecosistemas Y Recur. Agropecu. 2024, 10, e3699. [Google Scholar] [CrossRef]
  41. Steveen, J.; Barros, C.; Antonio, E.; Araujo, Y.; Miguel, R.; Batista, G. Effect of the Applications of Three Bio Stimulants on the Ger-Mination and Development of Horticultural Species. Rev. Científica Agroecosistemas 2022, 10, 27–40. Available online: https://aes.ucf.edu.cu/index.php/aes/article/view/559/532 (accessed on 16 April 2026).
  42. Gabriel-Ortega, J.; Pionce, P.C.; Campana, W.N.; Figueroa, T.F.; Villao, F.A. Evaluación de cuatro bioestimulantes en la inducción de la resistencia sistémica en pepino (Cucumis sativus L.) y tomate (Solanum lycopersicum Mill.) en monocultivo y cultivo asociado en invernadero. J. Selva Andin. Res. Soc. 2022, 13, 69–79. [Google Scholar] [CrossRef]
  43. Rouphael, Y.; Colla, G. Editorial: Biostimulants in Agriculture. Front. Plant Sci. 2020, 11, 40. [Google Scholar] [CrossRef] [PubMed]
  44. Jardin, P.D. Plant biostimulants: Definition, concept, main categories and regulation. Sci. Hortic. 2015, 196, 3–14. [Google Scholar] [CrossRef]
  45. Acosta-Motos, J.; Ortuño, M.; Bernal-Vicente, A.; Diaz-Vivancos, P.; Sanchez-Blanco, M.; Hernandez, J. Plant Responses to Salt Stress: Adaptive Mechanisms. Agronomy 2017, 7, 18. [Google Scholar] [CrossRef]
  46. Bulgari, R.; Cocetta, G.; Trivellini, A.; Vernieri, P.; Ferrante, A. Biostimulants and crop responses: A review. Biol. Agric. Hortic. 2015, 31, 1–17. [Google Scholar] [CrossRef]
  47. Rahman, M.; Mukta, J.A.; Sabir, A.A.; Gupta, D.R.; Mohi-Ud-Din, M.; Hasanuzzaman, M.; Miah, M.G.; Rahman, M.; Islam, M.T. Chitosan biopolymer promotes yield and stimulates accumulation of antioxidants in strawberry fruit. PLoS ONE 2018, 13, e0203769. [Google Scholar] [CrossRef] [PubMed]
  48. Ramírez-Rodríguez, S.C.; Ortega-Ortiz, H.; González-Morales, S.; Preciado-Rangel, P. Nanopartículas de quitosán mejoran el rendimiento, actividad enzimática y compuestos bioactivos en frutos de tomate. Rev. TERRA Latinoam. 2023, 41, e1686. [Google Scholar] [CrossRef]
  49. Preciado-Rangel, P.; Marín-Gómez, E.R.; Ortega-Ortiz, H.; Hernández-Montiel, L.G.; Núñez-Ramírez, F.; Reyes-Pérez, J.J.; Torres-Rodriguez, J.A. Chitosan Nanoparticles Enhance Yield and Bioactive Compounds in Melon Fruits. Sci 2025, 7, 166. [Google Scholar] [CrossRef]
  50. Ishkeh, S.R.; Shirzad, H.; Asghari, M.; Alirezalu, A.; Pateiro, M.; Lorenzo, J.M. Effect of Chitosan Nanoemulsion on Enhancing the Phytochemical Contents, Health-Promoting Components, and Shelf Life of Raspberry (Rubus sanctus Schreber). Appl. Sci. 2021, 11, 2224. [Google Scholar] [CrossRef]
  51. Dawa, K.; Metwaly, E.; Swelam, W.; Morgan, A. Response of some Cucumber Cultivars Grown under High Plastic Tunnels to Grafting and some Foliar Application Treatments. J. Plant Prod. 2022, 13, 861–867. [Google Scholar] [CrossRef]
  52. Mukarram, M.; Ali, J.; Dadkhah-Aghdash, H.; Kurjak, D.; Kačík, F.; Ďurkovič, J. Chitosan-induced biotic stress tolerance and crosstalk with phytohormones, antioxidants, and other signalling molecules. Front. Plant Sci. 2023, 14, 1217822. [Google Scholar] [CrossRef] [PubMed]
  53. Malerba, M.; Cerana, R. Chitosan Effects on Plant Systems. Int. J. Mol. Sci. 2016, 17, 996. [Google Scholar] [CrossRef] [PubMed]
  54. El Hadrami, A.; Adam, L.R.; El Hadrami, I.; Daayf, F. Chitosan in Plant Protection. Mar. Drugs 2010, 8, 968–987. [Google Scholar] [CrossRef] [PubMed]
  55. Katiyar, D.; Hemantaranjan, A.; Singh, B. Chitosan as a promising natural compound to enhance potential physiological responses in plant: A review. Indian J. Plant Physiol. 2015, 20, 1–9. [Google Scholar] [CrossRef]
  56. Maliki, S.; Sharma, G.; Kumar, A.; Moral-Zamorano, M.; Moradi, O.; Baselga, J.; Stadler, F.J.; García-Peñas, A. Chitosan as a Tool for Sustainable Development: A Mini Review. Polymers 2022, 14, 1475. [Google Scholar] [CrossRef] [PubMed]
  57. Maksimova, Y.G. Polymer Hydrogels in Agriculture (review). Sel’skokhozyaistvennaya Biol. 2023, 58, 23–42. [Google Scholar] [CrossRef]
  58. Wang, W.; Vinocur, B.; Altman, A. Plant responses to drought, salinity and extreme temperatures: Towards genetic engineering for stress tolerance. Planta 2003, 218, 1–14. [Google Scholar] [CrossRef] [PubMed]
  59. Hasanuzzaman, M.; Bhuyan, M.H.M.B.; Anee, T.I.; Parvin, K.; Nahar, K.; Mahmud, J.A.; Fujita, M. Regulation of Ascorbate-Glutathione Pathway in Mitigating Oxidative Damage in Plants under Abiotic Stress. Antioxidants 2019, 8, 384. [Google Scholar] [CrossRef] [PubMed]
  60. Sharma, A.; Verma, P.; Bodh, S.; Thakur, K. Silicon-mediated alleviation of salinity stress in horticultural crops: Mechanisms and applications. J. Plant Nutr. 2026, 49, 732–752. [Google Scholar] [CrossRef]
  61. Phothi, R.; Theerakarunwong, C.D. Effect of chitosan on physiology, photosynthesis and biomass of rice (Oryza sativa L.) under elevated ozone. Aust. J. Crop Sci. 2017, 11, 624–630. [Google Scholar] [CrossRef]
  62. Mondal, M.M.A.; Malek, M.A.; Puteh, A.B.; Ismail, M.R.; Ashrafuzzaman, M.; Naher, L. Effect of foliar application of chitosan on growth and yield in okra. Aust. J. Crop Sci. 2012, 6, 918–921. [Google Scholar]
  63. Khan, W.M.; Prithiviraj, B.; Smith, D.L. Effect of Foliar Application of Chitin and Chitosan Oligosaccharides on Photosynthesis of Maize and Soybean. Photosynthetica 2002, 40, 621–624. [Google Scholar] [CrossRef]
  64. Xu, C.; Mou, B. Chitosan as Soil Amendment Affects Lettuce Growth, Photochemical Efficiency, and Gas Exchange. Horttechnology 2018, 28, 476–480. [Google Scholar] [CrossRef]
  65. Pérez-Velasco, E.A.; Valdez-Aguilar, L.A.; Betancourt-Galindo, R.; Martínez-Juárez, J.; Lozano-Morales, S.A.; González-Fuentes, J.A. Gas Exchange Parameters, Fruit Yield, Quality, and Nutrient Status in Tomato Are Stimulated by ZnO Nanoparticles of Modified Surface and Morphology and Their Application Form. J. Soil Sci. Plant Nutr. 2021, 21, 991–1003. [Google Scholar] [CrossRef]
  66. Pichyangkura, R.; Chadchawan, S. Biostimulant activity of chitosan in horticulture. Sci. Hortic. 2015, 196, 49–65. [Google Scholar] [CrossRef]
  67. Riseh, R.S.; Ebrahimi-Zarandi, M.; Vazvani, M.G.; Skorik, Y.A. Reducing Drought Stress in Plants by Encapsulating Plant Growth-Promoting Bacteria with Polysaccharides. Int. J. Mol. Sci. 2021, 22, 12979. [Google Scholar] [CrossRef] [PubMed]
  68. Cohen, R.A.; Walker, K.; Carpenter, E.J. Polysaccharide addition effects on rhizosphere nitrogen fixation rates of the California cordgrass, Spartina foliosa. Wetlands 2009, 29, 1063–1069. [Google Scholar] [CrossRef]
  69. Al-Hazmi, N.E.; Naguib, D.M. Agricultural wastes polysaccharides promising soil fertilizer improves plant growth and resistance against soil-borne pathogens. Plant Soil 2024, 495, 675–697. [Google Scholar] [CrossRef]
  70. Singh, N.; Agarwal, S.; Jain, A.; Khan, S. 3-Dimensional cross linked hydrophilic polymeric network ‘hydrogels’: An agriculture boom. Agric. Water Manag. 2021, 253, 106939. [Google Scholar] [CrossRef]
  71. Sikder, A.; Pearce, A.K.; Parkinson, S.J.; Napier, R.; O’Reilly, R.K. Recent Trends in Advanced Polymer Materials in Agriculture Related Applications. ACS Appl. Polym. Mater. 2021, 3, 1203–1217. [Google Scholar] [CrossRef]
  72. He, Y.; Bose, S.K.; Wang, W.; Jia, X.; Lu, H.; Yin, H. Pre-Harvest Treatment of Chitosan Oligosaccharides Improved Strawberry Fruit Quality. Int. J. Mol. Sci. 2018, 19, 2194. [Google Scholar] [CrossRef] [PubMed]
  73. Singh, R.K.; Martins, V.; Soares, B.; Castro, I.; Falco, V. Chitosan Application in Vineyards (Vitis vinifera L. cv. Tinto Cão) Induces Accumulation of Anthocyanins and Other Phenolics in Berries, Mediated by Modifications in the Transcription of Secondary Metabolism Genes. Int. J. Mol. Sci. 2020, 21, 306. [Google Scholar] [CrossRef] [PubMed]
  74. Singh, S. Enhancing phytochemical levels, enzymatic and antioxidant activity of spinach leaves by chitosan treatment and an insight into the metabolic pathway using DART-MS technique. Food Chem. 2016, 199, 176–184. [Google Scholar] [CrossRef] [PubMed]
  75. Kazimi, R.; Saxena, D. Significance of chitosan foliar spraying on the growth and yield of vegetable crop under protected cultivation: A Review. Plant Sci. Today 2023, 10, 140–148. [Google Scholar] [CrossRef]
  76. Hossain, A.; Syed, M.A.; Maitra, S.; Garai, S.; Mondal, M.; Akter, B.; Rahman, M.E.; Alam, N.; Islam, T.; Skalicky, M.; et al. Genetic Regulation, Biosynthesis, and the Roles of Osmoprotective Compounds in Abiotic Stress Tolerance in Plants. In Plant Abiotic Stress Physiology, 1st ed.; Aftab, T., Hakeem, K.R., Eds.; CRC Press: Boca Raton, FL, USA, 2022; Volume 2, pp. 61–114. Available online: https://books.google.com.mx/books?hl=es&lr=&id=9jVVEAAAQBAJ&oi=fnd&pg=PA61&ots=Emz3hxoh_F&sig=pr3JhK6Fkc2pawil0GwpDdYTIoo&redir_esc=y#v=onepage&q&f=false (accessed on 16 April 2026).
  77. Aftab, T.; Hakeem, R. Plant Abiotic Stress Physiology; Apple Academic Press: Boca Raton, FL, USA, 2021. [Google Scholar] [CrossRef]
Figure 1. FT-IR spectra of CHT, MD, and the CHT–MD formulation.
Polysaccharides 07 00080 g001
Figure 2. SEM of the CHTMD system.
Polysaccharides 07 00080 g002
Figure 3. Interaction between CHTMD concentration and salinity on strawberry plant growth: (a) number of leaves, (b) total fresh weight, (c) total dry weight, and (d) root length. Bars represent the standard error of the mean. Different letters indicate significant differences according to Tukey’s multiple-comparisons test (p < 0.05).
Polysaccharides 07 00080 g003
Figure 4. Interaction between CHTMD concentration and salinity on the quality and productivity of strawberry crops: (a) equatorial diameter, (b) fruit weight, (c) number of fruits, and (d) yield. Bars represent the standard error of the mean. Different letters indicate significant differences according to Tukey’s multiple-comparisons test (p < 0.05).
Polysaccharides 07 00080 g004
Figure 5. Interaction between CHTMD concentration and salinity on leaf gas exchange parameters in strawberries: (a) photosynthetic rate, (b) stomatal conductance, (c) internal CO2 concentration, and (d) transpiration rate. Bars represent the standard error of the mean. Different letters indicate significant differences according to Tukey’s multiple-comparisons test (p < 0.05).
Polysaccharides 07 00080 g005
Figure 6. Interaction between CHTMD concentration and salinity on bioactive compounds in strawberries: (a) total soluble solids, (b) titratable acidity, (c) vitamin C, and (d) total anthocyanins. Bars represent the standard error of the mean. Different letters indicate significant differences according to Tukey’s multiple-comparisons test (p < 0.05).
Polysaccharides 07 00080 g006
Table 1. Effect of CHTMD concentration and salinity conditions on growth and biomass parameters in strawberry plants.
Plant Height (cm)Number of LeavesTotal Fresh
Weight (g)
Total Dry Weight (g)Root Length (cm)
CHTMD (mg L−1)
Control35.21 ± 0.608 b13.12 ± 0.310 d318.28 ± 20.623 c54.62 ± 2.305 c17.31 ± 0.654 c
25038.76 ± 0.624 a33.66 ± 0.461 b414.46 ± 18.276 a87.34 ± 1.989 b27.79 ± 0.542 b
50034.28 ± 0.666 b21.56 ± 0.745 c372.56 ± 6.314 b91.18 ± 5.104 ab26.68 ± 0.665 b
100036.04 ± 0.621 b36.69 ± 0.734 a366.75 ± 19.087 b94.71 ± 5.007 a30.43 ± 0.470 a
CV9.6808.3708.08311.4729.625
ANOVA<0.001<0.001<0.001<0.001<0.001
Salinity
Without25.5 a28.4 a337.8 b83.1 a27.7 a
With26.6 a24.1 b398.1 a80.8 a23.4 b
ANOVA0.0716<0.001<0.0010.1615<0.001
Interactions
CHTMD * salinity0.5913<0.001<0.001<0.0010.0175
* Different letters within the same column indicate statistical differences according to Tukey’s multiple-comparisons test (p ≤ 0.05).
Table 2. Effect of CHTMD concentration and salinity conditions on quality and yield variables in strawberry cultivation.
Equatorial Diameter (mm)Polar Diameter (mm)Fruit Weight (g)Number of FruitsYield
(g Plant−1)
CHTMD (mg L−1)
Control32.48 ± 0.472 b37.37 ± 0.765 b18.44 ± 0.418 c10.8 ± 0.398 b200.7 ± 8.615 d
25038.93 ± 0.882 a41.93 ± 0.910 a27.04 ± 0.884 a15.0 ± 0.446 a409.3 ± 21.427 ab
50037.10 ± 0.827 a39.33 ± 0.722 b23.78 ± 0.543 b12.2 ± 0.587 b289.4 ± 15.373 c
100037.81 ± 1.062 a37.45 ± 1.003 b28.62 ± 0.452 a14.5 ± 0.668 a418.7 ± 22.092 a
CV10.75311.77711.83321.01425.143
ANOVA<0.0010.0003<0.001<0.001<0.001
Salinity
Without35.4 b40.2 a24.012.6 b303.8 b
With37.8 a37.8 b24.913.7 a355.3 a
ANOVA0.00120.00320.09040.02950.0007
Interactions
CHTMD * salinity<0.0010.1061<0.001<0.001<0.001
* Different letters within the same column indicate statistical differences according to Tukey’s multiple-comparisons test (p ≤ 0.05).
Table 3. Effect of CHTMD concentration and salinity conditions on gas exchange parameters in strawberry plants.
Photosynthetic Rate
(µmol CO2 m−2 s−1)
Stomatal Conductance
(mol H2O m−2 s−1)
Internal CO2
(μmol mol−1)
Transpiration Rate (mmol H2O m−2 s−1)SPAD Units
CHTMD (mg L−1)
Control12.58 ± 0.235 b0.235 ± 0.010 c249.6 ± 4.611 b9.9 ± 0.408 b45.43 ± 0.498 b
25015.69 ± 0.498 a0.281 ± 0.005 b262.9 ± 2.172 a11.5 ± 0.229 a51.25 ± 0.543 a
50012.81 ± 0.373 b0.307 ± 0.015 ab261.6 ± 4.583 a10.8 ± 0.346 a50.61 ± 0.422 a
100016.19 ± 0.459 a0.325 ± 0.010 a260.2 ± 2.215 a11.3 ± 0.243 a51.32 ± 0.498 a
CV9.10911.0414.0868.2455.224
ANOVA<0.001<0.0010.0029<0.001<0.001
Salinity
Without14.37 a0.319 a266.84 a11.63 a50.4 a
With14.27 a0.255 b250.33 b10.15 b48.9 b
ANOVA0.7633<0.001<0.001<0.0010.0016
Interactions
CHTMD * salinity<0.0010.05990.0010.00040.1312
* Different letters within the same column indicate statistical differences according to Tukey’s multiple-comparisons test (p ≤ 0.05).
Table 4. Effect of CHTMD concentration and salinity conditions on bioactive compound content in strawberries.
Total Soluble SolidsTitratable Acidity
(% Citric Acid)
Vitamin C
(mg 100 g−1 FW)
Total Anthocyanins
(mg C3G 100 g−1 FW)
CHTMD (mg L−1)
Control5.9 ± 0.151 c0.723 ± 0.046 b50.58 ± 3.600 c65.7 ± 2.561 c
2506.5 ± 0.160 b0.749 ± 0.055 b60.09 ± 2.509 b75.6 ± 9.219 b
5006.9 ± 0.308 ab0.955 ± 0.037 a115.42 ± 5.038 a106.2 ± 6.685 a
10007.1 ± 0.258 a1.028 ± 0.050 a110.20 ± 12.260 a105.1 ± 16.087 a
CV7.0729.20214.2347.453
ANOVA<0.001<0.001<0.001<0.001
Salinity
Without5.9 b0.89 76.55 b74.8 b
With7.3 a0.84 96.10 a101.6 a
ANOVA<0.0010.07580.0002<0.001
Interactions
CHTMD * salinity<0.001<0.0010.0002<0.001
* Different letters within the same column indicate statistical differences according to Tukey’s multiple-comparisons test (p ≤ 0.05).
Disclaimer/Publisher’s Note: The statements, opinions and data contained in all publications are solely those of the individual author(s) and contributor(s) and not of MDPI and/or the editor(s). MDPI and/or the editor(s) disclaim responsibility for any injury to people or property resulting from any ideas, methods, instructions or products referred to in the content.