Article

Turbulence-Induced Buffeting Response and Vibration Mitigation of a Cable-Supported Photovoltaic System

1
State Key Laboratory of Disaster Reduction in Civil Engineering, Tongji University, Shanghai 200092, China
2
Key Laboratory of Transport Industry of Wind Resistant Technology for Bridge Structures, Tongji University, Shanghai 200092, China
3
China Huaneng Group Co., Ltd., Xiong’an 070001, China
4
Huaneng Clean Energy Research Institute, Beijing 102209, China
5
Huaneng International Power Co., Ltd., Hebei Clean Energy Branch, Shijiazhuang 050051, China
*
Author to whom correspondence should be addressed.
Eng 2026, 7(9), 488; https://doi.org/10.3390/eng7090488 (registering DOI)
Submission received: 18 July 2026 / Revised: 5 September 2026 / Accepted: 16 September 2026 / Published: 20 September 2026
(This article belongs to the Special Issue Fluid-Structure Interaction in Civil Engineering)

Abstract

The stochastic buffeting response characteristics and control performance of a cable-supported flexible photovoltaic system under turbulent inflow were investigated through aeroelastic wind tunnel tests in an atmospheric boundary layer corresponding to terrain category A. Emphasis was placed on the stochastic vibration features induced by turbulence and their dependence on wind direction and structural reinforcement. The results demonstrate that the structural response is dominated by turbulence-induced buffeting, exhibiting pronounced random and non-periodic characteristics. Spectral analysis reveals a mixed frequency pattern, with broadband features in vertical vibration and narrowband characteristics in torsional vibration. A wind-induced vibration coefficient was introduced to quantify relative fluctuation intensity, and an applicability criterion was adopted to avoid misleading interpretation under near-zero mean-response conditions. The response shows strong wind-direction dependence, with generally lower response levels within 0–90° and larger, more variable responses within 90–180°, together with local amplification at several oblique wind directions. Despite these local amplifications, the opposite wind directions (0° and 180°) govern the extreme global responses. Clear spatial differences are observed between the mid-span and side span, with the side span showing stronger wind-directional sensitivity. Structural reinforcement effectively suppresses turbulence-induced responses, particularly the fluctuating components, with the maximum reduction rate reaching approximately 98.7%. The reinforced cables also modify the wind-directional distribution of the response and exhibit varying mitigation effectiveness depending on the response component and spatial location. The present study highlights the distinct characteristics of buffeting-dominated responses in flexible photovoltaic systems under turbulent wind conditions and provides a reference for evaluating vibration control strategies in practical engineering applications.

1. Introduction

With the global transition toward low-carbon energy systems, photovoltaic (PV) power generation has expanded rapidly over the past decade. Global PV electricity generation increased from 1039 TWh in 2021 to 1284 TWh in 2022, representing an increase of approximately 24% [1]. As PV projects are increasingly deployed in complex environments such as mountainous areas, tidal flats, and aquaculture–PV hybrid systems, the limitations of conventional rigid-support PV structures in terrain adaptability, spanning capacity, and land-use efficiency have become increasingly evident [2]. In this context, cable-supported flexible photovoltaic systems have attracted increasing attention because of their large-span capacity, lightweight configuration, and adaptability to complex terrains [3,4,5,6,7]. However, unlike rigid-support systems that are primarily governed by quasi-static wind loads, cable-supported flexible PV structures exhibit more complex dynamic response characteristics under realistic wind environments. Owing to their low mass, low stiffness, low damping, and pronounced flexibility, these structures are highly sensitive to wind excitation [8,9]. Recent field measurements and validated numerical simulations have further demonstrated that the natural frequencies, damping characteristics, and flutter performance of cable-supported flexible PV systems are strongly influenced by structural configuration and key modeling parameters [10]. Under wind action, their response is not limited to static deformation but is also significantly influenced by fluctuating wind and turbulent disturbances, leading to pronounced wind-induced vibrations.
Existing studies have shown that flexible PV structures may exhibit significant torsional vibration under wind excitation, with more pronounced responses under cross-wind conditions [11]. Meanwhile, under atmospheric boundary-layer inflow, the structural response is strongly affected by factors such as inclination angle, wind direction, and wind speed [12]. Excessive wind-induced vibrations can not only affect the operational stability of PV modules but may also lead to connection loosening, fatigue damage of auxiliary components, and even local structural failure, thereby compromising the safety, durability, and serviceability of the structure [13]. Therefore, systematically understanding the wind-induced response characteristics of cable-supported flexible PV structures is a key issue in their wind-resistant design and vibration control.
Existing studies on wind effects on PV structures have addressed several aspects, among which wind-load characteristics and wind-induced structural responses are the most relevant to the present study. For wind-load characteristics, previous studies have investigated wind pressure distributions, aerodynamic force coefficients, and shielding effects of PV panels through rigid-model wind tunnel tests or numerical simulations [14,15]. These studies provide useful information for static wind-load evaluation and wind-resistant design. For flexible PV structures, aeroelastic model tests and dynamic analyses have been further adopted to examine wind-induced vibration characteristics and their influencing factors [16,17,18,19]. Recent theoretical work has established analytical models and practical formulas for estimating the natural frequencies of single-layer cable-supported PV systems, providing a theoretical basis for structural dynamic characterization and subsequent aeroelastic assessment [20,21]. Previous studies have shown that wind direction, inclination angle, array configuration, and structural flexibility can significantly affect the wind-induced response of PV systems [12,22,23].
In practical engineering, the incoming wind is characterized by atmospheric boundary-layer turbulence, where the wind velocity exhibits significant temporal and spatial fluctuations rather than an idealized uniform steady flow [24,25]. Under such conditions, the wind loads acting on structures inherently behave as broadband stochastic processes, and the structural response is typically dominated by turbulence-induced buffeting [26,27,28]. Several recent studies have considered atmospheric boundary-layer inflow and wind-induced vibration coefficients of flexible photovoltaic systems [12,29,30]. However, the stochastic response characteristics under turbulent inflow still require further clarification, especially in terms of time-domain randomness, frequency-domain energy distribution, and response-component differences.
Despite the progress made in previous studies, several aspects of the wind-induced buffeting behavior and vibration mitigation of cable-supported flexible photovoltaic systems remain insufficiently understood. First, previous investigations have mainly focused on wind loads, aerodynamic characteristics, or overall structural responses of flexible photovoltaic systems under specific wind conditions [11,12,30,31,32,33]. However, the stochastic characteristics of buffeting responses under turbulent inflow, including the relationship between time-domain fluctuations, frequency-domain characteristics, and the differences between vertical and torsional responses, have not been systematically clarified. Second, although the effects of wind direction and aerodynamic interference in photovoltaic arrays have been investigated [12,34], the variation in wind-induced responses with different wind directions and structural locations, particularly the differences between mid-span and edge-span regions in multi-span cable-supported photovoltaic systems, remains insufficiently understood. Third, existing studies on vibration mitigation measures have mainly focused on the reduction of overall response amplitudes [11,35,36]. The dependence of mitigation effectiveness on response components, wind directions, and the possible variation in governing response conditions after reinforcement remains unclear. Therefore, further experimental evidence is needed to support a statistical-response-based evaluation of turbulence-induced buffeting in cable-supported flexible PV arrays.
To address these gaps, this study investigates the turbulence-induced buffeting response and vibration mitigation performance of a three-span, six-row cable-supported photovoltaic system through aeroelastic wind tunnel testing under a simulated atmospheric boundary layer. The main contributions of this study are summarized as follows.
(1) The buffeting characteristics of the flexible photovoltaic system are comprehensively evaluated by integrating time-history analysis, spectral analysis, RMS and standard deviation characteristics, peak response estimation, and wind-induced vibration coefficient assessment. This framework enables a more complete understanding of the stochastic vertical and torsional responses under turbulent wind excitation.
(2) A comprehensive wind-direction test matrix from 0° to 350° is conducted to investigate the variation in wind-induced responses with wind direction and structural location. The differences between mid-span and edge-span regions, as well as the characteristics of vertical and torsional responses, are analyzed to reveal the spatial response variations in multi-span flexible photovoltaic systems.
(3) The effectiveness of reinforced cables in mitigating turbulence-induced responses is systematically evaluated by comparing reinforced and unreinforced configurations under identical wind conditions. The influence of wind direction, response component, and spatial location on the mitigation performance is further examined, providing insights into the application of reinforcement measures for flexible photovoltaic structures.
The findings provide experimental evidence for buffeting-response assessment and vibration mitigation design of cable-supported flexible PV systems in realistic turbulent wind environments.

2. Experimental Setup and Data Acquisition

2.1. Simulation of Atmospheric Boundary-Layer Wind Field

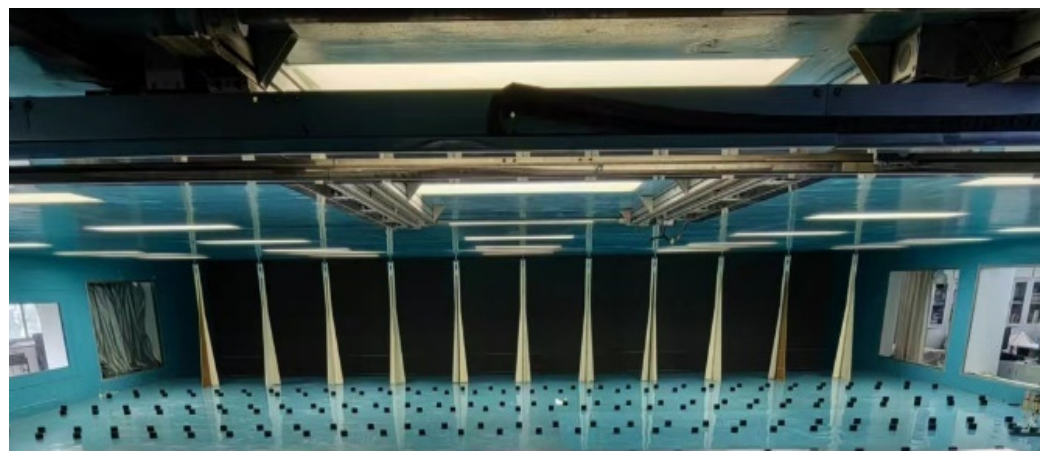
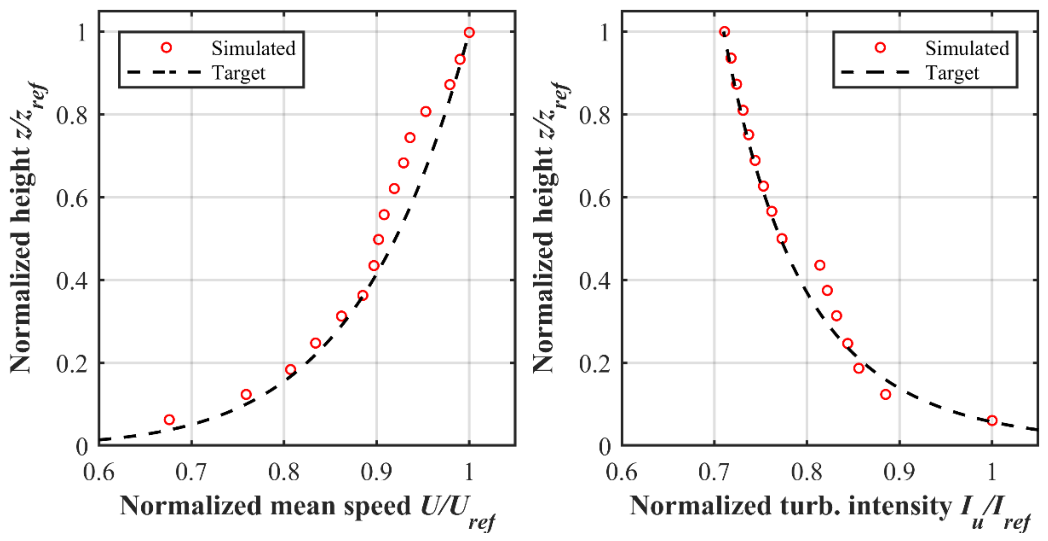
In wind tunnel experiments, accurately simulating the atmospheric boundary-layer wind field is crucial for ensuring the reliability of the test results. This experiment was conducted in the TJ-3 boundary-layer wind tunnel at Tongji University. The wind tunnel is a closed-return type boundary-layer wind tunnel, which offers excellent flow stability and uniformity, making it suitable for simulating atmospheric boundary layers under complex terrain conditions. According to the terrain classification specified in the Load Code for the Design of Building Structures (GB 50009-2012) [37], and considering the terrain, topography, and surrounding environment of the target site, the simulated atmospheric boundary layer was designed to correspond to terrain category A. To achieve the corresponding atmospheric boundary-layer characteristics, a passive simulation method combining sharp splitter blades and surface roughness elements was used in the wind tunnel to regulate the incoming wind field. The specific arrangement of the surface roughness elements and splitter blades upstream of the model is shown in Figure 1. The mean wind speed profile and the along-wind turbulence intensity profile of the experimental wind field are shown in Figure 2. The experimental results indicate that the fitted value of the atmospheric boundary-layer wind-speed profile exponent α 0 is 0.13, which agrees well with the recommended value of 0.12 for terrain category A in GB 50009-2012.
The mean wind-speed profile in the atmospheric boundary layer can be expressed in a power law form, with the following expression:
U z U z r = z z r α 0
where U z is the wind speed at height z , and U z r is the wind speed at the gradient wind height z r . z is the height above the ground, and z r is the boundary-layer height. The measurement results correspond to prototype heights within 160 m, covering the actual height range of the experimental model, thus meeting the requirements for structural wind-induced response analysis. As shown in Figure 2, the measured mean wind-speed profile agrees well with the theoretical profile for terrain category A specified in GB 50009-2012, indicating that the simulated wind field reasonably reproduces the target atmospheric boundary-layer characteristics. Additionally, the along-wind turbulence intensity profile also satisfies the expected turbulence characteristics for terrain category A specified in GB 50009-2012. In conclusion, the wind field simulated in this experiment satisfies the standard requirements for both mean flow and turbulence characteristics, making it suitable for subsequent structural wind-induced response analysis.

2.2. Aeroelastic Model and Measurement System

The tested structure was a three-span, six-row cable-supported photovoltaic system designed with a nominal geometric scale ratio of 1:10. The principal in-plane dimensions were geometrically scaled, whereas the PV-module thickness was adjusted because of model-material and fabrication constraints.
The prototype consisted of one mid-span and two side spans. The prototype mid-span and side-span lengths were 25.5 m and 15.5 m, respectively, corresponding to model-scale lengths of 2.55 m and 1.55 m. The photovoltaic modules had an initial inclination angle of 5°. The main geometric parameters and dynamic properties of the aeroelastic model are summarized in Table 1.
For the present turbulent-buffeting tests, the principal aeroelastic similitude parameters were considered based on the geometric scale λ L = 1 / 10 . Under the Froude similitude requirement, the velocity and frequency scale ratios are λ U = 1 / 10   and λ f = 10 , respectively, thereby preserving reduced-frequency similarity. The target mass scale is λ m = 1 / 1000 , and the corresponding mass-moment-of-inertia scale for a geometrically similar mass distribution is λ I = λ m λ L 2 = 1 / 100,000 . The actual PV-module mass was 0.032 kg, close to the target value of 0.035 kg; this also indicates that the structure/air mass ratio similitude was approximately satisfied. The measured vertical and torsional frequencies were 4.40 and 6.45 Hz, respectively, close to the target values of 4.43 and 6.36 Hz. The measured first-mode vertical and torsional damping ratios were approximately 2.5% and 2.9%, respectively, which are within the reported damping ratio range of other flexible photovoltaic systems [10]. Previous measurements of flexible cable-supported photovoltaic systems have shown that modal damping varies with vibration amplitude and structural configuration [10]. Since the mass ratio was approximately preserved and the measured damping ratios are representative of comparable flexible PV systems, the Scruton-number requirement is considered approximately satisfied. Therefore, the model is considered suitable for investigating the buffeting-response characteristics and relative variations among different wind directions, structural locations, and reinforcement configurations.
The aeroelastic model consisted of photovoltaic panels, supporting cables, rigid columns, and reinforced cables. The photovoltaic panels were made of expanded PVC foam boards, the supporting cables and reinforced cables were made of steel wires, and the columns were designed as rigid supporting members. These components were selected to reproduce the main geometric configuration and fundamental dynamic properties required for turbulent buffeting-response measurements.
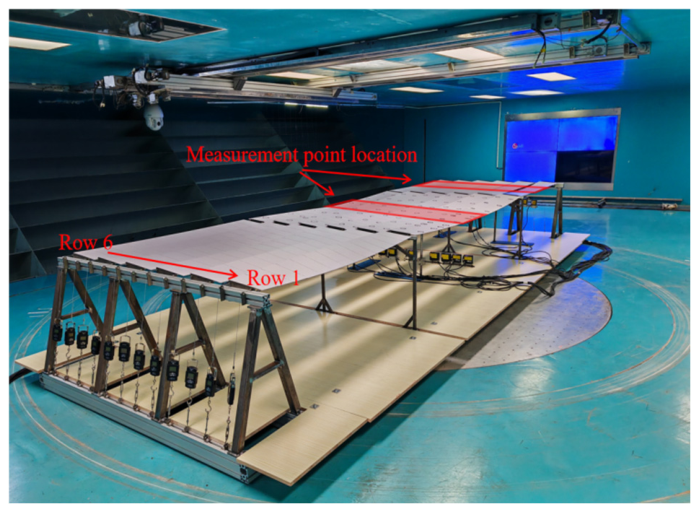
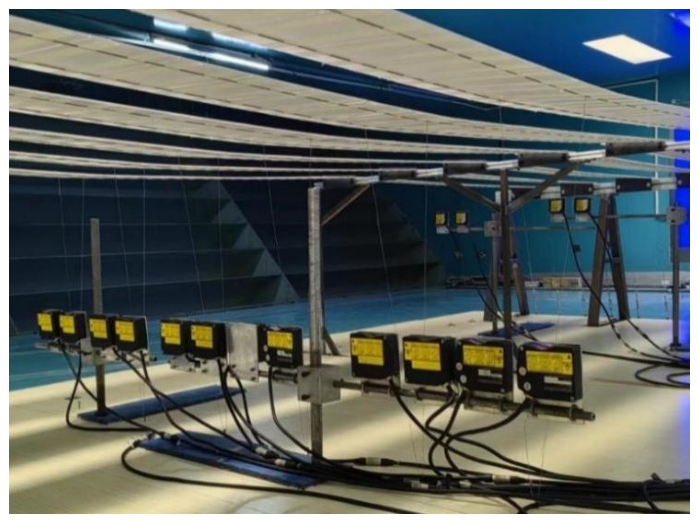
The measurement layout is shown in Figure 3. A total of 18 measurement points were arranged at the mid-span and side-span locations. At the mid-span, measurement points were arranged from Row 1 to Row 6. At the side span, representative measurement points were arranged at Rows 1, 4, and 6. Two displacement sensors were installed at each measured section to obtain the vertical displacement and torsional angle of the photovoltaic module.
The configuration of the reinforced cables is shown in Figure 4. For each row, paired steel-wire reinforced cables were installed at the one-third points of the mid-span and at the midpoint of each side span. Each reinforced-cable unit consisted of two steel wires arranged as a pair. The upper ends of the steel wires were connected to the photovoltaic module, while the lower ends were anchored to the ground. Two structural configurations were considered in the tests: the unreinforced configuration without reinforced cables and the reinforced configuration with reinforced cables. The comparison between these two configurations was used to evaluate the effect of reinforced cables on the mean and fluctuating responses under turbulent inflow.

2.3. Test Cases and Measurement

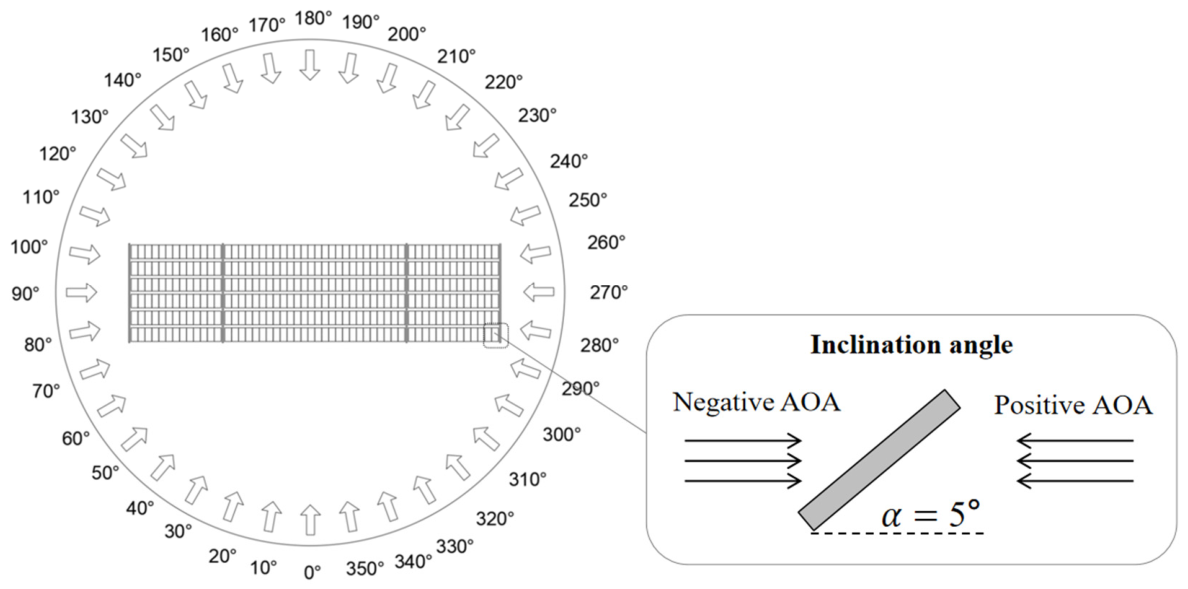
To facilitate the analysis of the impact of wind direction angle on the structural response, the wind direction angle of 0° is defined as the negative angle of attack direction (AOA), corresponding to the range of 0–90° and 270–360° as the negative angle of attack region. A wind direction angle of 180° is defined as the positive angle of attack direction, corresponding to the range of 90–270° as the positive angle of attack region. The overall layout of the aeroelastic wind tunnel testing system is shown in Figure 5.
The test cases are summarized in Table 2. All cases were conducted under the simulated atmospheric boundary-layer turbulence corresponding to terrain category A. The wind direction angle ranged from 0° to 350° with a 10° interval to systematically analyze the influence of different incoming wind directions on the structural response. Two structural configurations were tested: the unreinforced configuration and the reinforced configuration with reinforced cables. For the unreinforced configuration, wind speeds of 12.6 m/s and 19.0 m/s were selected to represent moderate and relatively high wind-speed levels for buffeting-response analysis. Higher wind speeds were not adopted because excessive vibration amplitudes may obscure the stochastic buffeting characteristics and reduce the reliability of displacement measurements. For the reinforced condition, an additional higher wind speed of 31.6 m/s was tested to evaluate whether the reinforced cables could effectively suppress turbulent buffeting responses under stronger wind excitation. With the measurement point layout and condition design, the wind-induced vibration characteristics of the structure under turbulent flow can be systematically assessed from the perspectives of spatial distribution and wind direction variation, and the control effect of the structural reinforcement measures can be further analyzed.
For each test condition, the structural responses were continuously recorded for 30 s. The mean response, standard deviation of the fluctuating response, and peak response used in the subsequent analyses were obtained from the complete measured time histories.
In addition to the turbulent-flow test matrix summarized in Table 2, complementary uniform-flow tests were also conducted using the same aeroelastic model. Representative response–wind-speed results at the principal wind directions of 0° and 180° are presented in Section 3.1 to support the interpretation of the aeroelastic contribution to the measured response.
Although the tests covered the complete wind-direction range from 0° to 350° at 10° intervals, only representative wind-direction ranges are discussed in detail to avoid redundant presentation. The complete dataset was used for identifying the governing wind directions and evaluating the reinforcement effectiveness.

3. Response Characteristics of the Cable-Supported Photovoltaic System

3.1. Vibration Characteristics of Mid-Span

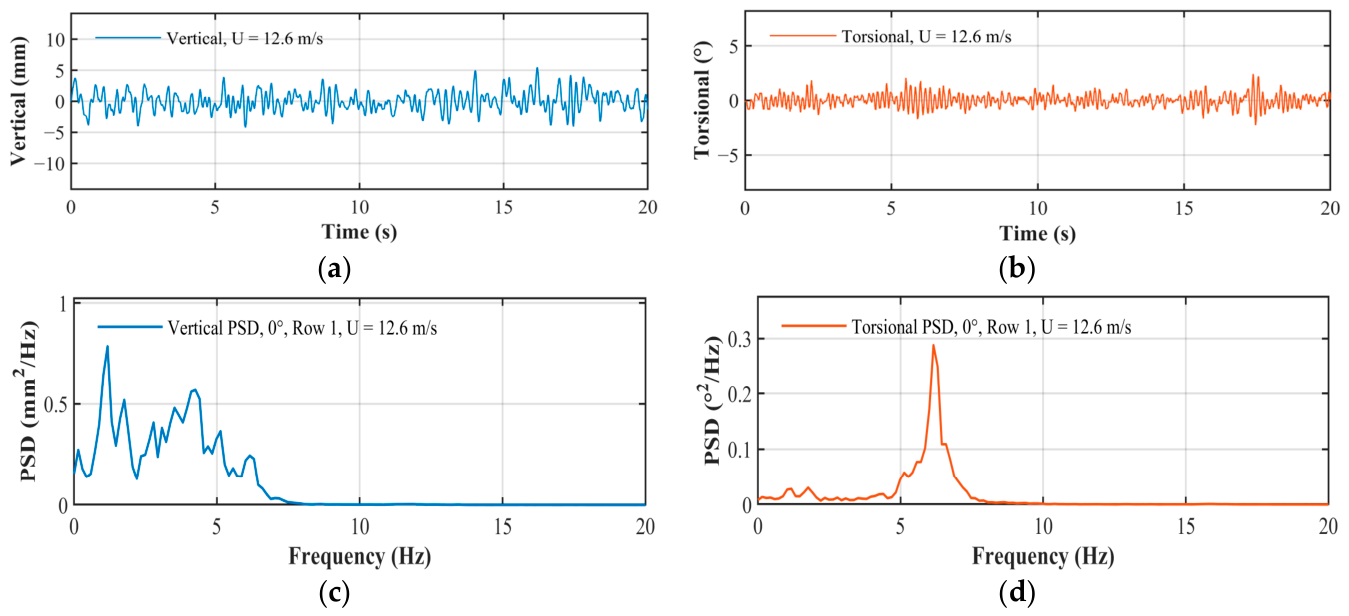
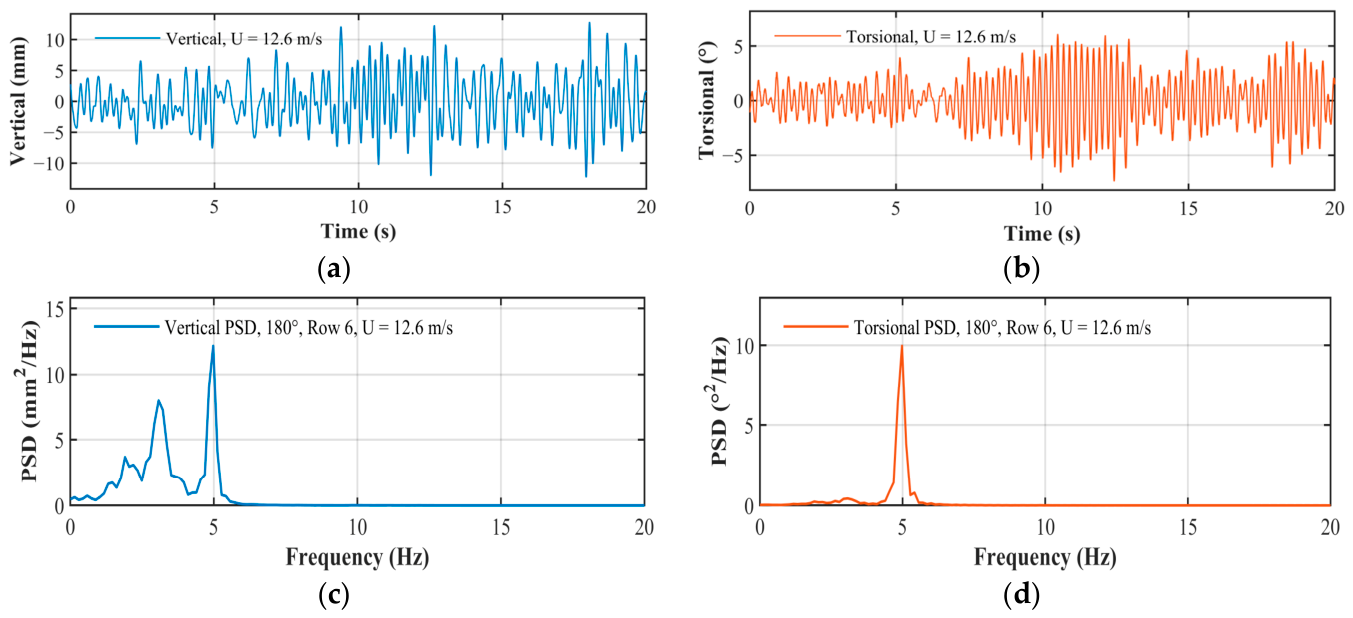
Representative time histories and power spectral density (PSD) analyses for the mid-span are shown in Figure 6 and Figure 7. Figure 6 presents the response under the 0° wind direction, while Figure 7 presents the response under the 180° wind direction. Specifically, when the wind direction angle is 0°, the first row (P1) is the windward row; when the wind direction angle is 180°, the sixth row is the windward row.
As shown in Figure 6a,b, the vertical and torsional displacement responses at the mid-span under the 0° wind direction exhibit irregular fluctuations without a stable periodic pattern. Similar stochastic response features are also observed under the 180° wind direction, as shown in Figure 7a,b. For the selected windward-row cases, the responses under 180° are larger than those under 0°, suggesting that incoming-flow direction affects the representative buffeting response. These irregular and non-periodic time-history features are characteristic of turbulence-induced buffeting under the tested inflow condition.
The corresponding PSD results are shown in Figure 6c,d and Figure 7c,d. The spectra exhibit broadband energy distributions together with several local peaks, indicating the combined influence of turbulent excitation and structural modal amplification. Compared with the vertical response, the torsional response shows stronger energy concentration near the measured structural frequencies, whereas the vertical component retains a broader spectral distribution. These features indicate a more pronounced modal response in the torsional component under turbulent excitation.
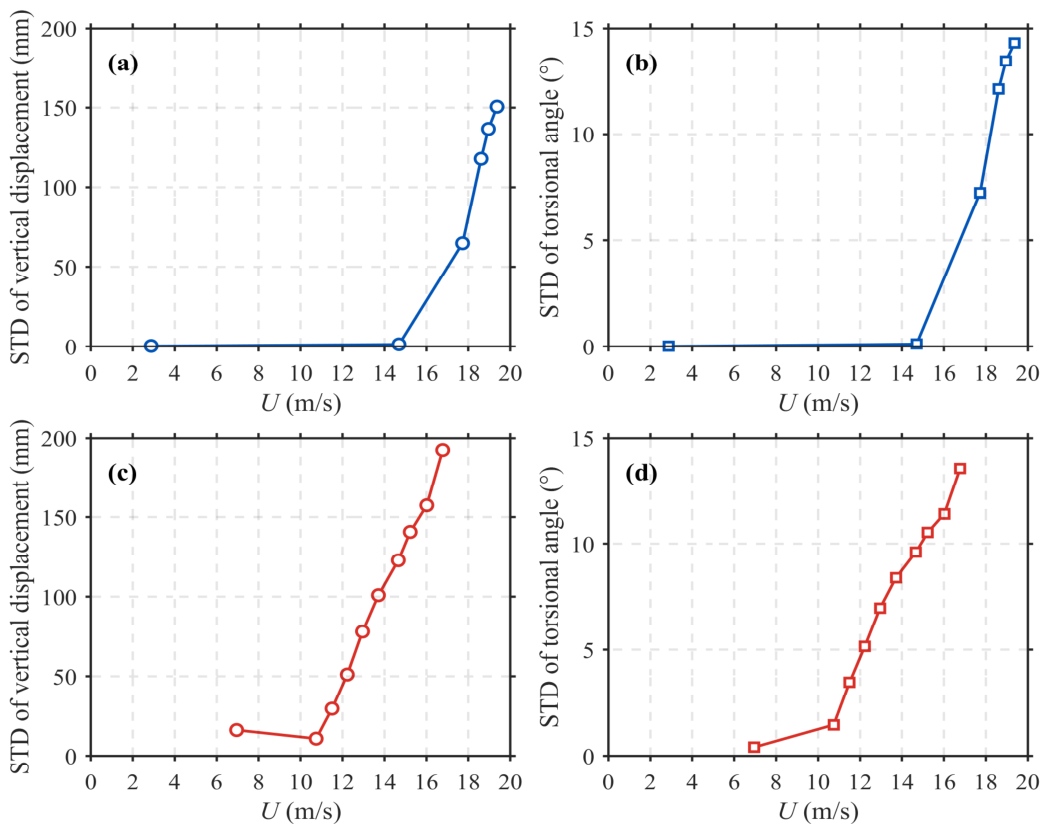
To further assess the aeroelastic contribution within the relevant wind-speed range, representative results from the complementary uniform-flow tests using the same aeroelastic model are presented in Figure 8. The 0° and 180° wind directions were selected because they correspond to the principal unfavorable directions identified from the turbulent-flow tests. Under uniform inflow, where broadband turbulent excitation is substantially reduced, pronounced wind-speed-dependent amplification is observed in both the vertical and torsional responses. At 0°, when the wind speed increases from 14.7 m/s to 17.7 m/s, the standard deviation of the vertical response at Mid-span Row 1 increases from 1.34 mm to 64.82 mm, while the torsional standard deviation increases from 0.12° to 7.24°. Under 180°, pronounced wind-speed-dependent amplification is also observed in both response components at Mid-span Row 6.
The uniform-flow response–wind-speed characteristics in Figure 8 provide direct response-based evidence that pronounced aeroelastic amplification occurs within the wind-speed range relevant to the turbulent-flow tests. Therefore, the frequency-selective response observed under turbulent inflow cannot be attributed solely to broadband turbulent excitation and structural resonance; self-excited aerodynamic effects also become significant within the corresponding wind-speed range.
This interpretation is consistent with previous studies of aeroelastic flutter and flexible cable-supported photovoltaic systems [10,38]. Wang et al. [10] identified flutter instability through flutter-derivative-based complex eigenvalue analysis and aeroelastic wind-tunnel verification, demonstrating that this type of lightweight flexible structure can exhibit aeroelastic instability at relatively low wind speeds. In addition, Gao et al. [39] identified the eight flutter derivatives of photovoltaic sections and demonstrated that vertical–torsional coupled terms in the self-excited force formulation are significant for tilt angles of 0–6°. Their results provide a physical basis for the participation of self-excited aerodynamic forces in coupled vertical–torsional vibration.
Nevertheless, the present turbulent-flow test campaign was designed primarily for buffeting-response characterization and did not include dedicated aerodynamic-damping identification or flutter-derivative extraction. Therefore, a critical flutter boundary is not determined from the turbulent-flow PSDs. Accordingly, the measured turbulent-flow response is interpreted as turbulence-induced buffeting with pronounced modal amplification, accompanied by non-negligible self-excited aeroelastic effects within the relevant wind-speed range.
Overall, the representative mid-span responses exhibit pronounced stochastic characteristics in the time domain, while the vertical and torsional components show different spectral features in the frequency domain. The vertical response is characterized by a broader energy distribution, whereas the torsional response shows relatively stronger frequency selectivity and modal amplification. These characteristics reflect the combined effects of turbulent excitation, structural modal response, and the aeroelastic contribution discussed above. Statistical measures are therefore further employed in the following sections to quantify the response intensity and its wind-direction dependence.

3.2. Vibration Characteristics of Side Span

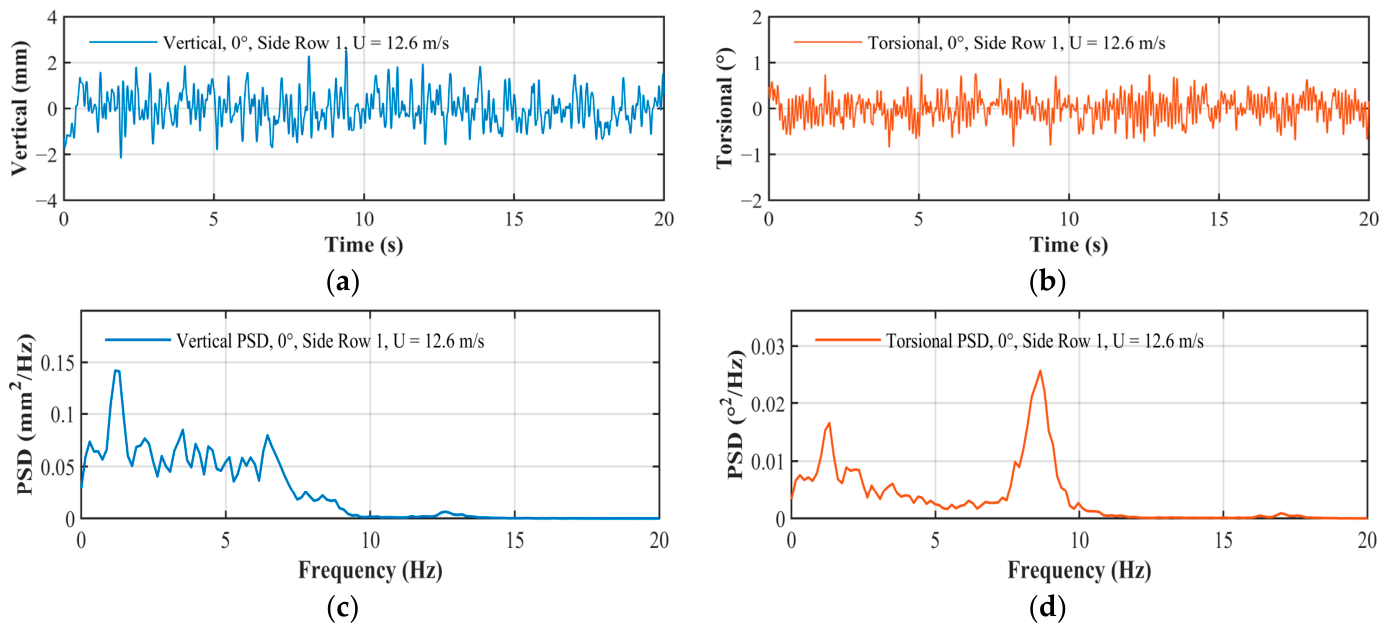
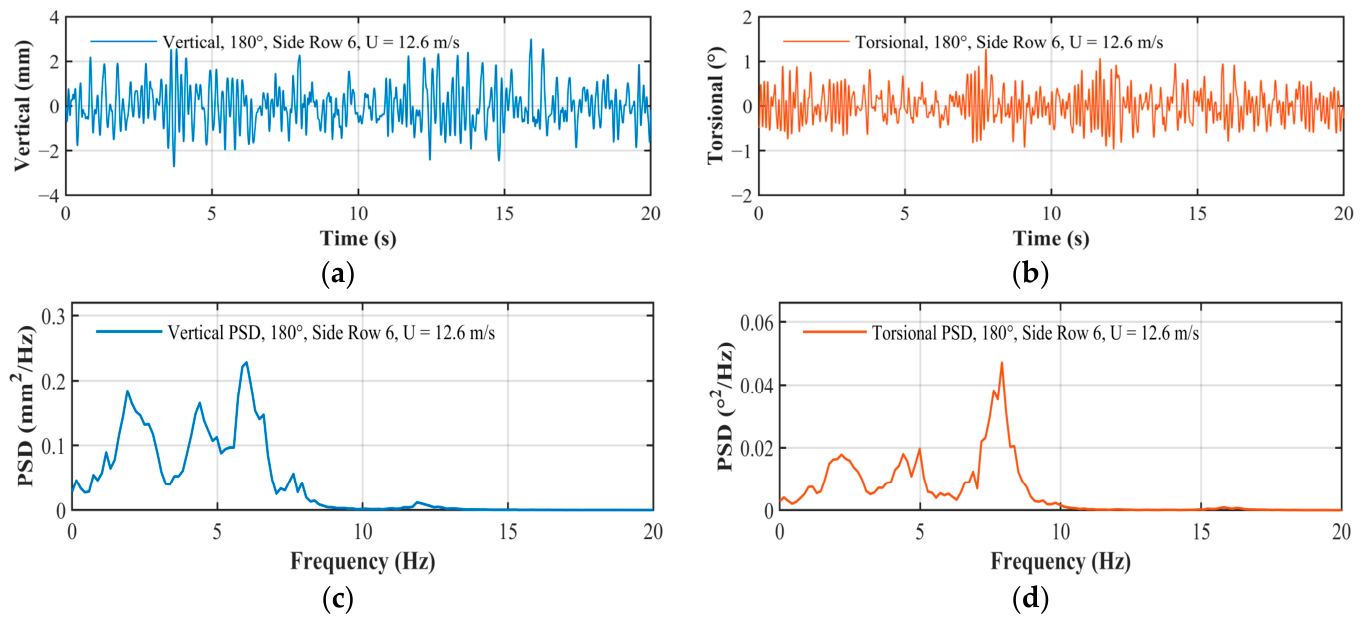
To examine the influence of different spatial positions on the buffeting response, representative time histories and PSD analyses at the side span are shown in Figure 9 and Figure 10. Figure 9 presents the response under the 0° wind direction, while Figure 10 presents the response under the 180° wind direction. The same two wind directions as those used in the mid-span analysis were selected to allow a direct comparison between the mid-span and side-span responses.
As shown in Figure 9a,b and Figure 10a,b, the side-span responses also exhibit irregular fluctuations without stable periodic patterns, showing pronounced stochastic characteristics under turbulent inflow. Compared with the mid-span, the side span has a shorter span length and therefore relatively higher structural stiffness and natural frequencies. These structural differences lead to smaller response amplitudes.
The PSD results in Figure 9c,d and Figure 10c,d show that both the vertical and torsional responses at the side span generally present more dispersed energy distributions than those at the mid-span. For the vertical component, the broadband feature is still evident, with response energy distributed over a relatively wide frequency range. For the torsional component, although local peaks can still be observed near the measured structural frequencies, the energy is not concentrated into a single dominant frequency as clearly as in the mid-span response.
The difference in spectral characteristics may be related to the shorter span length, higher structural stiffness, and slightly higher measured natural frequencies of the side span. Under the same incoming wind speed, the side-span spectra exhibit weaker frequency concentration and a relatively broader energy distribution than the corresponding mid-span spectra. Therefore, compared with the mid-span, the side-span response exhibits a relatively stronger broadband component and less pronounced modal amplification. These observations demonstrate that spanwise position affects the spectral distribution of the wind-induced response and provide a basis for the subsequent statistical analysis of RMS response, peak displacement, and wind-induced vibration coefficient.

3.3. Spatial Distribution of RMS Buffeting Responses

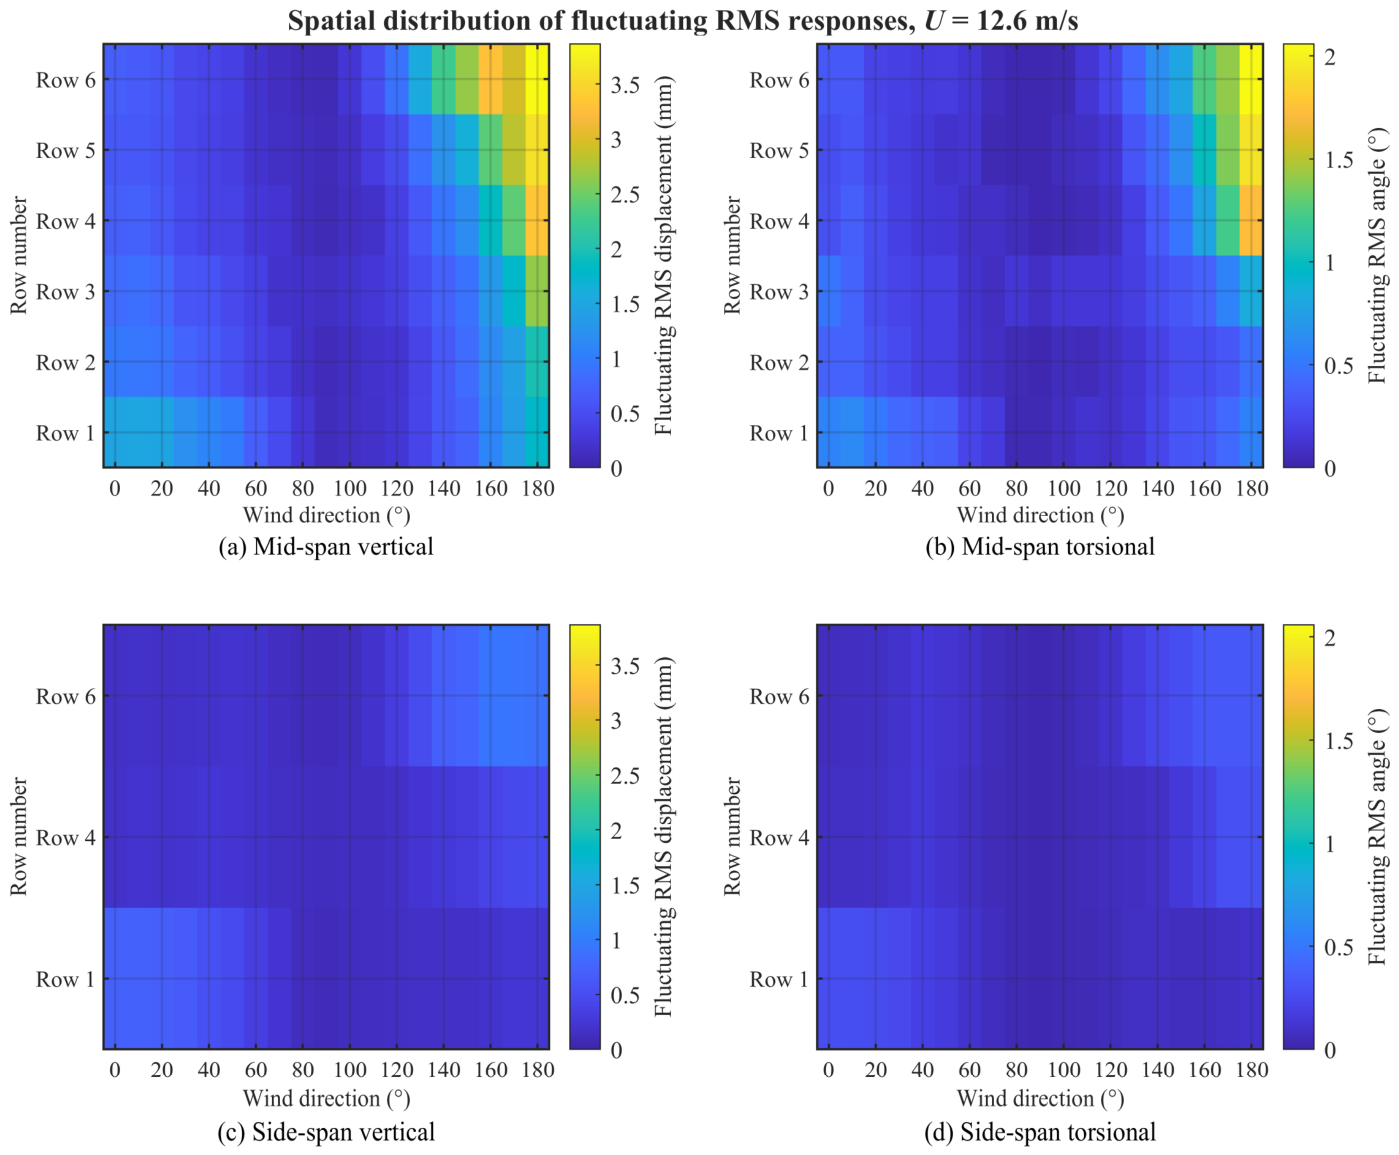
The representative time histories and PSDs in Section 3.1 and Section 3.2 reveal the basic stochastic characteristics at selected wind directions. To further examine the spatial distribution of buffeting intensity over the tested wind-direction range, the fluctuating root-mean-square (RMS) responses of the unreinforced array were calculated and compared, as shown in Figure 11. The fluctuating RMS response was evaluated using the standard deviation of the measured displacement time history after removing the mean component.
For the vertical component, the mid-span generally shows larger fluctuating RMS responses than the side span under the selected low-wind-speed condition. The RMS values at the mid-span increase as the wind direction approaches 180°, and larger values are mainly observed near the windward-side rows. This indicates that the absolute fluctuating vertical response is strongly affected by incoming-flow direction and row position. For the torsional component, the mid-span also exhibits larger RMS levels than the side span in most wind directions. Compared with the vertical response, the torsional RMS distribution shows clearer spatial non-uniformity, suggesting that the torsional fluctuation is more sensitive to row position and wind direction. The relatively smaller side-span RMS levels may be related to the shorter span length, higher stiffness, and slightly higher measured natural frequencies of the side span.
These results, together with the irregular time-history characteristics discussed above, further demonstrate the pronounced fluctuating-response characteristics of the structure under turbulent inflow. The RMS distribution provides a baseline description of absolute fluctuating-response amplitudes. In the following section, the wind-induced vibration coefficient is further used to evaluate the relative fluctuation intensity, while peak displacement responses are used to identify the governing wind directions.

4. Wind-Direction-Dependent Statistical Response Under Turbulent Inflow

4.1. Wind-Induced Vibration Coefficient

The wind-induced vibration coefficient is commonly used to describe the dynamic amplification effect of fluctuating wind loads and to support equivalent static response evaluation in structural design. For flexible photovoltaic systems under turbulent inflow, this coefficient provides a dimensionless measure of the relative fluctuation intensity of the measured displacement response. The wind-induced vibration coefficient G u is expressed as
G u = u m a x u ¯ = 1 + g σ u u ¯
In the equation, u m a x represents the peak displacement due to wind-induced buffeting, u ¯ represents the mean wind vibration response, σ u represents the standard deviation of the fluctuating displacement response, and g represents the peak factor. In this study, the standard deviation and mean value of the photovoltaic modules are obtained from the displacement time history measured by the laser displacement sensor, with the peak factor set to 3.5.
It should be noted that the wind-induced vibration coefficient is a ratio-based indicator and is sensitive to the magnitude of the mean response. When the mean displacement approaches zero, a small denominator may lead to unrealistically large coefficient values, even though the corresponding absolute displacement response remains limited. To avoid misleading interpretation, an applicability criterion was introduced in this study. For each measurement point and each response component, the wind-induced vibration coefficient was considered valid only when the absolute mean response at a given wind direction satisfied
x ¯ θ i η x ¯ r e f
where x ¯ r e f is defined as
x ¯ r e f = max θ j Θ x ¯ θ j
Here, Θ denotes the set of all tested wind directions under the same wind speed, structural configuration, measurement point, and response component. The threshold η determines whether the mean response at a given wind direction is sufficiently large for a ratio-based coefficient to be meaningfully interpreted. A sensitivity analysis was performed using η = 0.01, 0.025, 0.05, 0.075, and 0.10. The principal wind-directional and row-wise characteristics remained consistent within the intermediate range of η = 0.025–0.075, although the number of applicable cases decreased as the threshold increased. At η = 0.05, 88.89% and 90.74% of the complete wind-direction cases remained applicable for the vertical and torsional responses, respectively. Therefore, η = 0.05 was adopted as a practical balance between limiting artificially amplified ratios associated with near-zero mean responses and retaining sufficient data for directional interpretation.
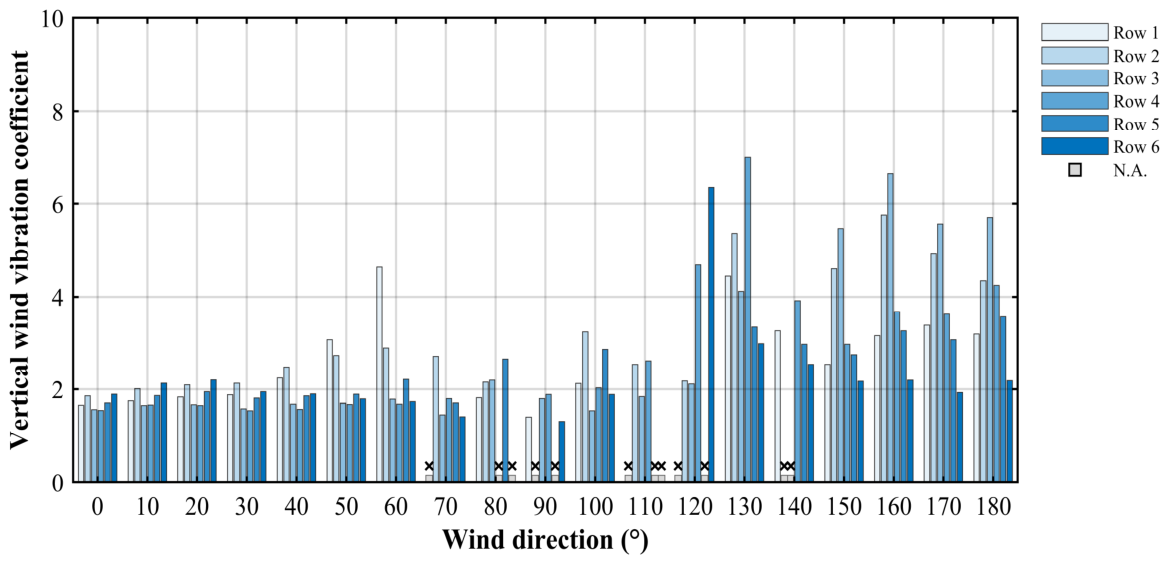
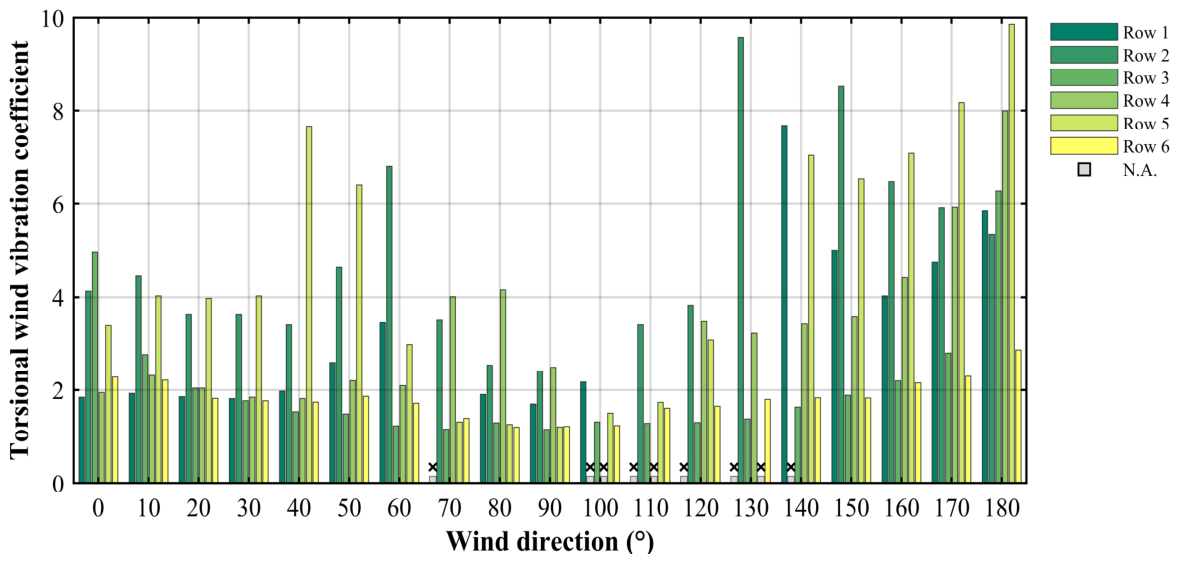
Cases not satisfying this criterion were retained in the original dataset but marked as not applicable (N.A.) in the wind-induced vibration coefficient analysis. In the corresponding figures, these cases are shown as gray bars marked with “×”. The applicability criterion affects only the ratio-based G u analysis; all measured cases are retained in the RMS and peak-response analyses. Accordingly, the identification of governing wind directions and unfavorable absolute-response conditions is independent of the adopted threshold.

4.2. Wind-Directional Variation in Relative Fluctuation Intensity

Figure 12 presents the vertical wind-induced vibration coefficients under different wind directions. According to the definition and applicability criterion introduced in Section 4.1, the wind-induced vibration coefficient is interpreted in this section as an indicator of relative fluctuation intensity. Cases marked as N.A. are not used for coefficient-based trend interpretation. Overall, the wind direction angle has a clear influence on the vertical wind-induced vibration coefficient, indicating that the relative fluctuation intensity of the vertical response varies with incoming-flow direction. In the range of 0–90°, the applicable coefficients of most rows generally range from 1.5 to 3.0. Within this range, most applicable coefficients remain at relatively low to moderate levels, with generally limited row-to-row differences, although local increases occur under several oblique wind directions. Among the rows, Row 2 frequently exhibits slightly higher coefficient values than several other rows, indicating locally enhanced relative fluctuation intensity.
In the range of 90–180°, the vertical wind-induced vibration coefficients are generally higher than those in the 0–90° range for several rows, suggesting that the relative fluctuation intensity becomes more pronounced under these incoming-flow directions. The coefficients also show stronger wind-directional variation in this range. Local increases can be observed under several oblique wind directions, especially around 50–60° and 110–150°. These local increases indicate enhanced relative fluctuation intensity under the corresponding wind directions, but they should not be directly interpreted as larger absolute displacement responses.
Figure 13 presents the variation characteristics of the torsional wind-induced vibration coefficient of the structure under different wind direction angles at a wind speed of 12.6 m/s. Compared with the vertical coefficients, the torsional coefficients exhibit more pronounced row-to-row differences and stronger wind-directional variability, indicating that the relative fluctuation intensity of the torsional response is more spatially non-uniform under turbulent inflow.
In the 0–90° range, the torsional wind-induced vibration coefficients are generally higher than the corresponding vertical coefficients. In particular, Row 2 and Row 5 frequently exhibit relatively high applicable coefficients, with many values exceeding 3.0, although elevated values can also occur in other rows depending on wind direction. This suggests that the torsional relative fluctuation intensity is more sensitive to row position than the vertical component. The windward-row coefficients are generally lower than those of several interior rows, indicating pronounced spatial non-uniformity in the torsional relative fluctuation intensity.
In the 90–180° range, the torsional coefficient distribution becomes more irregular. The coefficients decrease near the 90° condition for several rows, while several rows, including Row 2, exhibit elevated coefficients at multiple wind directions within the 110–180° range, but the variation is non-monotonic. Local increases also appear in the ranges of approximately 40–60° and 110–150°, which are broadly consistent with the vertical coefficient results. These results indicate that the relative fluctuation intensity of the torsional response is strongly dependent on wind direction and row position.
Overall, compared with the vertical coefficients, the torsional wind-induced vibration coefficients show stronger row-to-row variation and wind-direction dependence. Relatively high applicable coefficients are frequently observed in the interior rows, particularly Row 2 and Row 5, whereas the windward-row coefficients are generally lower. This indicates that the relative fluctuation intensity of the torsional response is more spatially non-uniform and more sensitive to row position under turbulent inflow.

4.3. Peak Displacement Responses and Governing Wind Directions

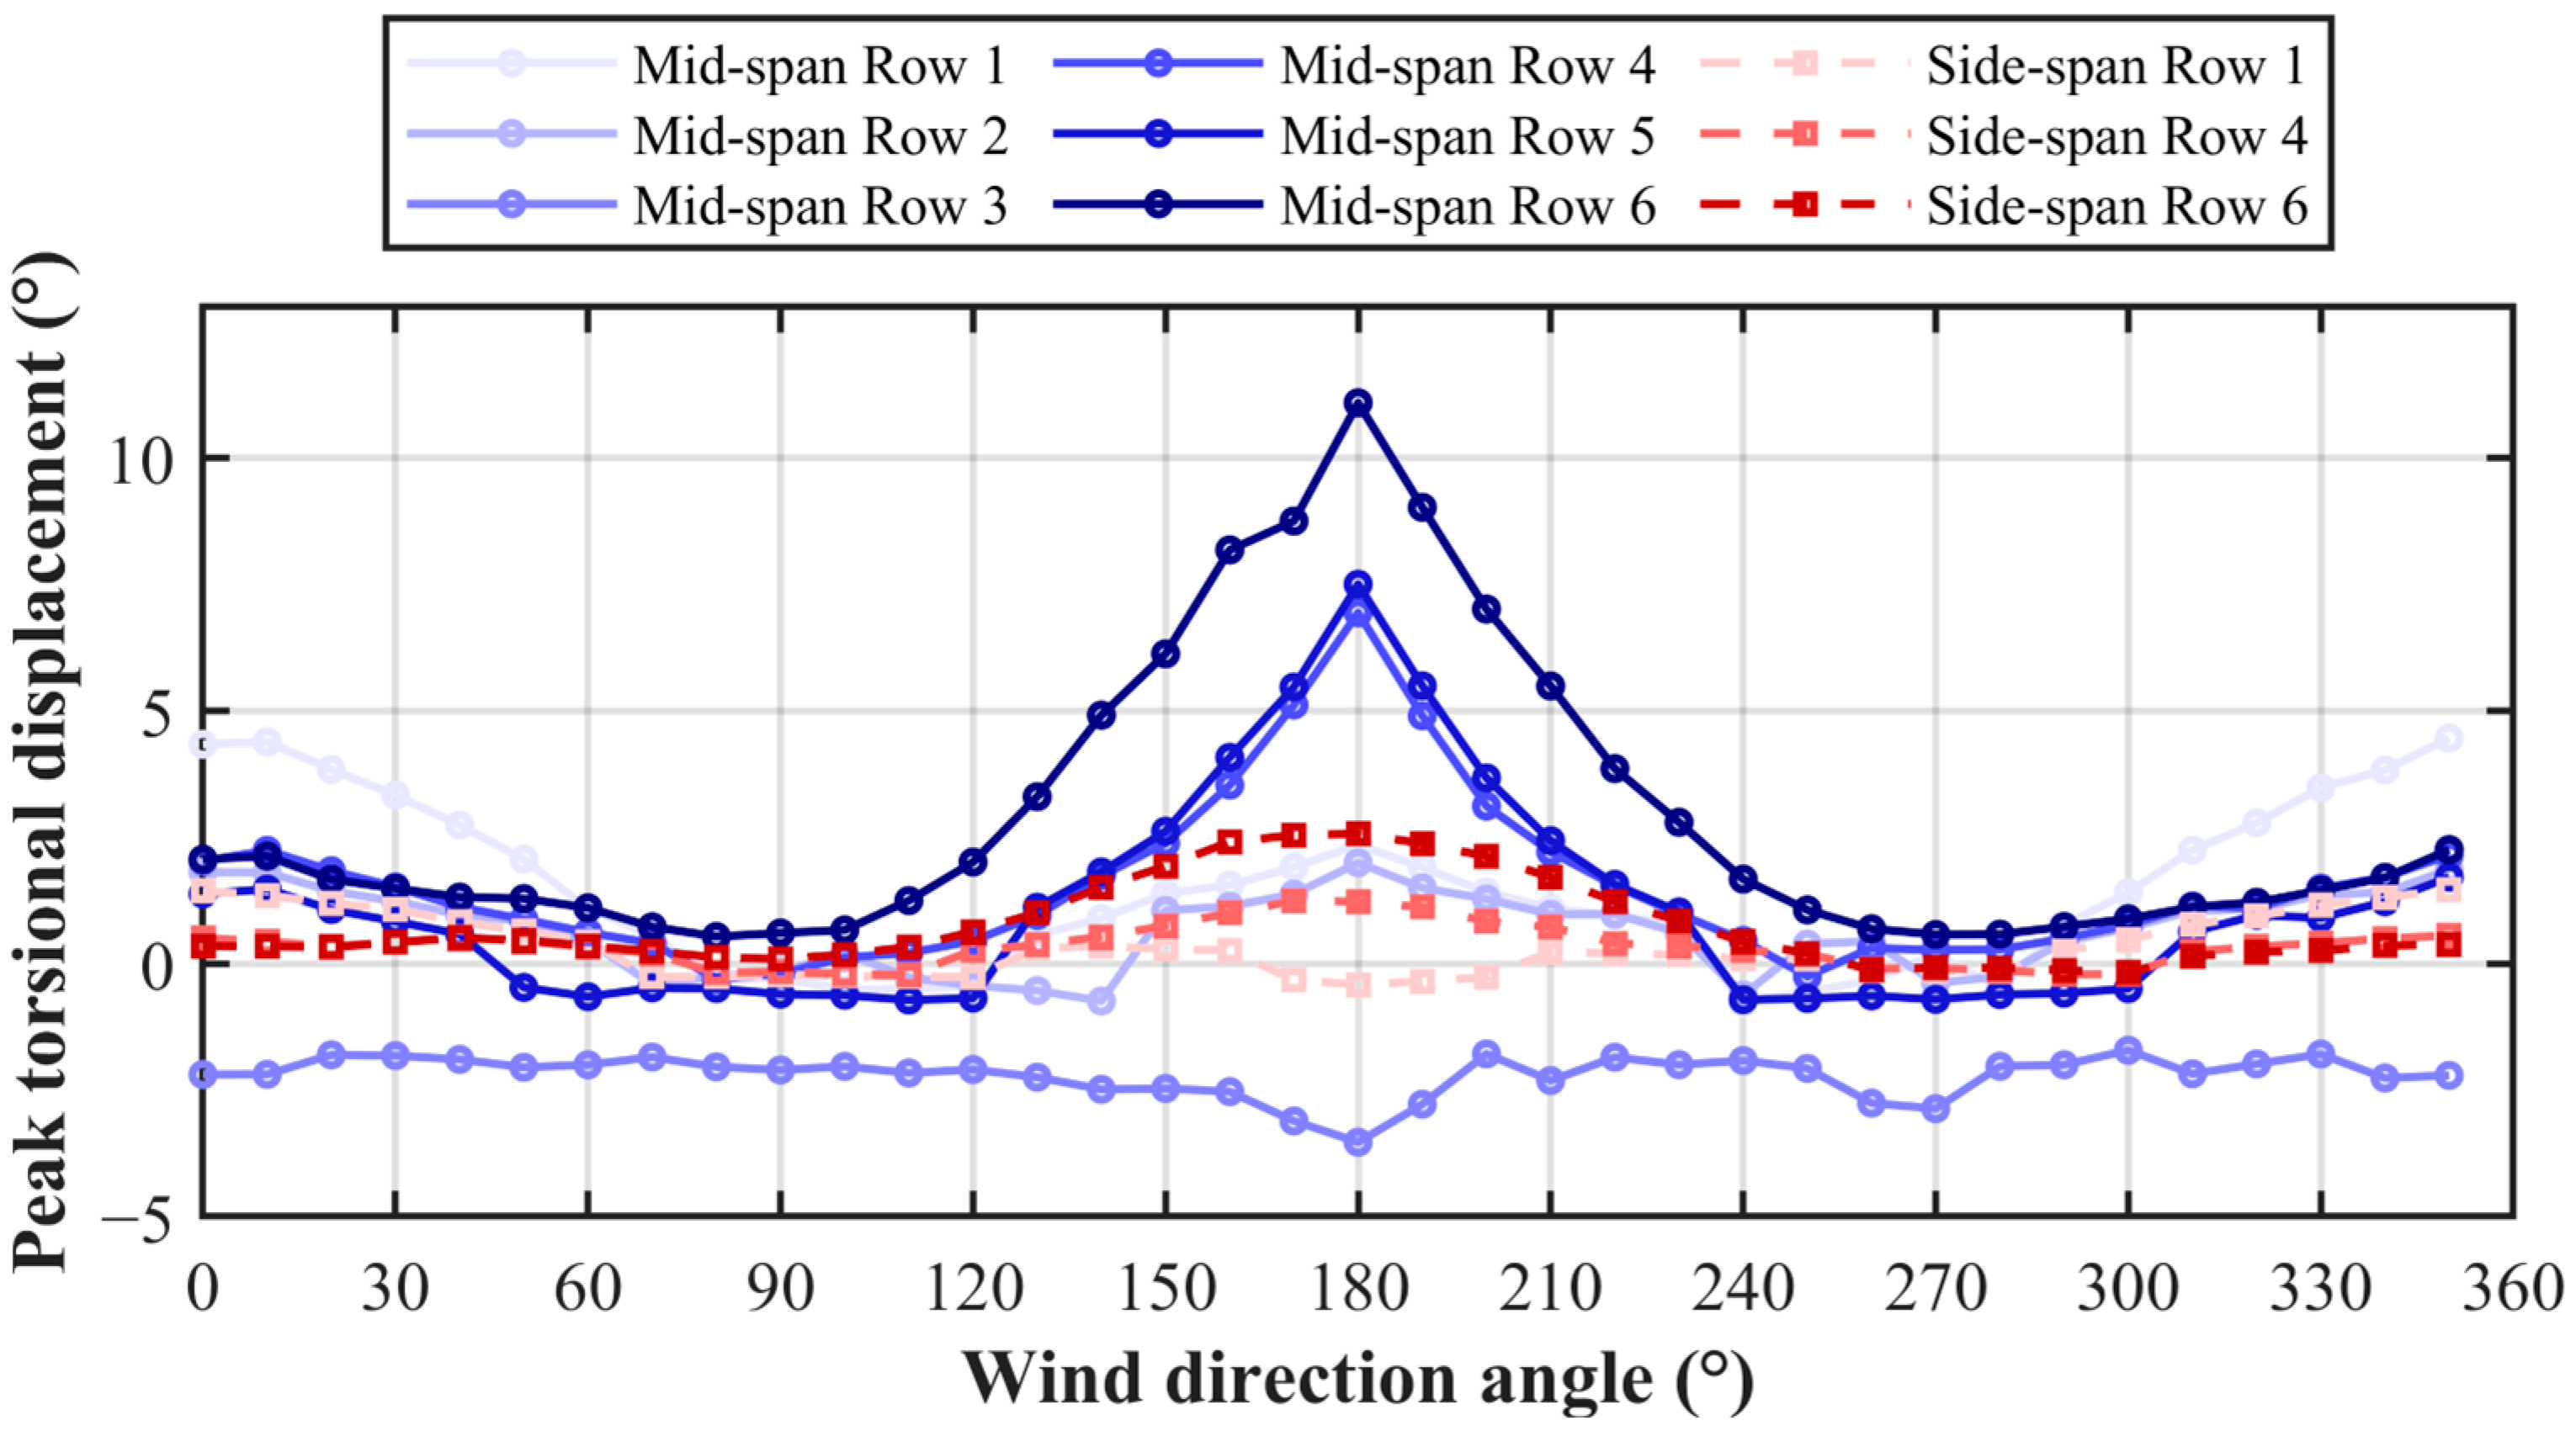
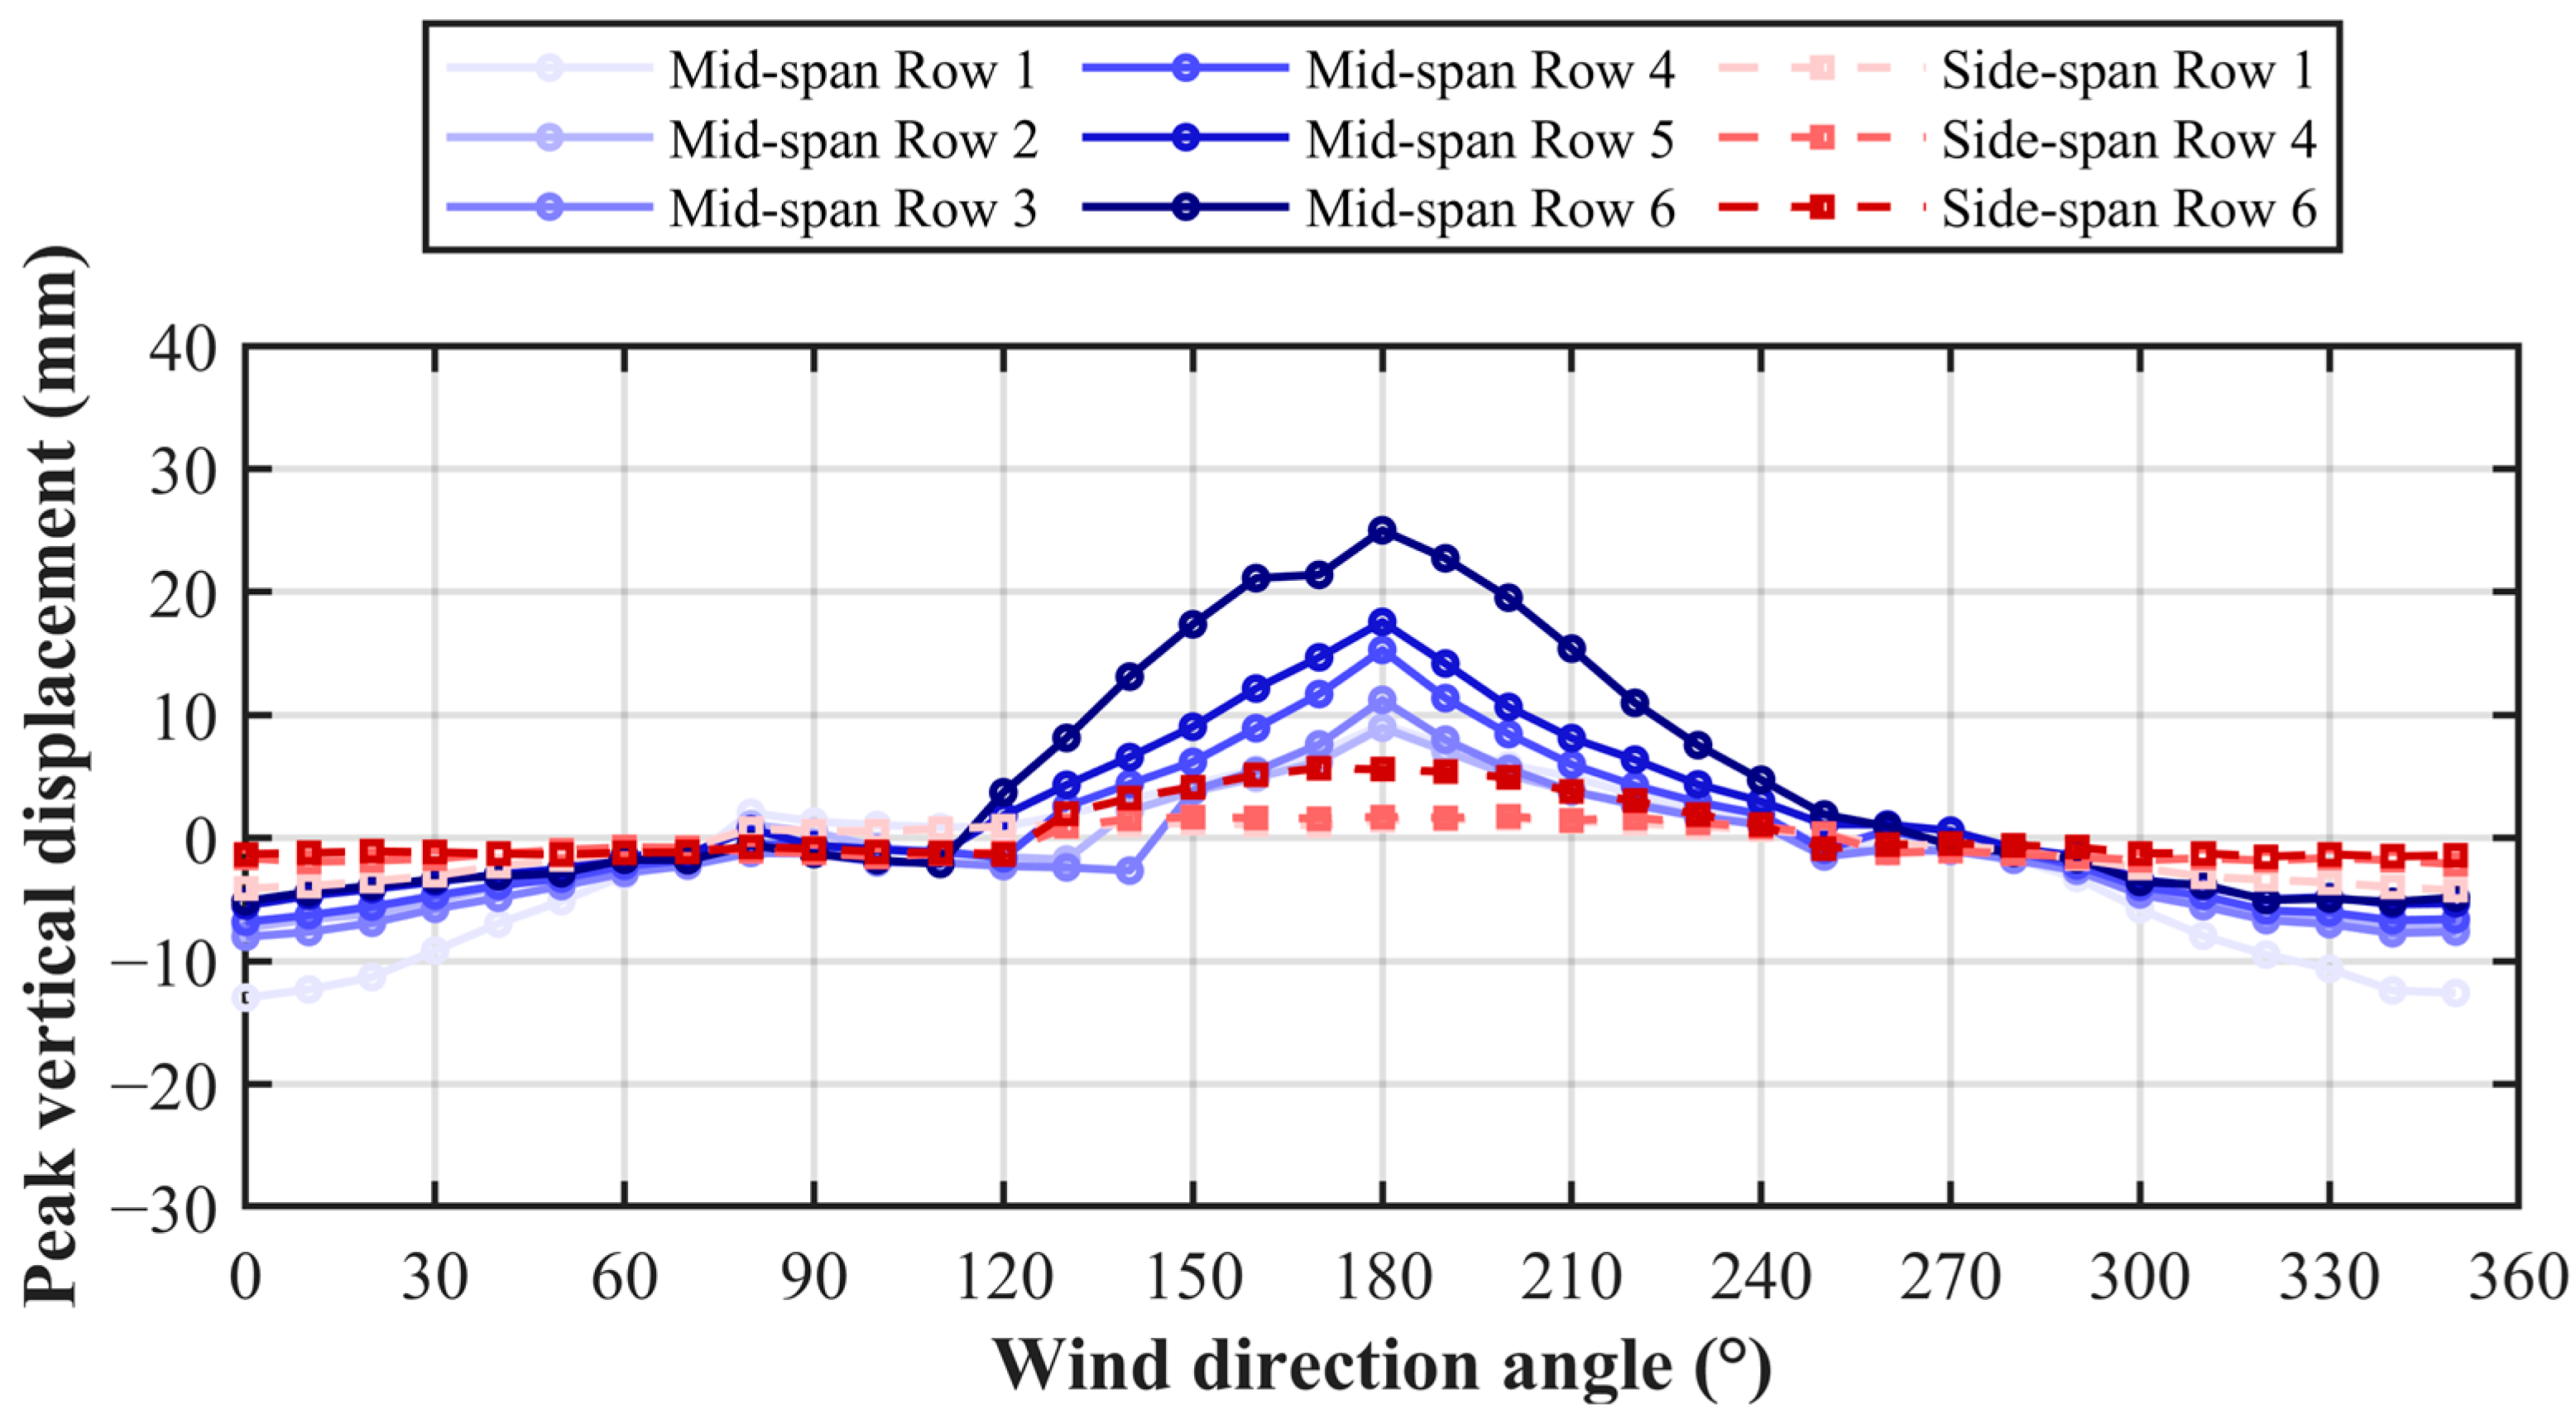
Figure 14 and Figure 15 present the peak displacement responses under different wind directions at a wind speed of 12.6 m/s. Unlike the wind-induced vibration coefficient, which is a ratio-based indicator of relative fluctuation intensity, the peak displacement response is more directly related to structural safety. In this study, the peak response was estimated from the measured displacement time histories as
u p = u ¯ + g σ u
where u ¯ is the mean displacement, σ u is the standard deviation of the fluctuating displacement response, and g is the peak factor. It should be noted that this calculation does not depend on the applicability of the wind-induced vibration coefficient. Therefore, cases marked as N.A. in the coefficient analysis are still included in the peak-response evaluation.
As shown in Figure 14, the vertical peak displacement exhibits clear wind-direction dependence. In the 0–90° range, the response generally decreases with increasing wind direction angle, whereas in the 90–180° range, it gradually increases as the wind direction approaches 180°. This trend indicates that the two opposite incoming-flow directions, 0° and 180°, produce the largest vertical peak responses within the tested wind-direction range. Therefore, the opposite wind directions of 0° and 180° can be regarded as the primary governing conditions for the overall structural response, although the dominant direction may vary depending on the response component. Among the rows, Row 1 dominates in the 0–90° range, while Row 6 becomes dominant in the 90–180° range. This indicates that the vertical peak response is closely related to the windward-side position of the array under turbulent inflow.
For the torsional peak displacement shown in Figure 15, the response also exhibits obvious wind-directional and row-wise variations. Similar to the vertical response, relatively large torsional peak responses can be observed near the 0° and 180° wind directions. However, compared with the vertical response, the torsional peak response shows more pronounced local variation under oblique wind directions. In particular, Row 3 maintains relatively large torsional peak responses under some oblique wind directions, especially within approximately 60–120°. This indicates that, although 0° and 180° remain the main governing directions from the overall peak-response distribution, certain oblique wind directions should also be considered in torsional response evaluation. The comparison between the mid-span and side-span results indicates that both locations exhibit similar wind-directional trends in peak displacement, but their response magnitudes and row-wise distributions are not identical.
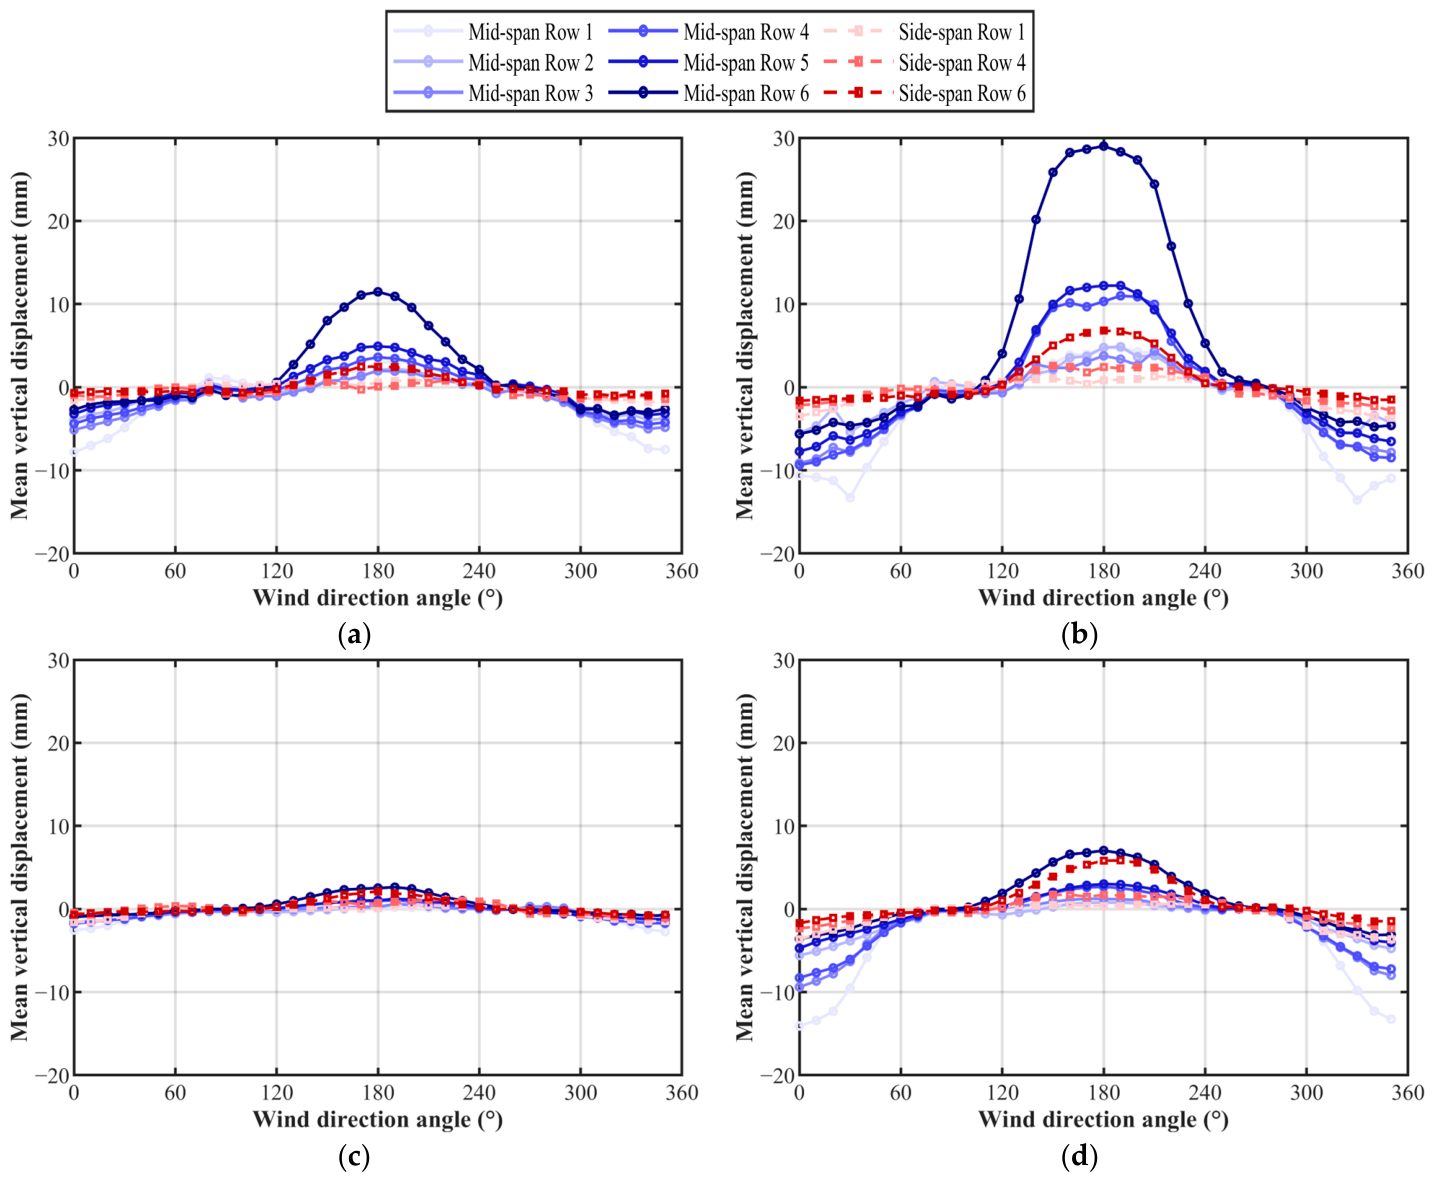
Considering the complete wind-direction range, Figure 14 and Figure 15 further show broadly corresponding directional variations between the 0–180° and 180–350° sectors. For the vertical response, the response magnitude generally increases from the vicinity of 90° toward 180° and decreases again from 180° toward 270°. The response levels within 270–350° are generally comparable to those within 0–90°. A similar overall directional tendency is observed for the torsional response, although stronger row-wise and local variations occur under several oblique wind directions. The full-direction mean and fluctuating responses presented in Figure 16, Figure 17, Figure 18 and Figure 19 show similar overall directional characteristics.
Therefore, the 0–180° range is adopted for detailed discussion as a representative directional range, while the complete 0–350° dataset is used for identifying the governing response conditions.

5. Control Measures for Buffeting Suppression

5.1. Comparative Analysis of Mean Displacement Response

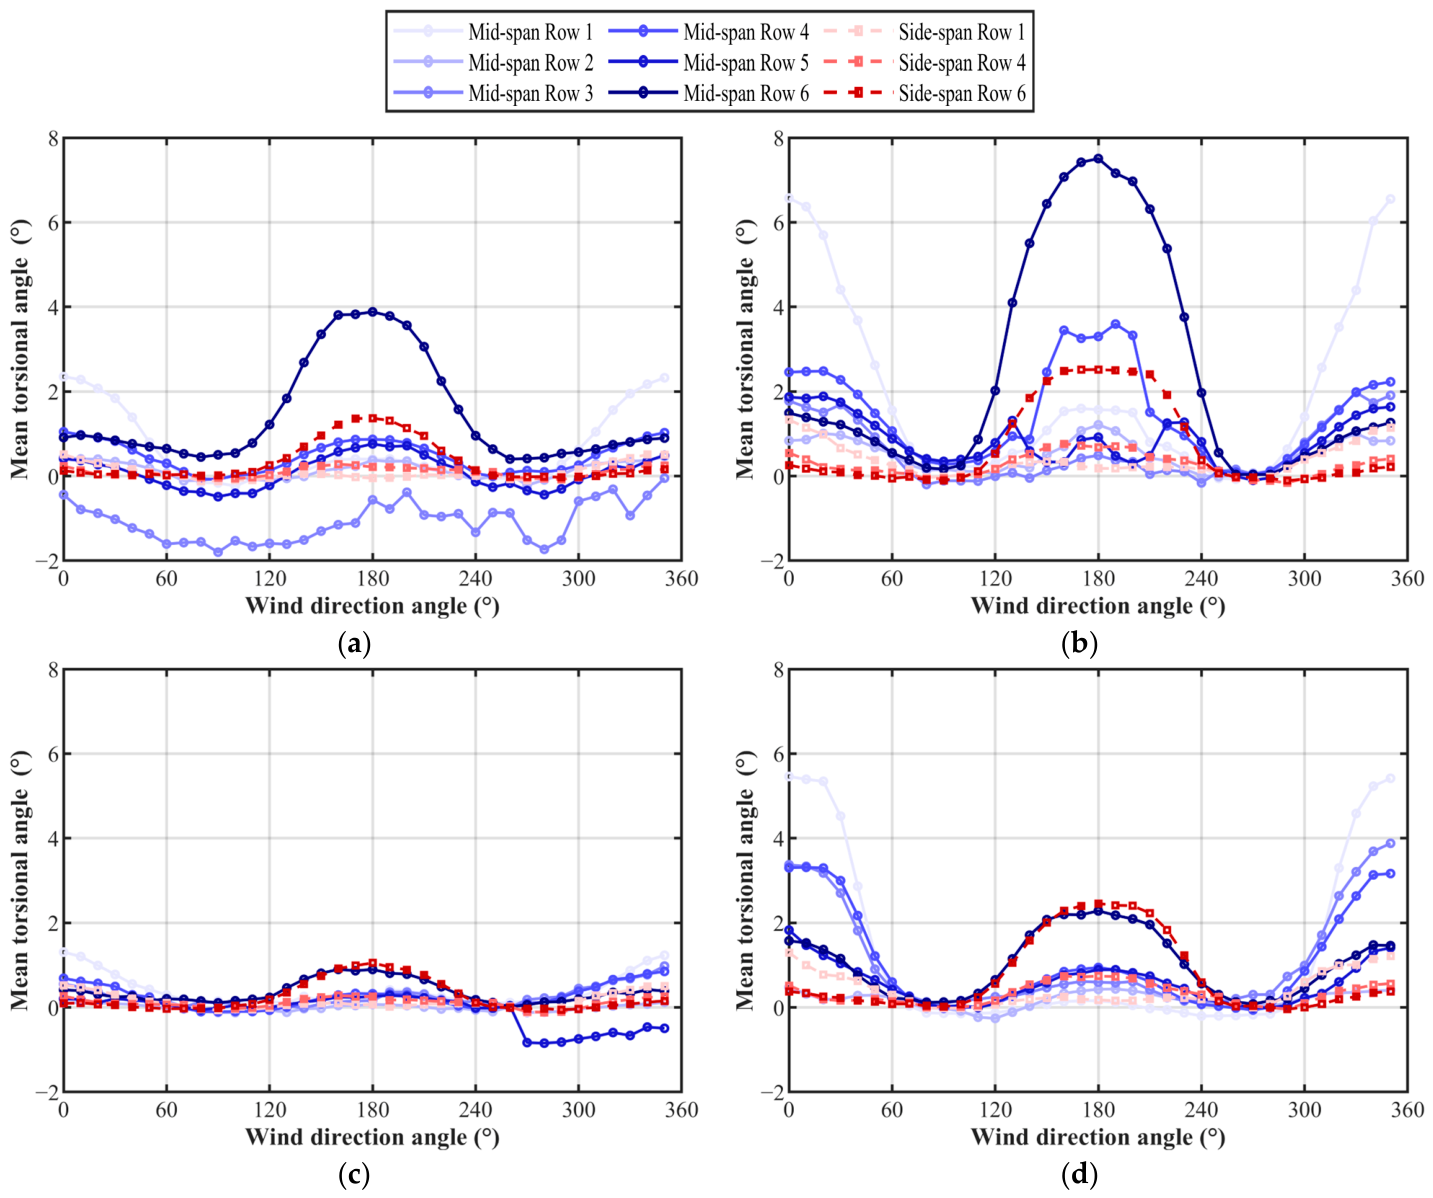
To evaluate the effect of reinforced cables on the overall deformation of the structure, the vertical and torsional mean displacements under reinforced and unreinforced conditions are compared in Figure 16 and Figure 17. Under the unreinforced condition at a wind speed of 19.0 m/s, the maximum mean vertical displacement reaches 0.29 m, corresponding to a model-scale displacement of 29 mm. After reinforcement, this value decreases to 0.03 m under the same wind speed and remains only 0.07 m even when the wind speed increases to 31.6 m/s, indicating that the reinforced cables can effectively reduce the overall mean deformation.
The reduction effect varies with wind direction and spatial position. Based on the peak-response analysis in Section 4, 0° and 180° are identified as the primary governing wind directions, where the reinforcement shows a more pronounced suppression effect. However, the reduction is relatively limited under some oblique wind directions. The governing condition for the maximum mean vertical displacement shifts from 180° before reinforcement to 0° after reinforcement. This shift may be related to the asymmetric restraint effect of the reinforced cables: when the structure undergoes downward displacement, the cables may partially slacken and therefore provide weaker restraint against vertical deformation.
The impact of reinforcement measures on the torsional mean displacement is relatively complex. Under certain wind direction angles, the torsional mean displacement decreases, but the overall change is smaller than that of the vertical response, indicating that the reinforcement measures have a relatively limited effect on controlling torsional deformation. This suggests that, in addition to the structural stiffness, the torsional response is closely related to factors such as the incoming flow and inter-row interference. Furthermore, the governing condition for the torsional mean displacement shifts noticeably before and after reinforcement, from the 180° wind direction angle under the unreinforced condition to the 0° wind direction angle under the reinforced condition. This change pattern is consistent with the vertical displacement response.

5.2. Comparative Analysis of Fluctuating Displacement Response

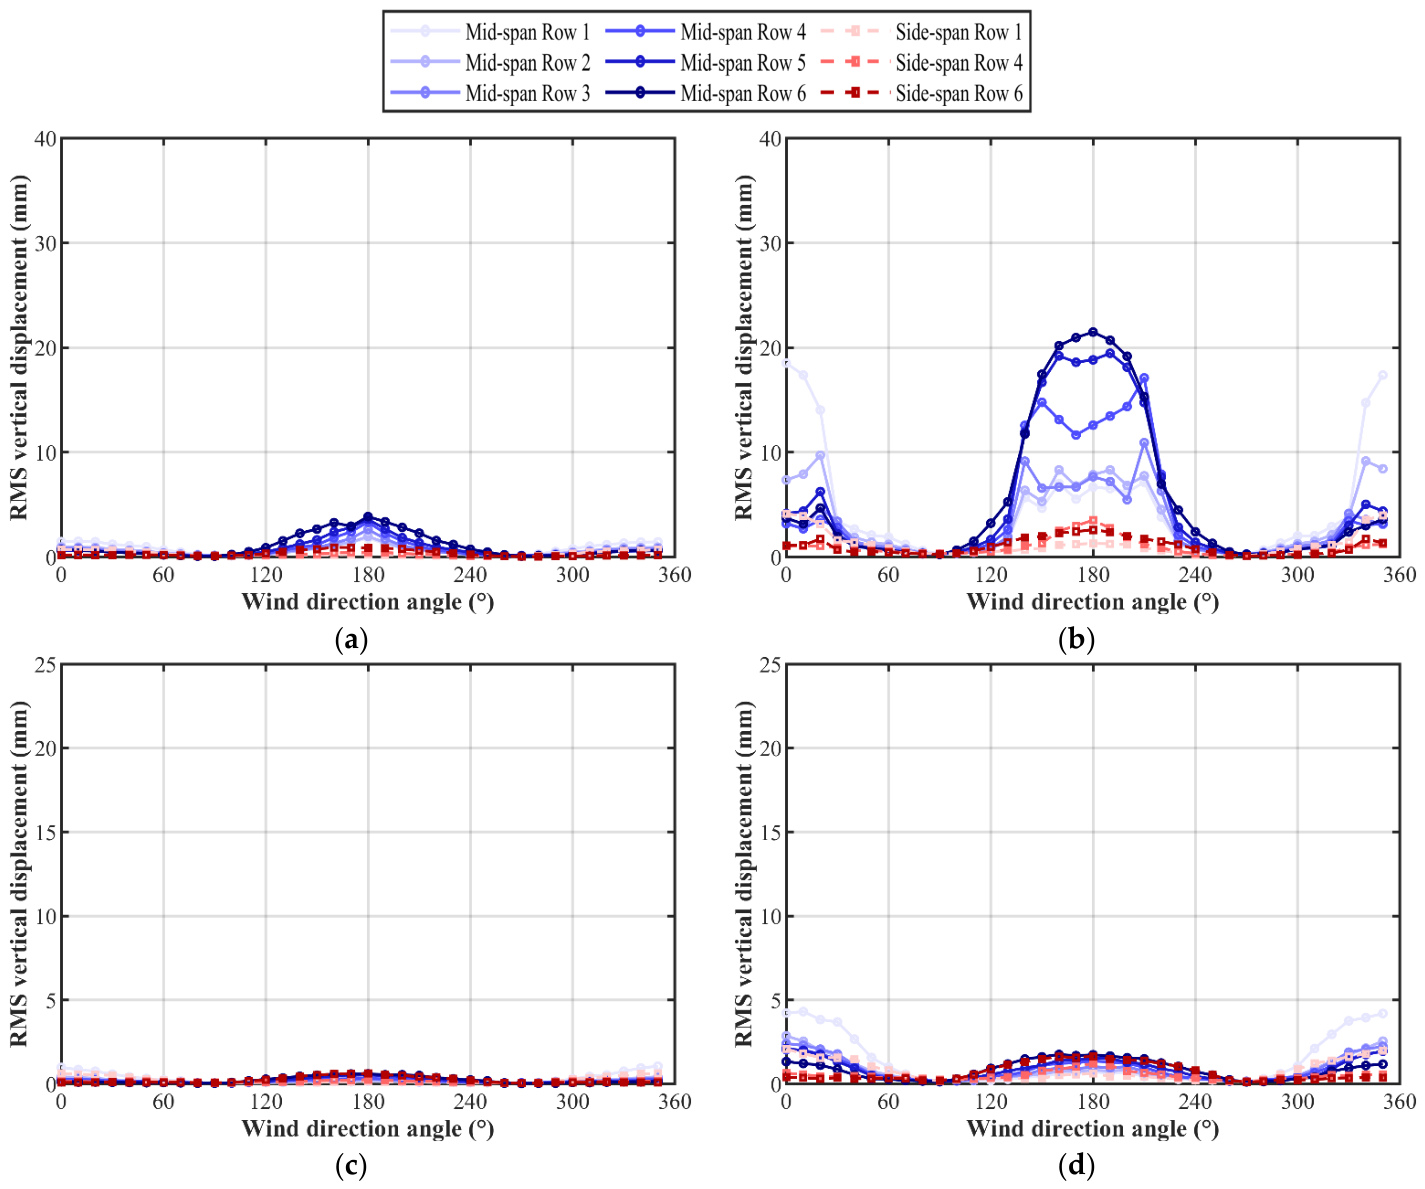
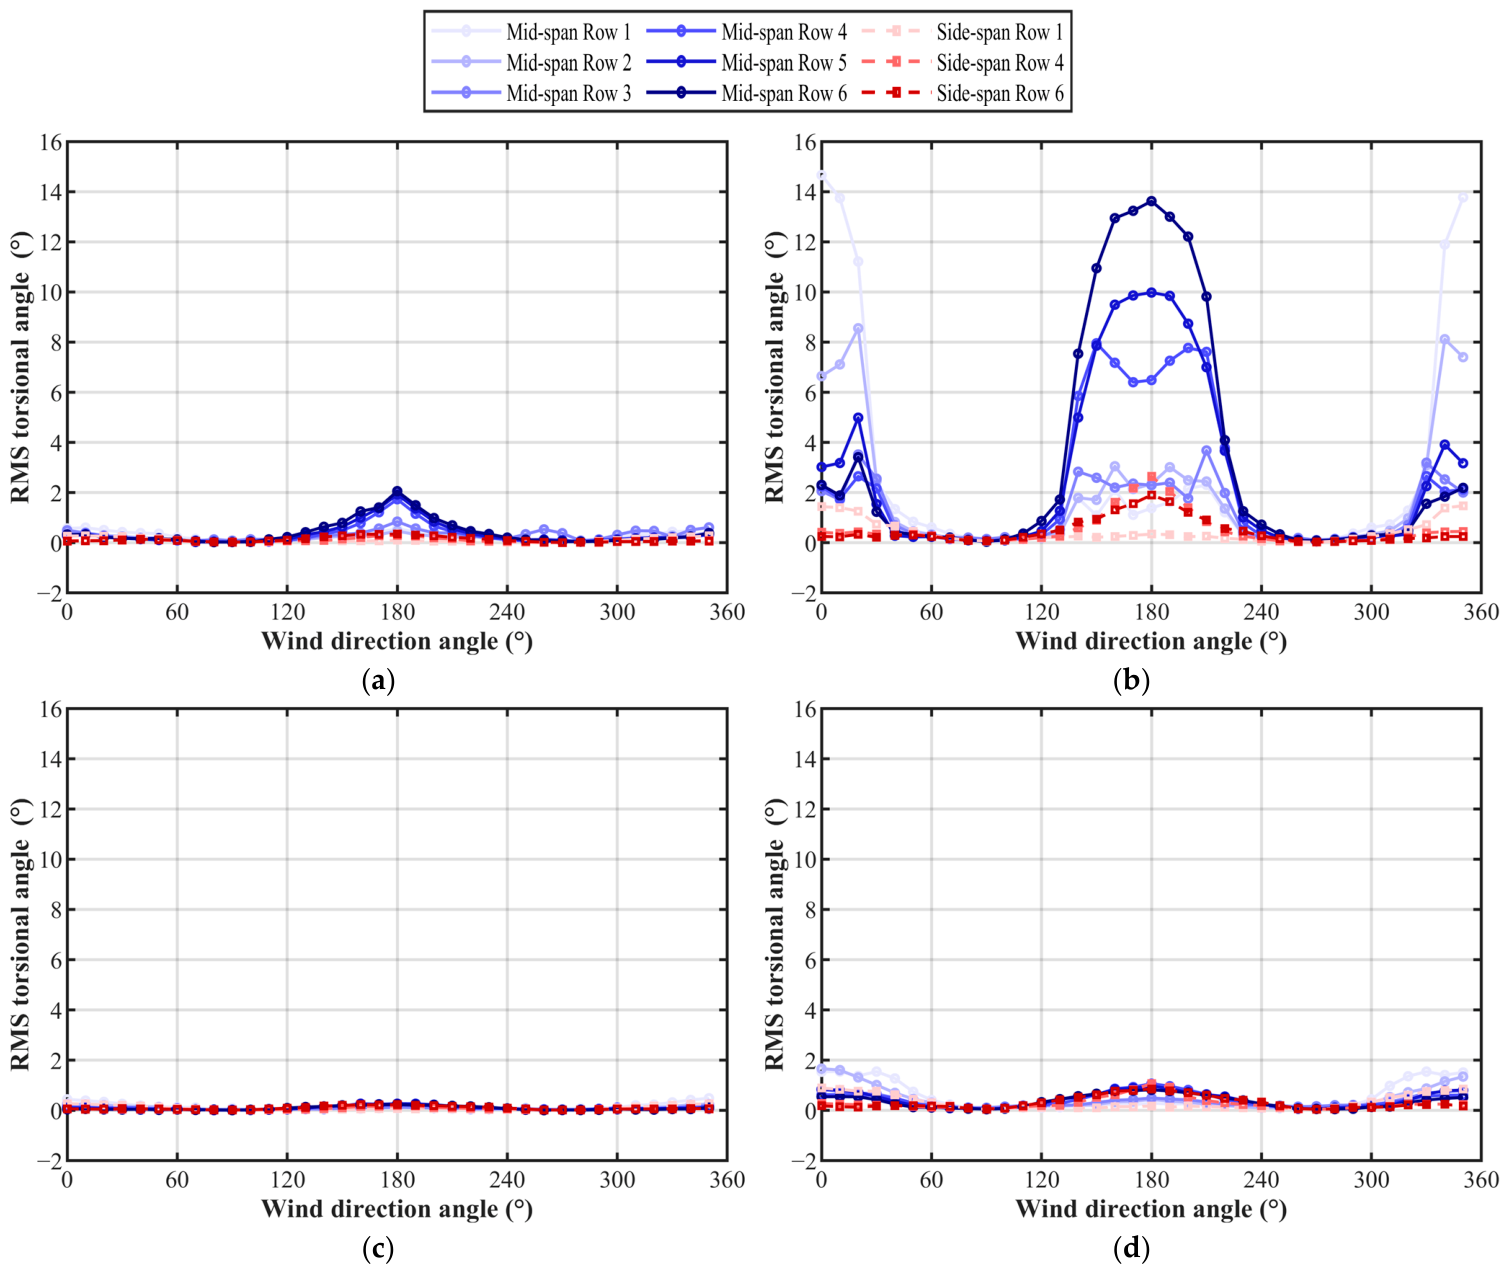
To further evaluate the effectiveness of the reinforcement measure in controlling the buffeting response of the structure, a comparative analysis was conducted on the fluctuating displacement values at all measurement points. The results show that, compared with the mean displacement, the reinforcement measure has a more pronounced effect on the fluctuating response, indicating a higher effectiveness in suppressing vibration fluctuations of the structure. This suggests that the reinforcement measure mainly reduces the response fluctuations induced by turbulent excitation by modifying the dynamic characteristics of the structure.
To quantitatively evaluate the mitigation efficiency of the reinforced cables, the reduction rate of the fluctuating response was defined as
R σ = σ U σ R σ U × 100 %
where σ U and σ R denote the standard deviations of the fluctuating responses under the unreinforced and reinforced configurations, respectively. The reduction rate was evaluated by comparing Cases C2 and C3 at the same wind speed of 19.0 m/s, wind direction, measurement point, and response component.
For both the vertical and torsional fluctuating responses, clear reductions were observed after reinforcement over all evaluated wind directions and measurement points at U = 19.0 m/s. The maximum reduction rate of the vertical fluctuating response was 98.58%, occurring at Mid-span Row 1 under the 210° wind direction, where the standard deviation decreased from 7.14 mm to 0.10 mm. For the torsional fluctuating response, the maximum reduction rate was 98.72%, occurring at Mid-span Row 6 under the 20° wind direction, where the standard deviation decreased from 3.41° to 0.04°. Thus, the overall maximum reduction rate was 98.72%, corresponding to the torsional response.
It should be noted that the wind directions associated with the maximum percentage reduction do not necessarily coincide with the governing wind directions identified from the absolute response magnitude. As discussed in Section 4, the 0° and 180° wind directions produce the principal extreme responses and therefore remain particularly important for design-oriented evaluation. At 0°, the maximum unreinforced vertical and torsional fluctuating responses occurred at Mid-span Row 1 and were reduced by 94.70% and 96.98%, respectively, after reinforcement. At 180°, the corresponding governing responses occurred at Mid-span Row 6 and were reduced by 97.19% and 98.27%, respectively. Meanwhile, a comparison between the two governing wind directions shows that the reduction rate at 180° is generally higher than that at 0°, indicating a certain wind-direction dependence of the control effectiveness. Nevertheless, substantial reductions are achieved at both governing wind directions, demonstrating that the reinforced cables remain effective under the most unfavorable response conditions.

6. Conclusions

Based on aeroelastic wind tunnel tests under a simulated atmospheric boundary-layer flow, this study investigated the buffeting-response characteristics of a cable-supported flexible photovoltaic system and the mitigation performance of reinforced cables. The main conclusions are as follows:
(1) Under turbulent inflow, the structural response exhibits pronounced stochastic and multi-frequency characteristics. The vertical response shows a broadband spectral distribution, whereas the torsional response exhibits stronger energy concentration near the measured structural frequencies, indicating more pronounced torsional modal amplification. Combined with the corresponding uniform-flow response characteristics across wind speed, these results indicate that self-excited aerodynamic forces also contribute to the amplified response within the relevant wind-speed range. Therefore, the measured turbulent response is characterized primarily by turbulence-induced buffeting with modal amplification, accompanied by non-negligible self-excited aeroelastic effects.
(2) The wind-induced vibration coefficient shows a clear dependence on wind direction and row position. Vertical coefficients are generally within 1.5–3.0 for applicable cases in the 0–90° range and are generally higher and more variable in the 90–180° range, with local increases around 40–60° and 110–150°. Torsional coefficients exhibit stronger row-to-row variation and wind-directional sensitivity than the vertical coefficients.
(3) Both the mid-span and side span exhibit pronounced stochastic buffeting characteristics, but their frequency-domain responses show clear spanwise differences. The vertical responses at both locations remain broadband, while the torsional response at the side span exhibits a more dispersed energy distribution and less pronounced frequency concentration than that at the mid-span. This difference may be associated with the shorter span length, higher stiffness, and slightly higher measured natural frequencies of the side span.
(4) Reinforced cables significantly reduce both mean and fluctuating responses. The maximum reduction rate of the fluctuating response reaches approximately 98.7%, while substantial mitigation is also achieved under the critical wind directions of 0° and 180°. The mitigation efficiency varies with wind direction, response component, and spanwise position.
(5) Wind-direction effects should be considered in design, and the 0° and 180° wind directions are recommended as key governing conditions. The design of reinforced cables should account for the response differences between the mid-span and side span under different wind directions.


Author Contributions

Conceptualization, G.F., Y.G. and Z.S.; methodology, G.F. and Z.S.; investigation, Z.S., Z.W., G.F., S.L., H.J. and W.H.; experimental design, G.F., Z.W. and Z.S.; data processing and analysis, Z.S.; writing—original draft preparation, Z.S.; writing—review and editing, Y.G., D.H., S.L., G.F., Z.W. and Z.S.; supervision, Y.G. and G.F.; project administration, G.F. and S.L.; resources, D.H., S.L., H.J. and W.H.; funding acquisition, G.F., D.H., S.L., H.J. and W.H. All authors have read and agreed to the published version of the manuscript.
Funding

This research was funded by the Natural Science Foundation of Shanghai, grant number 25ZR1402494; the Special Task Project of the State Key Laboratory of Disaster Reduction in Civil Engineering, grant number SLDRCE25-BZ-02; and the fund of China Huaneng Group (HNKJ24-H31).

Institutional Review Board Statement

Not applicable.

Informed Consent Statement

Not applicable.

Data Availability Statement

The original contributions presented in the study are included in the article. Further inquiries can be directed at the corresponding author.

Acknowledgments

The authors gratefully acknowledge the support of the fund of China Huaneng Group (HNKJ24-H31).

Conflicts of Interest

Dongfang Huo was employed by China Huaneng Group Co., Ltd.; Shengyuan Liu and Hechuan Jiang were employed by Huaneng Clean Energy Research Institute; and Wei Huangfu was employed by Huaneng International Power Co., Ltd., Hebei Clean Energy Branch. The remaining authors declare that the research was conducted in the absence of any commercial or financial relationships that could be construed as a potential conflict of interest. While the authors received funding from the Natural Science Foundation of Shanghai (Grant No. 25ZR1402494), the National Natural Science Foundation of China (Grant No. 52578602), the Special Task Project of the State Key Laboratory of Disaster Reduction in Civil Engineering (Grant No. SLDRCE25-BZ-02), and China Huaneng Group (Grant No. HNKJ24-H31), and collaborated with China Huaneng Group Co., Ltd., Huaneng Clean Energy Research Institute, and Huaneng International Power Co., Ltd., these entities had no role in the design of the study, data analysis, or interpretation of the results.

References

  1. Wang, G.; Zhang, Z.; Lin, J. Multi-energy complementary power systems based on solar energy: A review. Renew. Sustain. Energy Rev. 2024, 199, 114464. [Google Scholar] [CrossRef] [Scilit]
  2. Wang, Y. PV module flexible bracket technical solution. Sol. Energy 2018, 37–40. [Google Scholar] [CrossRef]
  3. Baumgartner, F.P.; Büchel, A.; Bartholet, R. Solar wings: A new lightweight PV tracking system. In Proceedings of the 23rd European Photovoltaic Solar Energy Conference, Valencia, Spain, 1–5 September 2008; Available online: https://api.semanticscholar.org/CorpusID:73595202 (accessed on 15 September 2026).
  4. Baumgartner, F.P.; Büchel, A.; Bartholet, R. Experiences with cable-based solar wings tracking system and progress towards two-axis large scale solar systems. In Proceedings of the 24th European Photovoltaic Solar Energy Conference, Hamburg, Germany, 21–25 September 2009; Available online: https://api.semanticscholar.org/CorpusID:54657222 (accessed on 15 September 2026).
  5. Baumgartner, F.P.; Büchel, A.; Bartholet, R. Cable-based solar wings tracking system: Two-axis system and progress of one-axis system. In Proceedings of the 25th European Photovoltaic Solar Energy Conference, Valencia, Spain, 6–10 September 2010; Available online: https://api.semanticscholar.org/CorpusID:107525309 (accessed on 15 September 2026).
  6. Qian, Y.; Wang, Y.; Yang, X. Application status of photovoltaic technology and “photovoltaic + water” in wastewater treatment plant. Ind. Water Treat. 2022, 42, 40–50. [Google Scholar] [CrossRef]
  7. Liu, X.J.; Cui, G.Q.; Yu, K.; Wang, S.H. Research on solar photovoltaic flexible racking system. New Technol. New Prod. China 2020, 79–81. [Google Scholar] [CrossRef]
  8. Geurts, C.P.W.; Steenbergen, R.D.J.M. Full-scale measurements of wind loads on stand-off photovoltaic systems. In Proceedings of the 5th European and African Conference on Wind Engineering (EACWE 2009), Florence, Italy, 19–23 July 2009; Available online: https://api.semanticscholar.org/CorpusID:61672404 (accessed on 15 September 2026).
  9. Kopp, G.A. Wind loads on low-profile, tilted, solar arrays placed on large, flat, low-rise building roofs. J. Struct. Eng. 2014, 140, 04013057. [Google Scholar] [CrossRef] [Scilit]
  10. Wang, P.X.; Fang, G.S.; Li, Y.Z.; Li, T.L.; Wen, Z.P.; Hao, X.T.; Wang, W.; Ge, Y.J.; Liu, S.Y. Dynamic characteristics and flutter performance of flexible cable-supported photovoltaic system: Field measurement and numerical simulation. Int. J. Struct. Stab. Dyn. 2026, 2750095. [Google Scholar] [CrossRef] [Scilit]
  11. He, X.H.; Ding, H.; Jing, H.Q.; Zhang, F.; Wu, X.P.; Weng, X.J. Wind-induced vibration and its suppression of photovoltaic modules supported by suspension cables. J. Wind Eng. Ind. Aerodyn. 2020, 206, 104275. [Google Scholar] [CrossRef] [Scilit]
  12. Zhou, Y.; Xiang, Y.; Wang, W.; Zhao, J.; Yang, K.; Zhang, Y.; Li, M. Experimental study on wind-induced response on a 45 m span double-layer cable-supported photovoltaic structure with arrays. J. Wind Eng. Ind. Aerodyn. 2025, 266, 106213. [Google Scholar] [CrossRef] [Scilit]
  13. Wang, J.X. Wind Effects and Wind-Resistant Design of Roof-Mounted Solar Arrays. Ph.D. Thesis, Beijing Jiaotong University, Beijing, China, 2020. [Google Scholar] [CrossRef]
  14. Warsido, W.P.; Bitsuamlak, G.T.; Barata, J.; Chowdhury, A.G. Influence of spacing parameters on the wind loading of solar array. J. Fluids Struct. 2014, 48, 295–315. [Google Scholar] [CrossRef] [Scilit]
  15. Ma, W.; Chai, X.; Zhao, H.; Ma, C. A study on distribution coefficient of a flexible photovoltaic support cable based on an eccentric moment wind load distribution model. J. Vib. Shock 2021, 40, 305–310. [Google Scholar]
  16. Xie, D.; Fan, J. Wind vibration analysis of prestressed flexible photovoltaic support systems. Build. Struct. 2021, 51, 15–18. [Google Scholar]
  17. Wang, Z.G.; Zhao, F.F.; Ji, C.M.; Peng, X.F.; Lu, H.Q. Wind-induced vibration analysis of multi-row and multi-span flexible photovoltaic support. Eng. J. Wuhan Univ. 2021, 54, 75–79. [Google Scholar]
  18. Li, S.; Ma, J.; Liu, J.; Chen, Z. Experimental study for flutter performance of flexible photovoltaic system by segmental model test. China Civ. Eng. J. 2024, 57, 25–34. [Google Scholar] [CrossRef]
  19. Guo, T.; Yang, Y.; Huang, G.Q.; Zhang, J.M. Wind-induced vibration analysis of flexible photovoltaic support structure under mountain canyon terrain. Acta Energ. Sol. Sin. 2023, 44, 131–140. [Google Scholar] [CrossRef]
  20. Fang, G.S.; Wang, P.X.; Zhao, M.; Wen, Z.P.; Shi, Z.N.; Ge, Y.J.; Yuan, W.K.; Zhao, Y.L.; Jiang, H.C. Theoretical modeling and practical formulas for natural frequencies of single-layer cable-supported photovoltaic systems. J. Struct. Eng. 2026, 152, 04026021. [Google Scholar] [CrossRef] [Scilit]
  21. Wang, P.X.; Fang, G.S.; Ge, Y.J. Practical estimation formulas and evolution law for natural frequencies of two-cable-supported flexible photovoltaic supports. J. Southeast Univ. (Nat. Sci. Ed.) 2026, 56, 973–982. [Google Scholar]
  22. Ma, C. Study on Wind Load Characteristics and Wind-Induced Response of Solar Photovoltaic Panels. Master’s Thesis, Shijiazhuang Tiedao University, Shijiazhuang, China, 2021. [Google Scholar] [CrossRef]
  23. Xu, H.; Ding, K.; Shen, G.; Du, H.; Chen, Y. Experimental investigation on wind-induced vibration of photovoltaic modules supported by suspension cables. Eng. Struct. 2024, 299, 117125. [Google Scholar] [CrossRef] [Scilit]
  24. Davenport, A.G. The application of statistical concepts to the wind loading of structures. Proc. Inst. Civ. Eng. 1961, 19, 449–472. [Google Scholar] [CrossRef] [Scilit]
  25. Davenport, A.G. The spectrum of horizontal gustiness near the ground in high winds. Q. J. R. Meteorol. Soc. 1961, 87, 194–211. [Google Scholar] [CrossRef] [Scilit]
  26. Davenport, A.G. Buffeting of a suspension bridge by storm winds. J. Struct. Div. 1962, 88, 233–270. [Google Scholar] [CrossRef] [Scilit]
  27. Scanlan, R.H. The action of flexible bridges under wind, II: Buffeting theory. J. Sound Vib. 1978, 60, 201–211. [Google Scholar] [CrossRef] [Scilit]
  28. Katsuchi, H.; Jones, N.P.; Scanlan, R.H. Multimode coupled flutter and buffeting analysis of the Akashi-Kaikyo Bridge. J. Struct. Eng. 1999, 125, 60–70. [Google Scholar] [CrossRef] [Scilit]
  29. Ding, H.; He, X.; Jing, H.; Wu, X.; Weng, X. Shielding and wind direction effects on wind-induced response of cable-supported photovoltaic array. Eng. Struct. 2024, 309, 118064. [Google Scholar] [CrossRef] [Scilit]
  30. Zhou, Y.; Peng, R.; Xiang, Y.; Li, M.; Xi, G.; Li, Y.; Luo, N. Experimental investigation on wind loads and wind-induced responses of large-span flexible photovoltaic support structure. Eng. Struct. 2025, 322, 119009. [Google Scholar] [CrossRef] [Scilit]
  31. Aly, A.M. On the evaluation of wind loads on solar panels: The scale issue. Sol. Energy 2016, 135, 423–434. [Google Scholar] [CrossRef] [Scilit]
  32. Chen, F.; Zhu, Y.; Wang, W.; Shu, Z.; Li, Y. A review on aerodynamic characteristics and wind-induced response of flexible support photovoltaic system. Atmosphere 2023, 14, 731. [Google Scholar] [CrossRef] [Scilit]
  33. Yang, W.; Dai, J.; Chen, W. Experimental study on wind-induced vibration and aerodynamic interference effects of flexible photovoltaics. J. Wind Eng. Ind. Aerodyn. 2025, 256, 105965. [Google Scholar] [CrossRef] [Scilit]
  34. Ren, H.; Weng, S.; Ke, S.; Zhao, K.; Tian, W. Investigation of wind-induced vibration evolution mechanisms in long-span flexible photovoltaic structures using three-dimensional digital image correlation method in aeroelastic wind tunnel tests. Phys. Fluids 2025, 37, 047126. [Google Scholar] [CrossRef] [Scilit]
  35. Wang, W.; Cao, J.X.; Cao, S.Y. Wind vibration characteristics of an array-type flexible photovoltaic system. Eng. Mech. 2026, 43, 51–57, 288. [Google Scholar] [CrossRef]
  36. Zhang, H.; Yang, Y.; Zhao, Y.; Li, M. Experimental investigation on self-excited vibration and wake interference effects of flexible photovoltaic systems. J. Wind Eng. Ind. Aerodyn. 2025, 262, 106098. [Google Scholar] [CrossRef] [Scilit]
  37. GB 50009-2012; Load Code for the Design of Building Structures. China Architecture & Building Press: Beijing, China, 2012. (In Chinese)
  38. Wen, Z.P.; Fang, G.S.; Wang, G.J.; Ge, Y.J.; Xu, K. Novel flutter speed formulas for classical flutter. AIAA J. 2026, 64, 3286–3301. [Google Scholar] [CrossRef] [Scilit]
  39. Gao, Y.; Li, S.; Ma, J.; Chen, Z. Critical flutter wind velocity of flexible photovoltaic support structure with large tilt angle based on sectional forced and free vibration wind tunnel tests. J. Wind Eng. Ind. Aerodyn. 2025, 267, 106255. [Google Scholar] [CrossRef] [Scilit]
Figure 1. Wind field simulation in the wind tunnel.
Eng 07 00488 g001
Figure 2. Mean wind profile and turbulence intensity profile.
Eng 07 00488 g002
Figure 3. Layout of measurement points and row number.
Eng 07 00488 g003
Figure 4. Arrangement of steel-wire reinforced cables.
Eng 07 00488 g004
Figure 5. Experimental wind direction angle.
Eng 07 00488 g005
Figure 6. Time histories and PSDs of the first windward row at the mid-span under 0° wind direction. (a) Vertical displacement time history of row 1 at 0°. (b) Torsional displacement time history of row 1 at 0°. (c) PSD of vertical displacement of row 1 at 0°. (d) PSD of torsional displacement of row 1 at 0°.
Eng 07 00488 g006
Figure 7. Time histories and PSDs of the first windward row at the mid-span under 180° wind direction. (a) Vertical displacement time history of row 6 at 180°. (b) Torsional displacement time history of row 6 at 180°. (c) PSD of vertical displacement of row 6 at 180°. (d) PSD of torsional displacement of row 6 at 180°.
Eng 07 00488 g007
Figure 8. Wind-speed-dependent response standard deviations under representative uniform-flow conditions: (a) vertical response at Mid-span Row 1 under 0°; (b) torsional response at Mid-span Row 1 under 0°; (c) vertical response at Mid-span Row 6 under 180°; and (d) torsional response at Mid-span Row 6 under 180°.
Eng 07 00488 g008
Figure 9. Time histories and PSDs for the first windward row at the side span. (a) Vertical displacement time history of side row 1 at 0°. (b) Torsional displacement time history of side row 1 at 0°. (c) PSD of vertical displacement of side row 1 at 0°. (d) PSD of torsional displacement of side row 1 at 0°.
Eng 07 00488 g009
Figure 10. Time histories and PSDs for the first windward row at the side span. (a) Vertical displacement time history of side row 6 at 180°. (b) Torsional displacement time history of side row 6 at 180°. (c) PSD of vertical displacement of side row 6 at 180°. (d) PSD of torsional displacement of side row 6 at 180°.
Eng 07 00488 g010
Figure 11. Spatial distribution of RMS responses of the unreinforced array under turbulent inflow.
Eng 07 00488 g011
Figure 12. Vertical wind-induced vibration coefficient of each row at mid-span for different wind directions. Gray bars marked with “×” indicate cases where the wind-induced vibration coefficient is not applicable due to near-zero mean responses. The vertical axis is limited to 0–10 for clarity.
Eng 07 00488 g012
Figure 13. Torsional wind-induced vibration coefficient of each row at mid-span for different wind directions. Gray bars marked with “×” indicate cases where the wind-induced vibration coefficient is not applicable due to near-zero mean responses. The vertical axis is limited to 0–10 for clarity.
Eng 07 00488 g013
Figure 14. Maximum vertical displacement of each row under different wind directions.
Eng 07 00488 g014
Figure 15. Maximum torsional displacement of each row under different wind directions.
Eng 07 00488 g015
Figure 16. Mean vertical displacement. (a) U = 12.6 m/s (unreinforced condition). (b) U = 19.0 m/s (unreinforced condition). (c) U = 19.0 m/s (reinforced condition). (d) U = 31.6 m/s (reinforced condition).
Eng 07 00488 g016
Figure 17. Mean torsional displacement. (a) U = 12.6 m/s (unreinforced condition). (b) U = 19.0 m/s (unreinforced condition). (c) U = 19.0 m/s (reinforced condition). (d) U = 31.6 m/s (reinforced condition).
Eng 07 00488 g017
Figure 18. Fluctuating vertical displacement. (a) U = 12.6 m/s (unreinforced condition). (b) U = 19.0 m/s (unreinforced condition). (c) U = 19.0 m/s (reinforced condition). (d) U = 31.6 m/s (reinforced condition).
Eng 07 00488 g018
Figure 19. Fluctuating torsional displacement. (a) U = 12.6 m/s (unreinforced condition). (b) U = 19.0 m/s (unreinforced condition). (c) U = 19.0 m/s (reinforced condition). (d) U = 31.6 m/s (reinforced condition).
Eng 07 00488 g019
Table 1. Characteristics of cable-supported photovoltaic system.
ParameterPrototypeTargetModelScale
Module size (L × W × T, mm)2256225.62261:10
1134113.4113
353.56
Inclination angle (°)5551:1
PV-module mass (kg)350.0350.0321:1000
Vertical frequency at mid-span (Hz)1.404.434.40 10 :1
Torsional frequency at mid-span (Hz)2.016.366.45 10 :1
Vertical damping ratio (%)--2.5-
Torsional damping ratio (%)--2.9-
Table 2. Experimental condition setup.
CaseReinforcement ConditionWind Velocity (m/s)Wind Direction (°)Increment (°)
C1Unreinforced12.60–35010
C2Unreinforced19.00–35010
C3Cable-reinforced19.00–35010
C4Cable-reinforced31.60–35010
Disclaimer/Publisher’s Note: The statements, opinions and data contained in all publications are solely those of the individual author(s) and contributor(s) and not of MDPI and/or the editor(s). MDPI and/or the editor(s) disclaim responsibility for any injury to people or property resulting from any ideas, methods, instructions or products referred to in the content.