Article

Effects of Multi-Modality on the Dynamic Stability in Milling of Typical Thin-Walled Structural Components

1
School of Mechanical Engineering, Lanzhou Petrochemical University of Vocational Technology, Lanzhou 730060, China
2
School of Mechanical and Electrical Engineering, Lanzhou University of Technology, Lanzhou 730050, China
*
Author to whom correspondence should be addressed.
Eng 2026, 7(9), 487; https://doi.org/10.3390/eng7090487 (registering DOI)
Submission received: 20 August 2026 / Revised: 17 September 2026 / Accepted: 18 September 2026 / Published: 20 September 2026
(This article belongs to the Special Issue Emerging Trends and Technologies in Manufacturing Engineering)

Abstract

Thin-walled structural components possess low structural stiffness and are prone to regenerative chatter in milling, while continuous material removal leads to time-varying dynamic characteristics during machining. For traditional methods concerning multi-modal stability analysis, neither the minimum envelope method nor the comprehensive modal method is capable of accurately predicting the specific chatter mode within a given cutting region prior to machining. Against this background, this study focuses on the identification of individual modal contributions before machining, aiming to reveal the influence mechanism of different modes on the stability of typical thin-walled structures within a given cutting region. A discretization-based stability lobe prediction model is constructed, which integrates multi-node contact characteristics within the tool–workpiece interaction region and considers the time-varying evolution of dynamic parameters induced by both material removal and variable tool positions. Stability prediction is individually performed for the first three dominant modes under different machining stages and tool positions to quantitatively distinguish the independent contribution of each mode. Milling experiments on typical rectangular thin-walled components are conducted, and the multi-modal stability mechanism is comprehensively illustrated through surface roughness analysis, real-time vibration analysis, and FFT spectra of the signals analysis. The results suggest that the second-order torsional node and the third-order bending–torsion nodes can effectively suppress the corresponding chatter modes within the given cutting region. Further validation demonstrates that multimodal effects are indispensable for reliable stability prediction in thin-walled component milling.

1. Introduction

Thin-walled structural components are widely adopted in aerospace, automotive, new energy, and other high-end equipment manufacturing industries owing to their merits, including lightweight, high load-bearing capacity, and compact structure, and are mainly machined via CNC milling at present. Nevertheless, thin-walled components suffer from low stiffness due to drastic dimensional disparities in different directions and high material removal rates during machining. Affected by such low-stiffness characteristics, chatter readily occurs during the milling process of thin-walled parts, which further restricts the improvement of machining efficiency, impedes precise control of machining accuracy, deteriorates workpiece surface quality, and accelerates tool wear [1,2,3,4,5].
Three core challenges exist in the research on milling stability of thin-walled components. The first is establishing a tool–workpiece contact dynamic model that accommodates the unique machining characteristics of thin-walled components. The second concerns identifying time-varying dynamic parameters induced by continuous material removal and varying geometric boundaries of the tool–workpiece contact region. The third focuses on revealing the chatter mechanism arising from multiple dominant modes of thin-walled components.
Many researchers have carried out in-depth investigations into the aforementioned problems and yielded abundant research achievements. Dang et al. investigated the multi-mode coupling chatter mechanism of pocket thin-walled workpieces and accounted for the influences of material removal and tool positions on milling stability [6]. Yang et al. used the decomposition condensation approach to obtain time-varying dynamic characteristics of flat and curved thin structures with the first three modes considered [7]. Yang et al. established a multi-node contact dynamic model and proposed an efficient structural dynamic modification method, verified by flat and curved thin-wall milling tests [8]. Li et al. introduced a flexible deformation prediction method with faster convergence speed to calculate cutting zone deformation, and further developed a solving algorithm for milling dynamic models based on extended Newton–Cotes rules [9]. Liu et al. established a multi-mode time-varying dynamic model with follow-up supports, performed stability prediction and milling tests, and investigated how the support device and different supporting forces affect workpiece dynamics [10]. Dang et al. put forward an efficient algorithm for solving time-varying dynamic parameters of thin-walled workpieces. This approach greatly cuts down memory consumption and calculation costs. Both flat and curved thin plates were used for experimental verification, proving its high precision, and the method supports chatter stability analysis for large thin-wall components [11]. Wang et al. constructed a multi-dimensional multi-mode dynamic model integrating process damping and contact multi-mode effects. This model rapidly updates mass and stiffness matrices through geometric judgment to obtain real-time workpiece dynamics and distinguish dominant vibration frequencies [12]. Li et al. proposed a new updating method for time-varying dynamics of thin-wall milling based on degree-of-freedom reduction. This approach simplifies the substructure finite element model after material removal and acquires the time-dependent dynamic properties of thin workpieces by solving the eigenvalue problem of the simplified structure [13]. Zheng et al. proposed a multi-point and multi-mode lumped parameter model for milling dynamics and stability analysis of aluminum alloy thin-walled parts with integrated mode coupling effects [14]. Zhao et al. established a three degree of freedom (3-DOF) milling process dynamics model based on the full discretization method, which systematically obtains the modal parameters of the thin-walled component at different locations [15]. Li et al. established a dynamic model considering multi-point contact, which accounts for the effects of material removal and varying tool positions on the dynamic characteristics of thin-walled components [16]. Most of the aforementioned literatures carry out stability prediction by adopting the first three dominant modes of thin-walled components. Nevertheless, whether the stability lobes are plotted via the minimum envelope method or predicted by integrating all dominant modes, it remains difficult to quantitatively analyze the independent influence mechanism of a single mode on milling stability. In other words, the specific mode triggering chatter within a given cutting region can only be distinguished via post-process frequency spectrum analysis upon machining completion.
Beyond the foregoing investigations centered on multi-mode coupling and time-varying dynamic characteristics, several researchers have further developed chatter prediction models that incorporate cutting-force-induced deformation and thin plate vibration theory. Zheng et al. mainly investigated the effect of milling-force-induced deformation on the machining stability of thin-walled components and put forward an efficient algorithm for fast deformation calculation based on the radial basis function neural network surrogate model [17]. Sun et al. established a multi-point contact dynamic model between tool and workpiece, and updated workpiece dynamic parameters via finite element correction. A flexible iterative algorithm was further proposed to calculate cutting force-induced deformation and revise actual cutting engagement boundaries [18]. Yan et al. adopted relative transfer functions covering tool-workpiece dynamics and an enhanced multi-frequency method to forecast axial critical cutting depths [19]. Song et al. put forward a novel time-space discretization method built on thin plate theory and mode superposition. It accounts for tool-workpiece engagement and system multi-modes, supports complex boundaries via Rayleigh-Ritz and penalty techniques [20]. Gao et al. proposed a comprehensive multi-point contact dynamics model that integrating machining deformation and forced vibration coupling, including their influence on process damping [21]. Liu et al. proposes a time-varying dynamic characteristics and chatter prediction method for mirror milling based on support mechanism analysis and support parameter modeling [22]. Although these studies employ thin-walled component models comparable to the one adopted in this work, they merely take the first two dominant modes into account and neglect the effect of the third-order bending-torsion mode on milling stability prediction.
Furthermore, many researchers have proposed other methodologies to predict chatter stability during the milling of thin-walled components. Qu et al. took displacement variance as chatter index to plot stability lobes and analyzed modal and cutter tooth effects on thin plate milling stability via simulation and milling tests [23]. Feng et al. proposed a Kriging-FE hybrid method to map position-dependent modal parameters of titanium thin-walled parts, then combined regenerative chatter theory to calculate stable cutting depths, and validated the high practicability of the method via milling tests [24]. Alan et al. adopted structural modification method to update workpiece FRFs by treating removed material as structural change, calculated dynamic characteristics of various structures and conducted chatter analysis, and optimized cutting parameters to raise stable material removal rate [25]. Thevenot et al. incorporated position-dependent workpiece dynamics into stability analysis and established a 3D stability lobe diagram to optimize cutting parameters, and the predicted stable regions were verified through practical down-milling experiments of thin-walled components [26]. Different from the above multi-mode and multi-node coupled models, the four studies above only considered single modal characteristics and failed to establish multi-point contact dynamic models between tool-workpiece, which cannot accurately reflect the vibration effect of multi-order modes and multiple cutting positions during milling.
This paper aims to investigate the influence mechanism of multimodality on thin-walled structural components milling stability, and addresses the three core issues mentioned above. Different from previous investigations, this work quantitatively distinguishes the independent stability contribution of each dominant mode via a discretization-based model and characterizes time-varying multimodal chatter characteristics. Individual stability lobe diagrams are further established to achieve pre-machining modal stability evaluation rather than post-process chatter identification. Moreover, the inherent modal chatter suppression mechanism of second-order torsional and third-order bending-torsion structural nodes is uncovered. The remainder of this paper is organized as follows. In Section 2, a stability lobe prediction model considering the multi-node effect of tool-workpiece contact zone is established via a discretization algorithm. In Section 3, the superelement and softening elements techniques are adopted to predict the time-varying dynamic parameters of thin-walled components at various machining stages and tool positions. In Section 4, milling experiments are carried out, and the effectiveness and accuracy of the proposed methods are verified by comparative analysis of machined surface topography, real-time vibration and their FFT spectra signal analysis. Finally, the whole paper is summarized. Specifically, the analytical and modeling research in Section 2 serves as the fundamental theoretical basis of this study. The numerical analysis conducted in Section 3 acts as an extension and concrete embodiment of the aforementioned theoretical foundation, which transforms abstract theoretical models into quantifiable and analyzable dynamic parameter results. On this basis, the experimental tests in Section 4 are implemented to comprehensively validate the rationality of the theoretical models and the reliability of the numerical analysis results.

2. A Stability Lobe Diagram Prediction Model for Thin-Walled Component Milling Based on the Discretization Algorithm

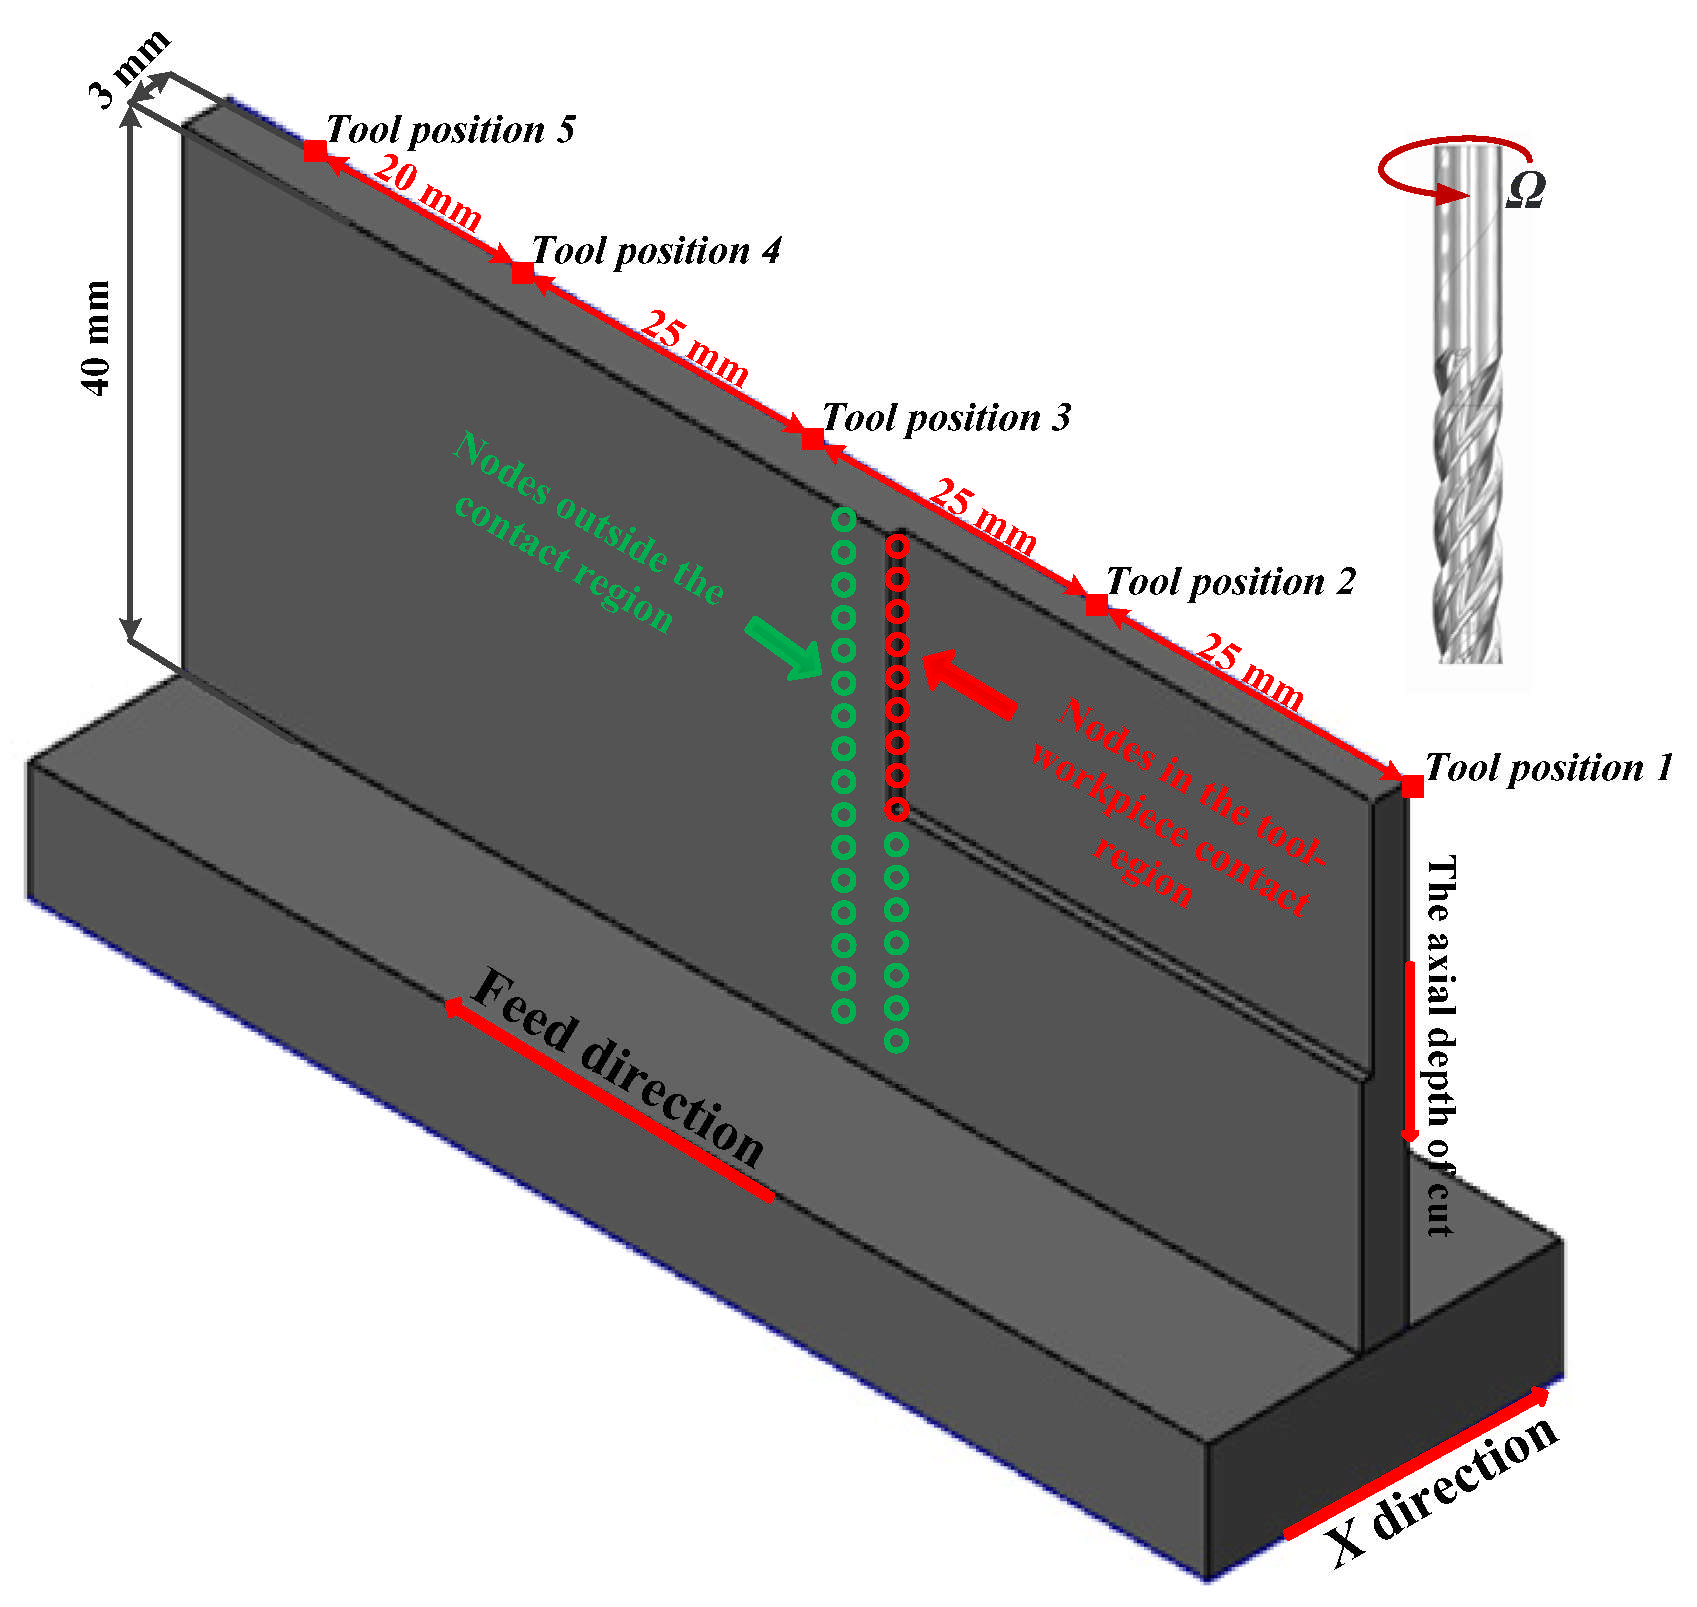
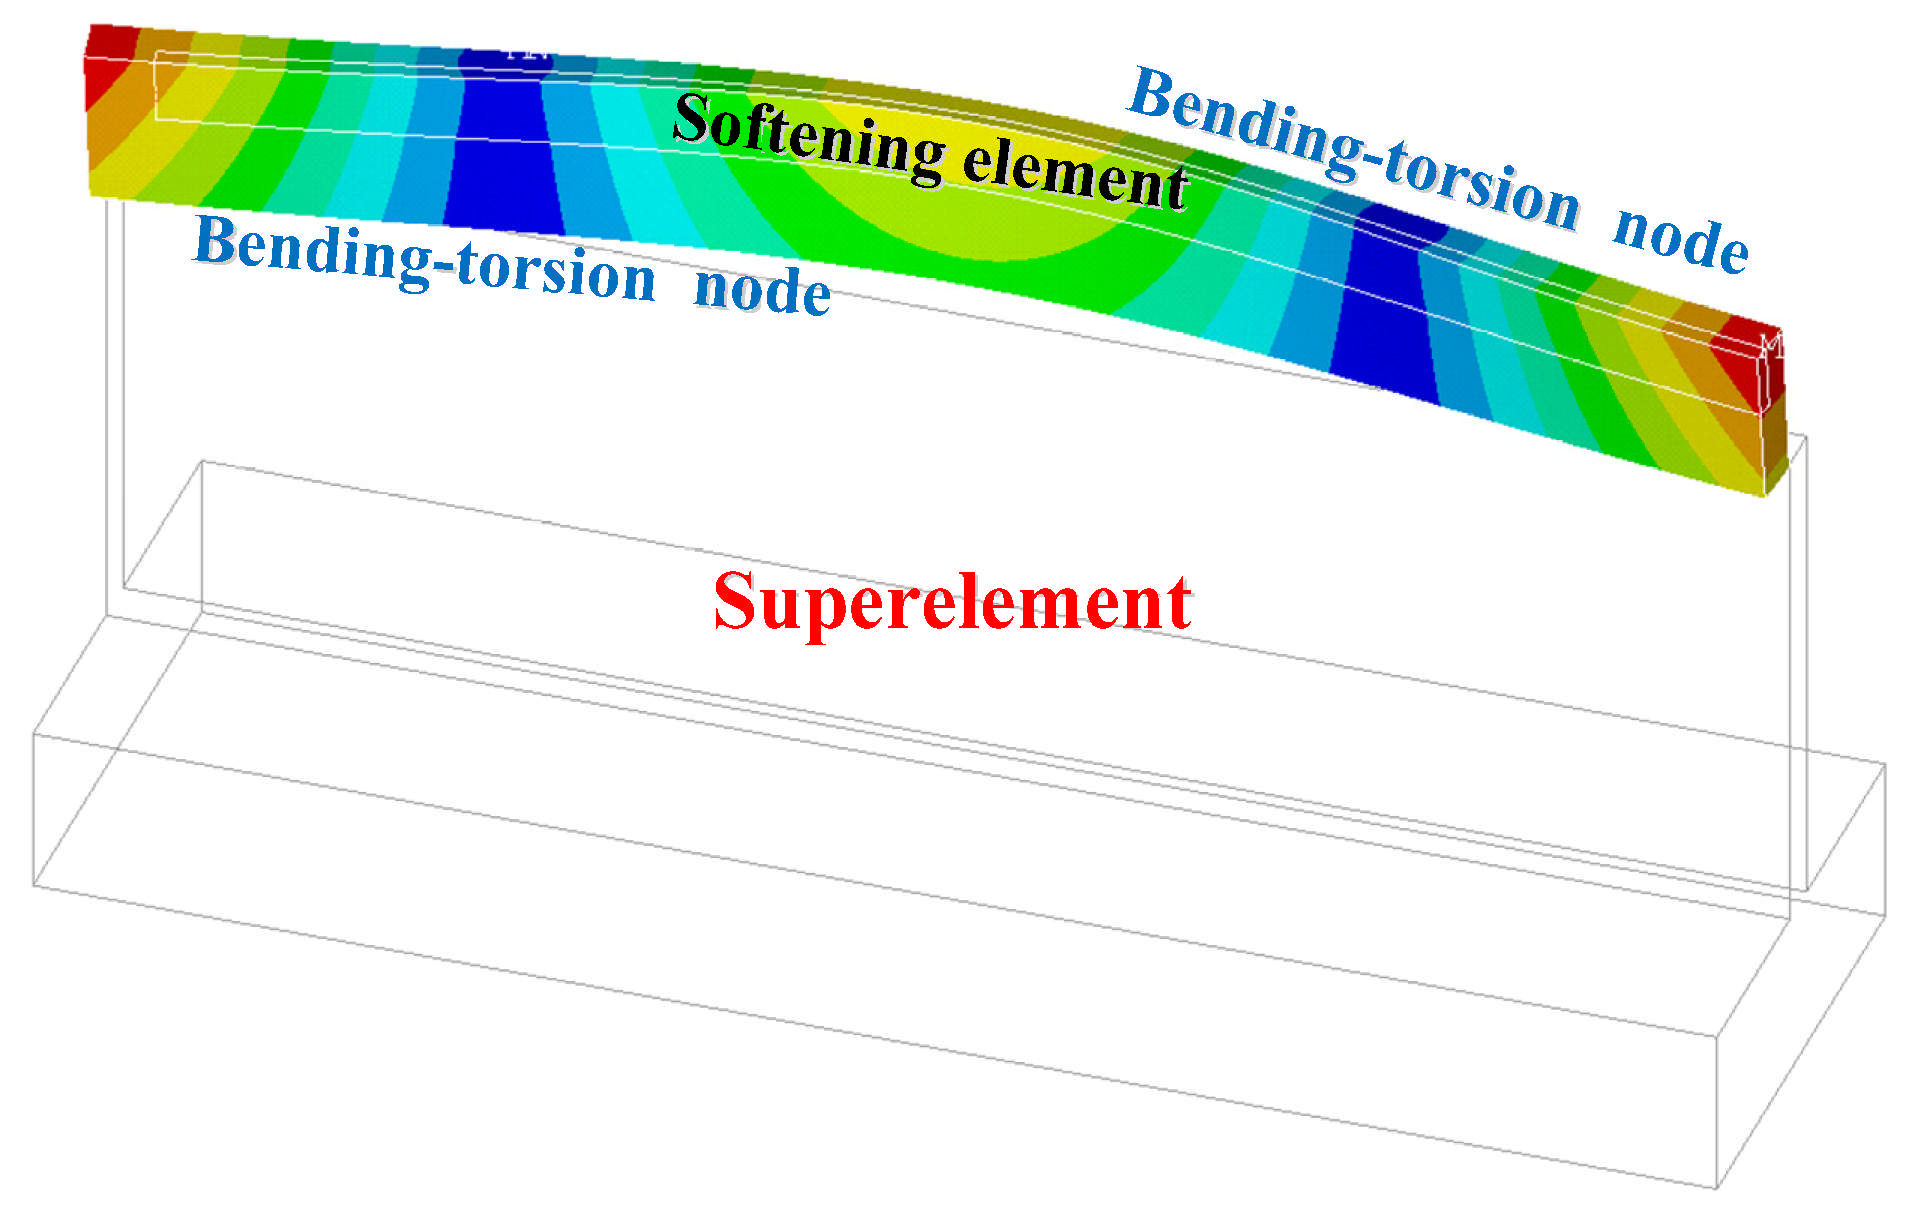
In the model adopted in this paper, the dimensional ratio between the X-direction and the feed direction is 3:100 as shown in Figure 1. Therefore, a single-degree-of-freedom dynamic model is employed for the analysis, assuming that the thin-walled component is rigid in the feed direction and thus does not experience chatter. As shown in Figure 1, only the mass and stiffness of nodes within the tool-workpiece contact region are taken into account, and nodes outside this contact region are assumed to bear no external loads.
The dynamic equation considering multi-node contact in the tool-workpiece contact region is expressed as Equation (1):
m p x ¨ p t + c p x ˙ p t + k p x p t = F p t
m p , c p and k p denote the mass, damping and stiffness matrices of nodes in the tool-workpiece contact region, respectively. Their dimensions are determined by the number of nodes within the contact region. For the present equation, let p represent the total number of contact nodes; the dimension of each matrix is 3 p × 3 p . x p t and F p ( t ) represent the displacement and force vectors of nodes in the X-direction under the physical space coordinate system with a dimension of 3 p × 1 , respectively.
With damping effects neglected, the undamped dynamic equation describing multi-node contact in the tool-workpiece contact region is given by Equation (2):
m p x ¨ p t + k p x p t = 0
The characteristic solution corresponding to Equation (2) is given by Equation (3), where ω n 2 denotes the eigenvalue and ω n represents the natural frequency. τ stands for the mass-normalized matrix with a dimension of 3 p × ω n d , in which ω n d is the order of dominant modes. If only a single dominant mode is taken into consideration, τ becomes a 3 p × 1 vector.
k p ω n 2 m p τ = 0
It is worth noting that the aforementioned mass, damping and stiffness matrices are difficult to obtain in physical space. The modal superposition method is utilized for coordinate transformation to decouple the physical space dynamic equation into modal space, and the coordinate transformation formula is given by Equation (4). This method serves two purposes: first, to realize the decoupling of the dynamic equation; second, after transforming into the modal space, the modal mass and stiffness matrices of nodes within the tool-workpiece contact region can be acquired by the finite element method
x p t = τ ( t )
( t ) denotes the displacement vector in modal space. Substitute Equation (4) into Equation (2), and pre-multiply the left-hand side of Equation (2) by the transpose of the mass-normalized matrix τ T , which yields:
τ T m p τ ¨ t + τ T k p τ t = 0
Since τ is a mass-normalized matrix, Equation (5) can be rewritten as:
¨ t + ω n 2 t = 0
When multiple dominant modes are considered simultaneously, the mass, damping and stiffness matrices transformed into modal space are ω n d × ω n d diagonal matrices, among which the modal mass matrix is a ω n d × ω n d identity matrix. In this paper, the first three dominant modes are analyzed separately, so Equation (7) is valid, where 2 ε ω n and ω n 2 are scalar constants.
τ T m p τ = 1 τ T c p τ = 2 ε ω n τ T k p τ = ω n 2
Then, the dynamic equation for damped thin-walled components in modal space is given by:
¨ t + 2 ε ω n ˙ t + ω n 2 t = τ T F p ( t )
In Equation (8), the force vector of the X direction is not subjected to coordinate transformation. The force vector can be calculated by Equation (9):
F p t = j = 1 N g ( θ ( t ) ) sin ( θ ( t ) ) K t c cos θ t + K r c sin ( θ ( t ) ) a x p t x p t T
where K t c and K r c denote the tangential and radial milling force coefficients, respectively. g ( θ ( t ) ) is the unit step function used to characterize the cutting state of the j -th tooth, and a represents the axial cutting depth. T is the time delay, which can be calculated via 60 / N Ω , where N is the number of cutter teeth and Ω (rpm) stands for the spindle speed. θ ( t ) is the instantaneous angular position of the j -th tooth and can be computed as follows:
θ t = 2 π Ω / 60 t + j 1 2 π / N
The terms associated with milling force coefficients in Equation (9) are expressed via Equation (11):
K t = j = 1 N g ( θ ( t ) ) sin θ t K t c cos θ t + K r c sin θ t
Then, Equation (9) can be expressed as:
F p t = K ( t ) a x p t x p t T
Substituting Equation (4) into Equation (12) and multiplying both sides by the transpose of the mass-normalized matrix τ T yields:
τ T F p t = τ T τ K ( t ) a t t T
where τ T τ denotes the mass-normalized value of the tool-workpiece contact region. In this paper, it is adopted as a core input parameter to construct stability lobes instead of the modal mass. The mass-normalized value and the modal mass are reciprocals of each other, and this value can be obtained by the finite element method.
Substituting the Equation (13) into Equation (8), yields:
¨ t + 2 ε ω n ˙ t + ω n 2 t = τ T τ K ( t ) a t t T
State-space equations are adopted to perform order reduction on Equation (14), as shown in Equation (15):
v ˙ t = A 0 v t + B t v t B ( t ) v ( t T )
The terms in Equation (15) are as follows:
A 0 = 0 1 ω n 2 2 ε ω n B t = 0 0 τ T τ K ( t ) a 0 v t = t ˙ t
Subsequently, a discretization algorithm is employed to discretize the period T, which is divided into m time elements with equal duration Δ t . Linear interpolation approximation is performed on the state term v t and time-delay term v t T , and integral approximation is adopted for the coefficients term B ( t ) , and A 0 denotes a constant matrix.
v t v ¯ = 0.5 v i + 0.5 v i + 1 v t T v T , i = 0.5 v i m + 0.5 v i m + 1 B i = 1 Δ t t i t i + 1 B ( t ) d t
Substitute Equation (17) into the delay differential Equation (15), and the ordinary differential equation within the discrete time interval is obtained as Equation (18):
v ˙ t = A 0 v t + B i v ¯ B ( t ) v T , i
Solve Equation (18) over the i -th time interval [ t i , t i + 1 ] , which yields:
v i + 1 = P i v i + R i v i m + 1 + R i v i m
where
P i = I e A 0 Δ t A 0 1 B i 2 + A 0 1 B i 2 1 e A 0 Δ t + e A 0 Δ t A 0 1 B i 2 A 0 1 B i 2 R i = I e A 0 Δ t A 0 1 B i 2 + A 0 1 B i 2 1 A 0 1 B i 2 e A 0 Δ t A 0 1 B i 2
I represents the identity matrix. The following discrete mapping can be established based on Equation (19):
M i + 1 = D i M i
M i is the column vector v i , v i 1 , , v i m T , and the coefficient matrix D i is given by:
D i = P i 0 0 0 R i R i I 0 0 0 0 0 0 I 0 0 0 0 0 0 0 0 0 0 0 0 0 I 0 0 0 0 0 0 I 0
The Floquet transition matrix derived above is given in Equation (23).
= D m 1 D m 2 D 1 D 0
Subsequently, the system stability is judged based on Floquet theory, the system is stable if all eigenvalues of the transition matrix are less than 1; otherwise, the system becomes unstable [27,28,29,30].

3. Acquisition of Time-Varying Dynamic Parameters and Construction of Stability Lobes

Section 2 constructs a stability lobe prediction model accounting for the machining features of thin-walled components with the discretization algorithm. Sufficient pre-input parameters must be obtained before implementing stability prediction with the proposed model. A representative thin-walled specimen with dimensions 100 mm × 40 mm × 3 mm is adopted here, as shown in Figure 1, the material is 7050 aerospace aluminum (whose mechanical properties include Young’s modulus = 71 GPa, Poisson’s ratio = 0.3 and density = 2830 kg/m3; the element type is Solid 185 with an element edge length of 1 mm). The tool used in this paper has a diameter of 10 mm and an overhang length of 41 mm, and it is made of cemented carbide. Given the differences in anisotropic dimensional ratios and materials between the cutter and workpiece, to simplify the complexity of the problem, it is assumed that the stability of the machining system is mainly governed by the thin-walled workpiece. However, the cutter’s contribution to system stability should be considered when constructing a more precise stability model. The hexahedral finite-element model is generated via the Sweep method, and zero-displacement constraints are imposed on the model base for modal analysis. For brevity, the detailed GUI operation procedures are referred to the Supplementary Materials. The well-known average force method combined with slot-milling tests is utilized to calibrate the milling force coefficients. Coefficients are identified via linear regression of average cutting forces at different feed rates, and the detailed implementation procedure is provided in Ref. [31]. The corresponding values are Ktc = 941 N/mm2 and Krc = 1157 N/mm2.

3.1. Acquisition of Time-Varying Dynamic Parameters

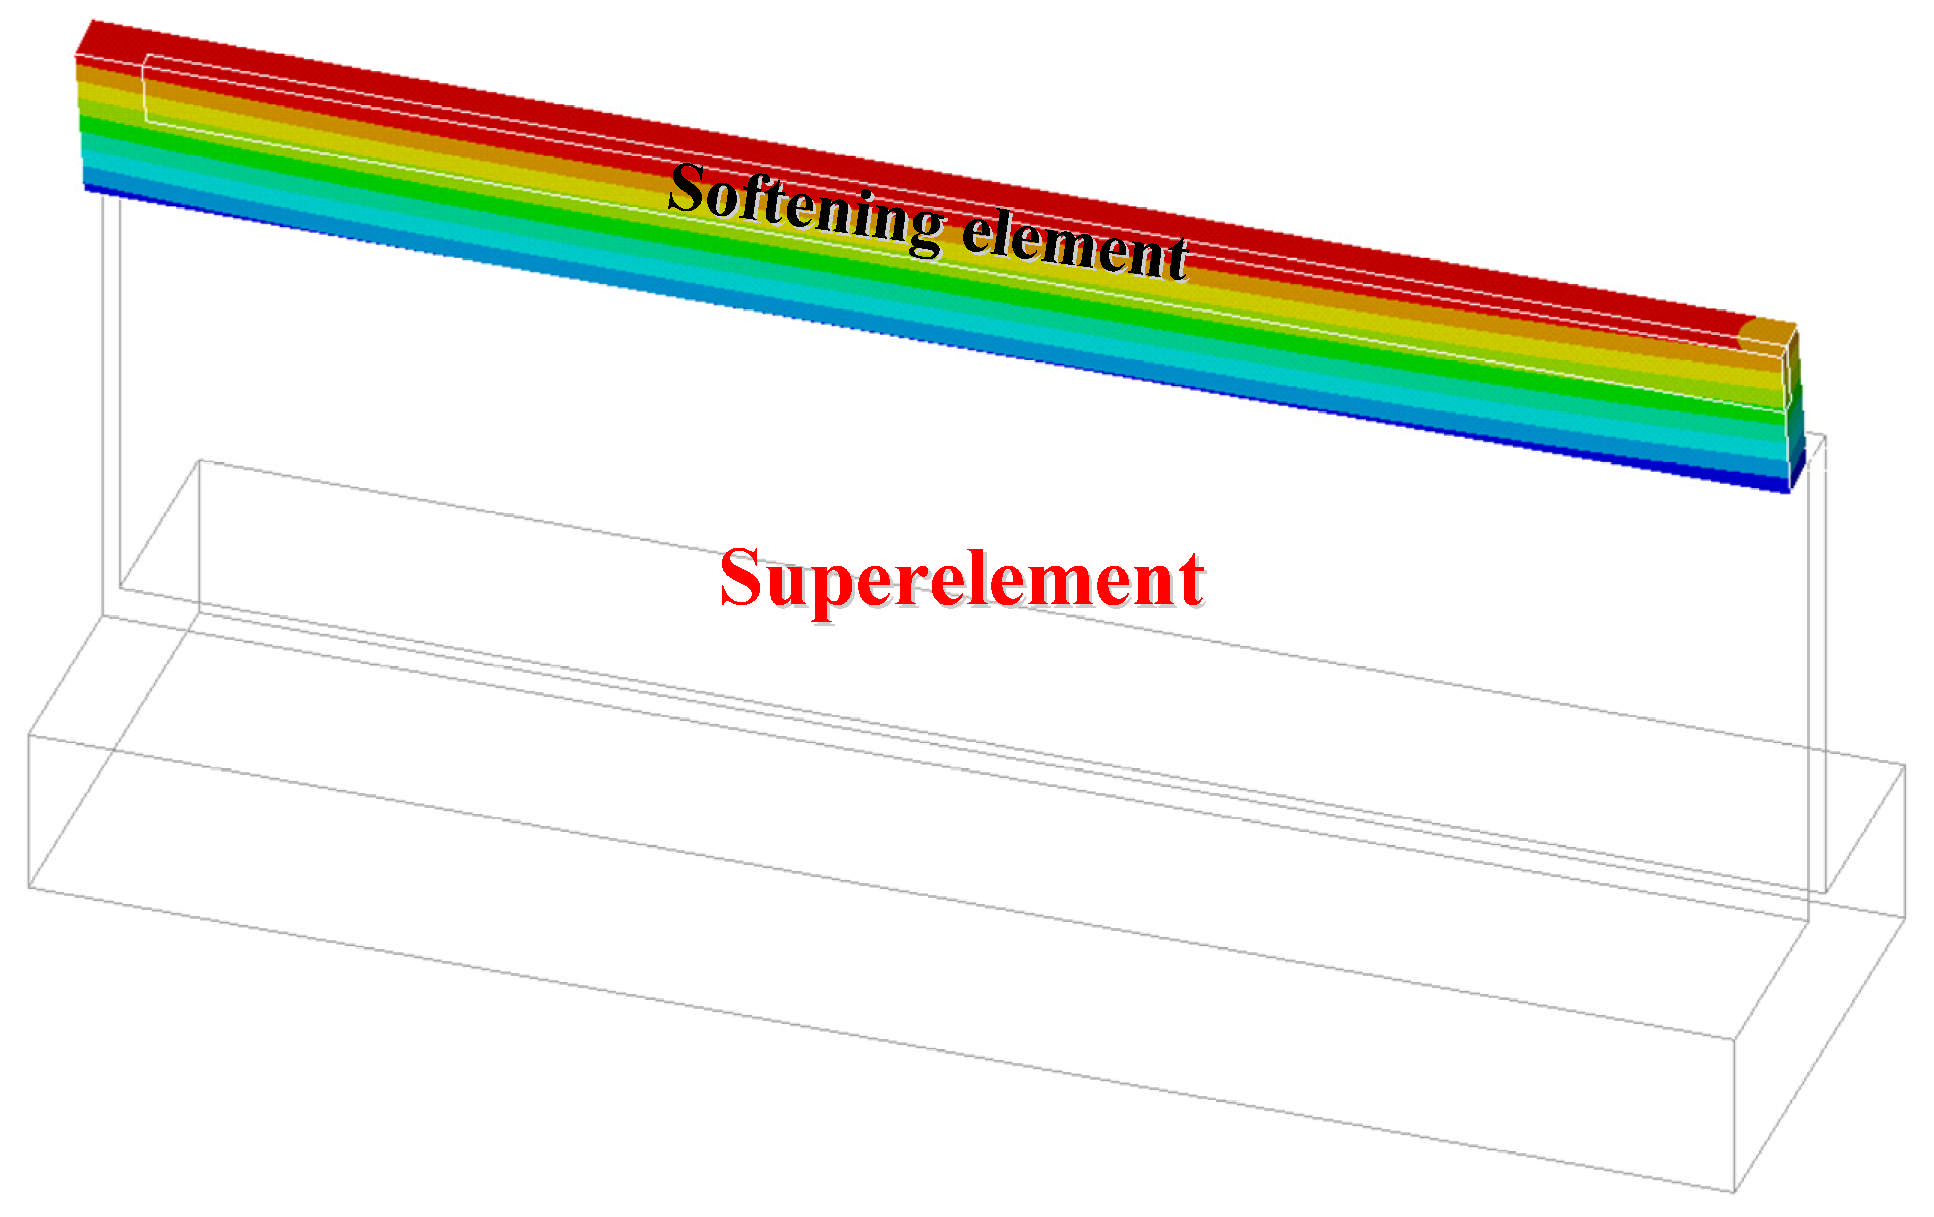
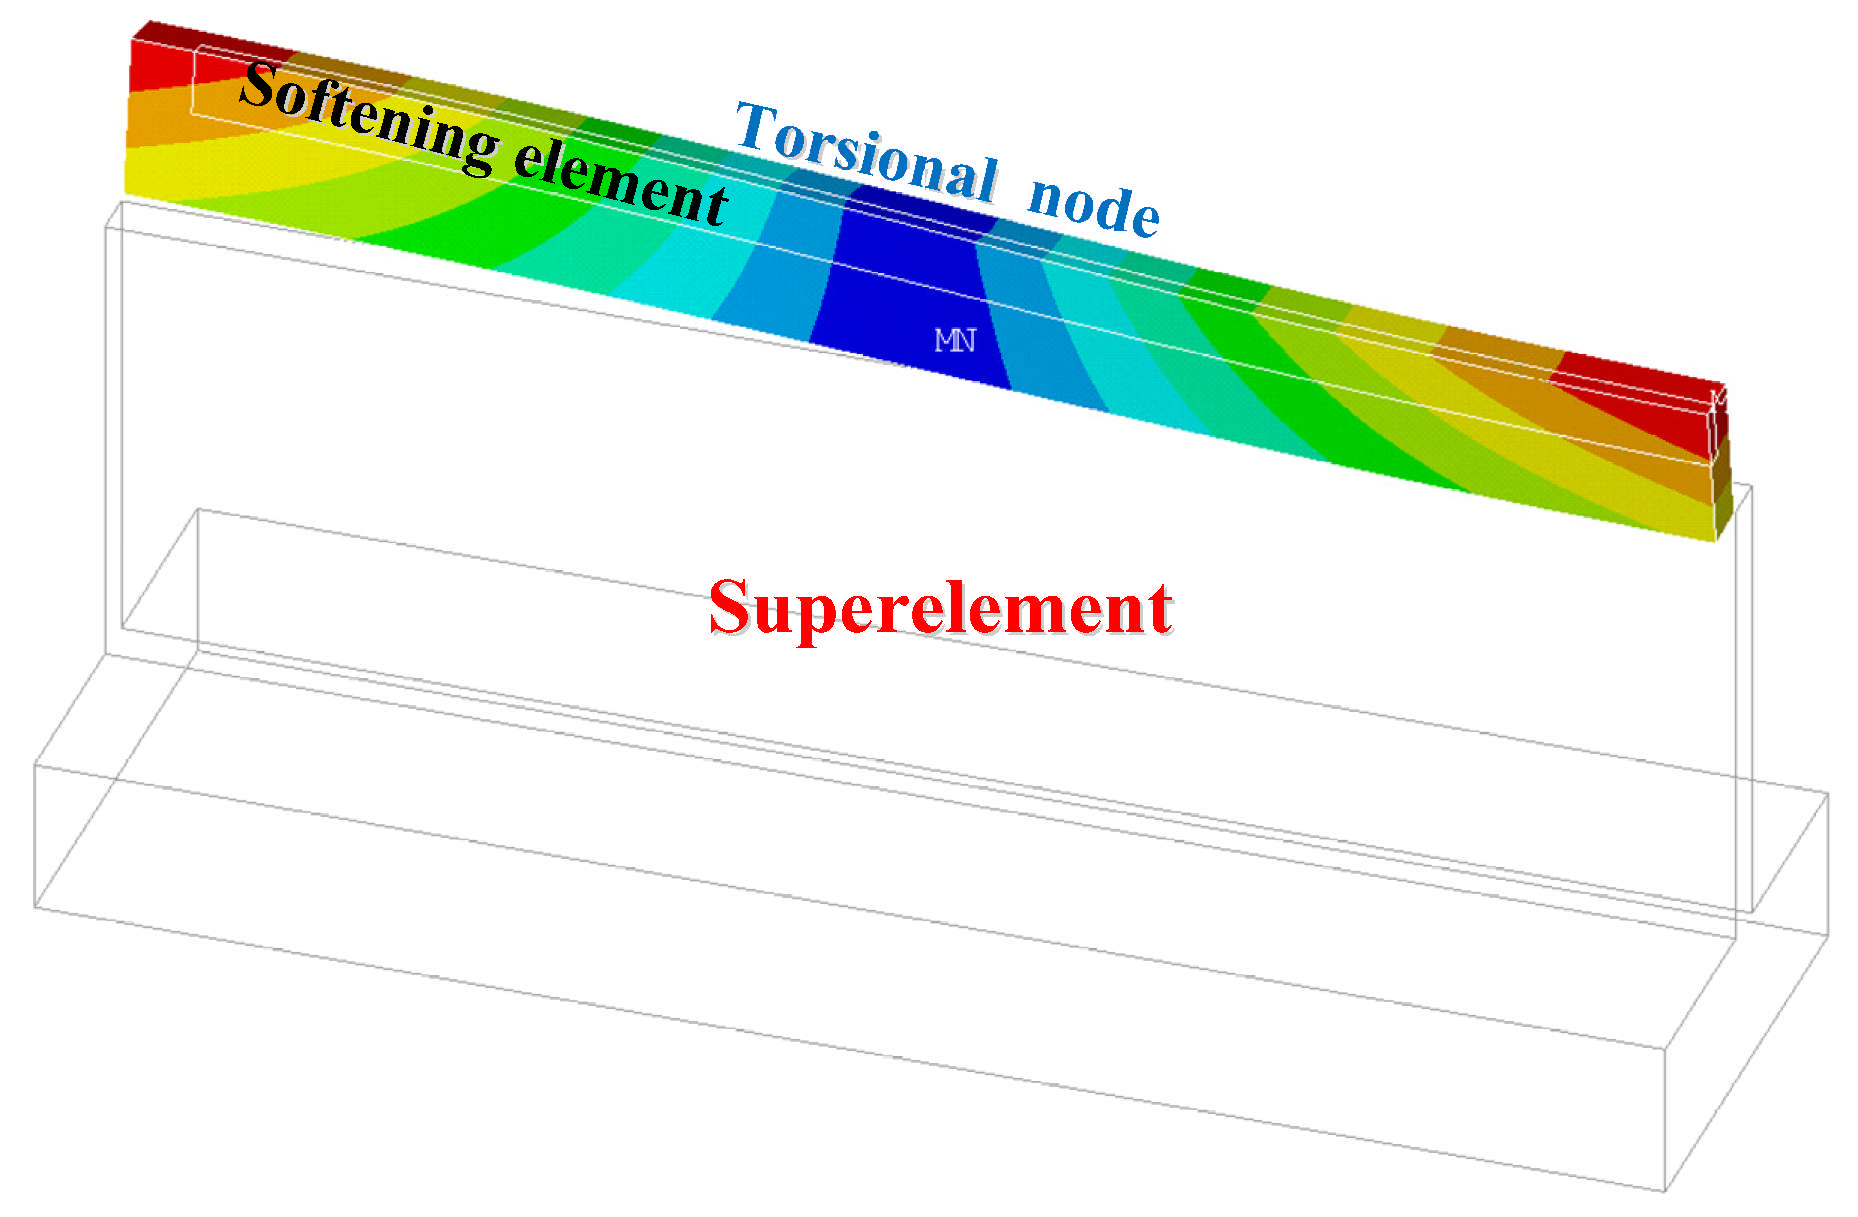
In this study, the structural dynamic modification method, a well-established technique widely applied in aerospace engineering, is adopted for finite element analysis of thin-walled components to extract their time-varying dynamic parameters. The first three dominant modes of the thin-walled workpiece derived from the corresponding modal analysis are plotted in Figure 2, Figure 3 and Figure 4.
Figure 2, Figure 3 and Figure 4 illustrate the first bending mode, second torsional mode and third bending-torsion mode of the thin-walled component under a specific machining stage. Within the framework of the structural dynamic modification method, superelement technique are adopted to reduce the number of finite elements and accelerate computation, while softening elements technique are introduced to avoid repeated modeling and meshing procedures.
It is widely recognized that dynamic parameters of thin-walled components vary significantly as material is removed throughout different machining stages. In addition, boundary geometric constraints alter dynamic properties at different tool-workpiece contact positions. Therefore, this paper accounts for the time-varying nature of thin-walled components and extracts dynamic parameters via the above method for diverse tool positions and distinct machining stages. Meanwhile, Figure 2 reveals that the torsional deformation at the central node is negligible. As illustrated in Figure 3, there are two symmetric nodes at which both bending and torsional deformations can be ignored.
In Section 4, two milling stability experiments of thin-walled components are carried out. As illustrated in Figure 1, the material removal length along the feed direction is 100 mm, and the radial cutting depth is 1 mm. The axial cutting depths of the two experiments are set to 2 and 4 mm, respectively. To account for the influences of material removal and variable tool positions on machining stability, five discrete tool positions are arranged along the feed direction. Tool position 1 refers to the starting point of feeding; positions 2 and 4 are located near the bending-torsion nodes for the 3rd-order mode; position 3 lies close to the torsional node of the 2nd-order mode; and position 5 is 5 mm away from the end point of the feeding path.
Table 1 summarizes the time-varying dynamic parameters at five tool positions derived from the present method. The damping ratios extracted via impact hammer modal testing (the modal test adopted a multiple-input single-output configuration. Five hammering locations corresponding to different tool positions are defined, with five excitations performed at each tool position. The impact hammer model is LC02-3A102, fitted with a steel tip. The miniature piezoelectric accelerometer model 1A803E is mounted at tool position 3 to capture X-direction response signals. The sampling frequency is set to 20 kHz, and 5 averages are performed to reduce measurement noise) are assumed constant throughout material removal; the corresponding values for the first three dominant modes are 0.048, 0.0067 and 0.0052. All required parameters including milling force coefficients, natural frequencies, mass-normalized coefficients and damping ratios at each tool position are now available. Subsequently, the above parameters are taken as input variables, and the method described in Section 2 is adopted to plot stability lobe diagrams for the five tool positions under axial depths of cut of 2 mm and 4 mm, as illustrated in Figure 5 and Figure 6.

3.2. Stability Lobes for Different Tool Positions and Cutting Depths

The parameters derived above are adopted as input data, and the approach presented in Section 2 is utilized to generate the stability lobe diagrams displayed in Figure 5 and Figure 6. A spindle speed of 6000 rpm is adopted for both the present section and Section 4 to facilitate subsequent frequency-domain analysis and chatter frequency identification. At this rotational speed, the fundamental spindle frequency reaches 100 Hz, and the tooth passing frequency is 200 Hz. These characteristic frequencies provide clear benchmarks for identifying chatter frequency components.
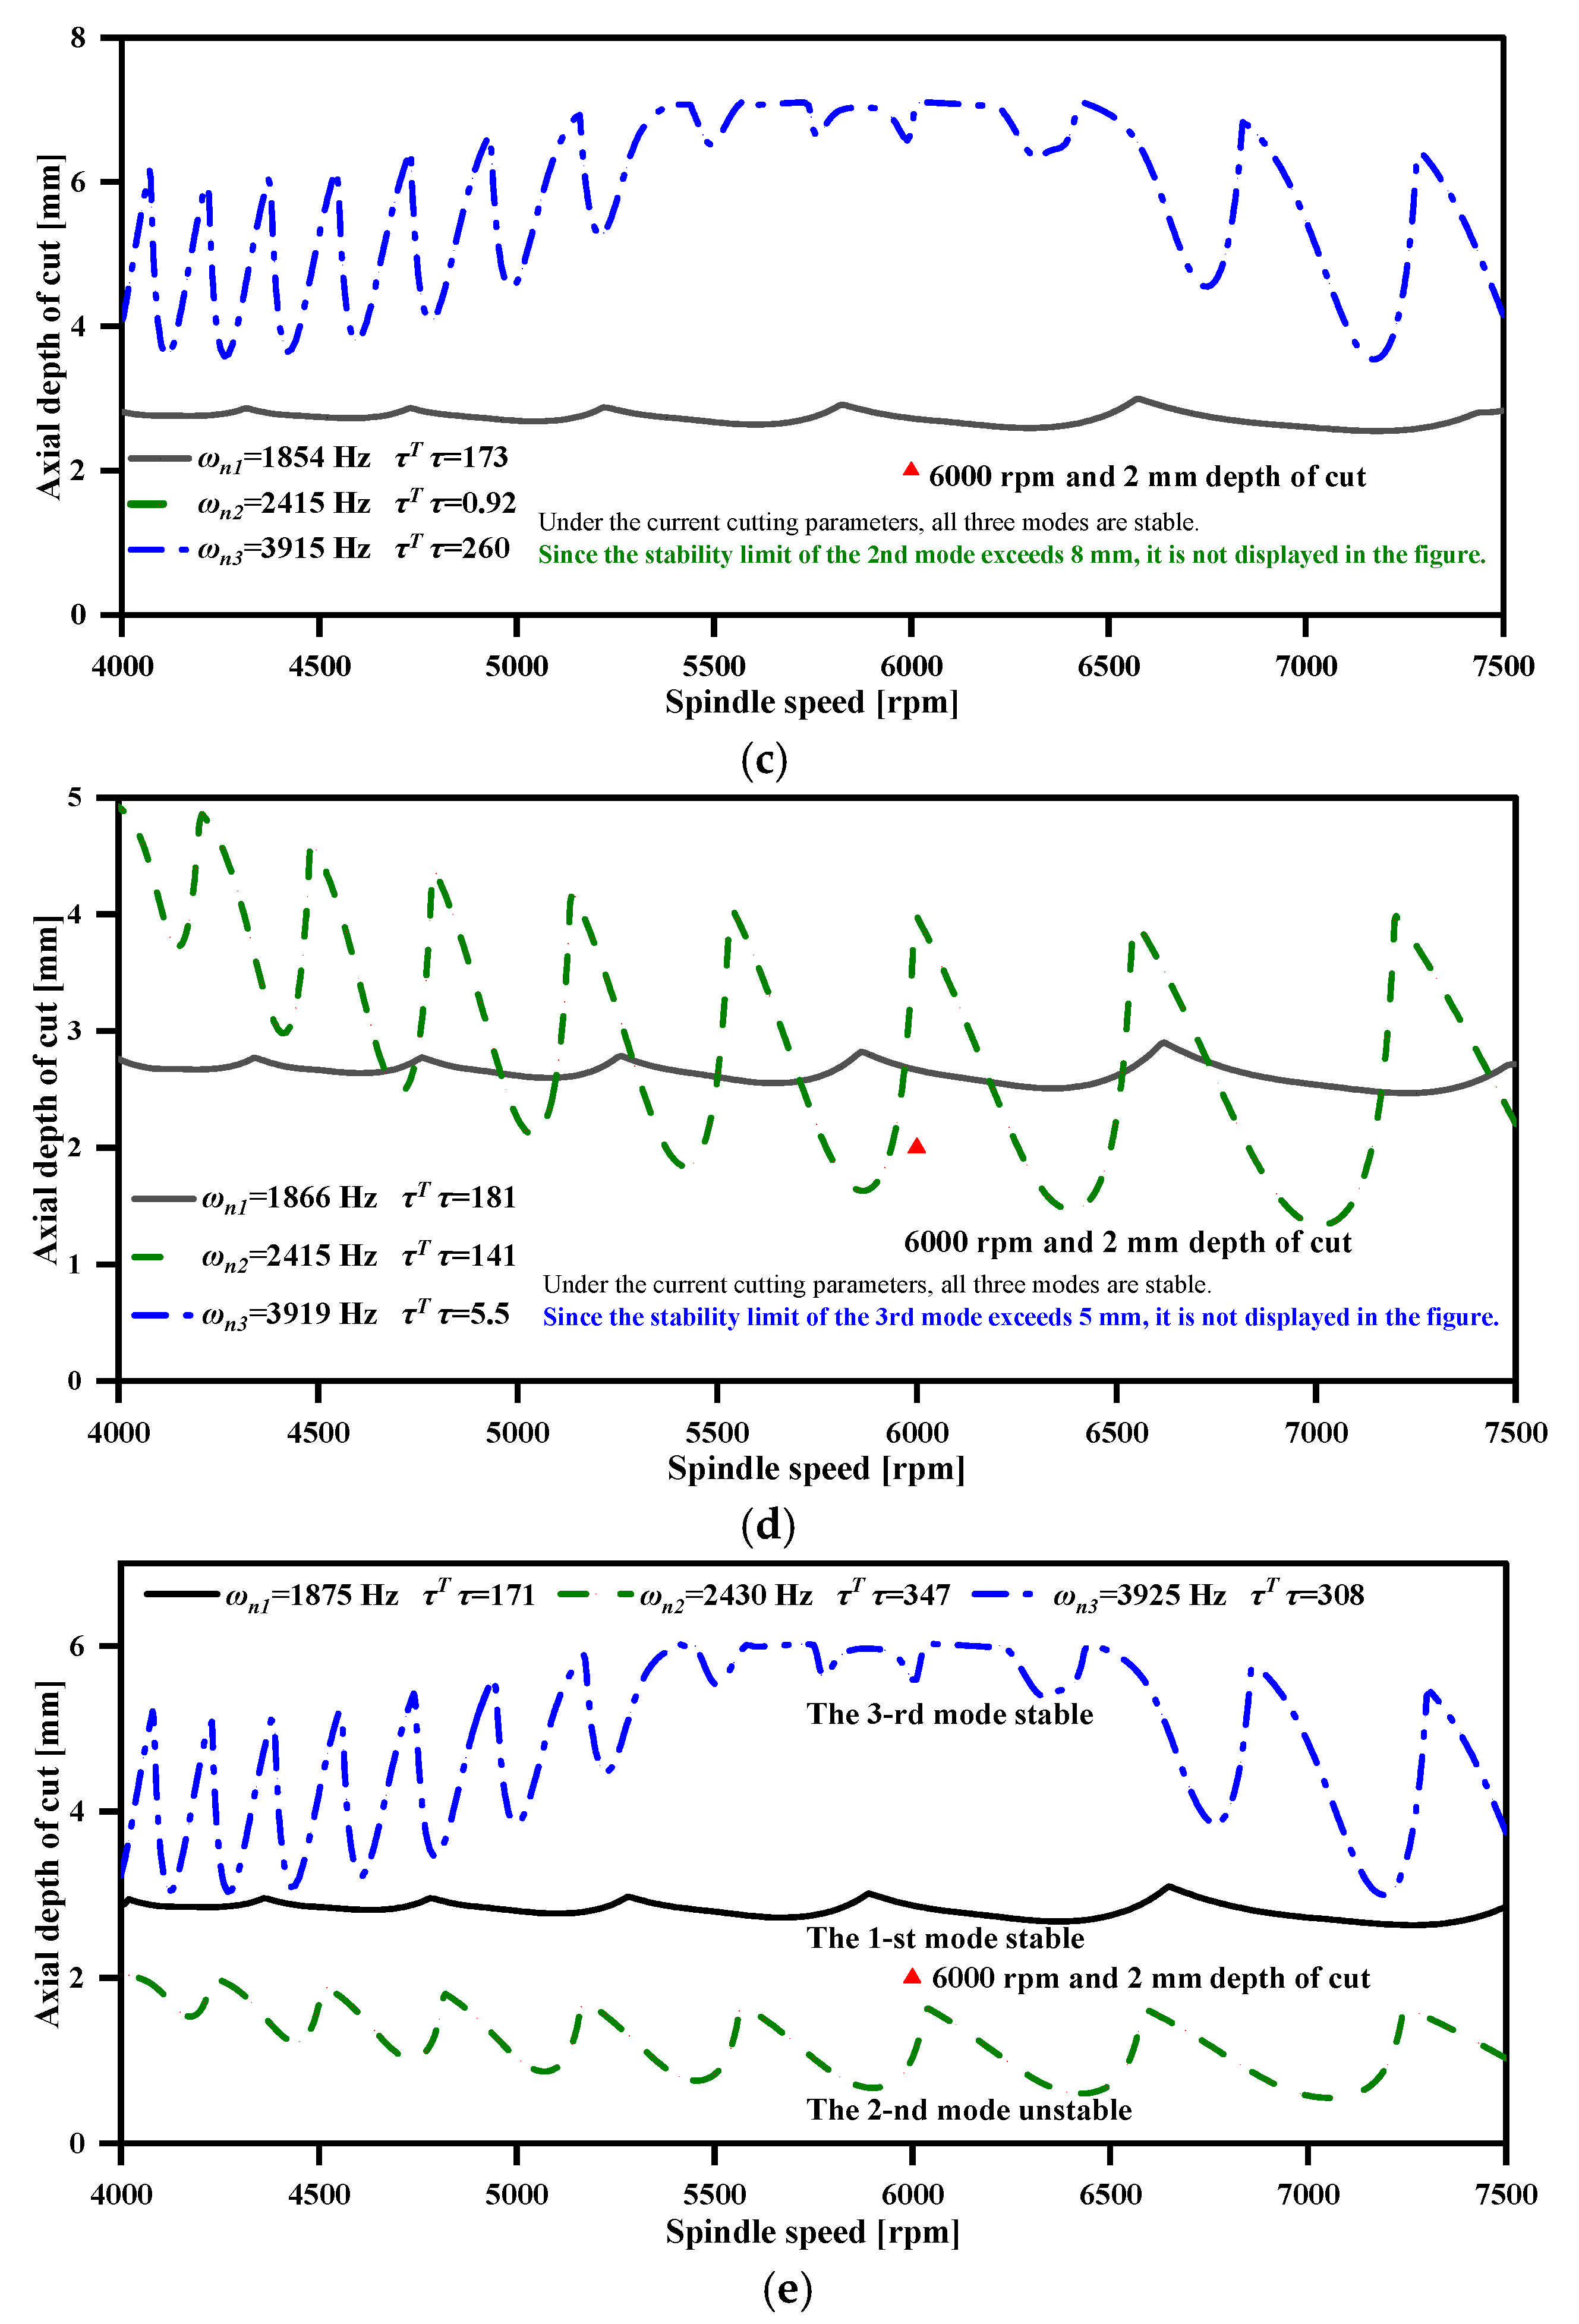
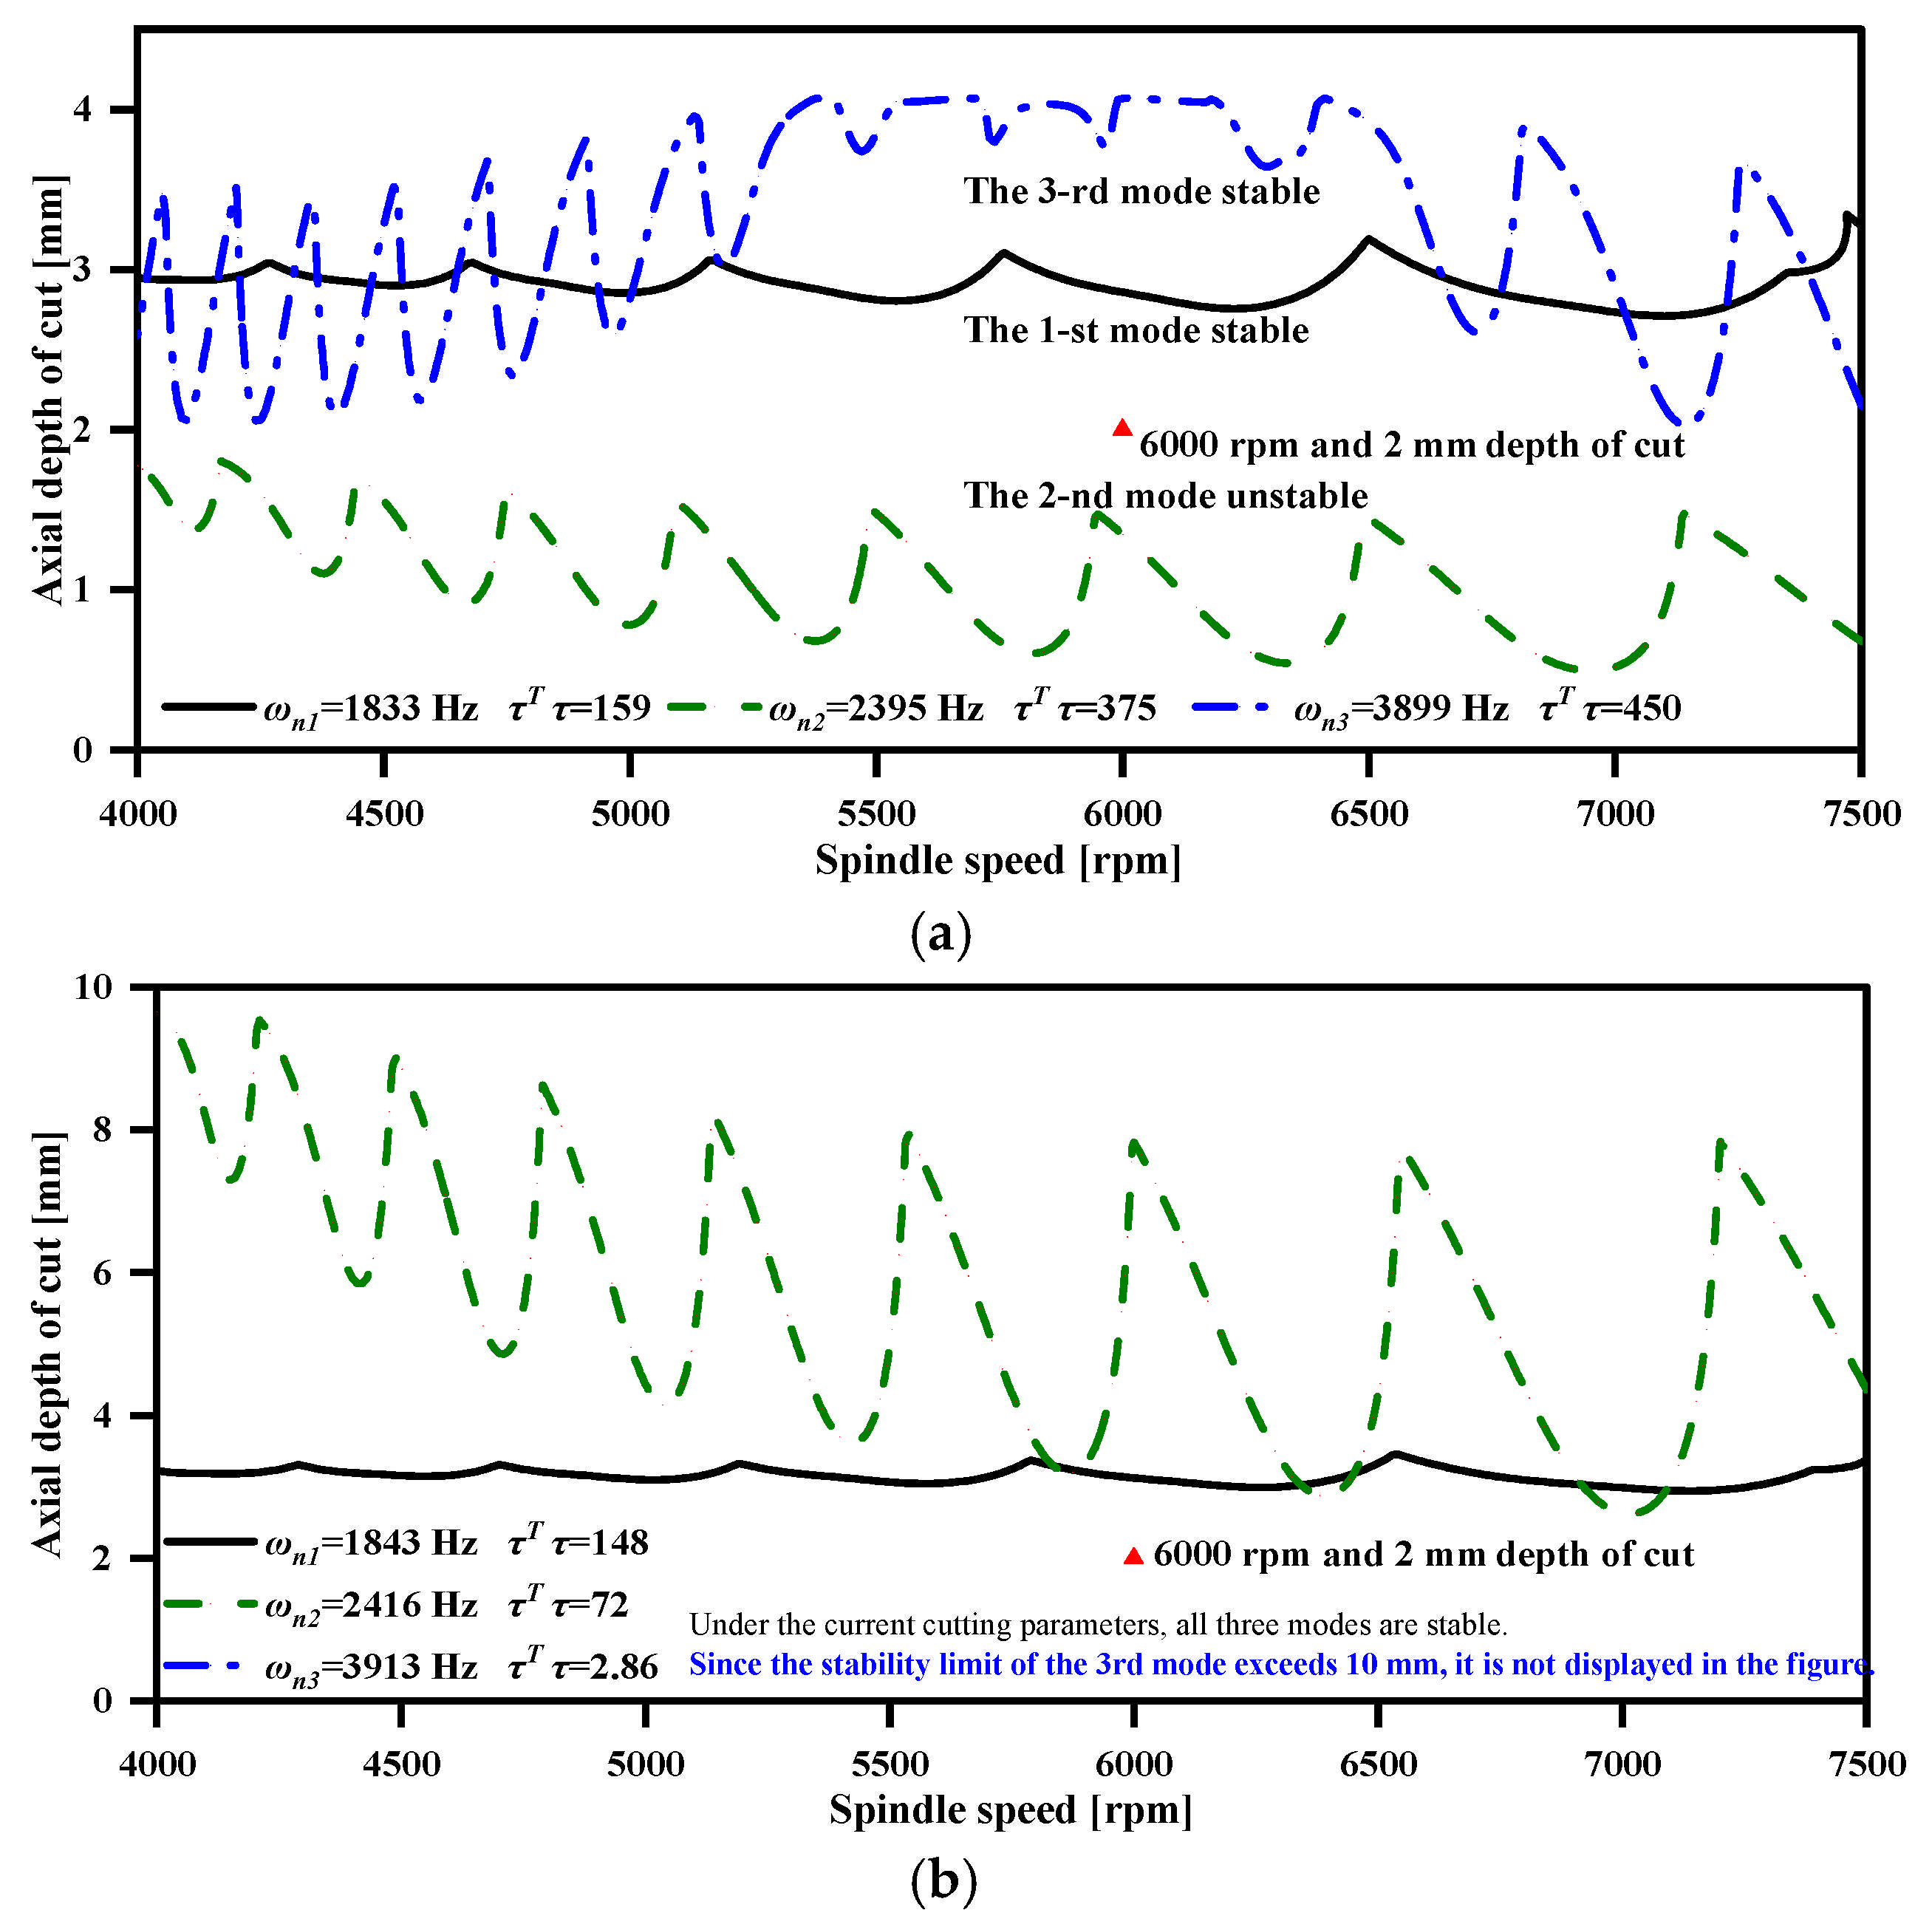
Figure 5a–e presents the lobe diagrams at five tool positions with an axial depth of cut of 2 mm. Figure 5a presents the stability lobe diagram at tool position 1 under an axial depth of cut of 2 mm. The prediction results demonstrate that the 1st- and 3rd-order modes remain stable, whereas the 2nd-order mode is unstable. Figure 5b shows the stability lobe diagram for tool position 2. The predictive results reveal that all three modes are stable at the selected spindle speed. Since tool position 2 is located near the bending-torsion node of the 3rd-order mode, the stability limit of the 3rd-order mode greatly exceeds 10 mm and is thus not displayed in the diagram. Figure 5c corresponds to the stability lobe diagram of tool position 3. The predicted outcomes indicate all three modes stay stable. Tool position 3 lies close to the torsional node of the 2nd-order mode, so the stability limit of the 2nd-order mode far surpasses 8 mm and is omitted from the figure. Figure 5d illustrates the stability lobe diagram at tool position 4. It is observed that all three modes maintain stable conditions. As tool position 4 is adjacent to the bending-torsion node of the 3rd-order mode, its stability limit substantially exceeds 5 mm and is not plotted herein. Figure 5e presents the stability lobe diagram of tool position 5. The predictive results show that the 2nd-order mode turns unstable, while the 1st- and 3rd-order modes stay stable.
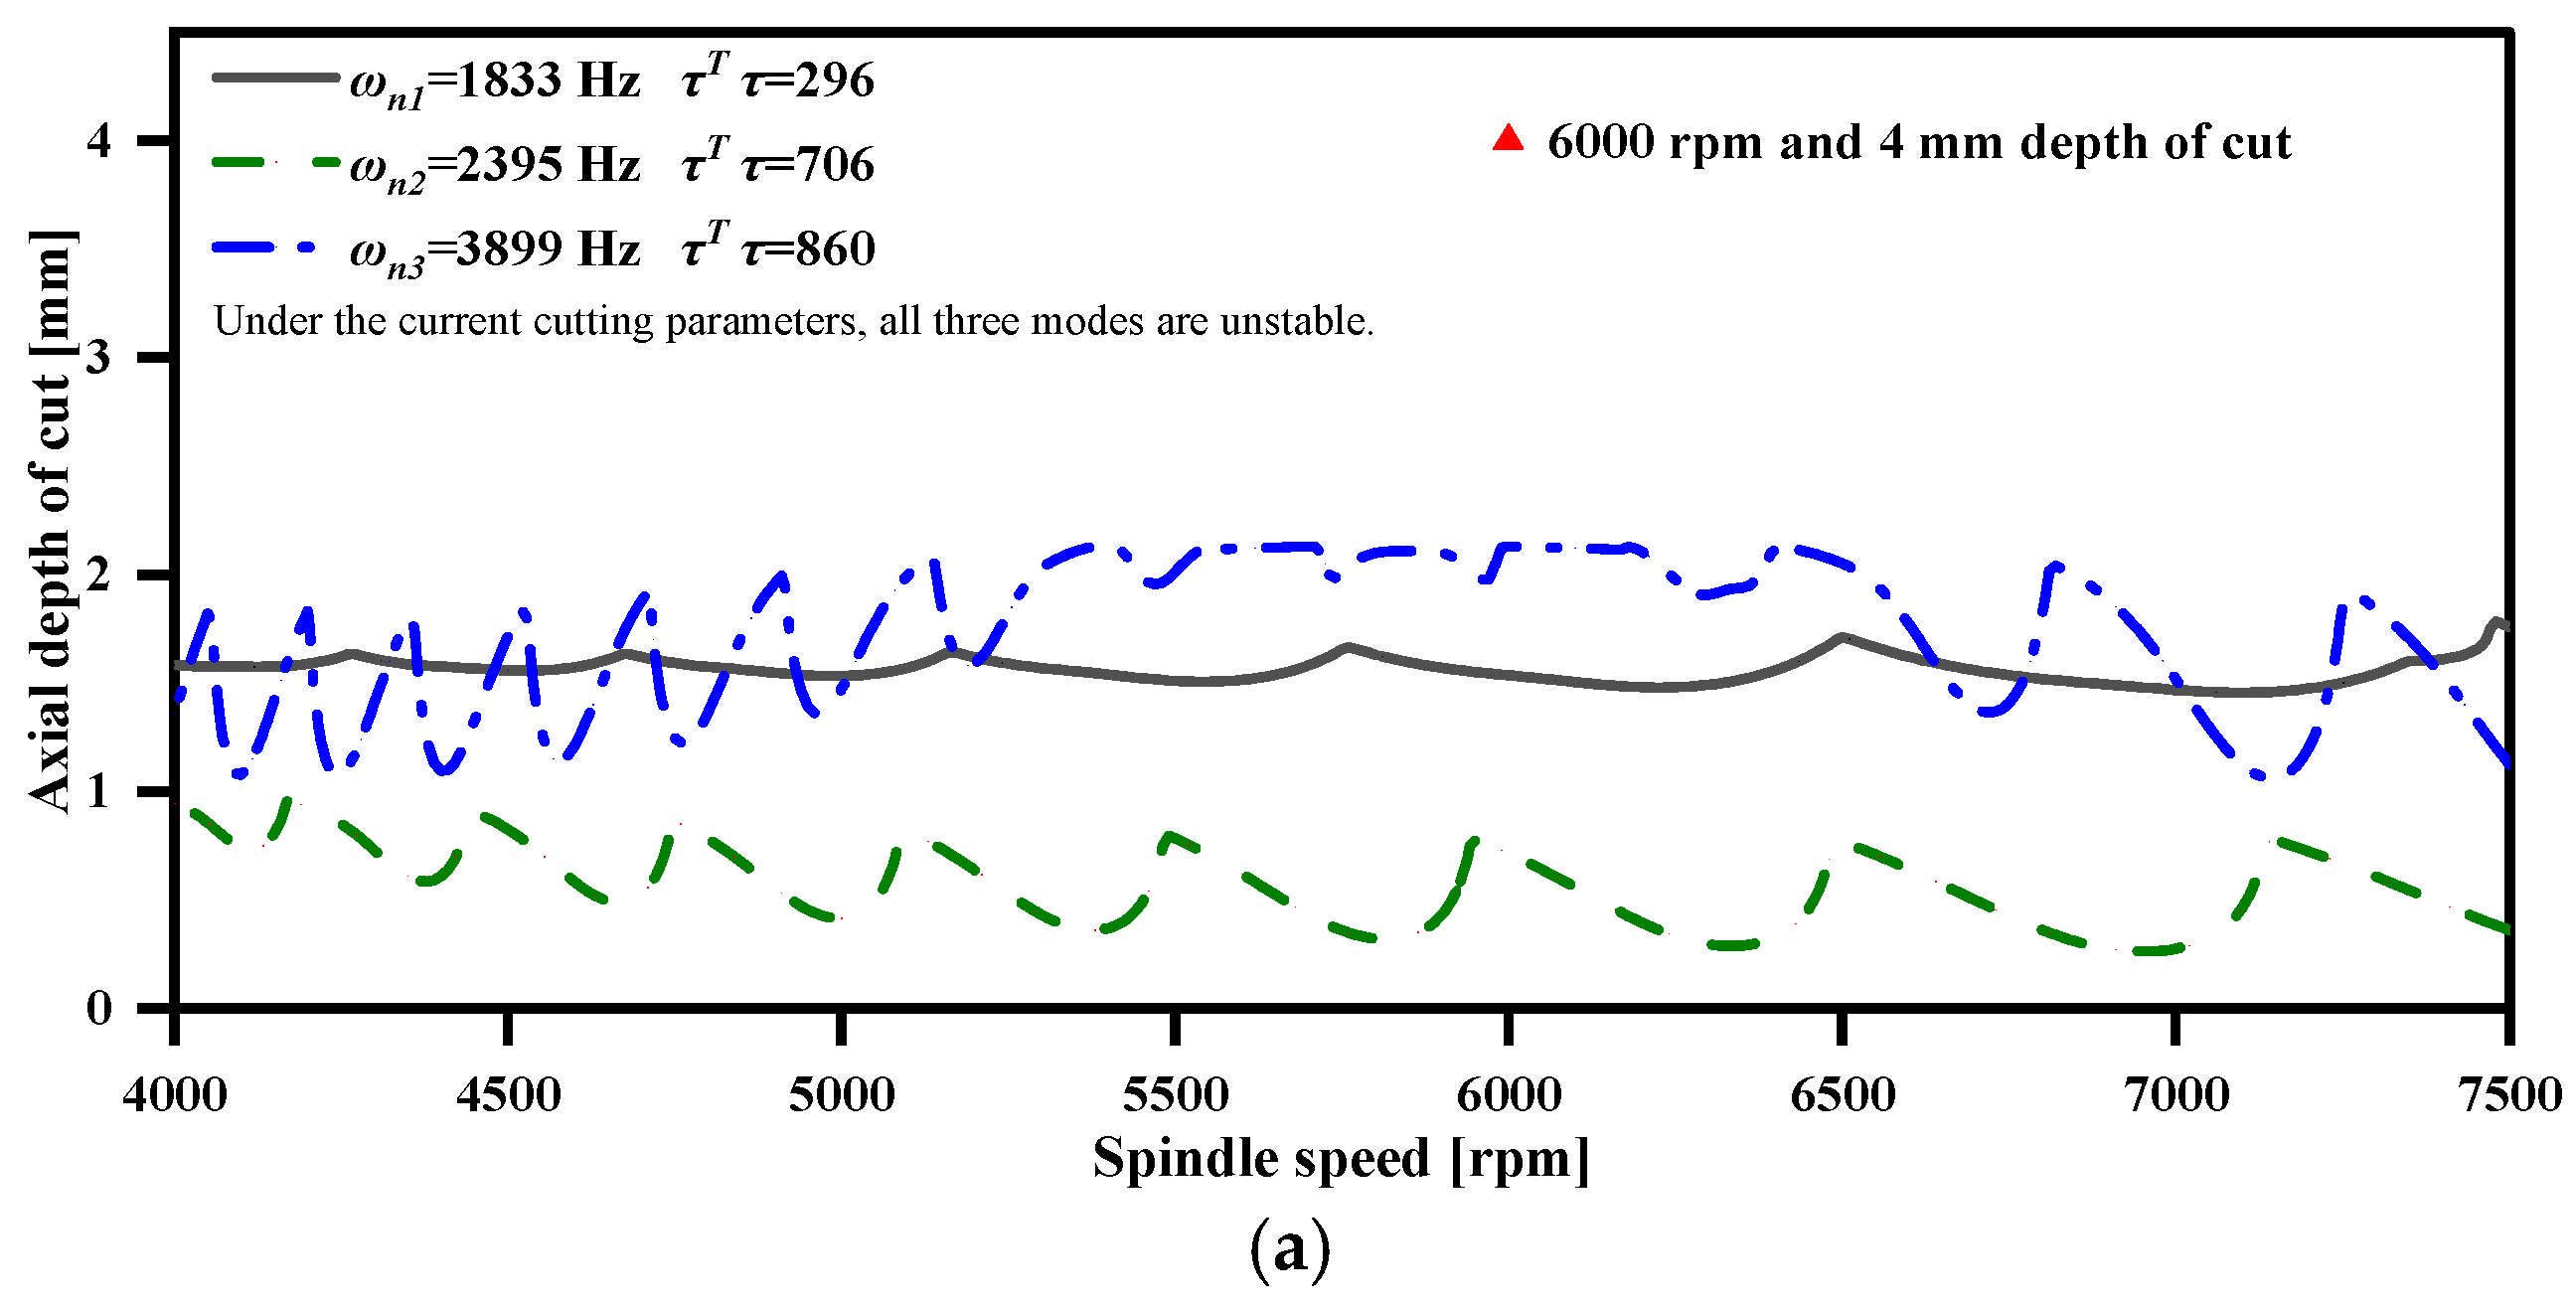
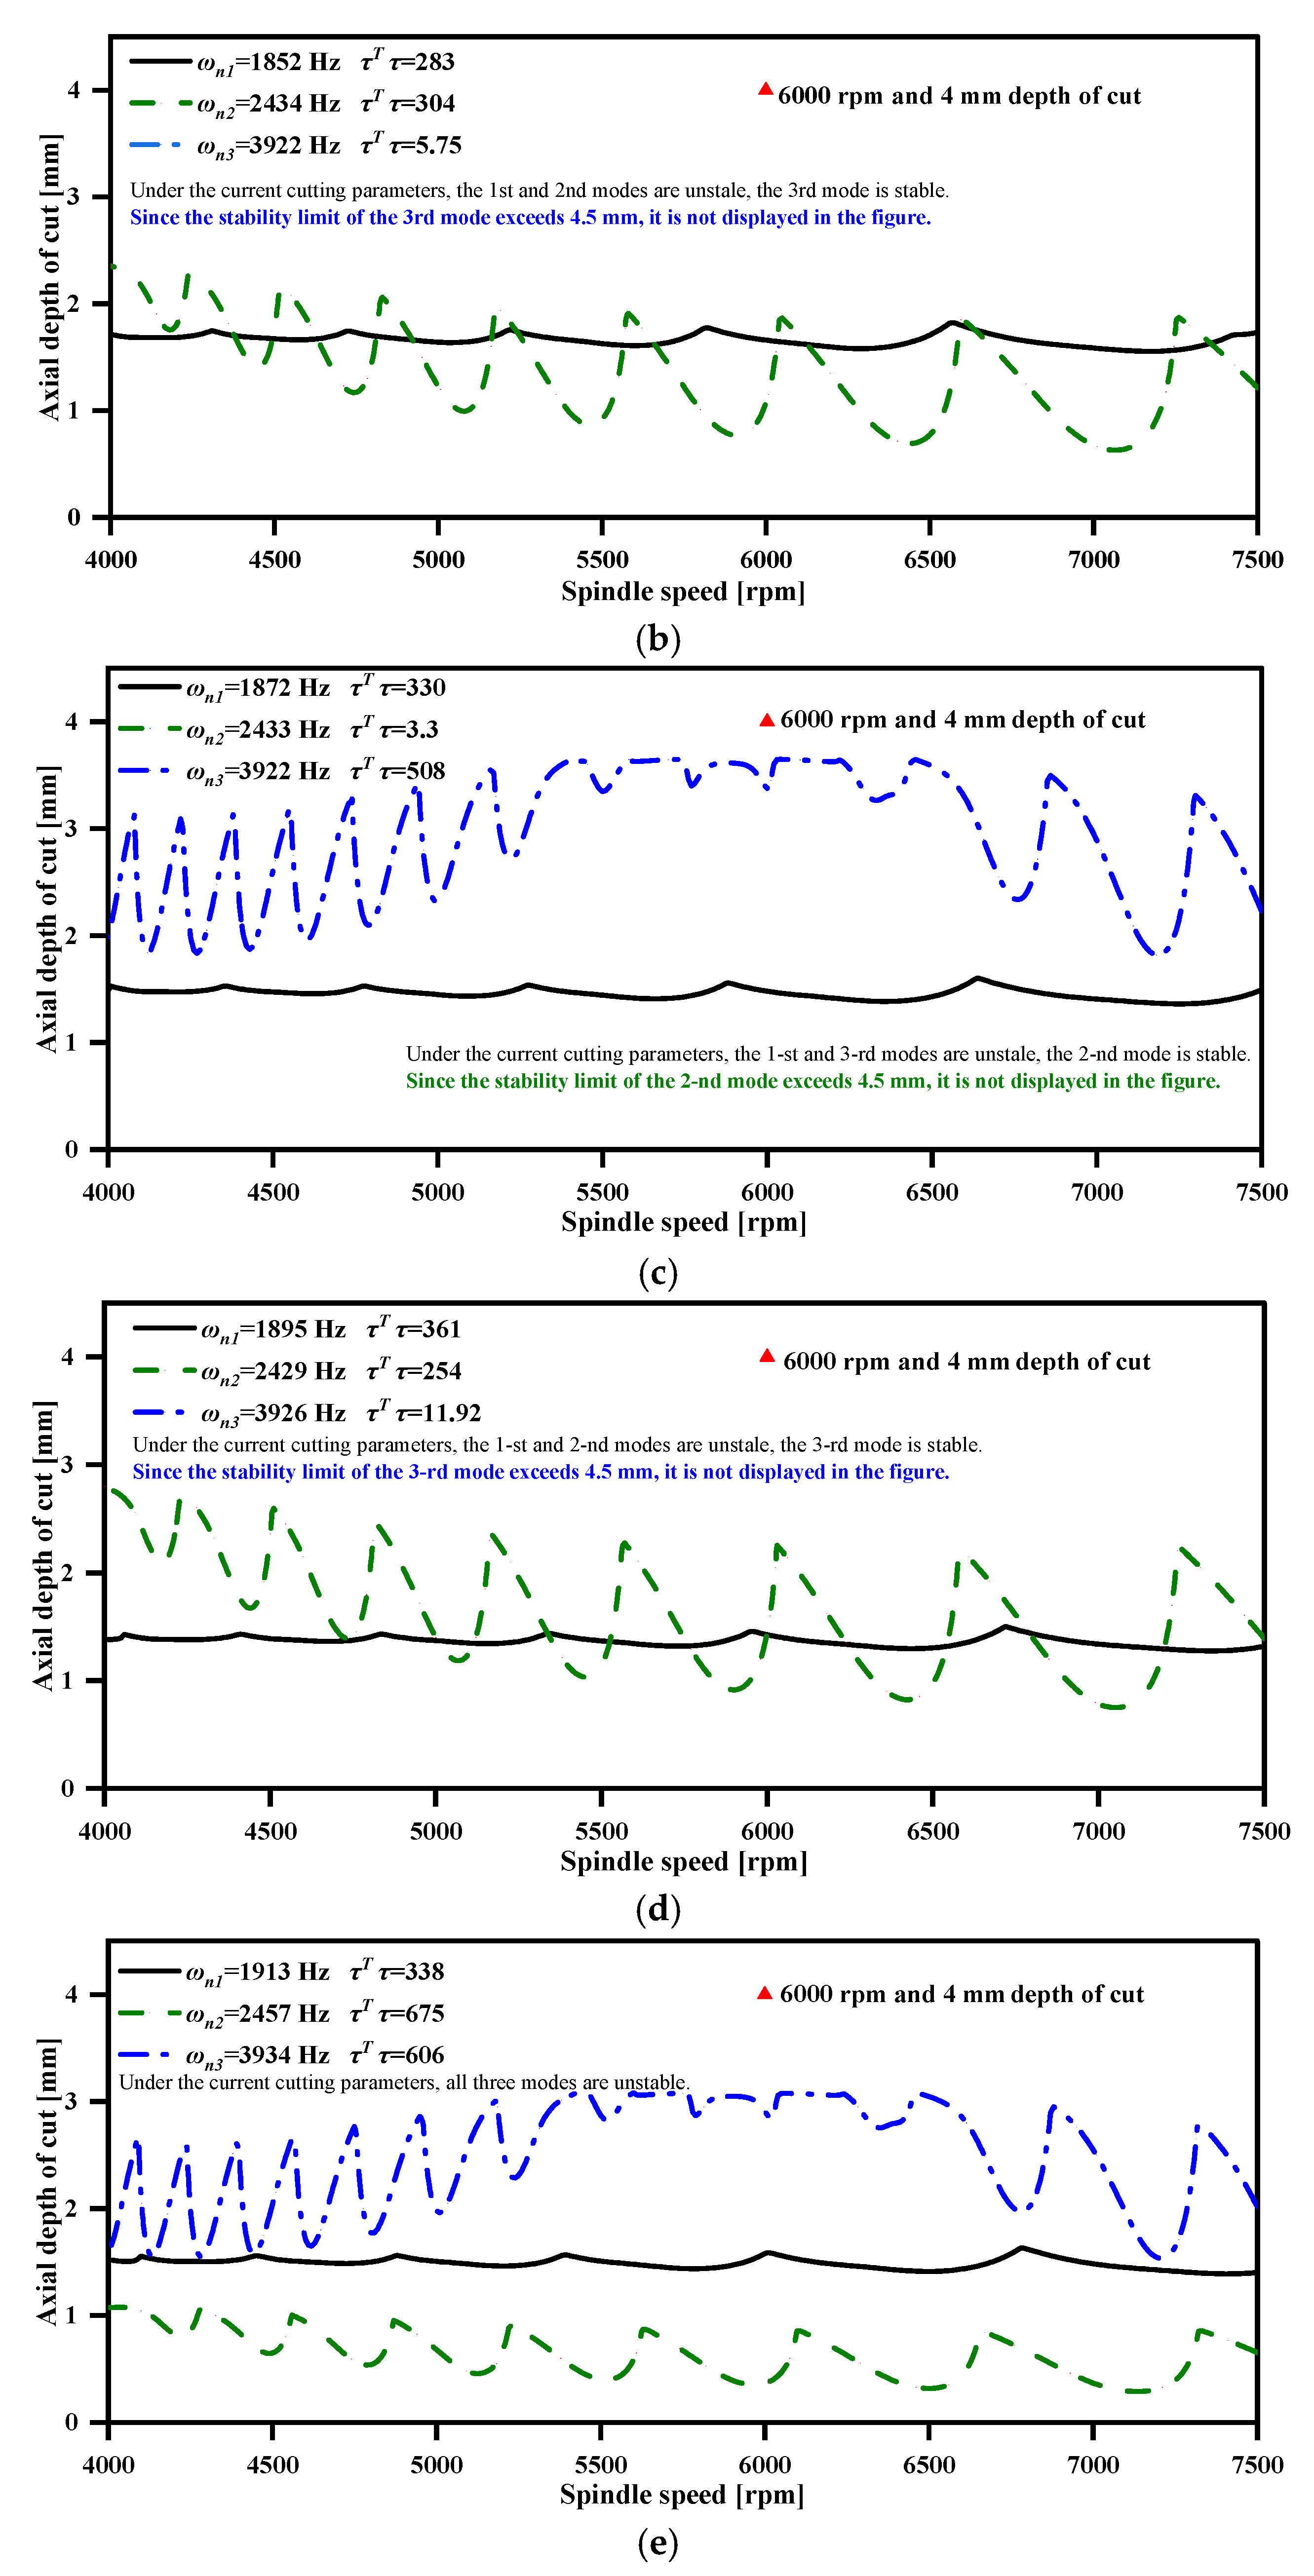
Figure 6a–e shows the stability lobes for the 4 mm axial depth of cut. Figure 6a presents the stability lobe diagram for tool position 1 at an axial depth of cut of 4 mm. The prediction results demonstrate that all three modes become unstable. Figure 6b shows the stability lobe diagram of tool position 2. The predictive results reveal that under the adopted cutting parameters, the 1st- and 2nd-order modes are unstable, while the 3rd-order mode remains stable. Since tool position 2 is located near the bending-torsion node of the 3rd-order mode, the stability limit of the 3rd-order mode far exceeds 4.5 mm and is thus not displayed in the figure. Figure 6c corresponds to the stability lobe diagram of tool position 3. The predicted outcomes indicate that the 1st- and 3rd-order modes are unstable, whereas the 2nd-order mode stays stable. Tool position 3 lies close to the torsional node of the second-order mode, so the stability limit of the 2nd-order mode greatly surpasses 4.5 mm and is omitted from the diagram. Figure 6d illustrates the stability lobe diagram for tool position 4. It is observed that the 1st- and 2nd-order modes are unstable, while the 3rd-order mode maintains a stable state. As tool position 4 is adjacent to the bending-torsion node of the 3rd-order mode, its stability limit substantially exceeds 4.5 mm and is not plotted herein. Figure 6e presents the stability lobe diagram of tool position 5. The predictive results show that all three modes fall into an unstable region.

4. Experimental Verification of Milling Stability

4.1. Experimental Setup

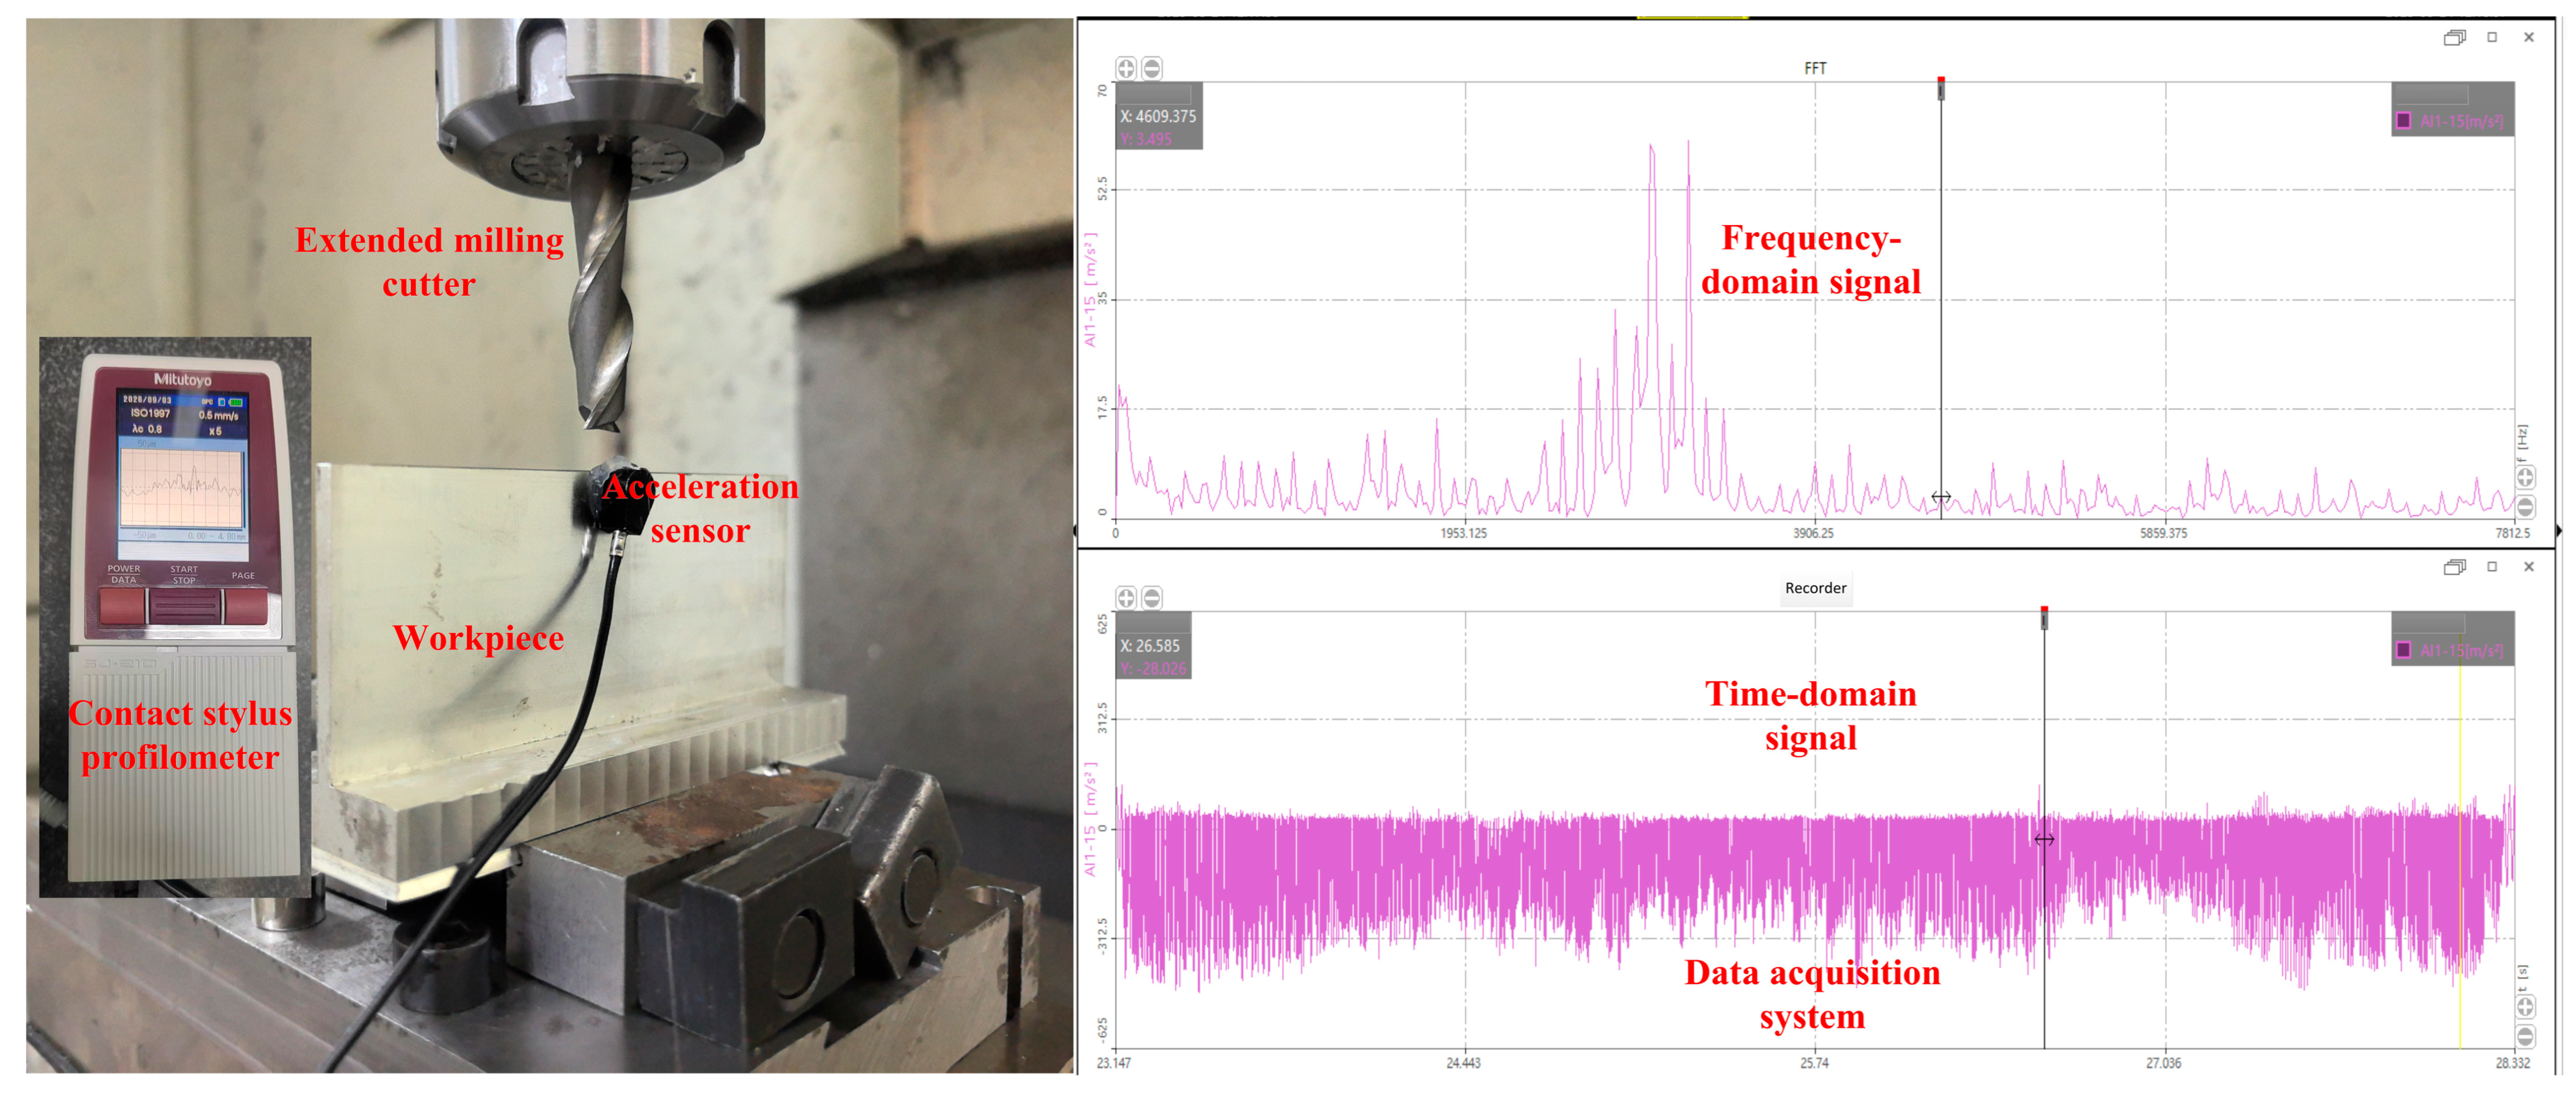
As shown in Figure 7, a two-flute extended helical carbide end mill with a diameter of 10 mm and a helix angle of 30° is used in the experiment, with a cutting edge length of 42 mm and tool overhang length of 41 mm. Climb milling under dry cutting condition is adopted for the machining test. The machining equipment is an XD-40A three-axis milling machine equipped with a Siemens 828D control system. The initial dimensions of the thin-walled workpiece are 100 mm × 40 mm × 3 mm, and the material is aerospace aluminum alloy 7050.
According to the conclusion proposed by Axinte et al. [32], acceleration signals are more sensitive to chatter than acoustic emission and cutting force signals. Therefore, the 1A803E acceleration sensor is utilized to collect vibration signals of thin-walled components in this section. The collected signals are analyzed via the Donghua DH-5922D data acquisition and analysis system.
For the 1st set of experiment, the material removal amount is 1 mm along the X direction (tool radial direction) and 100 mm along the feed direction, with an axial depth of cut of 2 mm, and the feed per tooth of 0.2 mm. For the 2nd set of experiment, the material removal amount is 1 mm along the X direction (tool radial direction) and 100 mm along the feed direction, with an axial depth of cut of 4 mm, and the feed per tooth of 0.1 mm. It is worth noting that although different feeds are adopted in the two sets of experiments, the study does not aim to compare the experimental results (e.g., surface roughness and vibration amplitude).

4.2. The 1st Experimental Set

The cutting parameters for the 1st experiment are specified as follows: spindle speed of 6000 rpm, radial depth of cut of 1 mm, axial depth of cut of 2 mm, and feed per tooth of 0.2 mm.
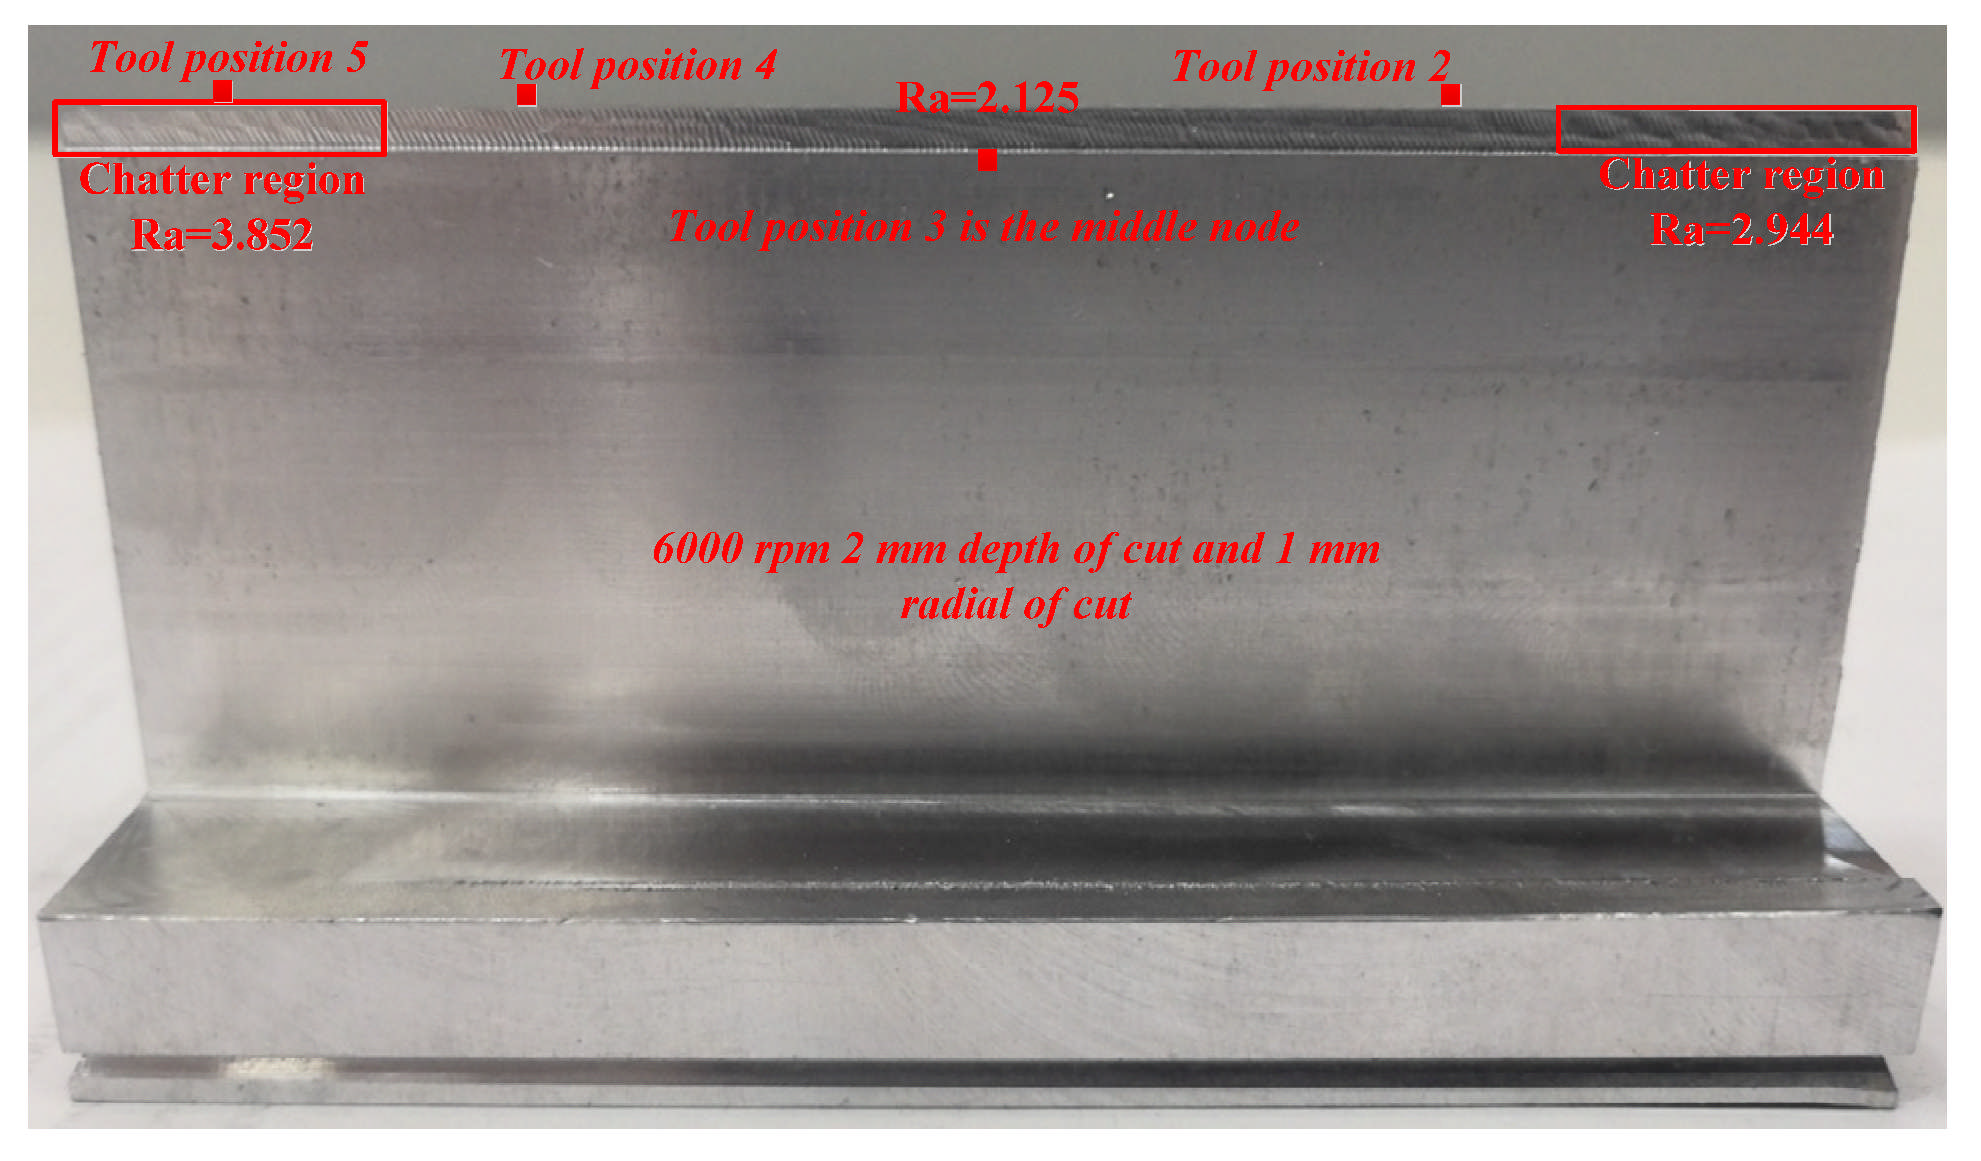
Figure 8 shows the surface topography of the thin-walled component. Distinct chatter marks appear in the region to the left of tool position 1. The region between tool position 2 and position 4 corresponds to stable machining; slight tool cutting marks exist yet the surface remains generally smooth. Noticeable chatter marks are also found near tool position 5. The machined surface around tool position 3 (close to the torsional node of the 2nd-order mode) exhibits the best surface integrity. Multiple measurements are carried out using a contact stylus profilometer, as shown in Figure 7. Measurements are performed with a sampling length of 1 mm and an evaluation length of 4 mm using a standard diamond stylus. The arithmetic-mean surface roughness within chatter-affected zones reaches 2.944 μm and 3.852 μm, respectively, while the roughness value in the stable cutting region is 2.125 μm. Each position was measured five times and the average value was adopted. This observation is consistent with the prediction results from the stability lobe diagrams.
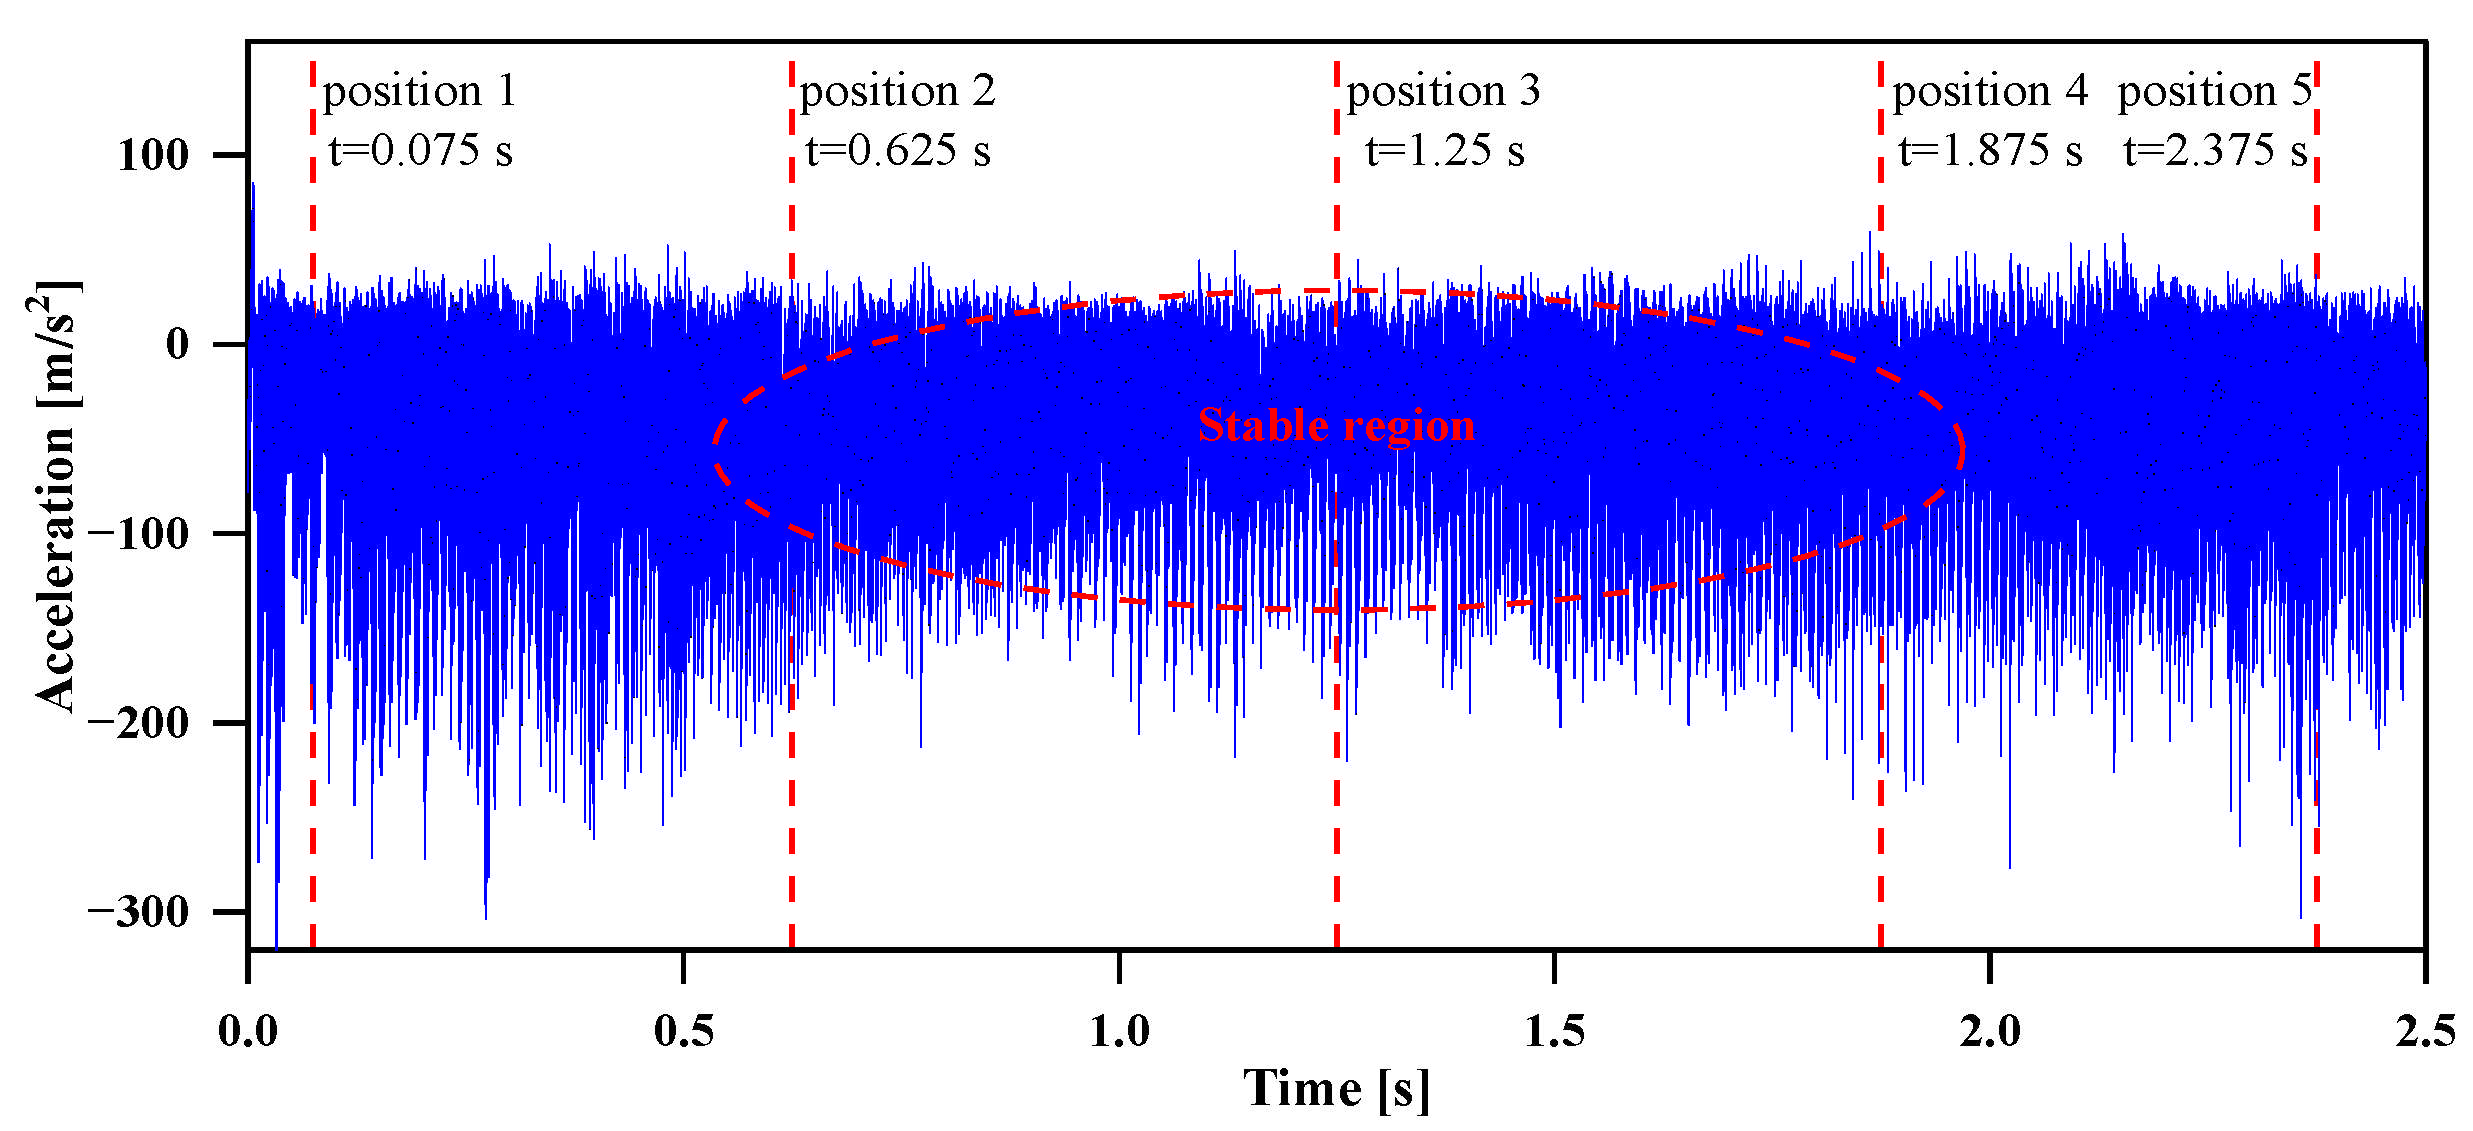
Figure 9 presents the acceleration signals acquired over the entire machining process. It is observed that the signal amplitude within the stable region between tool positions 2 and 4 is remarkably lower than that in the chatter zones covering tool positions 1–2 and 4–5.
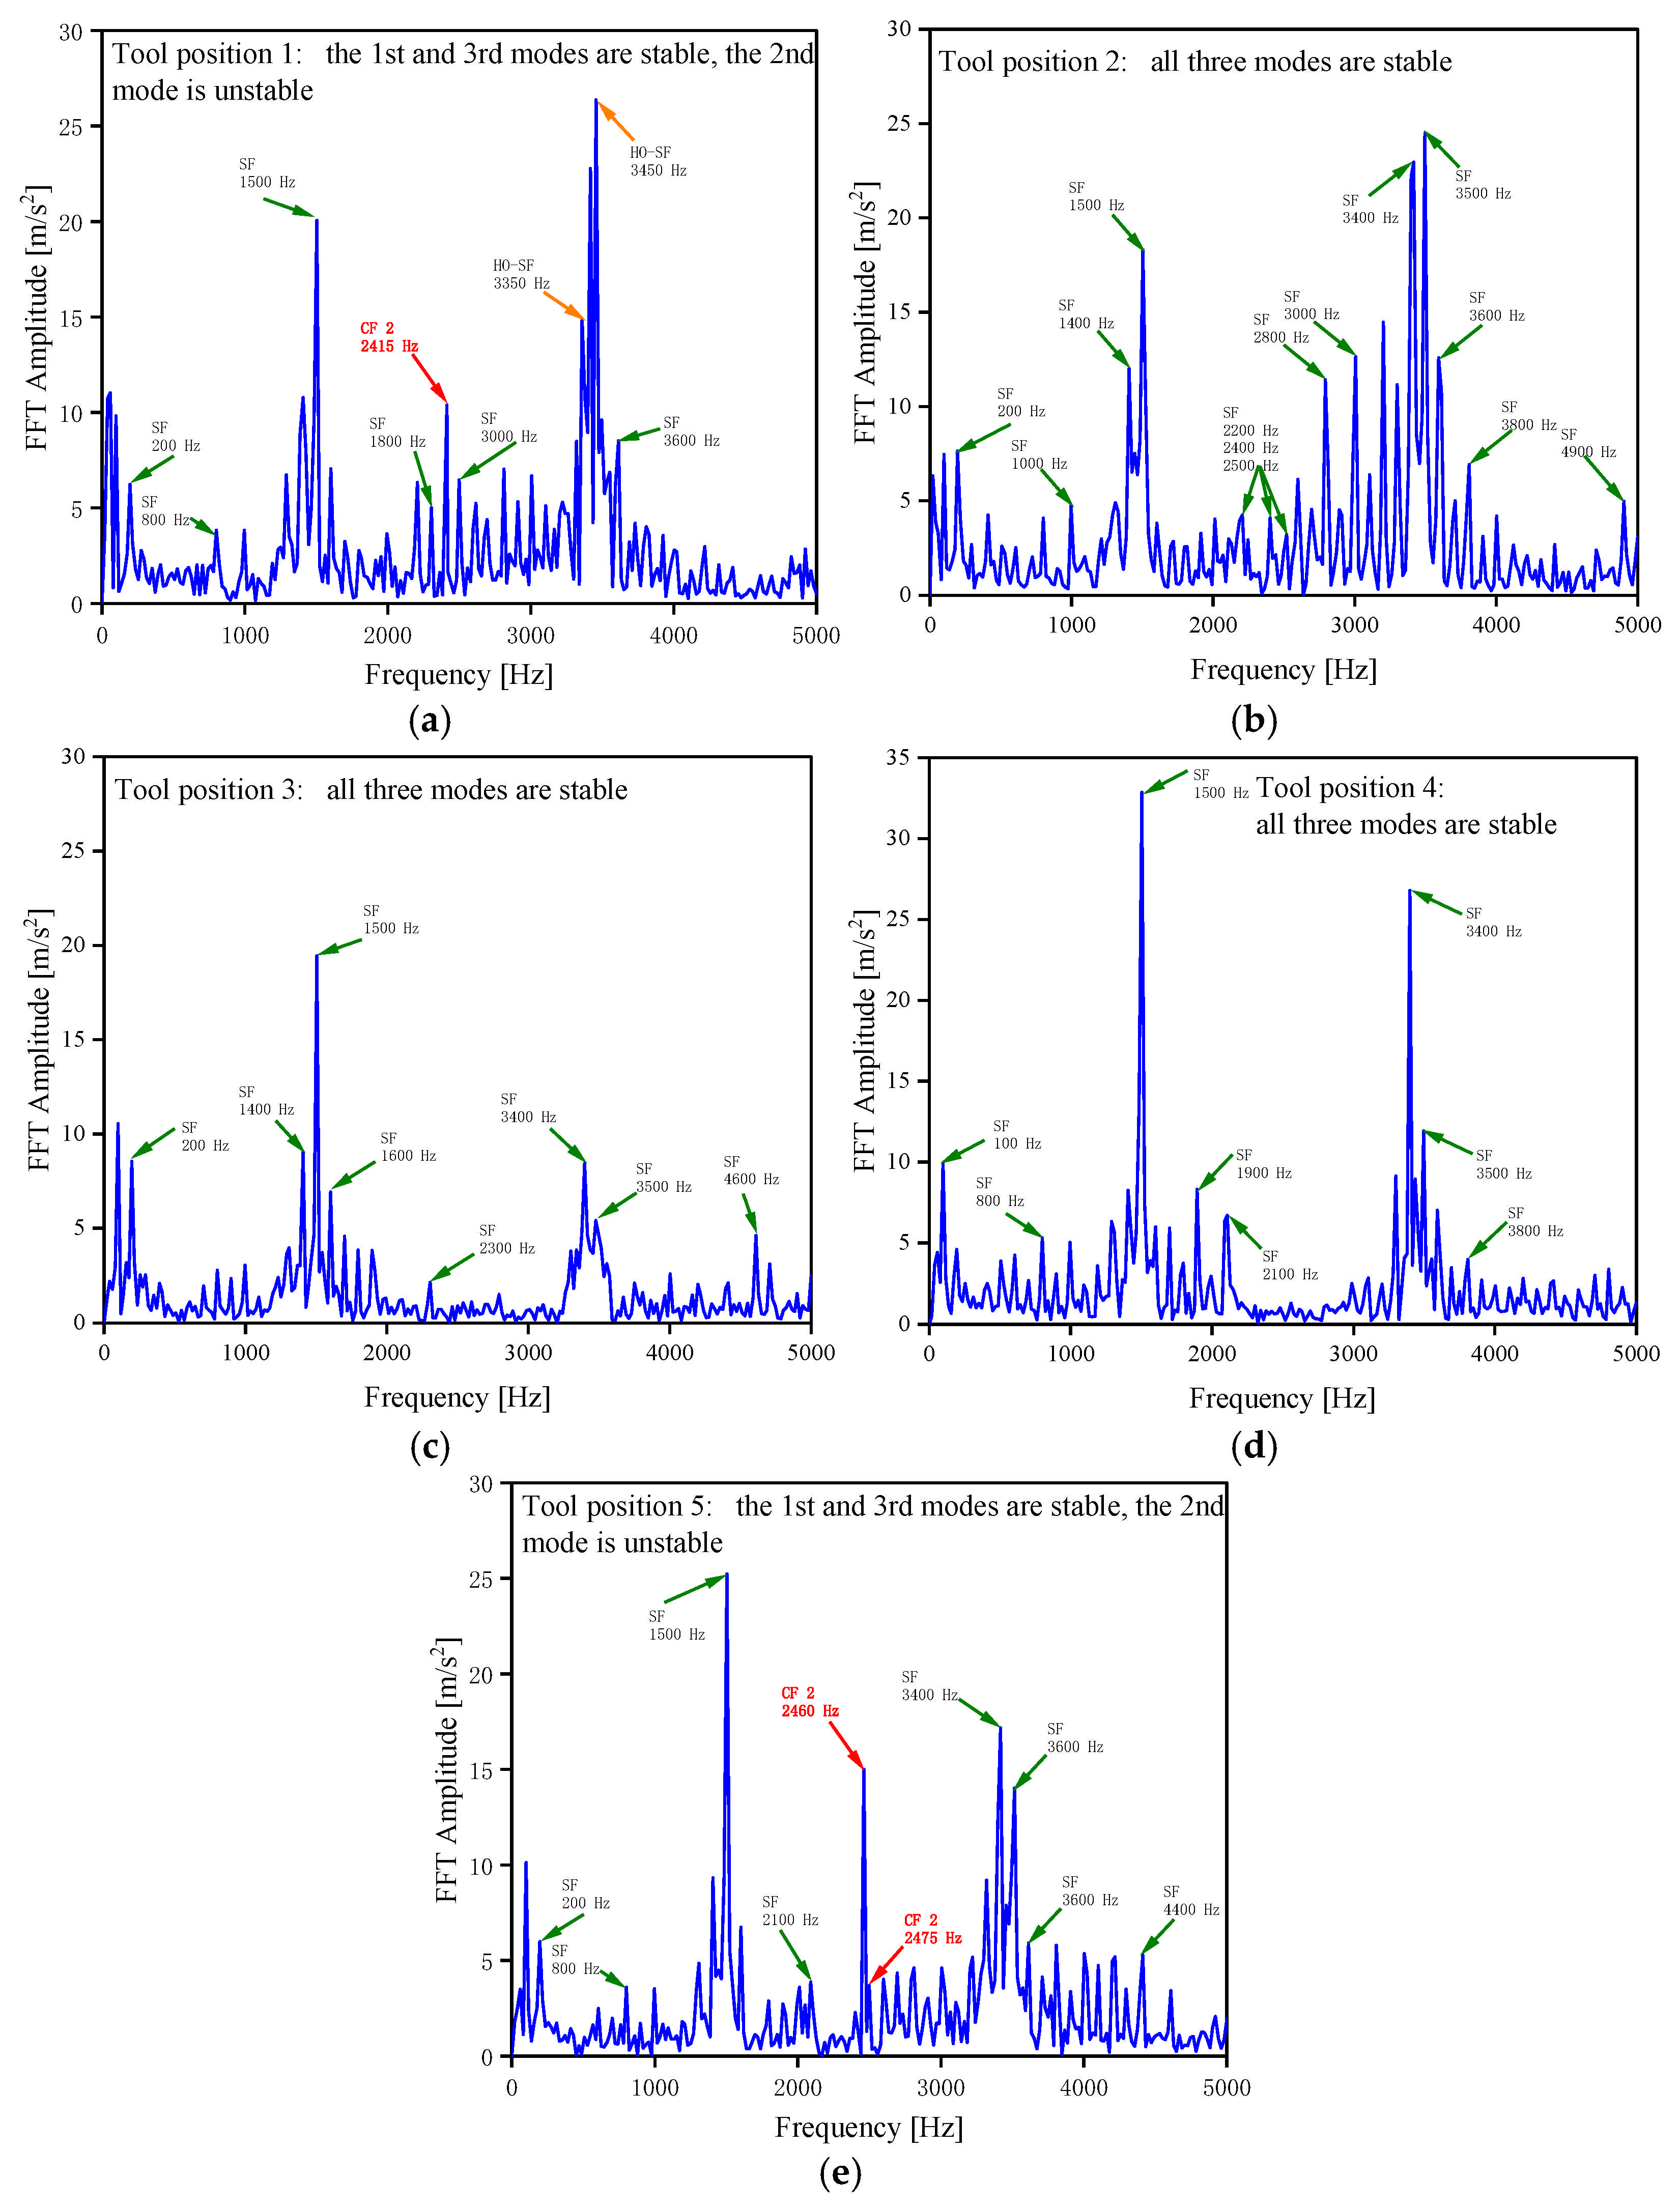
Figure 10a–e illustrates the frequency-domain signals obtained via Fast Fourier Transform near tool positions 1 to 5, sampled at t = 0.075 s, t = 0.625 s, t = 1.25 s, t = 1.875 s and t = 2.375 s. The FFT calculation adopts an amplitude spectrum with a rectangular window. The sampling rate is set to 20 kHz and the FFT length is 1024, yielding a frequency resolution of 19.531 Hz. A total of 400 spectral lines are retained, and the DC removal threshold is 0.1 Hz. Within all subplots, SF denotes the harmonics of the fundamental spindle frequency, HO-SF represents the half-order harmonic of the spindle fundamental frequency, and CF(1,2,3) stand for the 1st–3rd order chatter frequencies, respectively.
Figure 10a shows the frequency-domain signal at tool position 1. A chatter frequency of 2415 Hz can be observed, which is close to the 2nd-order natural frequency of the thin-walled component 2395 Hz listed in Table 1. The dominant vibration frequency is 3450 Hz, corresponding to a half-order harmonic equal to 69 times half the spindle fundamental frequency. Most signal peaks correspond to harmonics of the fundamental spindle frequency, such as 1500 Hz, 3000 Hz and 3600 Hz. Figure 10b–d present the frequency-domain signals measured at tool positions 2–4, respectively. The spectra only contain harmonics of the fundamental spindle frequency, with dominant vibration frequencies of 3500 Hz, 1500 Hz and 1500 Hz, which indicates stable machining at these positions. Notably, Figure 10c corresponds to the spectrum at tool position 3, whose vibration amplitude (the maximum vibration amplitude reaches 19.44 m/s2 at a frequency of 1500 Hz) is obviously lower than that of the other two stable machining positions, tool position 2 (the maximum vibration amplitude reaches 24.47 m/s2 at a frequency of 3500 Hz) in Figure 10b and tool position 4 (the maximum vibration amplitude reaches 32.85 m/s2 at a frequency of 1500 Hz) in Figure 10d. This phenomenon arises from the effect of the 2nd-order torsional node, which yields superior machining stability at this location. Figure 10e displays the frequency-domain signal at tool position 5. Two chatter frequencies of 2460 Hz and 2475 Hz are observed, which are close to the 2nd-order natural frequency of the thin-walled component 2430 Hz listed in Table 1. The dominant vibration frequency is 1500 Hz, a harmonic of the fundamental spindle frequency.

4.3. The 2nd Experimental Set

The cutting parameters for the 2nd experiment are specified as follows: spindle speed of 6000 rpm, radial depth of cut of 1 mm, axial depth of cut of 4 mm, and feed per tooth of 0.1 mm.
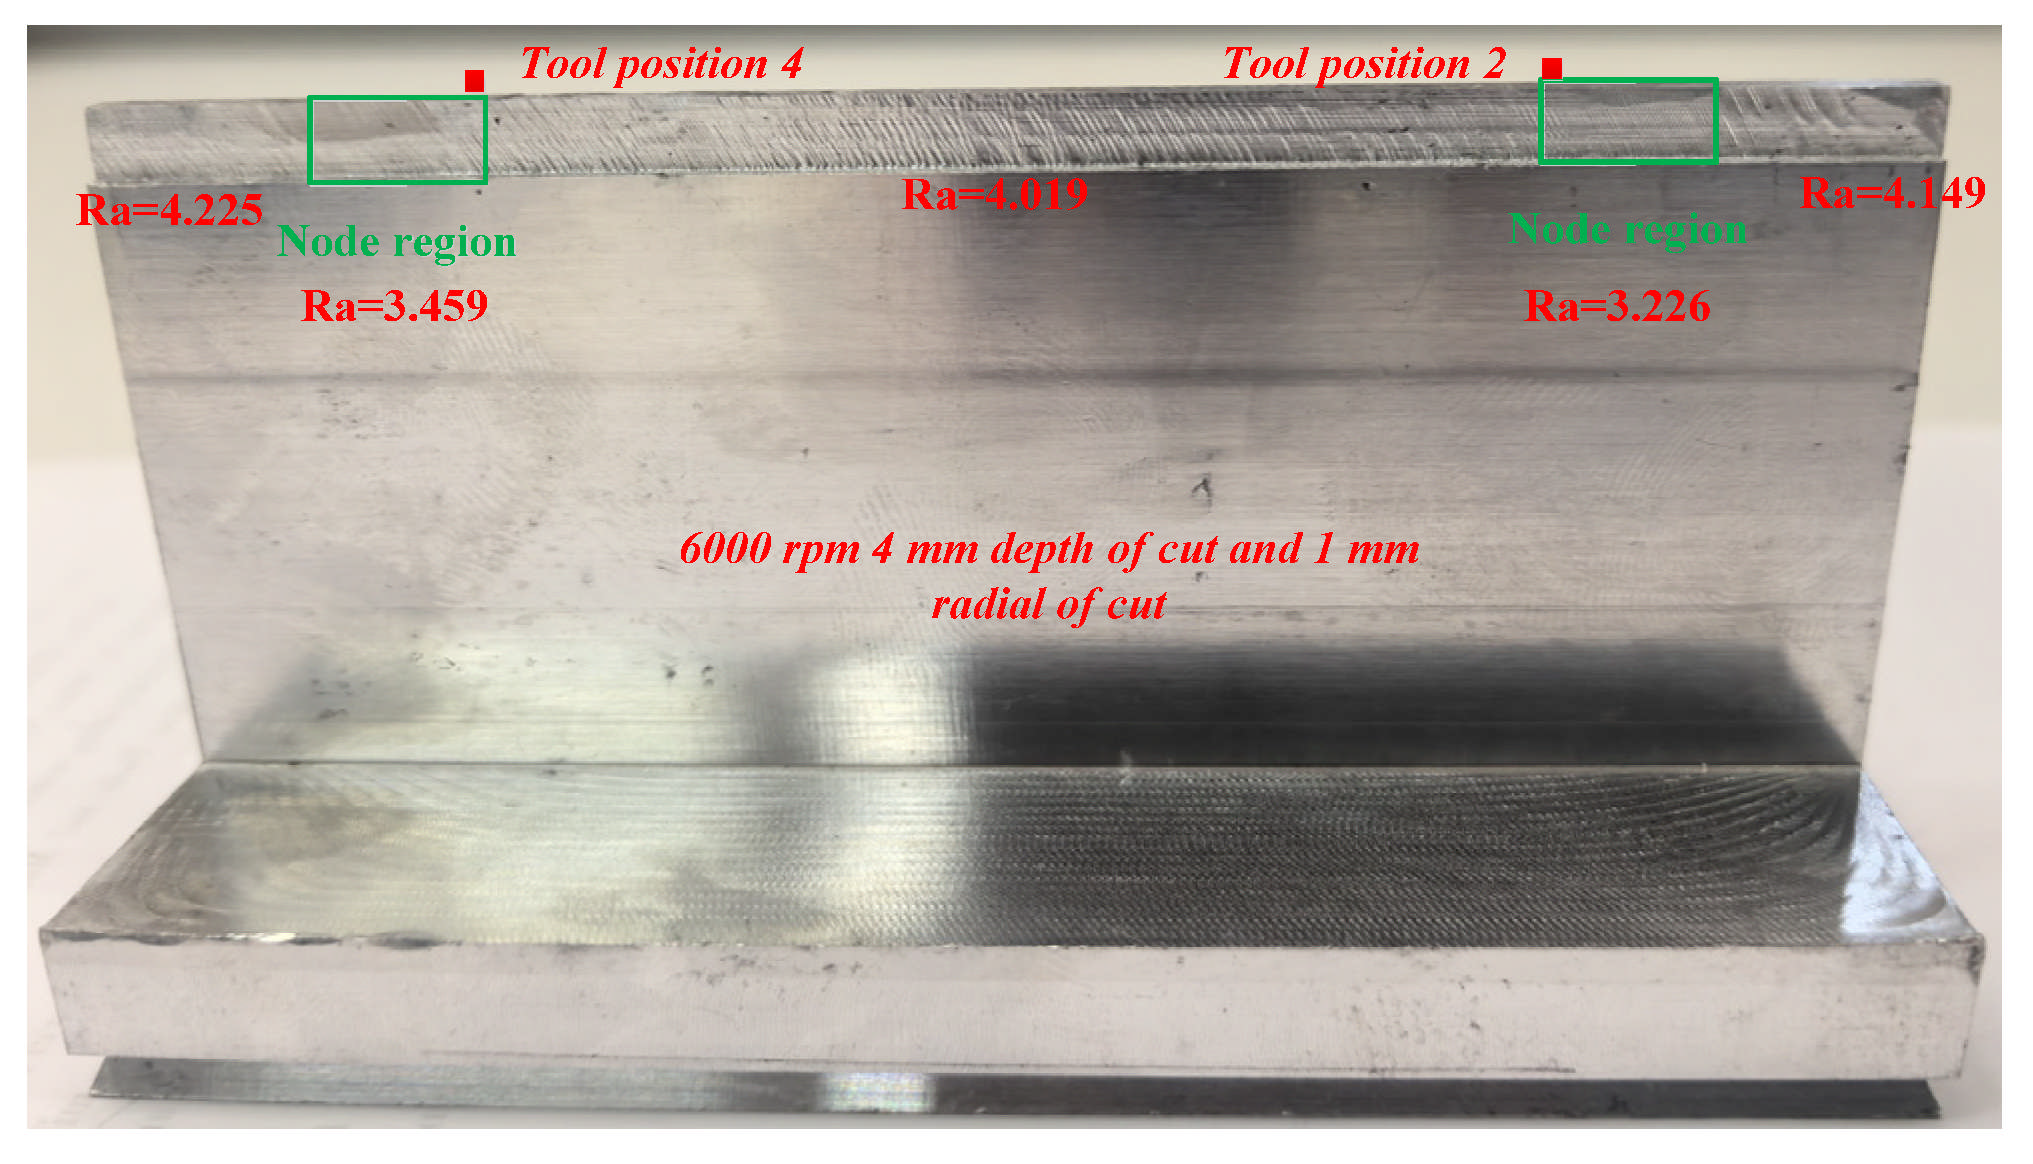
As illustrated in Figure 11, distinct chatter marks can be observed over the entire machined area, while chatter marks are remarkably alleviated near tool position 2 and position 4 (adjacent to the bending-torsion node of the 3rd-order mode). It can be observed from the measurements that the node regions exhibit the lowest roughness values of 3.226 μm and 3.459 μm. Severe chatter occurs between tool position 1 and 2, and the region on the left side of tool position 5, where the surface quality is the poorest, with roughness values of 4.149 μm and 4.225 μm. Better surface quality is obtained in the region between tool position 2 and 4, and the corresponding roughness value is 4.019 μm. This experimental phenomenon is in accordance with the predictions from stability lobe diagrams.
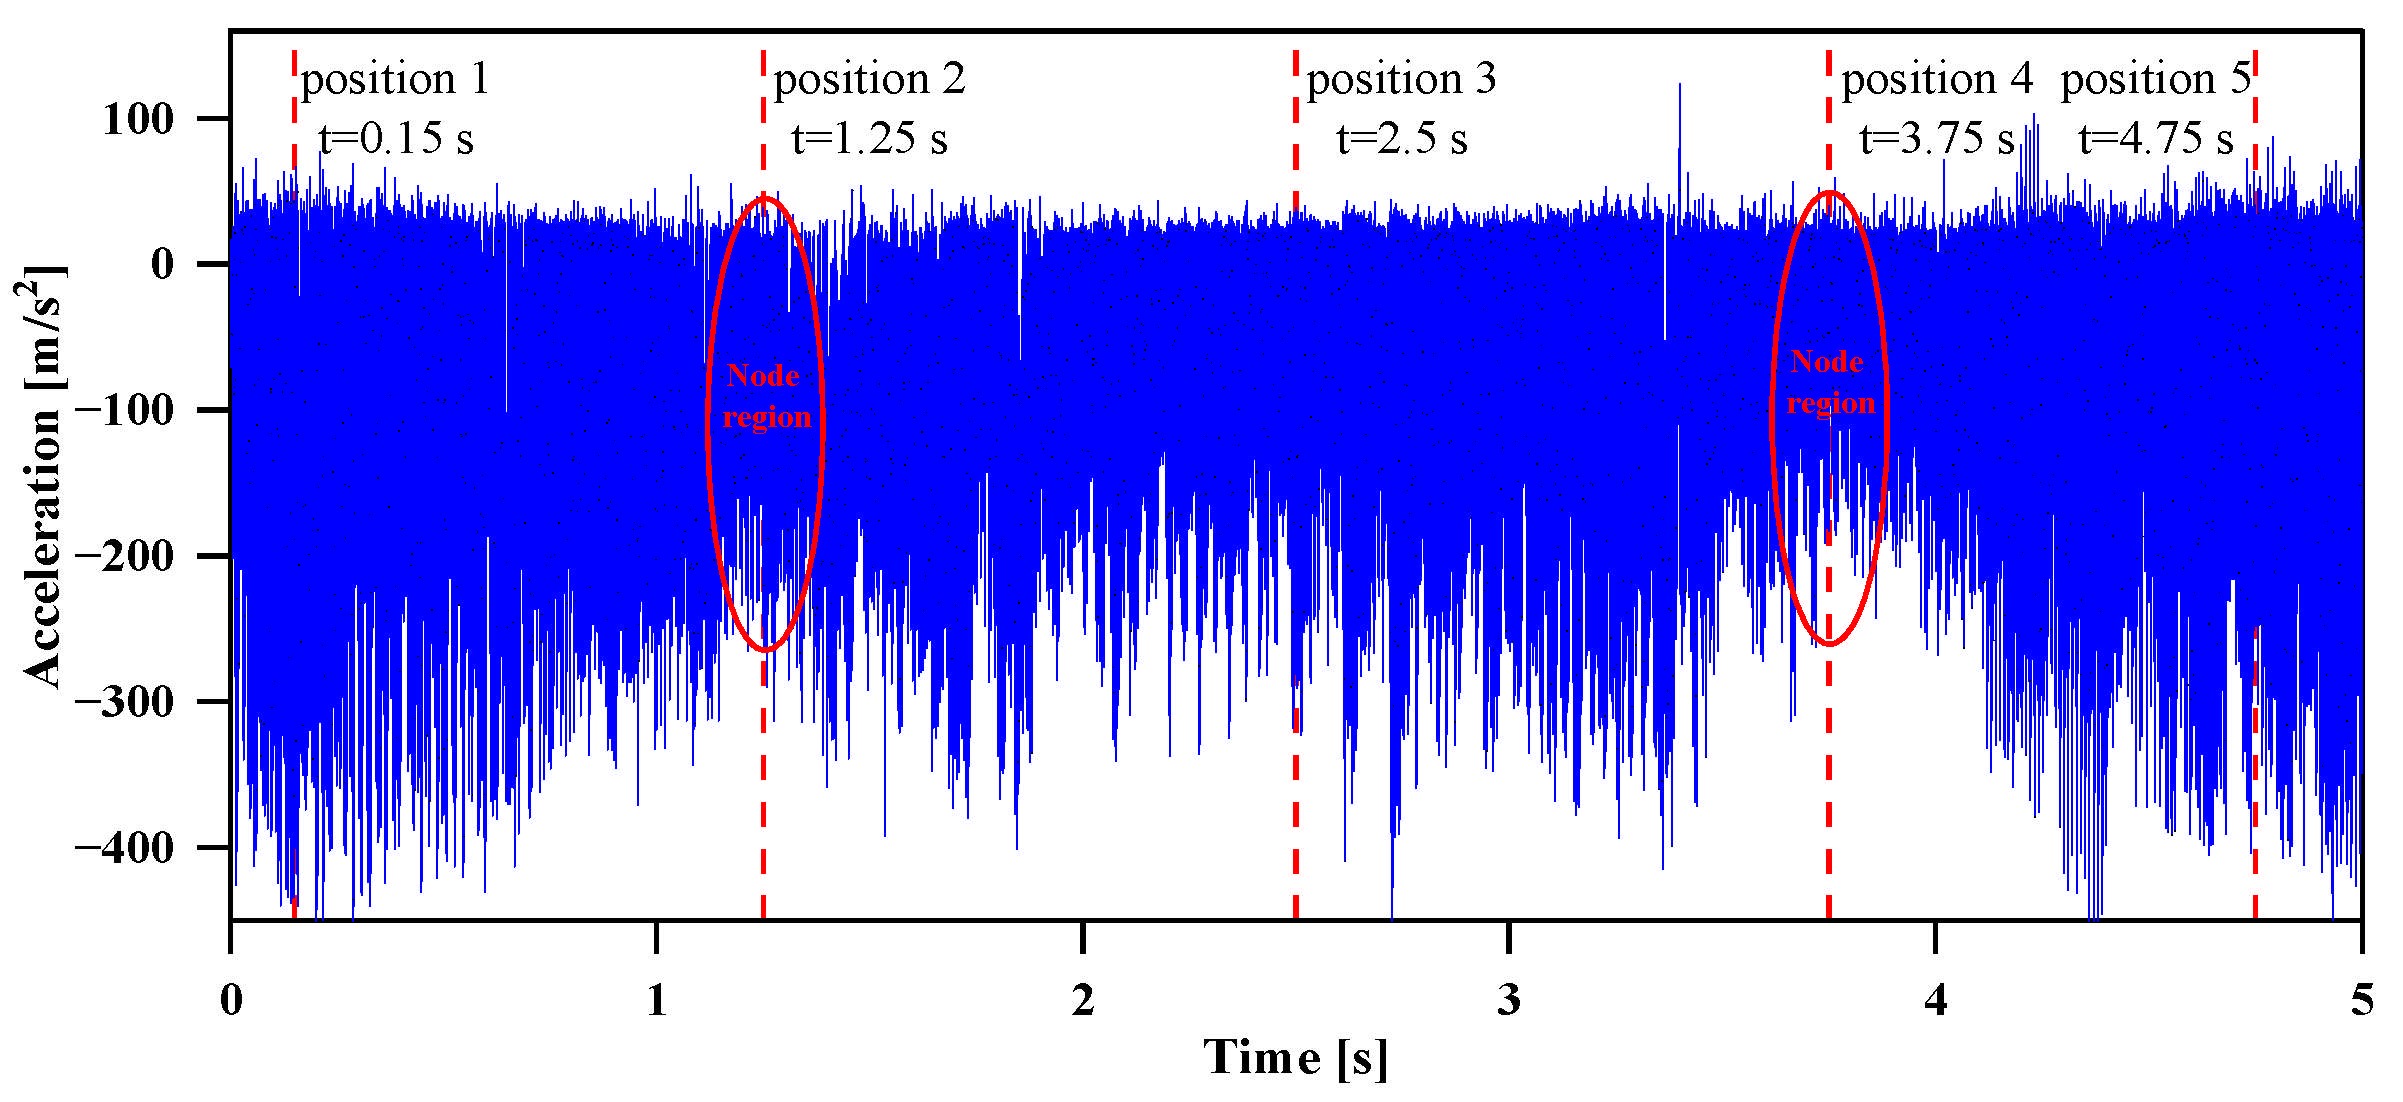
Figure 12 presents the acceleration signals collected throughout the entire machining process. The vibration signal amplitude near tool position 2 and tool position 4 is significantly lower than that in other regions, which can be attributed to the effect of the 3rd-order bending-torsion node.
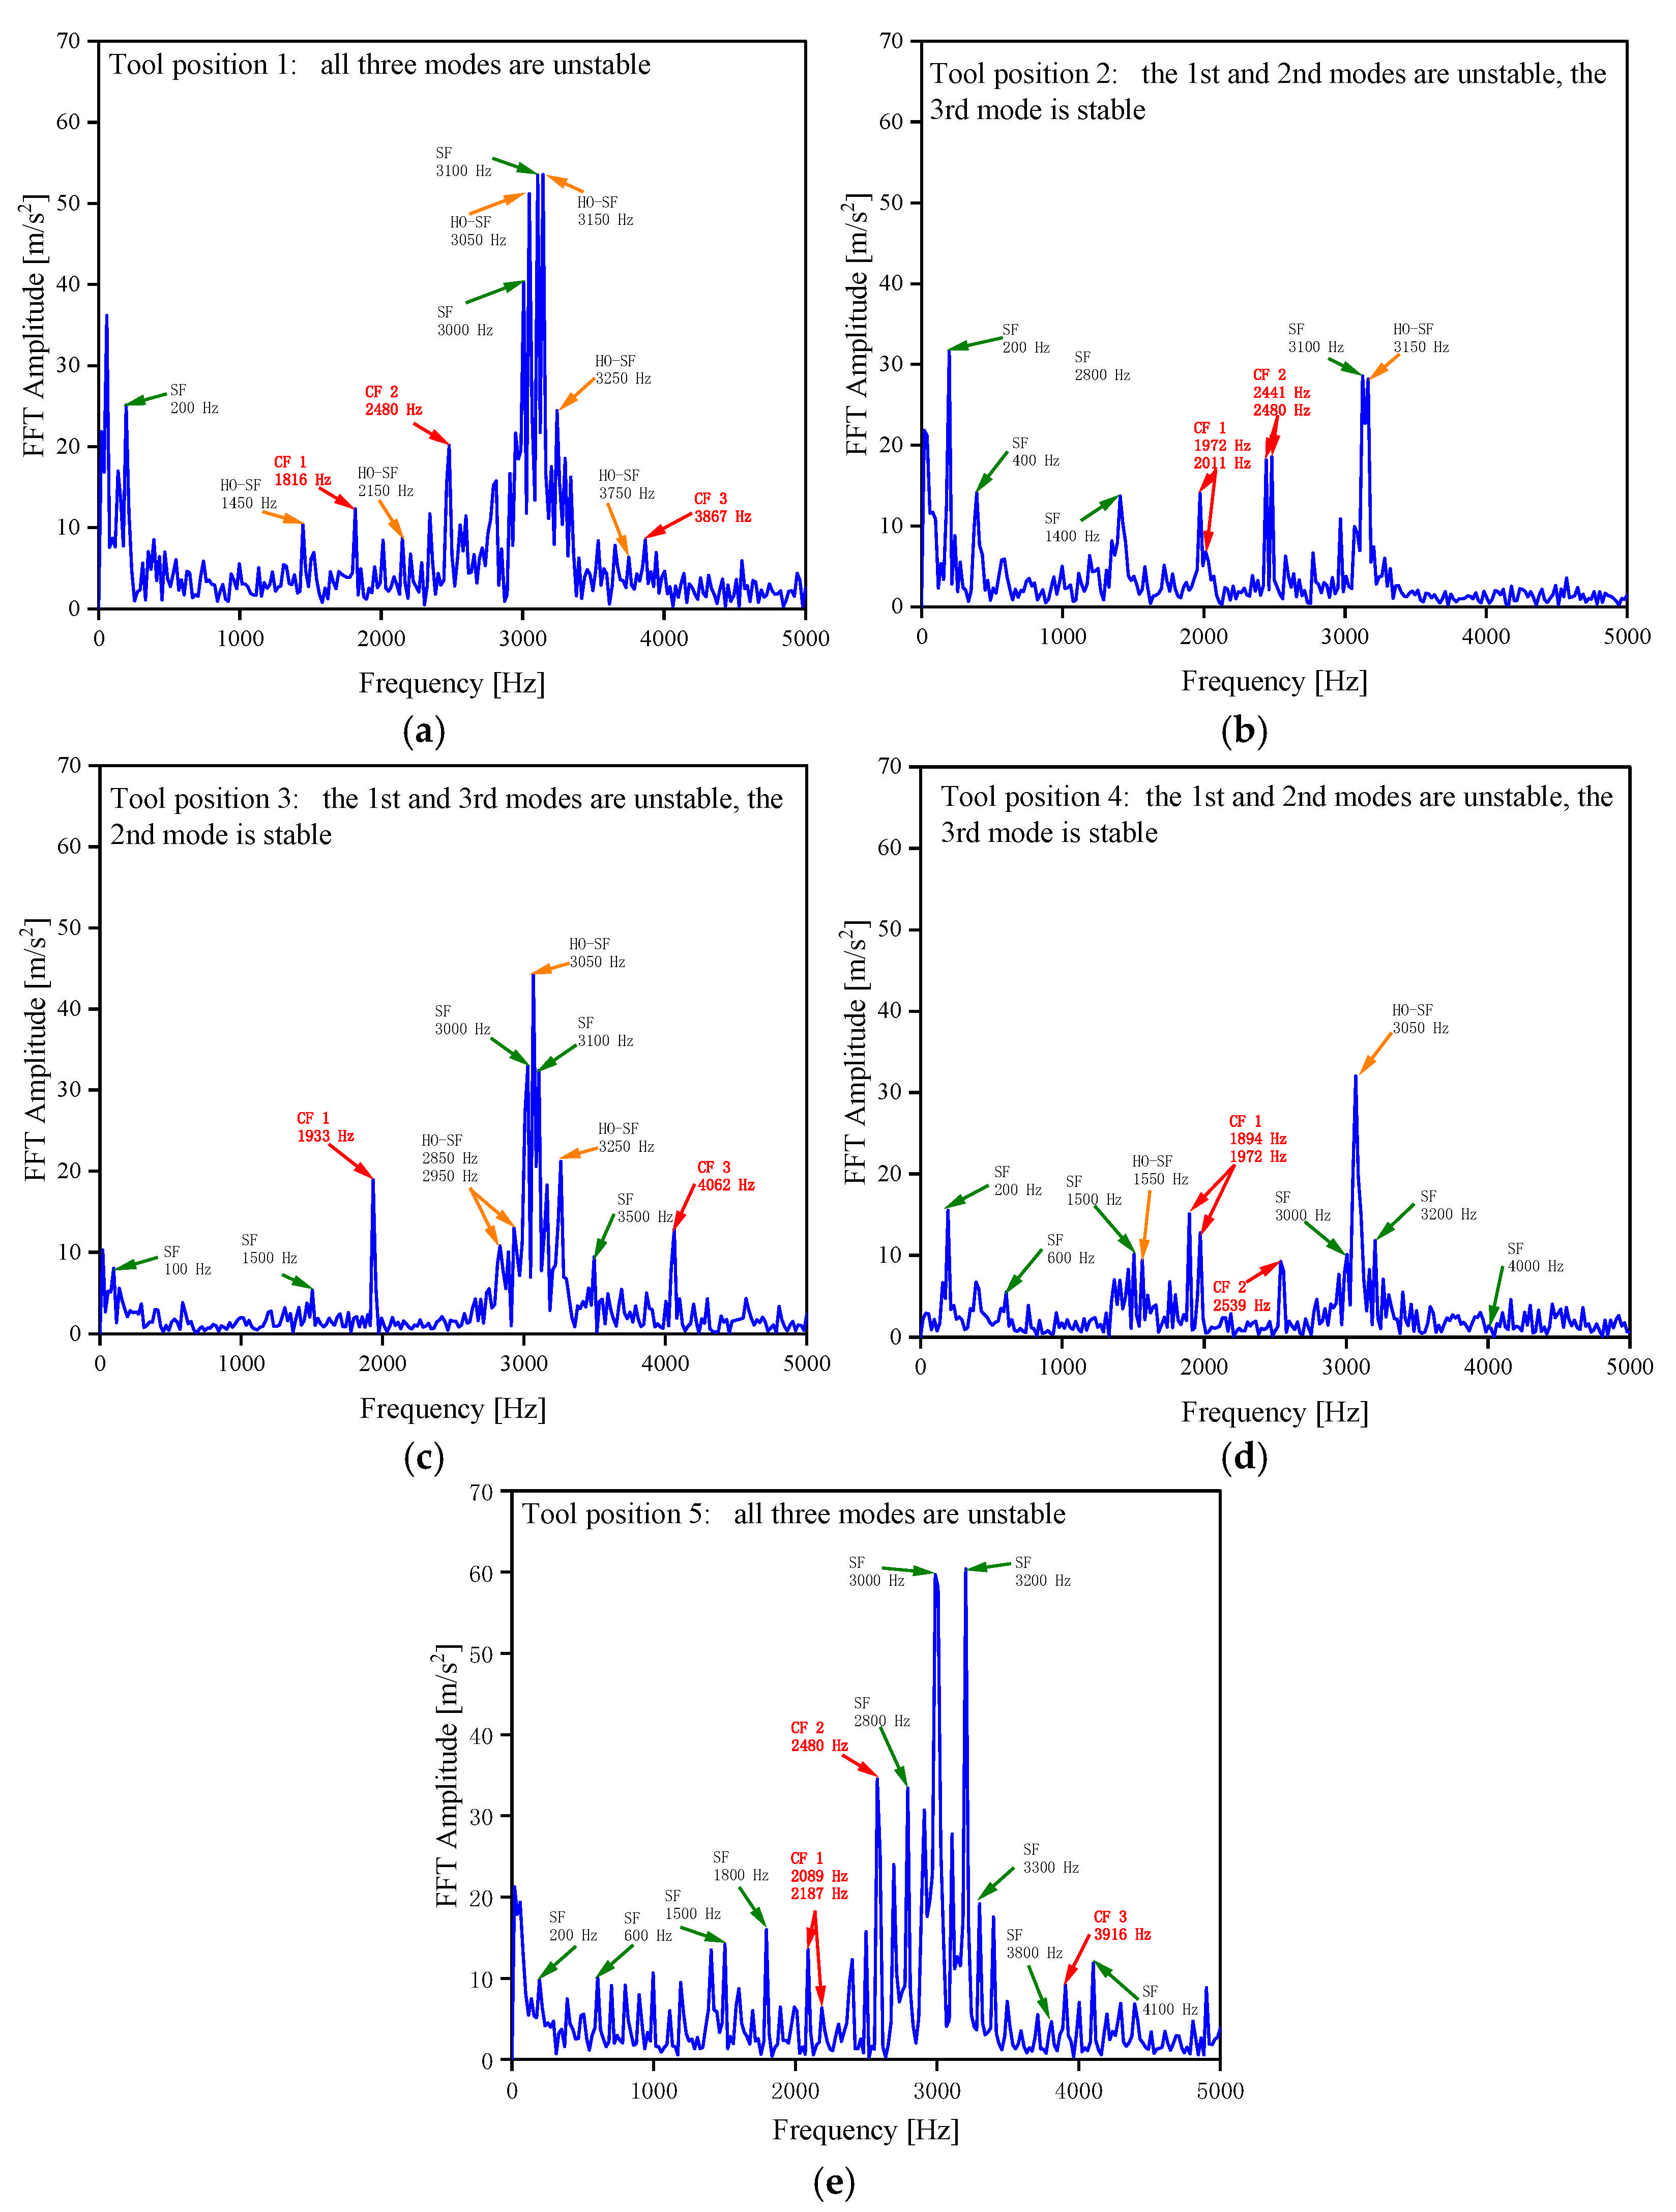
Figure 13a–e illustrates the frequency-domain signals obtained via Fast Fourier Transform near tool positions 1 to 5, which are sampled at t = 0.15 s, t = 1.25 s, t = 2.5 s, t = 3.75 s and t = 4.75 s.
Figure 13a shows the frequency-domain signal at tool position 1. Chatter frequencies of 1816 Hz, 2480 Hz and 3867 Hz are detected, which are close to the 1st–3rd natural frequencies of the thin-walled component 1833 Hz, 2395 Hz and 3899 Hz listed in Table 1, indicating that chatter occurs in all three modes at this position. The amplitude of the 2nd-order chatter frequency reaches the maximum value of 20.17 m/s2, followed by the 1st-order chatter frequency at 12.31 m/s2, while the 3rd-order chatter frequency exhibits the minimum amplitude of 8.5 m/s2. This observation verifies the predicted results in Figure 6a. Specifically, as illustrated in Figure 6a, under the present cutting parameters. The stability limit of the 2nd-order mode is farthest from the adopted machining parameters, with a distance of 3.3 mm, which makes it the most unstable mode. The 1st-order mode ranks second with a distance of 2.47 mm, and the 3rd-order mode, whose stability limit is closest to the cutting parameters with a distance of 1.88 mm, acts as a relatively stable mode. The dominant spindle vibration frequency is 3100 Hz, a harmonic of the fundamental spindle frequency.
As shown in Figure 13b, chatter frequencies of 1972 Hz and 2011 Hz are observed, which are close to the 1st-order natural frequency of the thin-walled component of 1852 Hz. Meanwhile, chatter frequencies of 2441 Hz and 2480 Hz are detected, approximating the 2nd-order natural frequency of 2434 Hz. This reveals that both the 1st- and 2nd-order modes are unstable at the current machining position (tool position 2). As illustrated in Figure 13c, chatter frequencies of 1933 Hz and 4062 Hz are captured, which are close to the 1st-order natural frequency 1872 Hz and 3rd-order natural frequency 3922 Hz of the thin-walled component, respectively. It indicates that the 1st- and 3rd-order modes are unstable at the current machining position (tool position 3). In Figure 13d, chatter frequencies of 1894 Hz and 1972 Hz appear near the 1st-order natural frequency 1895 Hz of the thin-walled component, and chatter frequency of 2539 Hz are close to its 2nd-order natural frequency 2429 Hz. It demonstrates that the 1st- and 2nd-order modes are both unstable at this machining position (tool position 4).
Notably, further conclusions can be drawn from Figure 13b–d: due to the influence of the 2nd-order torsional node, 2nd-order mode chatter is absent at tool position 3; meanwhile, the 3rd-order bending-torsional node suppresses 3rd-order mode chatter at tool position 2 and tool position 4. Meanwhile, an observation from Figure 13a–e shows that even under the same unstable machining conditions, the vibration amplitudes at tool positions 2–4 (the maximum vibration amplitude reaches 31.6 m/s2, 44.33 m/s2 and 32.05 m/s2 at a frequency of 200 Hz, 3050 Hz and 3050 Hz respectively) are remarkably lower than those at tool position 1 and tool position 5 (the maximum vibration amplitude reaches 53.53 m/s2 and 60.41 m/s2 at a frequency of 3100 Hz and 3200 Hz, respectively).
Figure 13e presents the frequency-domain signal at tool position 5. Chatter frequencies of 2089 Hz and 2187 Hz are detected, which are close to the first-order natural frequency (1913 Hz) of the thin-walled component. Nevertheless, considerable deviations exist between the measured chatter frequencies and the predicted natural frequency. There are two main reasons for this phenomenon. Firstly, relatively large deviations occur in the prediction of the first-order natural frequency when the structural dynamic modification method is adopted for dynamic-parameter prediction. As stated in Reference [16], such deviation can reach 8.8%. Secondly, the prediction error is aggravated by the model simplification performed with the superelement technique in this work, leading to a prediction error of 14% in the present study. The chatter frequencies of 2480 Hz and 3916 Hz approximate the 2nd- and 3rd-order natural frequencies 2457 Hz and 3934 Hz listed in Table 1, indicating that chatter arises in all three modes at this position. The dominant vibration frequency is 3200 Hz, a harmonic of the fundamental spindle frequency.
However, the experiments in this paper are only used to observe whether the machining state is consistent with the predicted trend of the stability lobe diagram. For further quantitative validation of the boundaries of the stability lobe diagram, experiments with multiple spindle speeds near the stability boundaries should be carried out.

5. Conclusions

This paper investigates multimodal chatter during the milling of typical thin-walled structural components. Combining theoretical derivation, numerical simulation and experimental validation, this work reveals the influencing mechanism of multiple dominant modes on the machining stability of typical thin-walled components. The main conclusions are summarized below:
Based on the discretization algorithm, a prediction model for stability lobe diagrams tailored to the machining characteristics of rectangular thin-walled structural components is established. Compared with the minimum envelope method and comprehensive modal method, the proposed approach helps reveal the influencing mechanism of each individual mode on chatter prior to machining. (instead of extracting chatter features from frequency-domain signals after machining completion), and is adopted to quantify the respective influencing mechanisms of the first three dominant modes on the milling stability of thin-walled structures. Comparative analyses of workpiece surface roughness, real-time vibration and their FFT spectra signal analysis comprehensively validate that the developed model can capture the evolution law of multimodal chatter within different given machining regions.
For the present typical rectangular thin-walled components, the central position acts as a torsional node that suppresses the 2nd-order-mode-induced chatter. The symmetric positions at one-third of the left and right sides are bending-torsion nodes for suppressing 3rd-order-mode-induced chatter. Affected by boundary conditions, the left- and right-corner regions are most prone to chatter, which deserves special attention when selecting machining parameters.
To account for the coupled influences of material removal and changing tool positions, this work employs two numerical approaches: the superelement technique for lowering computational cost, and the softening element technique to avoid repeated modeling and meshing at different machining steps. These two methods jointly enable the extraction and calculation of time-varying dynamic parameters for thin-walled components under diverse machining stages and tool positions. As can be observed from Table 1, the 1st-order and 3rd-order natural frequencies increase as material is removed, whereas the 2nd-order natural frequency first increases and then decreases.

Supplementary Materials

The following supporting information can be downloaded at: https://www.mdpi.com/article/10.3390/eng7090487/s1, Figure S1: Prediction process.

Author Contributions

Conceptualization, X.W. and F.L.; methodology, X.W.; software, F.L. and T.L.; validation, J.L.; formal analysis, J.L.; investigation, Z.F.; resources, J.L.; writing—original draft preparation, X.W.; funding acquisition, J.L. All authors have read and agreed to the published version of the manuscript.

Funding

This work was supported by the Lanzhou Science and Technology Project (Grant Number 2025-2-107), the National Key Research and Development Plan (Grant Number 2018YFB1703105), Key research and development plan of Gansu Province (Grant Number 22YF11GA315) and Hongliu First-class Disciplines Development Program of Lanzhou University of Technology.

Data Availability Statement

The original contributions presented in this study are included in the article. Further inquiries can be directed to the corresponding author.

Conflicts of Interest

The authors declare no conflicts of interest.

References

  1. Sun, Y.; Yan, S.; Sun, S.; Niu, J.; Xu, J.; Chen, M.; Guo, D. A Review of Chatter Suppression in Thin-Wall Milling: Strategies, Mechanisms, and Applications. Int. J. Extrem. Manuf. 2025, 7, 062003. [Google Scholar] [CrossRef] [Scilit]
  2. Li, X.; Ni, J.; Liu, X. Chatter-Free Milling of Aerospace Thin-Walled Parts. J. Mater. Process. Technol. 2025, 341, 118903. [Google Scholar] [CrossRef] [Scilit]
  3. Khattab, A.; Sztankovics, I.; Felhő, C. Preliminary Experimental Comparison of Plunge Milling and Face Milling: Influences of Cutting Parameters on Cutting Force and Surface Roughness. Eng 2025, 6, 128. [Google Scholar] [CrossRef] [Scilit]
  4. Yi, J.; Liu, K.; Han, D. Review of Milling Chatter in Aerospace Thin-Walled Structures. Proc. Inst. Mech. Eng. Part B J. Eng. Manuf. 2026, 240, 1577–1597. [Google Scholar] [CrossRef] [Scilit]
  5. Gao, S.; Zhang, X.; Yu, F.; Wen, L.; Yu, T. Review of Tool Condition Monitoring in Milling of Thin-Walled Parts Based on Digital Twin Technology. J. Braz. Soc. Mech. Sci. 2026, 48, 7. [Google Scholar] [CrossRef] [Scilit]
  6. Dang, X.B.; Wan, M.; Zhang, W.H.; Yang, Y. Chatter Analysis and Mitigation of Milling of the Pocket-Shaped Thin-Walled Workpieces with Viscous Fluid. Int. J. Mech. Sci. 2021, 194, 106214. [Google Scholar] [CrossRef] [Scilit]
  7. Yang, Y.; Zhang, W.H.; Ma, Y.C.; Wan, M.; Dang, X.B. An Efficient Decomposition-Condensation Method for Chatter Prediction in Milling Large-Scale Thin-Walled Structures. Mech. Syst. Signal Process. 2019, 121, 58–76. [Google Scholar] [CrossRef] [Scilit]
  8. Yang, Y.; Zhang, W.H.; Ma, Y.C.; Wan, M. Chatter Prediction for the Peripheral Milling of Thin-Walled Workpieces with Curved Surfaces. Int. J. Mach. Tools Manuf. 2016, 109, 36–48. [Google Scholar] [CrossRef] [Scilit]
  9. Li, W.T.; Wang, L.P.; Yu, G. Chatter Prediction in Flank Milling of Thin-Walled Parts Considering Force-Induced Deformation. Mech. Syst. Signal Process. 2022, 165, 108314. [Google Scholar] [CrossRef] [Scilit]
  10. Liu, S.J.; Xiao, J.L.; Tian, Y.; Ma, S.J.; Liu, H.T.; Huang, T. Chatter-Free and High-Quality End Milling through a Follow-Up Support Technology. J. Mater. Process. Technol. 2023, 312, 117857. [Google Scholar] [CrossRef] [Scilit]
  11. Dang, X.B.; Wan, M.; Yang, Y.; Zhang, W.H. Efficient Prediction of Varying Dynamic Characteristics in Thin-Wall Milling Using Freedom and Mode Reduction Methods. Int. J. Mech. Sci. 2019, 160, 105176. [Google Scholar] [CrossRef] [Scilit]
  12. Wang, D.Q.; Löser, M.; Ihlenfeldt, S.; Wang, X.B.; Liu, Z.B. Milling Stability Analysis with Considering Process Damping and Mode Shapes of In-Process Thin-Walled Parts. Int. J. Mech. Sci. 2019, 159, 105958. [Google Scholar] [CrossRef] [Scilit]
  13. Li, W.; Wang, L.; Yu, G.; Wang, D. Time-Varying Dynamics Updating Method for Chatter Prediction in Thin-Walled Part Milling Process. Mech. Syst. Signal Process. 2021, 159, 107840. [Google Scholar] [CrossRef] [Scilit]
  14. Zheng, J.; Ren, P.; Du, X.; Pan, Y.; Sun, J. Milling Stability Analysis: A Novel Approach Based on a Multi-Point and Multi-Mode Lumped Parameter Dynamic Model. J. Manuf. Process. 2025, 156, 406–422. [Google Scholar] [CrossRef] [Scilit]
  15. Xi, C.; Zhao, Y.; Xu, J.; Gao, P. Position-Dependent Milling Stability Modeling and Experimental Validation for Thin-Walled Components. In Proceedings of the 10th International Conference on Mechanical Manufacturing Technology and Material Engineering (MMTME 2025); Northeastern University: Shenyang, China, 2025; p. 385312. [Google Scholar]
  16. Li, F.; Liu, J.; Hu, B. An effective methodology for predicting the stability of thin-walled components during milling process. Int. J. Adv. Manuf. Technol. 2026, 143, 1021–1041. [Google Scholar] [CrossRef] [Scilit]
  17. Zheng, Y.W.; Zhao, Z.C.; Xu, B.D.; Yu, Y.; Xu, J.H. A Method to Predict Chatter Stability Accurately in Milling Thin-Walled Parts by Considering Force-Induced Deformation. J. Manuf. Process. 2023, 106, 552–563. [Google Scholar] [CrossRef] [Scilit]
  18. Sun, Y.; Jiang, S. Predictive Modeling of Chatter Stability Considering Force-Induced Deformation Effect in Milling Thin-Walled Parts. Int. J. Mach. Tools Manuf. 2018, 135, 38–52. [Google Scholar] [CrossRef] [Scilit]
  19. Yan, B.; Zhu, L. Research on Milling Stability of Thin-Walled Parts Based on Improved Multi-Frequency Solution. Int. J. Adv. Manuf. Technol. 2019, 102, 431–441. [Google Scholar] [CrossRef] [Scilit]
  20. Song, Q.H.; Shi, J.H.; Liu, Z.Q.; Wan, Y. A Time-Space Discretization Method in Milling Stability Prediction of Thin-Walled Component. Int. J. Adv. Manuf. Technol. 2017, 89, 2675–2689. [Google Scholar] [CrossRef] [Scilit]
  21. Gao, Z.; Liang, Z.; Du, Y.; Ma, Y.; Cai, Z.; Xiao, Y.; Huang, H.; Zhang, A.; Xiong, L.; Qiu, T. Chatter Stability in Robotic Milling of Low-Rigidity Components Considering Machining Deformation and Forced Vibration Coupling. Int. J. Adv. Manuf. Technol. 2026, 145, 2843–2860. [Google Scholar] [CrossRef] [Scilit]
  22. Liu, S.; Xiao, J.; Zhao, W.; Zhao, Y.; Wang, M.; Liu, H. Dynamic Characteristics and Chatter Prediction of Thin-Walled Workpieces in Dual-Robot Mirror Milling Based on Surrogate Model of Support Parameters. Mech. Syst. Signal Process. 2025, 224, 112187. [Google Scholar] [CrossRef] [Scilit]
  23. Qu, S.; Zhao, J.B.; Wang, T.R. Analysis of the Machining Stability in Milling Thin-Walled Plate. In 2015 IEEE Conference on Robotics and Biomimetics (ROBIO); IEEE: Piscataway, NJ, USA, 2015; pp. 1741–1745. [Google Scholar]
  24. Feng, J.L.; Hou, N.; Zhao, J.; Sun, Z.L. An Efficient Method to Predict the Chatter Stability of Titanium Alloy Thin-Walled Workpieces during High-Speed Milling. Int. J. Adv. Manuf. Technol. 2020, 106, 5407–5420. [Google Scholar] [CrossRef] [Scilit]
  25. Alan, S.; Budak, E.; Ozguven, H.N. Analytical Prediction of Part Dynamics for Machining Stability Analysis. Int. J. Autom. Technol. 2010, 4, 259–264. [Google Scholar] [CrossRef] [Scilit]
  26. Thevenot, V.; Arnaud, L.; Dessein, G.; Cazenave-Larroche, G. Integration of Dynamic Behaviour Variations in the Stability Lobes Method. Int. J. Adv. Manuf. Technol. 2006, 27, 638–644. [Google Scholar] [CrossRef] [Scilit]
  27. Insperger, T.; Stepan, G. Semi-Discretization Method for Delayed Systems. Int. J. Numer. Methods Eng. 2002, 55, 503–518. [Google Scholar] [CrossRef] [Scilit]
  28. Insperger, T.; Stepan, G. Updated Semi-Discretization Method for Periodic Delay Differential Equations with Discrete Delay. Int. J. Numer. Methods Eng. 2004, 61, 117–141. [Google Scholar] [CrossRef] [Scilit]
  29. Ding, Y.; Zhu, L.M.; Zhang, X.J. A Full-Discretization Method for Prediction of Milling Stability. Int. J. Mach. Tools Manuf. 2010, 50, 502–509. [Google Scholar] [CrossRef] [Scilit]
  30. Xiao, F.; Du, X.; Pan, Y.; Sun, J. Milling Stability Prediction Considering Axial Geometric Contact Effects. Micromachines 2026, 17, 977. [Google Scholar] [CrossRef] [Scilit]
  31. Altintas, Y. Manufacturing Automation: Metal Cutting Mechanics, Machine Tool Vibrations, and CNC Design; Cambridge University Press: New York, NY, USA, 2001. [Google Scholar]
  32. Axinte, D.; Gindy, N.; Fox, K.; Unanue, I. Process Monitoring to Assist the Workpiece Surface Quality in Machining. Int. J. Mach. Tools Manuf. 2004, 44, 1091–1108. [Google Scholar] [CrossRef] [Scilit]
Figure 1. Model of a typical thin-walled component.
Eng 07 00487 g001
Figure 2. The 1st-order bending mode at a certain machining stage.
Eng 07 00487 g002
Figure 3. The 2nd-order torsional mode at a certain machining stage.
Eng 07 00487 g003
Figure 4. The 3rd-order bending-torsion mode at a certain machining stage.
Eng 07 00487 g004
Figure 5. Stability lobe diagrams of five tool positions under an axial depth of cut of 2 mm: (a) Description the SLD of tool position 1; (b) Description the SLD of tool position 2; (c) Description the SLD of tool position 3; (d) Description the SLD of tool position 4; (e) Description the SLD of tool position 5.
Eng 07 00487 g005aEng 07 00487 g005b
Figure 6. Stability lobe diagrams of five tool positions under an axial depth of cut of 4 mm: (a) Description the SLD of tool position 1; (b) Description the SLD of tool position 2; (c) Description the SLD of tool position 3; (d) Description the SLD of tool position 4; (e) Description the SLD of tool position 5.
Eng 07 00487 g006aEng 07 00487 g006b
Figure 7. Experiment settings.
Eng 07 00487 g007
Figure 8. Surface topography of thin-walled workpiece of the 1st experiment.
Eng 07 00487 g008
Figure 9. The time-domain signals of the 1st experiment.
Eng 07 00487 g009
Figure 10. The frequency-domain signals of the 1st experiment: (a) Description the frequency-domain signals of tool position 1; (b) Description the frequency-domain signals of tool position 2; (c) Description the frequency-domain signals of tool position 3; (d) Description the frequency-domain signals of tool position 4; (e) Description the frequency-domain signals of tool position 5.
Eng 07 00487 g010
Figure 11. Surface topography of thin-walled workpiece of the 2nd experiment.
Eng 07 00487 g011
Figure 12. The time-domain signals of the 2nd experiment.
Eng 07 00487 g012
Figure 13. The frequency-domain signals of the 2nd experiment: (a) Description the frequency-domain signals of tool position 1; (b) Description the frequency-domain signals of tool position 2; (c) Description the frequency-domain signals of tool position 3; (d) Description the frequency-domain signals of tool position 4; (e) Description the frequency-domain signals of tool position 5.
Eng 07 00487 g013
Table 1. Time-varying dynamic parameters.
Tool Position (2 mm Depth of Cut)12345
1st mode natural frequency 18331843185418661875
1st mode mass-normalized coefficient159148173181171
2nd mode natural frequency 23952416241524152430
2nd mode mass-normalized coefficient375720.92141347
3rd mode natural frequency 38993913391539193925
3rd mode mass-normalized coefficient4502.862605.5308
Tool Position (4 mm Depth of Cut)12345
1st mode natural frequency 18331852187218951913
1st mode mass-normalized coefficient296283330361338
2nd mode natural frequency 23952434243324292457
2nd mode mass-normalized coefficient7063043.3254675
3rd mode natural frequency 38993922392239263934
3rd mode mass-normalized coefficient8605.7550811.92606
Disclaimer/Publisher’s Note: The statements, opinions and data contained in all publications are solely those of the individual author(s) and contributor(s) and not of MDPI and/or the editor(s). MDPI and/or the editor(s) disclaim responsibility for any injury to people or property resulting from any ideas, methods, instructions or products referred to in the content.