Article

Characterization of Uniaxial Compressive Strength and Point Load Index and Their Correlation in Compact and Porous Building Stones: Insights from the Effects of Stone Heterogeneity


1
Department of Geology, Faculty of Science, Lorestan University, Khorramabad 68151-44316, Iran
2
Department of Geology and Pole of Geosciences Center, University of Trás-os-Montes e Alto Douro, 5000-801 Vila Real, Portugal
*
Authors to whom correspondence should be addressed.
Eng 2026, 7(9), 479; https://doi.org/10.3390/eng7090479
Submission received: 5 August 2026 / Revised: 3 September 2026 / Accepted: 8 September 2026 / Published: 16 September 2026
(This article belongs to the Section Materials Engineering)

Abstract

The point load index (PLI) is a low-cost and rapid test widely used for the indirect evaluation of uniaxial compressive strength (UCS). However, its accuracy in predicting UCS may differ between compact and porous stones. This study investigated the performance of the PLI for UCS prediction in these two stone types. Granite and travertine samples were selected as representatives of compact and porous stones, respectively. The UCS and PLI of the samples were determined through laboratory testing. For both stone types, the average (AVE), standard deviation (SD), and coefficient of variation (CV) of UCS and the PLI were calculated. Next, correlation equations between UCS and the PLI were developed for granites and travertines using regression analyses, and several statistical indices were calculated to evaluate their performance. The results showed that travertines exhibited higher CV values for both UCS and PLI than granites, indicating greater dispersion in their data. The statistical indices demonstrated that PLI performed better in predicting the UCS of granites, representing compact stones, than that of travertines, representing porous stones. However, due to high dispersion of the UCS and PLI data of travertine (assessed by CV), the PLI was a less suitable parameter in predicting the UCS of this stone type.

1. Introduction

Stones are one of the most abundant construction materials used in buildings for various applications, including cladding, paving, stairs, and load-bearing walls [1,2]. Considering the climatic conditions governing regions, stone utilized in a building may be subjected to environmental deterioration processes, such as freezing–thawing, salt crystallization, wetting–drying, and heating–cooling. A high-quality stone can show good durability against the deterioration effects of these processes and, as a result, better endurance during the service period of a building [3,4,5]. Thus, before choosing a stone for various applications in a building, it is necessary to conduct a deep investigation of its durability, considering the climatic conditions prevailing in the region.
There are two common methods for evaluating the stone durability against environmental deterioration processes [6,7]. One of these methods is performing aging tests (e.g., freezing–thawing, salt crystallization, wetting–drying, and heating–cooling) in laboratory conditions to simulate the process of environmental deterioration in nature. Carrying out aging tests to assess the durability of stone is a time-consuming process that can take weeks or even months. As an alternative, a second method, which involves determining the intrinsic characteristics of the stone, can be used to make a quick assessment of its durability. Among the inherent characteristics, uniaxial compressive strength (UCS) is one of the most frequently used parameters in evaluating the stone durability [8,9,10]. A stone with higher UCS usually has better durability against deterioration processes. In some cases, the UCS of stone can be predicted from its other index parameters, such as density, porosity, P-wave velocity, Schmidt hardness, Brazilian tensile strength, and point load index (PLI), through correlation equations [11,12,13,14,15,16]. According to the literature, the PLI is one of the most widely used ways to predict the UCS of stones. In Table 1, some correlation equations between UCS and the PLI for various stone types are reported.
Depending on the amount of pore space in the stone, the specimen in UCS and PLI tests can be either compact or porous. For example, granite, gabbro, and marble are stones with compact structures, while travertines and some sandstones and limestones, due to the presence of pores, have a porous structure. Considering both the nature of UCS and PLI testing devices, the effects of their loading systems on stone specimens, and the heterogeneous nature of stones in terms of the presence of pores, the accuracy of UCS and PLI results can be affected. The low or high accuracy of UCS and PLI results determined through laboratory tests can affect the performance of the predictive equation of UCS using the PLI and, thus, the accuracy of evaluating the stone’s durability based on UCS. A low-accuracy evaluation of stone durability before selecting it as building stone leads to its premature deterioration under environmental processes (such as freezing–thawing, salt crystallization, wetting–drying, and heating–cooling), thereby damaging the building from both structural and aesthetic perspectives.
As a critical gap, there is no previous study comparing the performance of PLI in predicting the UCS of compact and porous stones. To address this issue, in the present study, a number of granite and travertine samples (as representatives of compact and porous stones, respectively) from Hamadan, Lorestan, Markazi, and Yazd Provinces (Iran) were selected. Next, the UCS and PLI of the samples were determined. Correlation equations between UCS and the PLI were established using simple regression analysis. Finally, the performance of the correlation equations obtained for the granite and travertine samples was compared through some statistical indices.

2. Materials

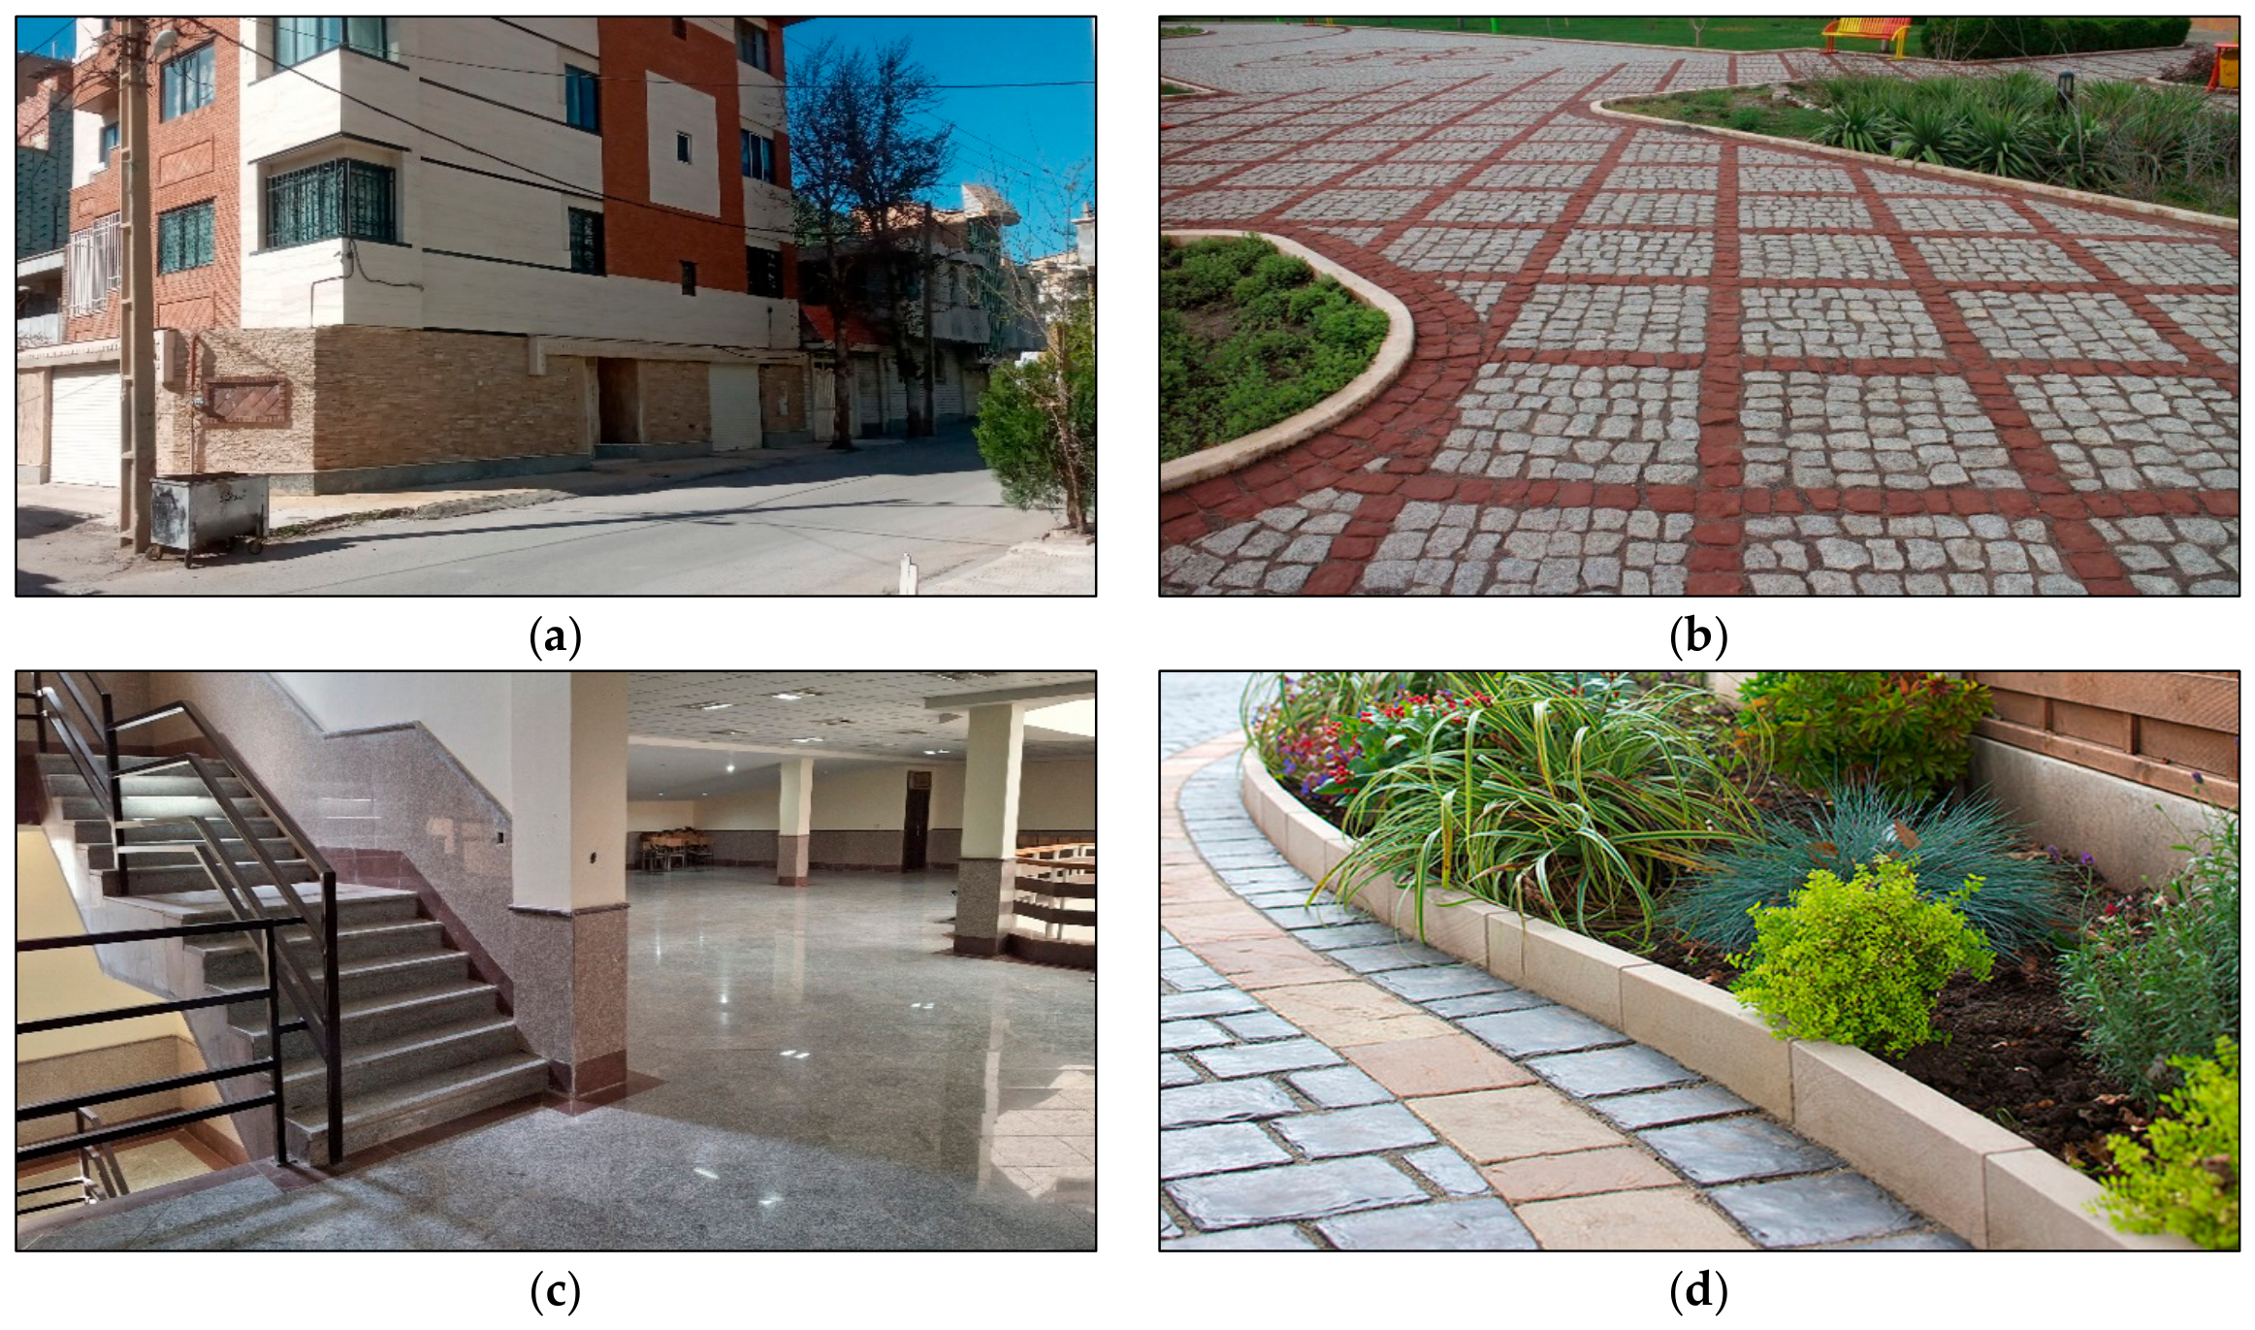
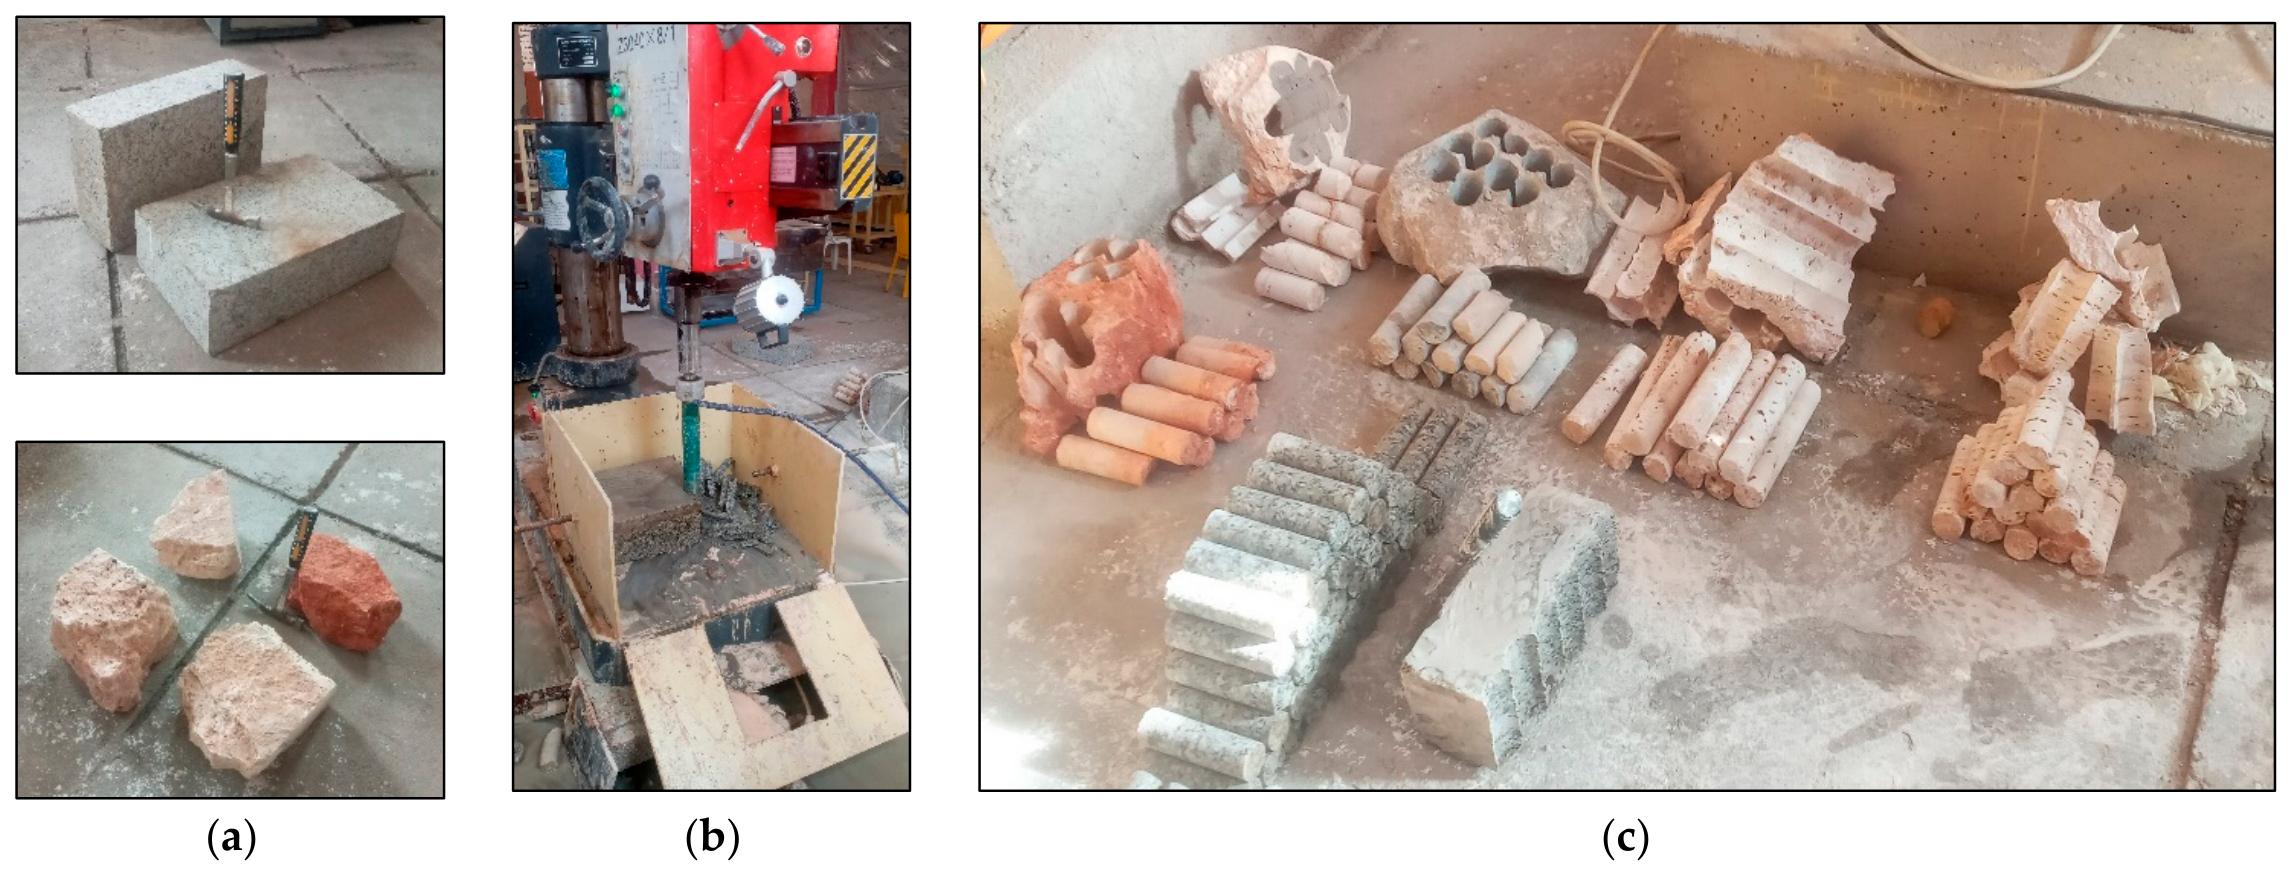
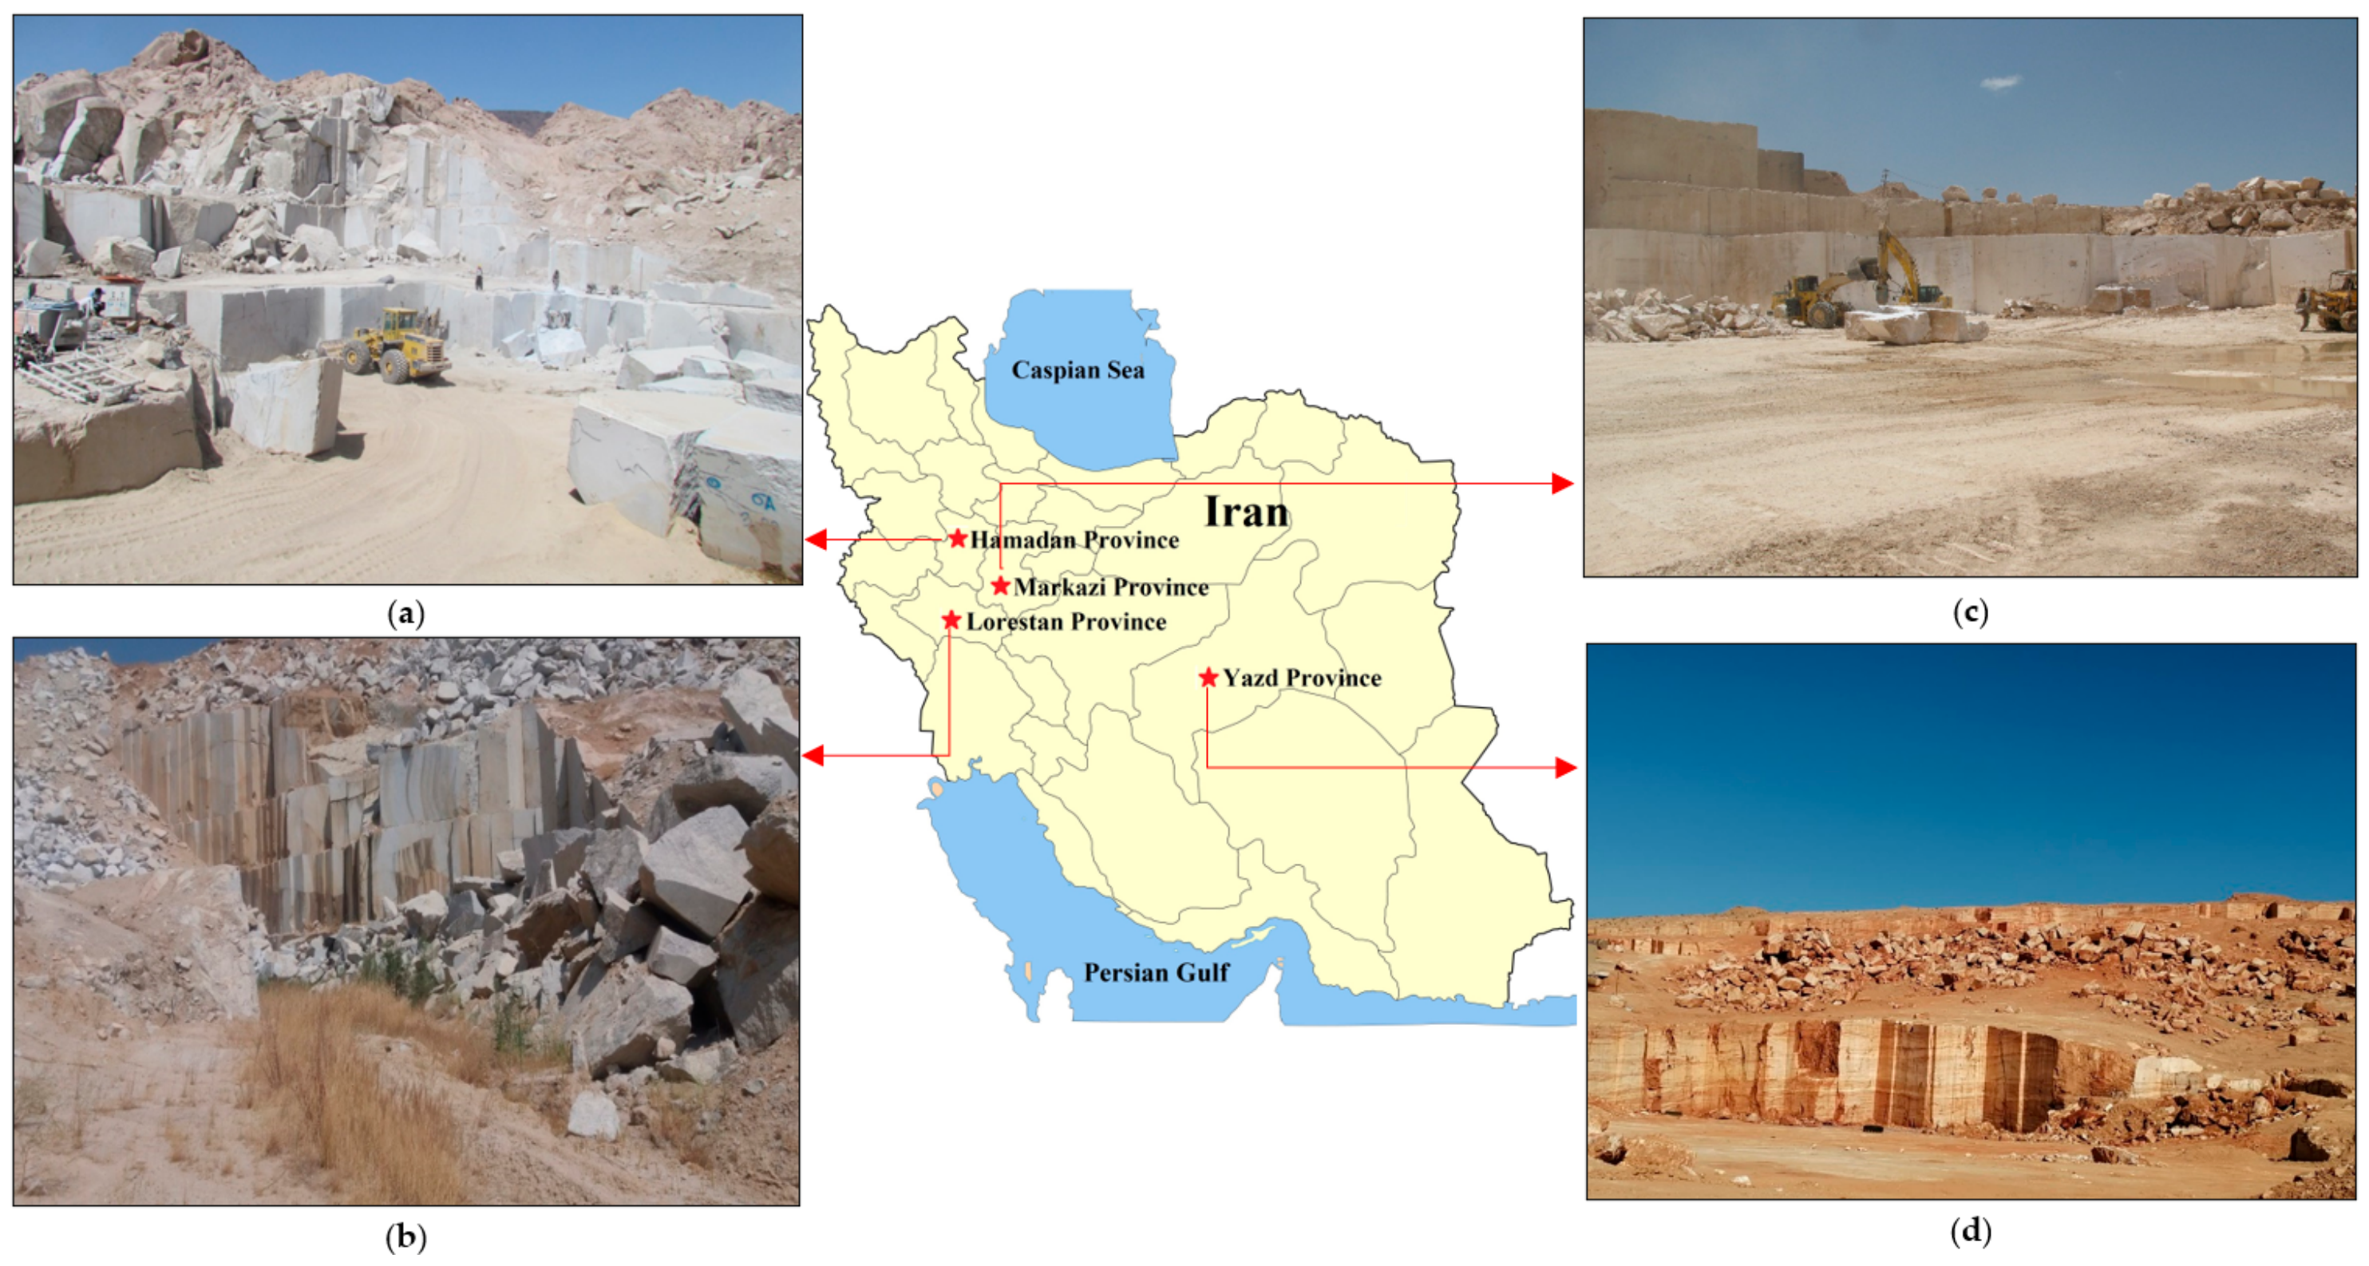
In several steps during field visits to granite and travertine quarries, block samples of these stones were collected. The quarries are located in provinces of Iran, namely, Hamadan, Lorestan, Markazi, and Yazd (Figure 1). Twelve different samples of each granite and travertine were selected (Table 2). Granites and travertines were selected as representatives of compact and porous stones, respectively. These stones are widely used throughout Iran, especially in the mentioned provinces, as building stones for various applications, such as cladding, paving, floors, stairs, and curbs (Figure 2). After transferring the block samples to the Engineering Geology Laboratory (Lorestan University, western Iran), core cylindrical specimens were taken from them using a coring machine (Figure 3). Finally, the specimens were prepared to perform porosity, UCS, and PLI tests.

3. Test Procedures

3.1. Porosity

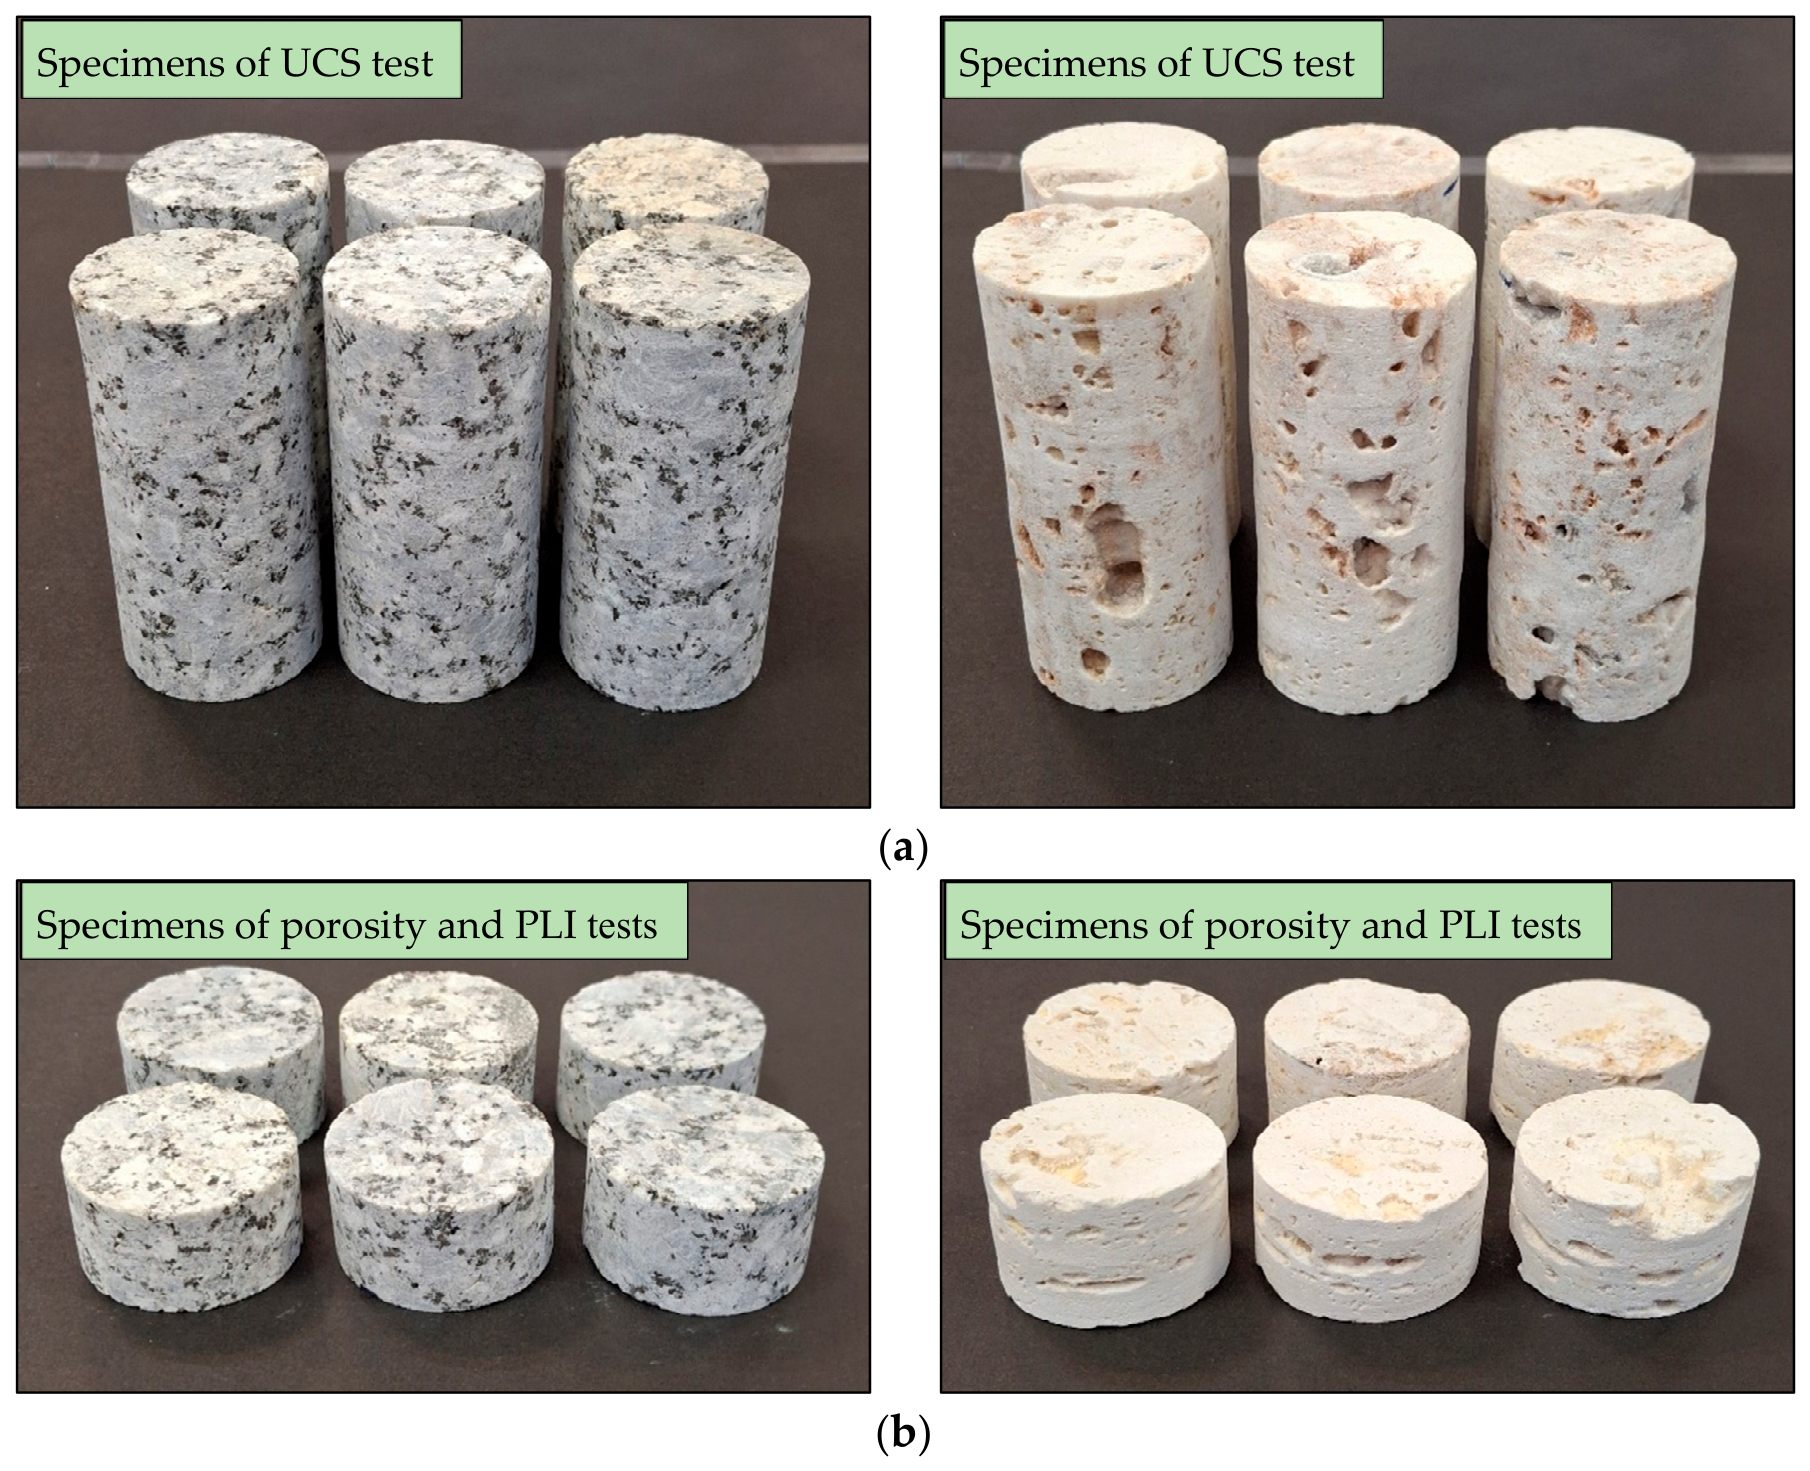
The porosity of the samples was determined according to the method suggested by the ISRM [38]. For each of the granite and travertine samples, six specimens were used to determine their porosity. The specimens had a cylindrical core shape with a diameter and height of 44 and 30 mm, respectively (Figure 4). Initially, the specimens were placed in an oven at 105 °C for 48 h, and then their dry mass (md) was determined. After this step, the specimens were submerged in a distilled water bath for a 48 h period, and next, their saturation mass (msat) values were measured. The porosity of each specimen was determined using the following equation:
n   %   =   V v V   ×   100
where n is porosity, and Vv and V are the pore volume and bulk volume of the specimen, respectively; their values were calculated as follows:
V V   =   m sat     m d ρ w
where ρw is the water density (1 g/cm3).
V = πr2h
where π is equal to 3.14, and r and h are the radius and height of the specimen, respectively.

3.2. Uniaxial Compressive Strength (UCS)

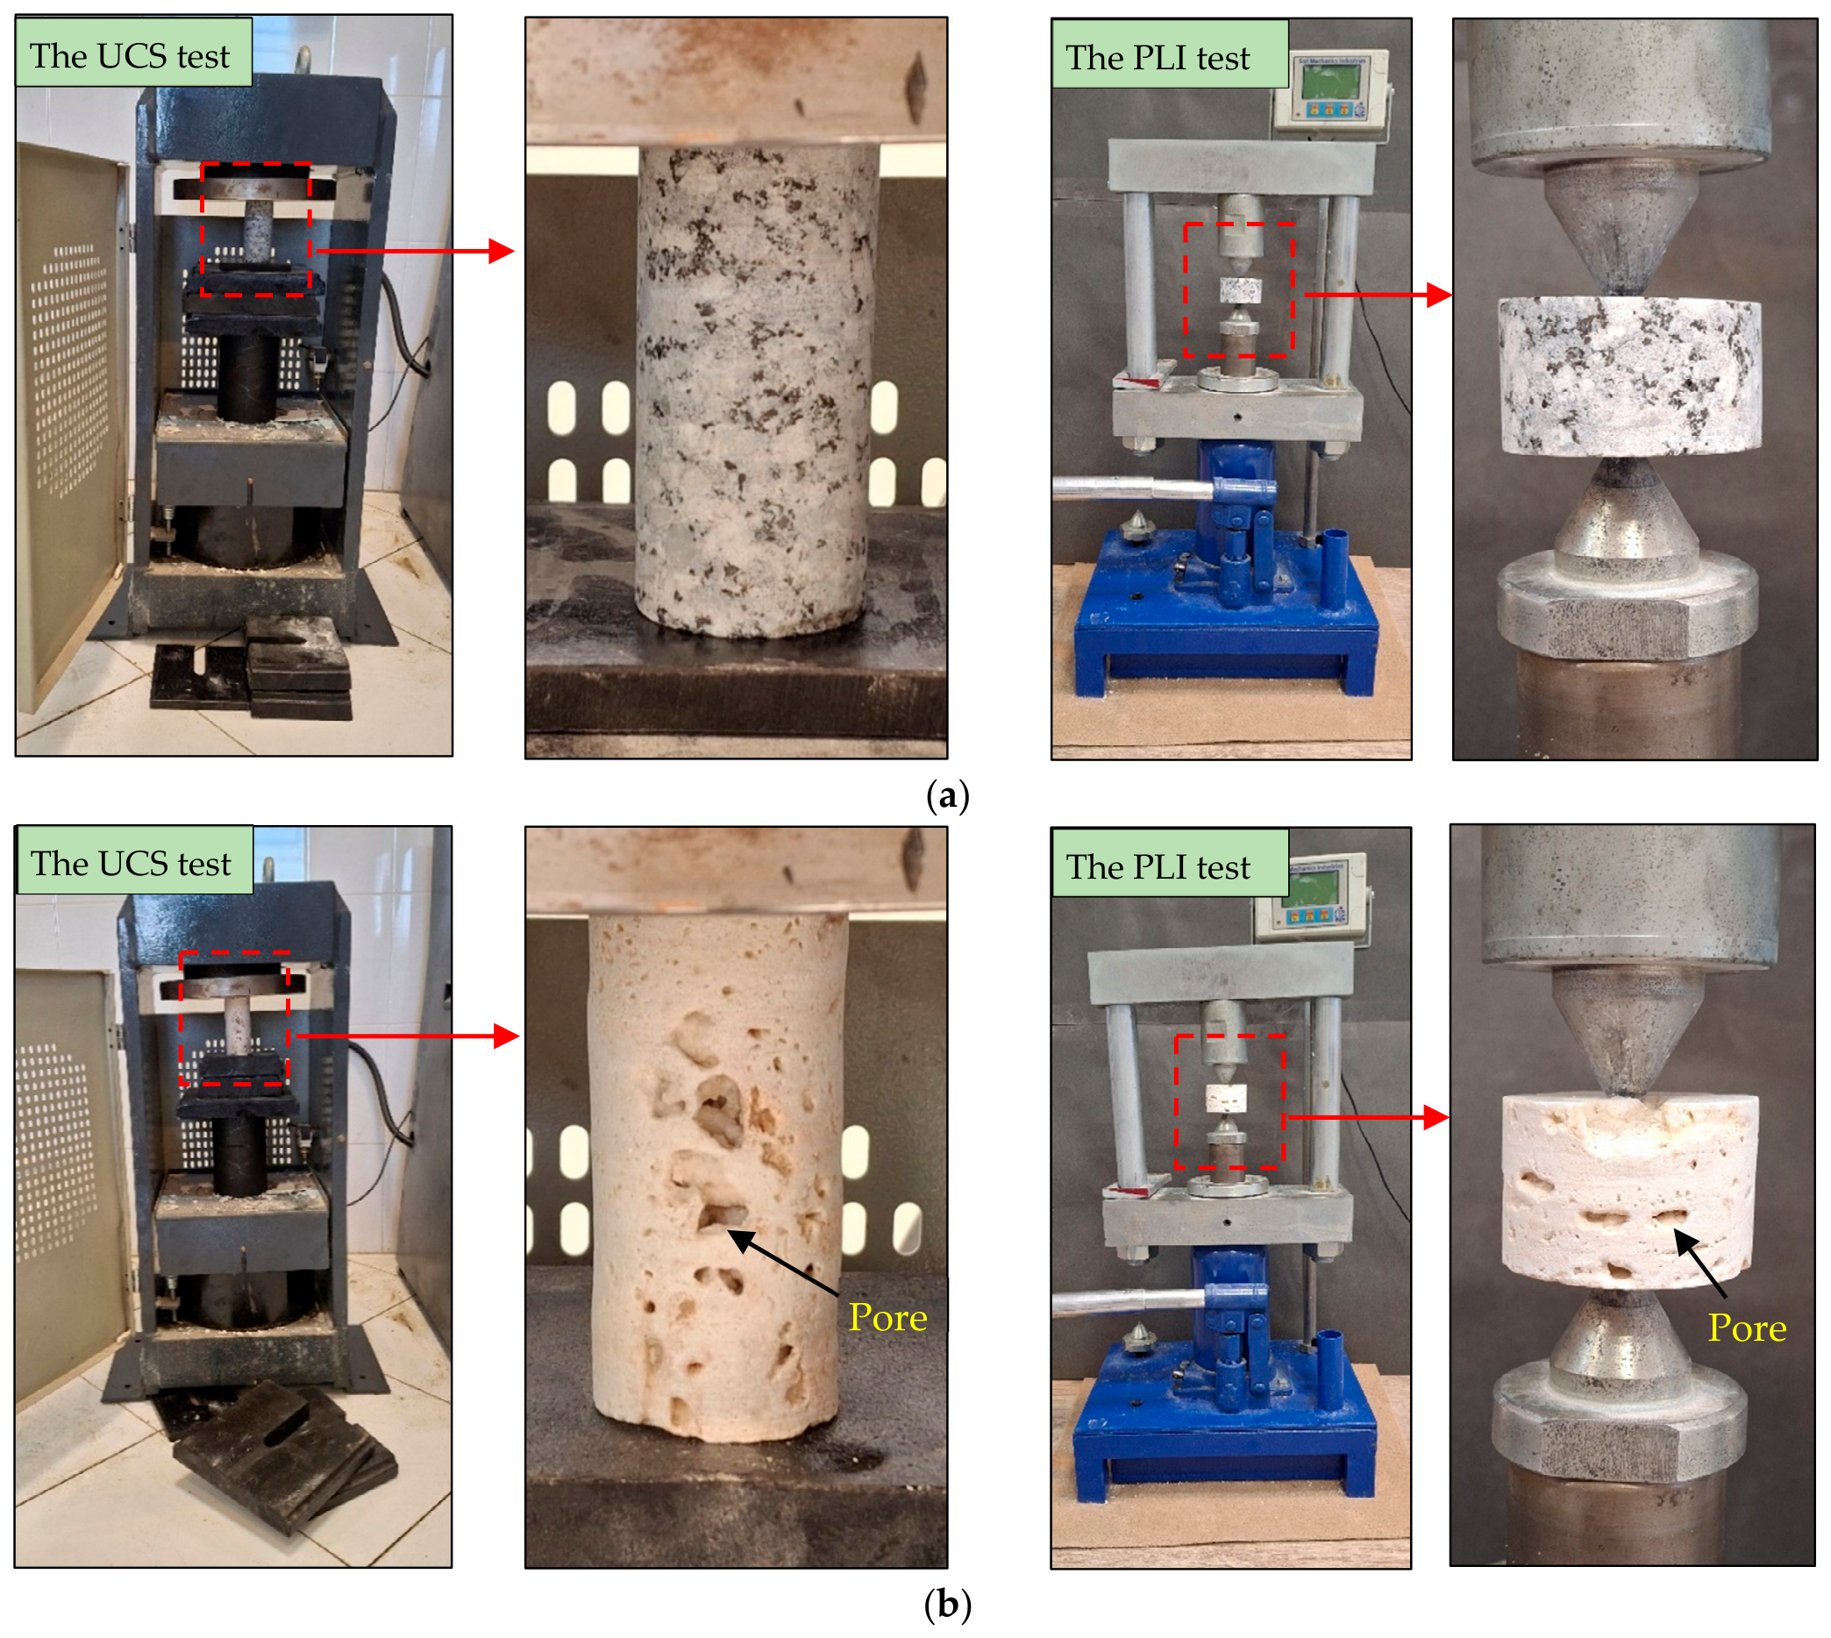
Six specimens from each of the granite and travertine samples were tested to measure their UCS in accordance with the ISRM [38]. The UCS tests were performed on cylindrical core specimens with a diameter of 44 mm and a height-to-diameter ratio of 2. Figure 4 shows some specimens prepared for UCS tests. The specimens were placed in the UCS device, and a load was applied under stress-controlled conditions at a constant loading rate of 0.3 MPa/s until failure (Figure 5). Using the load at the moment of failure and the diameter of the specimen, UCS was calculated according to Equation (4):
UCS   =   P f π D 2 2
where Pf is the maximum load at the moment of specimen failure, and D is the diameter of the specimen.

3.3. Point Load Index (PLI)

PLI tests were carried out according to guidelines suggested by the ISRM [38]. For the PLI tests, six specimens were tested for each of the granite and travertine samples (Figure 4). The diameter and thickness of the specimens are 44 and 30 mm, respectively. The specimens were subjected to axial loading by two conical pieces with an apex angle of 60° (Figure 5). The load was gradually increased on the specimens until they finally failed.
Knowing the failure load and specimen dimensions, the PLI(50) of the specimen (i.e., the PLI of a specimen with a diameter of 50 mm) was determined as follows:
PLI ( 50 )   =   F ( P f D e 2 )
where Pf is the failure load of the specimen, and De is the equivalent core diameter. Here, De was calculated as D e   =   ( 4 × A ) / π [where A = WD (W is the specimen width perpendicular to the loading direction, and D is equal to the distance between the conical pieces at failure). Finally, F is the size correction factor, i.e., (De/50)0.45.

4. Results and Discussions

4.1. Porosity, UCS, and PLI of the Samples

The results of various laboratory tests on the samples, including average (AVE), standard deviation (SD), and coefficient of variation (CV), are presented in Table 3. According to the results, the samples were classified using their porosity, UCS, and PLI values. Granite samples showed porosity values in a narrow range from 0.29 to 1.21%, whereas travertines have higher porosity values, ranging from 5.09 to 15.58%. The noticeable difference between the porosity of granites and travertines can be attributed to the nature of their pore spaces. Granite is an intrusive igneous rock formed by the crystallization of magma (silicate melt) at great depths. The formation conditions of this rock, under the high pressure governing magma, will lead to the interlocking of mineral grains, which results in the compact and non-porous nature of granite [39]. In contrast, the formation of travertine is completely different from granite. Travertine is a carbonate sedimentary rock, which, in most cases, is deposited around hot springs and along streams and rivers. The underground waters reach the Earth’s surface through conduits such as fractures and faults. As water moves from underground to the surface, rocks containing carbonate minerals exist in its path, especially limestone, which dissolves and forms calcium and bicarbonate ions. On the Earth’s surface, due to the loss of pressure and heat, calcite or aragonite minerals (CaCO3) can precipitate from dissolved ions, resulting in the formation of travertine. During this process, the release of carbon dioxide (CO2) from the solution leads to the development of pore space in the travertine and, thus, its porous media [40,41].
The porosity values obtained for the granite samples are consistent with findings of some previous studies on other types of granite stones. The studies by Zalooli et al. [6], Ersoy and Atici [42], and Momeni et al. [43] showed porosity values between 0.21 and 0.47%, 0.86 and 1.33%, and 0.83 and 1.03%, respectively. The results of the present study and previous studies indicate low porosity and a narrow value range for granite stones. In addition, considering the highly heterogeneous nature of travertines due to their porous media, there are differences between porosity values reported for this stone type in previous studies. Yaşar et al. [44] investigated the physico-mechanical characteristics of two types of travertines from the Burdur and Kayseri regions of Turkey, and the results revealed porosity values of 1.55 and 2.48%, respectively. Travertines studied by Akin [45] had a wider range of porosity values, varying from 2.83 to 29.12%, depending on their weathering degree. Török and Vásárhelyi [46] carried out a laboratory study on two types of Hungarian travertines: a massive, less porous type and a laminated, porous type. These researchers found porosity values of 2.42–5.62% and 4.41–13.13% for massive and laminated travertines, respectively. In another study, Khanlari et al. [47] found that some laminated travertines from Hamedan Province, western Iran, had porosity values between 2.73 and 7.17% and between 3.01 and 6.55% for cylindrical core samples parallel and perpendicular to their lamination planes, respectively.
The studied samples were classified according to their porosity values [48]. It can be seen from Table 3 that granite samples fall into the stone classes with very low (<1%) and low (1–5%) porosity, while travertine samples were categorized as stones with medium porosity (5–15%) and high porosity (15–30%).
Based on the results presented in Table 3, there is a significant difference between the UCS values obtained for the granite and travertine samples. The granites have UCS values varying from 99.0 to 179.3 MPa, while these values were between 23.4 and 60.3 MPa for travertines. Considering the UCS values, granites are stones with strong (UCS = 50–120 MPa) and very strong (UCS = 120–230 MPa) strengths; in contrast, travertines fall into stone classes with moderately weak (UCS = 15–50 MPa) and strong (UCS = 50–120 MPa) strengths [48].
Table 3. Porosity, UCS, and PLI of the granite samples.
Stone TypeStone CodePorosityUCSPLI
AVE (%)SDCV (%)1 Porosity ClassificationAVE (MPa)SDCV (%)2 UCS ClassificationAVE (MPa)SDCV (%)3 PLI Classification
GraniteG10.740.0131.76VL149.02.31.5VS10.700.232.15EH
G21.210.0211.74L123.21.81.5VS9.860.303.04VH
G30.680.0091.32VL158.92.61.6VS11.120.282.52EH
G40.400.0071.75VL179.33.72.1VS13.200.251.89EH
G50.450.0081.78VL123.02.52.0VS9.650.272.80VH
G60.880.0161.82VL101.32.02.0S8.470.182.13VH
G71.100.0141.27L103.02.82.7S7.650.395.10VH
G80.330.0051.52VL129.63.22.5VS9.330.373.97VH
G90.800.0111.38VL154.63.01.9VS11.430.141.22EH
G100.560.0071.25VL160.91.61.0VS12.040.221.83EH
G111.150.0191.65L99.01.81.8S7.920.415.18VH
G120.290.0041.38VL107.32.72.5S8.300.333.98VH
TravertineT112.061.018.37M47.35.511.6MW3.340.3610.78VH
T25.120.6412.50M54.43.36.1S4.050.4310.62VH
T36.980.9012.89M49.14.08.1MW4.600.4810.43VH
T45.090.6111.98M58.63.86.5S4.060.4310.59VH
T513.551.108.12M39.84.110.3MW4.060.5212.81VH
T68.020.9311.60M50.03.77.4MW3.670.369.81VH
T75.910.457.61M51.53.56.8S5.040.499.72VH
T810.230.828.02M60.36.010.0S4.560.4710.31VH
T915.120.433.05H23.42.39.8MW2.110.2712.80H
T105.320.234.32M44.83.68.0MW3.620.349.39VH
T1110.440.363.45M32.32.78.4MW2.770.3010.83H
T1215.580.402.57H31.13.110.0MW2.580.3212.40H
1 According to IAEG [48]—VL: very low (porosity < 1%), L: low (porosity = 1–5%), M: medium (porosity = 5–15%), H: high (porosity = 15–30%), VH: very high (porosity > 30%). 2 According to IAEG [48]—W: weak (UCS < 15 MPa), MW: moderately weak (UCS = 15–50 MPa), S: strong (UCS = 50–120 MPa), VS: very strong (UCS = 120–230 MPa), ES: extremely strong (UCS > 230 MPa). 3 According to Broach and Franklin [49]—EL: extremely low (PLI < 0.03 MPa), VL: very low (PLI = 0.03–0.1 MPa), L: low (PLI = 0.1–0.3 MPa), M: medium (PLI = 0.3–1 MPa), H: high (PLI = 1–3 MPa), VH: very high (PLI = 3–10 MPa), EH: extremely high (PLI > 10 MPa).
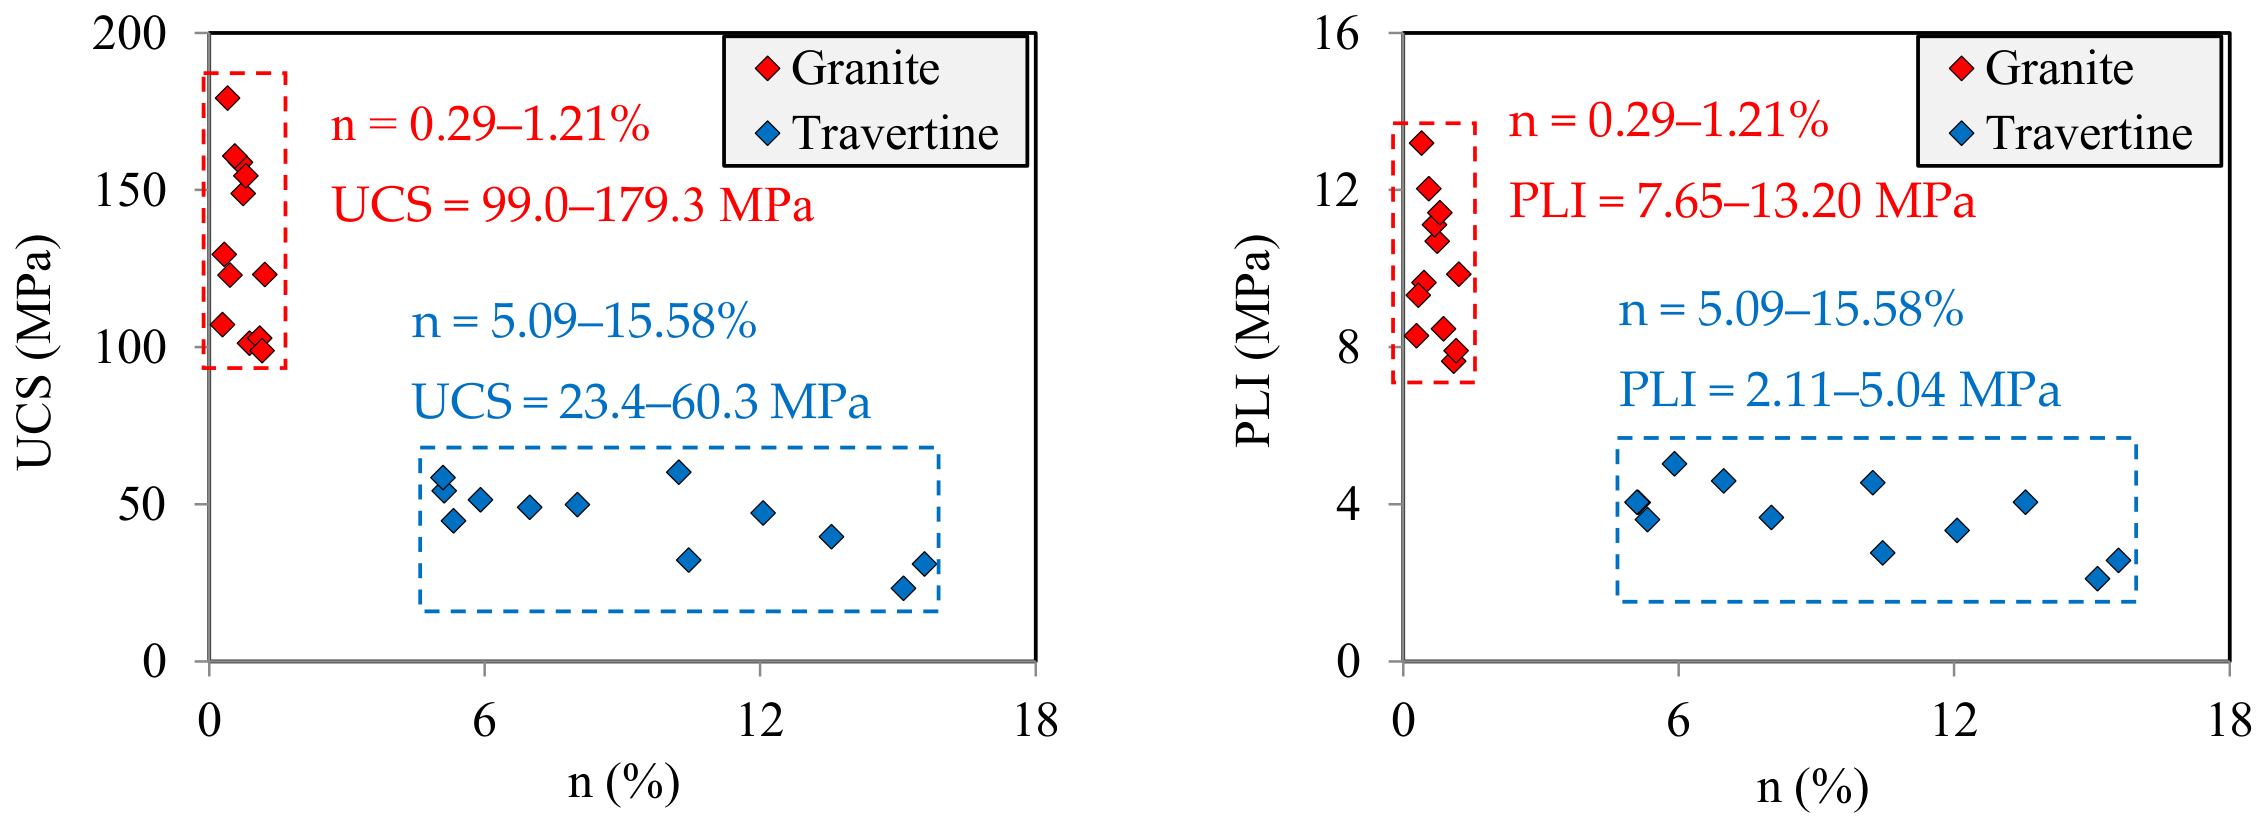
One of the key factors influencing the UCS of stones is their porosity values, so UCS usually shows an increasing trend with decreasing porosity [37,50,51]. Thus, differences in UCS between granite and travertine samples could be due to differences in their porosity. This issue was investigated by plotting UCS data versus porosity data. As shown in Figure 6, granites have porosity values between 0.29 and 1.21%, which are significantly less than those obtained for travertines with porosity values ranging from 5.09 to 15.58%. In addition, the UCS of granites (UCS = 99.0–179.3 MPa) showed higher values than those obtained for travertines (UCS = 23.4–60.3 MPa). As a result, porosity plays an important role as an adverse factor in the UCS of the samples.
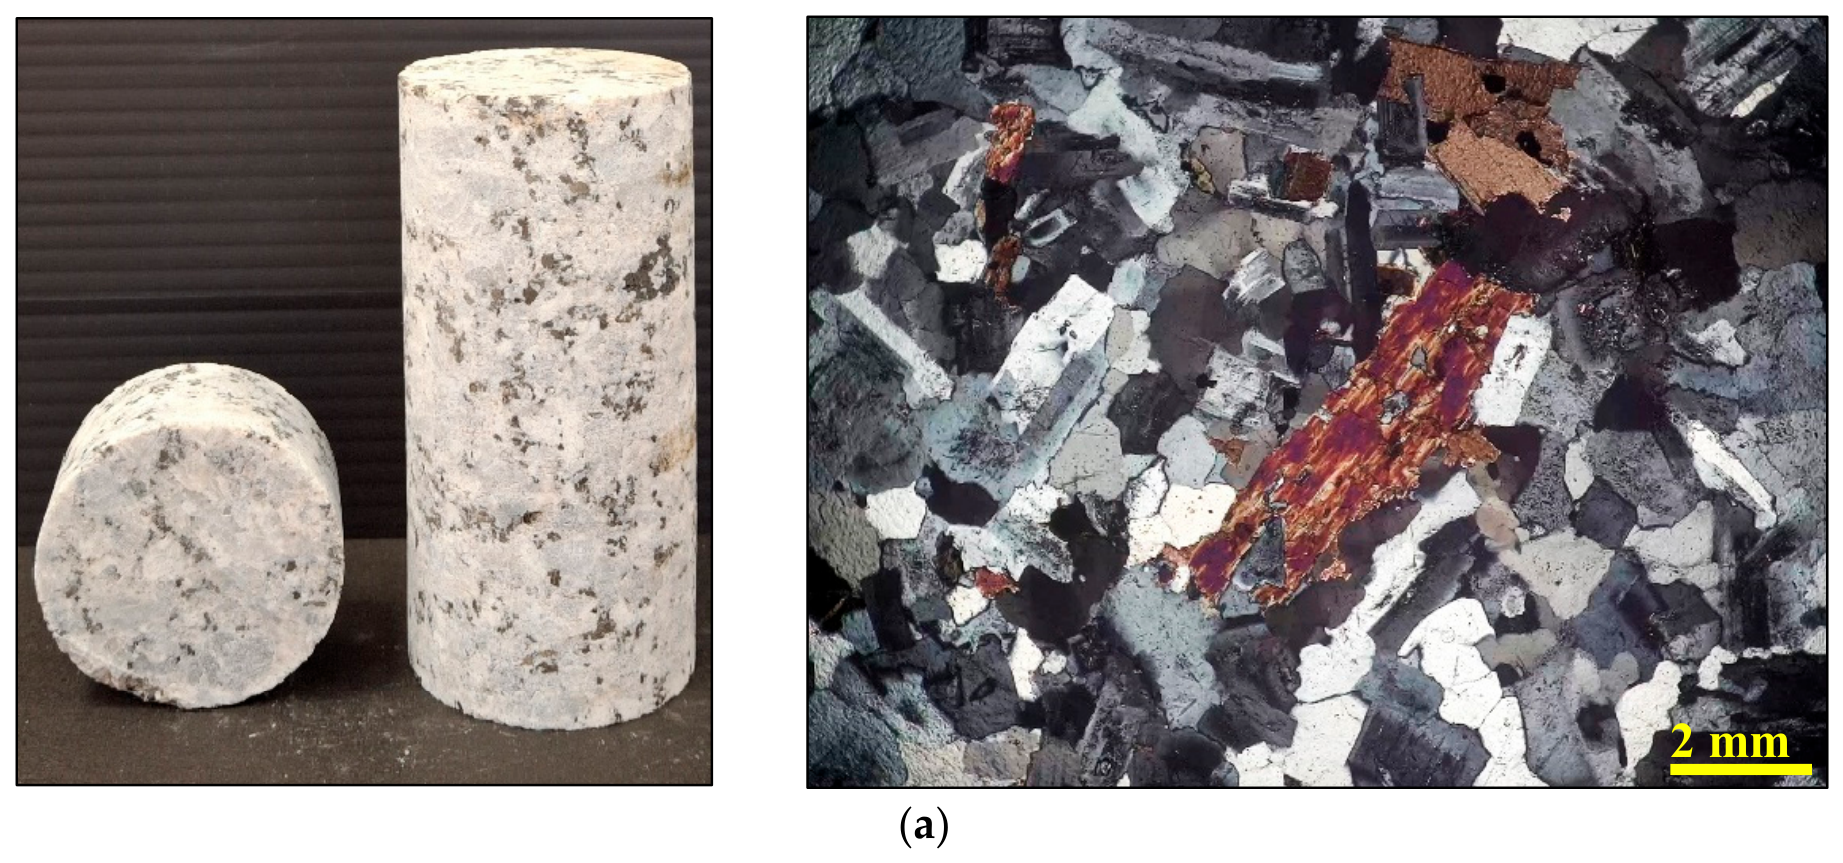
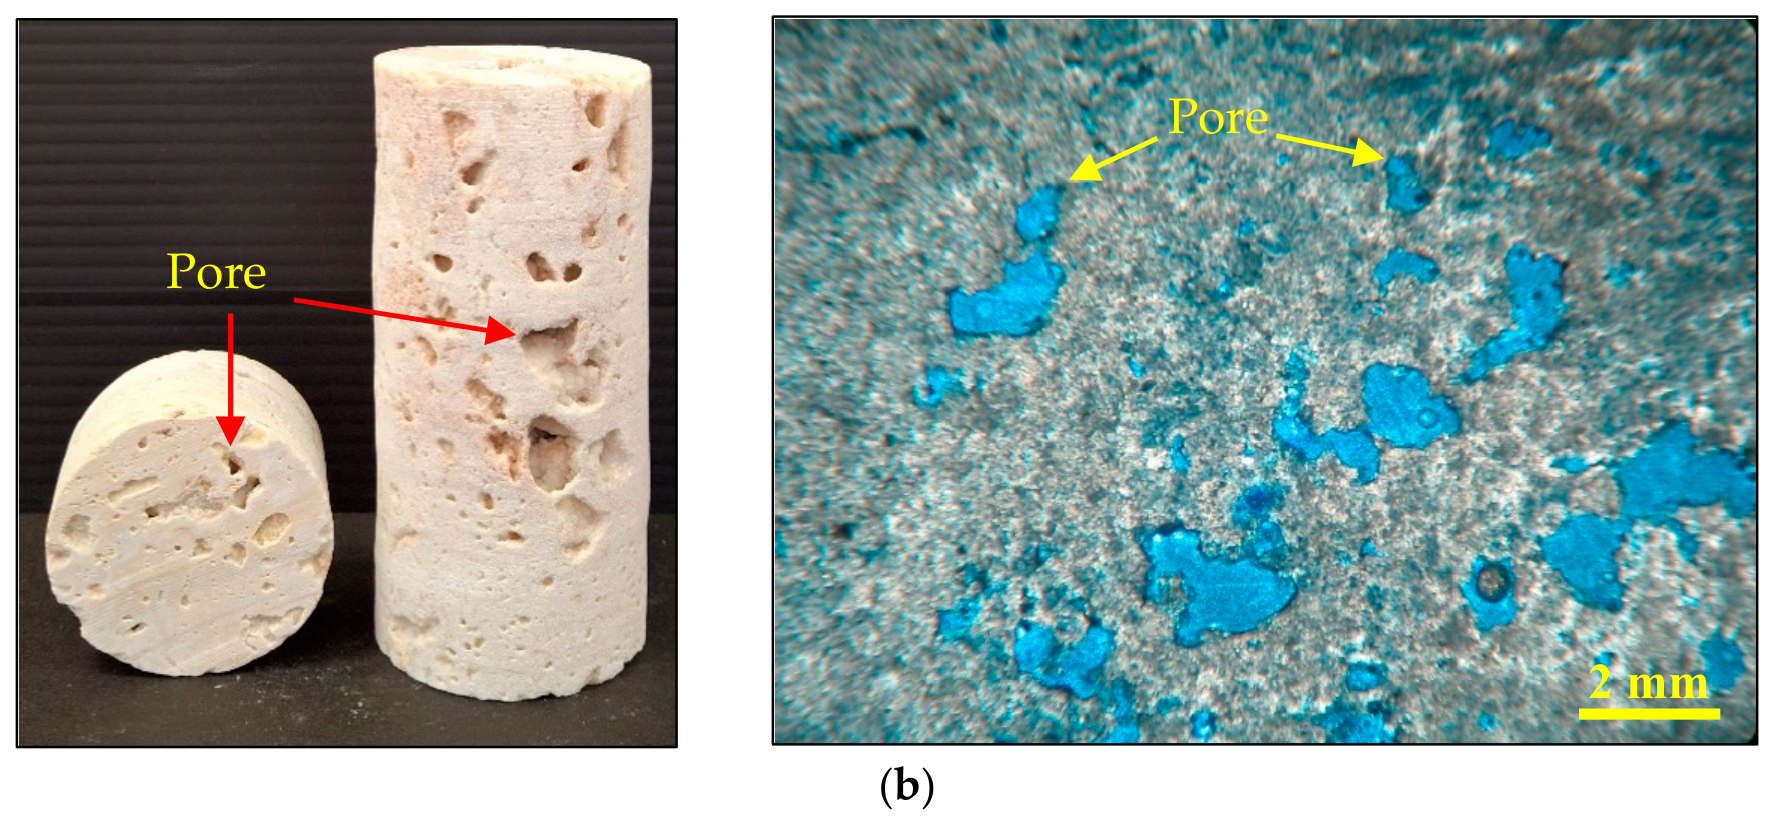
The PLI results for the samples are given in Table 3. The PLI values of the granites vary from 7.65 to 13.20 MPa, while these values for travertine are between 2.11 and 5.04 MPa. A high PLI for the granites can be attributed to their compact structure with a very low pore space. However, travertines have much lower PLI values compared to granites due to the presence of abundant pores in their structures. The structures of granite and travertine (as compact and porous stones, respectively) in terms of their pore space are shown in Figure 7. As a quantitative measure, porosity represents the amount of pore space in a stone. The porosity values of the samples were plotted versus their PLI values. It can be seen from Figure 6 that the porosity and PLI data for granites and travertines are concentrated in two completely separate areas. Low porosity corresponds to a high PLI (for granites); in contrast, high porosity corresponds to a low PLI (for travertines). This result is in good agreement with the findings regarding the role of porosity in the UCS of the samples.
The samples are categorized based on their PLI values, as suggested by Broch and Franklin [49]. It can be seen from Table 3 that the granites are classified as stones with very high (3 < PLI (MPa) < 10) and extremely high (PLI > 10 MPa) strengths. In addition, travertines show lower strength classes than granites. According to Table 3, travertines fall into stone classes with high strength (1 < PLI (MPa) < 3) and very high strength (3 < PLI (MPa) < 10).

4.2. Correlation Between UCS and PLI

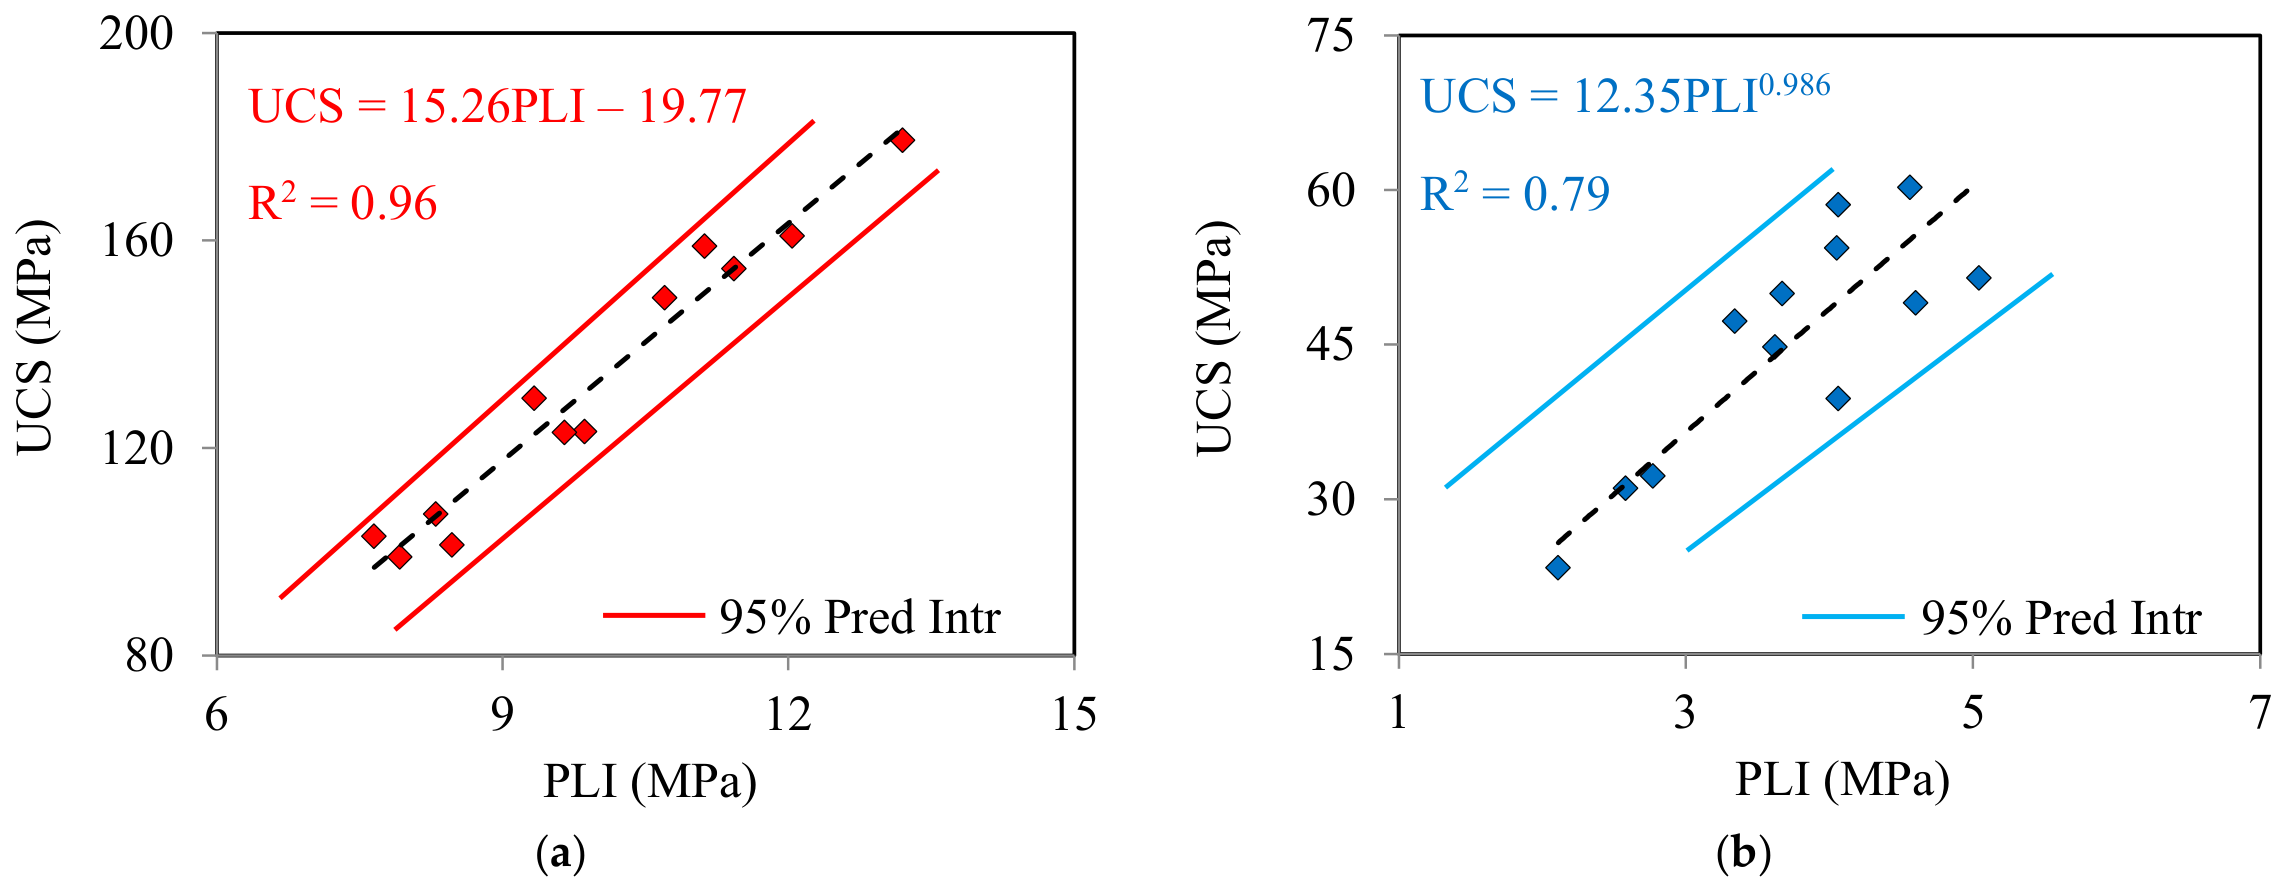
Simple regression analyses were used to investigate the correlation between the UCS and PLI of the samples. Analyses were performed separately on each of the granite and travertine samples. Four types of correlation equations, namely, linear (y = ax + b), exponential (y = aex), power (y = axb), and logarithmic (y = a + ln x), were fitted to the UCS and PLI data. Data used for regression analyses are presented in Table 3. The coefficient of determination (R2) and standard error of estimate (SEE) were used as complementary statistical criteria to compare the four types of correlation equations. In general, a higher R2 and a lower SEE indicate a better fit between the observed and predicted UCS values. The results of the regression analyses are presented in Table 4. Accordingly, among the linear, exponential, power, and logarithmic equations, the equation providing the highest R2 and the lowest SEE was selected as the most appropriate correlation equation between UCS and the PLI. It can be seen from Figure 8 that the correlation equations between UCS and the PLI are linear and power for granites and travertines, respectively, as follows:
UCS = 15.26PLI − 19.77        for granites
UCS = 12.35PLI0.986         for travertines
The R2, mean absolute percentage error (MAPE), and variance accounted for (VAF) are among the most common statistical indices used to comparatively evaluate the performance of correlation equations between two stone parameters [16,52,53,54]. These statistical indices were calculated for predictive equations of the UCS using PLI (Equations (6) and (7)) as follows:
R 2   =   1 i   =   1 N y     y i   =   1 N ( y     y ¯ ) 2
MAPE = 1 N i = 1 N y y y × 100
VAF = 1 var   ( y y ) var   y × 100
where y and y′ are the actual and predicted values of the UCS, respectively; ȳ is the mean value of y; and N is the number of the data set.
R2 measures the goodness of fit between the dependent and independent parameters in the regression model. A higher R2 value indicates a better fit of the curve to the data points. The MAPE calculates the average percentage difference between the actual and predicted values. A lower MAPE indicates higher predictive accuracy. On the other hand, VAF measures the proportion of the total variance in the actual values that is accounted for by the variance in the predicted values. A higher VAF indicates a more accurate correlation equation in predicting unknown parameters. Thus, a correlation equation has excellent performance in predicting the unknown parameter using the known parameter (in the present study: UCS and the PLI, respectively) if R2 = 1, MAPE = 0%, and VAF = 100%.
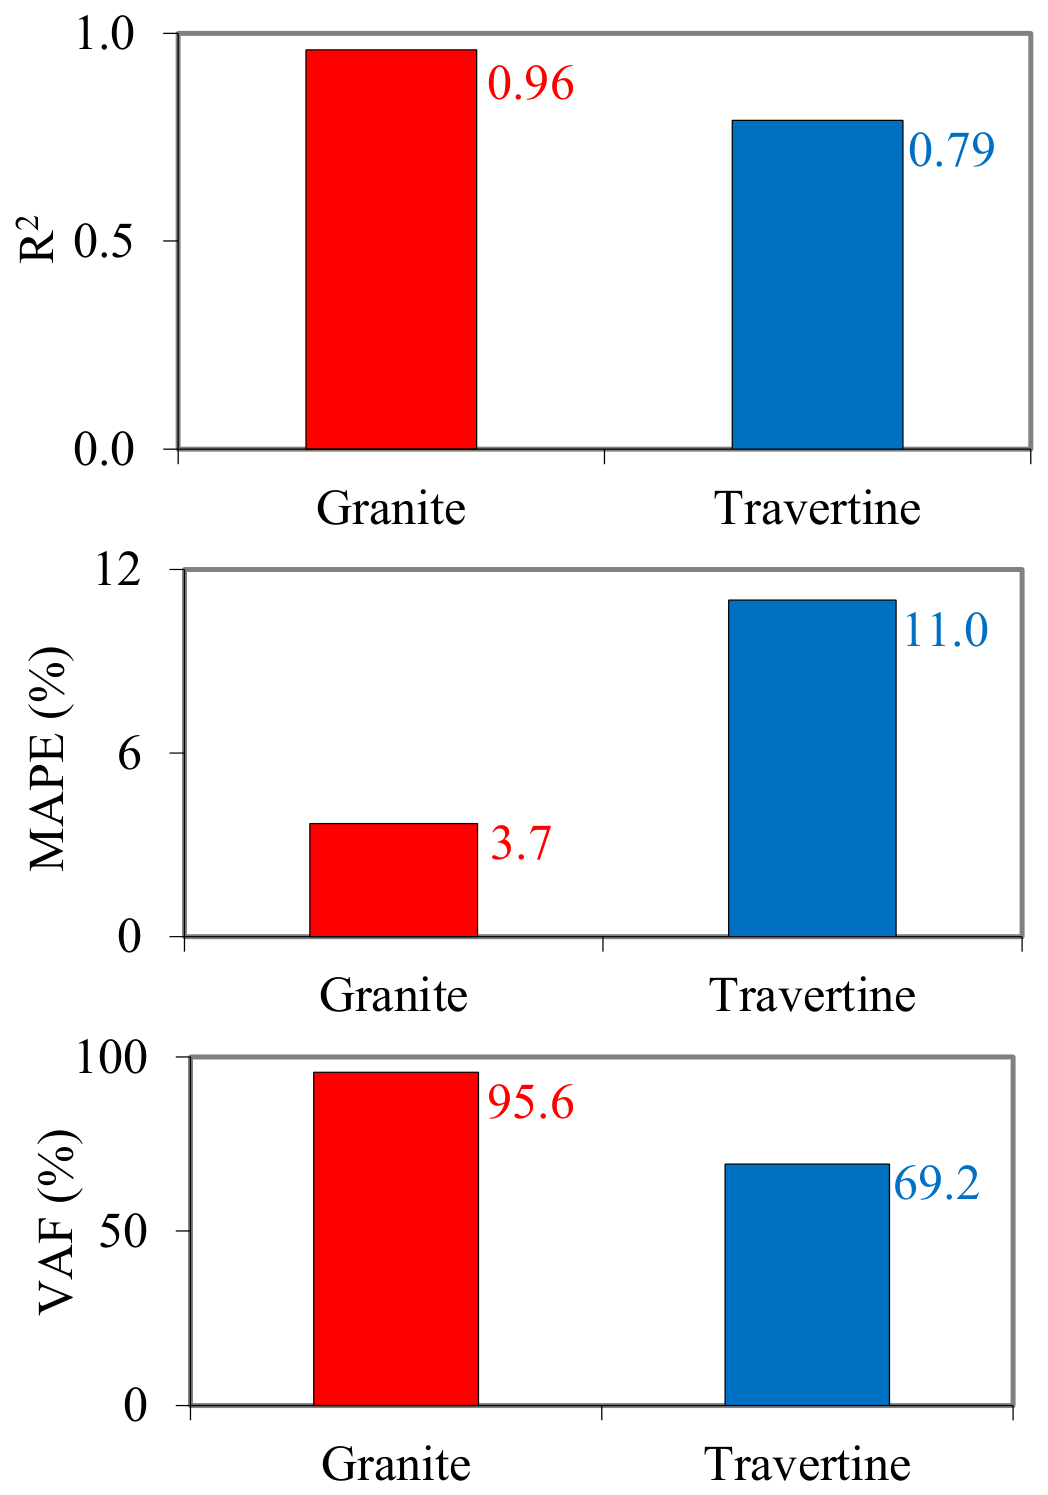
The calculated R2, MAPE, and VAF values for the correlation equations between UCS and PLI are presented in Figure 9. It can be seen from this figure that the R2, MAPE, and VAF obtained for the correlation equation between the UCS and PLI of granites have values equal to 0.96, 3.7%, and 95.6%, respectively, whereas these values were 0.79, 11.0%, and 69.2%, respectively, for the correlation equation developed between the UCS and PLI of travertines. Comparing the R2, MAPE, and VAF values of the correlation equations (Equations (6) and (7)) reveals that the PLI has better performance in predicting the UCS of granites (as compact stones) than that of travertines (as porous stones).
Given the R2, MAPE, and VAF values obtained for the granites investigated in the present study, the PLI can serve as a rapid indirect proxy for UCS in similar compact, relatively homogeneous, low-porosity stones, provided that an appropriate correlation is calibrated for the relevant lithology and local geological setting. In contrast, for porous and heterogeneous stones, such as the investigated travertines, PLI is more suitable for preliminary screening and comparative evaluation than for replacing direct UCS testing in applications requiring high accuracy. The travertine data set exhibited lower predictive performance, and the dispersion of both UCS and the PLI increased with porosity. Therefore, direct UCS testing remains necessary for the reliable quality assessment of highly porous or heterogeneous building stones.
In the present data set, the granites had porosity values of 0.29–1.21% and exhibited reliable UCS–PLI predictions, whereas the travertines had porosity values of 5.09–15.58% and showed greater data dispersion and lower predictive performance. Therefore, porosity values within the investigated granites range may be considered indicative of conditions under which PLI can provide relatively reliable preliminary UCS predictions. Conversely, the investigated travertine range represents a higher-porosity condition in which the PLI-based equation used to predict UCS should be interpreted cautiously, preferably verified by direct UCS testing. These ranges should not be considered universal acceptance or rejection thresholds, as they were obtained from a limited data set involving only granite and travertine. Establishing a general porosity-based decision criterion requires a larger multi-lithology database and independent validation.
The reason for the difference in PLI performance in UCS prediction could be due to the dispersion of UCS and PLI data. The standard deviation (SD) is a statistical metric of how dispersed the data is in relation to the average (AVE). The SD for a data set can be calculated according to Equation (11);
SD = y i AVE 2 N
where SD is the standard deviation of the UCS or PLI of a sample (e.g., sample G1), yi is the UCS or PLI value of a specimen, AVE is the measured average of the UCS or PLI values of the specimens, and N is the number of specimens used to measure the UCS or PLI of a sample (in this study, N = 6).
The results of the SD calculations for the samples are presented in Table 3. The SD values of UCS for granites and travertines range from 1.6 to 3.7 and 2.3 to 6.0, respectively. In addition, the granite and travertine samples have SD values between 0.14 and 0.41 and between 0.27 and 0.52 for PLI, respectively. A low, or small, SD value indicates that the data are clustered tightly around the AVE, and a high, or large, SD value indicates that the data are more spread out. According to Equation (11), the SD is a function of the AVE of a data set, and thus, its value is variable. SD is an absolute measure of dispersion and only applicable to a given parameter of a data set. However, when the aim is to compare the dispersion degree of a parameter value (in this study, UCS or PLI) for two data sets (in this study, granite and travertine samples) with different AVE values, SD is not a suitable statistical metric. As an alternative, the coefficient of variation (CV) is a good measure to compare the dispersion of a given parameter in two different data sets. Unlike the SD, which is an absolute measure and dependent on the AVE, CV is a relative measure of dispersion of a data set and independent of the AVE. The CV for a data set is determined through Equation (12):
CV = SD AVE × 100
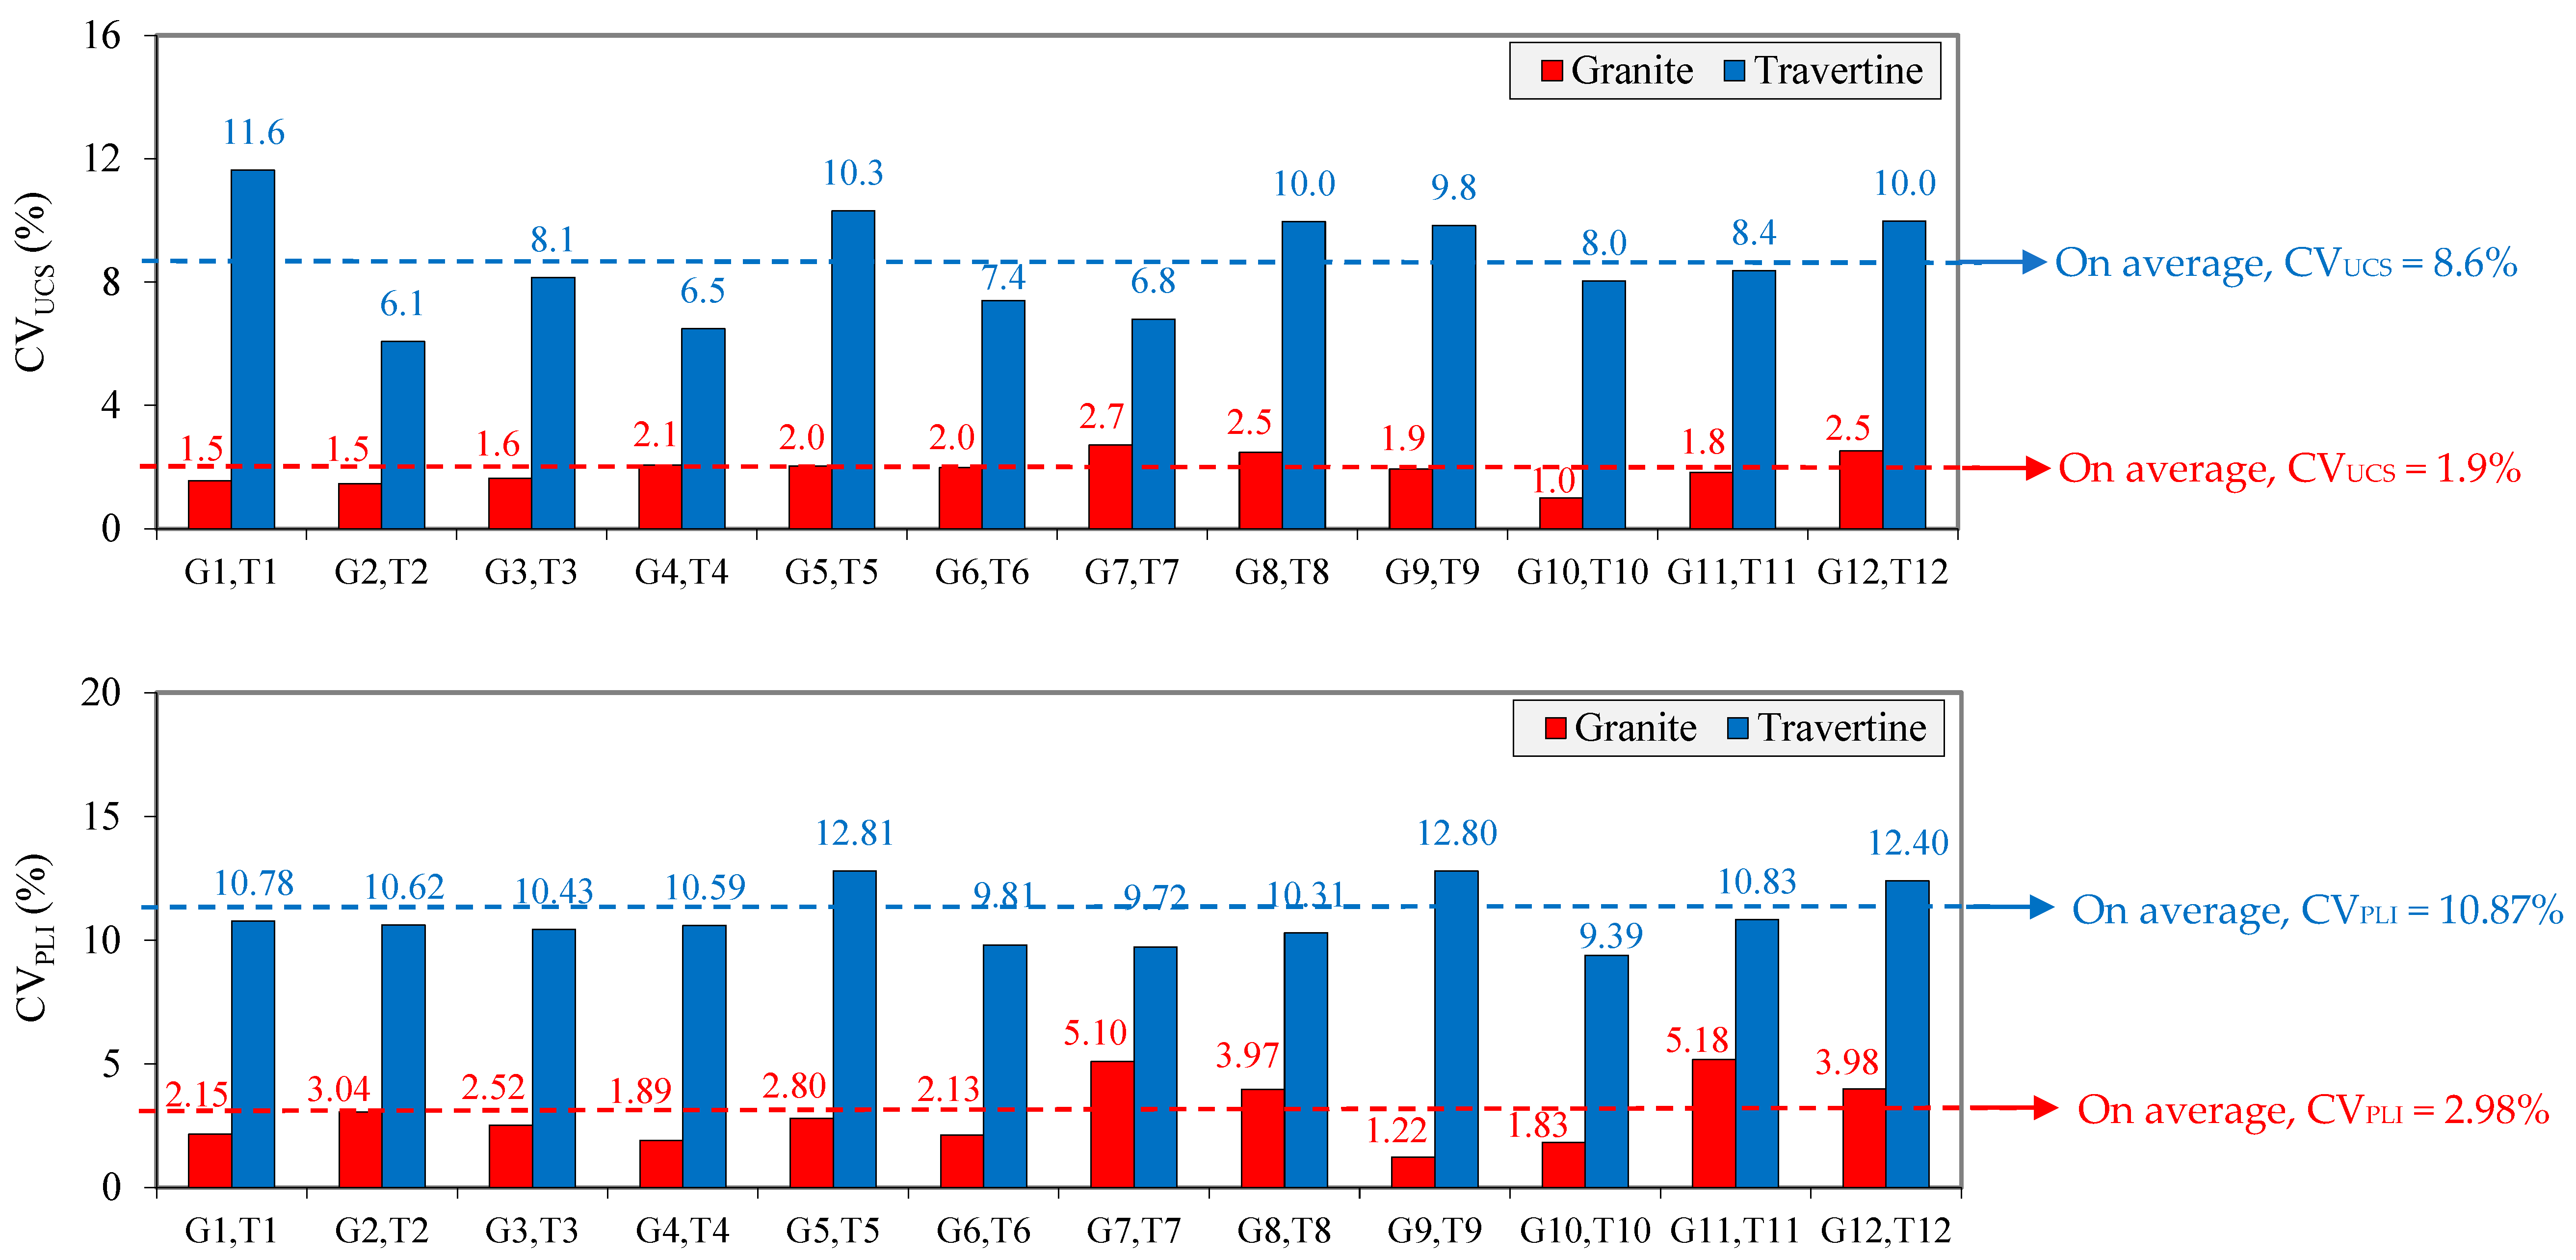
The CV values of the UCS and PLI of the samples were calculated using Equation (12). The results of these determinations are presented in Table 3 and, for a better graphical comparison, in Figure 10. According to this figure, the CV values of the UCS (CVUCS) of granites and travertines were between 1.0 and 2.7% and between 6.1 and 11.6%, respectively. Considering the CVUCS values of the samples, CVUCS averages of 1.9 and 8.6% were obtained for granites and travertines, respectively. In addition, granites and travertines had CV values of the PLI (CVPLI) of 1.22 to 5.18% and 9.39 to 12.81%, respectively. On average, the CVPLI values for granites and travertines were 2.98 and 10.87%, respectively.
Higher CVUCS and CVPLI values lead to a higher dispersion of data points around the regression curve and, consequently, a lower-performing predictive equation for UCS using PLI. Travertine has higher CVUCS and CVPLI values than granite and, thus, a higher dispersion of the data points around the regression curve, as shown in Figure 8. The lower performance of PLI in predicting the UCS of travertines compared with granites was previously verified by comparing the statistical indices, namely R2, MAPE, and VAF.
Compared with granite, which is a compact stone, travertines are porous building stones with pore spaces varying from low to high [46,47]. Figure 7 shows images of hand specimens and microscopic thin sections of travertine and granite regarding pore spaces. During the UCS and PLI tests, the heterogeneity of the travertine specimens, due to their pore space, caused the results to be scattered over a wide range, confirmed by using the statistical measurement of CVUCS and CVPLI (Figure 10). In Figure 5, UCS and PLI tests on a travertine specimen containing some pore spaces are shown. The higher dispersion of data points around the regression curve that developed between the UCS and PLI of travertines—and, consequently, the low performance of the predictive equation for UCS using PLI—can be attributed to their highly heterogeneous nature.
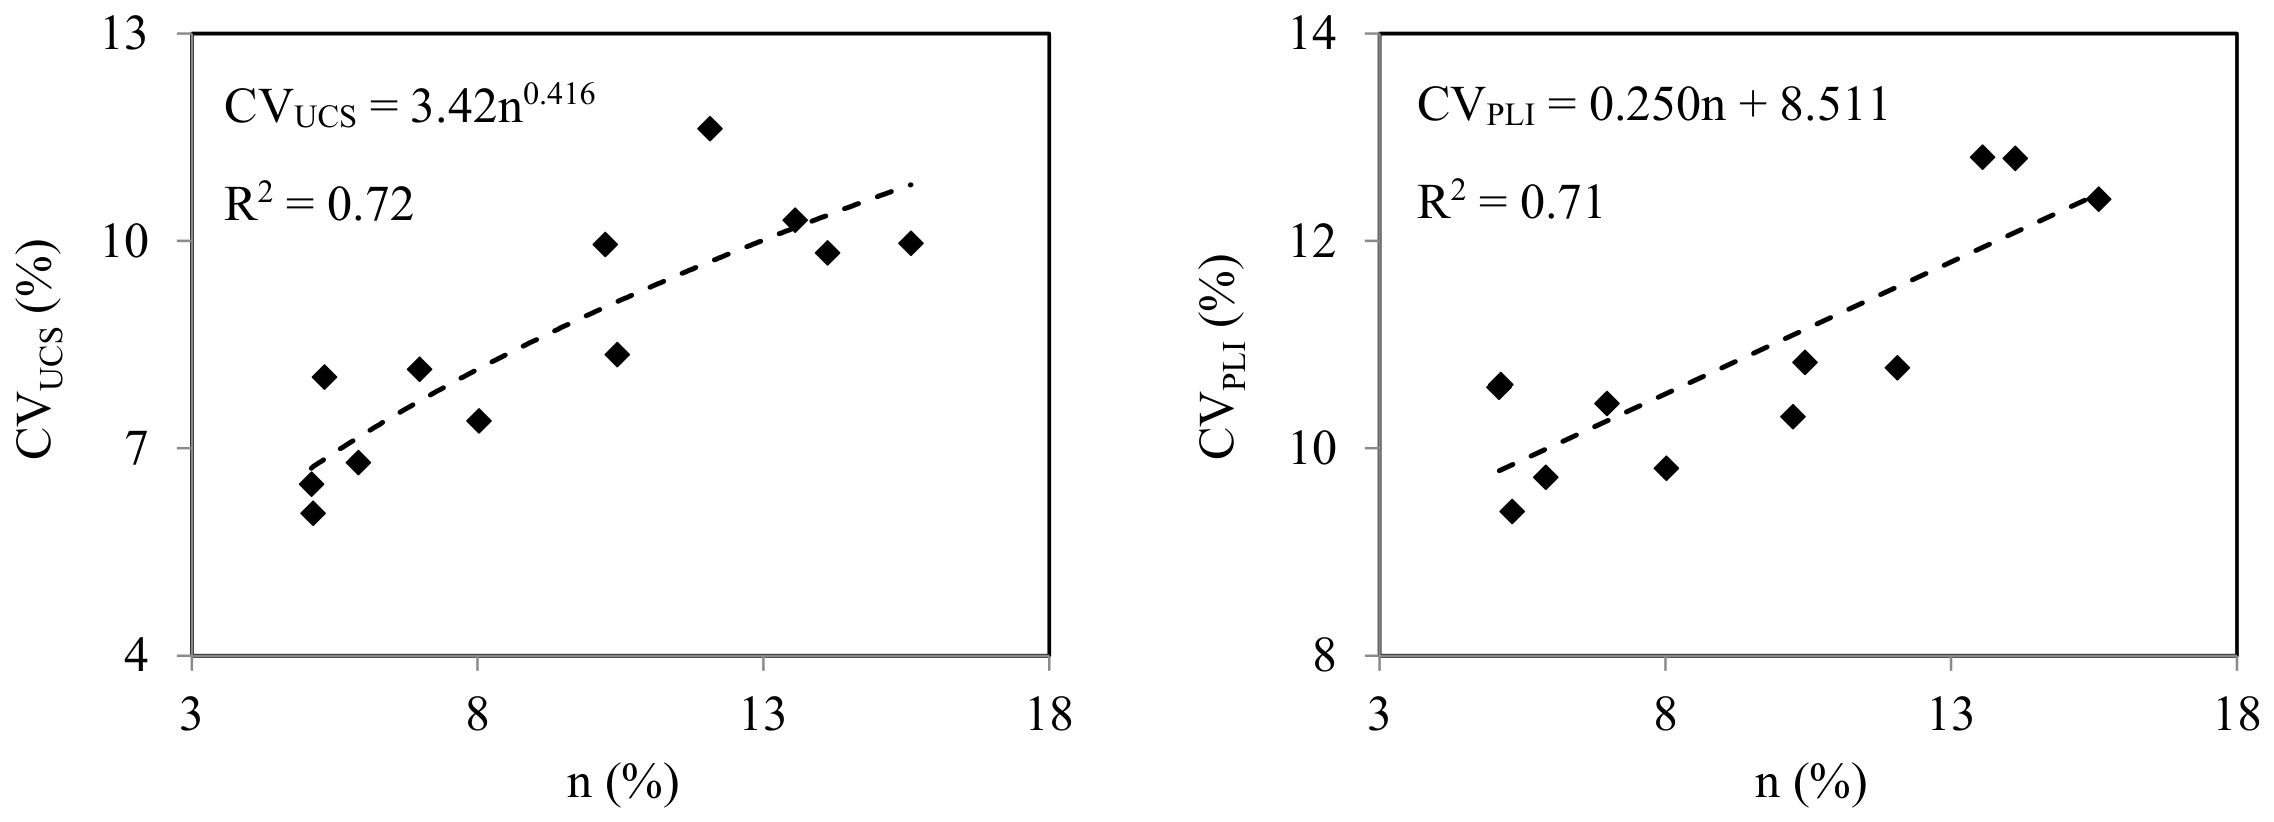
Travertines have a wide range of porosity values that can vary from <1% to very high (>30%) [48]. According to the data presented in Table 3, the studied travertine samples have porosity values between 5.09% and 15.58%. It can be seen from Figure 10 that samples with different porosity values also have different CVUCS and CVPLI values, ranging from 6.1 to 11.6% and 9.39 to 12.81%, respectively. Thus, CVUCS and CVPLI can be a function of the porosity values of the samples. The relationships of CVUCS and CVPLI with the porosity of travertines were investigated using simple regression analyses. The results of these analyses are presented in Figure 11. As can be seen from this figure, CVUCS and CVPLI show an increasing trend in the form of power and linear functions, respectively, with increasing porosity values. The correlation equations of CVUCS and CVPLI with porosity are as follows:
CVUCS = 3.420n0.416        R2 = 0.72
CVPLI = 0.250n + 8.511       R2 = 0.71
The R2 values are equal to 0.72 and 0.71 for the correlation equations of CVUCS and CVPLI with porosity. These values are at an acceptable level, indicating a real correlation between the dispersion of the UCS and PLI values of the travertines (assessed by using CVUCS and CVPLI, respectively) and their porosity values. As a result, it can be expected that in porous stones such as travertines, an increase in their porosity will lead to greater dispersion of UCS and PLI data, thus lowering the performance of the predictive equation for UCS using PLI.

5. Conclusions

In the present study, a number of granite and travertine samples were selected as representatives of compact and porous building stones, respectively. Porosity, uniaxial compressive strength (UCS), and point load index (PLI) tests were performed on cylindrical core specimens prepared from the samples. By using statistical metrics, including standard deviation (SD) and coefficient of variation (CV), the dispersion of the porosity, UCS, and PLI results was investigated. Correlation equations between UCS and PLI were developed through separate, simple regression analyses for granites and travertines. The accuracy of the predictive equations for UCS was evaluated using coefficient of determination (R2), mean absolute percentage error (MAPE), and variance accounted for (VAF). Based on an in-depth data analysis, the conclusions of the present study can be summarized as follows:
-
Overall, the higher porosity of travertines (5.09–15.58%), compared with granites (0.29–1.21%), was associated with lower UCS and PLI values. The UCS and PLI ranges were 23.4–60.3 MPa and 2.11–5.04 MPa for travertines, respectively, compared with 99.0–179.3 MPa and 7.65–13.20 MPa for granites. These findings indicate that UCS and PLI values are strongly influenced by porosity and pore–space heterogeneity.
-
The PLI showed high performance in predicting the UCS of granites, with R2 = 0.96, MAPE = 3.7%, and VAF = 95.6%. In contrast, its predictive performance was less adequate for travertines, with R2 = 0.79, MAPE = 11.0%, and VAF = 69.2%. These results indicate that a PLI-based equation for predicting UCS is more reliable for compact, low-porosity stones than for porous and heterogeneous stones.
-
The lower performance of PLI in predicting the UCS of travertines is mainly attributed to their highly porous and heterogeneous nature. The higher porosity of travertines resulted in greater dispersion of UCS and PLI data around the regression curve, as confirmed by the higher coefficients of variation of UCS and PLI (CVUCS = 10.87%, and CVPLI = 2.98%). In contrast, the low porosity and more homogeneous structure of granites resulted in lower CVUCS and CVPLI values (8.6% and 1.9%, respectively), which contributed to the higher performance of the UCS–PLI equation developed for granites.
-
It was found that the predictive accuracy of UCS using PLI is highly dependent on the physical characteristics of the stone. For compact, low-porosity stones (porosity < 1.5%), represented by the granites, PLI offers a highly reliable proxy (R2 = 0.96, MAPE = 3.7%, and VAF = 95.6%). Conversely, for porous, heterogeneous lithologies (porosity = 5.09–15.58%), such as travertines, the predictive accuracy drops significantly (R2 = 0.79, MAPE = 11.0%, and VAF = 69.2%) due to porosity-driven data dispersion. From an engineering perspective, while PLI serves as an efficient screening tool for preliminary assessment, direct UCS testing remains mandatory for heterogeneous building stones. These limitations highlight the necessity of establishing local, lithology-specific calibrations rather than applying generalized UCS–PLI conversion factors.
-
Finally, the results indicated that the UCS of travertines examined in the present study cannot be predicted with a high level of accuracy from their PLI. However, this requires more studies in the future on other porous stones, such as limestones and sandstones, to add new information to the findings of the present study.

Author Contributions

Conceptualization, A.J.; methodology, A.J.; validation, A.J. and L.S.; formal analysis, A.J. and L.S.; investigation, A.J. and L.S.; writing—original draft preparation, A.J.; writing—review and editing, A.J. and L.S.; visualization, A.J. and L.S.; supervision, L.S. All authors have read and agreed to the published version of the manuscript.

Funding

This study was supported by Fundação para a Ciência e a Tecnologia, I.P. (Portugal), in the framework of the UID/00073/2025, UID/PRR/00073/2025 and UID/PRR2/00073/2025 projects of the R&D unit of the Geosciences Center (University of Coimbra, Portugal).

Institutional Review Board Statement

Not applicable.

Informed Consent Statement

Not applicable.

Data Availability Statement

The original contributions presented in this study are included in this article. Further inquiries can be directed to the corresponding author.

Acknowledgments

The authors acknowledge the official support of the Engineering Geology Laboratory of Lorestan University, Khorramabad, Iran, for performing all laboratory tests in this research.

Conflicts of Interest

The authors declare no conflicts of interest.

Abbreviations

The following abbreviations are used in this manuscript:
PLIPoint load index
UCSUniaxial compressive strength
MAPEMean absolute percentage error
VAFVariance accounted for
AVEAverage
SDStandard deviation
CVCoefficient of variation
msatSaturation mass
mdDry mass
nPorosity
VvPores volume
VBulk volume
ρwWater density
rRadius
hHeight
PfFailure load
DeEquivalent core diameter
FSize correction factor
R2Coefficient of determination

References

  1. Shohda, A.M.A.; Ali, M.A.M.; Ren, G.; Kim, J.G.; Abdo, A.M.; Abdellah, W.R.; Hassan, A.M. Sustainable assignment of Egyptian ornamental stones for interior and exterior building finishes using the AHP-TOPSIS technique. Sustainability 2022, 14, 2453. [Google Scholar] [CrossRef] [Scilit]
  2. Paládi-Kovács, Á.; Nemes, R. Design issues and value analysis of modern stone slab coverings. Eng 2025, 6, 209. [Google Scholar] [CrossRef] [Scilit]
  3. Yavuz, A.B.; Kaputoglu, S.A.; Colak, M.; Tanyu, B.F. Durability assessments of rare green andesites widely used as building stones in Buca (Izmir), Turkey. Environ. Earth Sci. 2017, 76, 211. [Google Scholar] [CrossRef] [Scilit]
  4. Celik, M.Y.; Sert, M. Accelerated aging laboratory tests for the evaluation of the durability of hydrophobic treated and untreated andesite with respect to salt crystallization, freezing-thawing, and thermal shock. Bull. Eng. Geol. Environ. 2020, 79, 3751–3770. [Google Scholar] [CrossRef] [Scilit]
  5. Yao, J.; Liu, C.; Chen, B. A Nanoindentation-Based Study on the Mechanical Properties of Main Rock-Forming Minerals in Granite. Eng 2026, 7, 130. [Google Scholar] [CrossRef] [Scilit]
  6. Zalooli, A.; Khamehchiyan, M.; Nikudel, M.R.; Freire-Lista, D.M.; Fort, R.; Ghasemi, S. Artificial microcracking of granites subjected to salt crystallization aging test. Bull. Eng. Geol. Environ. 2020, 79, 5499–5515. [Google Scholar] [CrossRef] [Scilit]
  7. Strzałkowski, P.; Köken, E.; Sousa, L. Guidelines for natural stone products in connection with European standards. Materials 2023, 16, 6885. [Google Scholar] [CrossRef] [Scilit] [PubMed]
  8. Bayram, F. Predicting mechanical strength loss of natural stones after freeze-thaw in cold regions. Cold Reg. Sci. Technol. 2012, 83–84, 98–102. [Google Scholar] [CrossRef] [Scilit]
  9. Abdelhamid, M.M.A.; Li, D.; Ren, G. Predicting unconfined compressive strength decrease of carbonate building materials against frost attack using nondestructive physical tests. Sustainability 2020, 12, 1379. [Google Scholar] [CrossRef] [Scilit]
  10. Huang, S.; He, Y.; Yu, S.; Cai, C. Experimental investigation and prediction model for UCS loss of unsaturated sandstones under freeze-thaw action. Int. J. Rock Mech. Min. Sci. 2022, 32, 41–49. [Google Scholar] [CrossRef] [Scilit]
  11. Kahraman, S. Evaluation of simple methods for assessing the uniaxial compressive strength of rock. Int. J. Rock Mech. Min. Sci. 2001, 38, 981–994. [Google Scholar] [CrossRef] [Scilit]
  12. Yilmaz, I.; Yuksek, G. Prediction of the strength and elasticity modulus of gypsum using multiple regression, ANN, and ANFIS models. Int. J. Rock Mech. Min. Sci. 2009, 46, 803–810. [Google Scholar] [CrossRef] [Scilit]
  13. Ceryan, N.; Okkan, U.; Kesimal, A. Prediction of unconfined compressive strength of carbonate rocks using artificial neural networks. Environ. Earth Sci. 2013, 68, 807–819. [Google Scholar] [CrossRef] [Scilit]
  14. Jamshidi, A.; Yazarloo, R.; Gheiji, S. Comparative evaluation of Schmidt hammer test procedures for prediction of rocks strength. Int. J. Min. Geo-Eng. 2018, 52, 199–206. [Google Scholar] [CrossRef] [Scilit]
  15. Aladejare, A.E.; Alofe, E.D.; Onifade, M.; Lawal, A.I.; Ozoji, T.M.; Zhang, Z.-X. Empirical estimation of uniaxial compressive strength of rock: Database of simple, multiple, and artificial intelligence-based regressions. Geotech. Geol. Eng. 2021, 39, 4427–4455. [Google Scholar] [CrossRef] [Scilit]
  16. Kong, F.; Xue, Y.; Shang, J.; Zhu, C.; Han, M.; Qu, Z.; Wang, B.; Yang, K. Predicting uniaxial compressive strength of building stone based on index tests: Correlations, validity, reliability, and unification. Constr. Build. Mater. 2024, 438, 137227. [Google Scholar] [CrossRef] [Scilit]
  17. Deere, D.U.; Miller, R.P. Engineering Classification and Index Properties for Intact Rock; Technical Report No. AFNL-TR-65-116; Air Force Weapon Laboratory: Albuquerque, NM, USA, 1966. [Google Scholar]
  18. Cargill, J.S.; Shakoor, A. Evaluation of empirical methods for measuring the uniaxial compressive strength of rock. Int. J. Rock Mech. Min. Sci. Geomech. Abstr. 1990, 27, 495–503. [Google Scholar] [CrossRef] [Scilit]
  19. Chau, K.T.; Wong, R.H.C. Uniaxial compressive strength and point load strength of rocks. Int. J. Rock Mech. Min. Sci. Geomech. Abstr. 1996, 33, 183–188. [Google Scholar] [CrossRef] [Scilit]
  20. Tugrul, A.; Zarif, I.H. Correlation of mineralogical and textural characteristics with engineering properties of selected granitic rocks from Turkey. Eng. Geol. 1999, 51, 303–317. [Google Scholar] [CrossRef] [Scilit]
  21. Tsiambaos, G.; Sabatakakis, N. Considerations on strength of intact sedimentary rocks. Eng. Geol. 2004, 72, 261–273. [Google Scholar] [CrossRef] [Scilit]
  22. Fener, M.; Kahraman, S.; Bilgil, A.; Gunaydin, O. A comparative evaluation of indirect methods to estimate the compressive strength of rocks. Rock Mech. Rock Eng. 2005, 38, 329–343. [Google Scholar] [CrossRef] [Scilit]
  23. Basu, A.; Aydin, A. Predicting uniaxial compressive strength by point load test: Significance of cone penetration. Rock Mech. Rock Eng. 2006, 39, 483–490. [Google Scholar] [CrossRef] [Scilit]
  24. Sabatakakis, N.; Koukis, G.; Tsiambaos, G.; Papanakli, S. Index properties and strength variation controlled by microstructure for sedimentary rocks. Eng. Geol. 2008, 97, 80–90. [Google Scholar] [CrossRef] [Scilit]
  25. Diamantis, K.; Gartzos, E.; Migiros, G. Study on uniaxial compressive strength, point load strength index, dynamic and physical properties of serpentinites from Central Greece: Test results and empirical relations. Eng. Geol. 2009, 108, 199–207. [Google Scholar] [CrossRef] [Scilit]
  26. Mishra, D.A.; Basu, A. Estimation of uniaxial compressive strength of rock materials by index tests using regression analysis and fuzzy inference system. Eng. Geol. 2013, 160, 54–68. [Google Scholar] [CrossRef] [Scilit]
  27. Yesiloglu-Gultekin, N.; Gokceoglu, C.; Sezer, E.A. Prediction of uniaxial compressive strength of granitic rocks by various nonlinear tools and comparison of their performances. Int. J. Rock Mech. Min. Sci. 2013, 62, 113–122. [Google Scholar] [CrossRef] [Scilit]
  28. Kahraman, S. The determination of uniaxial compressive strength from point load strength for pyroclastic rocks. Eng. Geol. 2014, 170, 33–42. [Google Scholar] [CrossRef] [Scilit]
  29. Palassi, M.; Emami, V. A new nail penetration test for estimation of rock strength. Int. J. Rock Mech. Min. Sci. 2014, 66, 124–127. [Google Scholar] [CrossRef] [Scilit]
  30. Tandon, R.S.; Gupta, V. Estimation of strength characteristics of different Himalayan rocks from Schmidt hammer rebound, point load index, and compressional wave velocity. Bull. Eng. Geol. Environ. 2015, 74, 521–533. [Google Scholar] [CrossRef] [Scilit]
  31. Jamshidi, A.; Nikudel, M.R.; Khamehchiyan, M.; Zarei Sahamieh, R.; Abdi, Y. A correlation between P-wave velocity and Schmidt hardness with mechanical properties of travertine building stones. Arab. J. Geosci. 2016, 9, 568. [Google Scholar] [CrossRef] [Scilit]
  32. Yin, J.H.; Wong, R.H.C.; Chau, K.T.; Lai, D.T.W.; Zhao, G.-S. Point load strength index of granitic irregular lumps: Size correction and correlation with uniaxial compressive strength. Tunn. Undergr. Space Technol. 2017, 70, 388–399. [Google Scholar] [CrossRef] [Scilit]
  33. Sahin, M.; Ulusay, R.; Karakul, H. Point load strength index of half-cut core specimens and correlation with uniaxial compressive strength. Rock Mech. Rock Eng. 2020, 53, 3745–3760. [Google Scholar] [CrossRef] [Scilit]
  34. Teymen, A.; Mengüç, E.C. Comparative evaluation of different statistical tools for the prediction of uniaxial compressive strength of rocks. Int. J. Min. Sci. Technol. 2020, 30, 785–797. [Google Scholar] [CrossRef] [Scilit]
  35. Xue, Y.; Kong, F.; Li, S.; Zhang, L.; Zhou, B.; Li, G.; Gong, H. Using indirect testing methods to quickly acquire the rock strength and rock mass classification in tunnel engineering. Int. J. Geomech. 2020, 20, 05020001. [Google Scholar] [CrossRef] [Scilit]
  36. Jamshidi, A. A comparative study of point load index test procedures in predicting the uniaxial compressive strength of sandstones. Rock Mech. Rock Eng. 2022, 55, 4507–4516. [Google Scholar] [CrossRef] [Scilit]
  37. Jamshidi, A.; Sousa, L. Accuracy of point load index and Brazilian tensile strength in predicting the uniaxial compressive strength of the rocks: A Comparative Study. Materials 2024, 17, 5081. [Google Scholar] [CrossRef] [Scilit] [PubMed]
  38. ISRM. Rock Characterization, Testing and Monitoring, ISRM Suggested Methods; Brown, E.T., Ed.; Pergamon Press: Oxford, UK, 1981. [Google Scholar]
  39. Marshak, S.; Rauber, R. Earth Science, 2nd, ed.; W.W. Norton & Company: New York, NY, USA, 2020. [Google Scholar]
  40. Drysdale, R.N. The sedimentological significance of hydropsychid caddis-fly larvae (Order: Trichptera) in a travertine-depositing stream: Louie Creek, Northwest Queensland, Australia. J. Sediment. Res. 1999, 69, 145–150. [Google Scholar] [CrossRef] [Scilit]
  41. Pentecost, A. Travertine; Springer: Berlin/Heidelberg, Germany, 2005. [Google Scholar]
  42. Ersoy, A.; Atici, U. Performance characteristics of circular diamond saws in cutting different types of rocks. Diam. Relat. Mater. 2004, 13, 22–37. [Google Scholar] [CrossRef] [Scilit]
  43. Momeni, A.; Abdilor, Y.; Khanlari, G.R.; Heidari, M.; Sepahi, A.A. The effect of freeze–thaw cycles on physical and mechanical properties of granitoid hard rocks. Bull. Eng. Geol. Environ. 2016, 75, 1649–1656. [Google Scholar] [CrossRef] [Scilit]
  44. Yaşar, E.; Erdoğan, Y.; Güneyli, H. Determination of the thermal conductivity from physico-mechanical properties. Bull. Eng. Geol. Environ. 2008, 67, 219–225. [Google Scholar] [CrossRef] [Scilit]
  45. Akin, M. A quantitative weathering classification system for yellow travertines. Environ. Earth Sci. 2010, 61, 47–61. [Google Scholar] [CrossRef] [Scilit]
  46. Török, A.; Vásárhelyi, B. The influence of fabric and water content on selected rock mechanical parameters of travertine, examples from Hungary. Eng. Geol. 2010, 115, 237–245. [Google Scholar] [CrossRef] [Scilit]
  47. Khanlari, G.R.; Naseri, F.; Freire-Lista, D.M. Estimating compressive and flexural strength of travertines with respect to laminae-orientation by geomechanical properties. Bull. Eng. Geol. Environ. 2019, 78, 1451–1470. [Google Scholar] [CrossRef] [Scilit]
  48. IAEG. Classification of rocks and soils for engineering geological mapping part 1: Rock and Soil Materials. Bull. Eng. Geol. Environ. 1979, 19, 364–371. [Google Scholar] [CrossRef] [Scilit]
  49. Broch, E.; Franklin, J.A. The point-load strength test. Int. J. Rock Mech. Min. Sci. 1972, 9, 669–676. [Google Scholar] [CrossRef] [Scilit]
  50. Benavente, D.; Fort, R.; Gomez-Heras, M. Improving uniaxial compressive strength estimation of carbonate sedimentary rocks by combining minimally invasive and non-destructive techniques. Int. J. Rock Mech. Min. Sci. 2021, 147, 104915. [Google Scholar] [CrossRef] [Scilit]
  51. Rajabzadeh, M.A.; Moosavinasab, Z.; Rakhshandehroo, G. Effects of rock classes and porosity on the relation between uniaxial compressive strength and some rock properties for carbonate rocks. Rock Mech. Rock Eng. 2012, 45, 113–122. [Google Scholar] [CrossRef] [Scilit]
  52. Malkawi, D.A.; Rabab’ah, S.R.; Sharo, A.A.; Aldeeky, H.; Al-Souliman, G.K.; Saleh, H.O. Enhancing of uniaxial compressive strength of travertine rock prediction through machine learning and multivariate analysis. Results Eng. 2023, 20, 101593. [Google Scholar] [CrossRef] [Scilit]
  53. Jamshidi, A.; Ajalloeian, R.; Hashemi, M.; Aligholi, S.; Emami Mybodi, M.R. A comparison between porosities measured from specimens with regular and irregular shapes and their accuracy in predicting the strength characteristics of carbonate building stones. Constr. Build. Mater. 2024, 452, 138946. [Google Scholar] [CrossRef] [Scilit]
  54. Ajalloeian, R.; Jamshidi, A.; Khorasani, R. Evaluating the effects of mineral grain size and mineralogical composition on the correlated equations between strength and Schmidt Hardness of granitic rocks. Geotech. Geol. Eng. 2024, 42, 675–685. [Google Scholar] [CrossRef] [Scilit]
Figure 1. Sampling locations in Iran: (a) granite (Hamadan Province), (b) granite (Lorestan Province), (c) travertine (Markazi Province), and (d) travertine (Yazd Province).
Eng 07 00479 g001
Figure 2. Some applications of stones used in the present study: (a) cladding (travertine), (b) paving (granite), (c) floor and stairs (granite), and (d) curb (travertine).
Eng 07 00479 g002
Figure 3. (a) Some block samples. (b) Coring machine used to prepare the cylindrical core specimens. (c) Some specimens prepared from block samples using the coring machine.
Eng 07 00479 g003
Figure 4. Some specimens prepared for various tests: (a) granite and (b) travertine.
Eng 07 00479 g004
Figure 5. UCS and PLI tests on (a) granite (as compact stone) and (b) travertine (as porous stone).
Eng 07 00479 g005
Figure 6. Plot of UCS and PLI versus porosity (n) of the samples.
Eng 07 00479 g006
Figure 7. Images of hand specimens and microscopic thin sections: (a) granite (as compact stone) and (b) travertine (as porous stone).
Eng 07 00479 g007aEng 07 00479 g007b
Figure 8. Correlation between UCS and PLI of the samples: (a) granite and (b) travertine.
Eng 07 00479 g008
Figure 9. Values of the statistical indices obtained for correlation equations between the UCS and PLI of the samples.
Eng 07 00479 g009
Figure 10. CV values of UCS and PLI.
Eng 07 00479 g010
Figure 11. Relationships between CVUCS, CVPLI, and porosity (n) for the travertine samples.
Eng 07 00479 g011
Table 1. Correlation equations between UCS and PLI.
SourceRock TypeCorrelation EquationR2
Kahraman [11]Different rock typesUCS = 8.41PLI + 9.510.85
Kong et al. [16]Different rock typesUCS = 16.19PLI0.90
Deere and Miller [17]Different rock typesUCS = 20.7PLI + 29.60.92
Cargill and Shakoor [18]Limestone, sandstone, marbleUCS = 23PLI + 130.94
Chau and Wong [19]GraniteUCS = 12.5PLI0.73
Tugrul and Zarif [20]Granitic rocksUCS = 15.25PLI0.96
Tsiambaos and Sabatakakis [21]Different rock typesUCS = (13–28)PLI0.82
Fener et al. [22]Different rock typesUCS = 9.08PLI + 39.30.72
Basu and Aydin [23]GraniteUCS = 21PLI0.93
Sabatakakis et al. [24]Sandstone, limestoneUCS = 7.6PLI1.740.81
Diamantis et al. [25]SerpentiniteUCS = 19.79PLI0.74
Mishra and Basu [26]Granite, schist, sandstoneUCS = 14.63PLI0.88
Yesiloglu-Gultekin et al. [27]Granite, granodioriteUCS = 50.08e0.0846PLI0.48
Kahraman [28]Pyroclastic rocksUCS = 2.27e1.04PLI0.93
Palassi and Emami [29]Travertine, marbleUCS = 20.1PLI − 17.10.80
Tandon and Gupta [30]Different rock typesUCS = 3.125PLI + 40.080.41
Jamshidi et al. [31]TravertineUCS = 14.39PLI − 12.360.92
Yin et al. [32]Granitic rocksUCS = 22.27PLI0.82
Sahin et al. [33]Basalt, gypsum, marbleUCS = 12.8PLI0.83
Teymen and Mengüç [34]Andesite, limestone, marbleUCS = 12.29PLI1.2330.80
Xue et al. [35]GraniteUCS = 16.02PLI0.91
Jamshidi [36]SandstoneUCS = 4.94PLI + 33.030.85
Jamshidi and Sousa [37]LimestoneUCS = 27.08e0.192PLI0.82
Table 2. Stone types used in the present study and corresponding sampling locations.
GraniteTravertine
Stone CodeSampling LocationStone CodeSampling Location
G1Hamadan ProvinceT1Markazi Province
G2Hamadan ProvinceT2Markazi Province
G3Hamadan ProvinceT3Markazi Province
G4Hamadan ProvinceT4Markazi Province
G5Lorestan ProvinceT5Markazi Province
G6Lorestan ProvinceT6Markazi Province
G7Lorestan ProvinceT7Markazi Province
G8Lorestan ProvinceT8Markazi Province
G9Lorestan ProvinceT9Yazd Province
G10Lorestan ProvinceT10Yazd Province
G11Lorestan ProvinceT11Yazd Province
G12Lorestan ProvinceT12Yazd Province
Table 4. Summary of the simple regression analysis results.
Stone TypeCorrelation EquationEquation TypeR2SEE
GraniteUCS = 15.26PLI − 19.77Linear0.965.99
UCS = 41.37e0.115PLIExponential0.946.65
UCS = 9.288PLI1.154Power0.956.35
UCS = 152.7ln(PLI)−216.6Logarithmic0.956.29
TravertineUCS = 10.88PLI + 4.90Linear0.706.61
UCS = 15.56e0.279PLIExponential0.736.24
UCS = 12.35PLI0.936Power0.795.53
UCS = 38.15ln(PLI) − 3.64Logarithmic0.756.02
Disclaimer/Publisher’s Note: The statements, opinions and data contained in all publications are solely those of the individual author(s) and contributor(s) and not of MDPI and/or the editor(s). MDPI and/or the editor(s) disclaim responsibility for any injury to people or property resulting from any ideas, methods, instructions or products referred to in the content.