1. Introduction
The study of multiphase flow through pipelines and other flow conduits is of importance to a wide range of applications. These include industries involving petroleum processes, pipeline transportation (e.g., oil and/or gas), and petrochemical processes. Movement of two or more phases, known as multiphase flow, refers to the movement of gas, liquid and sometimes solid particles within the same conduit. This complex flow behaviour may have a great influence on the reliability, efficiency, and safety of fluid transport systems. It is essential for understanding multiphase characteristics such as pressure gradients, flow regime transitions, and phase distribution to enable the enhancement of the performance of fluid function. Also important is reducing operational and maintenance costs whilst improving production and separation efficiency [
1,
2,
3,
4,
5]. An example of this is when the occurrence of unstable flow patterns, such as slug flow, can trigger vibrations and large fluctuations in pressure [
6]. This can lead to mechanical failure or interruption of operations. By gaining deeper insights into multiphase flow phenomena, engineers can develop more efficient, stable, and cost-effective systems suited to various operating environments.
In the same context, chemical agents such as polymers and surfactants have been recognised for their ability to enhance the productivity of multiphase flow. These agents are also vital in more general practices in the oil and gas industry, for example, drilling fluid optimisation and Enhanced Oil Recovery (EOR) [
7,
8,
9,
10,
11,
12,
13,
14].
In 1948, drag-reducing agents (DRAs) first caught the attention of Toms for their ability to significantly reduce the pressure gradient of turbulent flow in pipes by adding only small concentrations to the liquid phase [
15]. Since then, polymers and surfactants have been widely and successfully used in multiple industries as drag reduction agents to stabilise fluid flow and enhance transportation efficiency. These agents are effective in their ability to prevent turbulent eddies, change unstable flow to more stable flow, reduce gas–liquid interfacial tension, reduce gas–liquid interface roughness and wall wettability, and eventually improve fluid drainage efficiency [
16,
17,
18,
19,
20,
21,
22,
23,
24,
25]. Greskovich and Shrier (1971) reported that the used polymer achieved up to 50% drag reduction (DR%) in slug gas–liquid flow when only 50 ppm DRA was added to the liquid phase [
22]. Al-Sarkhi and Soleimani (2004) noticed that the addition of polymer to water–air flow was able to shift the flow pattern from annular to a stratified flow by damping the waves in the liquid phase and significantly reducing the interfacial shear stress. The accomplished DR% was around 48% [
25]. Moreover, a DR% of 47% was noticed with a concentration of only 40 ppm. This outcome was also accompanied by flow pattern alteration from slug flow to stratified flow [
23]. However, alongside these outstanding achievements, polymers have two serious issues, polymer precipitation and degradation [
16,
26,
27].
Taking the above issues into consideration, surfactants offer a better option as they are non-degradable due to their self-repair capability. In addition, they are proven to reduce flow turbulence [
28,
29], interface roughness and wall wettability [
30,
31]. In addition to these mechanisms, surfactants can manipulate the gas–liquid interactions which consequently decreases interfacial stress and liquid density leading to improved flow patterns and reduced liquid accumulation [
16,
32,
33]. Yin et al. (2020) reported that adding sodium dodecyl benzoyl sulphate (SDBS) and sodium dodecyl sulphate (SDS) surfactants significantly altered the flow pattern and increased liquid drainage efficiency [
16]. Later, Yin et al. (2022) concluded that SDBS can shift flow patterns from intermittent to more stable stratified flows, which eventually reduces the pressure gradient and increases liquid draining efficiency in flowlines [
16]. The impact of anionic SDS surfactant on gas–liquid slug flow pattern was examined by Zhang et al. (2021) [
33]. They report that increasing the concentration of the SDS has a strong efficiency in reducing the slug frequency and increasing the slug length. This in turn improves liquid drainage efficiency and decreases the pressure gradient [
33]. In addition, Van Nimwegen et al. (2016) concluded that surfactants can create foam in multiphase flow, which consequently influences gas–liquid flow behaviour and eventually efficiently reduces liquid accumulation in pipes [
34].
Despite the popularity of drag reduction agents, such as surfactants, in the context of multiphase flows, the vast majority of the available literature has focused on vertical or inclined pipes when the effect of gravity is dominant, and the distribution of phases, liquid accumulation, and pressure losses is controlled by gravitational processes [
9,
10,
11,
32,
33]. Whilst a number of studies have investigated drag-reducing agents in horizontal pipelines, the available literature on specifically anionic surfactant effects in horizontal air–water two-phase flow remains limited. The majority of horizontal DRA studies have employed polymer additives [
10,
25], oil–water fluid systems [
35], or single-phase configurations [
36], with few reporting systematic quantitative data on flow pattern transitions, liquid holdup, and pressure gradient across a range of superficial velocities with surfactant addition. The current investigation fills this gap and provides a systematic examination of the effects of anionic sodium lauryl sulphate (SLS) on the flow stability, liquid accumulation, and drag minimization in horizontal water–air pipelines on the basis of the comprehensive experimental measurements and mechanistic interpretation. Whilst prior studies on surfactant-assisted drag reduction in horizontal gas–liquid pipelines have predominantly employed sodium dodecyl sulphate (SDS) and sodium dodecylbenzene sulfonate (SDBS)—both of which are anionic surfactants in the alkyl sulphate and alkylbenzene sulfonate families, respectively—no systematic experimental investigation of SLS as a drag-reducing agent in horizontal two-phase pipeline flow has hitherto been reported in the open literature [
16,
26,
33,
37]. SLS, as a short-chain alkyl sulphate surfactant, shares the same anionic sulphate head-group chemistry as SDS but offers distinct advantages in terms of biodegradability, lower ecotoxicity, and cost-effectiveness, whilst exhibiting comparable surface-active behaviour at the gas–liquid interface [
38]. The present work therefore constitutes, to the authors’ knowledge, the first systematic experimental investigation of SLS in this configuration, extending the existing body of knowledge on anionic surfactant drag reduction from SDS- and SDBS-dominated literature to a previously unexplored member of the same chemical family.
This work, thus, experimentally examines the performance of anionic sodium lauryl sulphate (SLS) surfactant as a DRA in water–air flow in horizontal pipes. SLS is chosen due to its structural affinity with the alkyl sulphate family of anionic surfactants—the same chemical class as the widely studied sodium dodecyl sulphate (SDS)—which has been shown to reduce interfacial tension, stabilise flow patterns, and suppress turbulent fluctuations in horizontal pipelines [
16,
26,
33,
39]. No prior study has, to the authors’ knowledge, systematically examined SLS as a drag-reducing agent in horizontal gas–liquid two-phase pipeline flow, beyond the associated preliminary investigation [
6]. In particular, the alterations in flow pattern maps, DR%, and HLR% are investigated by increasing the concentration of SLS (0, 100, and 200 ppm) over a range of superficial gas and liquid velocities (Vsg and Vsl).
2. Experimental Work
To experimentally examine the influence of anionic sodium lauryl sulphate (SLS) surfactant on air–liquid flow, a horizontal flow loop was designed. Pressure drop, flow patterns, and liquid holdup were recorded under varying concentrations of the SLS surfactant. The experimental setup is designed to visually observe the flow pattern and its transitions and measure pressure drop and liquid holdup across a range of gas and liquid flow rates. The setup aims to systematically evaluate the influence of SLS on enhancing flow stability and liquid draining efficiency in horizontal pipeline systems.
2.1. Materials
Sodium lauryl sulphate (SLS), an anionic surfactant, was utilised as drag-reducing additive in the present study (see
Table 1). This surfactant is provided by the Iraqi General Company of Vegetable Oil (Baghdad, Iraq). The diluted solutions of SLS were prepared with 100 and 200 ppm concentrations (
Table 2). The physical properties of the solutions reported in
Table 2 were determined as follows: density was measured using a calibrated glass pycnometer; kinematic viscosity was determined using a U-tube Ubbelohde viscometer (SI Analytics, Mainz, Germany) at 27 °C; pH and electrical conductivity were measured using a Thermo Orion 3 Star portable pH meter and a Thermo Orion Star Series conductivity meter (both Thermo Fisher Scientific, Beverly, MA, USA), respectively; and total dissolved solids (TDS) were determined using the Thermo Orion Star Series conductivity meter with built-in TDS conversion.
2.2. Surface Tension Measurement
A high-resolution IDS uEye UI-3140CP-C-HQ camera (IDS Imaging Development Systems GmbH, Obersulm, Germany) was used to take the pendant drop images. ImageJ software (version 1.54, NIH, USA) was used to analyse the images with the axisymmetric drop shape analysis (ADSA) procedure that calculates surface tension using droplet geometry as the Young–Laplace equation.
Before every run of the experiment, the measurement system was calibrated with DI water (σ = 72.28 mN/m at 27 °C). Measurements were done in triplicate at each SLS concentration and the data is given in the form of the mean plus the standard deviation (usually with a standard deviation of 0.5 mN/m).
2.3. Flow Loop Description
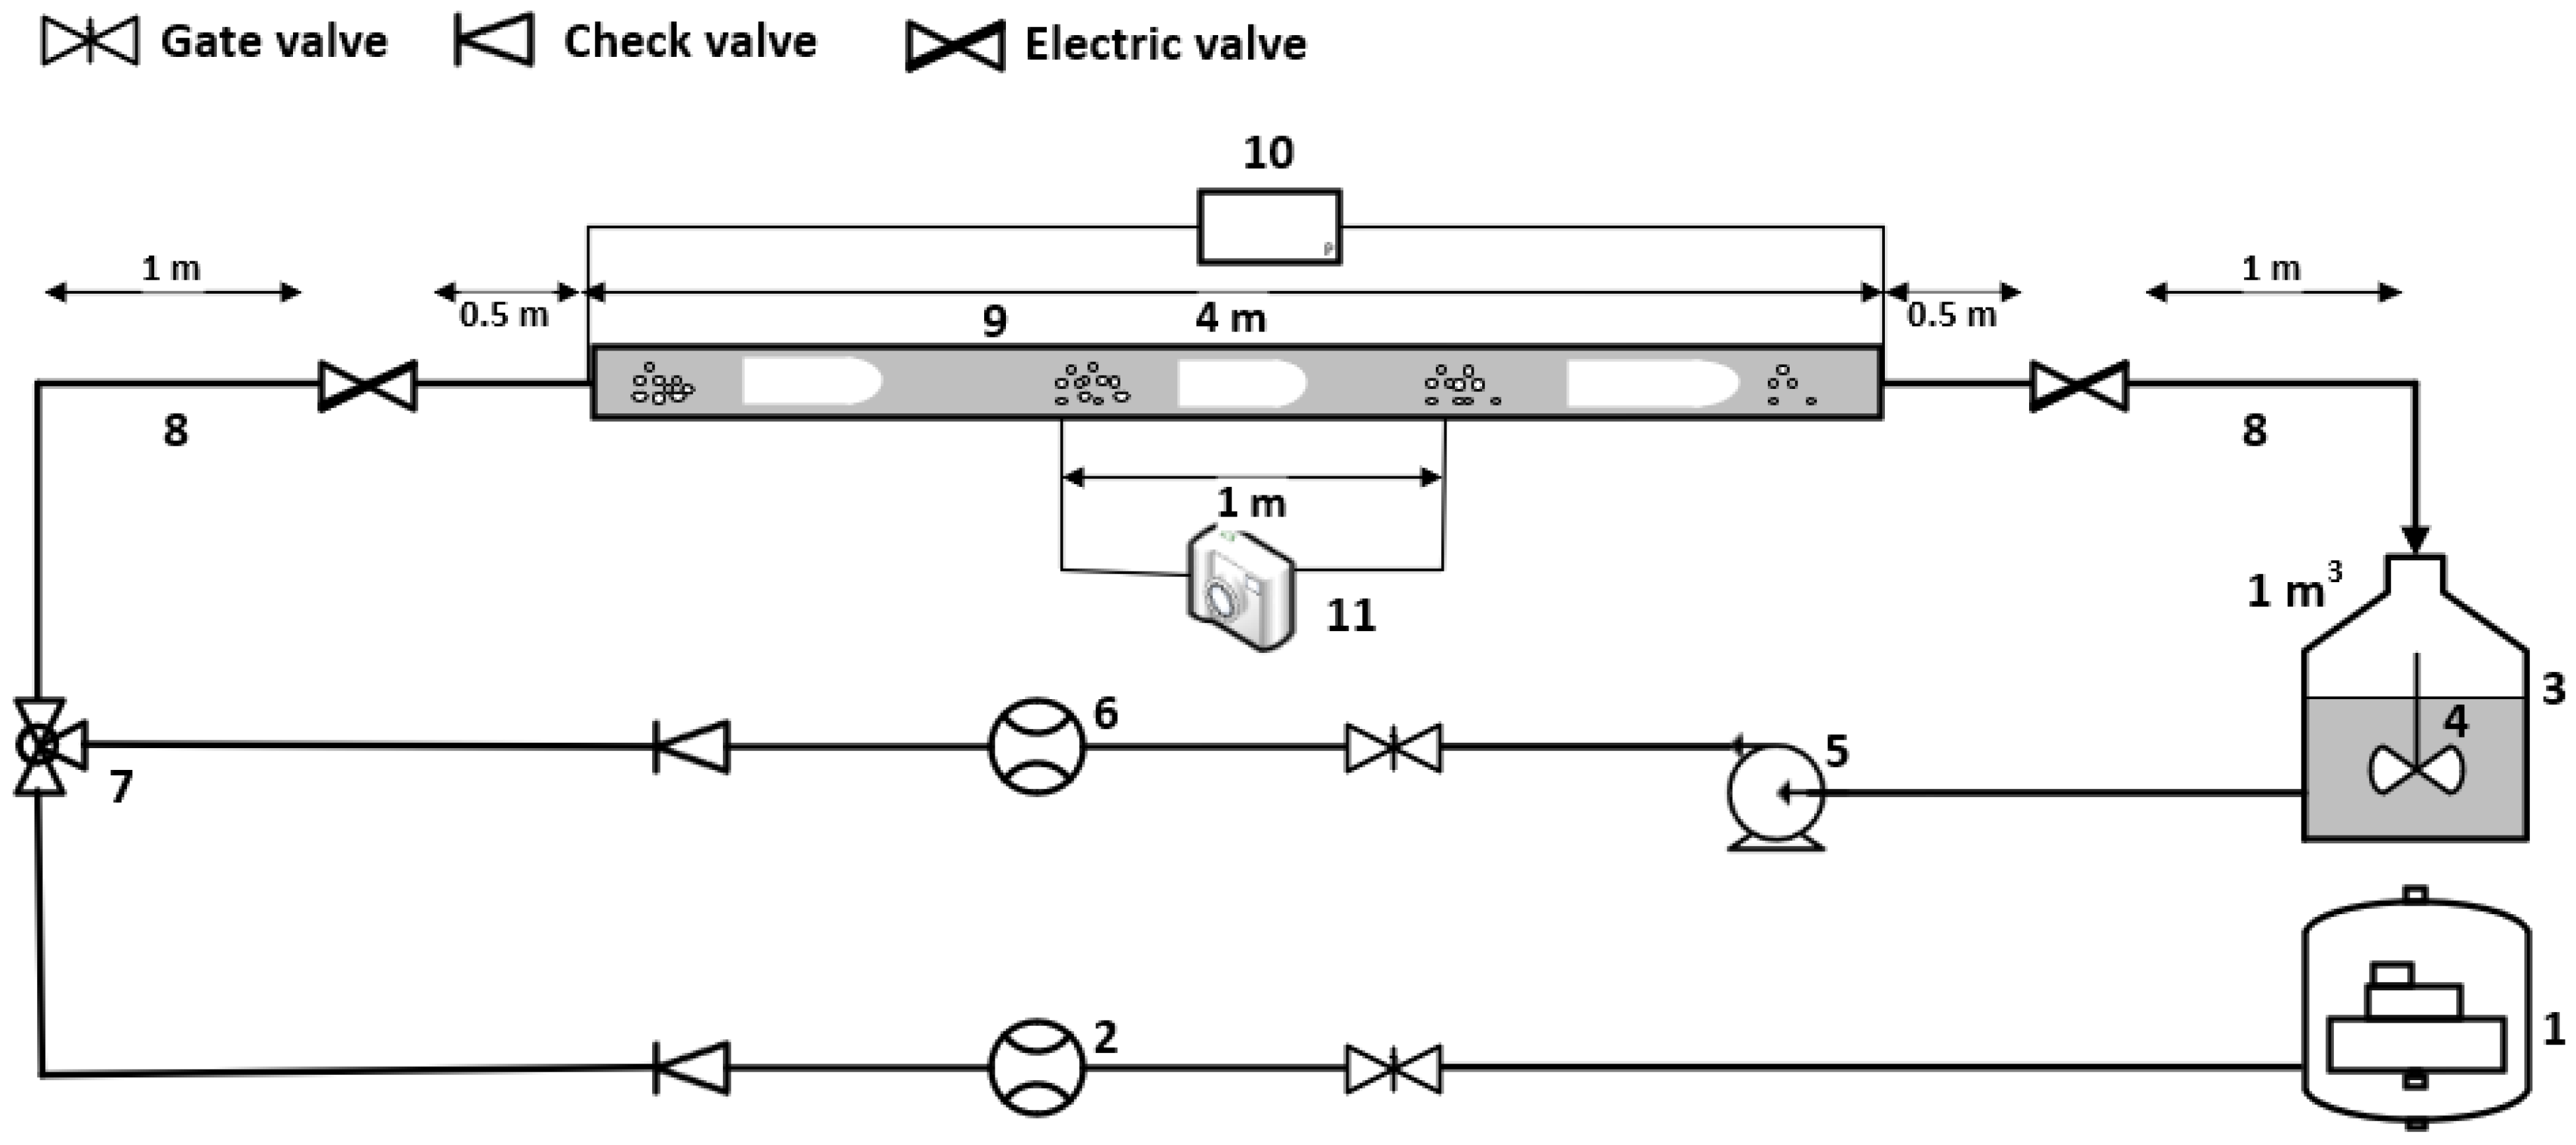
A circulating flow loop system was designed to examine the SLS performance with air–water flow pattern alteration, reducing pressure losses, and increasing liquid draining (
Figure 1). The flow loop is composed of a Plexiglas testing line of 5 m length and 5.1 cm inner diameter, a 1 m
3 liquid storage tank, a Sthreen YS200AM centrifugal pump (Sthreen, Istanbul, Turkey), a Dalgakiran TIDY 20 screw air compressor (Dalgakiran, Istanbul, Turkey), two flow meters—a Heinrichs Messgeräte rotameter (Heinrichs Messgeräte, Cologne, Germany, serial no. 613139, range 0–25 m
3/h) for liquid flow measurement and a glass-tube rotameter for gas flow measurement—a Y injection part to mix the gas and liquid phases, Faber PA 63 double-acting pneumatic butterfly valves (Faber, Italy), and two Setra Model 264 differential pressure transducers (Setra Systems, Boxborough, MA, USA, range 0–3000 Pa, precision ±0.25% full scale).
All the testing instruments were also calibrated before use to enhance the reliability of the measurements. Calibration of the water flow meter, air flow meter and the differential pressure measurement transducer was done using standard reference apparatus and a stationary column of water giving error limits of approximately +/−2 percent on flow rates and +/−0.25 percent on pressure values. Prior to the two-phase experiments, single-phase water flow was conducted through the system across the full range of liquid superficial velocities (0.14–3.40 m/s) and the measured pressure gradients were compared against the Blasius correlation for turbulent flow in smooth pipes. The agreement was within 1.35–2.58%, confirming the reliability of the pressure measurement system. To confirm the repeatability, triplication was done in every test condition. Experiments were conducted in triplicate at each flow condition. The error bars shown in the respective figures represent the absolute uncertainty in the measured pressure gradient (Pa/m) and liquid holdup (dimensionless), determined from the spread of the three repeated measurements at each condition.
2.4. Test Procedure
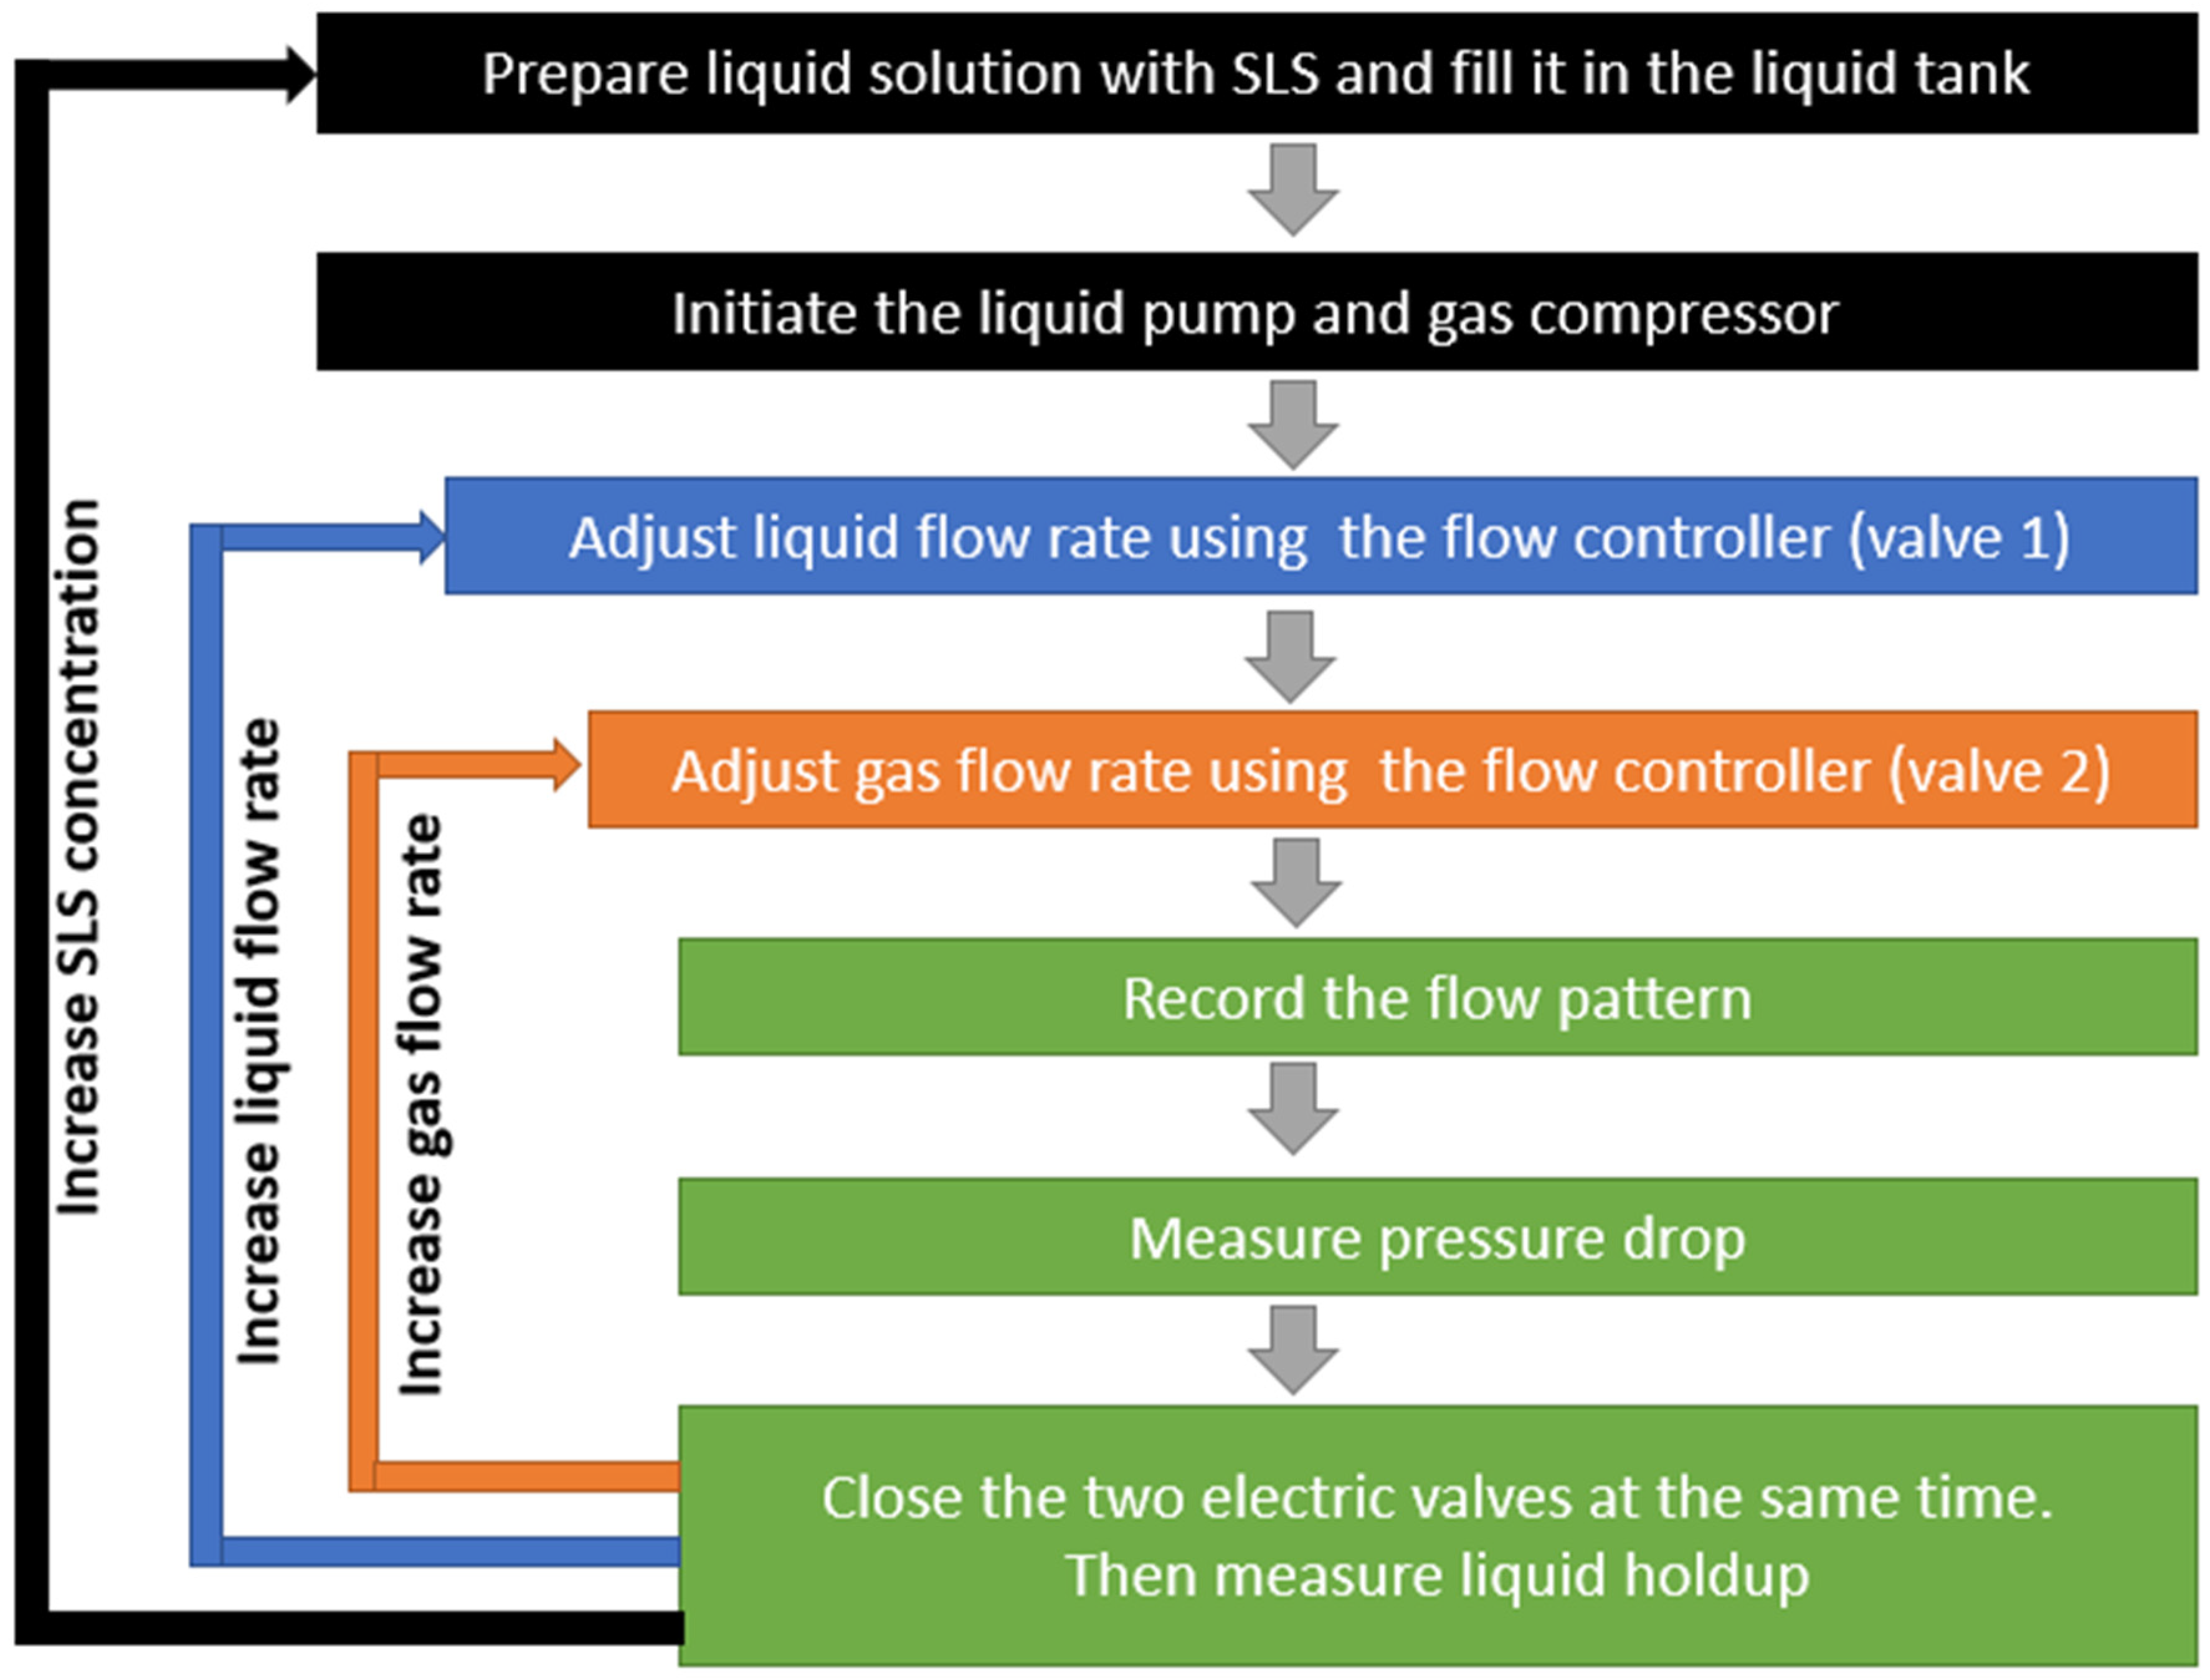
The pressure drop, liquid holdup and flow pattern are determined at different SLS concentrations using the following procedure:
Set the liquid flow rate (Ql) at a certain value by regulating the valve that is located before the liquid flow meter.
Repeat step 1 to adjust the gas-phase flow rate (Qg).
After visually detecting the flow pattern, record the next parameters:
Alter the Ql and repeat the steps from 1 to 3
Alter the SLS concentration and repeat the steps from 1 to 4.
The above procedure is summarised in
Chart 1.
Flow visualisation and pressure measurement: Flow patterns were recorded using a GoPro Hero4 Black camera (GoPro, Inc., San Mateo, CA, USA) (90 fps) positioned at right angles to the transparent test section. Each flow condition was considered steady when the differential pressure signal varied by less than ±2% over a 30–60 s observation window; flow pattern identification was then performed from the recorded footage based on interfacial morphology, gas–liquid distribution, and phase continuity, following the classification criteria of Mandhane et al. (1974) and Al-Dogail and Gajbhiye (2021) [
40,
41]. Pressure drop across the test section was measured using Setra Model 264 differential pressure transducers (range 0–3000 Pa, ±0.25% full scale), calibrated before each experimental run.
Determination of liquid holdup: At the end of every flow condition, the inlet and outlet Faber PA 63 double-acting pneumatic butterfly valves were actuated simultaneously to isolate the horizontal test section. The centrifugal pump and gas compressor were then de-energised after 5 s, to allow the system pressure to dissipate slowly, and thus preventing the pressure surge that occurs when the pump suddenly stops against closed valves. The height of the liquid level, h
L, was determined geometrically using a transparent Plexiglas wall, only after the liquid surface had visually stabilised at a horizontal level. The liquid-filled cross-sectional area was then determined by using h
L in Equation (1) and the ratio of the liquid holdup was obtained as HL = AL/AT. Potential sources of measurement uncertainty were valve response time, liquid surface fluctuation, and transient phase redistribution, which were mitigated with the described isolation and de-energisation sequence.
The overall cross-sectional area of the pipe was considered to be .
- 6.
Then, calculate the percentage of drag reduction (DR %) and the percentage of liquid holdup reduction (HLR %), by using the following equations.
where ∆p represents the pressure difference between the pipeline’s inlet and outlet. HL is the liquid holdup which represents the remaining of the liquid volume in the pipe between the two electric valves. These equations were used to quantify the efficiency of SLS in improving drag reduction and liquid drainage across the different experimental conditions. The uncertainties of DR% and HLR% were determined by propagating standard errors of Equations (2) and (3) respectively, with the absolute measurement uncertainties of the pressure gradient and liquid holdup at each condition. The uncertainty of DR% propagated between ±0.6 and ±6.0% in most of the tested conditions, with higher values of up to ±14.0% at the lowest liquid superficial velocity (Vsl = 0.136 m/s) where the small absolute baseline pressure gradient magnifies the relative measurement uncertainty. The propagated uncertainty of HLR% was between ±1.1 and ±10.9% in most of the tested conditions with higher values of up to ±20.5% in specific high gas–liquid velocity combinations where the liquid holdup was near low absolute values (HL < 0.12) which increased the relative measurement uncertainty. These high uncertainties in extreme flow conditions are in line with the established constraints of measuring pressure gradient and geometric holdup under extreme flow conditions and have no impact on the main conclusions made on the data.
Table 3 presents the full test matrix, which includes combinations of liquid flow rates (Ql), gas flow rates (Qg), and SLS concentrations. This range was selected to capture a variety of flow patterns and evaluate the effect of the concentration of SLS on flow stability, drag reduction, and liquid holdup.
3. Results and Discussion
This section presents and discusses the effect of using SLS at different concentrations (i.e., 0, 100, and 200 ppm) across a range of gas and liquid superficial velocities (i.e., 0.26–1.35 m/s, and 0.136–3.26 m/s, respectively) on air–water flow patterns transitions, drag reduction increment, and liquid holdup reduction.
3.1. Impacts of SLS Surfactant on Flow Pattern Alterations
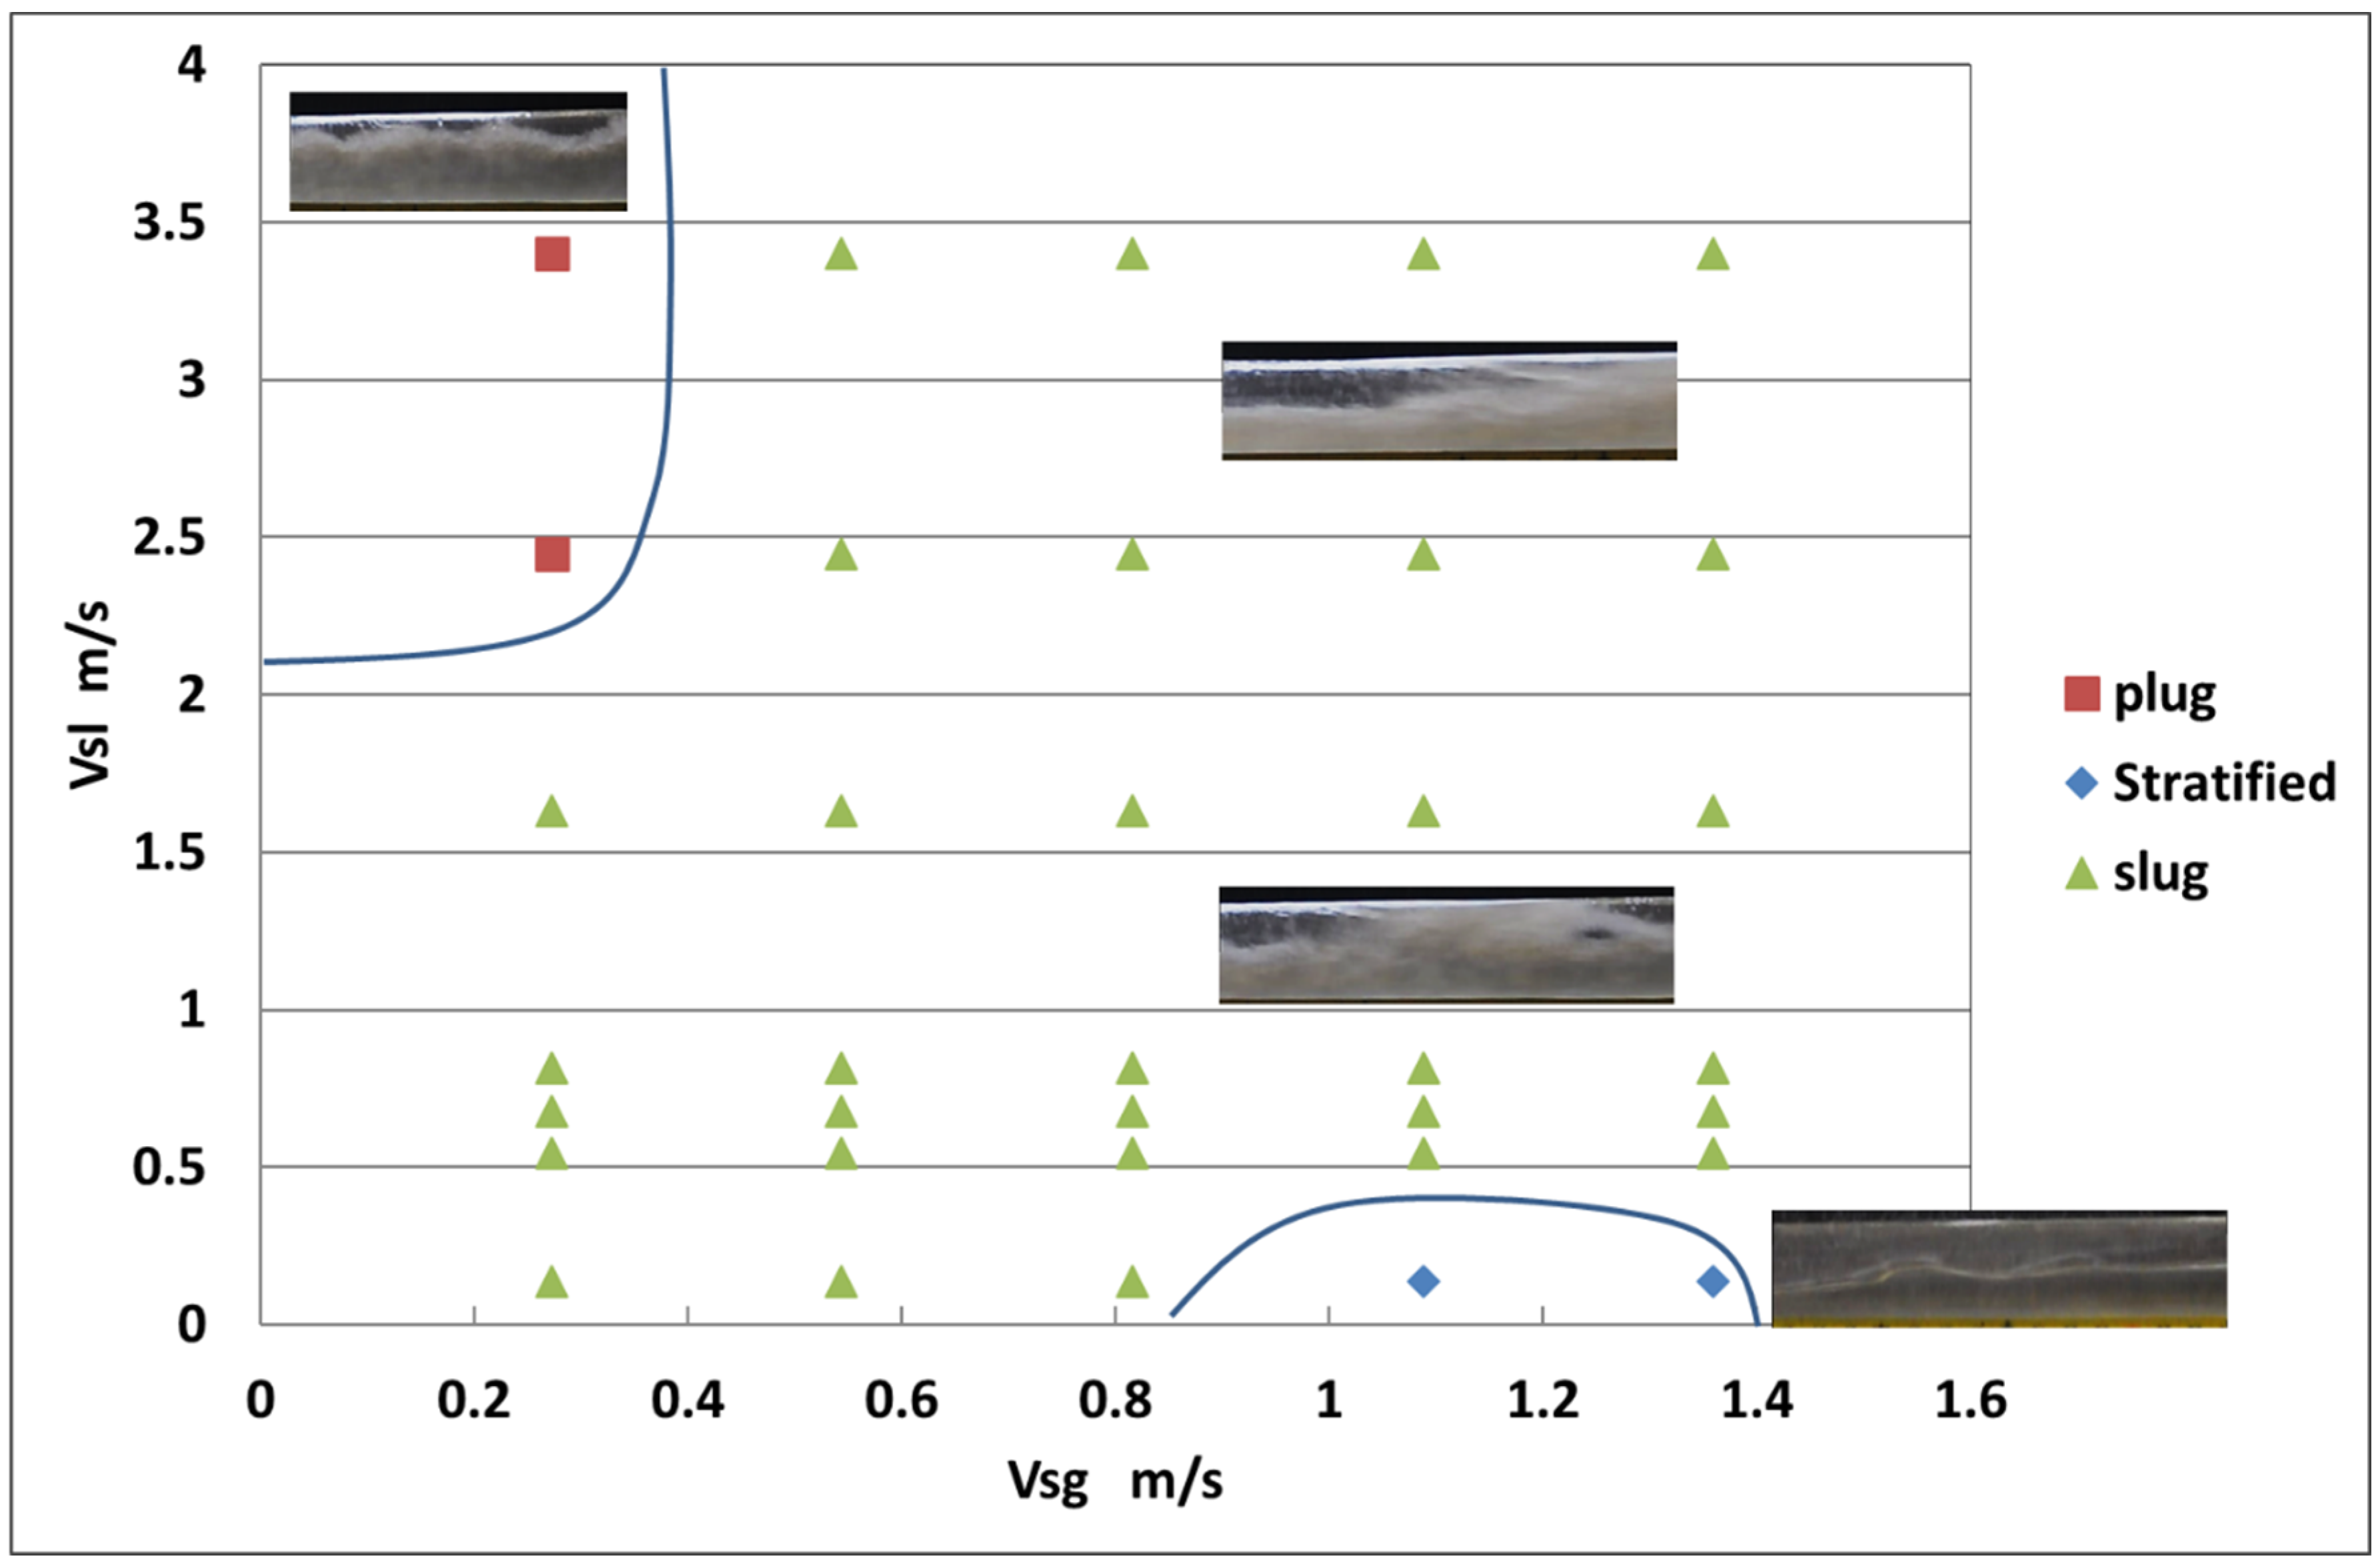
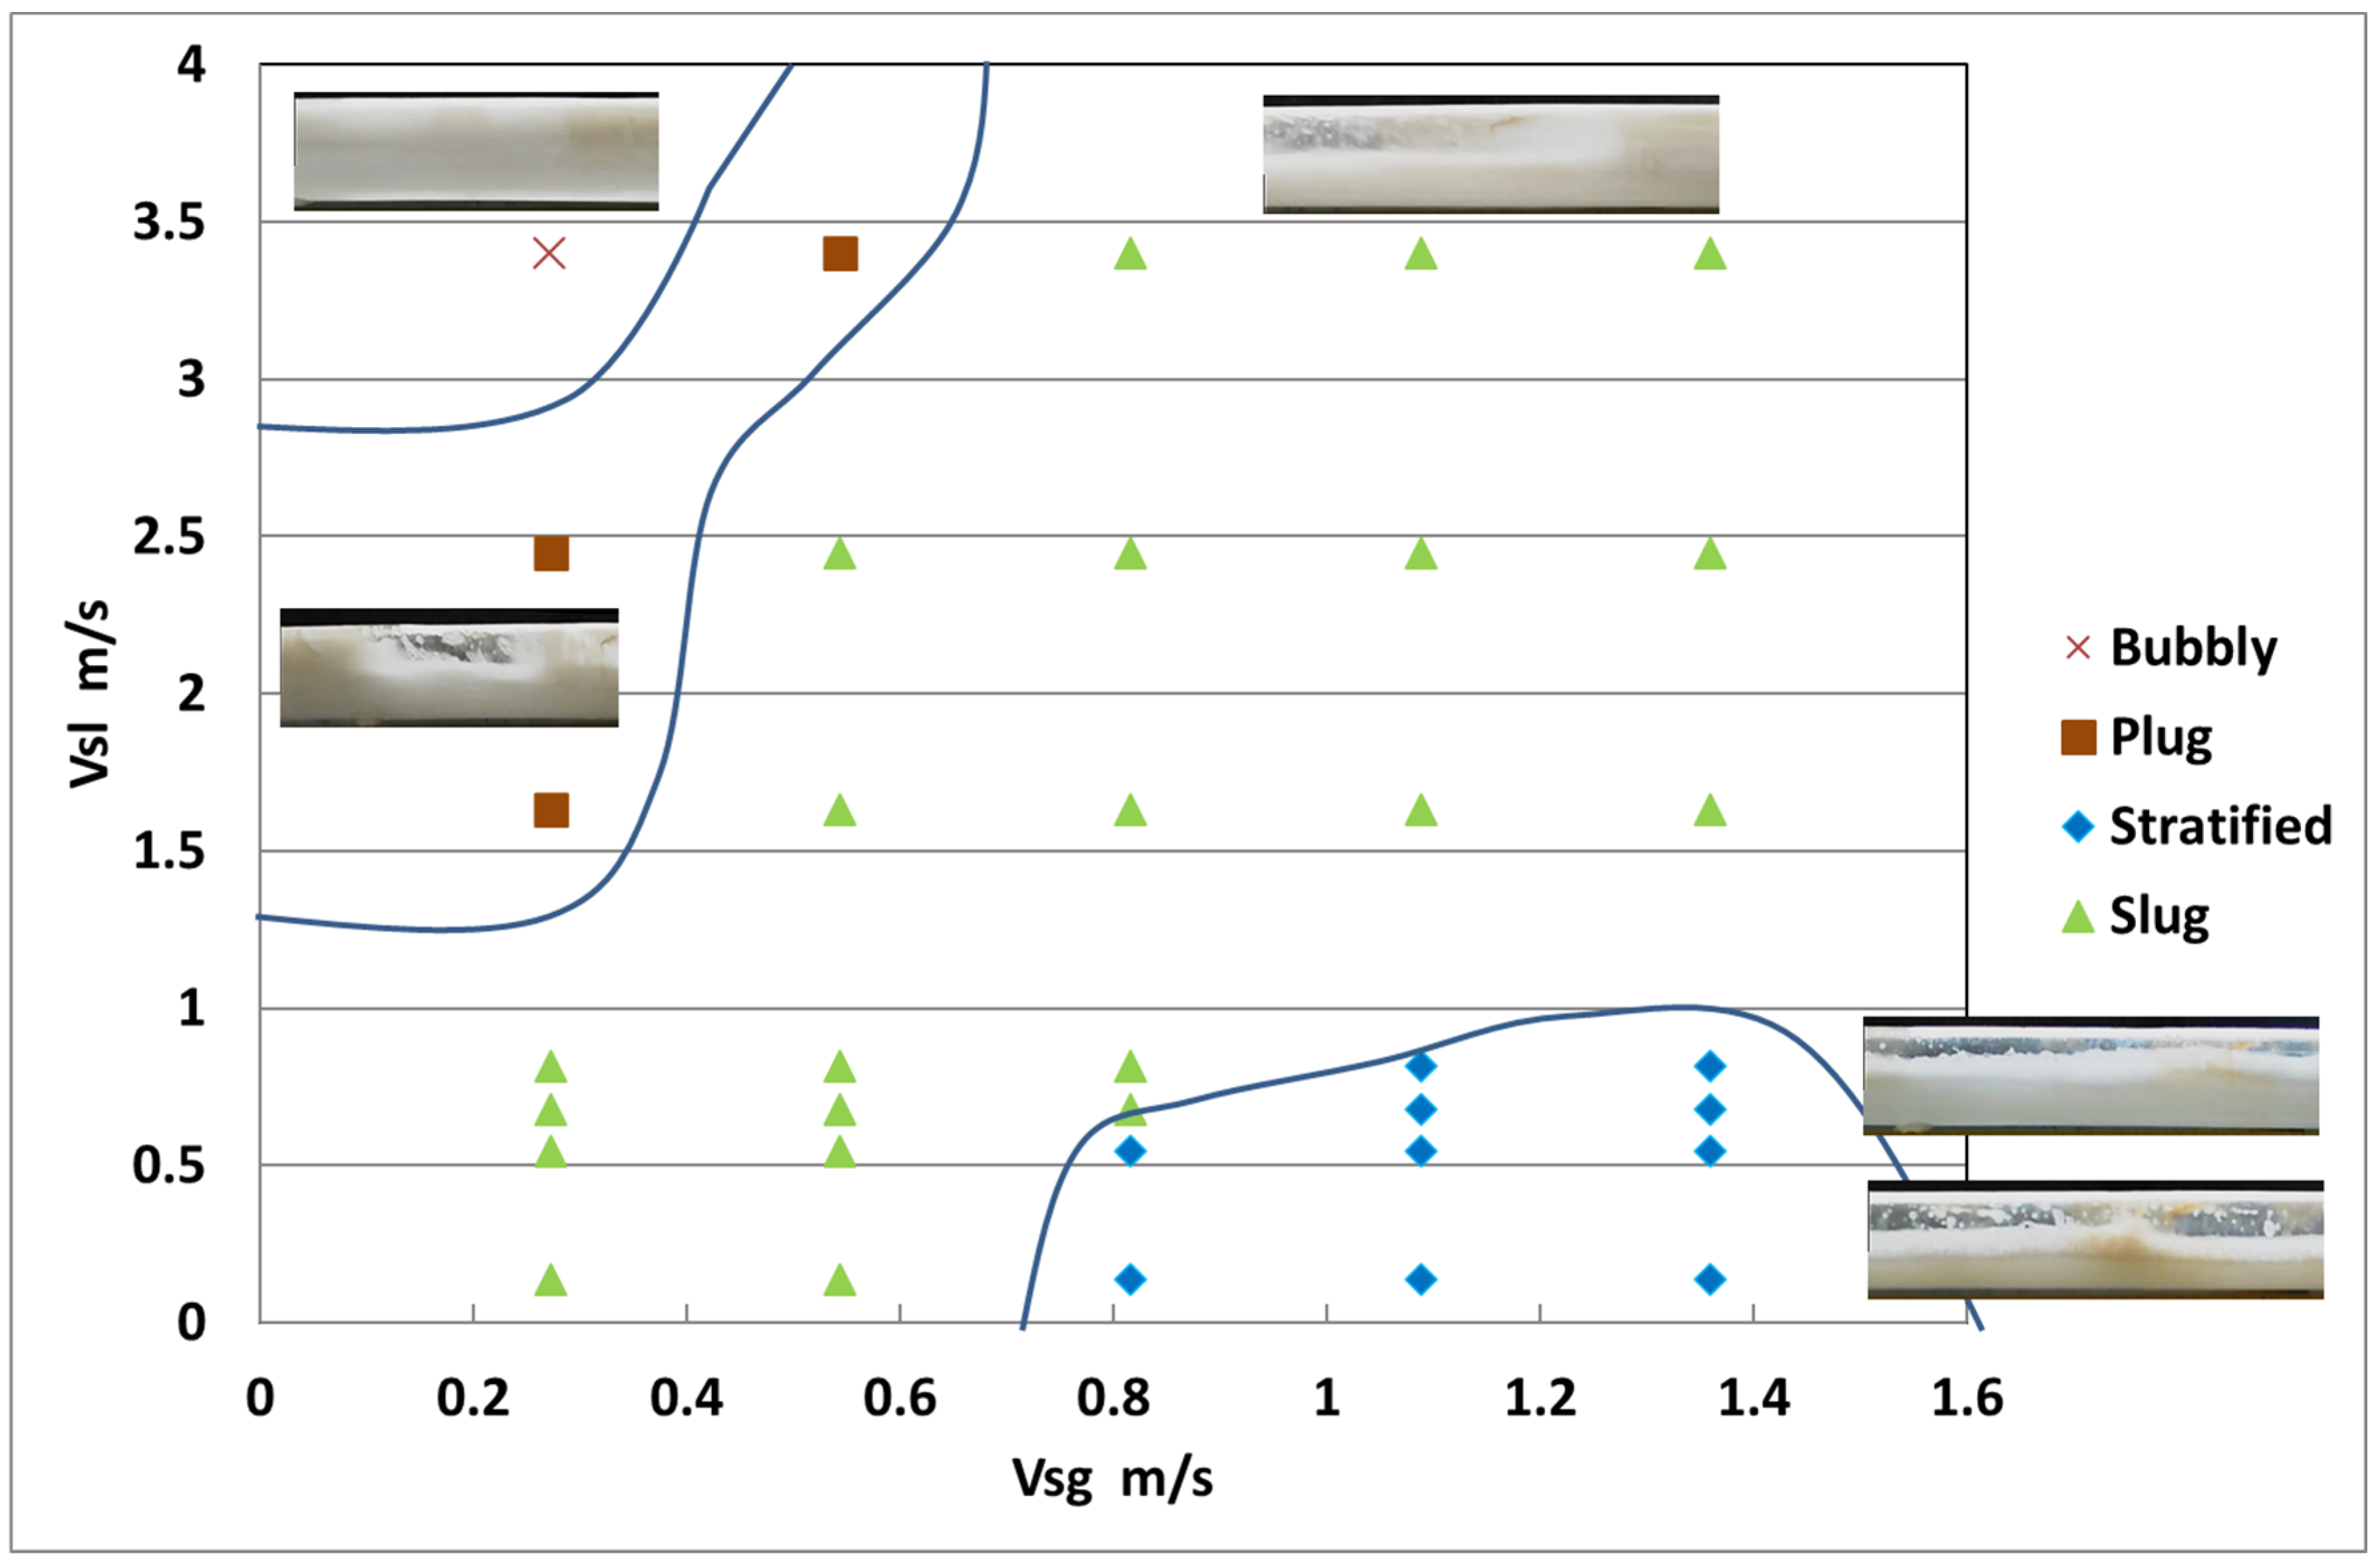
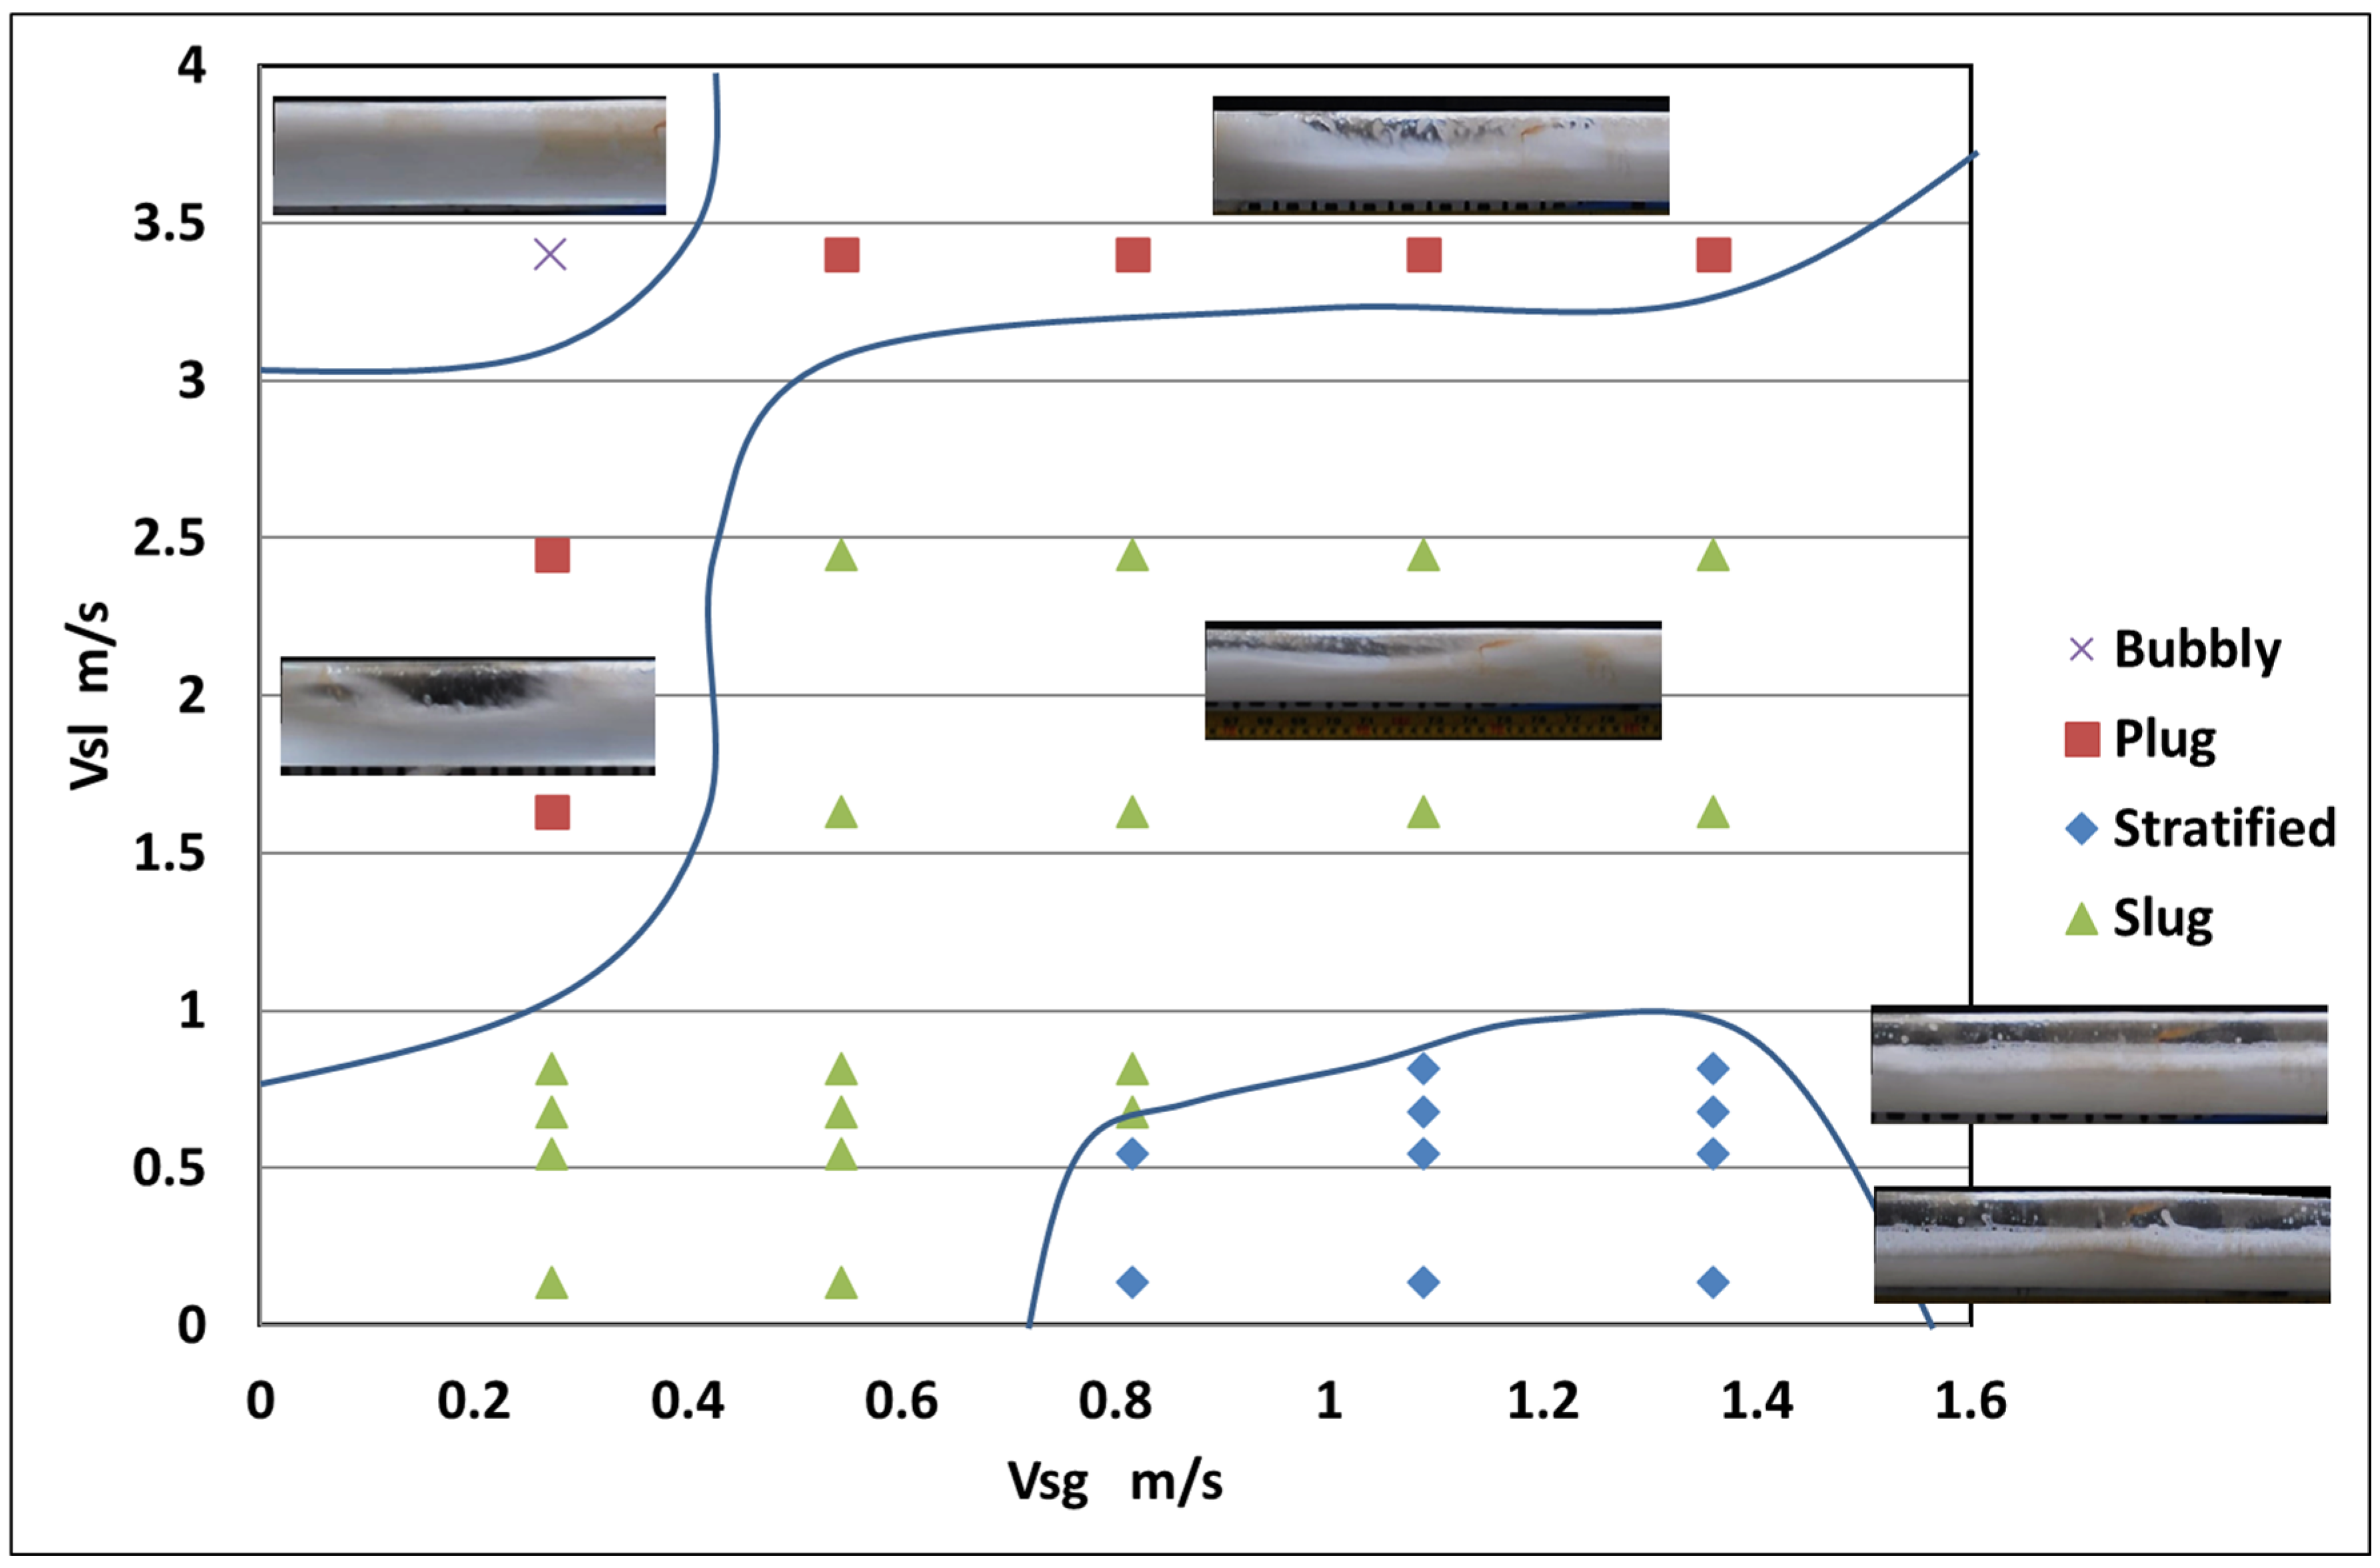
This subsection analyses the impact of three SLS concentrations (i.e., 0, 100, and 200 ppm) on the observed flow patterns in a horizontal water–air system. The flow pattern maps are presented in
Figure 2,
Figure 3 and
Figure 4 for the SLS concentrations, 0, 100, and 200 ppm, respectively. The four flow patterns observed in the present study are defined as follows, consistent with established classification criteria for horizontal gas–liquid pipe flow [
40,
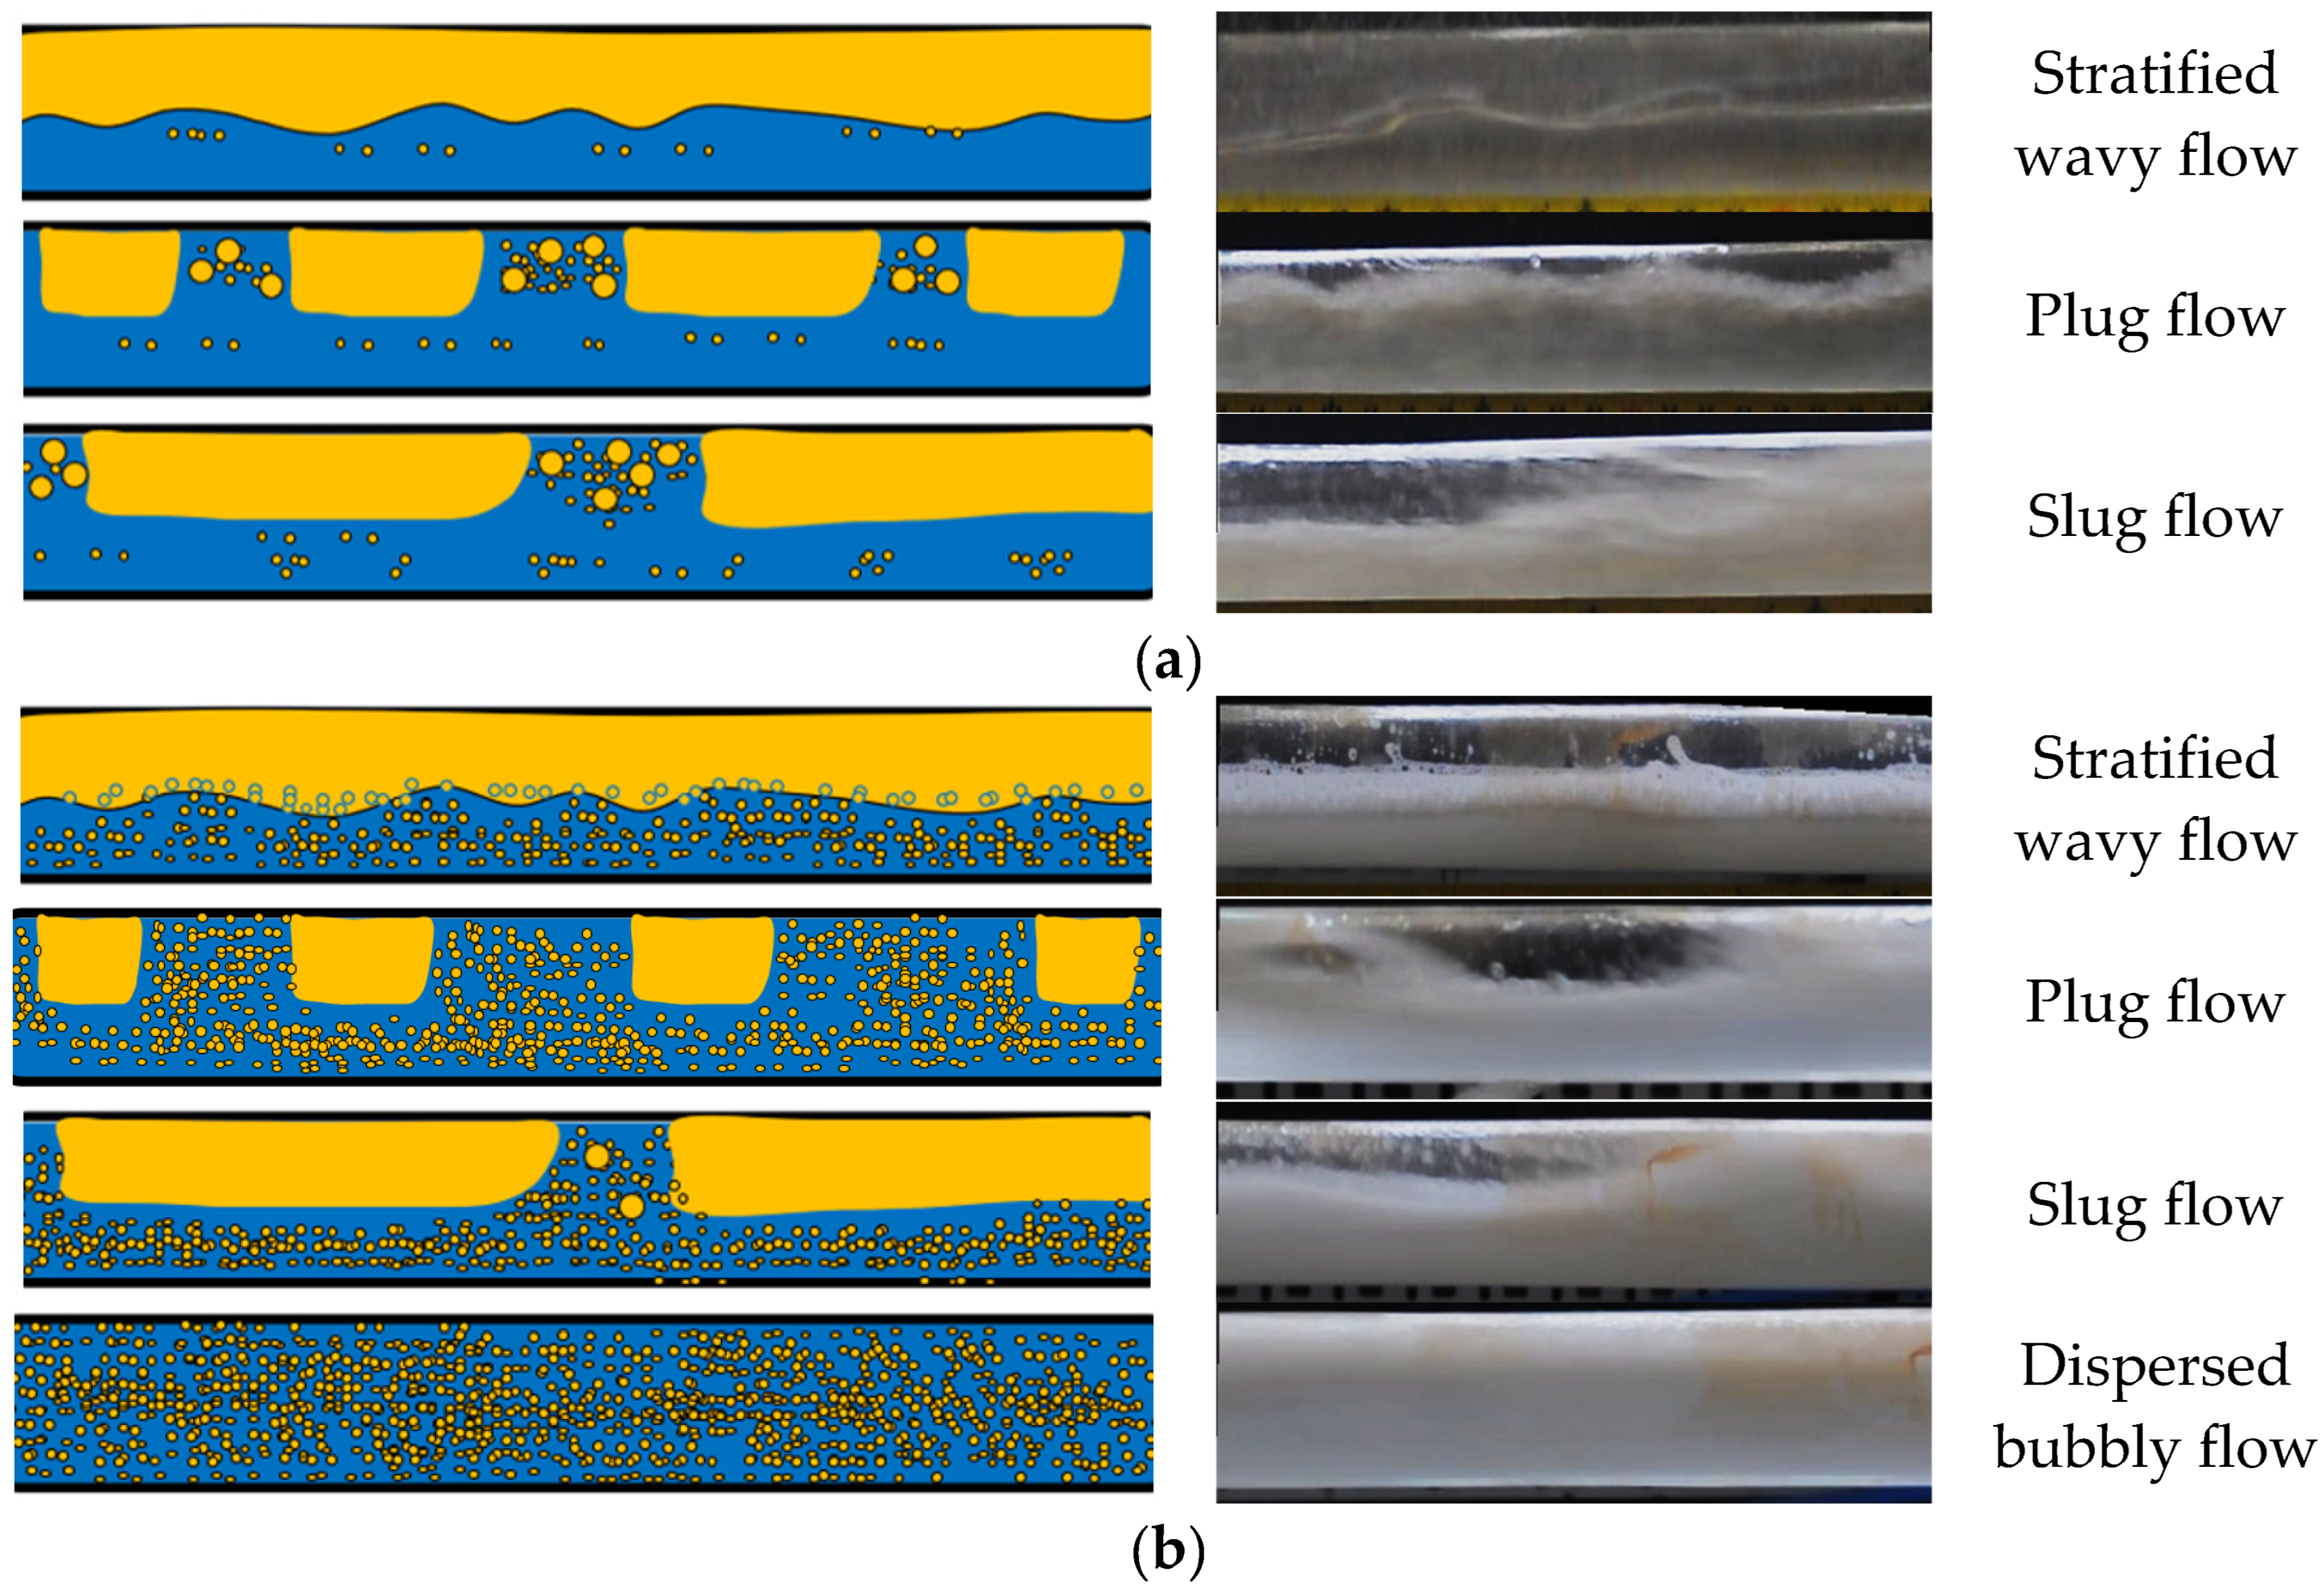
41]. Stratified wavy flow is a continuous layer of liquid at the bottom of the pipe and a gas phase at the top, separated by a deformed wavy interface; the liquid does not touch the crown of the pipe. Plug flow (also known as elongated bubble flow) is defined by elongated gas bubbles that fill the upper part of the pipe cross-section but do not completely cover the pipe diameter—the liquid phase is continuous and the gas bubble is surrounded by a liquid film. Slug flow is contrasted with plug flow by the fact that the entire cross-section of the pipe is filled by the liquid slug body, which isolates successive long gas bubbles; the slug front collects liquid at the end of the previous film and expels it at the slug tail, producing the typical pressure oscillations. Dispersed bubbly flow is typified by small discrete gas bubbles dispersed in a continuous liquid phase, at high liquid velocities where turbulence inhibits gas-phase coalescence.
At 0 ppm of SLS and for the applied range of Vsg and Vsl,
Figure 2 shows that the stratified wavy pattern appears in a small area within low liquid superficial velocity (i.e., Vsl < 0.5 m/s) and high gas superficial velocity (i.e., Vsg > 1 m/s). The plug flow pattern appears also in a small area within low gas superficial velocity (i.e., Vsg < 0.4 m/s) and high liquid superficial velocity (Vsl > 2 m/s). The slug flow is the dominant pattern, encompassing all other flow regimes and extending across the entire flow pattern map. The slug flow dominance in the tested Vsl and Vsg range at 0 ppm is in line with the baseline air–water flow pattern maps of Wilkens and Thomas (2007) of a horizontal pipe, where slug flow occupied most of the intermediate Vsl-Vsg operating space [
26]. The identified growth of stratified wavy and plug flow regions with the rise in SLS concentration is also in line with the surfactant-induced flow pattern transitions reported by Wilkens and Thomas (2007) and Zhang et al. (2021), who found that anionic surfactants inhibit slug formation and favour more stable flow regimes in horizontal and near-horizontal flows [
26,
33].
Figure 3 shows that as 100 ppm of SLS is added to the liquid, the flow pattern map significantly changes. The region of the slug pattern shrunk while the region of the stratified wavy and plug pattern expanded and initiated a new flow pattern (i.e., dispersed bubbly flow). The region of the stratified wavy flow pattern expanded to overtake higher Vsl and lower Vsg (i.e., Vsl < 1 m/s and Vsg > 0.7 m/s). The region of the plug flow pattern also expanded to cover lower Vsl and higher Vsg (i.e., Vsl > 1.5 and m/s Vsg < 0.7 m/s). The newly emerged pattern (i.e., bubbly flow) appears at the highest Vsl (i.e., ≈3.39 m/s) and the lowest Vsg (i.e., ≈0.26 m/s).
As the concentration of SLS increases more (i.e., 200 ppm) these trends intensify (
Figure 4). The region of the slug flow shrinks more, and the plug flow pattern covers a bigger area to reach the highest gas velocity (i.e., Vsg ≈ 1.4 m/s) at the highest Vsl (i.e., Vsl ≈ 3.39 and m/s). The stratified wavy and bubbly flow regions remain unchanged, suggesting that further concentration increases yield diminishing returns for these particular flow conditions. Overall, the shift from slug pattern to patterns with greater stability (i.e., stratified wavy and plug patterns) with increasing SLS concentration highlights the SLS’s ability to enhance flow efficiency.
Table 4 is a summary of the quantitative flow pattern transition boundaries obtained in
Figure 2,
Figure 3 and
Figure 4 at each SLS concentration. The critical Vsg at which slug-to-stratified wavy transition takes place diminishes between Vsg > 1.09 m/s at 0 ppm and Vsg > 0.816 m/s at 100 and 200 ppm, which means that SLS reduces the flow stabilisation onset. The plug flow region increases significantly as the concentration increases—from one boundary condition at 0 ppm to a wide Vsg range of 0.27–1.36 m/s at 200 ppm. The optimum operating range for maximum drag reduction is associated with the conditions in the slug-to-stratified wavy transition zone, especially at Vsg = 0.54–0.82 m/s and Vsl = 0.136 m/s of 200 ppm SLS, where the interfacial tension reduction and microbubble stabilisation effects are the most significant.
When SLS was added, it was noticed that there were significant variations in the appearance and behaviour of the liquid phase changing to a milky dispersion with increase in surfactant concentration (
Figure 5b). This is a change in visual appearance that indicates the stabilisation and entrainment of small microbubbles in the liquid phase. Under stratified flow pattern conditions, a thin film of foam was formed along the gas–liquid interface (
Figure 5b, stratified wavy flow). Even though this film can enhance the apparent interfacial roughness, it has a stabilising effect on interfacial instabilities, damping surface waves and limiting their development. Consequently, the propensity of waves to combine and develop into enormous liquid slugs is decreased. In slug flow regime, the existence of liquid with microbubbles changes the internal structure of the slug. Liquid phase seems to flow easier, the slugs become shorter, and the persistence of the slugs decreases with the length of the pipe [
6]. These weakened slugs in a number of instances do not bridge the pipe completely. These visual observations are quantitatively validated by the related published study that was performed on the same experimental setup [
6], which found that the addition of SLS concentration of 0 to 200 ppm decreased the slug frequency by up to 100 percent and slug length by up to 68 percent, and the slug velocity increased by up to 233 percent—collectively confirming that SLS fundamentally restructures slug dynamics in horizontal two-phase pipeline flow in a manner consistent with the pressure gradient and holdup reductions reported in the present manuscript.
The decrease in the equilibrium surface tension (
Table 2) and the interfacial stabilising effect of the foam film are not conflicting. The pendant drop method is a thermodynamic equilibrium surface tension measurement at quiescent conditions, but at dynamic two-phase flow, the spatial gradient of surface tension—the Gibbs–Marangoni effect—is the resistance to interfacial deformation, independent of the absolute equilibrium value. At gas velocities faster than Vsg ≈ 1 m/s, the interfacial shear increasingly dominates over the Marangoni restoring forces and breaks the foam film, which explains the observed attenuation of DR% above this point [
34,
42].
3.2. Impacts of SLS Surfactant on Drag Reduction
This section discusses how the concentration of SLS influences pressure gradient (PG) and drag reduction (DR%) at the Vsg and Vsl ranges that were tested (
Figure 6,
Figure 7 and
Figure 8). Equation (2) is used to compute DR% using the 0 ppm baseline. Two contributions to drag reduction can be identified: an indirect effect, due to transitions in the flow patterns caused by SLS, which is mainly slug-to-stratified wavy or slug-to-plug, which removes the accelerational pressure losses and interfacial pulsations of intermittent flow; and a direct effect, which is the drag reduction within the same flow pattern through interfacial tension reduction and microbubble entrainment. At conditions where there is no transition in the pattern of flow, the direct contribution is reflected in the measured DR% of 22–44%. In cases where SLS addition is accompanied by a regime transition, the DR% values of 71–83% represent the sum of the two effects, the indirect pattern transition effect making up the majority of the contribution—as found by Wilkens and Thomas (2007) [
26].
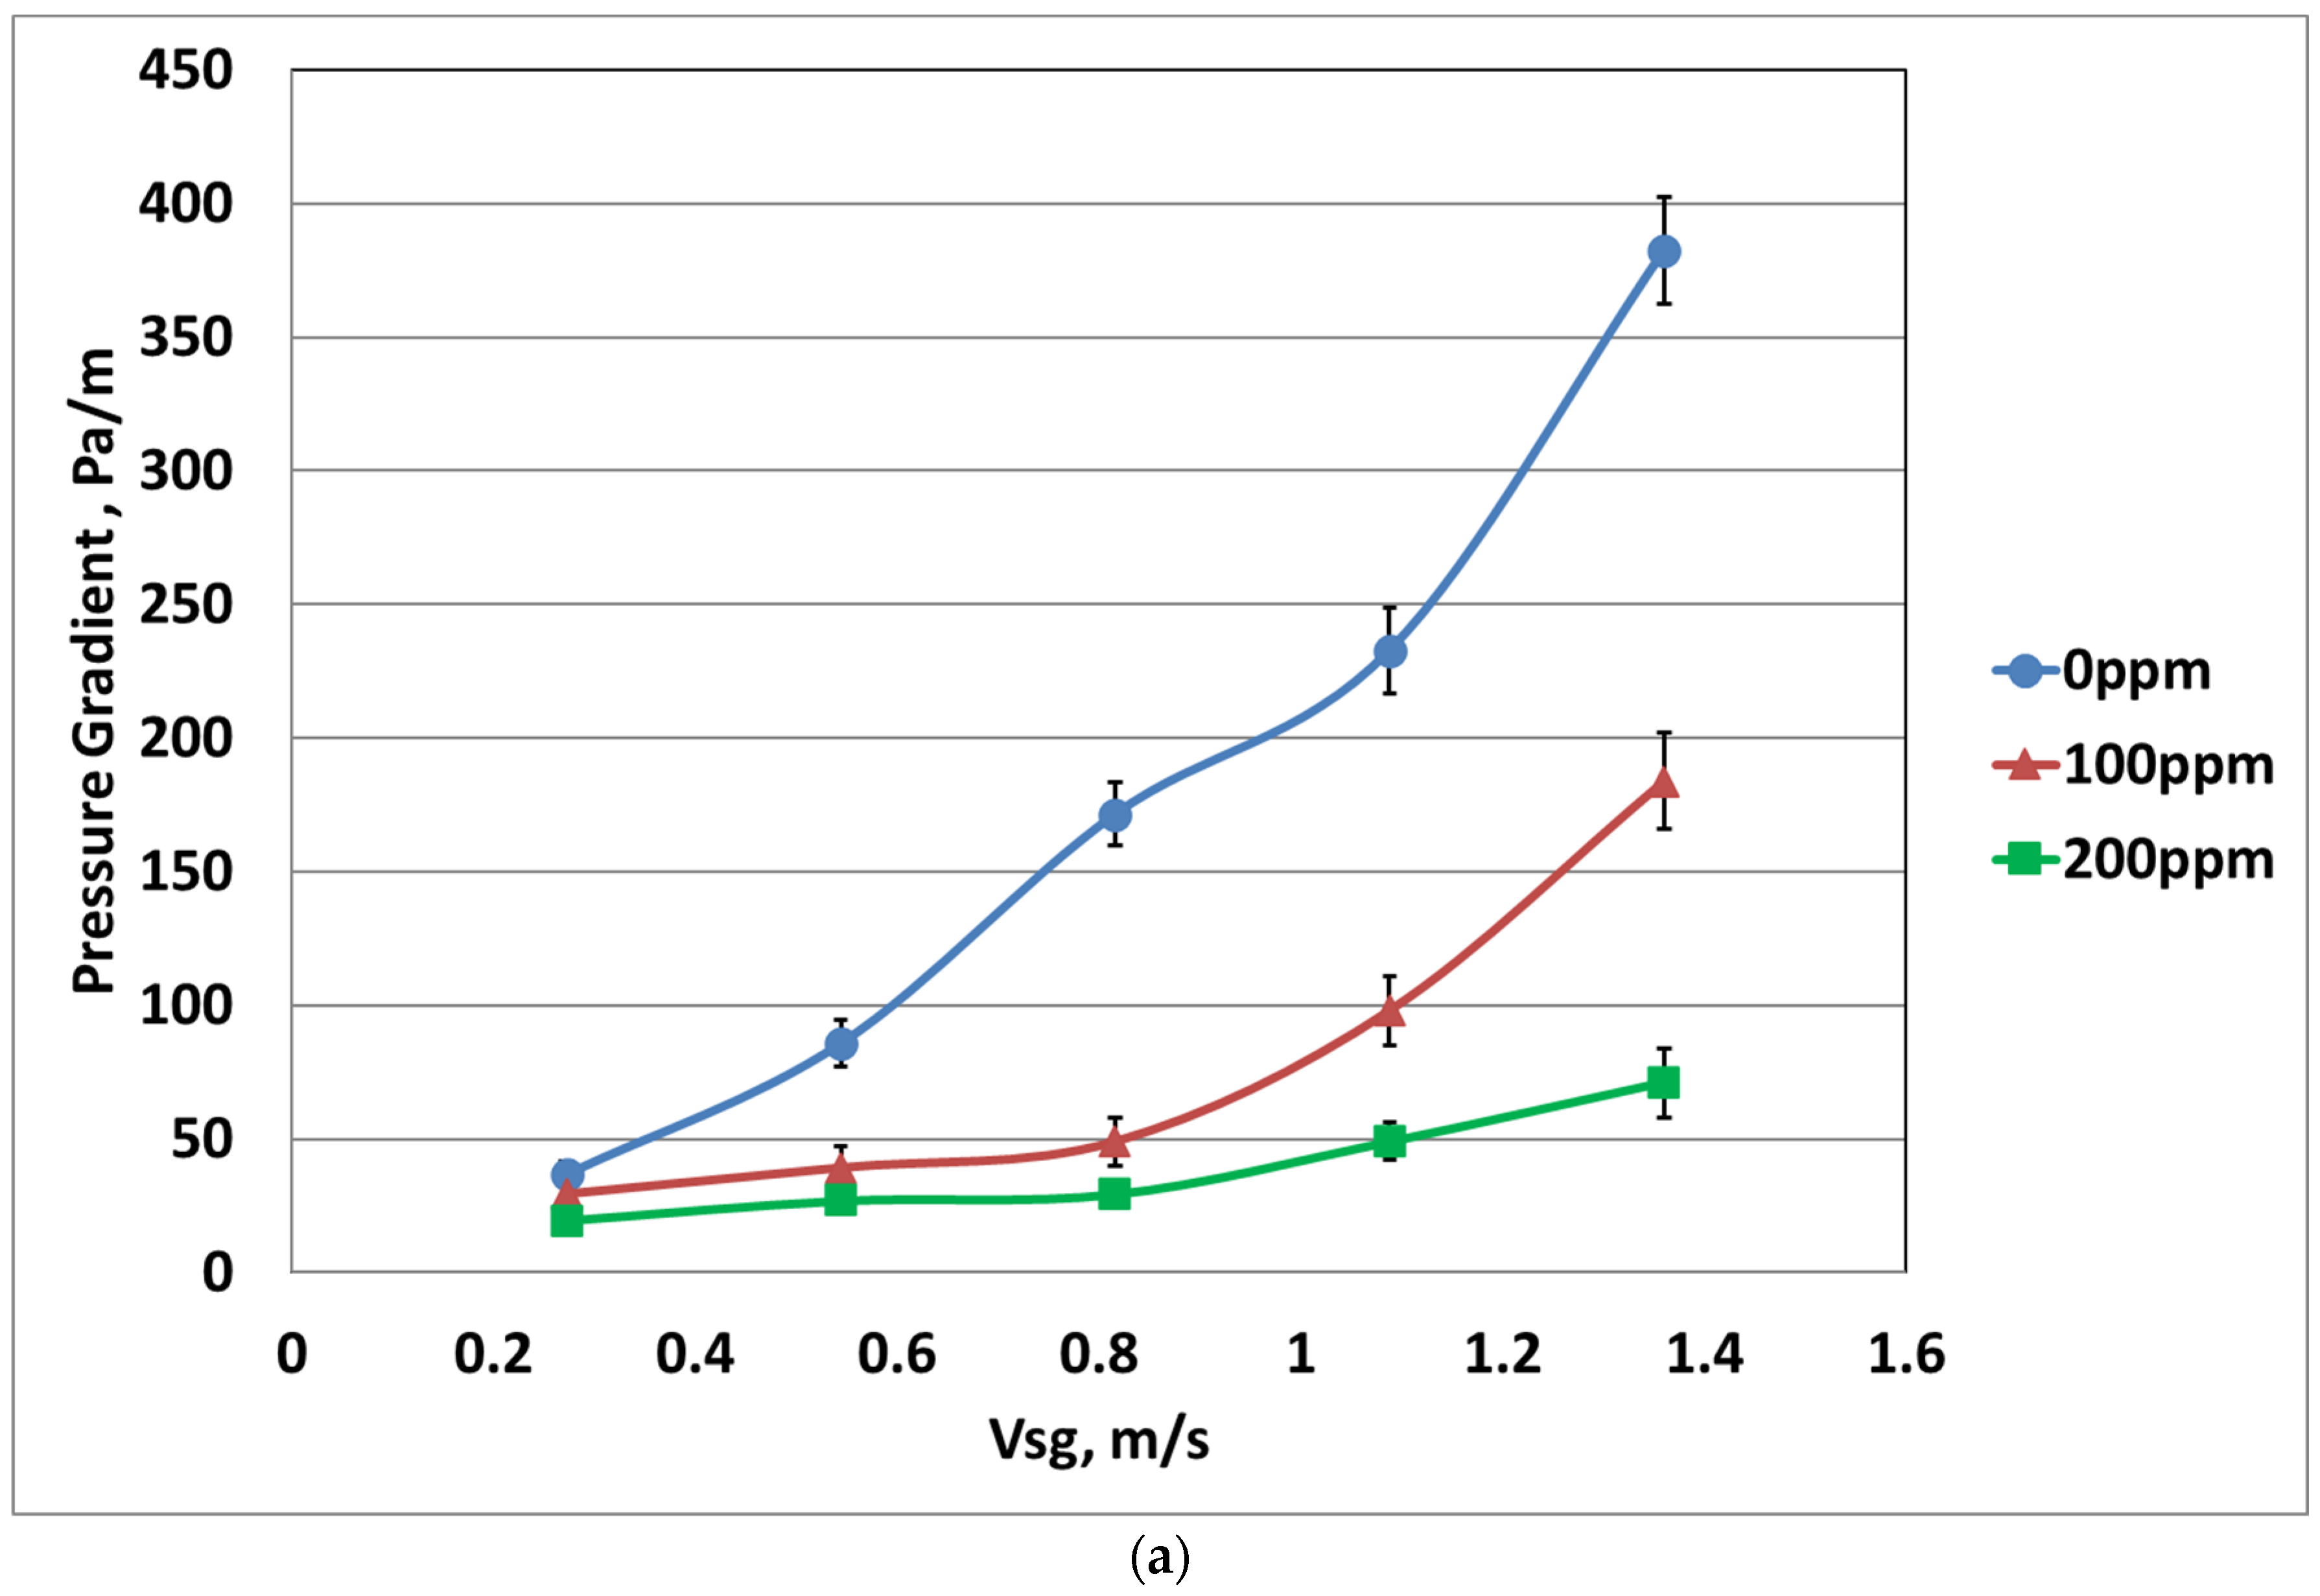
At Vsl = 0.136 m/s,
Figure 6a shows the influence of SLS concentration (100 and 200 ppm) on PG at different Vsg. As SLS concentration increases, the PG significantly decreases across all Vsg values. For example, at 100 ppm SLS, the pressure gradient (PG) decreased significantly across all tested superficial gas velocities (Vsg), from 36 to 28 Pa/m at 0.26 m/s, 171 to 48 Pa/m at 0.81 m/s, and 381 to 183 Pa/m at 1.35 m/s. This reduction is even more pronounced at a higher SLS concentration (i.e., 200 ppm). The PG is lowered more to 20, 29, and 71 Pa/m at the same Vsg values. These results indicate that higher SLS concentrations effectively suppress turbulent interfacial fluctuations in the slug flow regime and reduce pressure losses, leading to more stable flow conditions. The 0 ppm pressure gradient trends are consistent with horizontal slug flow data reported by Abdulkadir et al. (2016) and Wilkens and Thomas (2007) [
26,
43].
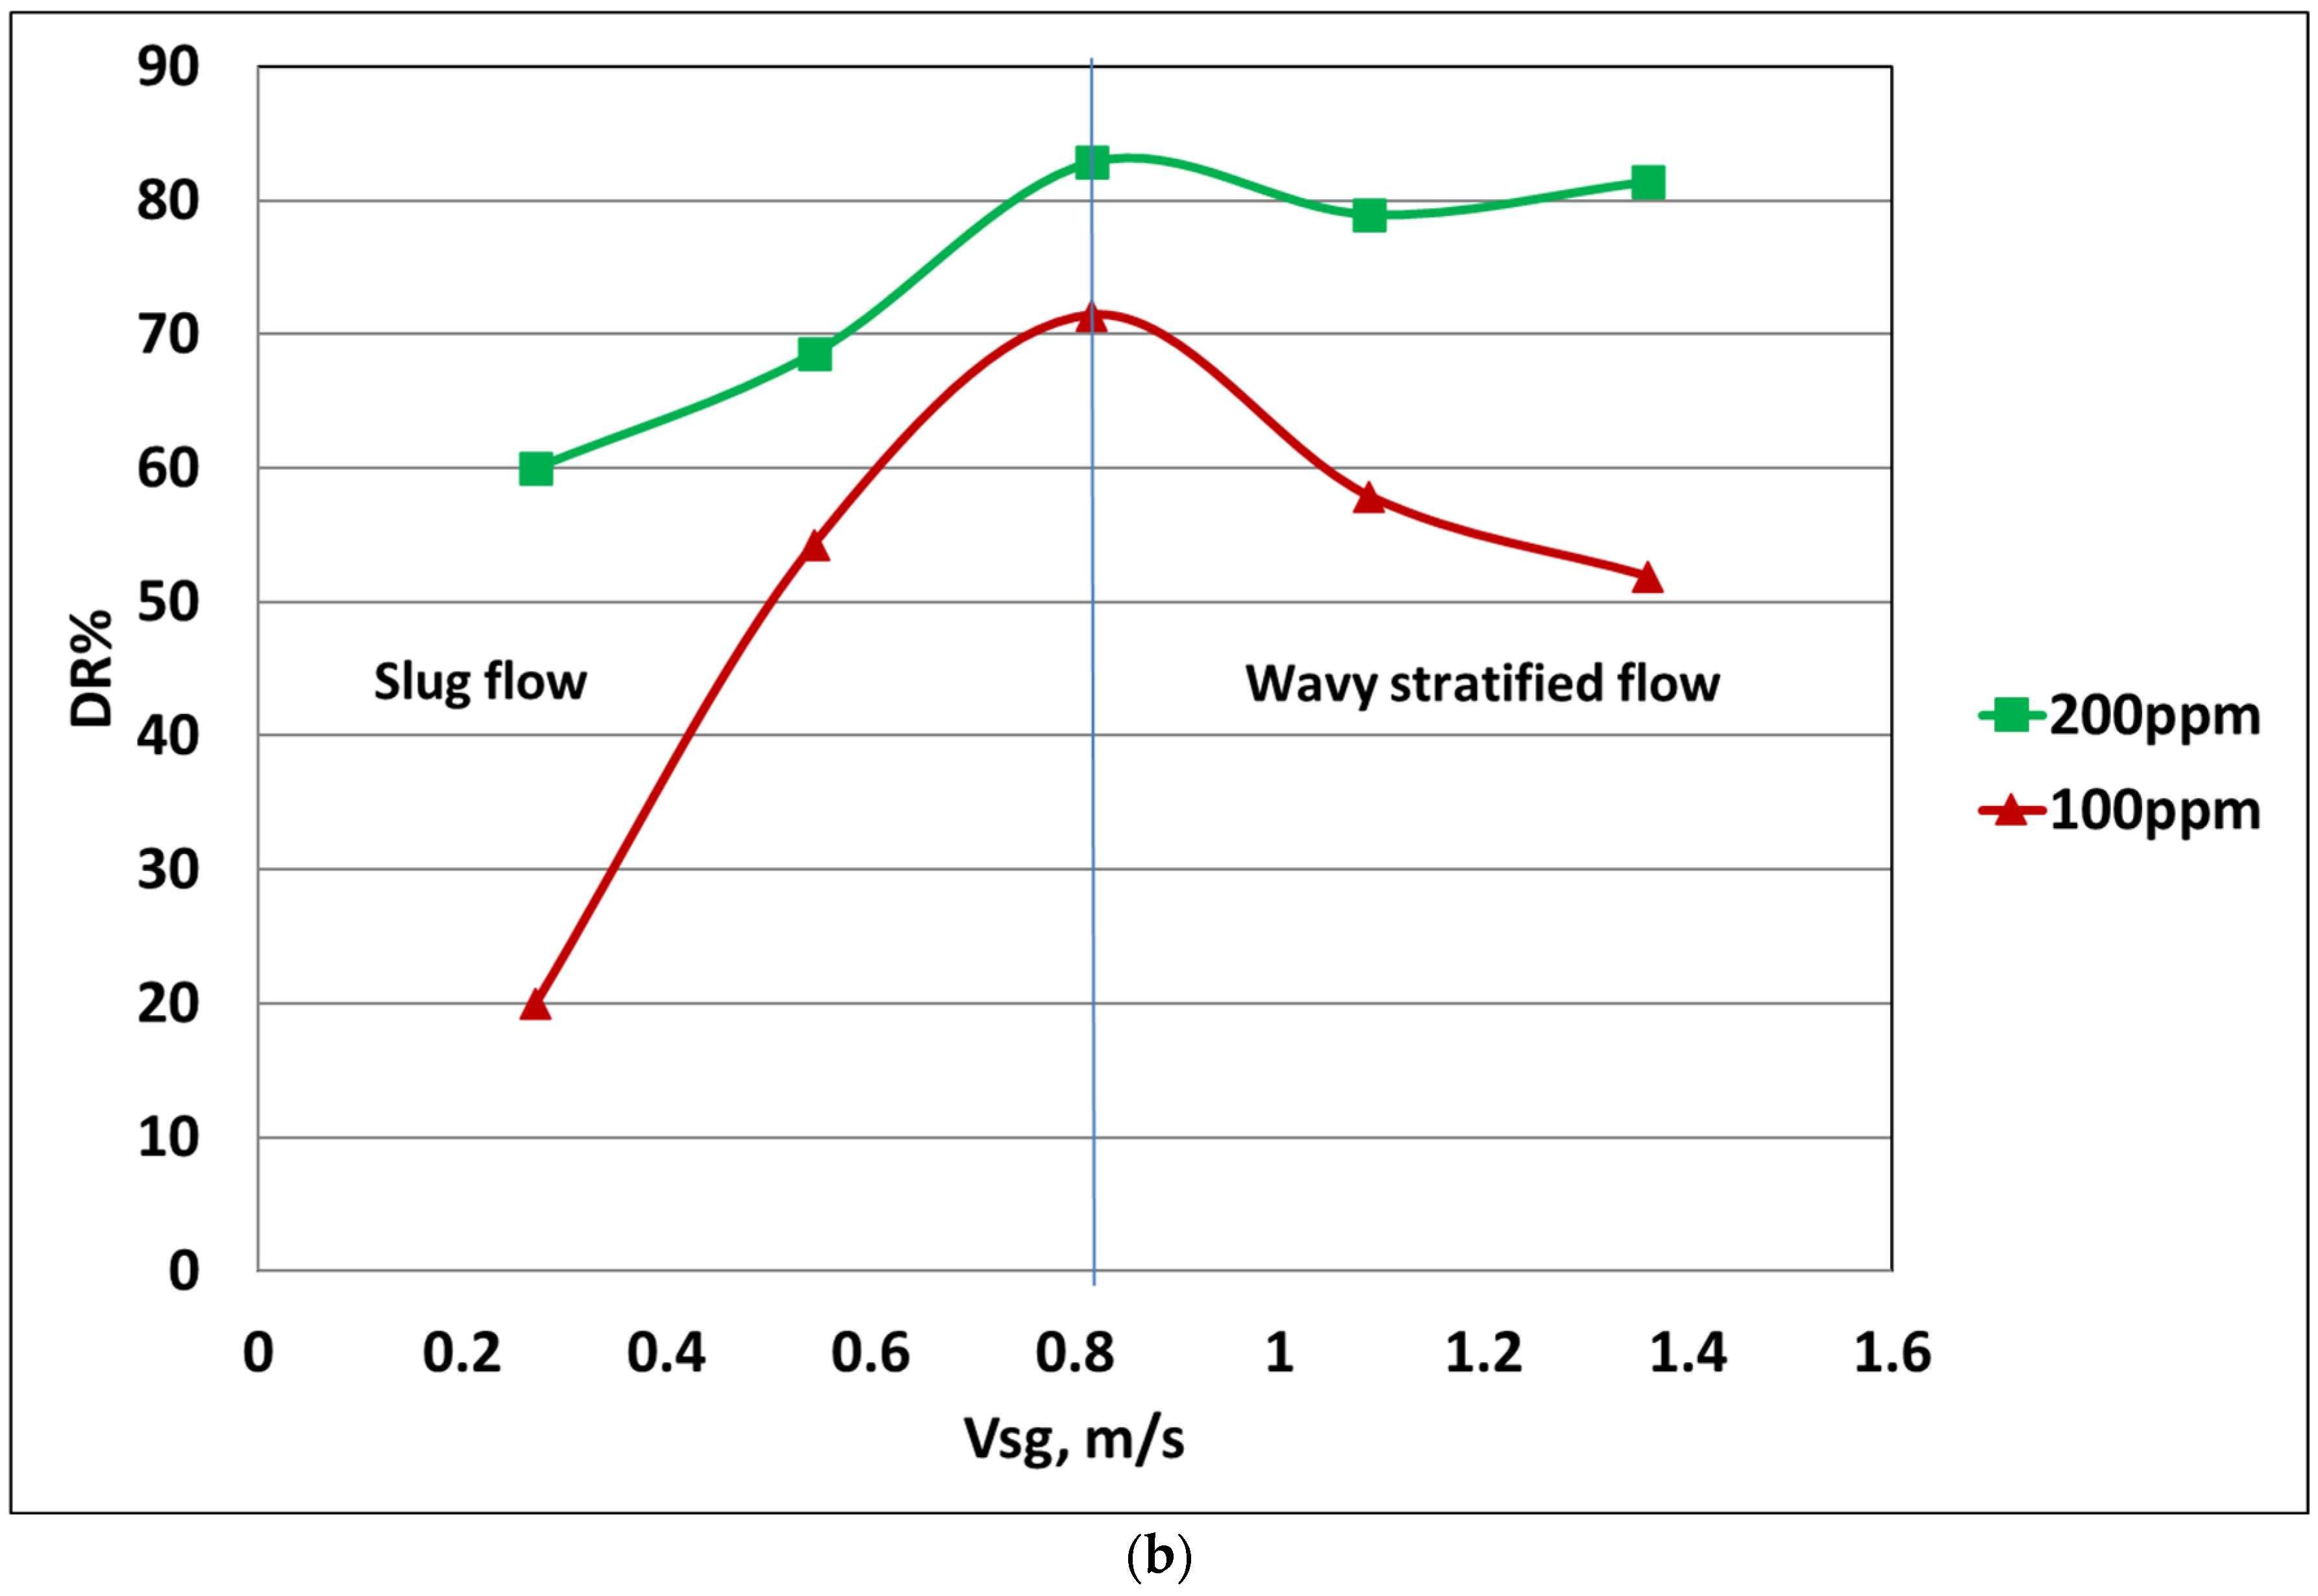
Figure 6b shows, regardless of SLS concentration, that there is a critical gas superficial velocity (Vsgc ≈ 0.81 m/s). Below the Vsgc, the flow pattern is slug (
Figure 3 and
Figure 4); as the Vsg increases (from 0.14 to 0.81 m/s), the DR% rises from 20 to 71% at 100 ppm and from 47% to 83% at 200 ppm. Above the Vsgc, the flow pattern is stratified wavy (
Figure 3 and
Figure 4); as the Vsg rises from 0.81 to 1.35 m/s, the DR% either decreases from 70 to 51% at 100 ppm or stays constant (≈82%) at 200 ppm. In conclusion, the efficiency of SLS increases as the Vsg increases when used in slug flow, whereas the efficiency of SLS decreases as the Vsg increases when used in stratified wavy flow. The results also indicate a limit to the surfactant’s efficiency in reducing drag beyond the slug flow pattern. In all the tested conditions, including the stratified wavy regime, the liquid-phase Reynolds number was between ReL = 12,098 and 72,589, indicating fully turbulent liquid-phase flow in all cases; the drag reduction is thus due to the surfactant-induced change in turbulent interfacial structures, and not a laminar–turbulent transition.
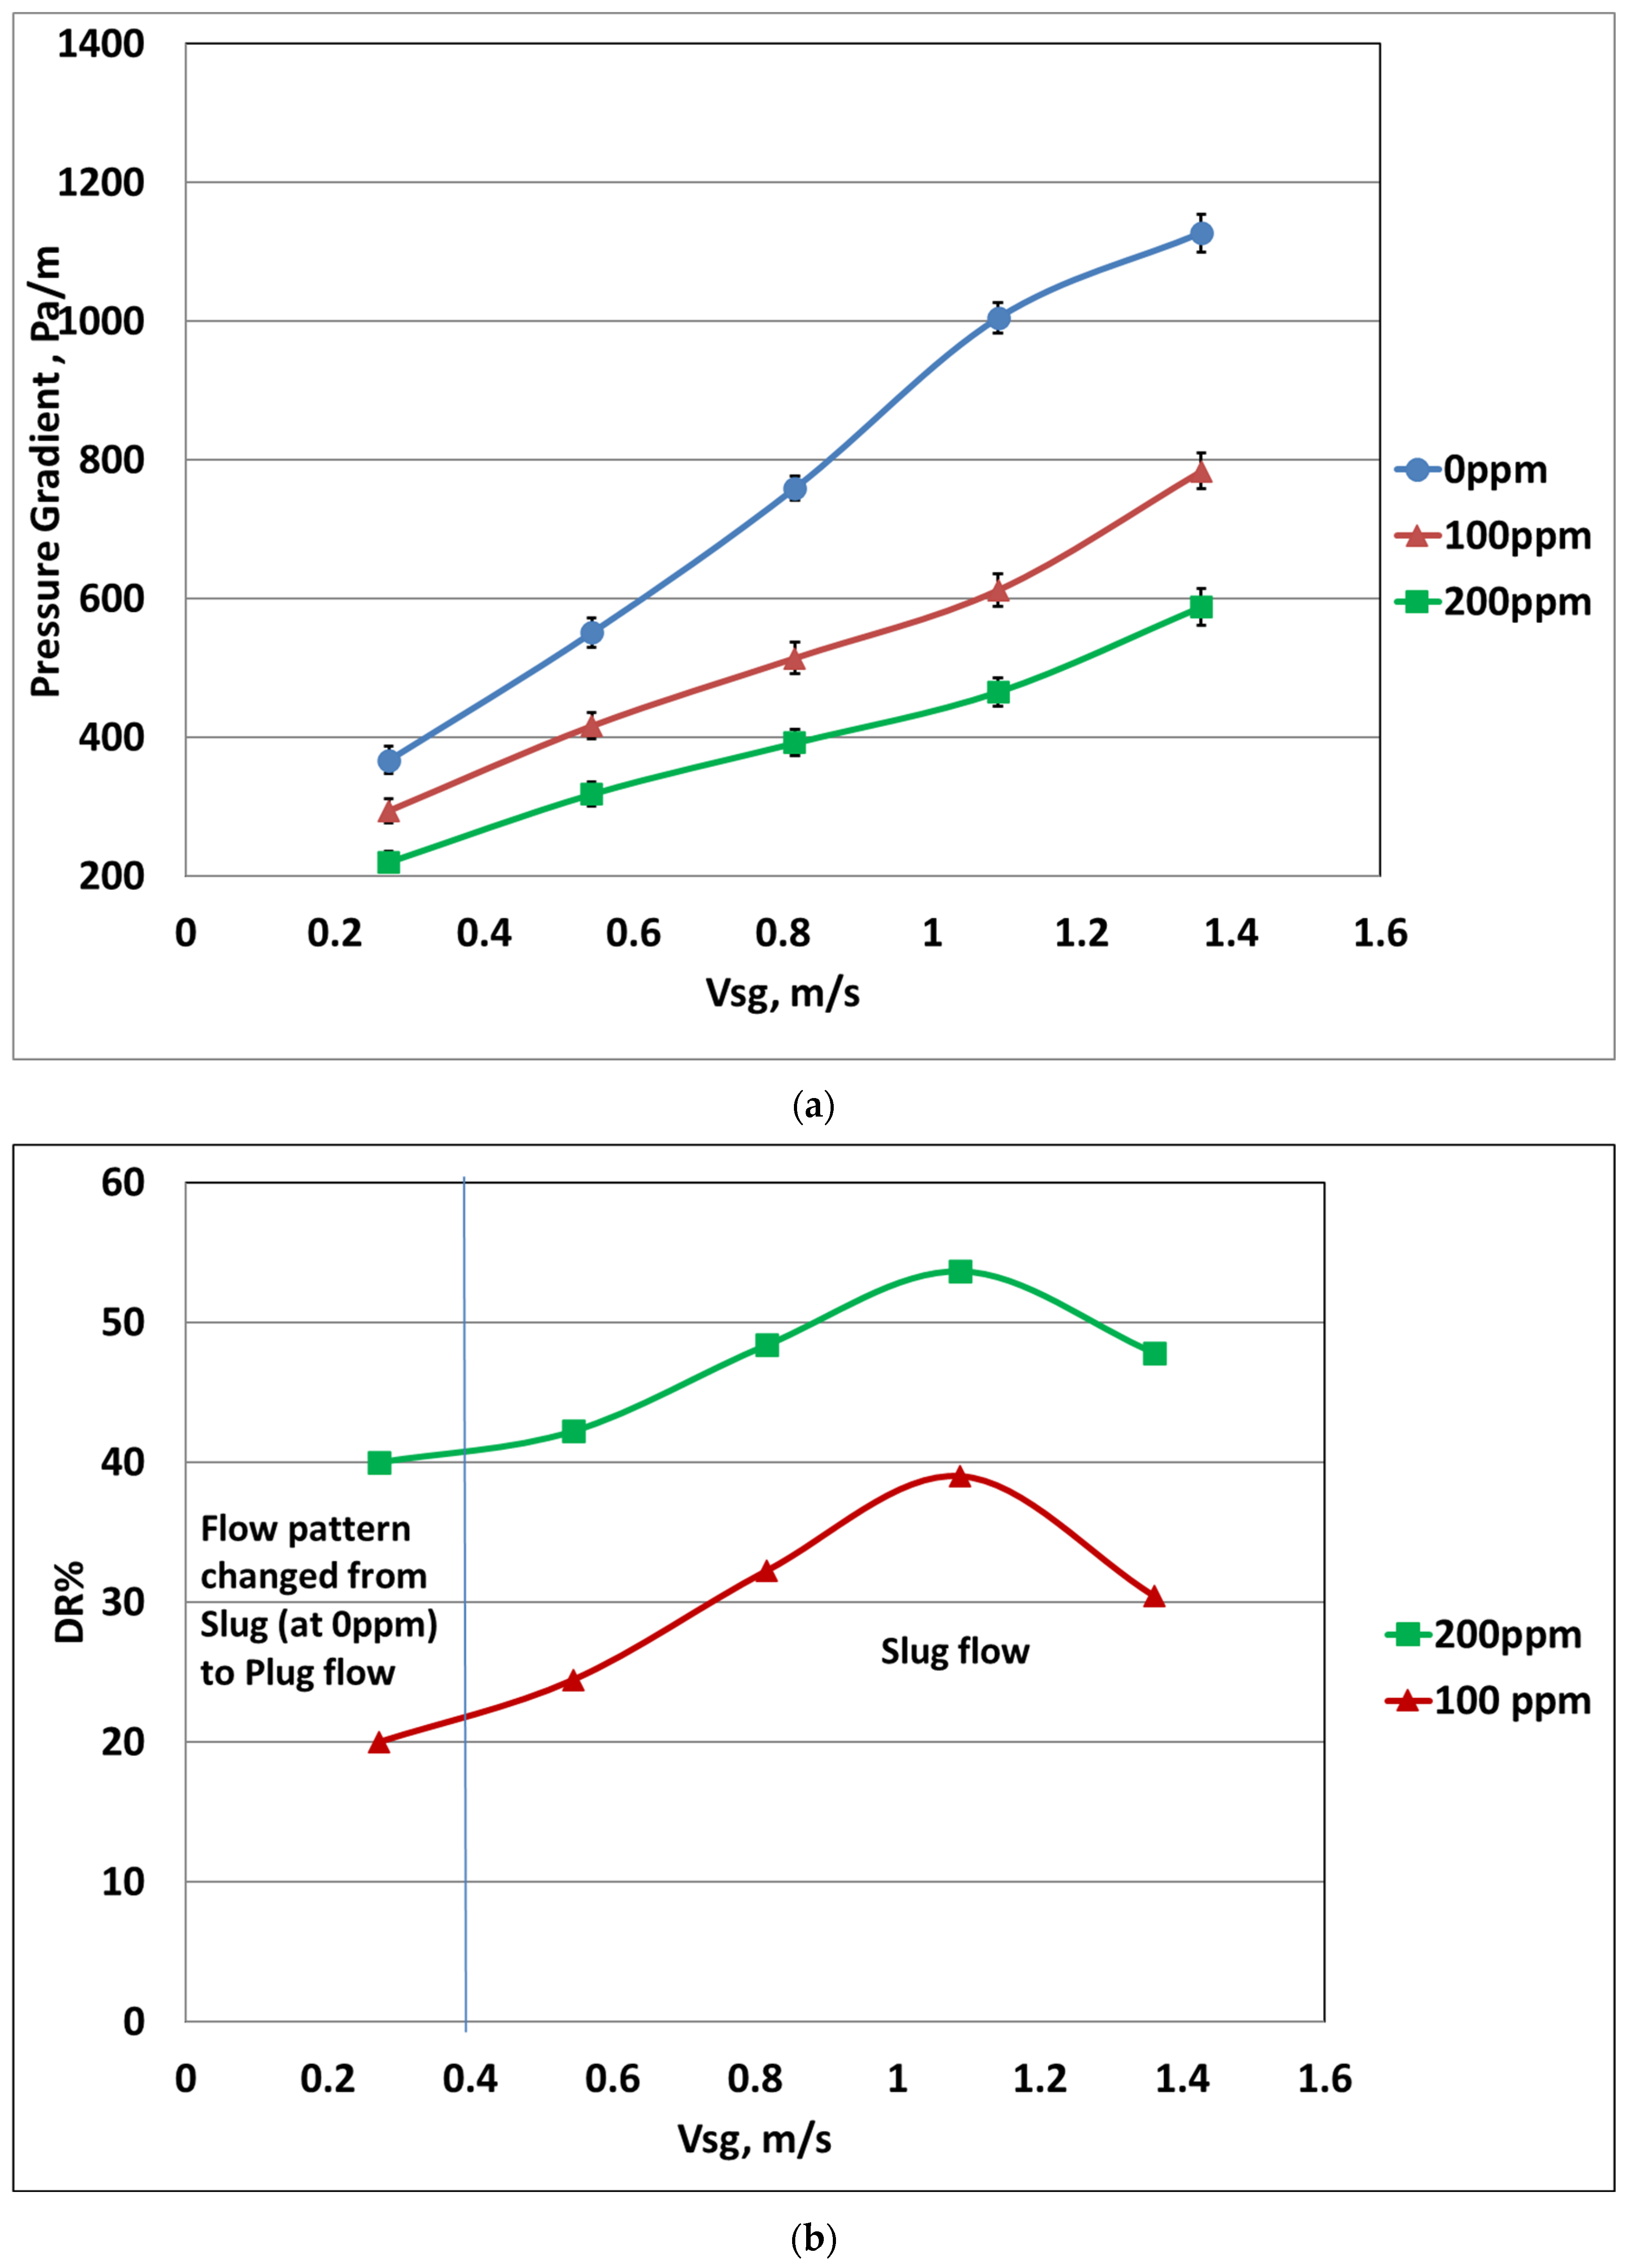
At a higher liquid velocity (Vsl = 1.63 m/s), as shown in
Figure 7a, a similar trend is observed; as SLS concentration increases, the PG significantly decreases. For example, at 100 ppm SLS, the PG decreases from 366 down to 292 Pa/m at Vsg of 0.26 m/s, from 759 down to 514 Pa/m at Vsg of 0.81 m/s, and from 1125 down to 782 Pa/m at Vsg of 1.35 m/s, respectively. At higher SLS concentration (200 ppm), the PG reduction is even more substantial, to 220, 391, and 587 Pa/m at the same gas superficial velocities. This highlights that SLS is still effective in stabilising flow and reducing pressure losses, although the performance of the surfactant weakens slightly as the Vsl increases.
In
Figure 7b, regardless of SLS concentration, the DR% shows a similar profile with a distinguishable critical gas superficial velocity (Vsgc ≈ 1.09 m/s). Below the Vsgc, the flow pattern is intermediate flow (plug or slug); as the Vsg rises from 0.14 to 1.09 m/s, the DR% increases from 20 to 39% at 100 ppm and from 40% to 54% at 200 ppm. Above the Vsgc, the flow pattern is slug; as the Vsg rises from 0.81 to 1.35 m/s, the DR% modestly decreases from 39 to 30% at 100 ppm and from 54 to 48% at 200 ppm.
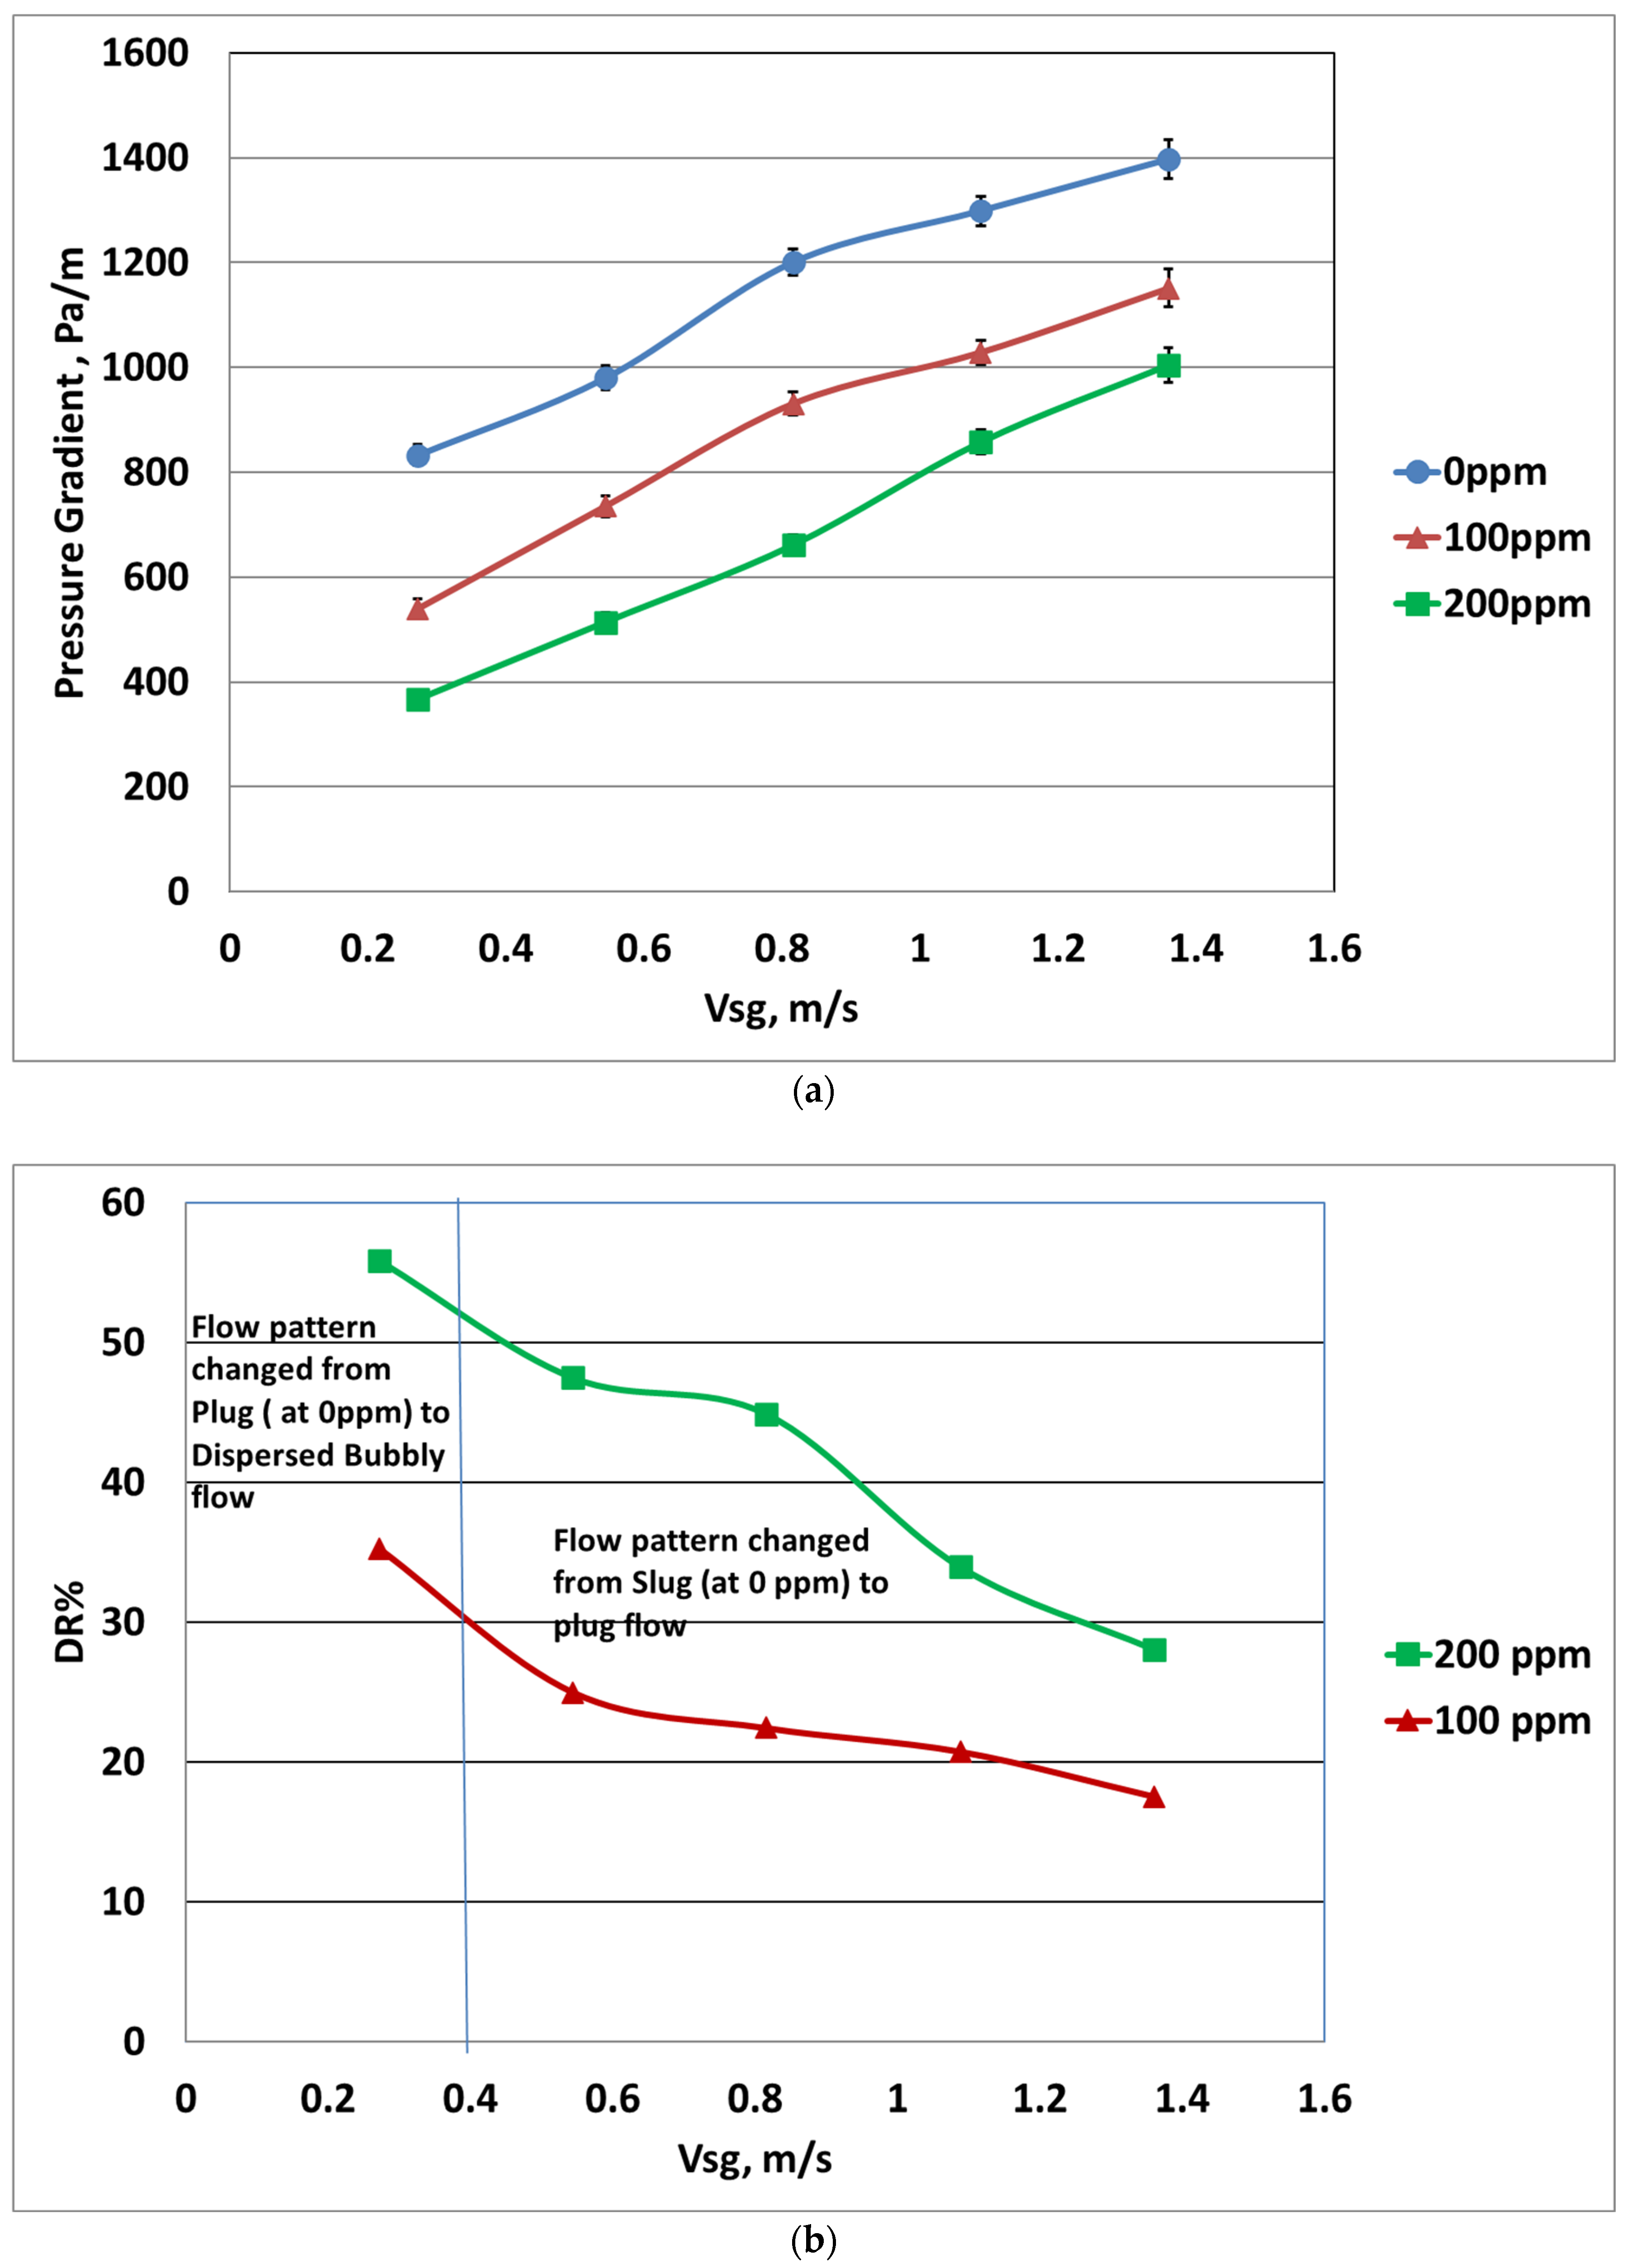
At Vsl = 3.26 m/s, as in
Figure 8a, as SLS concentration increases, the PG slightly decreases compared to lower values of Vsl. For example, at 100 ppm, the PG declines from 831 down to 537 Pa/m at the lowest Vsg (0.26 m/s), from 1201 down to 932 Pa/m at higher Vsg (0.81 m/s), and from 1396 down to 1151 Pa/m at the highest Vsg (1.35 m/s). By adding more SLS (i.e., 200 ppm), the PG is lowered even more significantly, to 368, 662, and 1005 Pa/m, at the same values of Vsg. These results suggest that even though the SLS is still effective at higher Vsl, its effect on flow drag reduction is less pronounced. The decreasing DR% at higher Vsl is the result of the structure of the DR% measure and not the reduced performance of the surfactant. The pressure gradient at the base is already large at high Vsl because the inertia of the liquid is large, and thus the relative decrease in pressure expressed as DR% is smaller even when the absolute decrease in pressure by SLS is large [
37].
Figure 8b shows, regardless of SLS concentration and the flow pattern, which are dispersed bubbly and plug, as Vsg rises from 0.14 to 1.35 m/s, the DR% decreases gradually from 35 to 18% at 100 ppm and from 56 to 28% at 200 ppm. This suggests that at higher Vsl, SLS has a limited effect on further drag reduction once the flow is already stable.
The non-monotonic behaviour of DR% with increasing Vsg reflects a competition between interfacial stabilisation and gas-phase inertial forces. At low to moderate Vsg, the decrease in surface tension facilitates the formation of foam and interfacial stabilisation, which inhibits large amplitude waves and destabilises the slugs, causing a significant drop in pressure gradient. Further increase in Vsg leads to the dominance of gas inertia and the increased interfacial shear facilitates partial foam destruction and greater momentum transfer between the gases and liquids, and the effect of surfactant-induced flow stabilisation is less effective and the drag reduction efficiency levels off or decays [
36,
44,
45,
46].
Overall, as SLS concentration increases, the PG significantly decreases and improves the drag reduction, especially in unstable flow (i.e., slug flow). At 100 ppm SLS, the achieved maximum DR% is around 71%, while at a higher concentration (i.e., 200 ppm), the achieved maximum DR% is further increased to around 83%. More interestingly, it seems that the efficiency of the SLS depends not only on the surfactant concentration but also on the flow pattern and a critical gas superficial velocity (Vsgc). This critical gas velocity (Vsgc) marks a transition flow condition point beyond which the effect of SLS weakens, especially at higher Vsl values where the flow has already stabilised. These findings highlight the importance of selecting optimal SLS concentrations based on the operating conditions of the pipeline.
3.3. Impacts of SLS Surfactant on Liquid Holdup Reduction
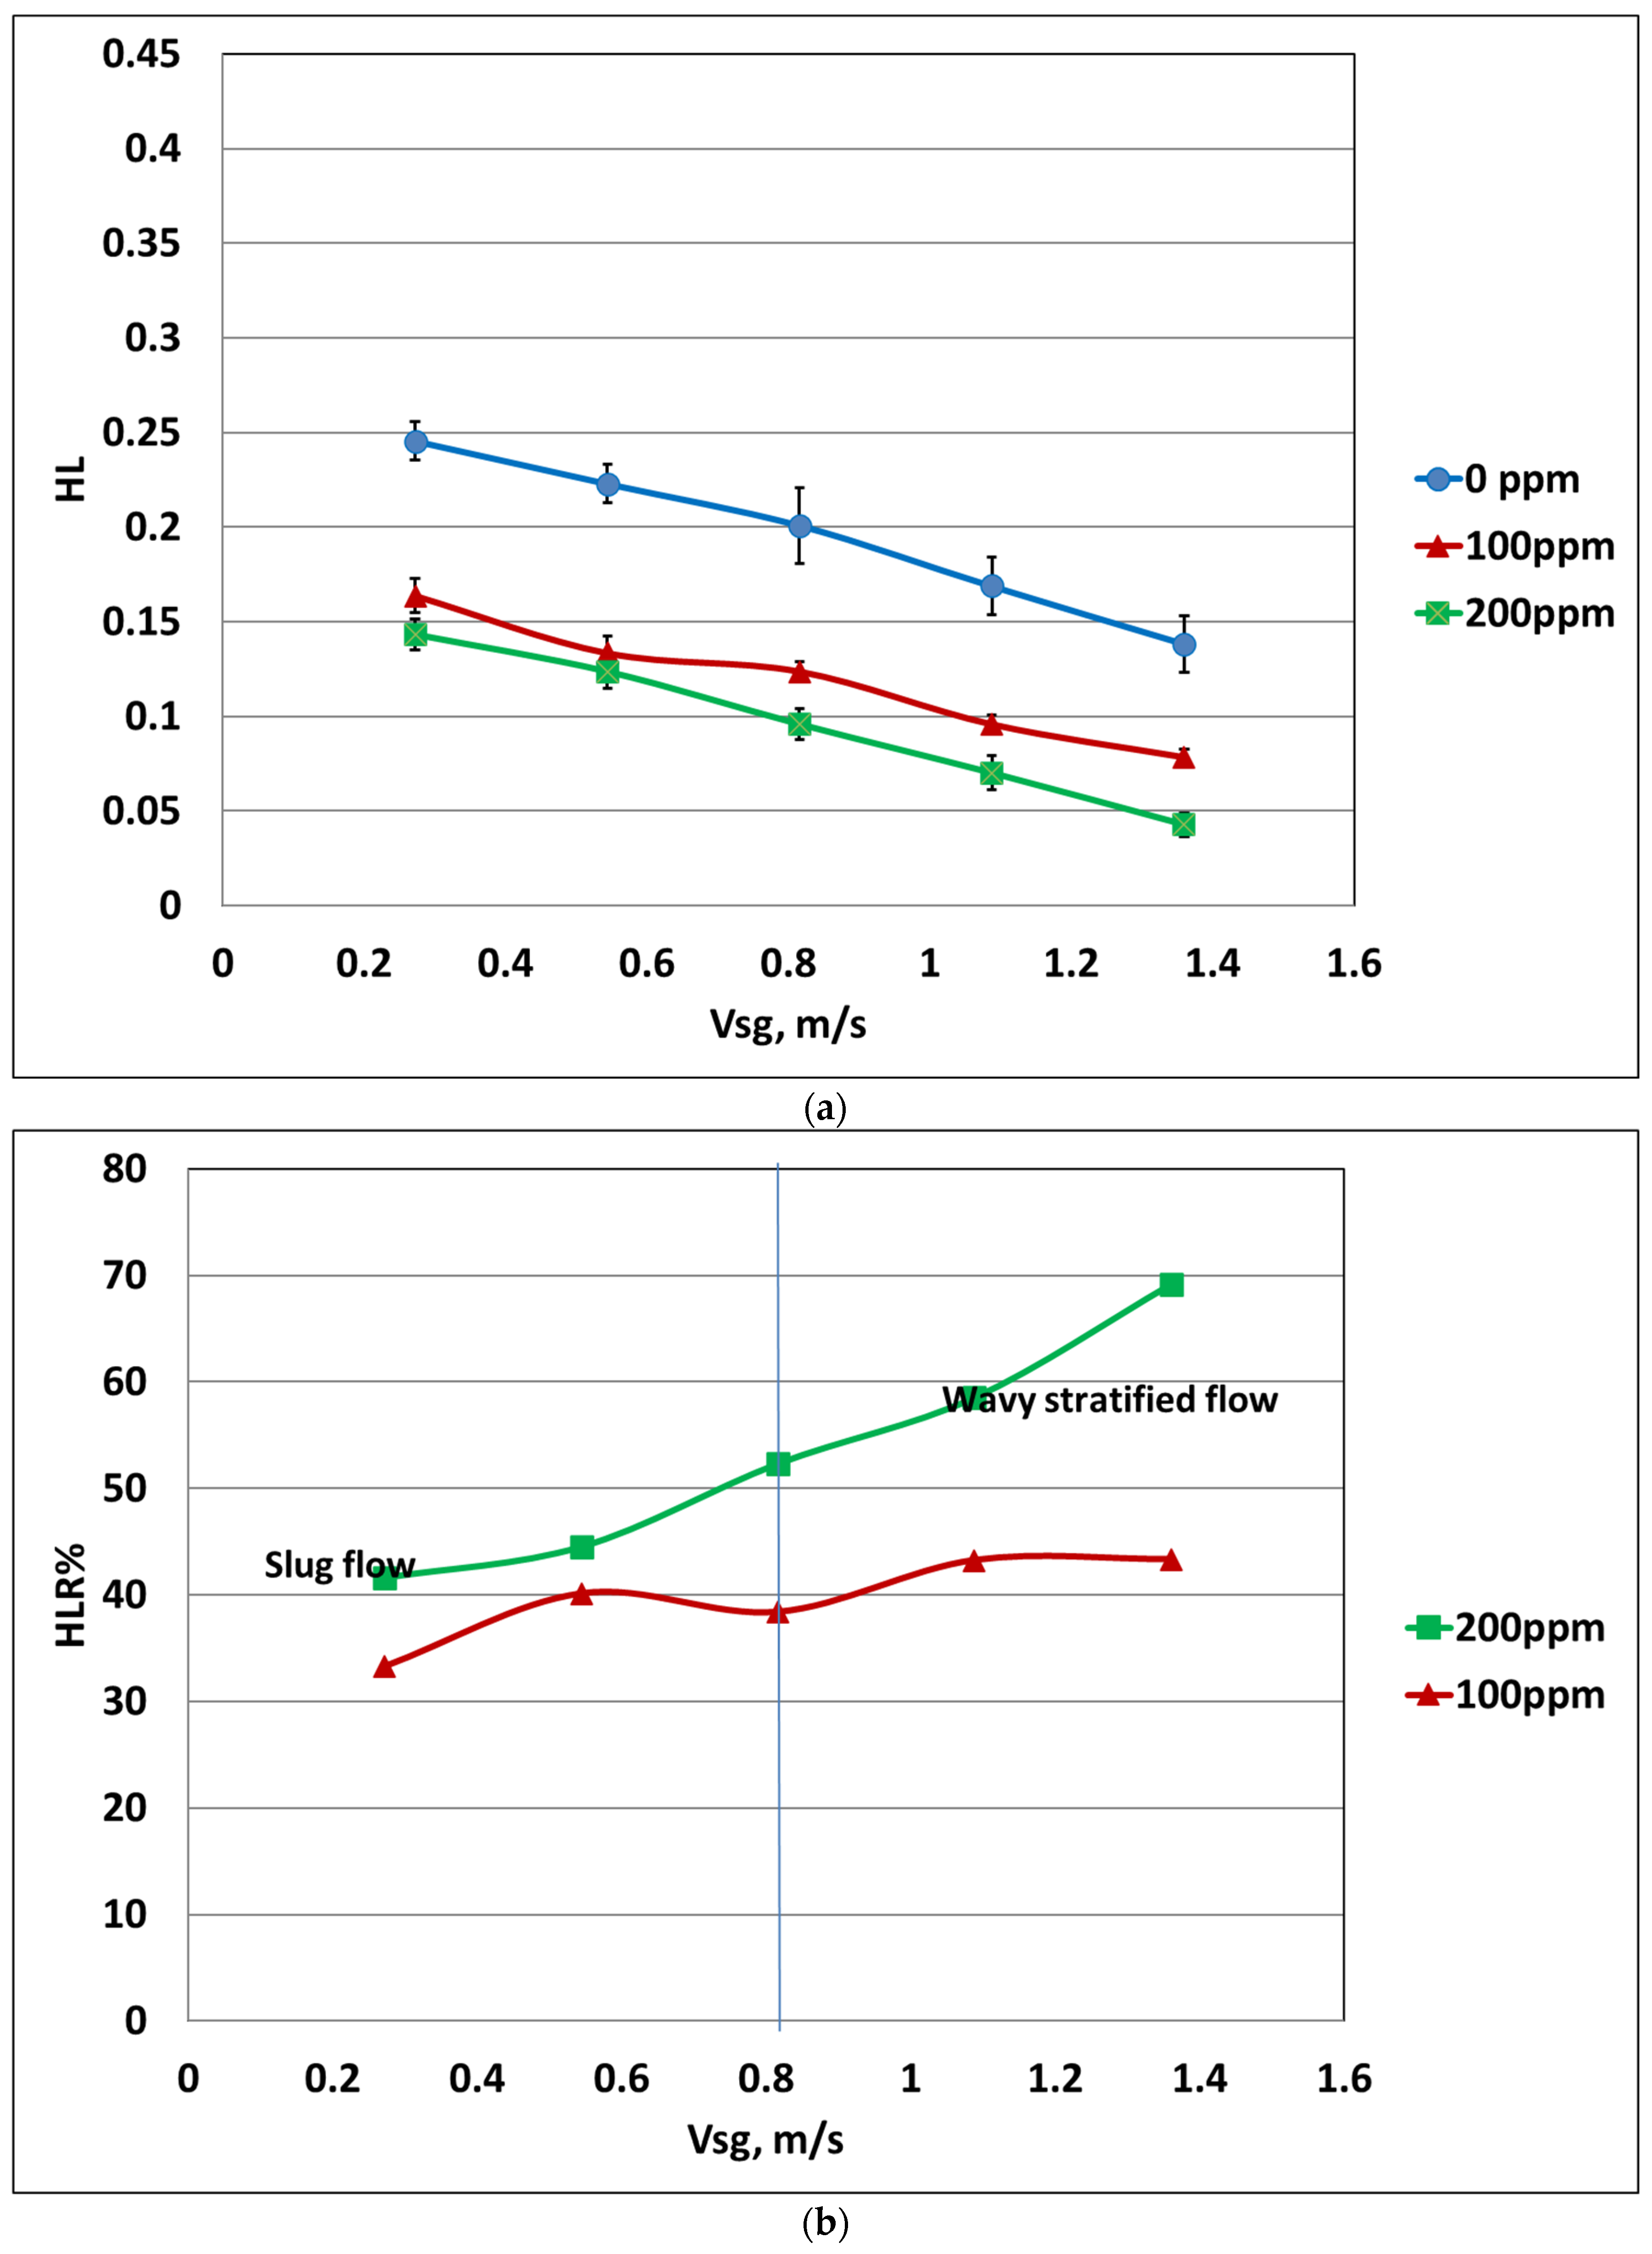
This section examines the effect of SLS concentration on liquid holdup (HL) and holdup reduction (HLR%) across the tested velocity range (
Figure 9,
Figure 10 and
Figure 11). HLR% is calculated using Equation (3) with the 0 ppm baseline as reference.
At Vsl = 0.136 m/s (
Figure 9a), as SLS concentration increases, the HL significantly decreases across all Vsg values. For example, at 100 ppm, the HL decreases from 0.25 down to 0.16 at the lowest Vsg (i.e., 0.26 m/s), 0.2 down to 0.12 at higher Vsg (0.81 m/s), and 0.14 down to 0.08 at the highest Vsg (i.e., 1.35 m/s). When a higher SLS concentration is used (200 ppm), the HL is further decreased to 0.14, 0.10, and 0.05 at the same values of Vsg. These reductions indicate that increasing SLS concentration improves liquid drainage, which means decreasing liquid retention within the flow pipeline. The 0 ppm holdup values (0.14–0.39 across tested conditions) are consistent with horizontal air–water two-phase flow data reported in the literature. The monotonically decreasing liquid holdup as Vsg increases (
Figure 9a) and the concomitantly increasing pressure gradient in
Figure 6a at the same Vsl are indicative of different physical processes and are thus not inconsistent. These two trends reflect different physical mechanisms: the pressure gradient rises with Vsg as the contribution of gas-phase inertia and interfacial shear rises, and the liquid holdup also falls as the faster gas velocity more effectively entrains and carries the liquid phase along the pipe. The two trends are thus physically consistent manifestations of growing gas-phase dominance with increasing Vsg, and their apparent divergence is merely a manifestation of the fact that pressure gradient and liquid holdup are controlled by different and partially independent hydrodynamic processes in horizontal two-phase flow.
Figure 9b shows that, regardless of the flow pattern, the HLR% gradually increases from 33 to 43% for 100 ppm and from 24 to 69% for 200 ppm as Vsg increases from 0.14 to 1.35 m/s. This indicates that higher concentrations of SLS significantly enhance the liquid drainage efficiency, particularly in more stable flow conditions.
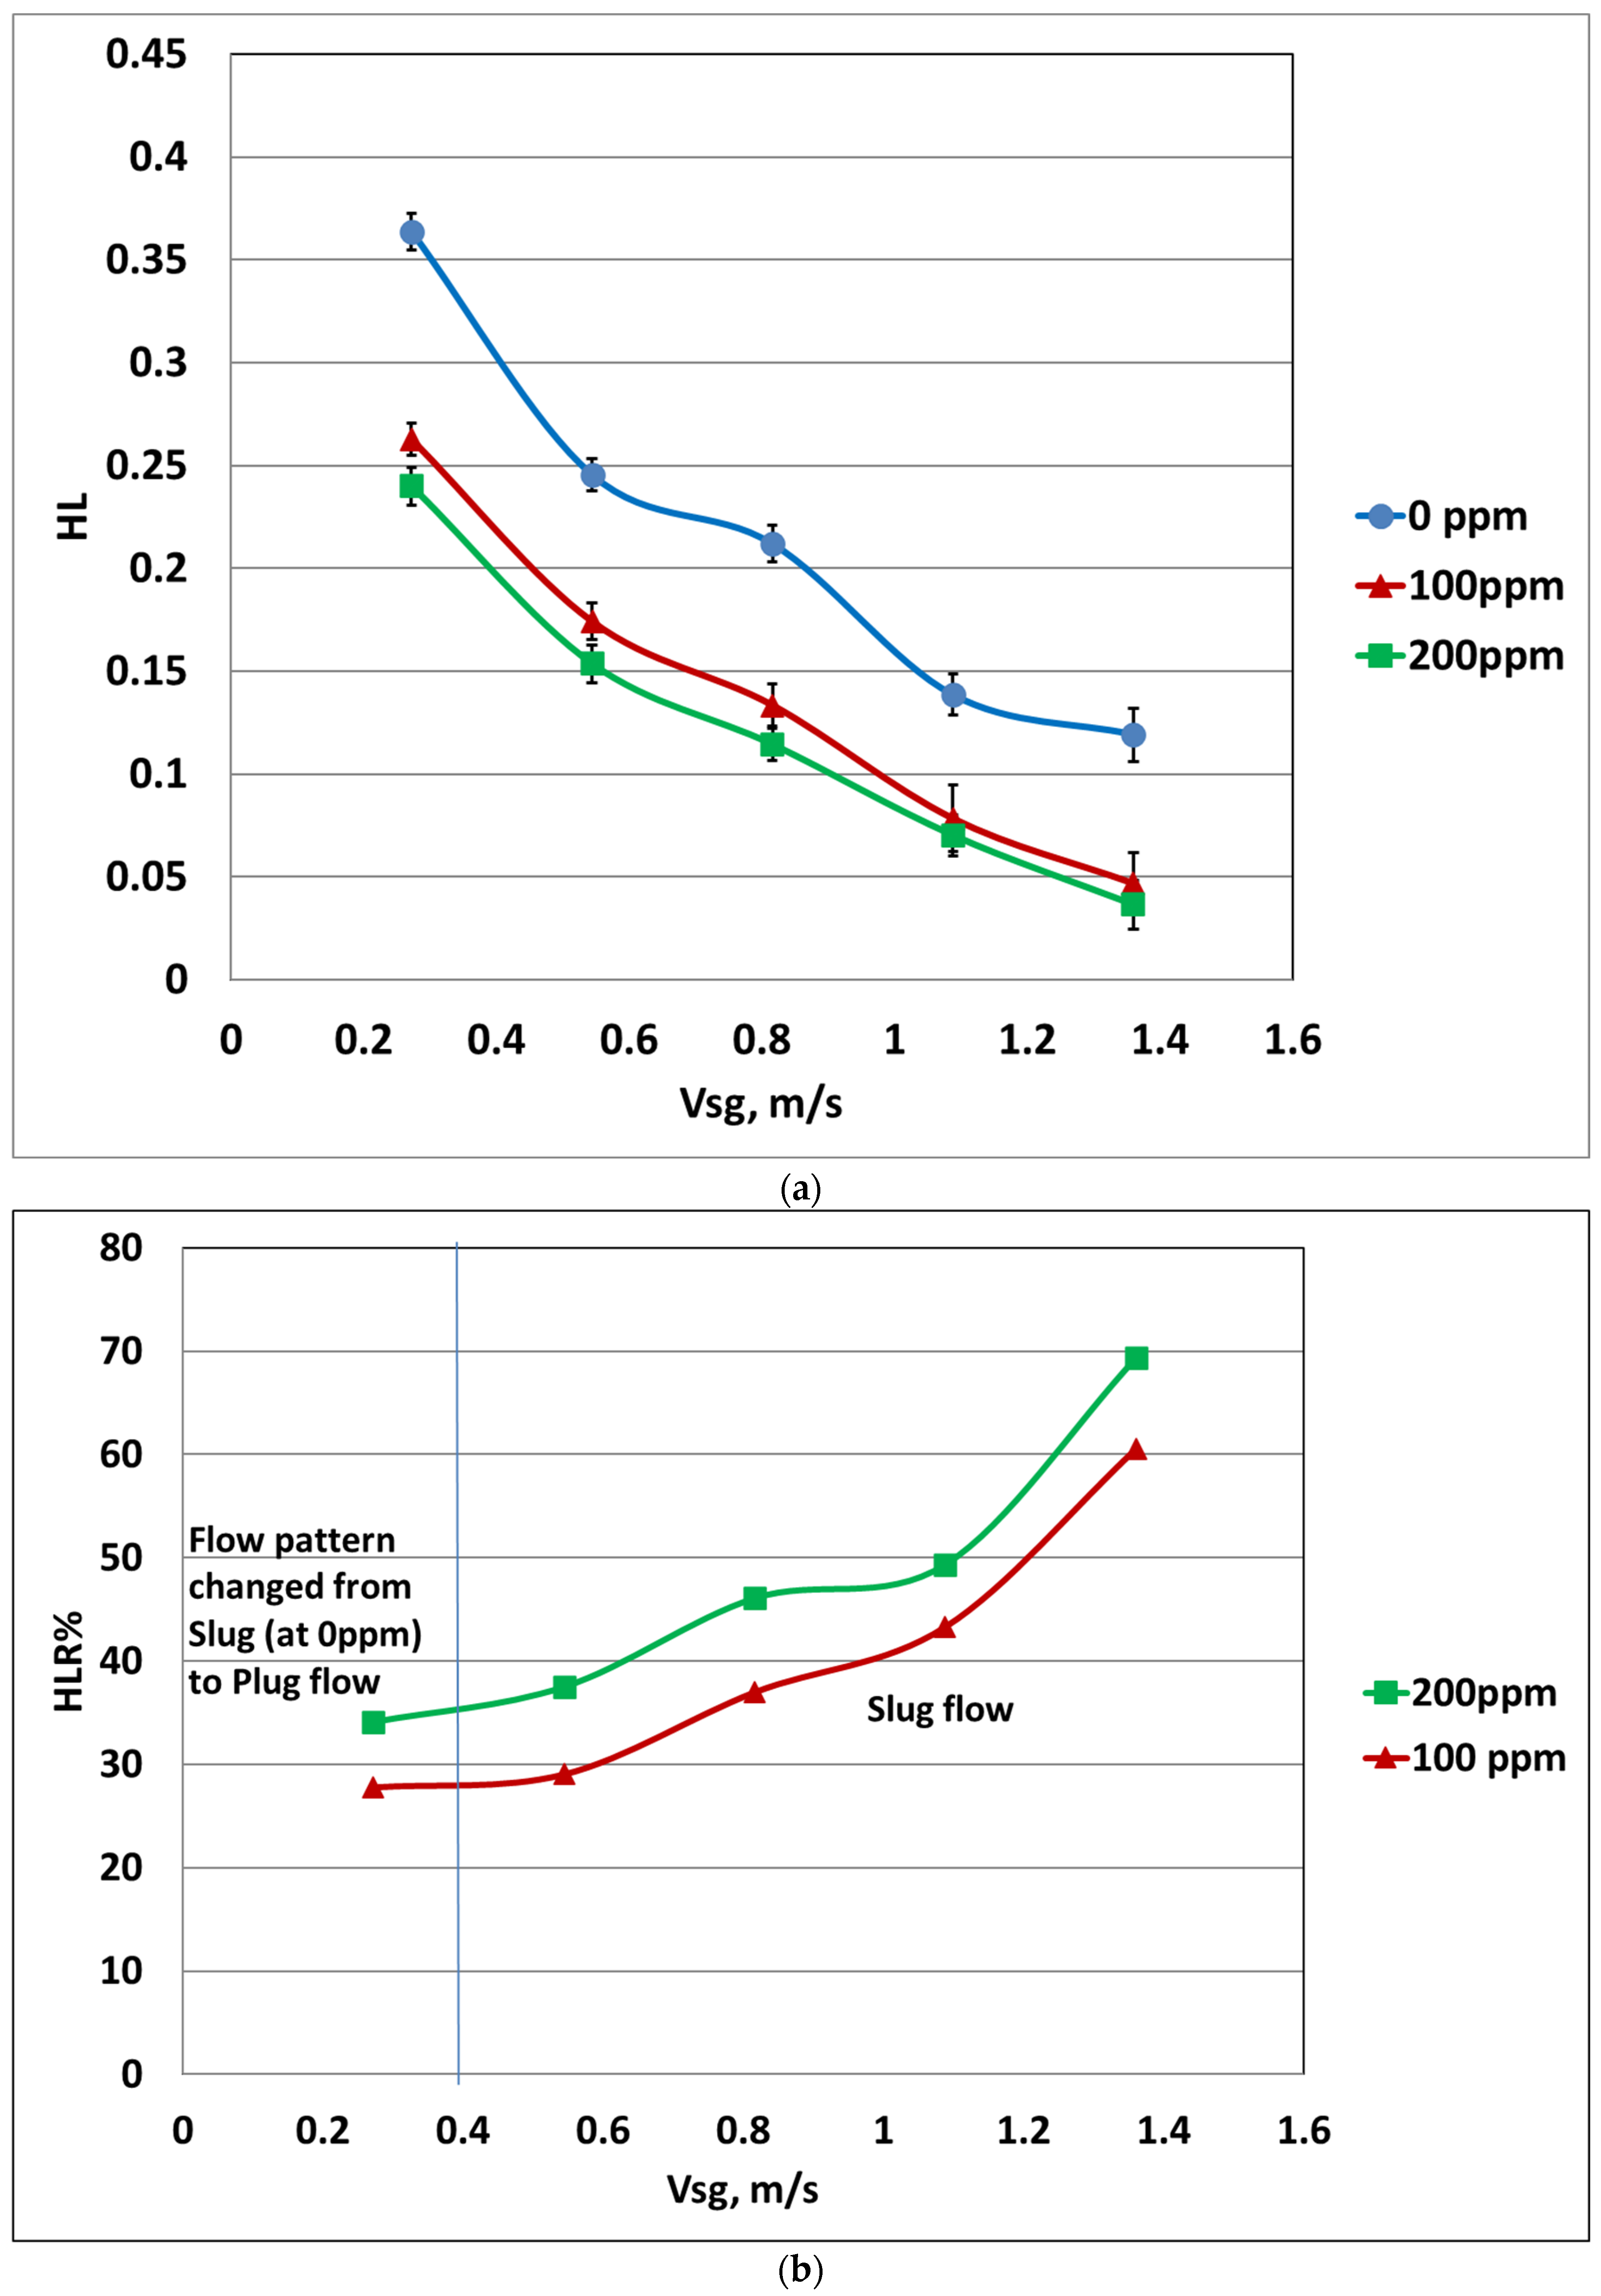
At higher Vsl (1.63 m/s) (
Figure 10a), a similar trend is observed; as SLS concentration increases, the HL significantly decreases across all Vsg values. For example, at 100 ppm, the HL decreases from 0.36 down to 0.26 at the lowest Vsg (i.e., 0.26 m/s), from 0.21 down to 0.13 at higher Vsg (0.81 m/s), and from 0.14 down to 0.05 at the highest Vsg (i.e., 1.35 m/s). When a higher concentration of SLS is added to the liquid solution (i.e., 200 ppm), the HL reduces further to 0.24, 0.11, and 0.04 at the same values of Vsg. These results highlight that the surfactant maintains its effectiveness in reducing HL even as Vsl increases.
Figure 10b shows a similar trend to lower Vsl. The HLR% increases from 28 to 61% for 100 ppm as Vsg increases from 0.14 to 1.35 m/s, whereas the increment is from 34 to 69% for 200 ppm. The consistency in HLR% enhancement across different flow patterns highlights the role of SLS in improving flow stability and minimising liquid build-up.
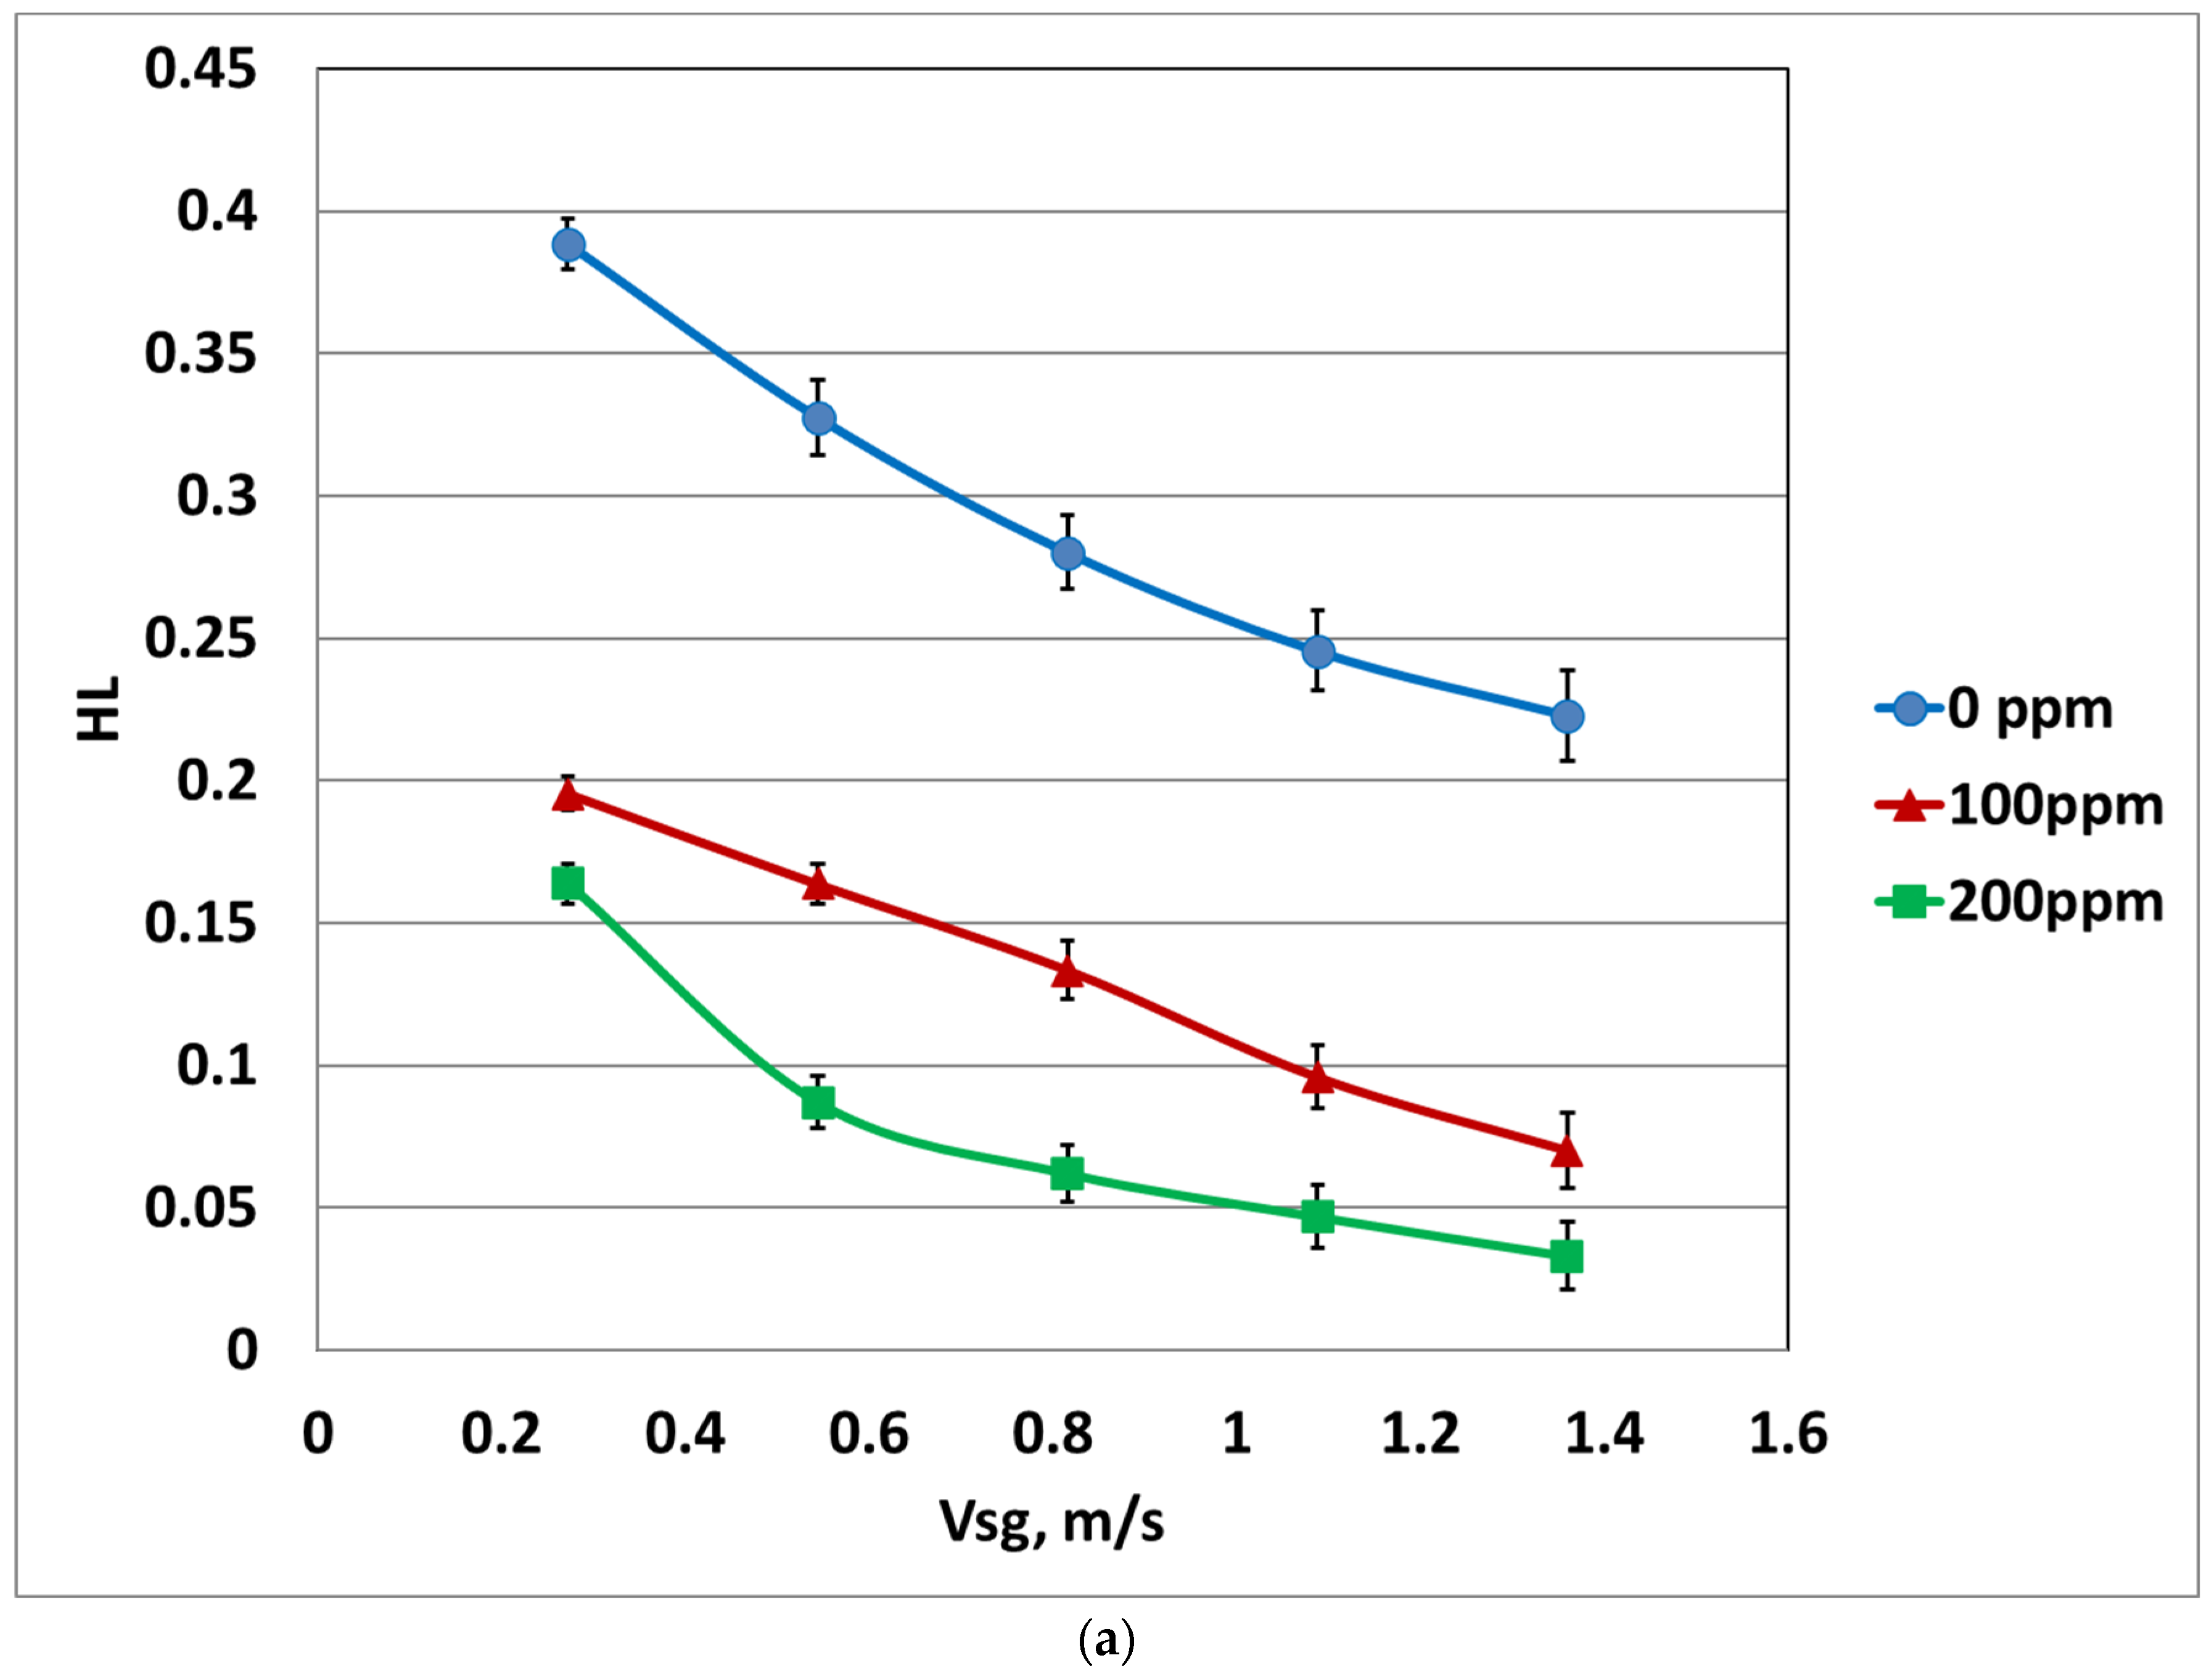
At the highest liquid velocity (Vsl = 3.26 m/s) (
Figure 11a), as SLS concentration increases, the HL significantly decreases. However, the HL reduction is less pronounced than at lower VSl values. For example, at 100 ppm, the HL decreases from 0.39 down to 0.2 at the lowest Vsg (0.26 m/s), from 0.28 down to 0.13 at higher Vsg (0.81 m/s), and from 0.22 down to 0.07 at the highest Vsg (i.e., 1.35 m/s). When more SLS is added to the liquid solution, 200 ppm, the HL is further lowered to 0.16, 0.06, and 0.03 at the same values of Vsg. This indicates a constant enhancement in liquid draining.
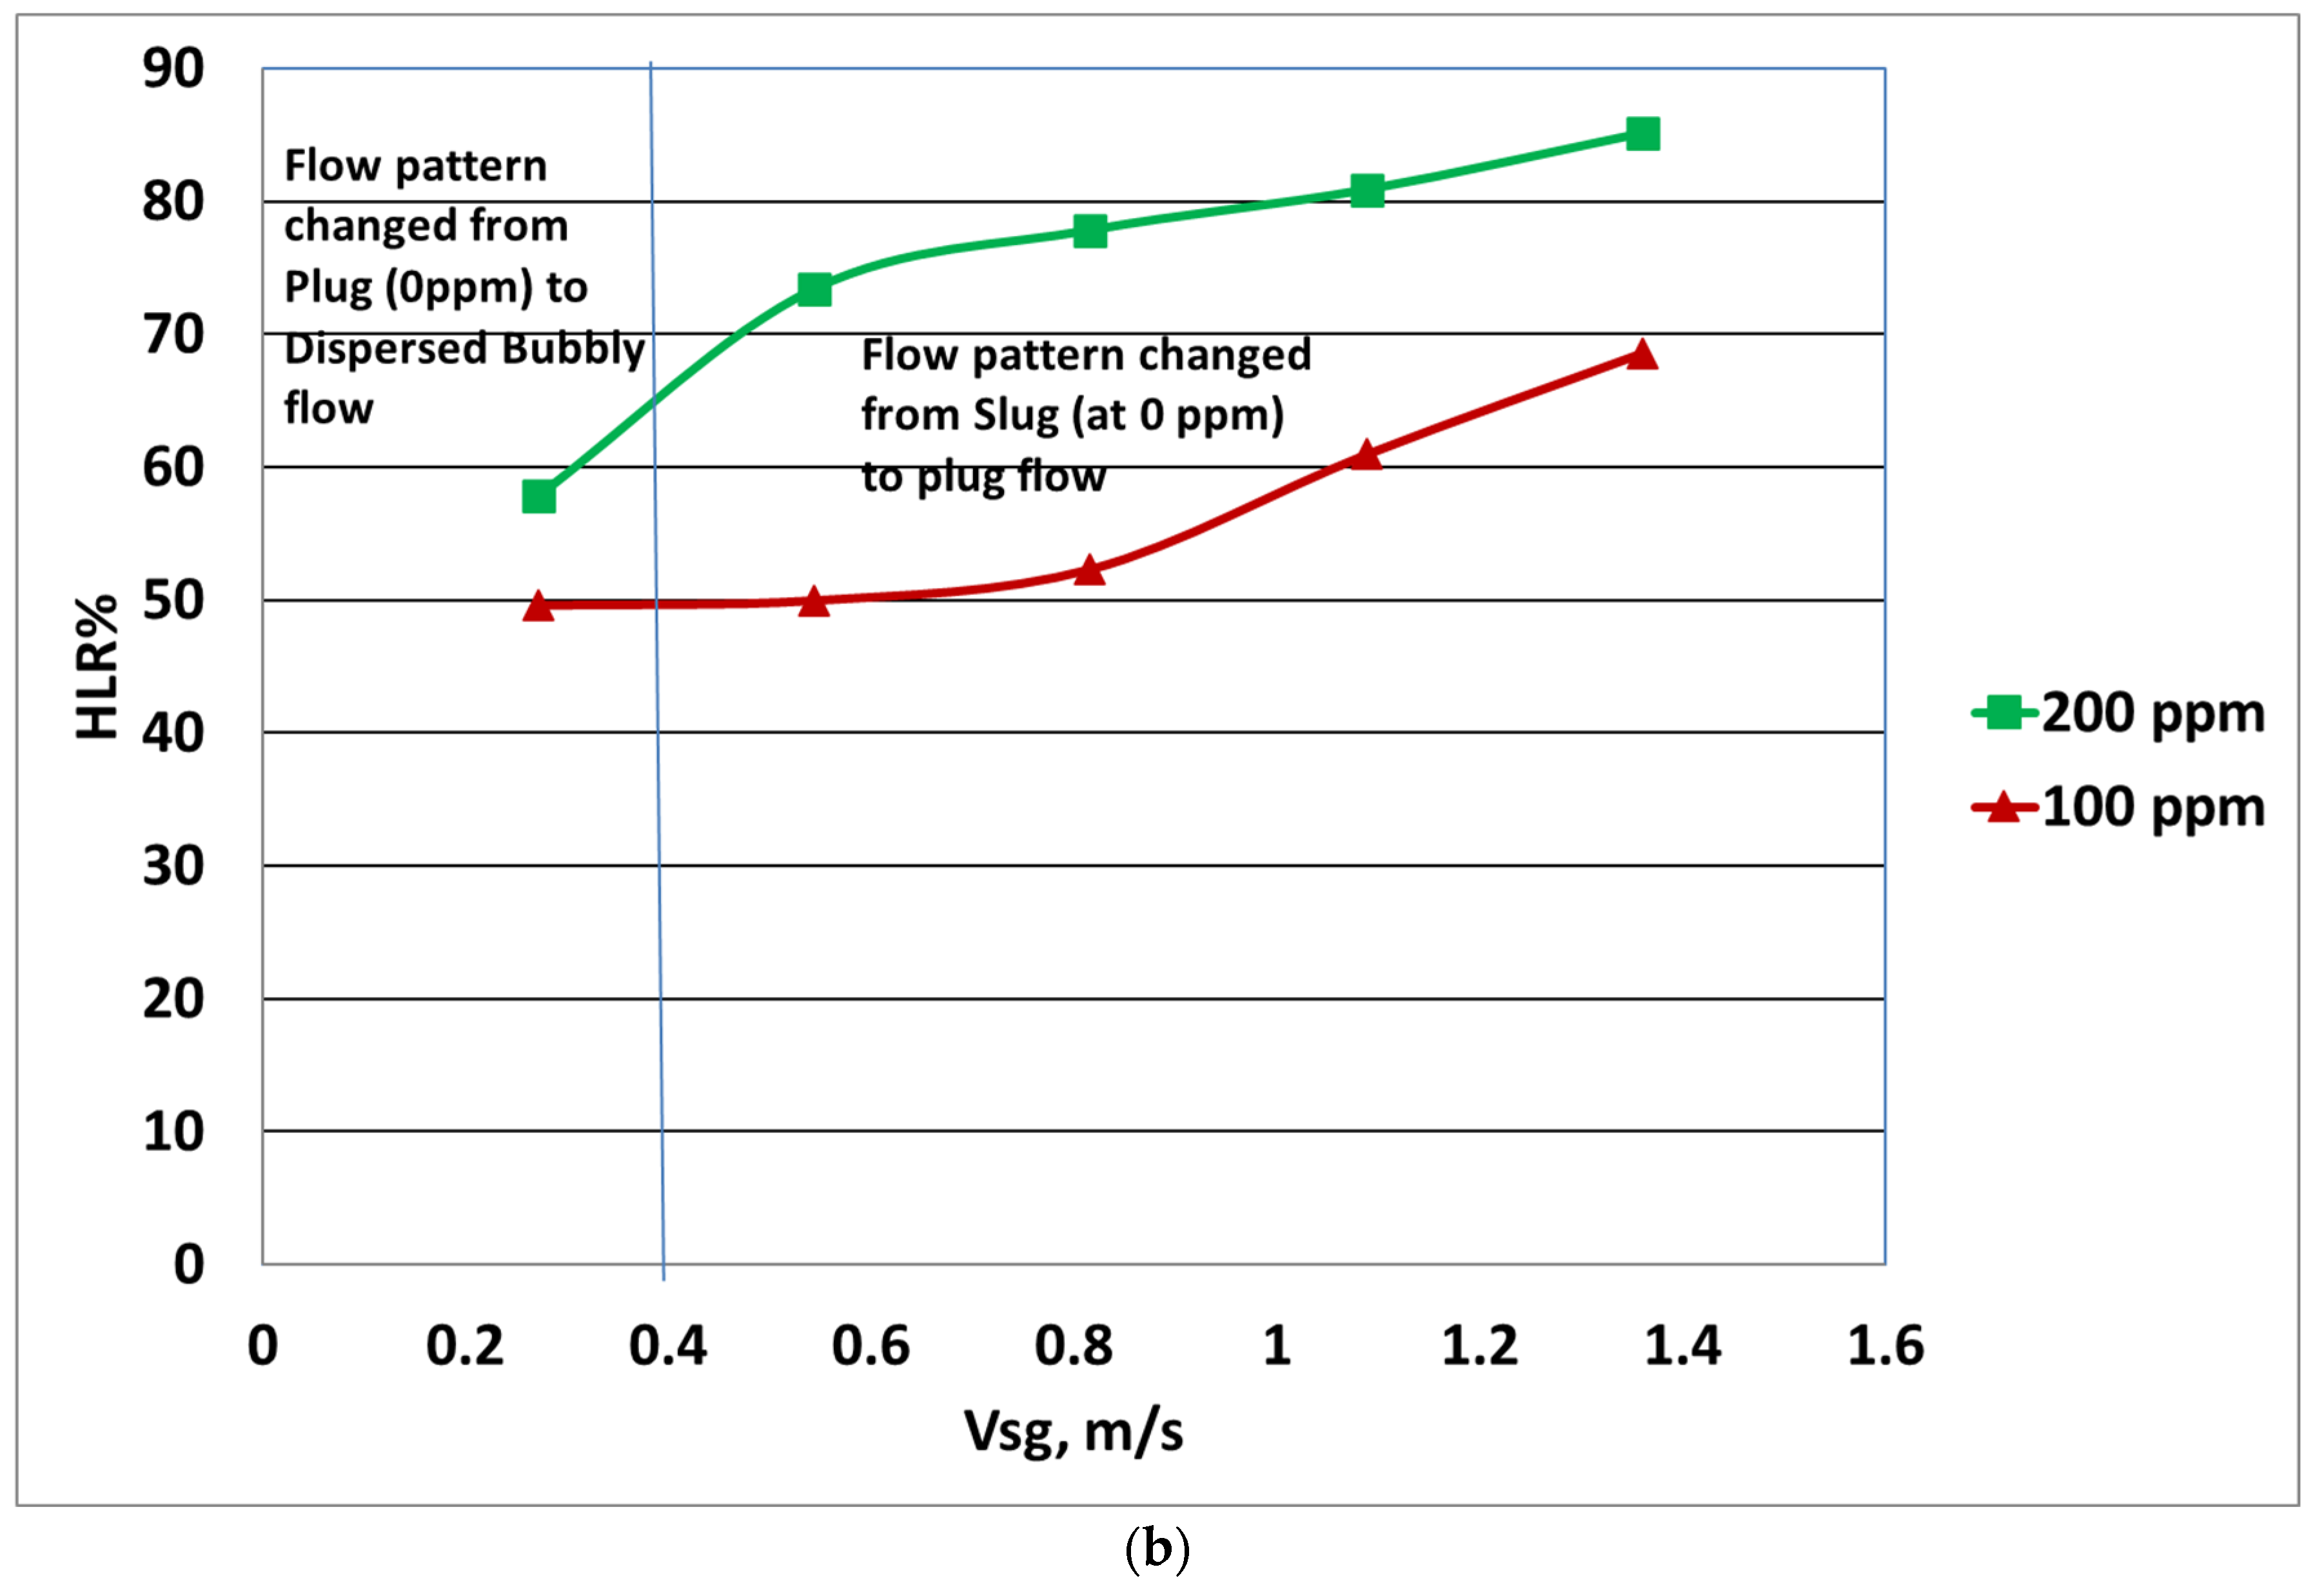
Figure 11b shows a continuous increase in HLR% as SLS concentration and Vsg increase. For example, at 100 ppm, the HLR% increases from 50 to 69%, while at 200 ppm, it increases from 58 to 85% as Vsg increases from 0.14 to 1.35 m/s. These results suggest that the effectiveness of SLS in reducing liquid accumulation continues as liquid velocities become higher as the flow stabilises.
The decrease in liquid holdup with increasing Vsg reflects enhanced liquid transport by the gas phase. The higher the Vsg, the higher the shear force of the gas phase, which enhances entrainment and drainage of the liquid, and the thinner the liquid layer and the amount of liquid that is stagnant in the pipe. In the case of the SLS, the effect is intensified due to the stabilisation of the microbubbles in the liquid phase by the surfactant, and the formation of the dispersed, lower-density liquid structure is facilitated. This liquid of microbubbles flows more readily and is transported by the gas phase more efficiently resulting in a constant reduction in holdup with increasing Vsg. This has been observed as well with the surfactant-enhanced gas–liquid systems in which a rise in the velocity of the gas results in a rise in the efficiency of the liquid removal via a greater momentum transfer between the gas and the liquid [
47,
48,
49]. Despite the fact that the decreased HL means an increase in the liquid-phase velocity, which would be anticipated to increase the wall shear, the simultaneous decrease in the total pressure gradient is attributed to the removal of slug accelerational pressure losses, which dominate the total pressure drop in intermittent flow [
50]. This element, which is a result of momentum exchange at slug fronts, is significantly eliminated when SLS transitions the flow away from slug patterns, resulting in a net pressure decrease that dominates over any growth in film-phase wall friction.
Contrary to drag reduction, which is a non-monotonic function of the velocity of the gas (Vsg), in the case of liquid holdup reduction, the reduction is monotonic with Vsg. This distinction follows since the effect of holdup reduction is more on liquid transport efficiency but drag reduction is also affected by the changes in flow regime and foam structure. At higher gas velocities, though high interfacial shear or thicker foam could complicate frictional losses and drag reduction, gas phase is still able to transport liquid in the downstream direction thus sustaining the holdup reduction. The same differences between pressure gradient behaviour and liquid holdup behaviour trends have been found in earlier surfactant studies, where maximum liquid unloading is found in a broader range of gas velocity than optimum drag reduction [
36,
46,
51].
Overall, as SLS concentration increases, the HL significantly decreases, and the HLR% (i.e., liquid draining) considerably enhances. At 100 ppm, the maximum achieved HLR% is around 69%, while at 200 ppm, the maximum achieved HLR% is around 85%. Moreover, the most pronounced effects of surfactant on reducing liquid accumulation are seen at higher Vsl.
4. Conclusions
This study demonstrates that increasing concentrations of sodium lauryl sulphate (SLS) significantly enhances the efficiency of air–water flow in horizontal flowlines.
The surfactant additive shows significant changes in the flow pattern map. Increasing the SLS concentrations shifts the flow pattern from slug to more stable patterns (stratified wavy and plug patterns).
At lower superficial liquid velocities (Vsl), SLS is more effective in suppressing slug flow, achieving maximum drag reduction percentages (DR %) of 71% for 100 ppm and 83% for 200 ppm. As Vsl increases, the influence of SLS persists but diminishes as the flow stabilises (stratified wavy and plug patterns).
Regarding liquid holdup, increasing SLS concentrations in the liquid phase consistently decreases holdup across a range of gas velocities (Vsg). The maximum holdup reduction (HLR %) is 69% at 100 ppm and 85% at 200 ppm. The surfactant’s ability to stabilise flow and minimise turbulent slug flow contributes to reducing pressure losses, more efficient liquid drainage, and improving overall pipeline performance.
The results also show that the reduction in liquid holdup and the reduction in drag although correlated with each other exhibit varying sensitivities to the gas velocity, which is the result of the mutual interference of the liquid removal and the turbulence modulation.
Overall, the results highlight the effectiveness of SLS as a drag-reducing agent in enhancing two-phase flow in horizontal flowlines. The study underlines the importance of selecting appropriate SLS concentrations based on specific operational conditions to achieve flow stability and efficiency. The results give a foundation to the design and optimisation of surfactant-assisted horizontal multiphase pipeline systems. The current work, to the best of the authors’ knowledge, is the first systematic experimental study of SLS as a drag-reducing agent in horizontal gas–liquid two-phase pipeline flow, thus extending the current body of knowledge on anionic surfactant drag reduction—previously limited to SDS and SDBS—to a previously unexplored member of the alkyl sulphate family.
Despite these results, the current study has a number of limitations. The experiments used an air–water system at ambient pressure and temperature; real hydrocarbon gas–liquid systems vary in fluid density, viscosity, and interfacial tension in a manner that will influence the boundaries of flow patterns as well as the DR that can be achieved. The diameter of the tested pipe (5.1 cm) is not reflective of the scale of industrial pipelines, and the experiment is limited to horizontal orientation. Further research should consider the performance of SLS in a variety of pipe sizes, fluid systems, and operating pressures that are relevant to field-scale gas–liquid transportation conditions, and the goal of creating predictive models that combine the surfactant-mediated surface tension effects with the flow pattern transition behaviour.




 ,
,