1. Introduction
As distributed generation, electric vehicles, and smart home technologies become more commonplace, low-voltage grids are confronted with new challenges [
1,
2,
3,
4,
5,
6,
7,
8,
9]. These issues can be addressed by adopting novel topologies that enable the seamless integration of distributed renewable energy sources (RESs), which operate in DC [
10].
The CIGRE European low-voltage benchmark was developed by CIGRE Task Force C6.04.02 as a standardized reference system [
11]. Its purpose is to facilitate the analysis and validation of new methods for the economic, robust, and environmentally responsible integration of distributed energy resources (DERs). These comprehensive reference systems enable detailed studies of DER integration across high, medium, and low-voltage levels, providing a consistent platform for power system research and evaluation.
The benchmark network allows flexibility in integrating devices such as converter-interfaced generators (CIGs), battery energy storage systems (BESSs), or additional new network configurations [
12]. In this work, three hybrid AC/DC topology adaptations of the CIGRE European low-voltage benchmark are proposed by adding a DC network and structural modifications on the AC side.
To provide a baseline assessment of the proposed topologies, this work employs a simple decentralized control method based on droop control. In power systems, the droop control is a widely used local technique that enables power-sharing among distributed generators (DGs) without the need for communication or centralized coordination [
13,
14,
15,
16,
17]. This paper similarly applies the droop control to regulate the power exchanged between the DC link and the AC buses. Although not intended as the main contribution, this basic control setup allows us to evaluate the inherent performance of the hybrid AC/DC architectures, providing a foundation for future studies using more advanced controllers. This decentralized structure increases the robustness and reliability of the system, as the failure of one DG does not necessarily affect the others. The core principle of droop control lies in the relationship between the output power and a specific system variable; in this work, the relationship between active power and voltage (P/V) is considered. In the proposed hybrid topologies, some AC and DC buses are interconnected through VSCs equipped with a local control system, implementing a droop or overvoltage characteristic. These interfacing points regulate the voltage of the AC buses and enable controlled power exchange between the AC and DC buses. This droop mechanism establishes a linear relationship between the output power and the deviation of the controlled variable from its nominal value [
18,
19,
20]. Managing power flow in hybrid AC/DC systems requires proper coordination between AC and DC subsystems to handle nonlinear interactions and variable demand [
21]. However, the focus of this work is not on advanced optimization or control design, but rather on evaluating how different hybrid topologies perform under realistic operating conditions using a basic decentralized droop control strategy.
Previous studies on medium-voltage (MV) hybrid systems have demonstrated that integrating DC feeders and renewable resources can reduce conversion losses and enhance controllability [
22]. This work extends the hybrid concept to the low-voltage (LV) level using the CIGRE benchmark.
To assess the performance of the proposed topologies, simulations were conducted under two representative 24-h load profiles that reflect realistic operating conditions. These profiles emulate typical daily variations in residential, commercial, and industrial demand, allowing a detailed evaluation of voltage and current responses for each proposed topology with and without droop control, in order to better understand how the topologies perform under highly fluctuating and dynamic operating conditions.
Unlike studies that focus on advanced or adaptive control development, this work intentionally adopts a conventional droop-based approach to evaluate the intrinsic performance of different hybrid AC/DC network topologies.
The key contributions of this work, applied to the CIGRE European low-voltage benchmark, are as follows:
Development of three hybrid AC/DC topologies (Topology–1, Topology–2, and Topology–3) for the CIGRE benchmark, enhancing DC resource utilization through improved power sharing between the AC and DC networks, and superior voltage/current regulation.
Proposed a 24-h load profile specifically tailored for AC/DC distribution networks.
Implementation of a decentralized droop-based control strategy with plug-and-play capability, which minimizes communication infrastructure dependency and enables the flexible addition or removal of components without system reconfiguration.
Comprehensive evaluation under realistic 24-h varying load scenarios, confirming enhanced voltage and current regulation, and improved system resilience.
The full reproducibility of the Python-based PyDAE implementation facilitates further research and development on AC/DC distribution networks.
Collectively, this paper proposes AC/DC CIGRE topologies and demonstrates their ability to improve voltage and current control in low-voltage distribution networks by effectively utilizing VSCs and the droop approach. These capabilities are validated through the proposed 24 h load profile simulations, which examine performance under varying operating conditions.
2. AC/DC CIGRE Modified Network Model
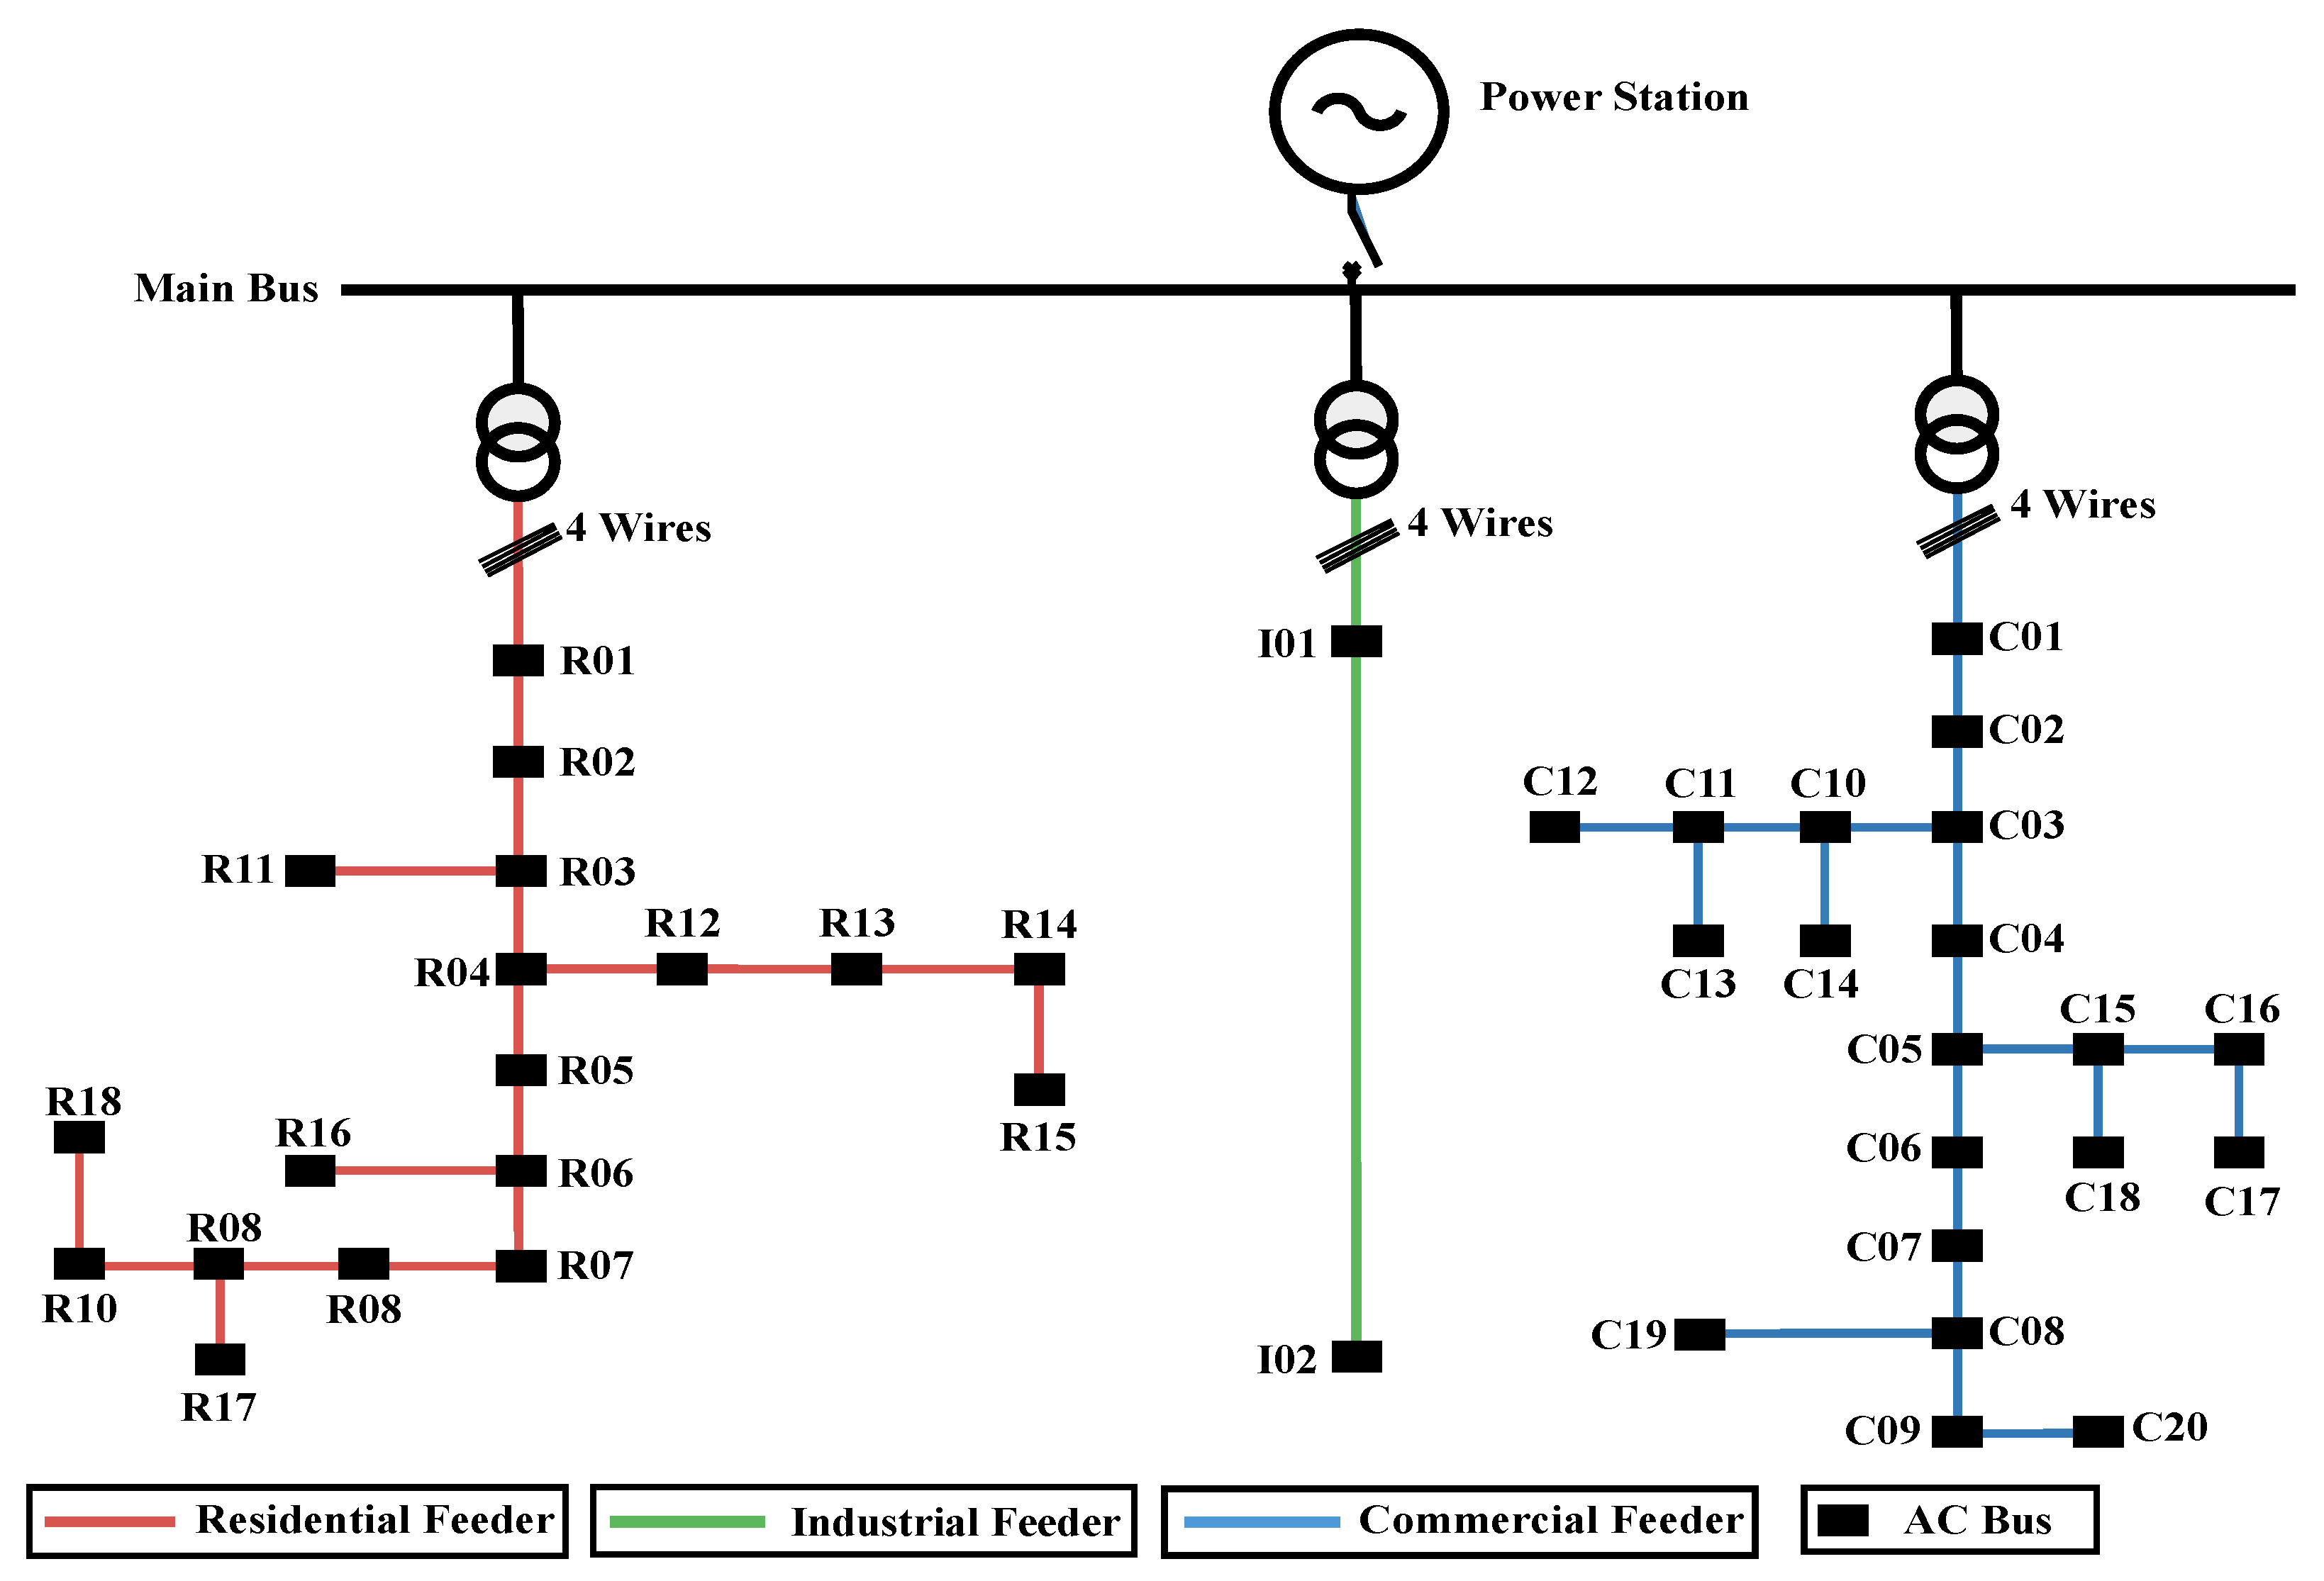
The CIGRE European low-voltage benchmark network serves as the foundation for the development of three hybrid AC/DC topologies. This section details the network parameters, line characteristics, and the structural modifications introduced in each topology. The network consists of three feeders supplying three types of loads (Residential (RES), Industrial (IND), and Commercial (COM)), as shown in
Figure 1 [
11].
The original CIGRE LV network comprises three radial feeders supplying distinct load types:
Residential feeder: 18 buses (R01–R18) with loads ranging from 15–200 kVA per bus.
Industrial feeder: 2 buses (I01–I02) with a concentrated industrial load of 100 kVA at bus I02.
Commercial feeder: 20 buses (C01–C20) with loads ranging from 8–120 kVA per bus.
Each feeder is supplied by a 20 kV/0.4 kV transformer connection with identical short-circuit impedances (
,
). The AC network parameters follow the standardized CIGRE European low-voltage benchmark and are detailed in [
11], while the technical parameters of the proposed DC grid are summarized in
Table 1.
The hybrid topologies integrate an 800 V DC network using VSCs to interface with the AC system. The DC network utilizes UG cables with R = 0.162 Ω/km and a current rating of 300 A.
The network was modeled and simulated using PyDAE in Python (version 3.10.9). The CIGRE LV network was configured using JSON files specifying bus locations, line impedances, transformer parameters, and control settings. This platform enables dynamic simulation of hybrid AC/DC systems with embedded control strategies, facilitating comprehensive performance evaluation under the proposed varying load conditions. The main parameters of the CIGRE LV benchmark used in this study are summarized in
Table 2.
Prior studies have shown that the DC interlinks can improve voltage profiles and facilitate renewable integration in distribution systems [
23,
24]. This work adapts these principles to the low-voltage level, proposing robust LV AC/DC topologies.
The proposed topology modifications for the CIGRE European low-voltage benchmark were as follows:
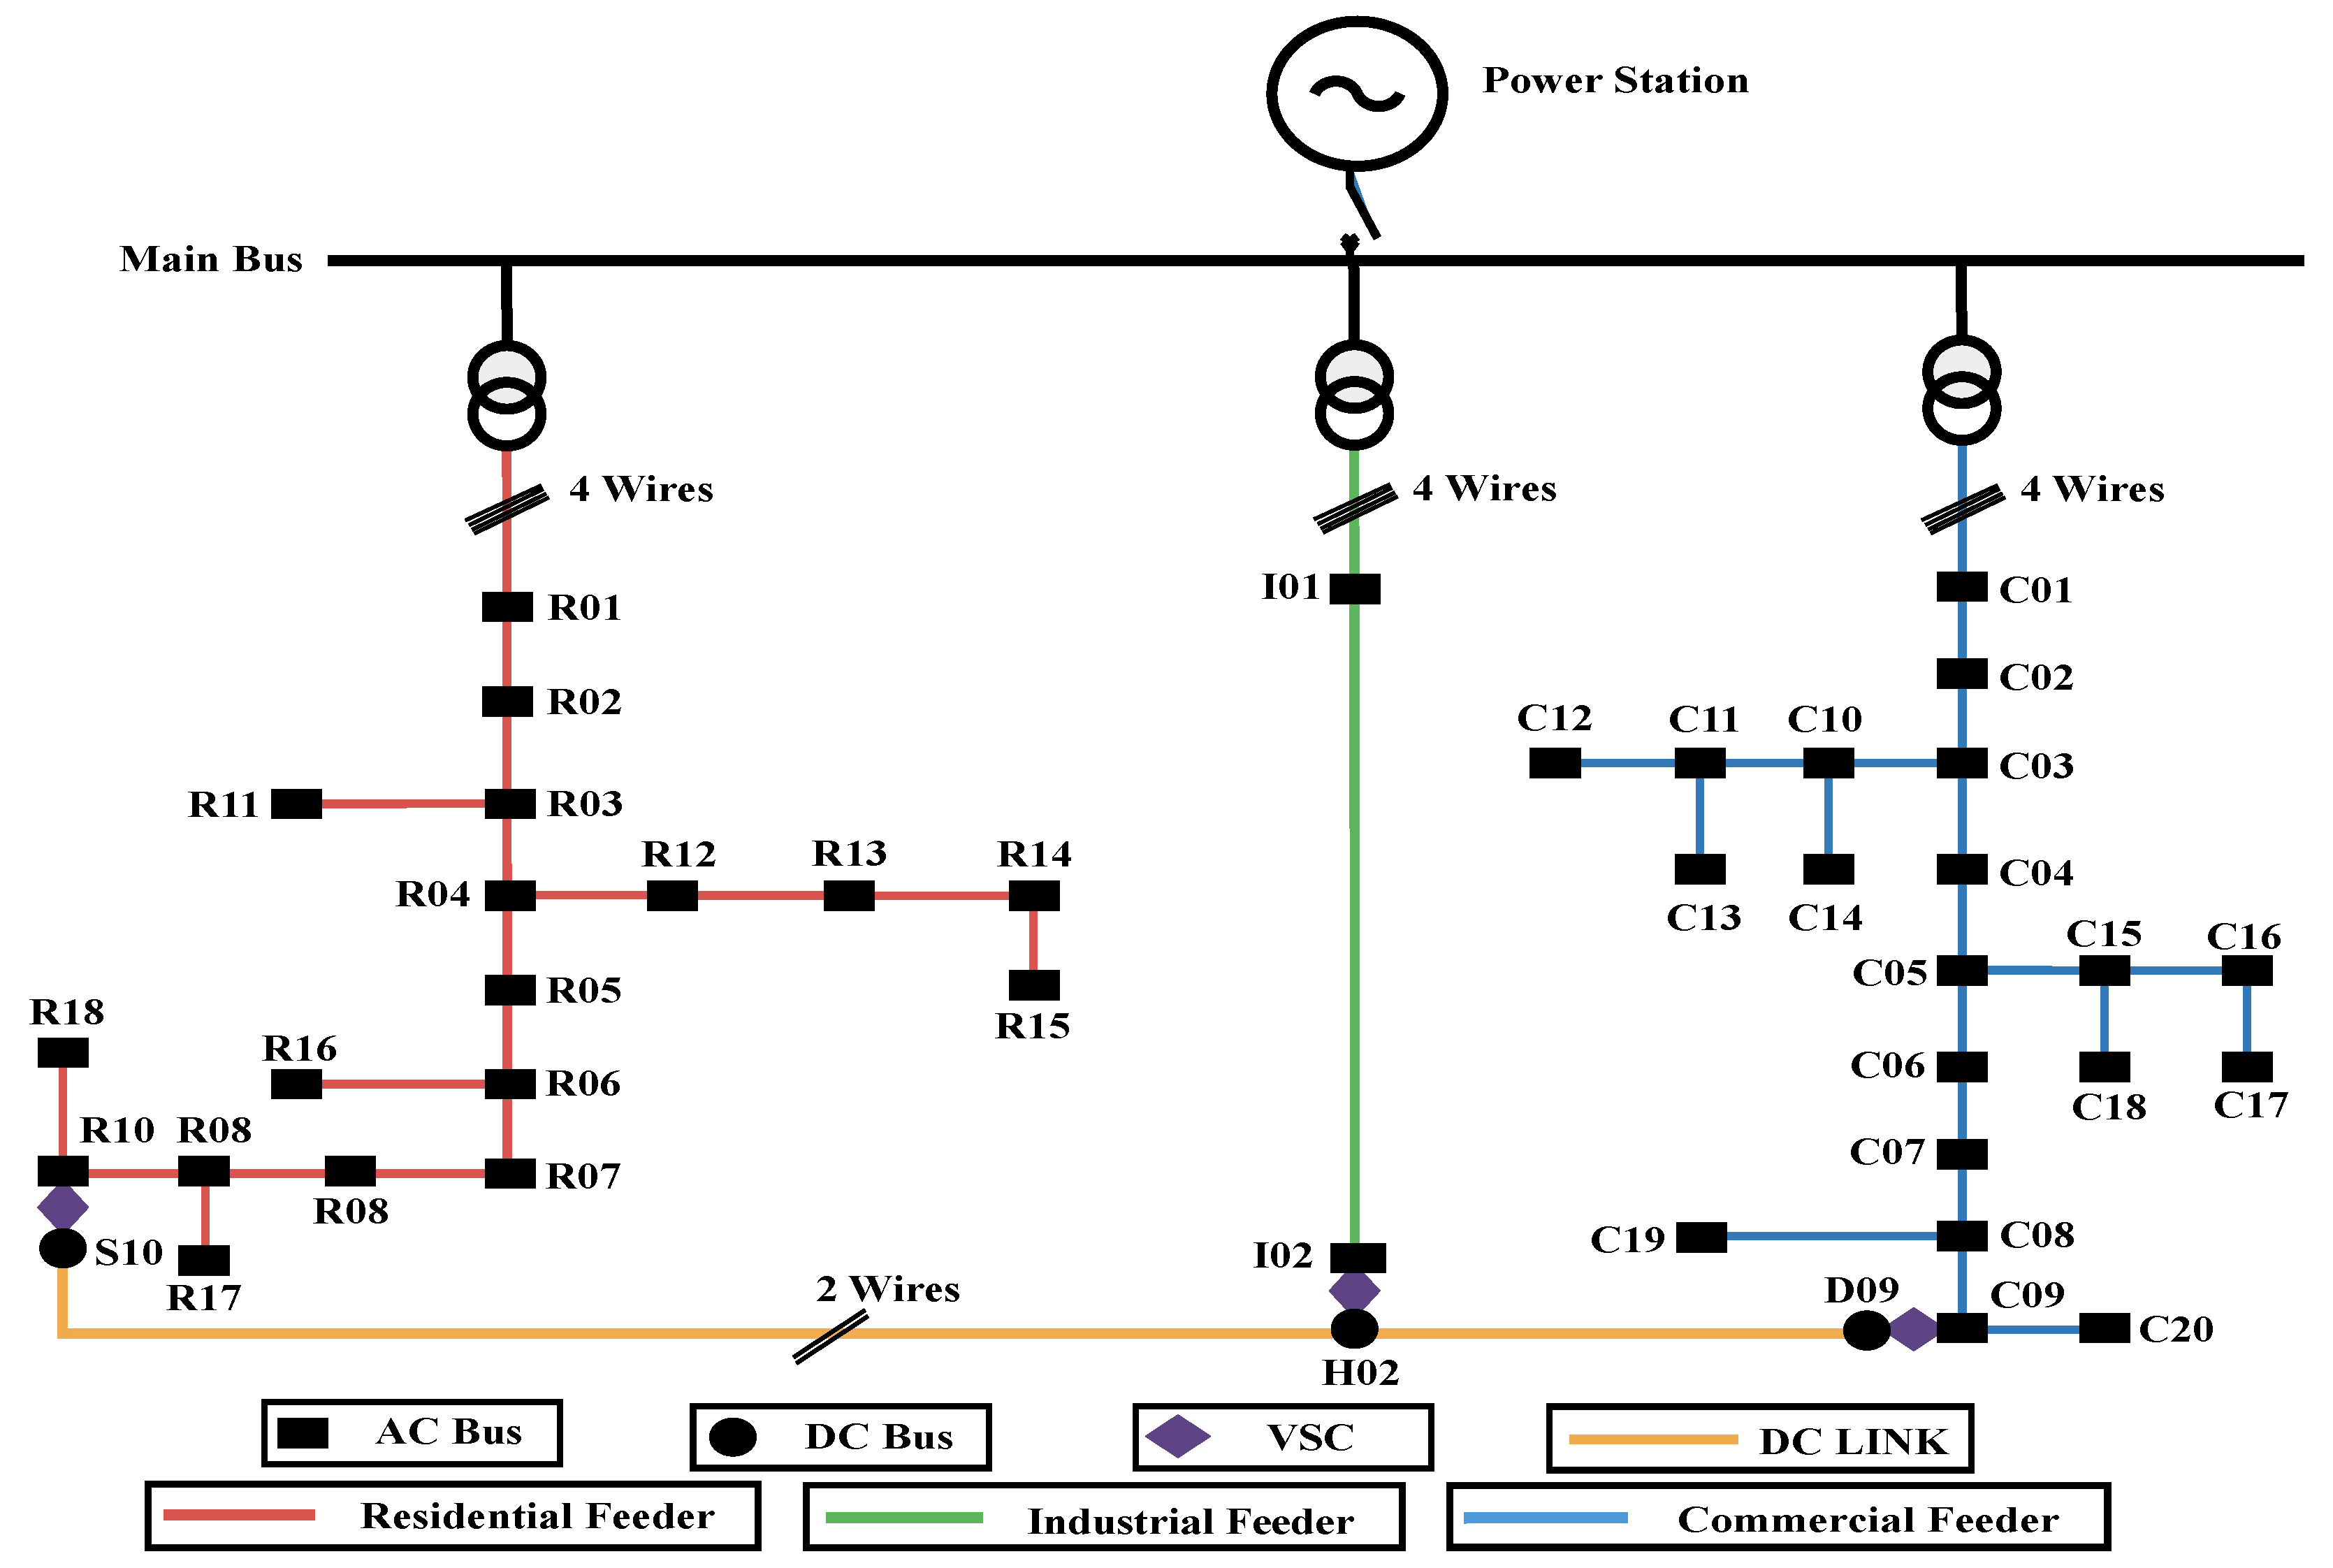
Topology–1: A minimal hybrid configuration where a single DC line is added at the end of each feeder, interfaced through three VSCs located at buses R10, I02, and C09 (one per feeder), named AC/DC CIGRE Topology–1 as shown in
Figure 2.
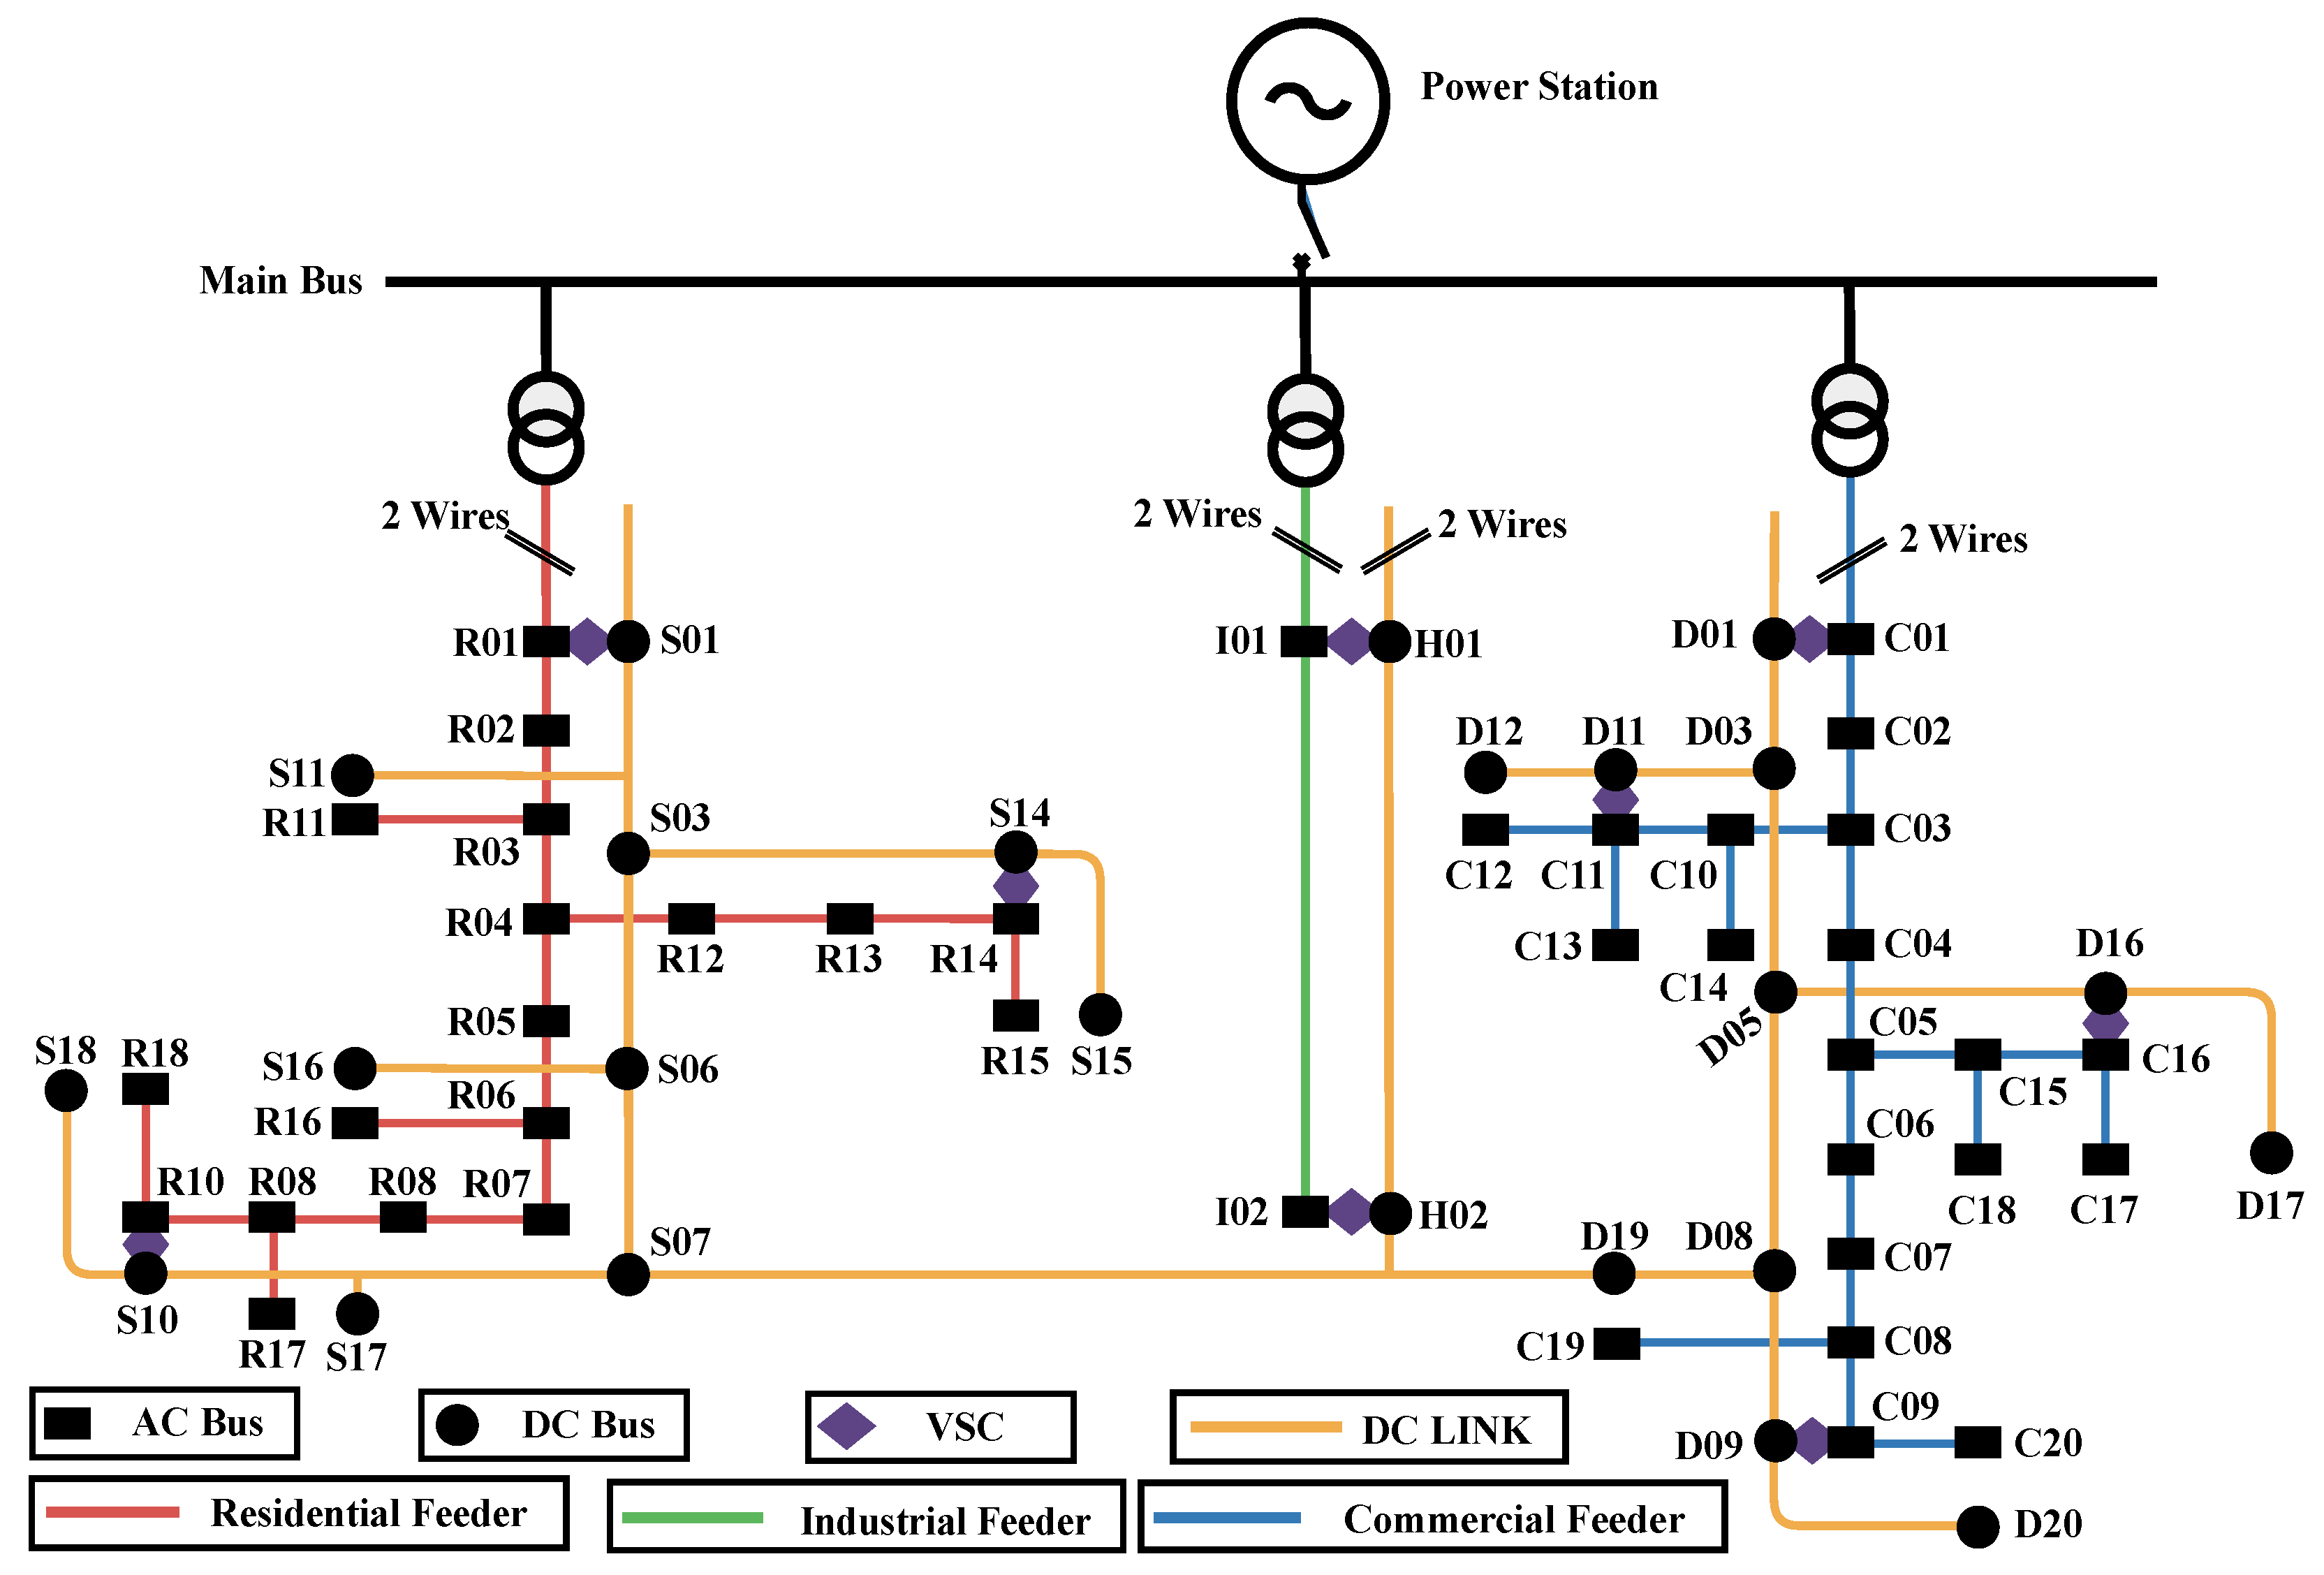
Topology–2: A mixed-wiring configuration that reuses the existing four-wire low-voltage feeder, where one phase conductor and the neutral are assigned to single-phase AC operation, and the remaining two conductors are reconfigured for DC transfer, enabling hybrid operation without adding new physical cables as shown in
Figure 3. It is not designed to directly supply three-phase industrial loads; three-phase loads should be supplied via local three-phase conversion interfaces.
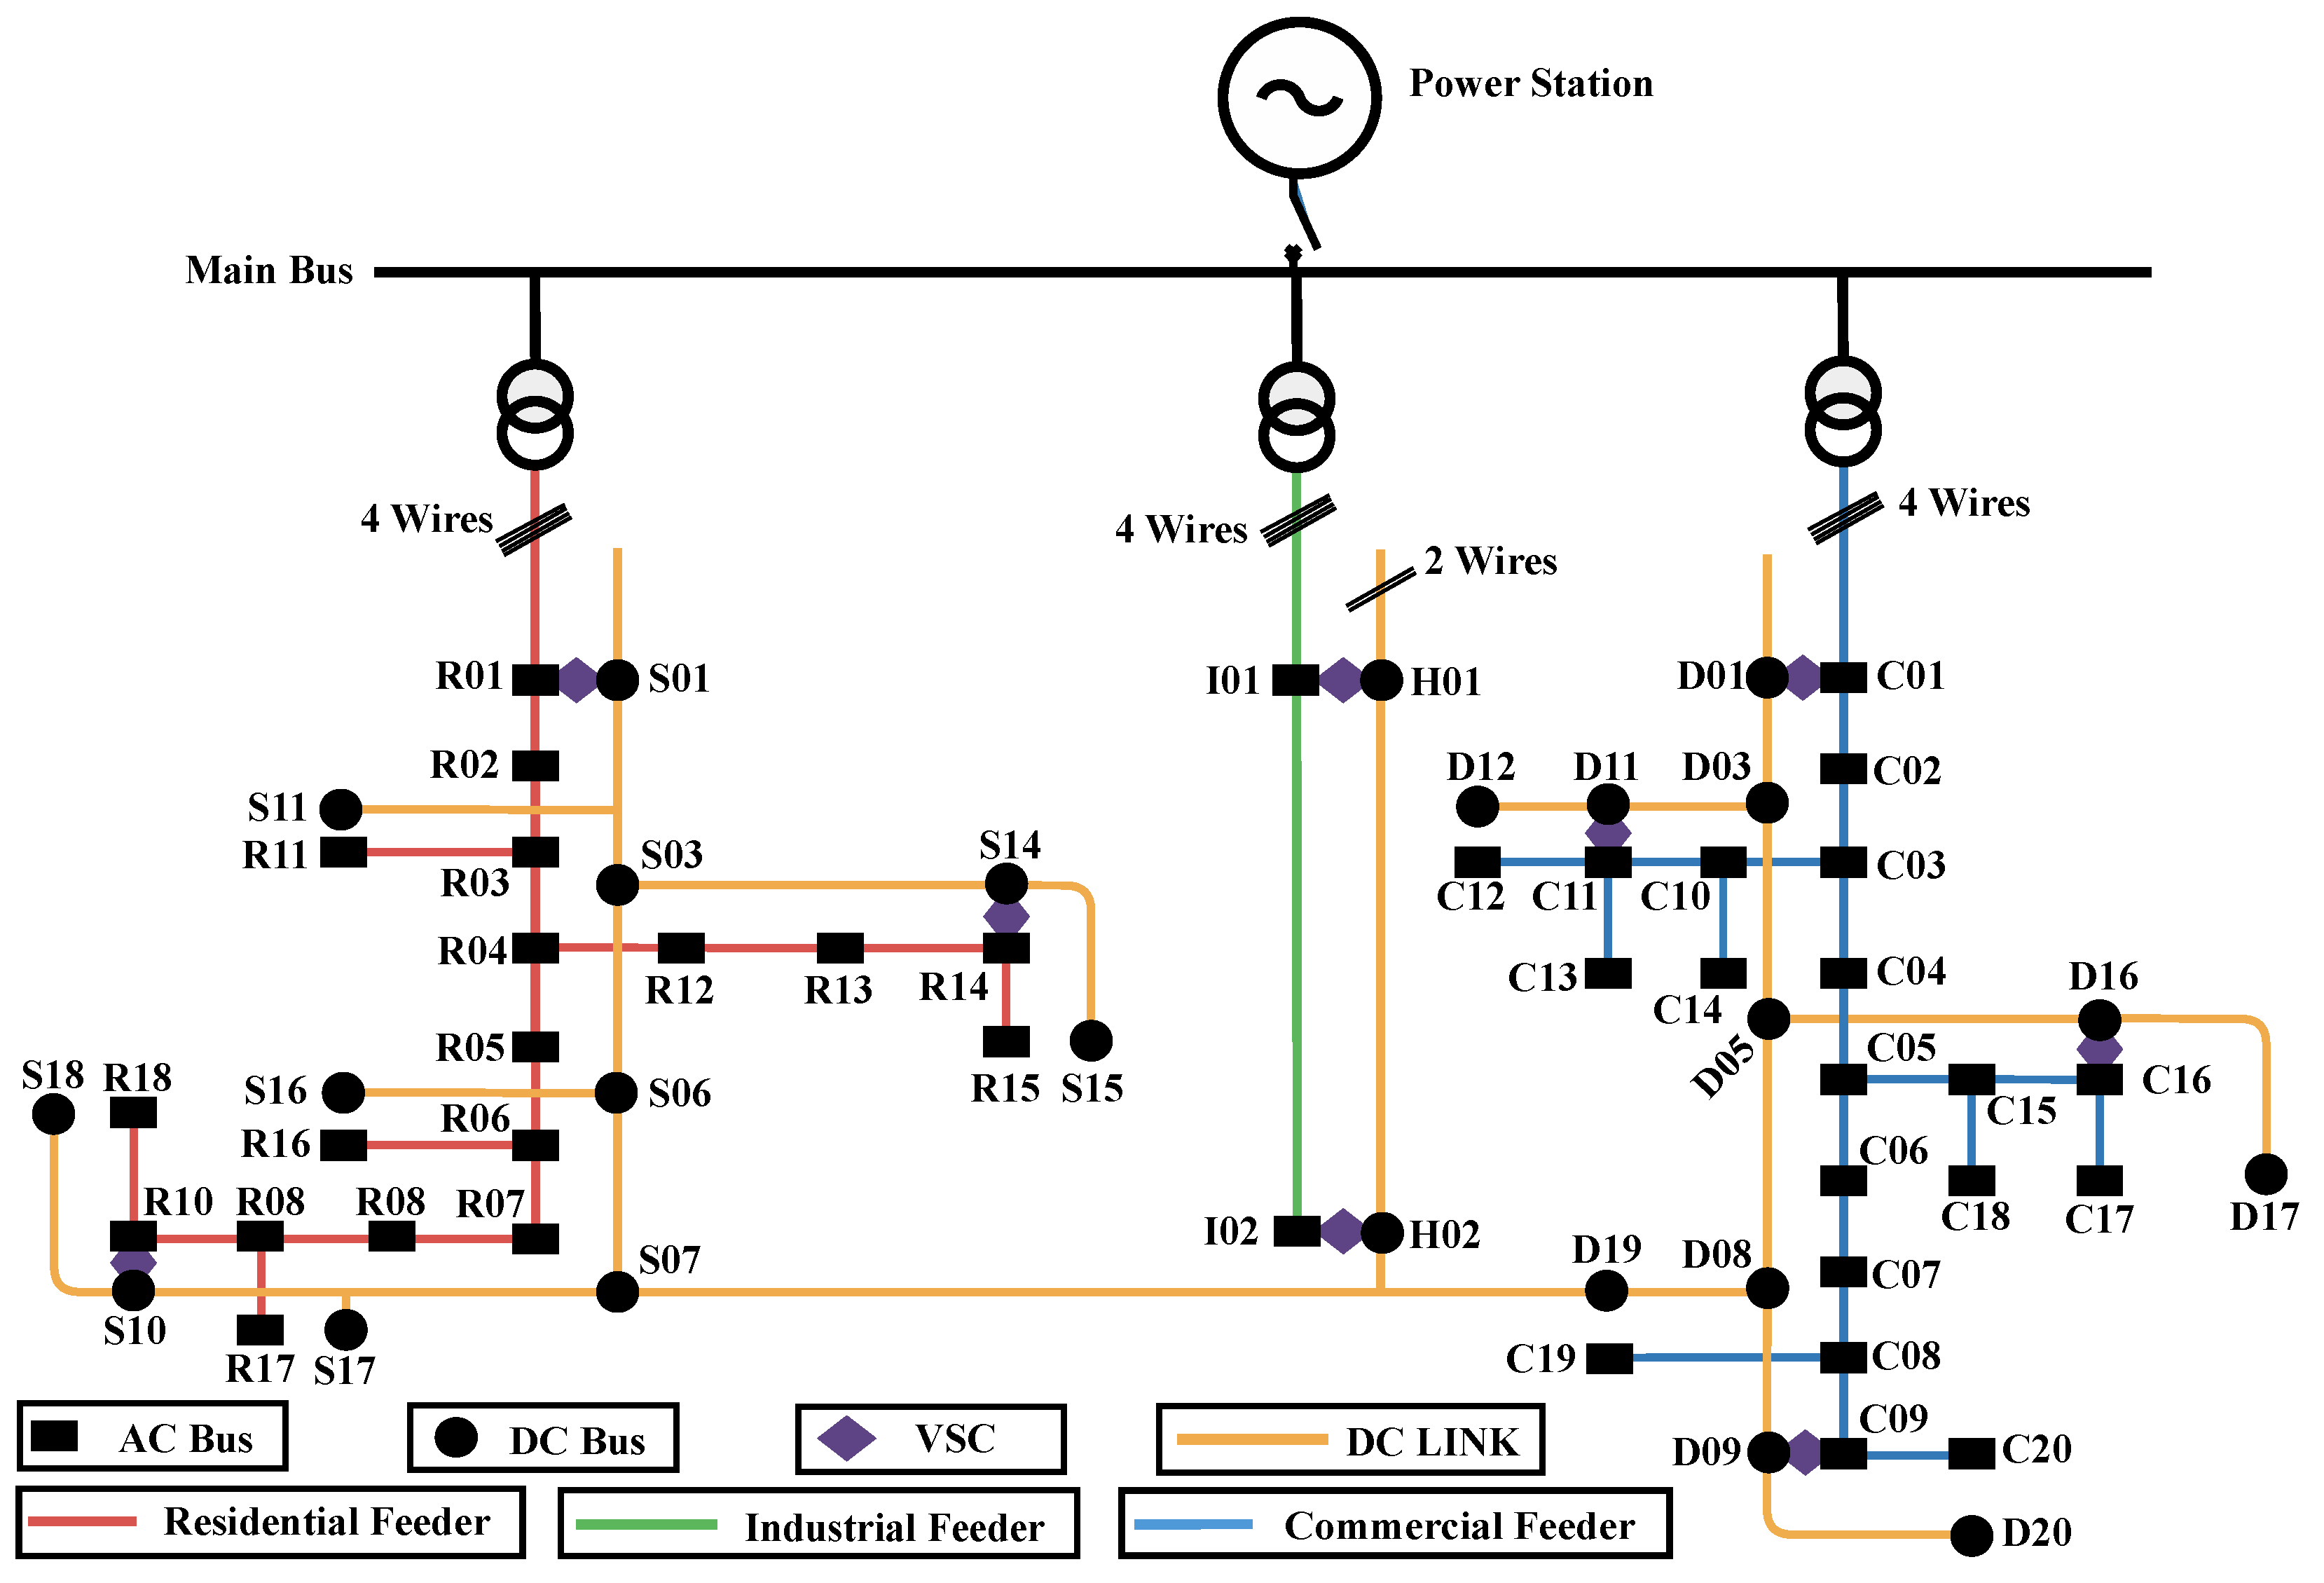
Topology–3: A fully hybrid AC/DC configuration in which the entire DC grid is installed in parallel with the existing AC feeders. Nine VSCs are strategically placed to interconnect both networks, providing enhanced voltage control and flexible power sharing as shown in
Figure 4.
In Topology–1 and Topology–3, all VSCs employ three-phase converters with a DC link and implement droop-based control, with the droop coefficient tuned empirically to ensure stable operation across loading conditions. In contrast, Topology–2 uses single-phase VSCs.
The proposed hybrid AC/DC topologies address different low-voltage distribution applications. Topology–1 targets low-cost LV networks where partial current relief at feeder ends is sufficient and DC integration and voltage support are limited. Topology–2 is intended for transitional retrofit scenarios that reuse existing four-wire feeders, but its applicability is restricted under high or rapidly varying loads and is mainly suitable for single-phase AC and DC loads. In contrast, Topology–3 is designed for future LV networks with AC overloading and high DC penetration, incorporating distributed power-electronic interfaces and stringent voltage and current regulation requirements, where enhanced controllability and operational robustness may justify higher infrastructure investment. The proposed benchmark topologies are primarily intended for topology-oriented and time-domain performance evaluation of hybrid AC/DC low-voltage networks under realistic operating conditions. Static optimal power flow, protection studies, and detailed electromagnetic transient analyses are not the main emphasis of this work. Moreover, the proposed topologies differ in their maximum transferable power capability by design:
Topology–1 maintains the same maximum AC power transfer capability as the original network, with DC integration limited to localized support at feeder ends.
Topology–2 reduces the maximum AC power transfer compared to the original three-phase configuration; this limitation reflects its role as a transitional retrofit benchmark targeting single-phase residential and DC-oriented loads rather than high-power industrial applications.
In Topology–3, the parallel DC network operates as an auxiliary subsystem and does not replace or downgrade the AC system. Therefore, the original three-phase AC power transfer capability of the CIGRE LV benchmark is fully maintained in Topology–3. Meanwhile, operational flexibility and voltage/current regulation margins are enhanced through DC integration.
3. Proposed Load Profiles
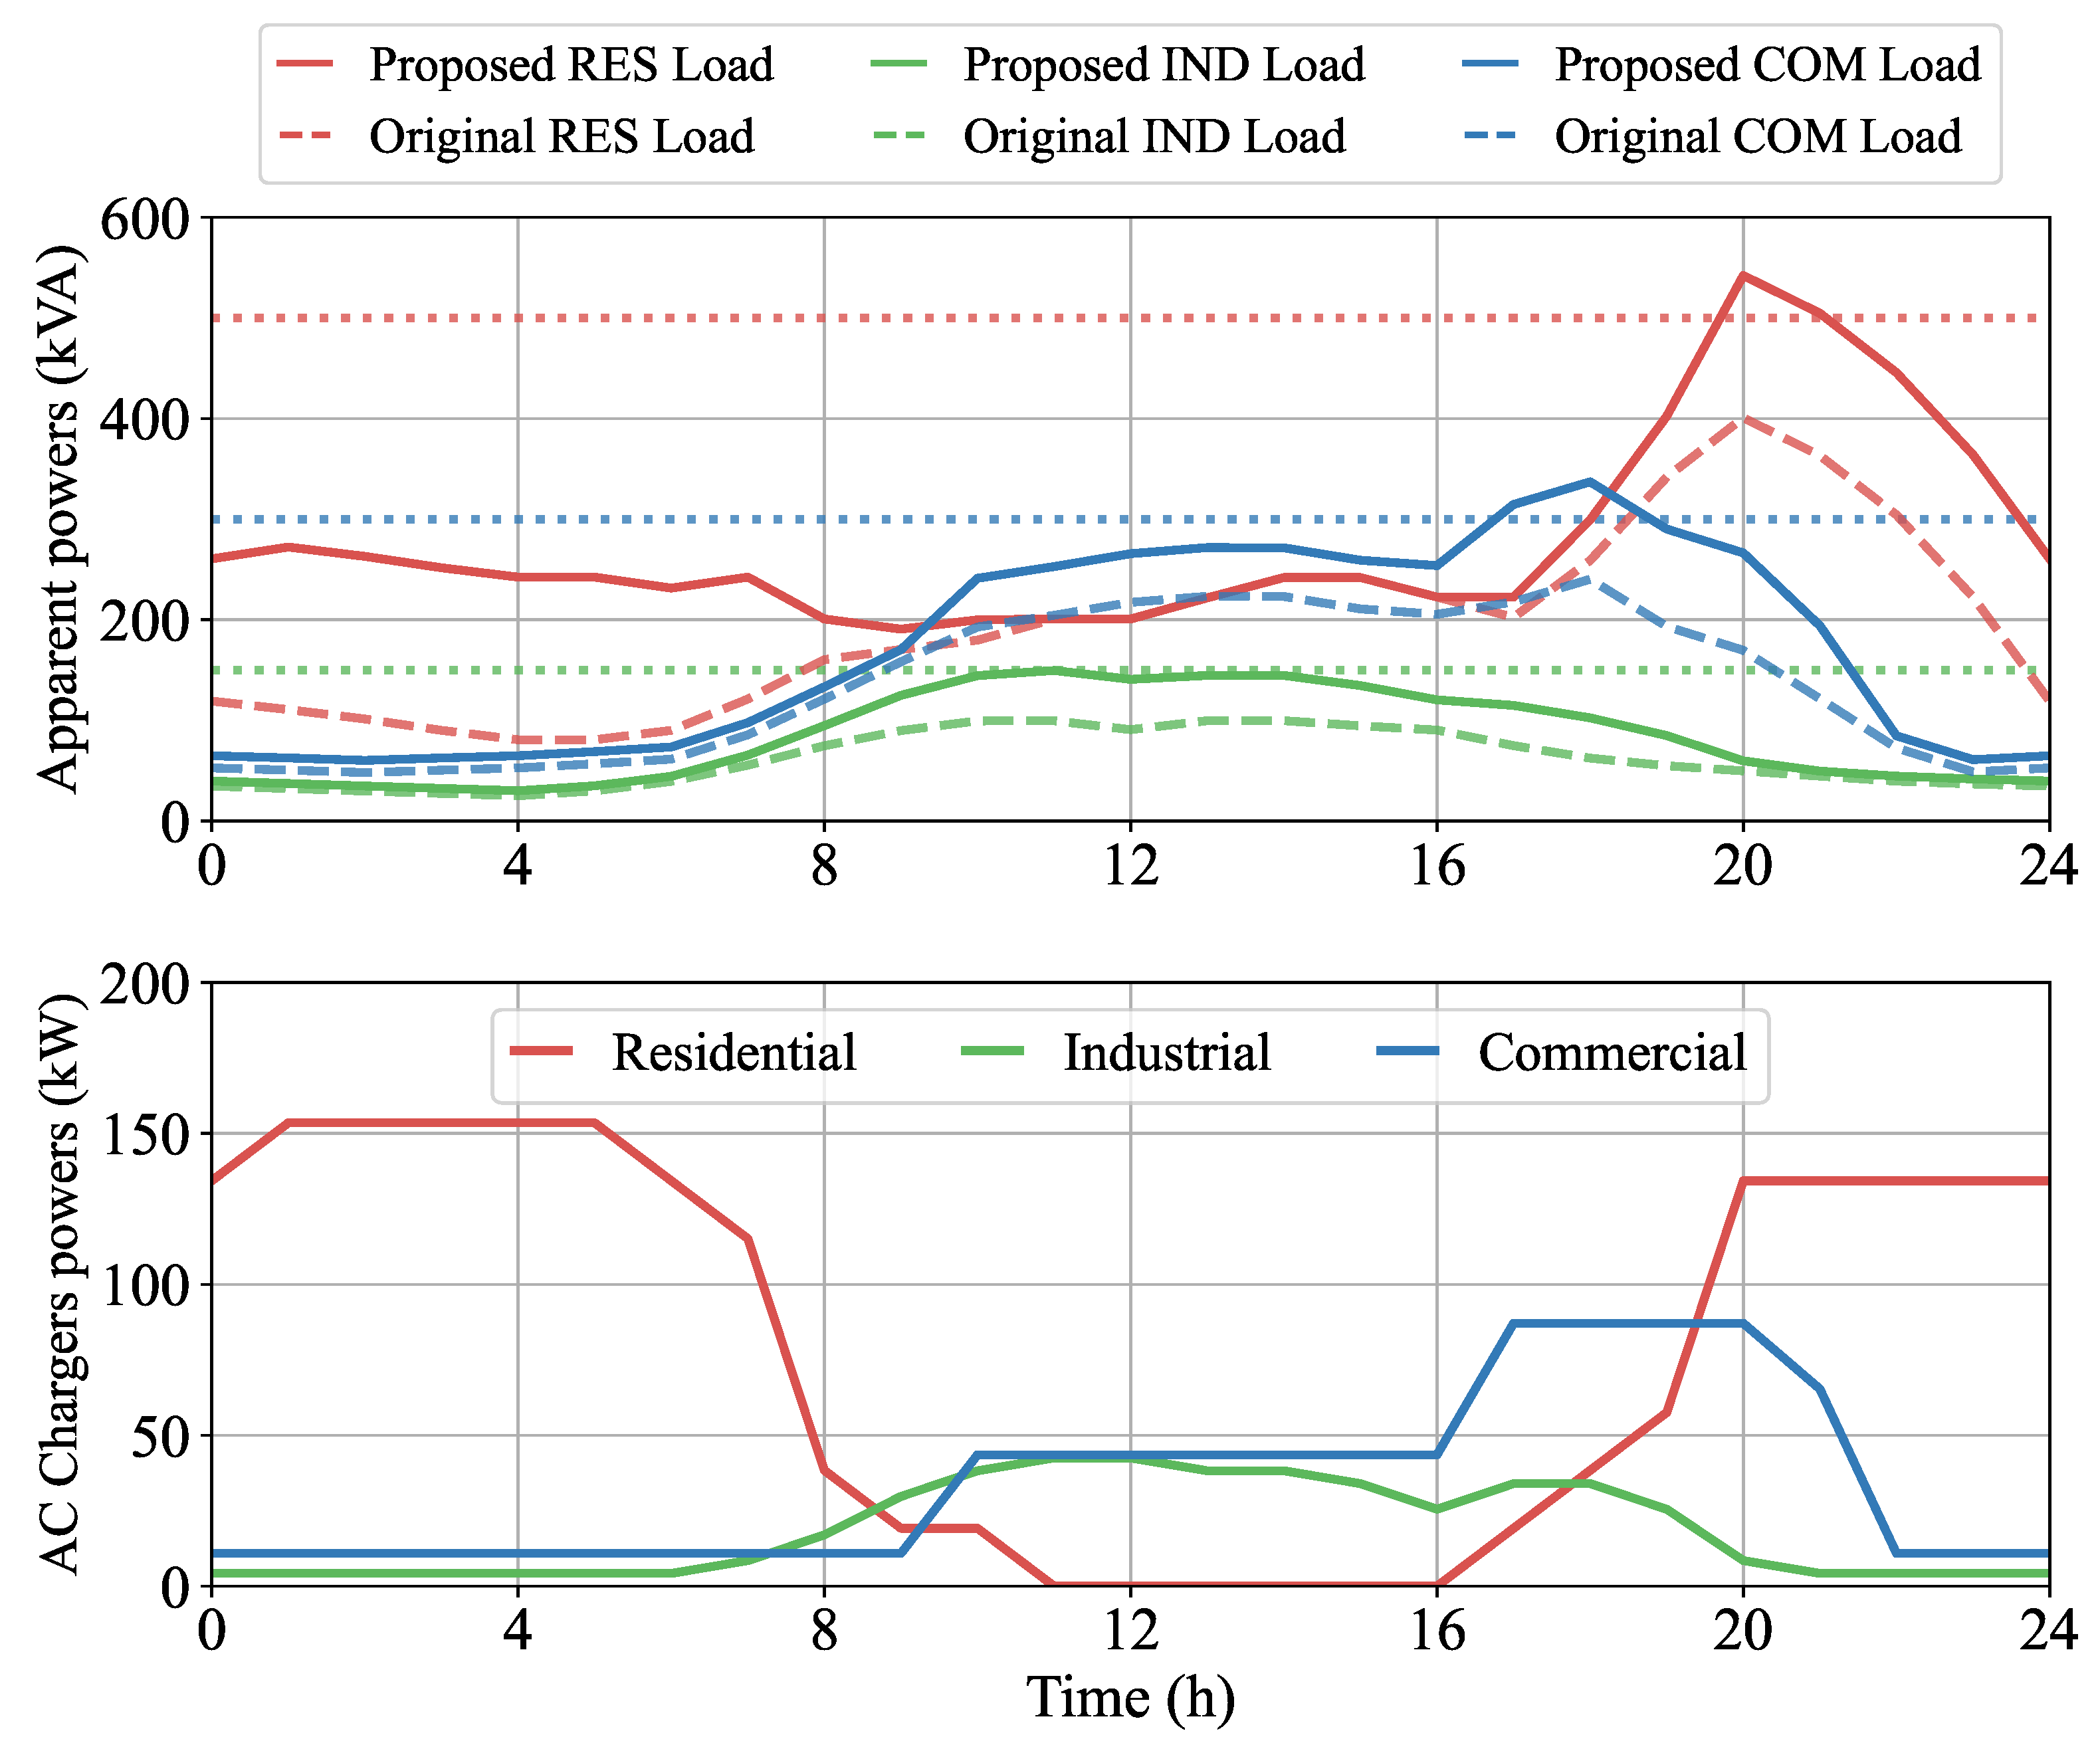
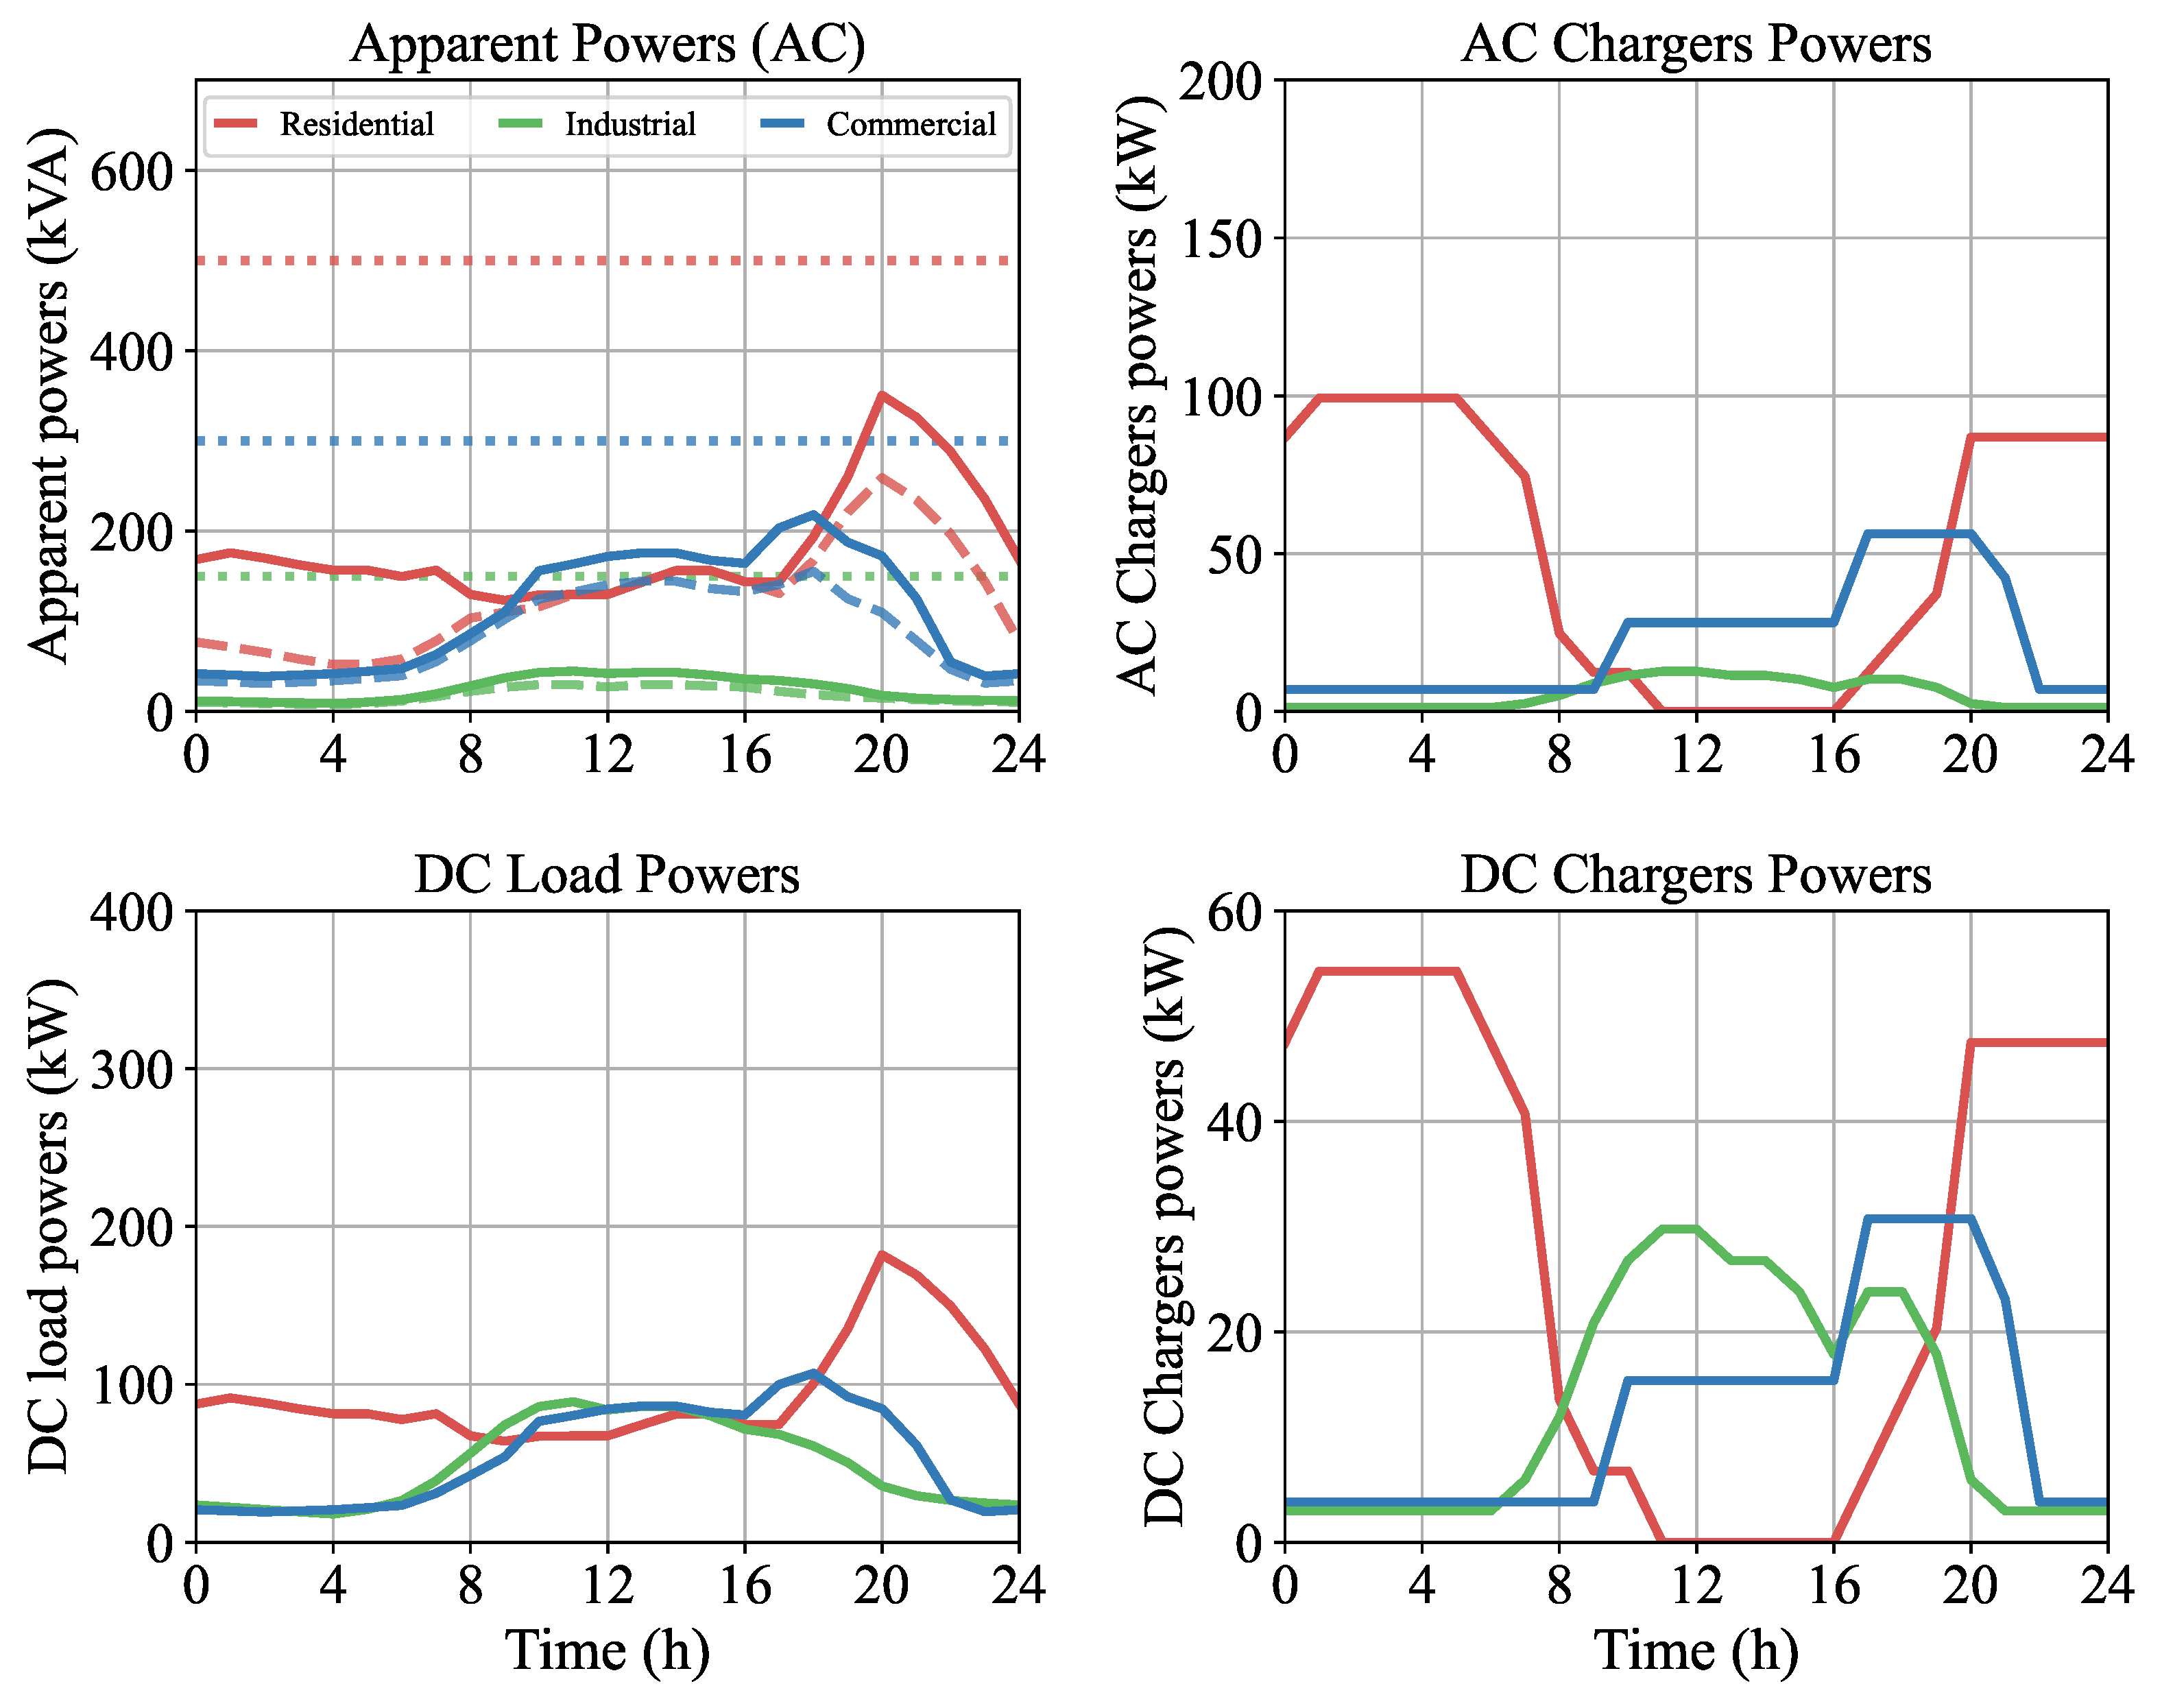
The evaluation of the proposed hybrid topologies employed two 24-h load profiles, illustrated in
Figure 5 and
Figure 6. The load profiles considered in this study are derived from the standardized CIGRE benchmark and not from site-specific measurements, in order to systematically induce critical stress conditions, as follows:
Load–1: AC Stress Profile: Characterized by the integration of additional AC load demand, this profile induces significant overloading on the AC network, thereby validating the necessity of DC infrastructure support for voltage and current regulation.
Figure 5 illustrates the original load as reported in [
11], along with the proposed load for each feeder after the addition of the AC chargers.
Load–2: High DC Penetration Profile: This profile maintains the aggregate load level of Load–1, while 70% of the load points (including chargers) are reassigned to the DC network, resulting in 30% of the total active and reactive power being supplied through the DC network, as shown in
Figure 6. This scenario is designed to assess system performance under a high penetration of DC load integration in modernized distribution networks.
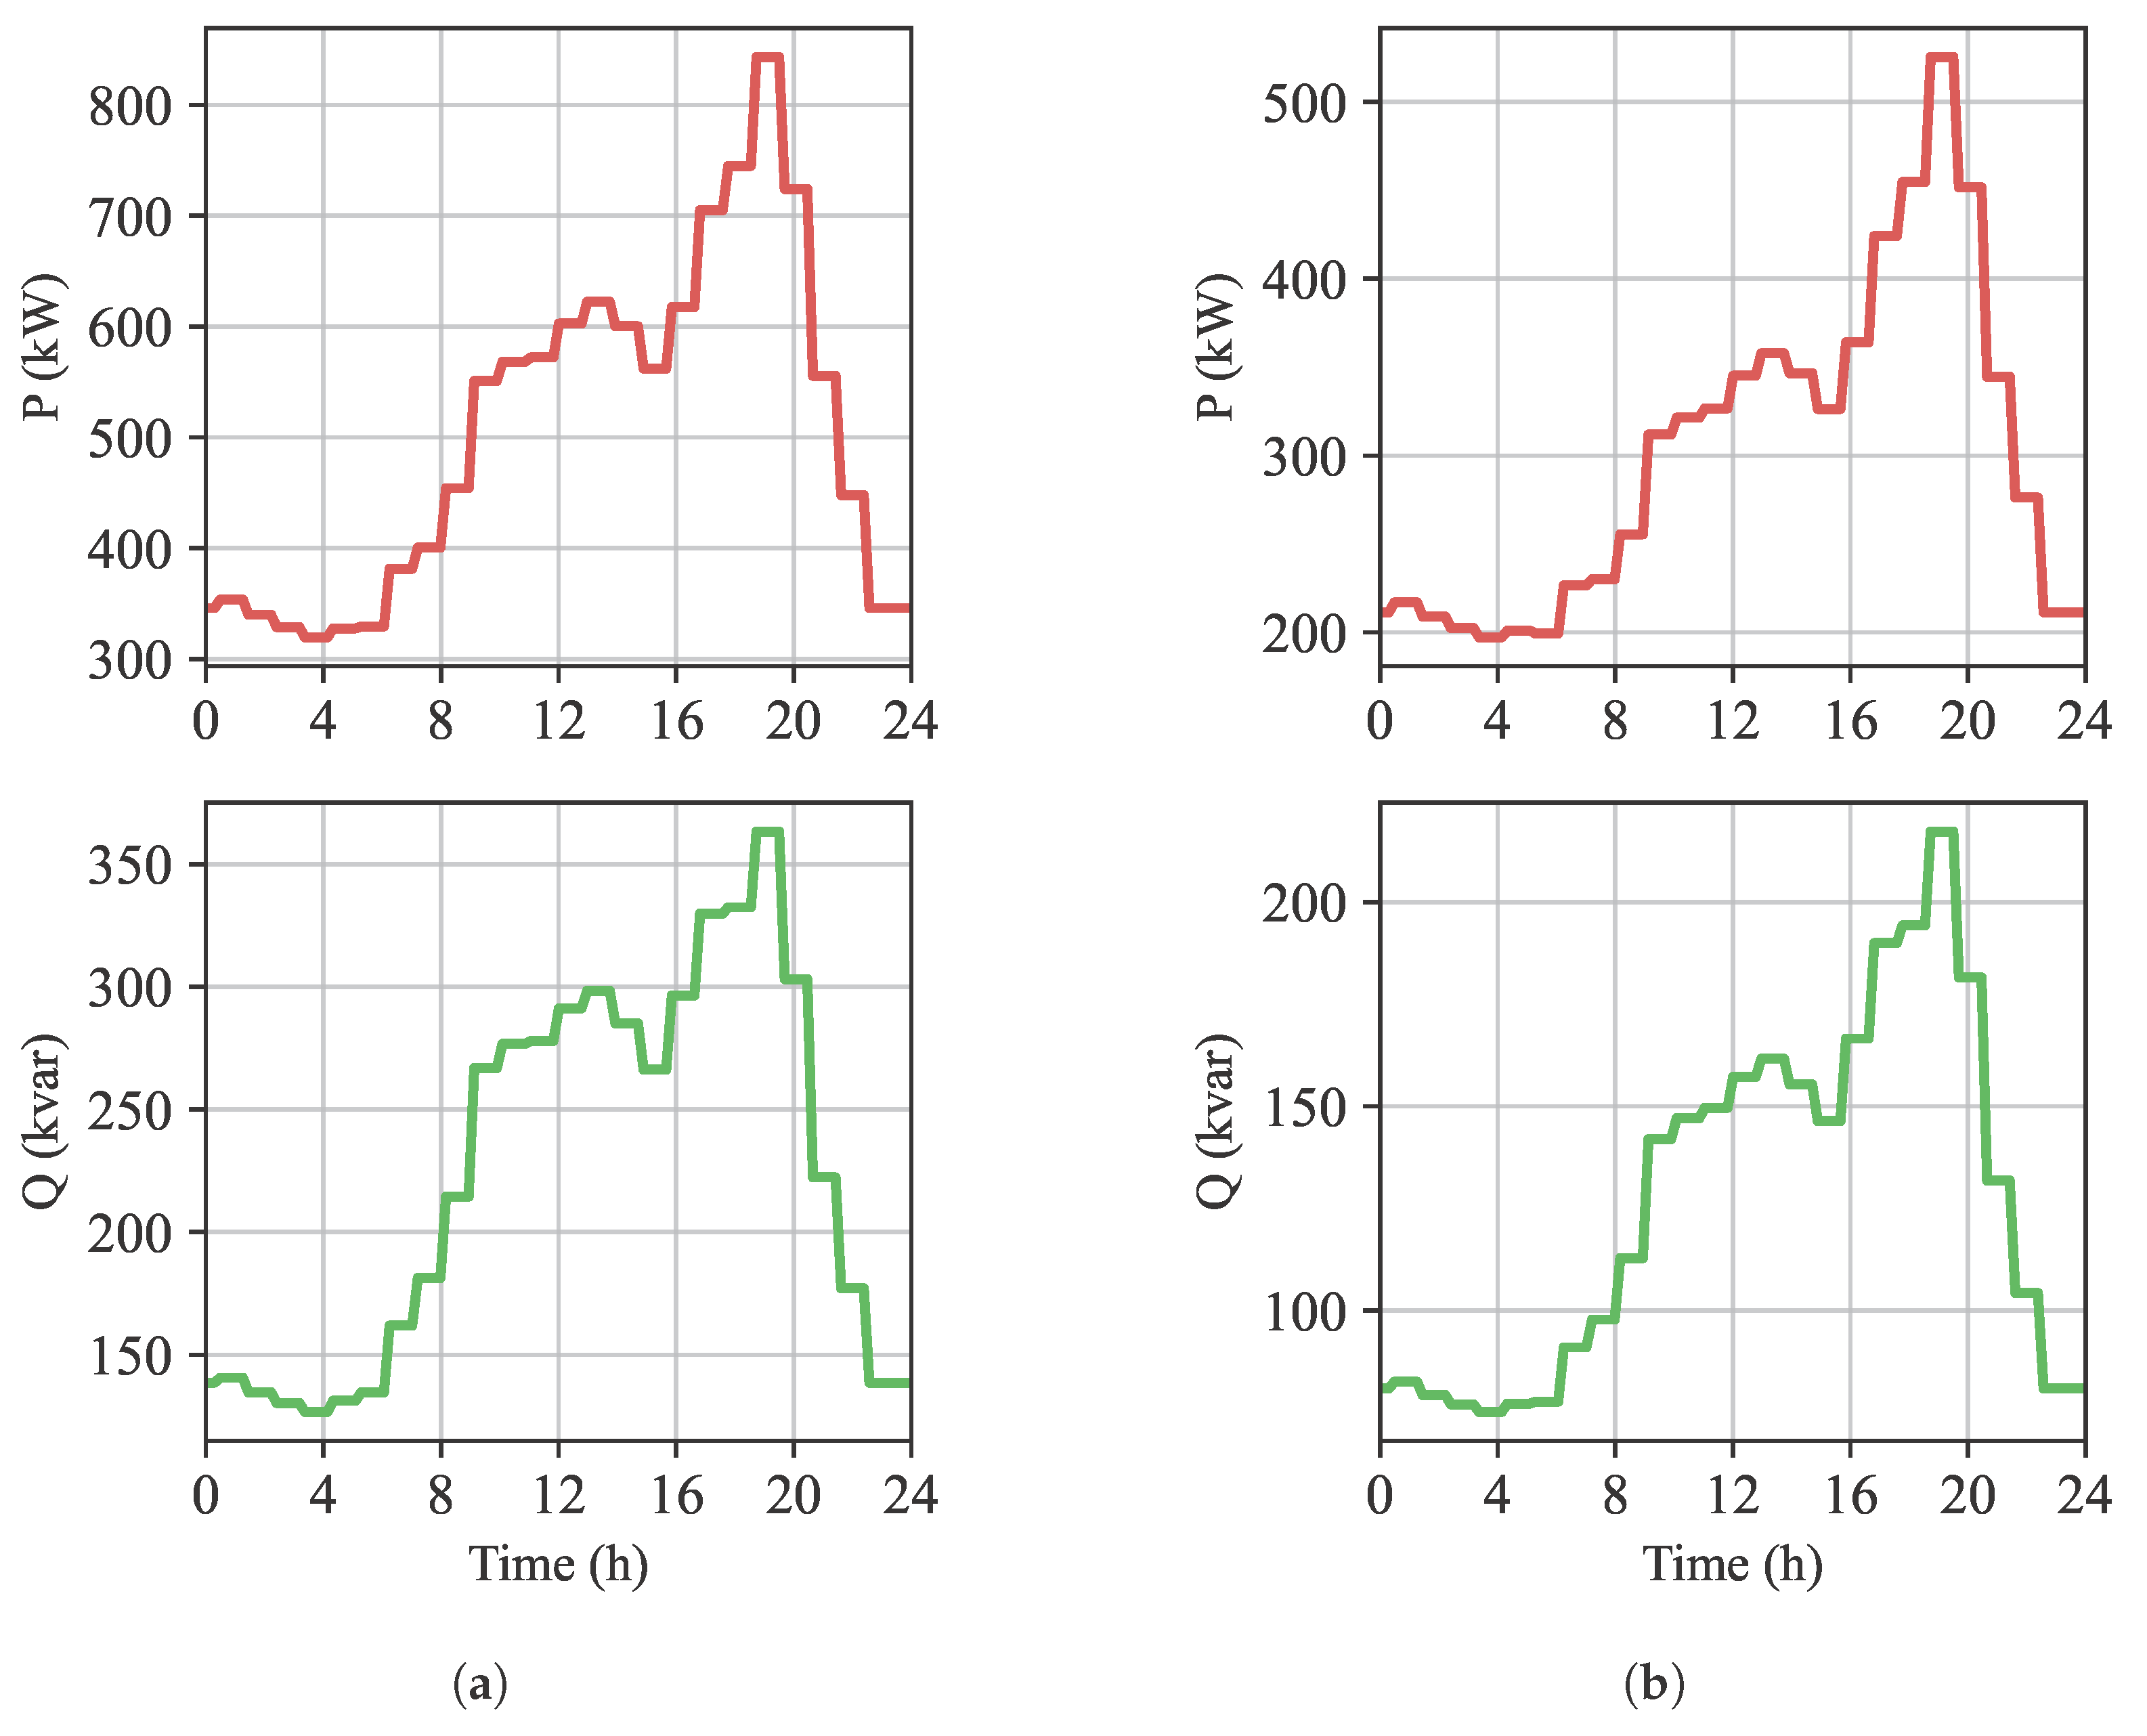
The selection of these profiles provides a comprehensive basis for evaluating the robustness of the proposed topologies against overloading and power-sharing challenges. Moreover, the active (kW) and reactive (kvar) power profiles for each scenario are presented in
Figure 7.
4. Droop Control Strategy
4.1. System Configuration and Control Architecture
The proposed hybrid AC/DC CIGRE configurations employ a simple decentralized droop-based control strategy to regulate power exchange between interconnected AC and DC buses. Only buses with VSC interfaces apply this control scheme, ensuring local voltage regulation and active power sharing without requiring any communication between feeders or buses. The purpose of including this control is not to propose a new algorithm, but to provide a consistent basis for comparing the three topologies under the defined load demands.
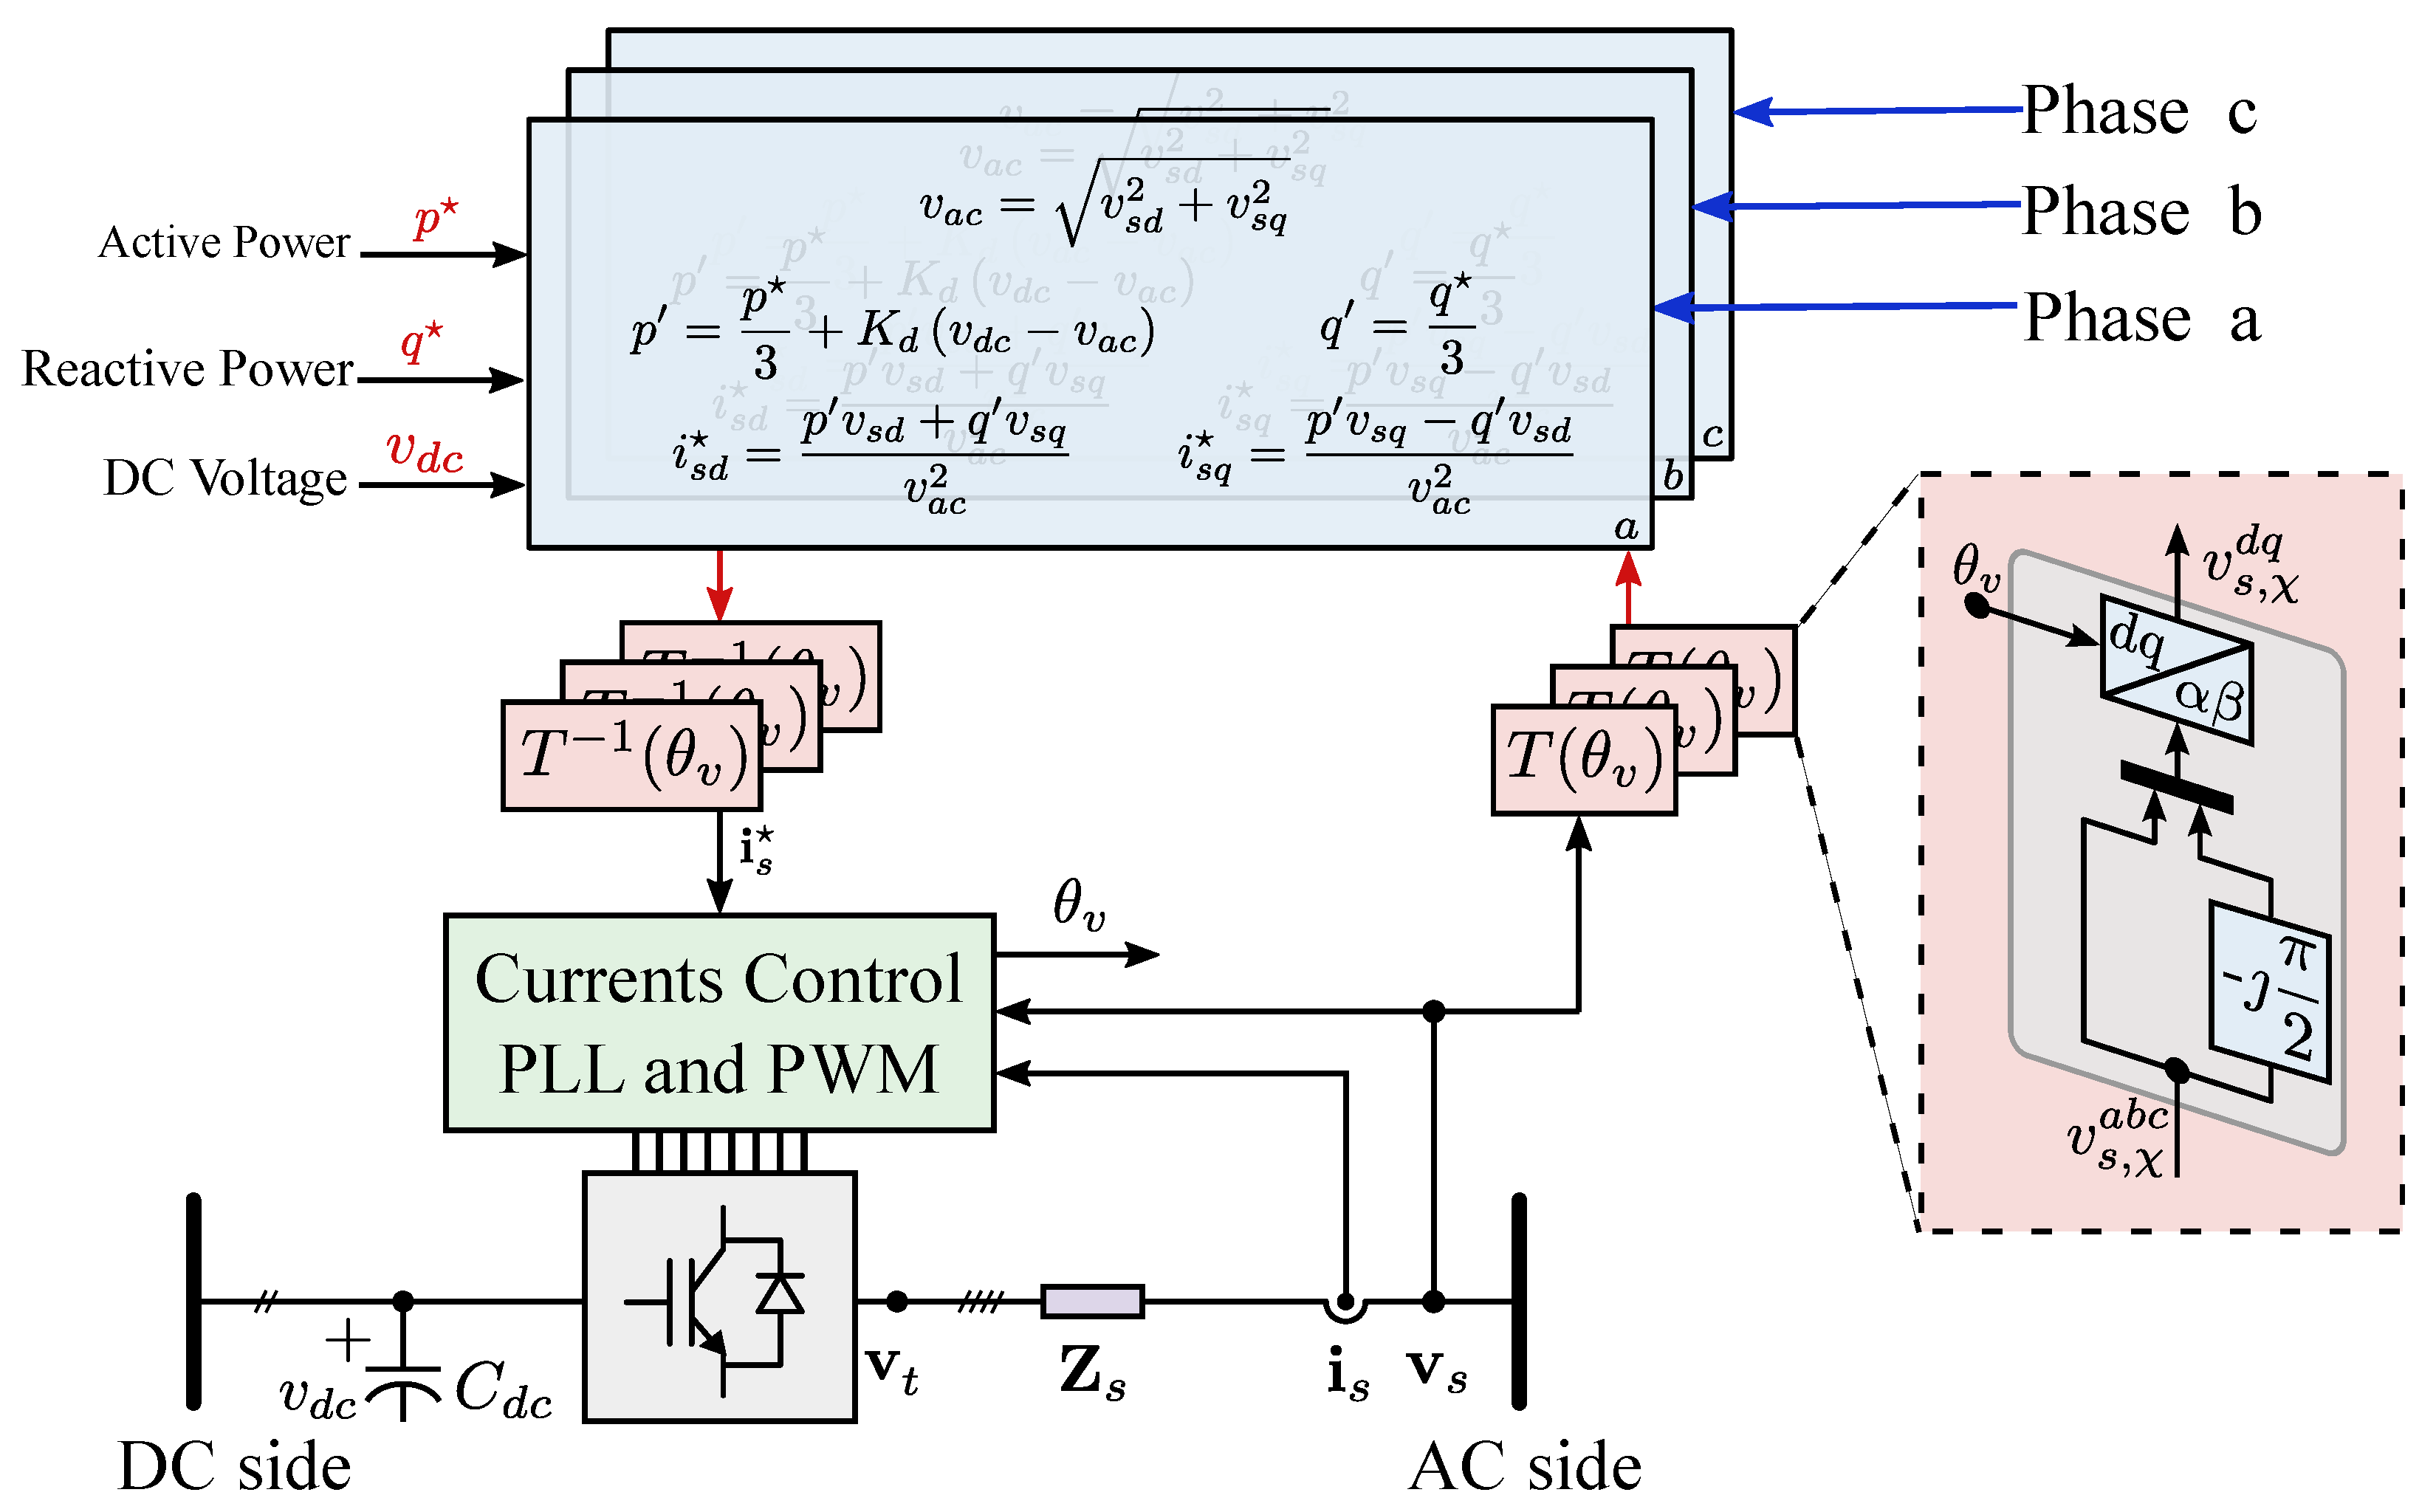
The complete droop control strategy is illustrated in
Figure 8, which shows the hierarchical control structure implemented in the hybrid AC/DC system. The droop control operates as a local controller, as opposed to centralized control schemes that require a central coordinator to regulate the power output of DGs. The droop control allows each DG to independently regulate its power output based on local measurements. While several advanced droop and adaptive strategies exist in the literature [
25,
26,
27], this work intentionally adopts a basic scheme to maintain comparability among the proposed topologies. The droop-based control is not proposed as a novel contribution; it is deliberately used as a conventional baseline to ensure a fair comparison of the proposed hybrid AC/DC topologies.
The analysis of hybrid AC/DC grids requires specialized simulation tools, such as PyFlow-ACDC [
28], which focuses on centralized optimal power flow analysis. In this work, a simplified dynamic model was developed using the Python-based PyDAE framework to evaluate the proposed topologies under decentralized droop control and 24-h load variations.
The employed control strategy in this study is a primary-level decentralized droop control. Each VSC operates based on locally simulated measurements and generates active power references through droop characteristics, which are then passed to the inner current control loops. No secondary voltage restoration, frequency coordination, or centralized control layers were implemented.
4.2. Droop Control Formulation
The droop-based control strategy in LV networks assumes that line impedances are predominantly resistive. As a result, voltage magnitudes are strongly affected by active power flows, while reactive power plays only a minor role. LV networks also experience notable phase unbalances, mainly caused by single-phase loads and DGs connected unevenly across the phases.
This work applies an active power droop strategy based on voltage. Individual active power references are adjusted on a per-phase basis to mitigate voltage deviations and improve current balance across the network.
Here, represents the total active power reference assigned to each VSC, while denotes the phase-level active power reference after droop adjustment. The droop coefficient was tuned empirically to ensure stable operation and effective power redistribution under realistic daily load variations and is kept identical for all VSCs to enable fair topology comparison.
Where denotes the measured DC-link voltage at the VSC, is the value of the local AC bus voltage, and and are the corresponding nominal (base) DC and AC voltages, respectively, used for per-unit normalization. The voltage-difference term represents the normalized AC–DC voltage mismatch that drives the active power droop response.
For simplicity, reactive power is not actively regulated through droop control in this study. Instead, the total reactive power reference
assigned to each VSC is equally distributed among the three phases.
Accordingly, the droop mechanism influences only the active power sharing, while reactive power is treated as a fixed auxiliary reference used for current computation.
The inner current-control loops and the voltage-control implementation are not detailed here; further information is available in [
29]. In this approach, each phase has its own d-q coordinate system. Then, for the given
and
references the desired d-q currents are computed as:
where
and
are the reference d-axis and q-axis current components for each phase, respectively. The variables
and
denote the measured d-axis and q-axis components of the AC-side voltage in the synchronous reference frame of the corresponding phase.
The AC-side voltage magnitude used in the denominators is computed as
In summary, the implemented droop control strategy was designed to ensure each topology maintained voltage regulation within ±5% of the nominal value (220–242 V), prevent feeder currents from exceeding their limits, and enable efficient bidirectional power transfer between the AC and DC networks.
In this study, the same decentralized droop control strategy and parameter settings are applied to all VSCs across all topologies. This common choice ensures that the comparative analysis focuses on the intrinsic impact of network topology rather than on adaptive or topology-specific control tuning. Accordingly, the objective is not to optimize or propose a new control method, but to isolate the intrinsic performance differences among the network topologies.
4.3. Simulation Model Scope and Validity
The simulations in this study are based on a dynamic phasor-domain representation implemented in the PyDAE framework. This approach captures electromechanical and power-flow-related dynamics relevant to low-voltage distribution networks over seconds to hours, making it suitable for evaluating voltage and current regulation and power-sharing behavior under daily load variations.
The objective is not to analyze fast electromagnetic transients or converter switching phenomena, but to assess steady-state and slow dynamic interactions between AC and DC subsystems under realistic operating conditions. Similar modeling assumptions are widely adopted in hybrid AC/DC distribution studies focused on system-level behavior rather than converter-level electromagnetic dynamics [
12]. Accordingly, the adopted PyDAE-based approach is sufficient and appropriate for the comparative topology assessment presented in this work.
5. Simulation and Results Discussion
This section presents a comprehensive evaluation of three proposed AC/DC CIGRE network topologies (Topologies 1–3) under the two load profile scenarios (Load–1 and Load–2) over a 24-h period to evaluate their adaptability under varying conditions. The results are presented in box plots, which provide a visual representation of the statistical distribution of feeder currents (A) and line-to-neutral voltages (V) across selected buses.
The box plots are constructed from the simulations and concisely summarize the results by illustrating the central tendency (median) and dispersion through the interquartile range (IQR). The median, represented by a horizontal line within each box, indicates the central value of the data. The box itself encompasses the middle 50% of the observations, corresponding to the IQR, while the whiskers extend to the minimum and maximum values. This representation enables a compact comparison of voltage regulation and current compliance among the proposed topologies under realistic daily variations, thus providing a clear understanding of each topology’s effectiveness and robustness.
The smart placement of DERs reduces voltage distortions [
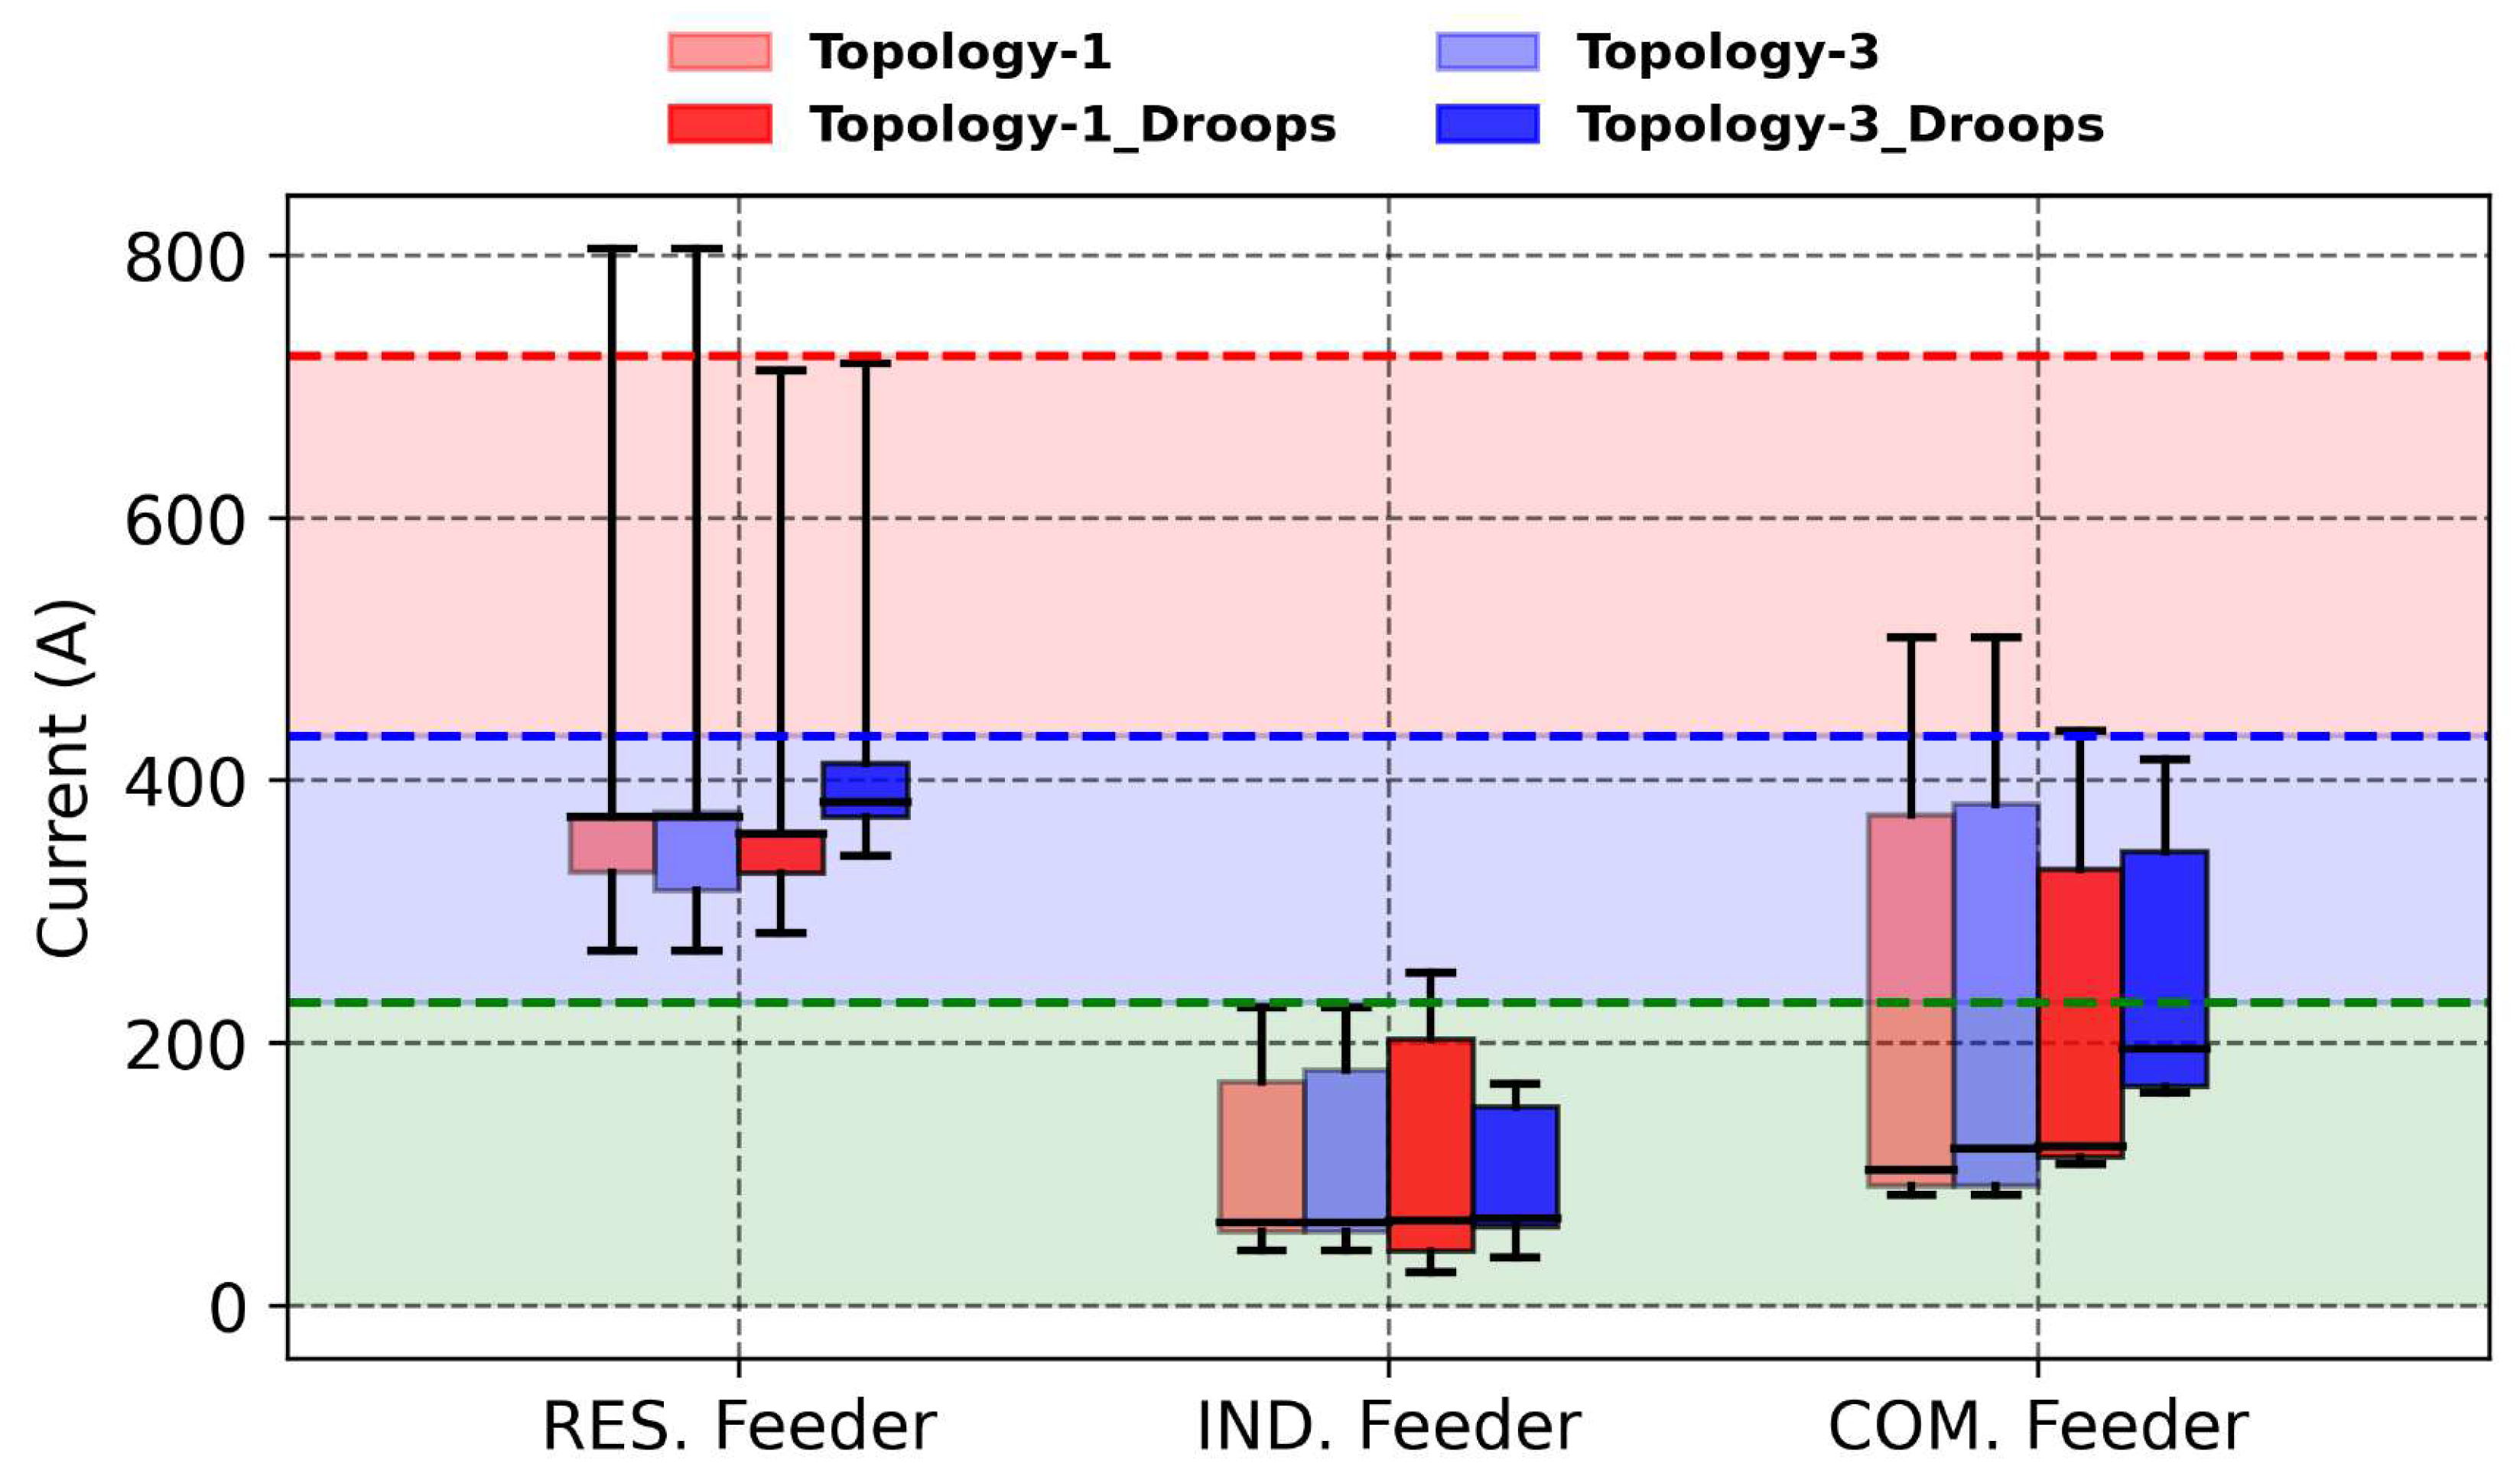
30], further supporting the adopted regulation strategy. The acceptable voltage range is 220–242 V, derived from a nominal voltage of 231 V and ±5% limits (1.05 pu upper limit and 0.95 pu lower limit). Consequently, the allowable voltage limits are clearly indicated by the green and red dashed lines in all scenarios. Additionally, the maximum current limits for each feeder are prominently displayed as dashed lines in the current figures.
5.1. Load Profile (Load–2)
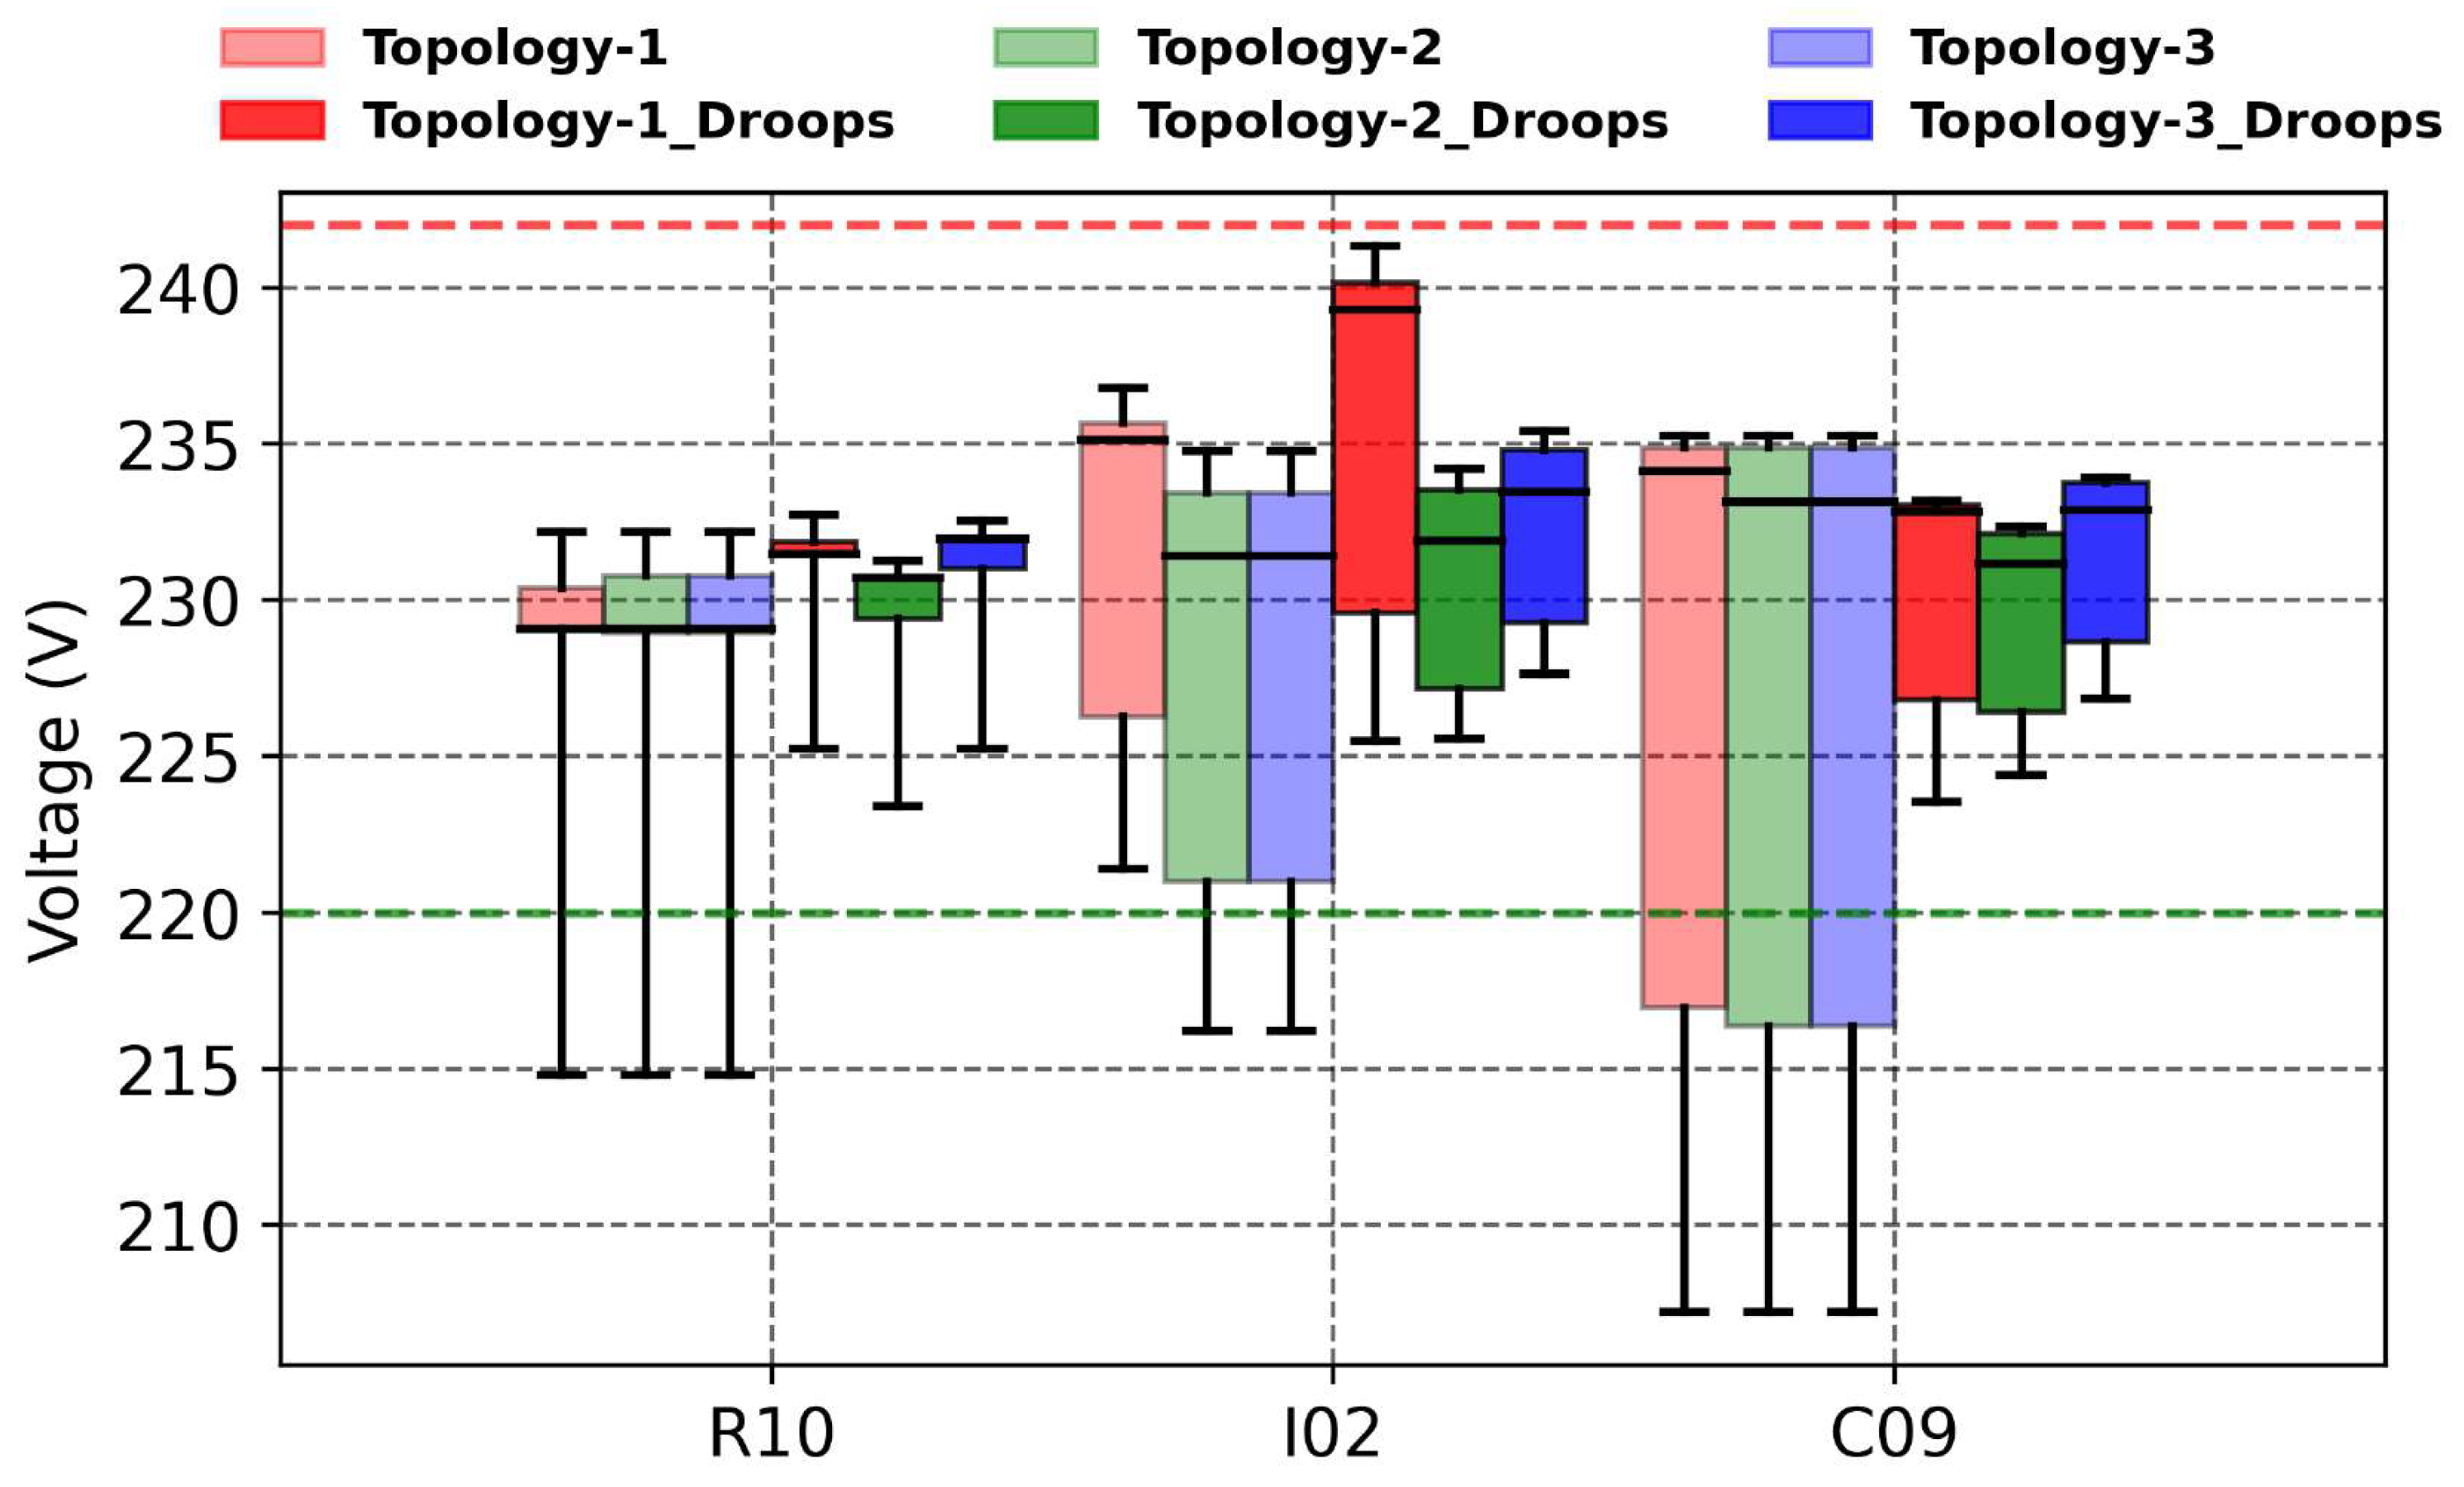
Figure 9 compares the bus-voltage distributions at R10, I02, and C09 of the proposed three topologies under the Load–2 scenario, with and without droop control. With droop control enabled, the voltages remain within the acceptable range (220–242 V) for all three topologies. In contrast, without droop control, buses R10 and C09 exhibit undervoltage conditions (below 220 V). Among the three topologies, Topology–3 provides the largest voltage margins, as indicated by its higher minimum (lower-whisker) voltage values.
As shown in
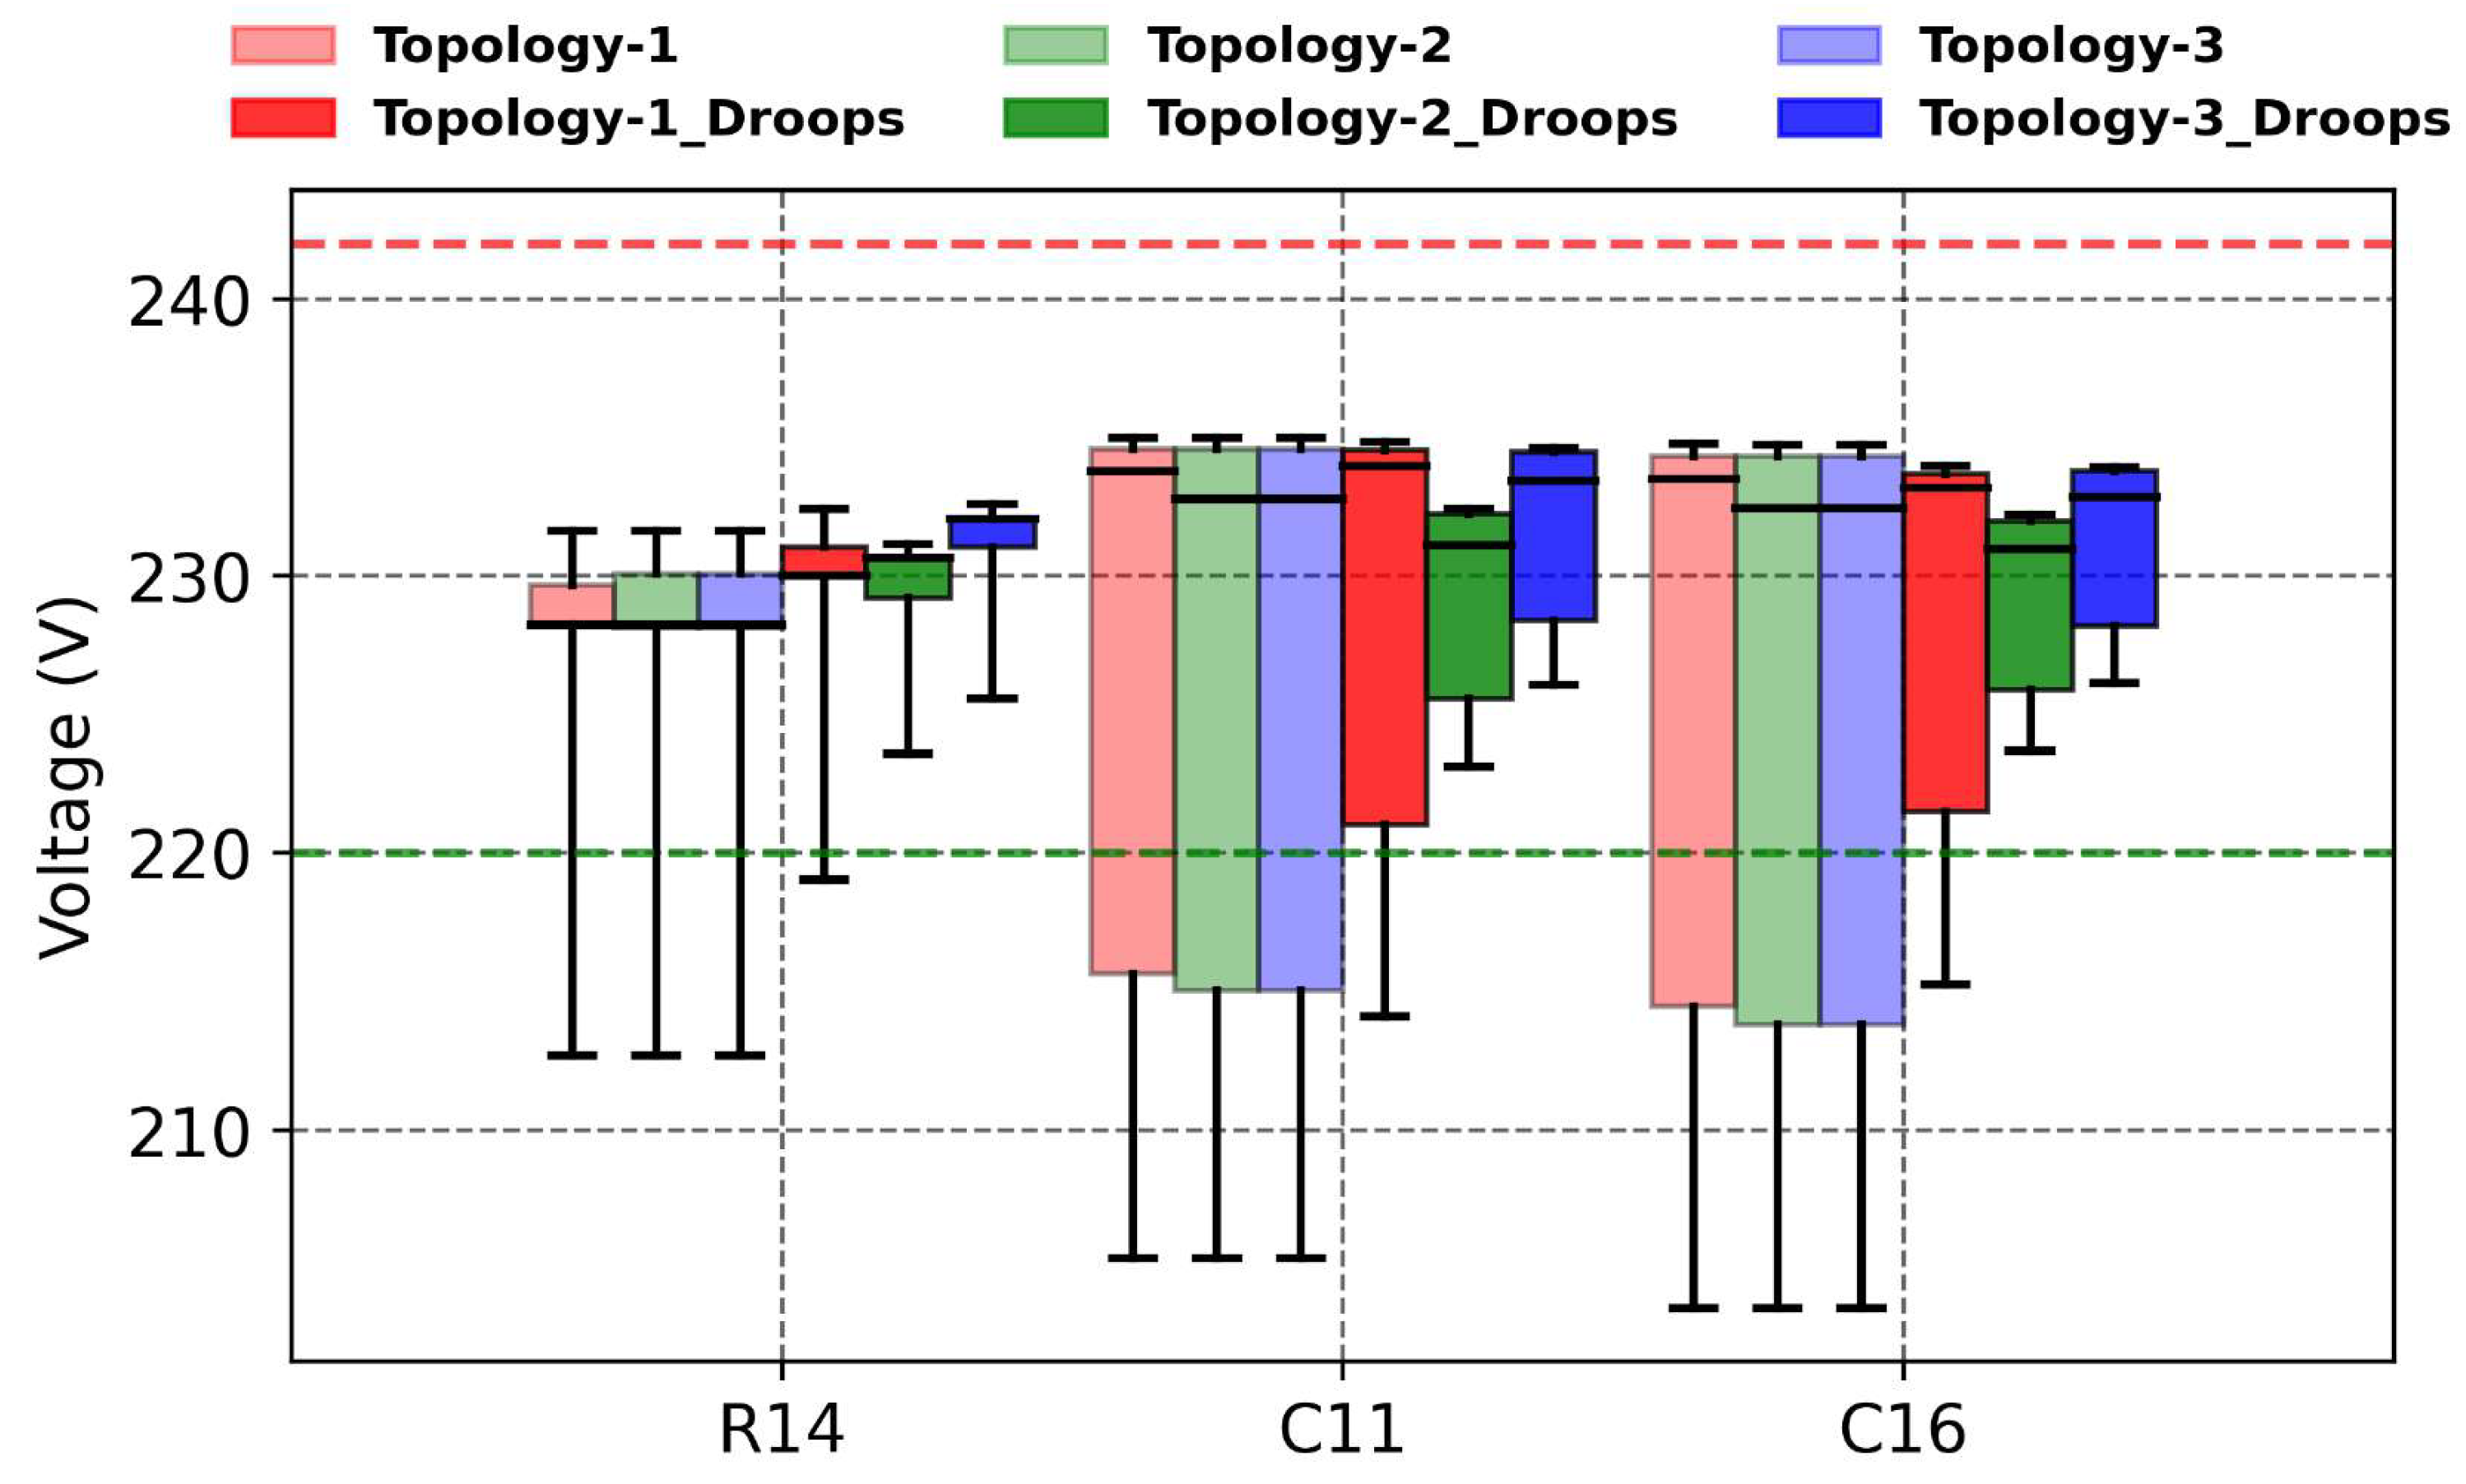
Figure 10, buses R14, C11, and C16 violate the voltage limits when droop control is not applied. With droop control, Topology–1 still shows borderline undervoltage at these locations, whereas Topology–2 and Topology–3 maintain the voltages within the acceptable range.
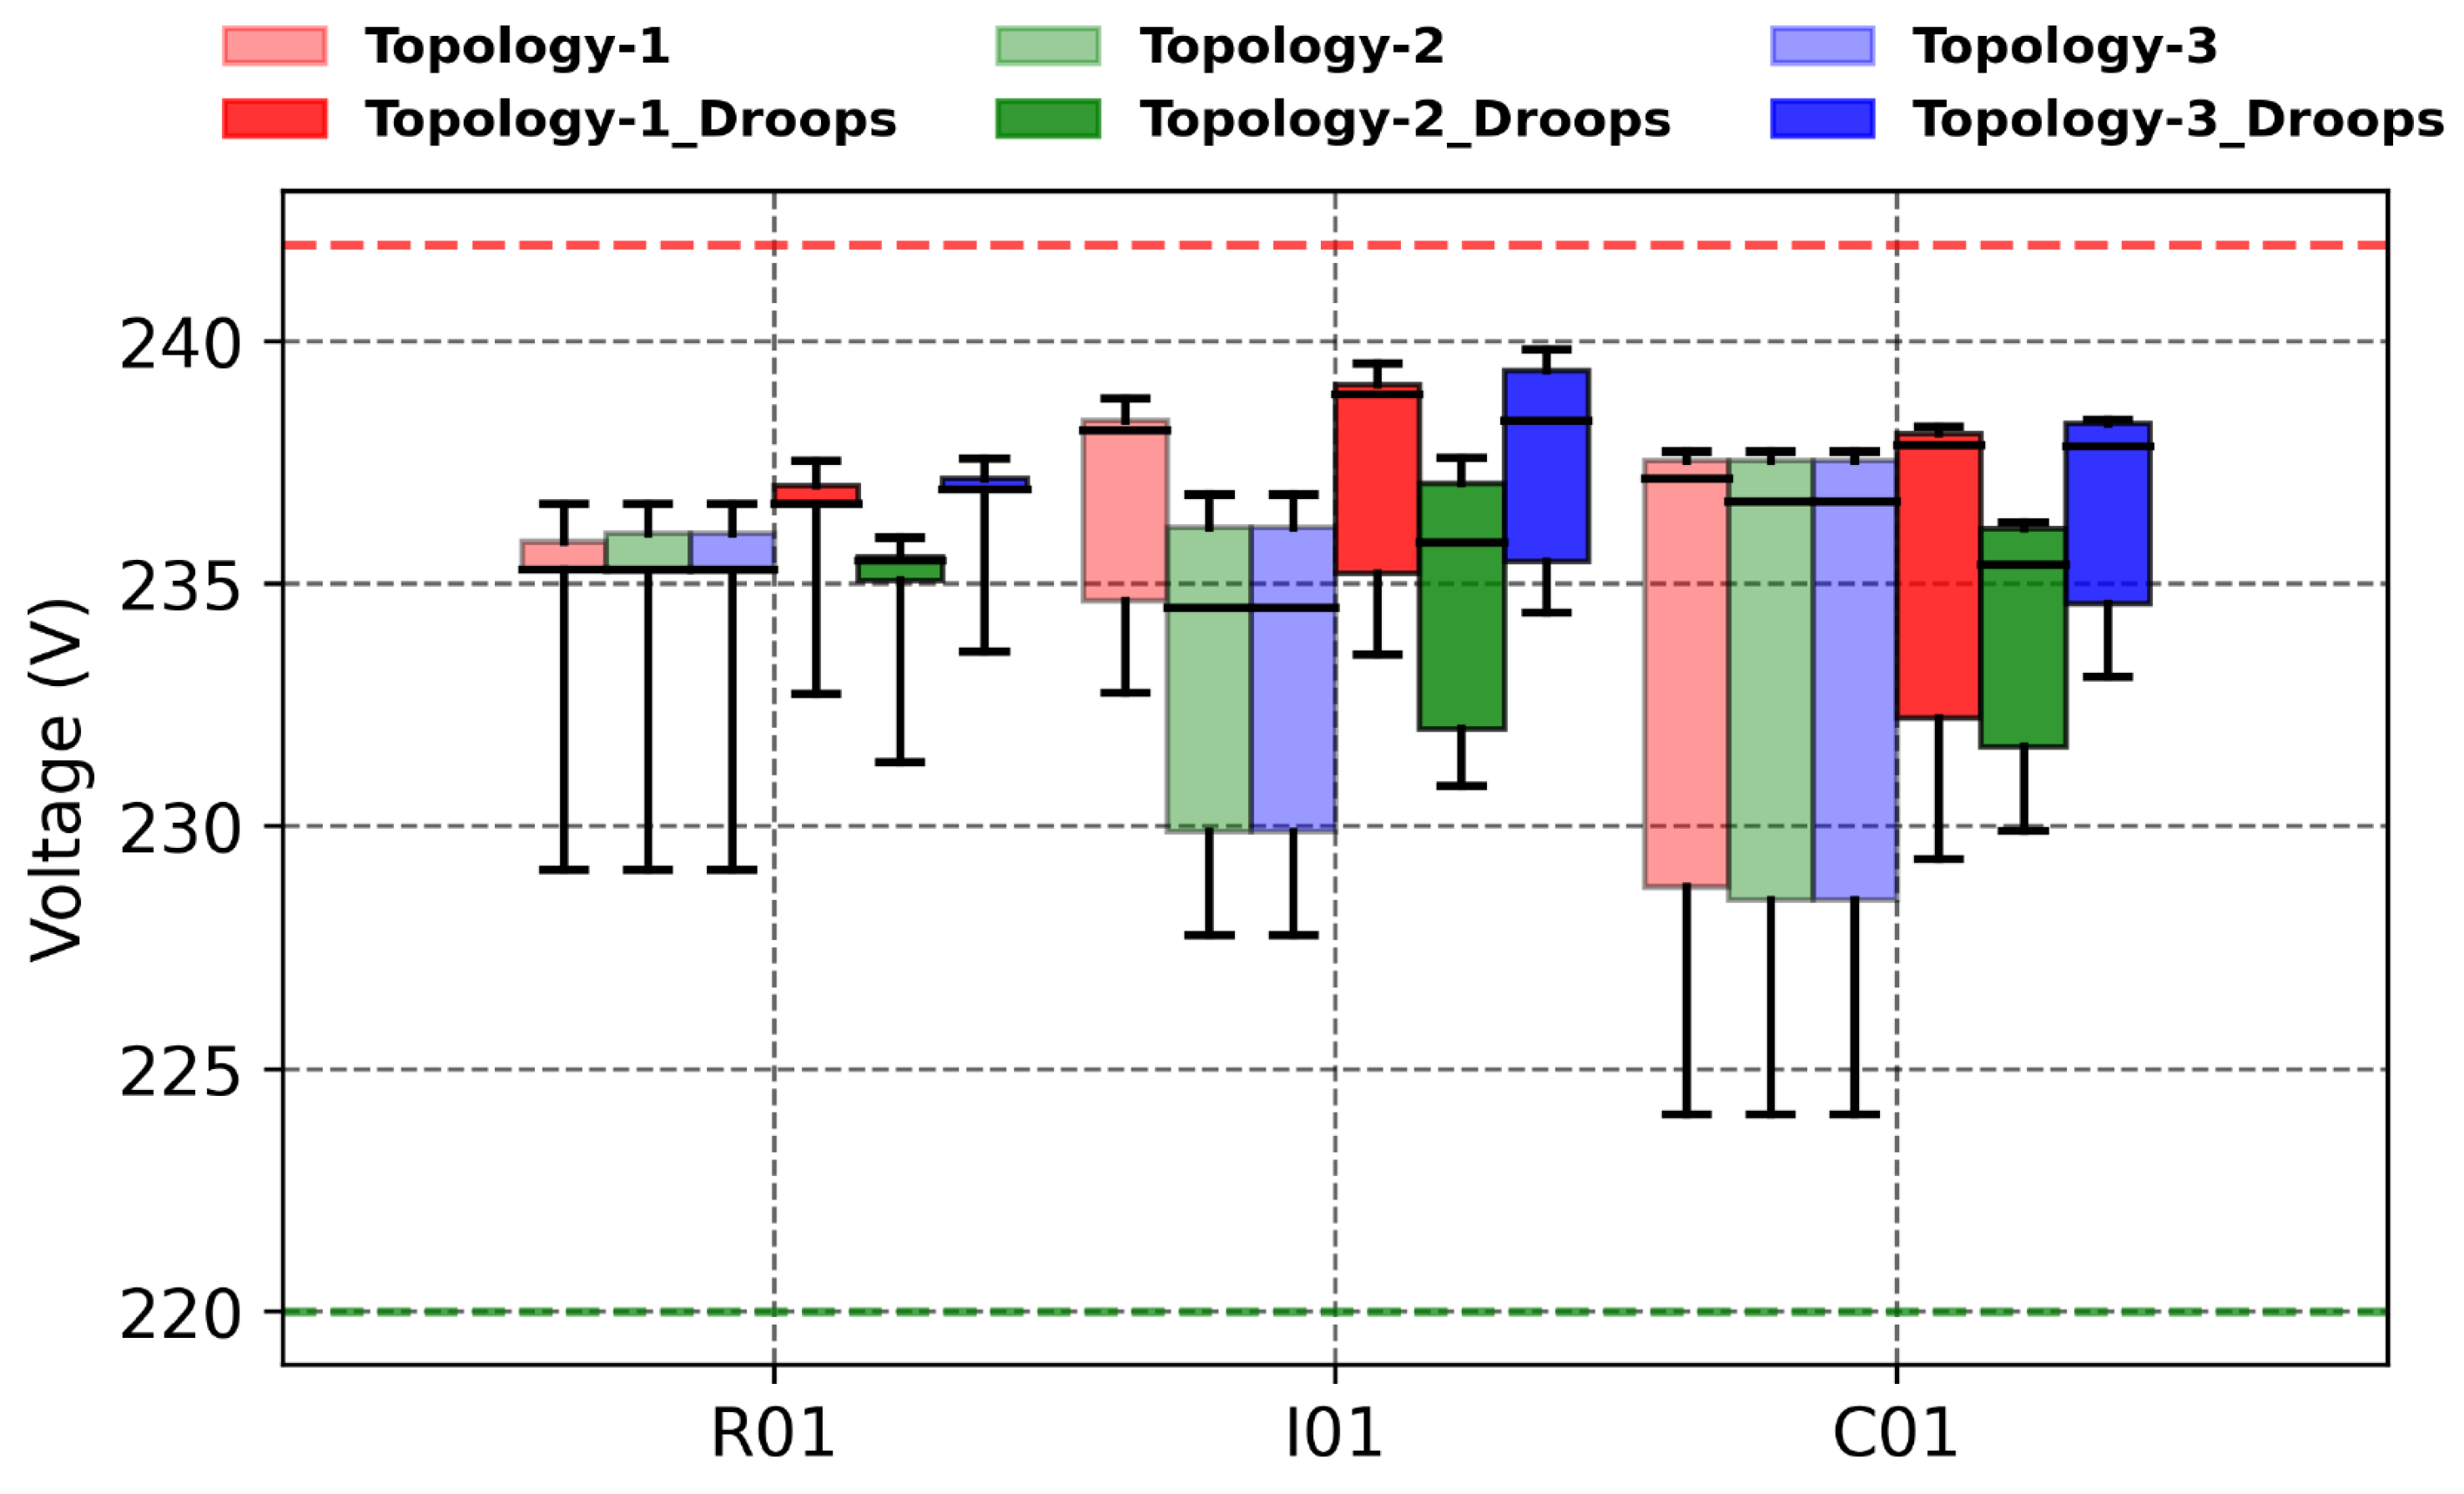
The buses closest to the main supply (R01, I01, and C01) exhibit stable voltage profiles and remain within the allowable voltage limits both with and without droop control across all topologies. This behavior is expected, as these buses are located near the main transformer. Nevertheless, the droop strategy improved the voltage profile, as illustrated in
Figure 11.
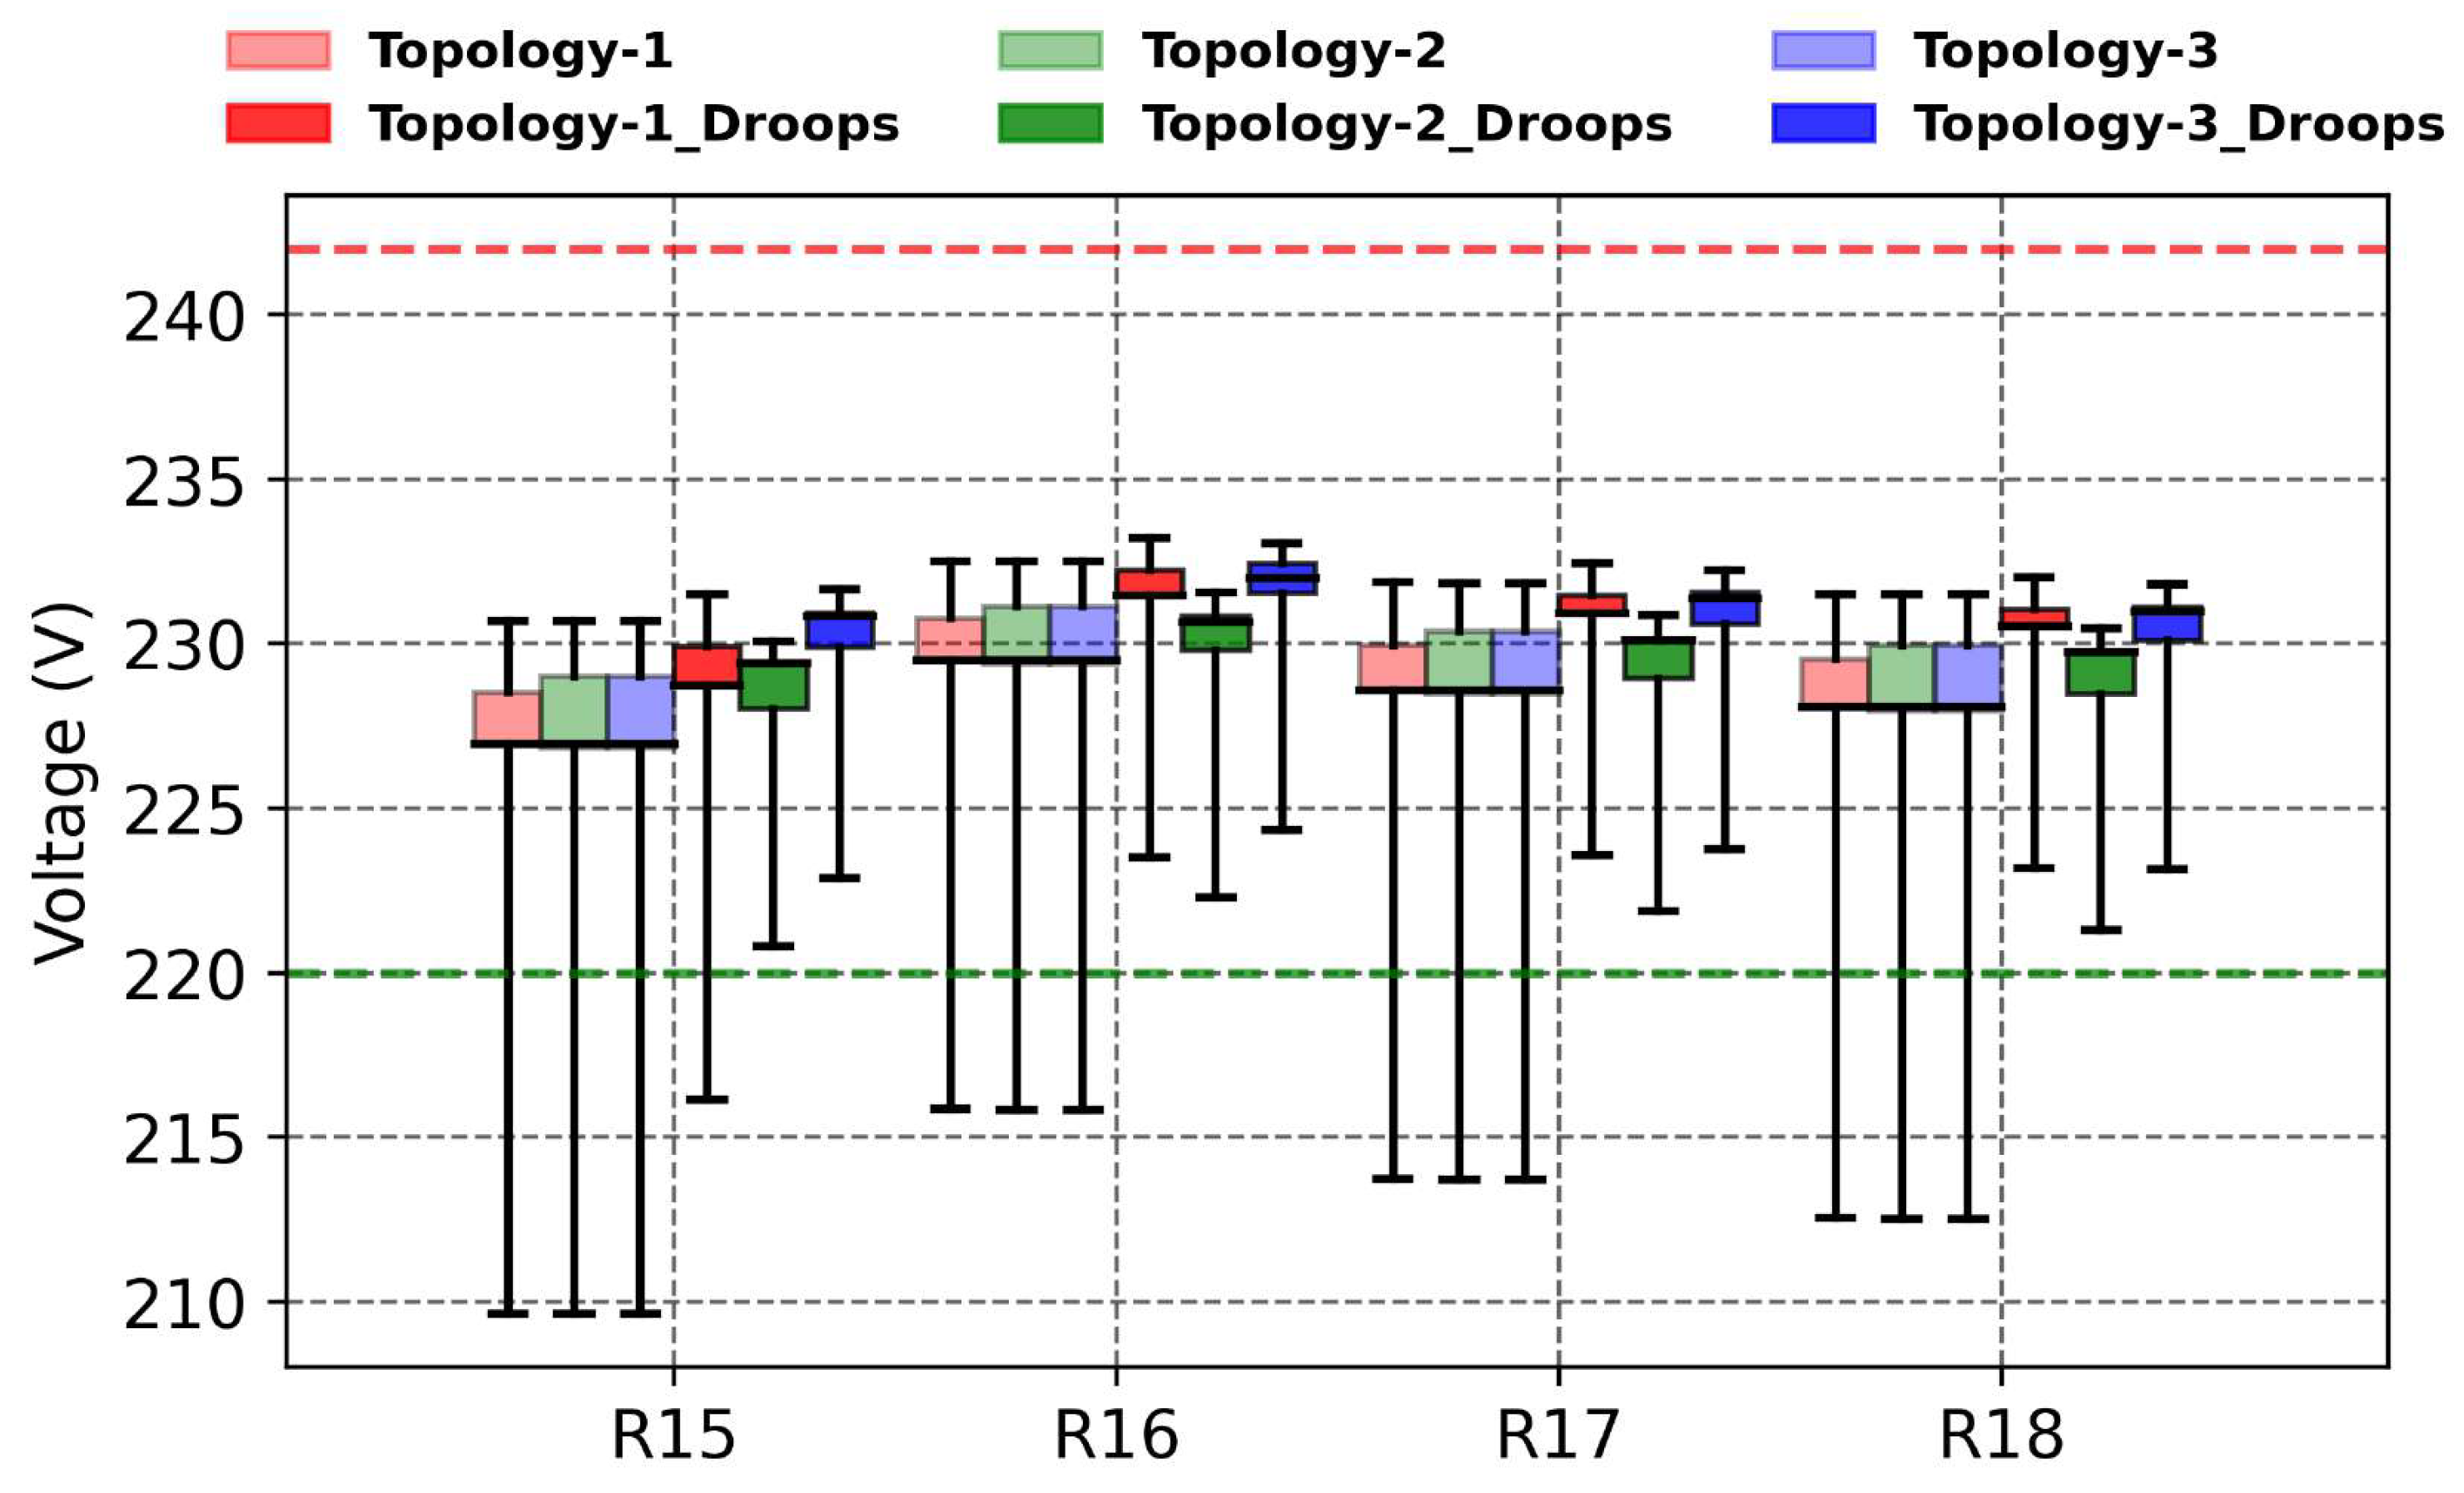
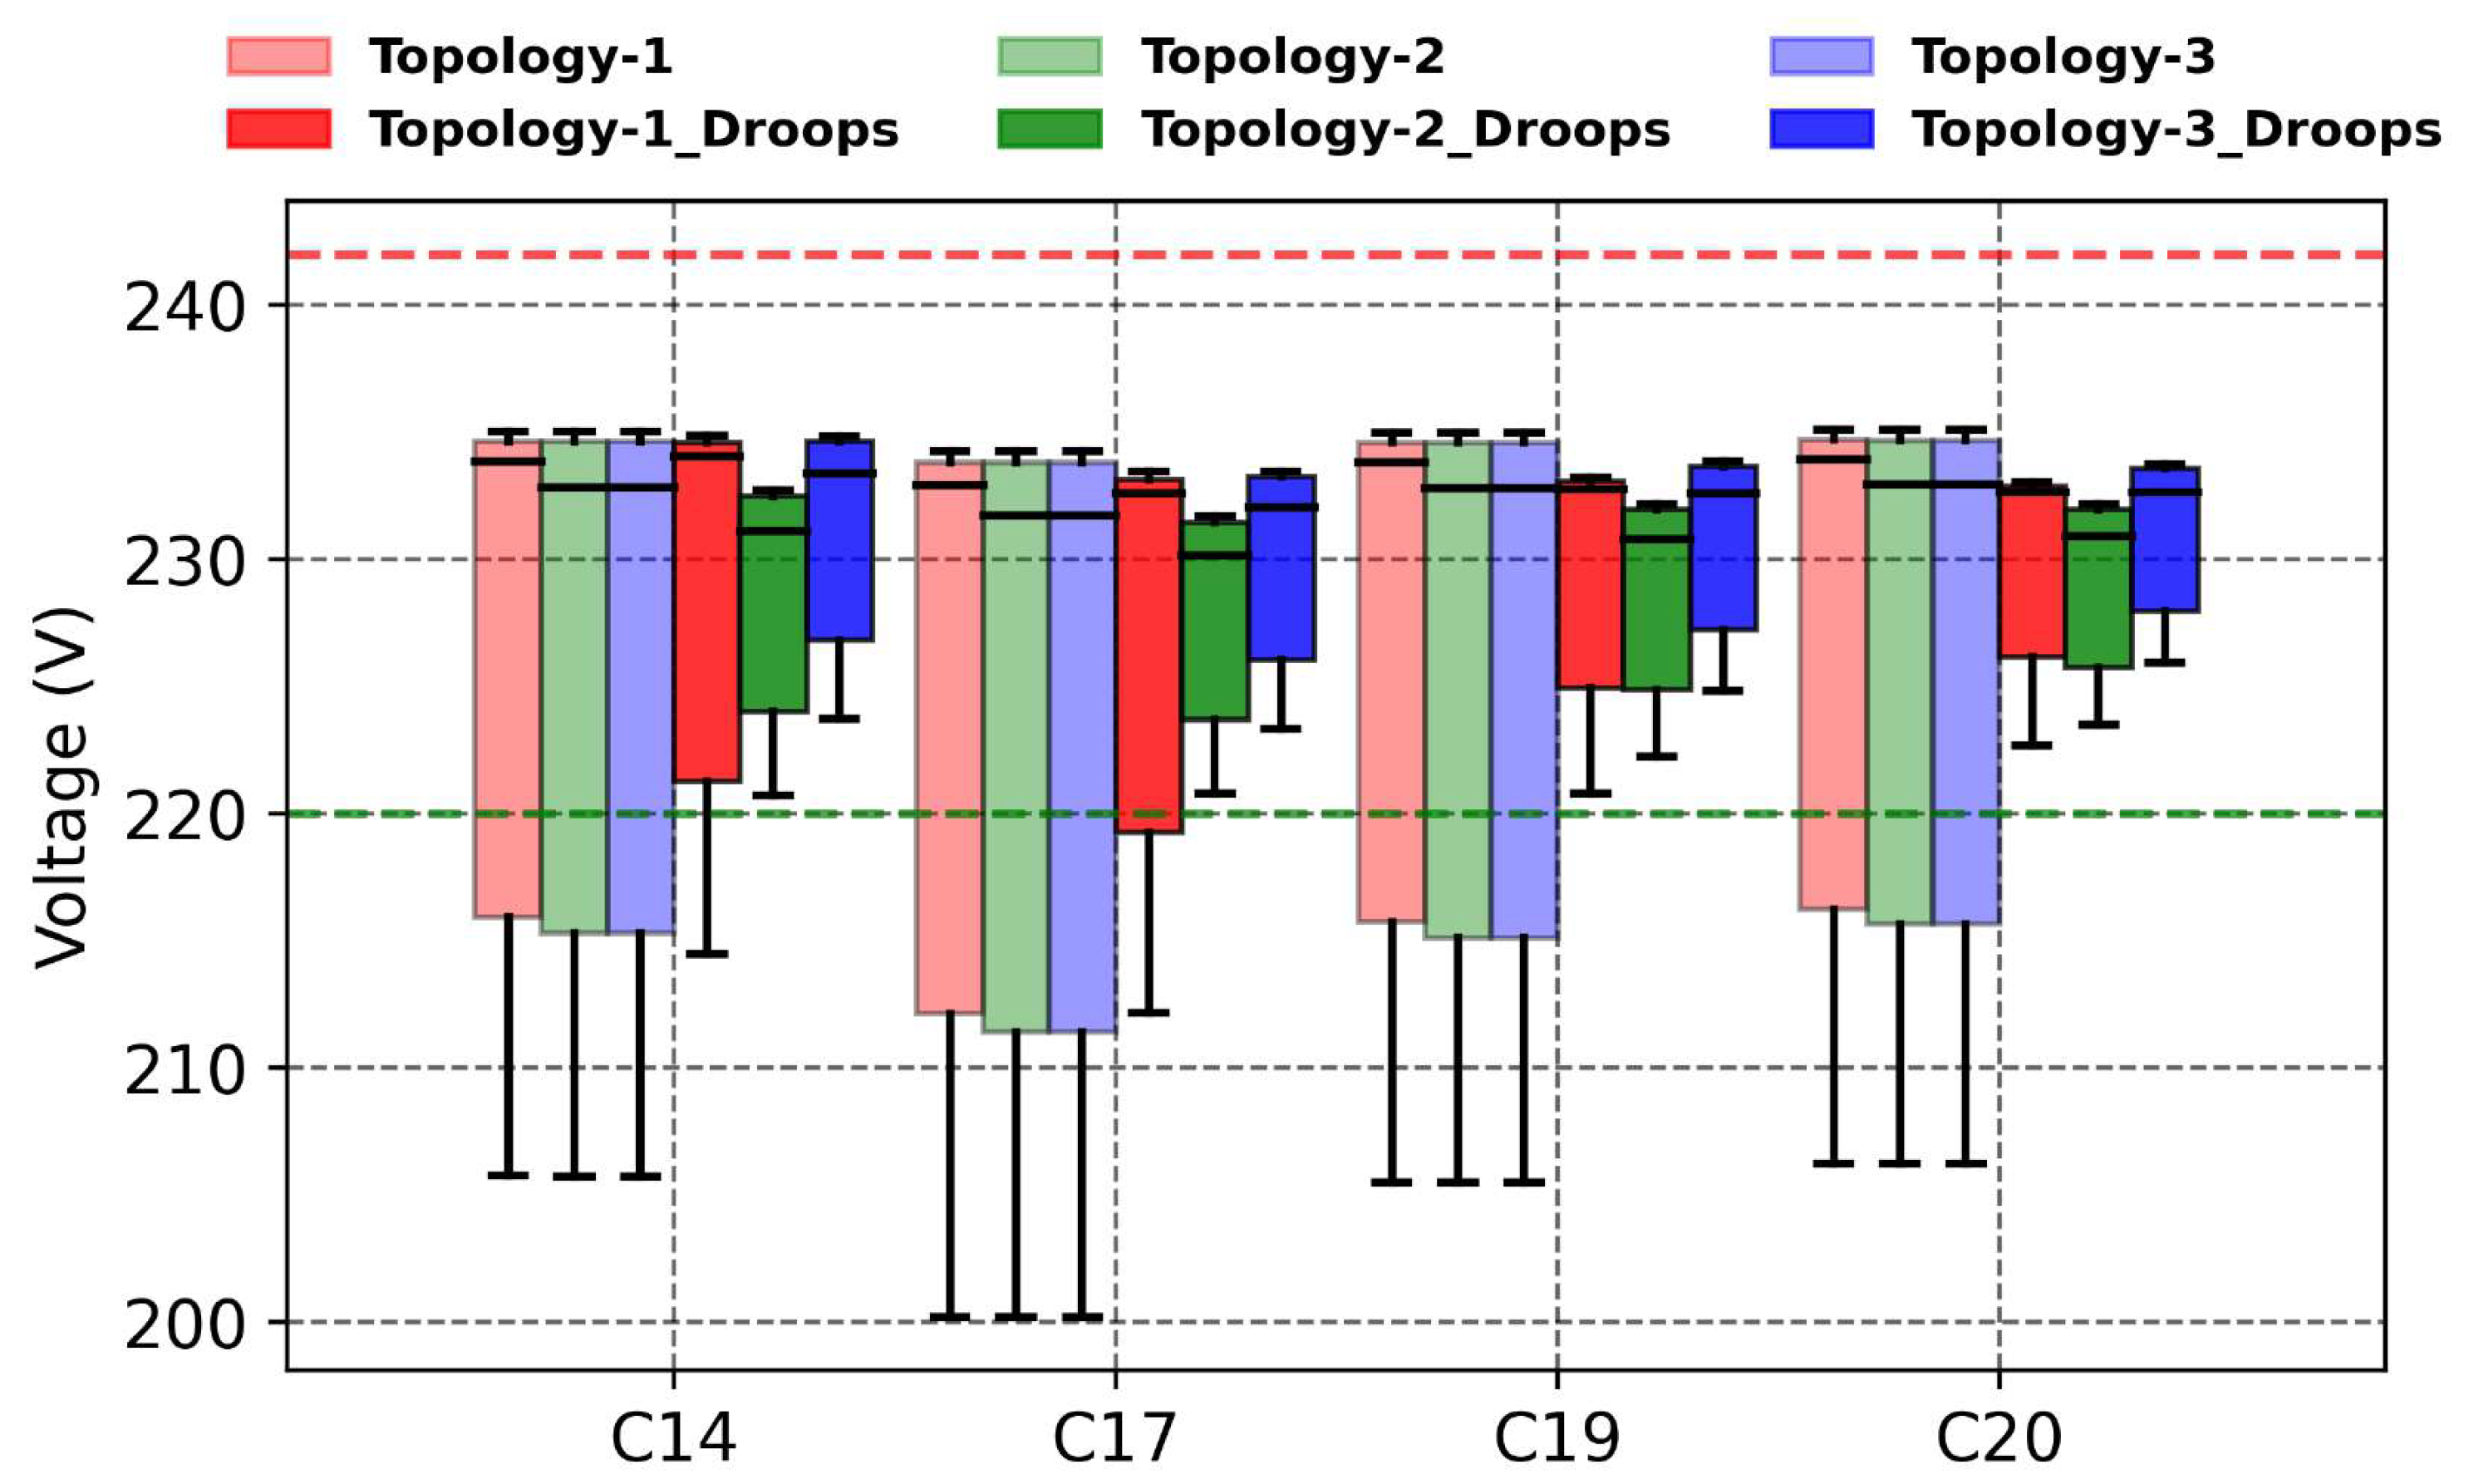
The residential feeder buses that were most challenging to control and maintain within the acceptable voltage range are R15, R16, R17, and R18. Similarly, the most critical buses in the commercial feeder are C14, C17, C19, and C20, mainly due to their distance from the VSC-connected buses and the lack of direct VSC support. Accordingly, Topology–2 and Topology–3 with the droop strategy successfully kept the voltages of these buses within the acceptable voltage range, as shown in
Figure 12 and
Figure 13, respectively.
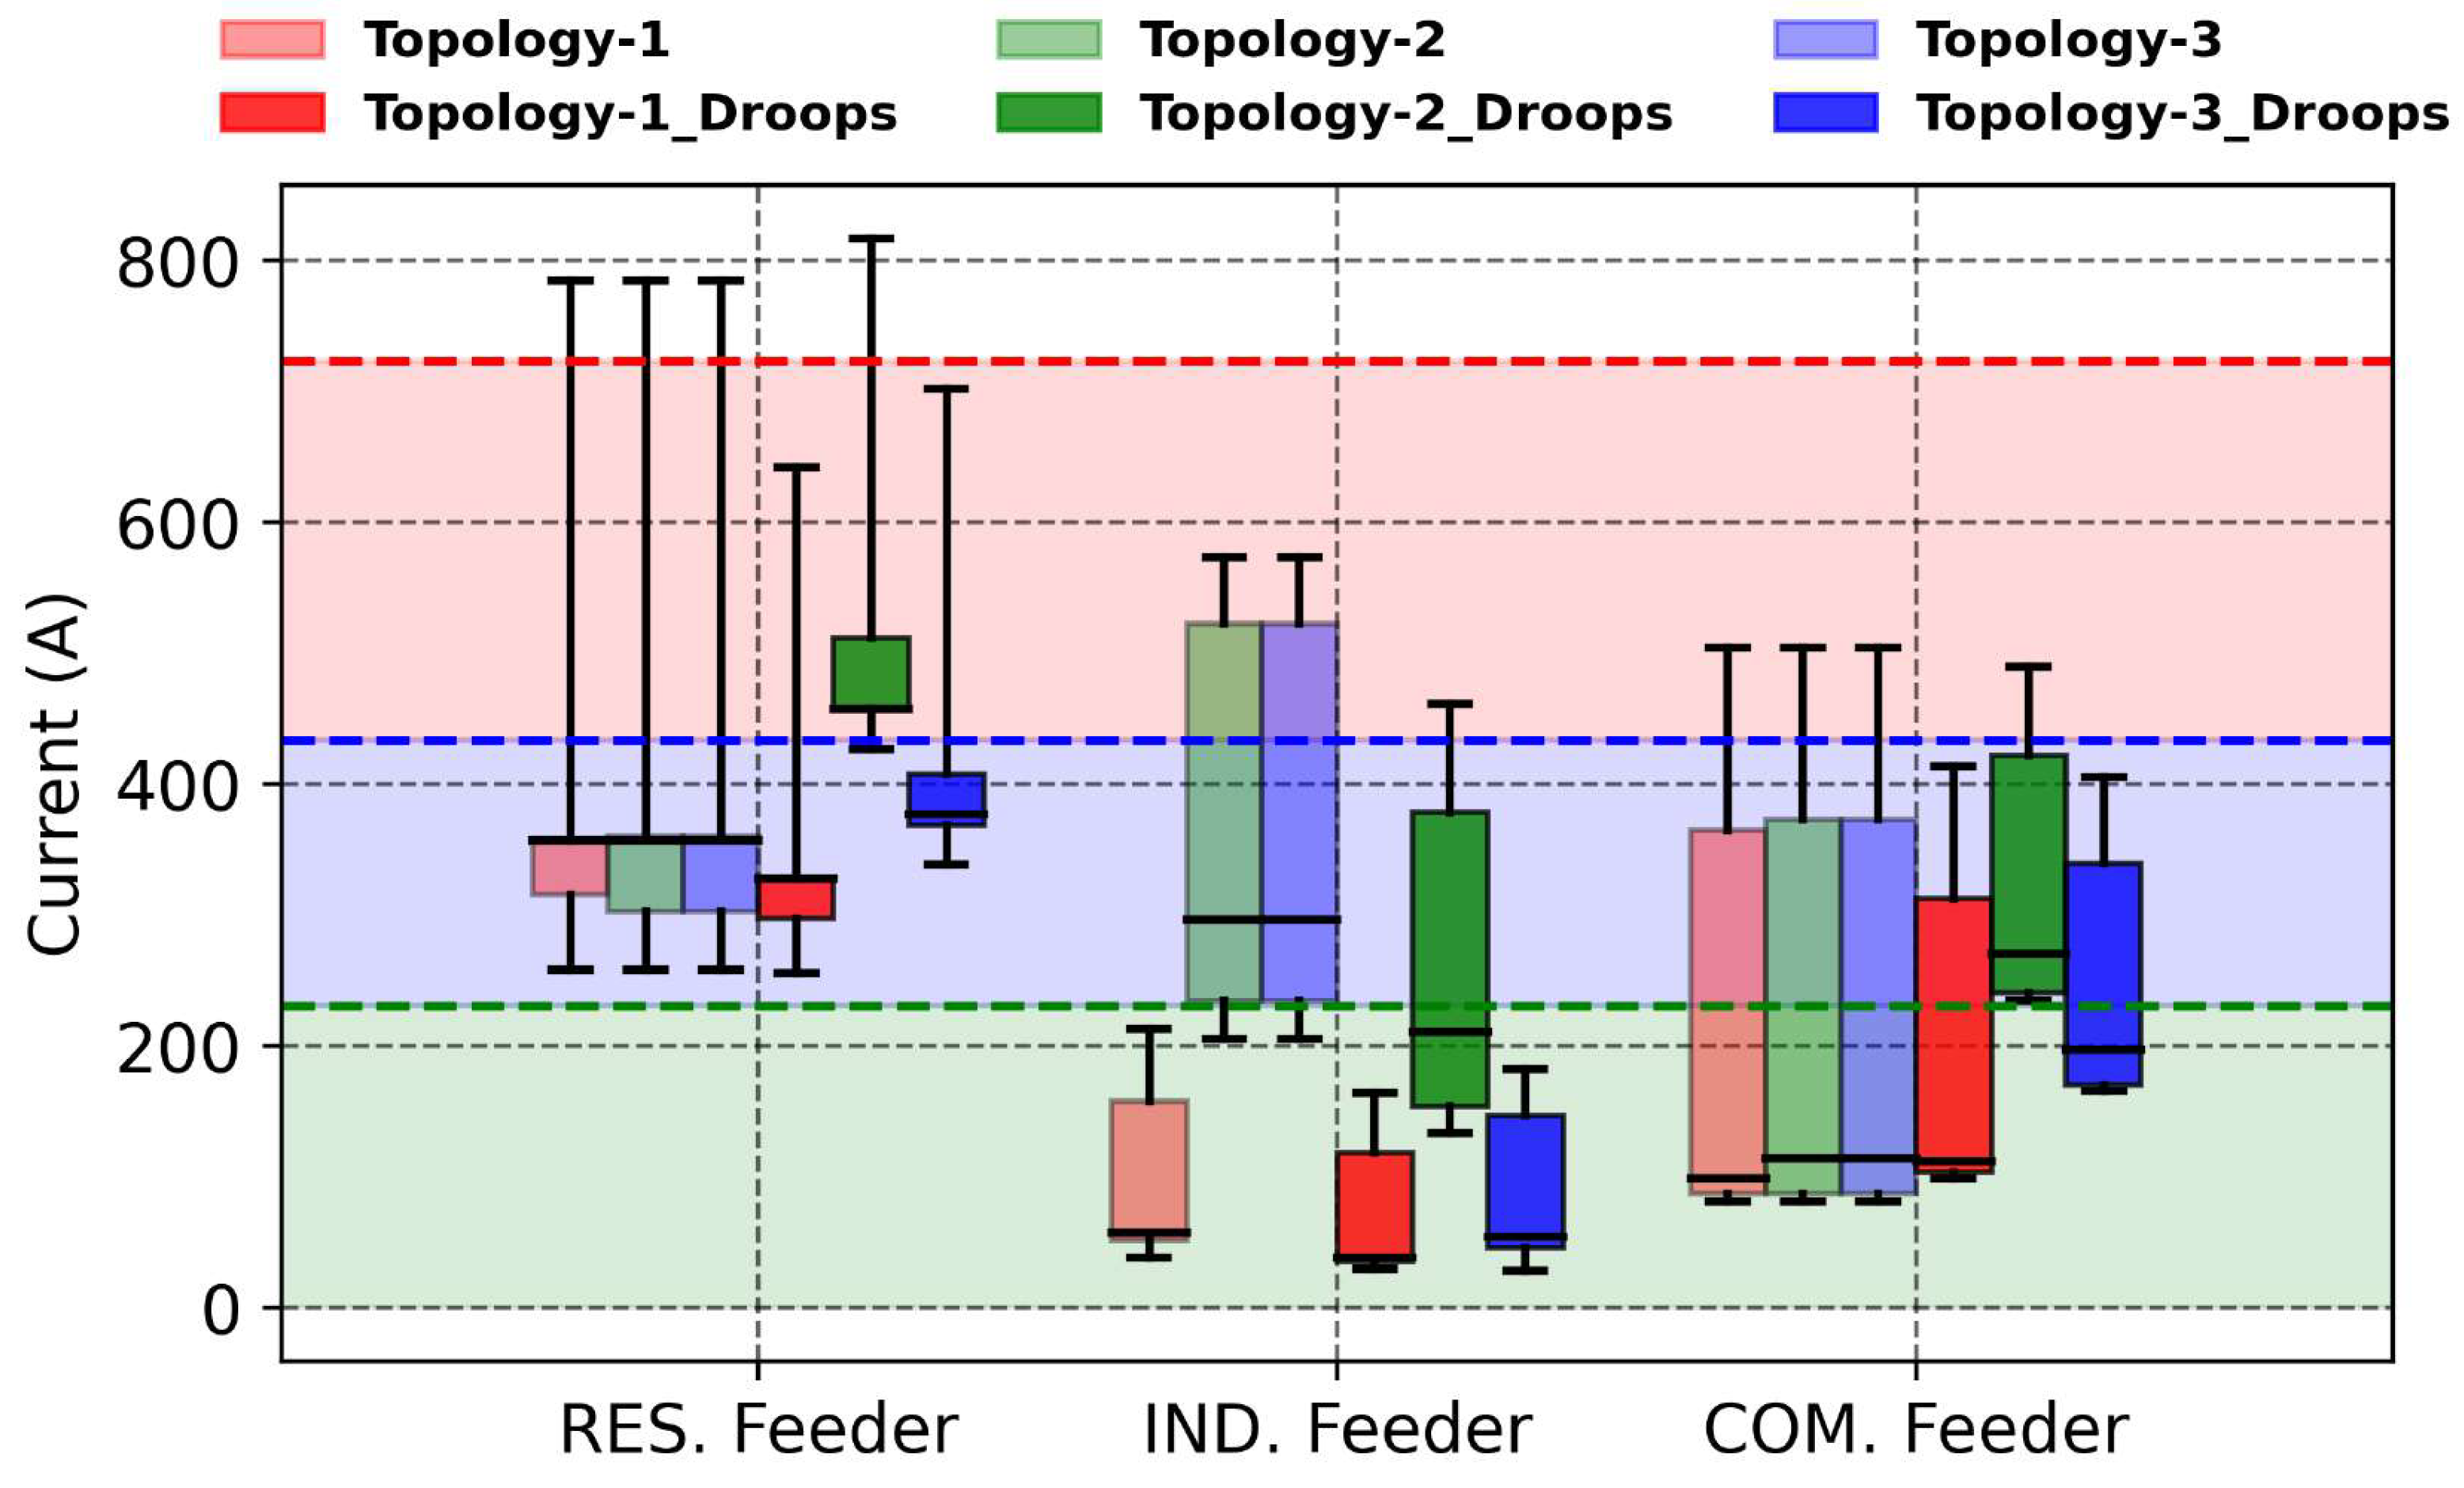
Figure 14 presents the current profiles for each feeder under Load–2, with and without droop control. Without the droop control, currents in the residential and commercial feeders exceeded the maximum limits. The dashed lines indicate the maximum permissible currents for each feeder type: The red zone represents the acceptable range for the residential feeder (724 A maximum limit), the green zone represents the acceptable range for the industrial feeder (231 A maximum limit), and the blue zone represents the acceptable range for the commercial feeder (434 A maximum limit). All feeders in Topology–2 exceeded the limits even with the droop control. However, Topology–1 and Topology–3 successfully maintained currents below the maximum limits under the droop approach. Additionally, Topology–1 consistently exhibited the lowest median current across all feeders compared to Topologies 2 and 3. The performance of Topology–2 is unsuitable under high or fluctuating load demands due to its mixed-wiring structure, which reduces available AC conduction paths and increases effective feeder impedance, thereby limiting power redistribution capability and current headroom compared to topologies preserving full three-phase AC feeders.
5.2. Load Profile (Load–1)
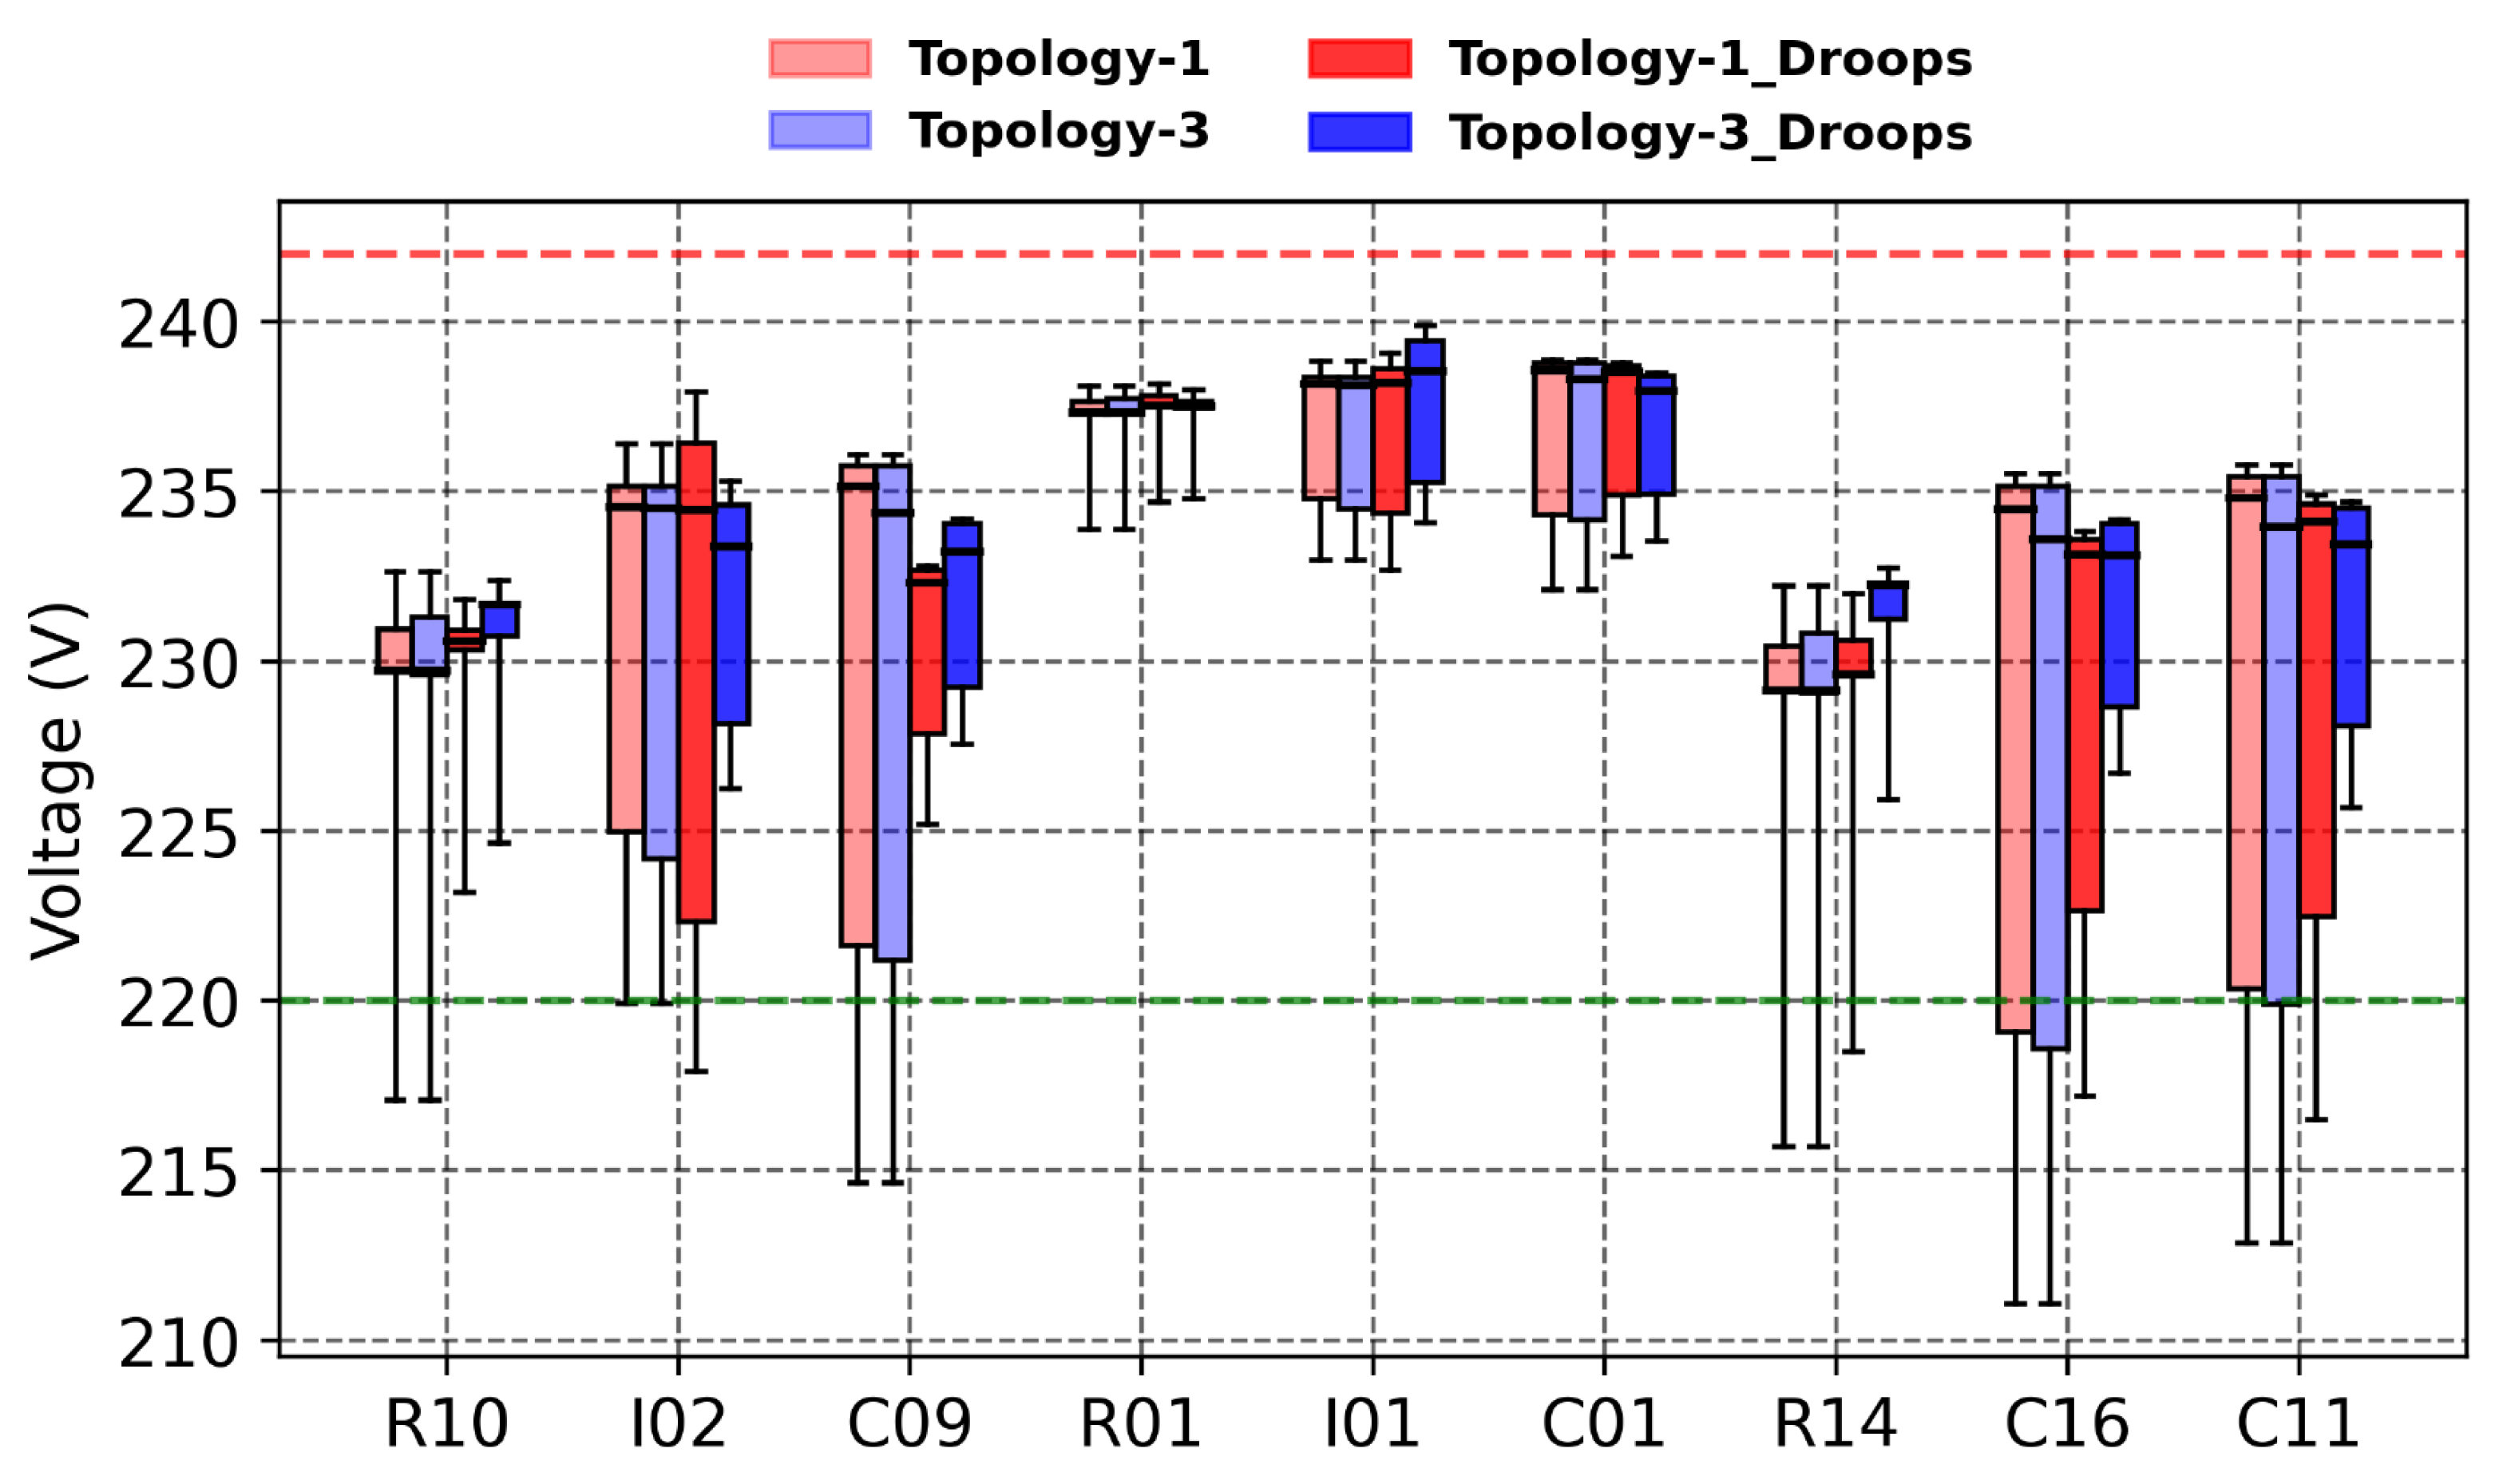
Figure 15 illustrates the voltage with and without the droop strategy during the Load–1 scenario for all buses connected to the VSCs of each topology; the Load–1 scenario does not include a DC load; therefore, Topology–2 is not included in this analysis.
Figure 15 reveals that R01, I01, and C01 also maintained stable voltages within acceptable limits regardless of the droop control of each topology. However, implementing the droop control strategy in Topology–3 generally ensured voltages remained within the acceptable range. It also resulted in higher minimum voltage values (the lower whiskers) compared to the other topologies.
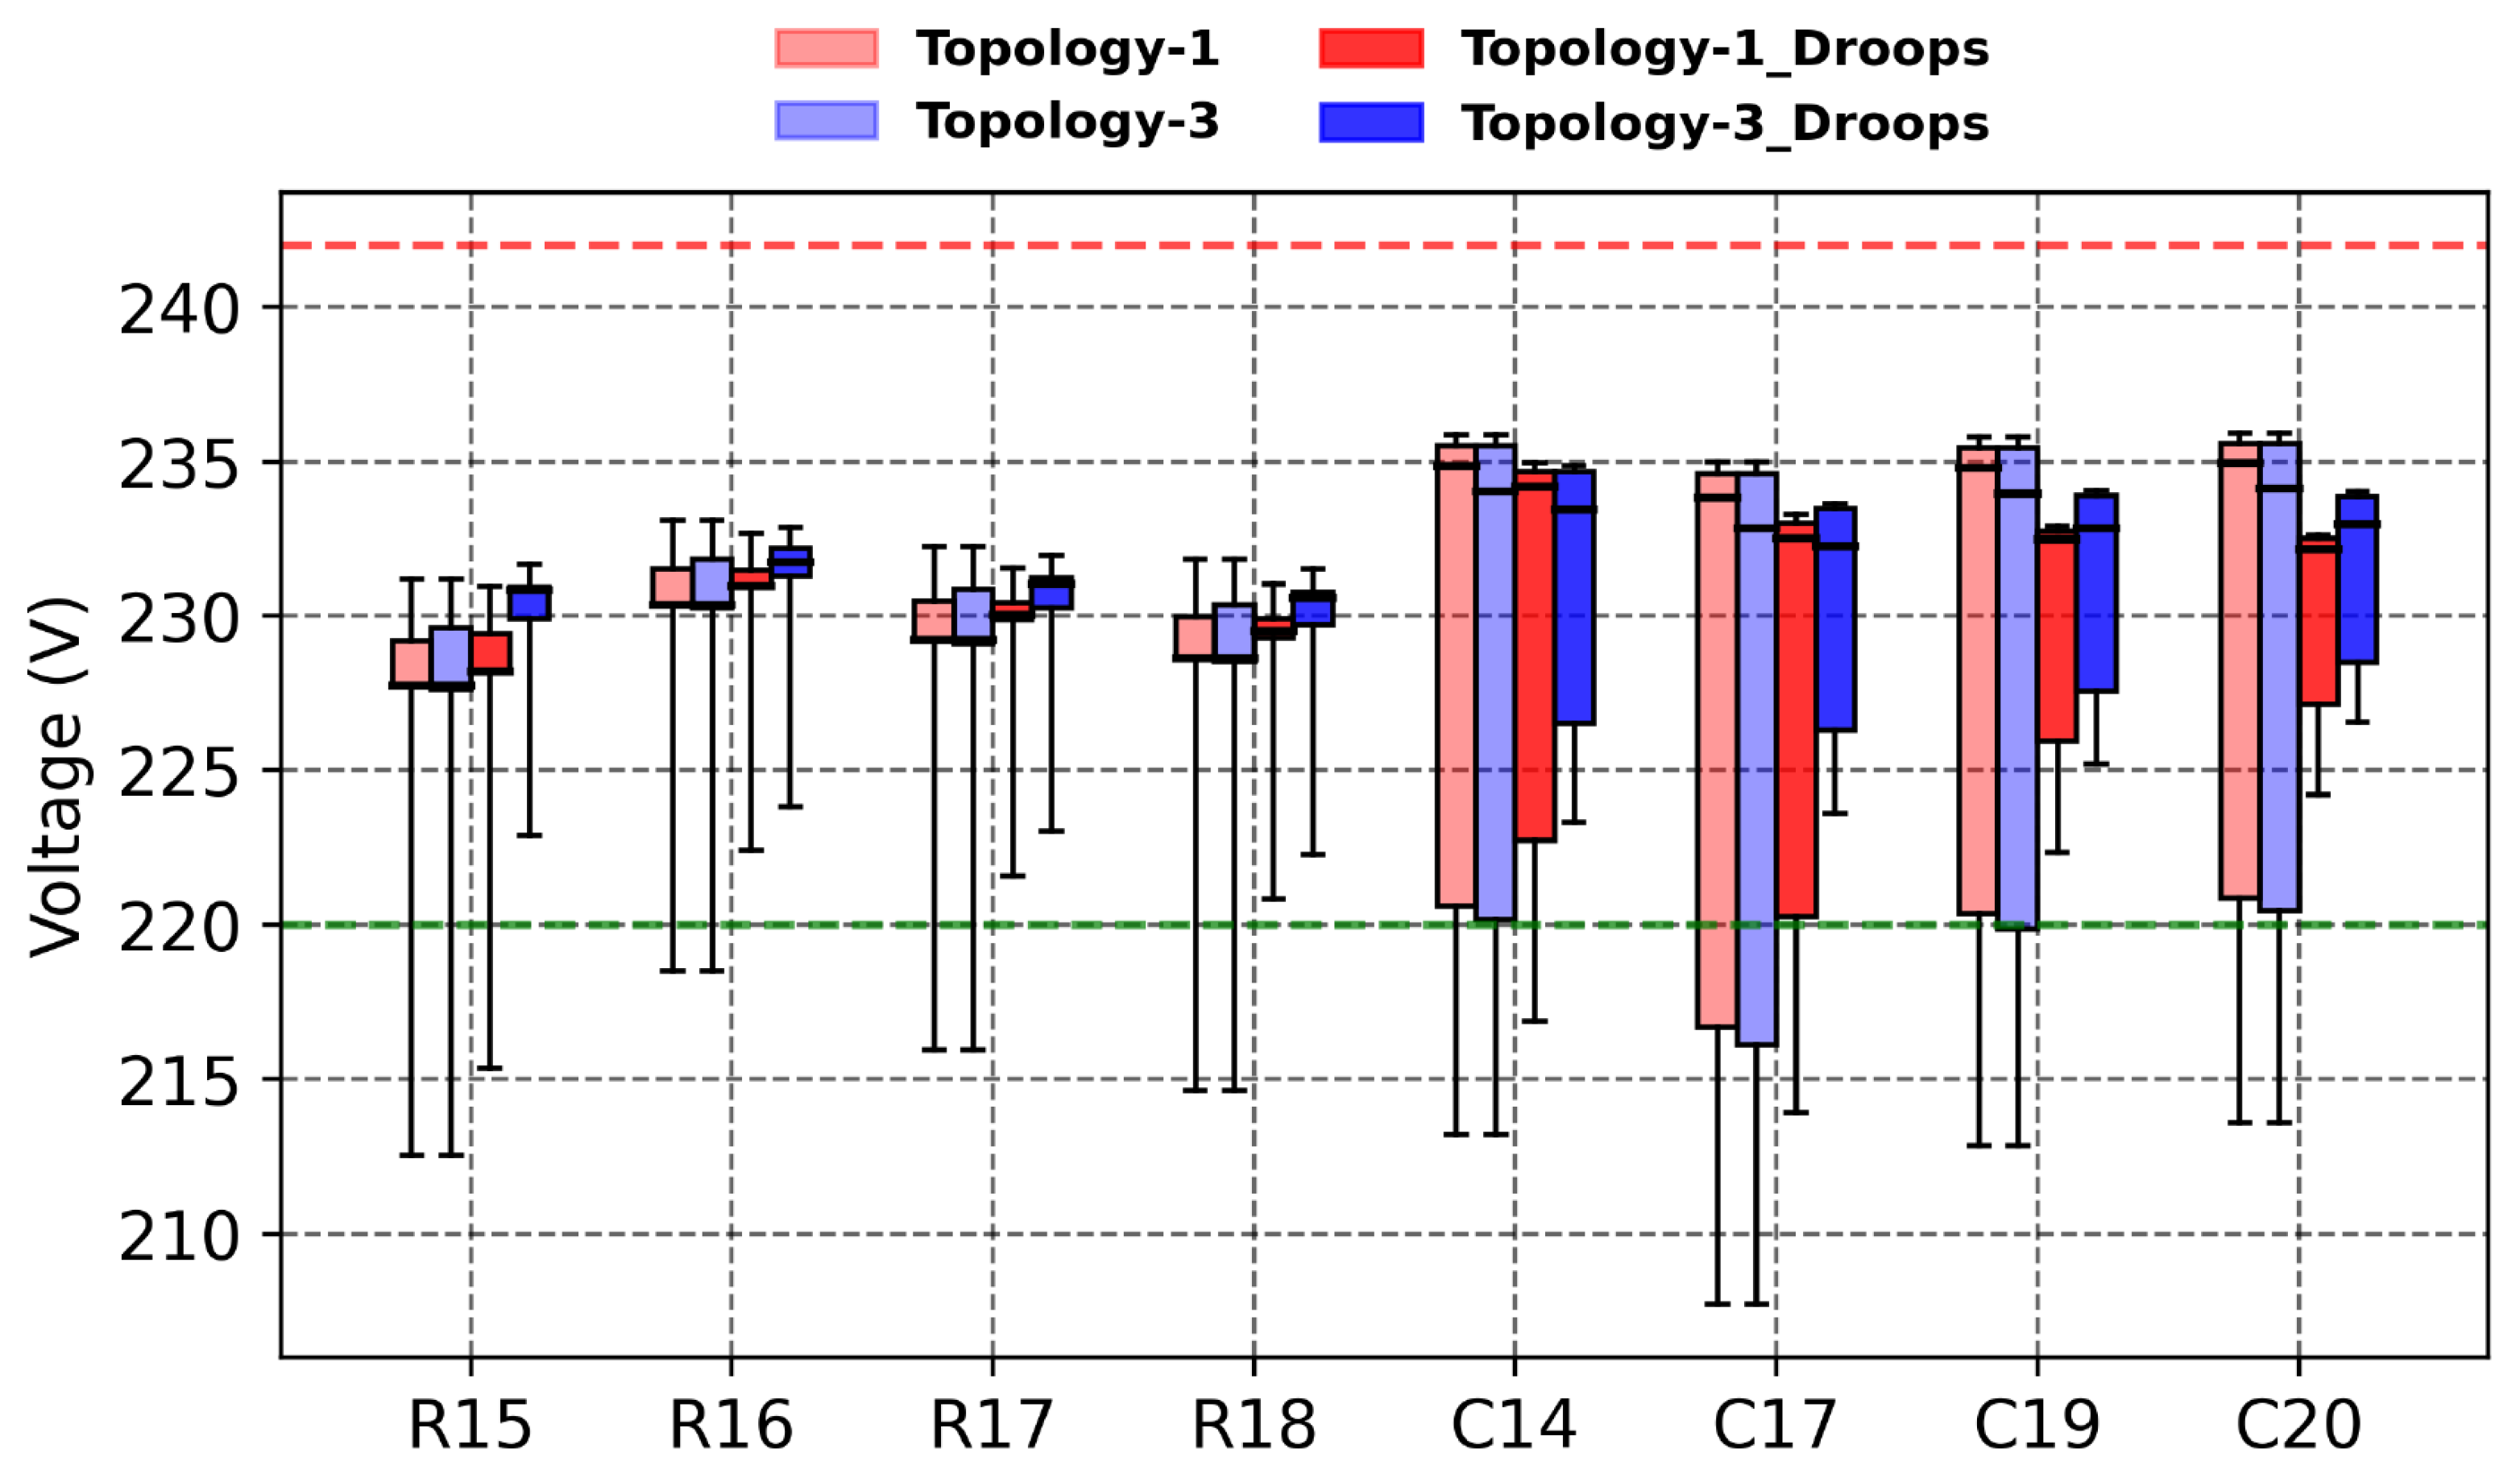
The residential and commercial buses that are most challenging to control and maintain within the acceptable voltage limits are evaluated during the Load–1 scenario as shown in
Figure 16. Topology–3, with droop control, successfully maintained the voltages of these buses within the acceptable voltage range. It also exhibited higher minimum voltage values (lower whiskers) than Topology–1. Moreover, the median voltages for all buses in Topology–3 with the droop control are consistently higher than Topology–1.
Figure 17 illustrates the current profiles for each feeder in Topologies 1 and 3 under Load–1, with and without droop control. Without droop control, currents in the residential and commercial feeders exceeded the maximum limits. Even with droop control, the industrial feeder in Topology–1 exceeded the limit. However, Topology–3 successfully maintained currents below the maximum limits under droop control.
6. Summary of Findings
The comprehensive evaluation yields the following main conclusions:
Topology–3 emerges as the optimal configuration, combining:
Superior voltage regulation with no violations within the ±5% limits, unlike the exceedances observed in other topologies (
Table 3).
Droop control provides critical benefits:
Implementation considerations:
Topology–1 offers the simplest implementation with the best current control under Load–2 (
Figure 14) but provides limited voltage support for remote buses (e.g., R15, C17). It is a cost-effective solution for networks where current limits are the primary concern.
Topology–2 consistently struggled with current overloads in the industrial feeder (
Figure 14) and offered minimal performance improvement. Its design makes it unsuitable for scenarios with high or fluctuating load demands.
Topology-Specific Advantages:
Load-Dependent Suitability of the Proposed Topologies:
The proposed topologies show different suitability depending on load type:
Topology–1 is effective for residential and commercial feeders under moderate loading, where partial current relief is sufficient.
Topology–2 is mainly suitable for single-phase and DC-oriented loads.
Topology–3 provides robust performance across residential, commercial, and industrial feeders due to multiple AC–DC interconnection points that enhance voltage regulation and power redistribution under varying load conditions.
Table 4 highlights the critical role of the droop strategy, showing a reduction in voltage violations and current exceedance across all topologies compared to uncontrolled operation.
The effectiveness of the proposed topologies with the droop control strategy in reducing peak currents was quantitatively evaluated across all topologies and load scenarios.
Table 5 summarizes the reduction achieved in each feeder type for both Load–1 (AC overloading) and Load–2 (heavy DC loading) scenarios.
The droop implementation successfully eliminated the voltage violations in critical buses (R10, C09) and reduced current exceedance in the residential feeder.
The key observations from Tables are as follows:
Topology–3 demonstrated superior performance in both load scenarios, achieving the highest current reductions, specifically in the industrial feeder under Load–2 and the commercial feeder under Load–1. It also kept all residential feeder currents within their limits.
Topology–1 achieved its design goal in the residential feeder under Load–2 conditions but exhibited limitations in the industrial feeder, where currents increased under Load–1.
Topology–2 proved ineffective in the residential feeder, where it increased currents during Load–2 despite minor reductions in other feeders.
Industrial feeder benefited most from droop control with Topology–3, where remarkable current reductions were achieved through optimized power sharing between AC and DC networks.
The exceptional performance of Topology–3 is attributed to its 4-wire AC and 2-wire DC configuration, which provides superior power flow control capabilities. This architecture, combined with droop control, reduced commercial feeder currents in both loading scenarios; the most consistent improvement was observed. These results establish Topology–3 as the optimal solution to improve grid stability under various operating conditions.
Limitations and Stability Considerations
This study focuses on voltage and current regulation performance under realistic daily operating conditions. Small-signal stability analysis and large-disturbance transient assessments are beyond the scope of this work. In hybrid AC/DC systems with high DC penetration, interactions among DC lines, converter dynamics, and control loops may introduce weakly damped modes under high power transfer.
Although stable operation was observed in all simulated scenarios using the droop-based control, future work should include small-signal eigenvalue analysis and large-disturbance studies to further assess stability margins, particularly for large-scale or highly meshed DC networks.
7. Conclusions
This paper presented a topology-level evaluation of hybrid AC/DC adaptations of the CIGRE European low-voltage benchmark to assess their impact on voltage regulation, current compliance, and power-sharing capability under realistic daily operating conditions. The proposed topologies integrate DC links into the existing AC infrastructure through VSCs controlled by a decentralized droop-based control strategy. Across the two 24-h load profiles, the three AC/DC topologies demonstrate significant improvements in voltage regulation, feeder current management, and overall operational performance. Additionally, this paper provides a standardized, reproducible hybrid AC/DC benchmark and a quantified topology-level comparison that links architectural design choices to measurable performance limits under realistic operating conditions.
Figure 11 and
Figure 15 show that buses R01, I01, and C01 maintain stable voltage profiles within acceptable limits regardless of the droop strategy. This observation indicates that certain VSC placements, particularly at buses located close to the main transformer, may be redundant for voltage support and could be reconsidered in future benchmark refinements. The consistent performance enhancement observed with the implementation of the droop control strategy highlights its role in mitigating undervoltage conditions and reducing feeder current exceedance, thereby improving the robustness of the low-voltage distribution network. Within the benchmark framework adopted in this study, droop control enables decentralized power sharing without a communication infrastructure, allowing the intrinsic performance differences among the proposed topologies to be clearly identified. Applying the droop controller as a baseline strategy reduced peak feeder currents under stressed operating conditions, with Topology–3 demonstrating the most consistent improvement. Under Load–2 (high DC penetration), Topology–3 achieved the largest reduction in industrial feeder peak currents while maintaining all feeder currents within their rated limits. Under Load–1 (AC overloading), it provided balanced current reductions across feeders and eliminated voltage violations. Topology–1 delivered partial current relief, particularly in residential feeders, but showed increased industrial feeder currents under Load–1. Topology–2 proved less effective, and even led to increased residential feeder currents under Load–2 due to its structural limitations. Overall, Topology–3 with droop control provides the most efficient and robust technical benchmark performance among the proposed topologies under the two 24-h load profiles, from a technical benchmark perspective, rather than as a cost-optimal solution. Furthermore, the proposed hybrid AC/DC topologies are evaluated in terms of technical electrical performance and operational benchmarking controllability. Future work may investigate economic feasibility, protection coordination, scalability considerations, and the integration of advanced or hierarchical control strategies beyond the primary droop-based approach.
Author Contributions
Conceptualization, M.A.K. and J.M.M.; Methodology, M.A.K.; Software, M.A.K. and J.M.M.; Validation, M.A.K. and J.M.M.; Formal analysis, M.A.K.; Investigation, J.M.M. Resources, J.M.M.; Data curation, M.A.K. and J.M.M.; Writing—original draft preparation, M.A.K.; Writing—review and editing, J.M.M.; Visualization, M.A.K.; Supervision, J.M.M.; Project administration, J.M.M. All authors have read and agreed to the published version of the manuscript.
Funding
This research received no external funding.
Institutional Review Board Statement
Not applicable.
Informed Consent Statement
Not applicable.
Data Availability Statement
Conflicts of Interest
The authors declare no conflicts of interest.
References
- Yang, Z.; Wang, C.; Han, J.; Yang, F.; Shen, Y.; Min, H.; Hu, W.; Song, H. Analysis of voltage control strategies for DC microgrid with multiple types of energy storage systems. Electronics 2023, 12, 1661. [Google Scholar] [CrossRef]
- González-Morán, C.; Arboleya, P.; Pilli, V. Photovoltaic self consumption analysis in a European low voltage feeder. Electr. Power Syst. Res. 2021, 194, 107087. [Google Scholar] [CrossRef]
- Ntombela, M.; Musasa, K.; Moloi, K. A comprehensive review of the incorporation of electric vehicles and renewable energy distributed generation regarding smart grids. World Electr. Veh. J. 2023, 14, 176. [Google Scholar] [CrossRef]
- Hasan, M.K.; Habib, A.A.; Islam, S.; Balfaqih, M.; Alfawaz, K.M.; Singh, D. Smart grid communication networks for electric vehicles empowering distributed energy generation: Constraints, challenges, and recommendations. Energies 2023, 16, 1140. [Google Scholar] [CrossRef]
- Khalid, M. Smart grids and renewable energy systems: Perspectives and grid integration challenges. Energy Strategy Rev. 2024, 51, 101299. [Google Scholar]
- Rani, P.; Parkash, V.; Sharma, N.K. Technological aspects, utilization and impact on power system for distributed generation: A comprehensive survey. Renew. Sustain. Energy Rev. 2024, 192, 114257. [Google Scholar]
- Bakare, M.S.; Abdulkarim, A.; Zeeshan, M.; Shuaibu, A.N. A comprehensive overview on demand side energy management towards smart grids: Challenges, solutions, and future direction. Energy Inform. 2023, 6, 4. [Google Scholar]
- Zenhom, Z.M.; Aleem, S.H.A.; Zobaa, A.F.; Boghdady, T.A. A comprehensive review of renewables and electric vehicles hosting capacity in active distribution networks. IEEE Access 2024, 12, 3672–3699. [Google Scholar] [CrossRef]
- Guzmán-Henao, J.A.; Bolaños, R.I.; Montoya, O.D.; Grisales-Noreña, L.F.; Chamorro, H.R. On Integrating and Operating Distributed Energy Resources in Distribution Networks: A Review of Current Solution Methods, Challenges, and Opportunities. IEEE Access 2024, 12, 55111–55133. [Google Scholar] [CrossRef]
- Peng, F.Z.; Liu, C.C.; Li, Y.; Jain, A.K.; Vinnikov, D. Envisioning the future renewable and resilient energy grids—A power grid revolution enabled by renewables, energy storage, and energy electronics. IEEE J. Emerg. Sel. Top. Ind. Electron. 2023, 5, 8–26. [Google Scholar] [CrossRef]
- Strunz, K.; Abbasi, E.; Fletcher, R.; Hatziargyriou, N.; Iravani, R.; Joos, G. Benchmark Systems for Network Integration of Renewable and Distributed Energy Resources; CIGRE Task Force C6.04.02; CIGRE: Paris, France, 2014; p. 119. [Google Scholar]
- del Nozal, Á.R.; Barragán-Villarejo, M.; de Paula García-López, F.; Dobric, G.; Mauricio, J.M.; Maza-Ortega, J.M.; Stefanov, P. A model-less approach for the optimal coordination of renewable energy sources and DC links in low-voltage distribution networks. Electr. Power Syst. Res. 2024, 234, 110770. [Google Scholar] [CrossRef]
- Zhang, M.; Wang, W.; Ding, J. Study on improved droop control strategy of MMC-MTDC system based on novel sliding mode control. Energy Rep. 2021, 7, 1258–1269. [Google Scholar] [CrossRef]
- Minetti, M.; Rosini, A.; Denegri, G.B.; Bonfiglio, A.; Procopio, R. An advanced droop control strategy for reactive power assessment in islanded microgrids. IEEE Trans. Power Syst. 2021, 37, 3014–3025. [Google Scholar] [CrossRef]
- Sevostyanov, N.A.; Gorbunov, R.L. Control strategy to mitigate voltage ripples in droop-controlled DC microgrids. IEEE Trans. Power Electron. 2023, 38, 15377–15389. [Google Scholar] [CrossRef]
- Ghalib, M.A.; Shehat, E.; Thomas, J.; Mostafa, R. Adaptive droop control for high-performance operation in low-voltage DC microgrids. Electr. Eng. 2019, 101, 1311–1322. [Google Scholar] [CrossRef]
- Fan, B.; Li, Q.; Wang, W.; Yao, G.; Ma, H.; Zeng, X.; Guerrero, J.M. A novel droop control strategy of reactive power sharing based on adaptive virtual impedance in microgrids. IEEE Trans. Ind. Electron. 2021, 69, 11335–11347. [Google Scholar] [CrossRef]
- Sun, P.; Wang, Y.; Khalid, M.; Blasco-Gimenez, R.; Konstantinou, G. Steady-state power distribution in VSC-based MTDC systems and dc grids under mixed P/V and I/V droop control. Electr. Power Syst. Res. 2023, 214, 108798. [Google Scholar] [CrossRef]
- Kotb, O.; Ghandhari, M.; Eriksson, R.; Leelaruji, R.; Sood, V.K. Stability enhancement of an interconnected AC/DC power system through VSC-MTDC operating point adjustment. Electr. Power Syst. Res. 2017, 151, 308–318. [Google Scholar] [CrossRef]
- Zhang, B.; Gao, F.; Zhang, Y.; Liu, D.; Tang, H. An AC-DC coupled droop control strategy for VSC-based DC microgrids. IEEE Trans. Power Electron. 2022, 37, 6568–6584. [Google Scholar] [CrossRef]
- Altorok, M.; Ukil, A.; Nair, N.K.C.; Rayudu, R. Review on optimal power flow in a hybrid AC/DC distribution network. Electr. Power Syst. Res. 2024, 236, 110956. [Google Scholar] [CrossRef]
- Hassan, S.J.U.; Mehdi, A.; Haider, Z.; Song, J.S.; Abraham, A.D.; Shin, G.S.; Kim, C.H. Towards medium voltage hybrid AC/DC distribution Systems: Architectural Topologies, planning and operation. Int. J. Electr. Power Energy Syst. 2024, 159, 110003. [Google Scholar] [CrossRef]
- Kaharevic, A.; Silva, E.S.; Ponci, F.; Monti, A. Validation of energy services in a hybrid AC-DC grid with an MVDC pilot link. In Proceedings of the 22nd IET International Conference on AC and DC Power Transmission (ACDC Global 2025); IET: London, UK, 2025; Volume 2025, pp. 220–225. [Google Scholar] [CrossRef]
- Mousavi, M.H.; Moradi, H.; Rouzbehi, K. Architecture of AC-DC Energy Nodes in Supergrids: A Technical Foundation for Future Renewable Integration. In Proceedings of the 2025 Fifth National and the First International Conference on Applied Research in Electrical Engineering (AREE); IEEE: Piscataway, NJ, USA, 2025; pp. 1–7. [Google Scholar]
- Yang, C.; Gao, F.; Zhang, B. An improved nonlinear droop control strategy in DC microgrids. IEEE Trans. Power Electron. 2024, 39, 5058–5073. [Google Scholar] [CrossRef]
- Li, Q.; Yan, C.; Han, Y.; Zeng, H.; Zalhaf, A.S.; Yang, P.; Wang, C. Optimizing power sharing and voltage control in DC microgrids using a novel adaptive droop control strategy based on current consensus algorithm. Sustain. Energy Grids Netw. 2024, 38, 101386. [Google Scholar] [CrossRef]
- Shahgholian, G.; Moradian, M.; Fathollahi, A. Droop control strategy in inverter-based microgrids: A brief review on analysis and application in islanded mode of operation. IET Renew. Power Gener. 2025, 19, e13186. [Google Scholar] [CrossRef]
- Valerio, B.C.; Lacerda, V.A.; Cheah-Mane, M.; Gebraad, P.; Gomis-Bellmunt, O. An optimal power flow tool for AC/DC systems, applied to the analysis of the North Sea Grid for offshore wind integration. IEEE Trans. Power Syst. 2025, 40, 4278–4291. [Google Scholar] [CrossRef]
- Gross-Muresan, A.M.; Majstorovic, M.; Matas-Díaz, F.J.; Dobric, G.; Barragán-Villarejo, M.; Maza-Ortega, J.M. Independent per-phase power control in four-leg grid-following voltage source converters. In Proceedings of the 2024 International Symposium on Power Electronics, Electrical Drives, Automation and Motion (SPEEDAM); IEEE: Piscataway, NJ, USA, 2024; pp. 1105–1110. [Google Scholar]
- Malamaki, K.N.D.; Christofis, D.A.; Kryonidis, G.C.; Demoulias, C.S. Voltage Harmonic Mitigation by Distributed Renewable Energy Sources in Low-Voltage Distribution Networks: Sensitivity Analysis. IEEE Trans. Ind. Appl. 2024, 60, 7656–7671. [Google Scholar] [CrossRef]
Figure 1.
The CIGRE European low-voltage (LV) benchmark distribution grid.
Figure 1.
The CIGRE European low-voltage (LV) benchmark distribution grid.
Figure 2.
Proposed minimal hybrid configuration topology for the AC/DC CIGRE LV benchmark (Topology–1).
Figure 2.
Proposed minimal hybrid configuration topology for the AC/DC CIGRE LV benchmark (Topology–1).
Figure 3.
Proposed mixed-wiring configuration topology for the AC/DC CIGRE LV benchmark (Topology–2).
Figure 3.
Proposed mixed-wiring configuration topology for the AC/DC CIGRE LV benchmark (Topology–2).
Figure 4.
Proposed fully hybrid AC/DC configuration topology for the AC/DC CIGRE LV benchmark (Topology–3).
Figure 4.
Proposed fully hybrid AC/DC configuration topology for the AC/DC CIGRE LV benchmark (Topology–3).
Figure 5.
Proposed AC overloading profile (Load–1). The dotted lines represent the operational limits of each feeder.
Figure 5.
Proposed AC overloading profile (Load–1). The dotted lines represent the operational limits of each feeder.
Figure 6.
High DC load profile (Load–2), where 30% of the total active and reactive power are supplied through the DC network.
Figure 6.
High DC load profile (Load–2), where 30% of the total active and reactive power are supplied through the DC network.
Figure 7.
Active and reactive power (kW and kvar) of the grid under different loading conditions: (a) Load–1 and (b) Load–2.
Figure 7.
Active and reactive power (kW and kvar) of the grid under different loading conditions: (a) Load–1 and (b) Load–2.
Figure 8.
Primary-level decentralized droop control architecture applied to the VSCs in the proposed hybrid AC/DC topologies.
Figure 8.
Primary-level decentralized droop control architecture applied to the VSCs in the proposed hybrid AC/DC topologies.
Figure 9.
Voltage profiles at R10, I02, and C09 under the Load–2 scenario.
Figure 9.
Voltage profiles at R10, I02, and C09 under the Load–2 scenario.
Figure 10.
Voltage profiles at R14, C11, and C16 under the Load–2 scenario.
Figure 10.
Voltage profiles at R14, C11, and C16 under the Load–2 scenario.
Figure 11.
Voltage profiles at R01, I01, and C01 under the Load–2 scenario.
Figure 11.
Voltage profiles at R01, I01, and C01 under the Load–2 scenario.
Figure 12.
Voltage profiles at R15, R16, R17, and R18 under the Load–2 scenario.
Figure 12.
Voltage profiles at R15, R16, R17, and R18 under the Load–2 scenario.
Figure 13.
Voltage profiles at C14, C17, C19, and C20 under the Load–2 scenario.
Figure 13.
Voltage profiles at C14, C17, C19, and C20 under the Load–2 scenario.
Figure 14.
Current profiles for each feeder under the Load–2 scenario.
Figure 14.
Current profiles for each feeder under the Load–2 scenario.
Figure 15.
Voltage profiles at buses connected to VSCs under the Load–1 scenario.
Figure 15.
Voltage profiles at buses connected to VSCs under the Load–1 scenario.
Figure 16.
Voltage profiles at the most challenging remote residential and commercial buses under the Load–1 scenario.
Figure 16.
Voltage profiles at the most challenging remote residential and commercial buses under the Load–1 scenario.
Figure 17.
Current profiles for each feeder under the Load–1 scenario.
Figure 17.
Current profiles for each feeder under the Load–1 scenario.
Table 1.
Technical parameters of the proposed DC grid components.
Table 1.
Technical parameters of the proposed DC grid components.
| Component | Technical Specifications |
|---|
| DC line impedances (UG type) | Line lengths (m): S01–S03: 70; S03–S04: 35; S04–S06: 70; S06–S07: 105; S07–S09: 30;
S09–S10: 30; S03–S11: 30; S04–S14: 105; S14–S15: 35; S06–S16: 30;
S09–S17: 30; S10–S18: 30; H01–H02: 200; D01–D03: 60; D03–D05: 60;
D05–D08: 90; D08–D09: 30; D03–D11: 90; D11–D12: 90; D05–D16: 60;
D16–D17: 30; D08–D19: 30; D09–D20: 30; S07–H02: 30; H02–D19: 30. |
| Buses | All buses operate at a nominal DC voltage of 800 V. |
| Current rating | All DC lines are rated at 300 A. |
Table 2.
Main parameters of the CIGRE LV benchmark network used in this study.
Table 2.
Main parameters of the CIGRE LV benchmark network used in this study.
| Parameter | Value |
|---|
| Nominal AC voltage | 400 V |
| Transformer rating | 20 kV/0.4 kV |
| Short-circuit impedance | , |
| Number of feeders | 3 |
| Residential feeder buses | 18 (R01–R18) |
| Industrial feeder buses | 2 (I01–I02) |
| Commercial feeder buses | 20 (C01–C20) |
| Total AC buses | 40 |
| Number of VSC converters | 9 |
Table 3.
Performance summary of the AC/DC CIGRE topologies with droop control.
Table 3.
Performance summary of the AC/DC CIGRE topologies with droop control.
| Metric | Topology 1 | Topology 2 | Topology 3 |
|---|
| Voltage regulation | Within ±5% range; undervoltage observed at R10/C09 and R14/C11 (<220 V) | Within range; stable operation for most buses (Figure 10) | Within range under both Load–1 and Load–2; best performance at R15–R18 (Figure 12, Figure 13, Figure 15 and Figure 16) |
| Current control | Lowest median current; all feeders within limits (Figure 14) | Current exceeds limits under Load–2 (Figure 14) | Optimal balance; compliant under both Load–1 and Load–2 |
Table 4.
Comparative performance of AC/DC topologies with and without droop control.
Table 4.
Comparative performance of AC/DC topologies with and without droop control.
| Metric | No Droop | Topology 1 + Droop | Topology 2 + Droop | Topology 3 + Droop |
|---|
| Voltage violations | Undervoltage at R10/C09 (<220 V; Figure 9) | Borderline voltage at R14/C11 | All buses within limits | Best voltage margins (Figure 12, Figure 13, Figure 15 and Figure 16) |
| Current exceedance | RES/COM feeders exceed limits (Figure 14) | All feeders within limits | Industrial feeder issues observed | All feeders within limits (Figure 14 and Figure 17) |
Table 5.
Comprehensive topology performance comparison.
Table 5.
Comprehensive topology performance comparison.
| Metric | Topology 1 | Topology 2 | Topology 3 | Best |
|---|
| Maximum current reduction (Load–2) | Low | Intermediate | High reduction | Topology 3 |
| | | | Across all feeders compared with other topologies | |
| Maximum current reduction (Load–1) | Low | Not applicable | High reduction | Topology 3 |
| | | | Across all feeders compared with Topology 1 | |
| Violation elimination | Partial | Ineffective | Complete | Topology 3 |
| Disclaimer/Publisher’s Note: The statements, opinions and data contained in all publications are solely those of the individual author(s) and contributor(s) and not of MDPI and/or the editor(s). MDPI and/or the editor(s) disclaim responsibility for any injury to people or property resulting from any ideas, methods, instructions or products referred to in the content. |