Article

Analysis of Cutting Forces Response to Machining Parameters Under Dry and Wet Machining Conditions in X5CrNi18-10 Turning

by
Csaba Felhő
1,*,
Tanuj Namboodri
1 and
Daynier Rolando Delgado Sobrino
2
1
Institute of Manufacturing Science, University of Miskolc, 3515 Miskolc, Hungary
2
Faculty of Materials Science and Technology in Trnava, Institute of Production Technologies, Slovak University of Technology in Bratislava, 917 24 Trnava, Slovakia
*
Author to whom correspondence should be addressed.
Submission received: 10 December 2025 / Revised: 29 December 2025 / Accepted: 6 January 2026 / Published: 8 January 2026
(This article belongs to the Special Issue Emerging Trends and Technologies in Manufacturing Engineering)

Abstract

The shift toward digital and smart manufacturing requires an accurate prediction of cutting behavior, such as cutting forces. Controlling cutting forces in machining is important for maintaining product quality, particularly in steels such as X5CrNi18-10. This steel has high toughness, which resists cutting, thereby increasing overall cutting forces. Proper selection of machining parameters and conditions can help reduce cutting forces during machining. Several studies have been dedicated to understanding the influence of cutting parameters on cutting forces. However, limited attention is given to the influence of the cutting conditions on cutting forces. The primary objective of this study is to understand the behavior of cutting forces in chromium-nickel alloy steel by varying machining parameters, specifically cutting conditions (dry and wet), using a full factorial (31 × 22) design of experiments (DoE). The secondary objective is to develop a multilinear regression model to predict cutting forces. The root mean square (RMS) values of the cutting force components were calculated from the acquired data and analyzed using OriginPro 2025b. In addition, this study analyzes the effects of cutting parameters and cutting forces on root mean square (RMS) surface roughness (Rq) to understand their impact on quality using the AltiSurf 520 profilometer. The results suggest a significant effect of the selected machining parameters and conditions on cutting force reduction and on improved surface quality when cutting forces are low. This research provides a valuable insight into optimizing the machining process for hard steels.

1. Introduction

The transformation of industry towards digital and smart manufacturing requires the ability to predict the cutting behavior, such as cutting forces, to optimize the manufacturing and production [1,2,3]. By analyzing these effects, manufacturers can optimize the machining process to improve efficiency and reduce the initial cycle times. Overall, it will help reduce costs and provide a high-quality product [4,5]. Machine learning tools like ANN models rely on high-quality experimental data, especially cutting forces data in machining. Understanding hard steel can be challenging due to its properties, but it is necessary to develop an intelligent process monitoring system that aligns with Industry 4.0 goals [6,7].
In stainless steel, cutting forces are usually higher because it requires more effort to machine, specifically, when it contains Chromium (Cr) and Nickel (Ni), which provide the steel’s strength but make it hard to cut [8,9,10]. Several studies have focused on understanding cutting forces in stainless steel. Machining parameters such as cutting speed (vc), feed (f), and depth of cut (ap) play an important role in understanding cutting forces, as they influence the forces during machining. Moreover, the cutting forces affect the surface integrity of the machined part. Sztankovics et al. [11,12] noted that turning operations can replace grinding for surface finishing in precision manufacturing, provided the process is thoroughly analyzed. Such replacement is possible when the cutting forces are properly analyzed.
Labuda et al. [13] studied the influence of low cutting speed on X5CrNi18-10 steel. They noted that several factors affect the geometric structure and surface quality of difficult-to-machine materials, including machining parameters, tool material, and workpiece material. The study uses cutting speeds of 200 m/min and 150 m/min to analyze cutting forces with different inserts. However, the study lacks an analysis of coolant use. Lalwani et al. [14] studied the influence of cutting parameters on cutting forces in MDN250 steel, where cutting speed, feed rate, and depth of cut were varied at three levels. The study highlights that cutting speed has no significant effect on any of the cutting force components or surface roughness, while feed rate and depth of cut dominate cutting forces. The experiments were carried out entirely under dry conditions. Bhokse et al. [15] studied chip formation and plowing cutting forces in hard turning. The cutting parameters were varied, cutting speed at 100, 150, and 200 m/min, feed at 0.1, 0.2, and 0.3 mm/rev, and depth of cut at 0.1, 0.3, and 0.5. The study highlights that at a lower depth of cut, plowing forces dominate chip-forming forces. This study does not find the effect of coolant on cutting forces. Korkmaz et al. [16] studied the machinability of Nimonic 80A superalloy using cutting forces in both experimental and simulation. The research highlights that cutting forces, specifically feed forces, increase as feed and depth of cut increase, and with an increase in cutting speed, the cutting force components decrease.
Hong et al. [17] studied the influence of cutting parameters on cutting forces during the turning of AISI 1055 steel. The machining parameters, spindle speed 460, 650, 910 rev/min, feed 0.08, 0.194, 0.302 mm/rev, depth of cut 0.2, 0.35, 0.5 mm, and tool nose radius 0.2, 0.4, 0.6 mm, were varied at three levels under dry machining conditions. The study highlights that spindle speed and tool nose radius effects axial cutting force (Fz). Zerti et al. [18] studied the influence of cutting parameters on cutting forces during the dry hard turning of AISI 420 stainless steel. The machining parameters, cutting speed 80, 120, 170, 240, and 340 m/min, feed rate 0.08, 0.12, 0.16, 0.2, and 0.24 mm/rev, and depth of cut 0.1, 0.2, 0.3, 0.4, and 0.5 mm, were varied at five levels using a Taguchi L25 design of experiment (DoE). The study highlights that the depth of cut has the most effect on the cutting force component Fz, while cutting speed showed minimal effect. Patra et al. [19] studied the influence of cutting parameters on cutting forces during micro-drilling of austenitic stainless steel X5CrNi18-10. The study highlights that feed rate has the most significant impact on all cutting force components − F c , F p   o r   F r , F f , while cutting speed has only a minor effect. The machining was performed using a mineral oil-based coolant, which was supplied into the drilling zone to assist cooling and chip removal. Although it is important to use coolant in drilling, it does not compare to dry and coolant machining conditions. So, no conclusions can be drawn about the difference between dry and wet machining from this work.
Laghari et al. [20] studied the influence of cutting parameters on cutting forces during the turning of Al45 where cutting speed was varied at 4 level 6.283, 12.566, 18.85, and 25.133 m/min, feed rate was varied at four level 0.01, 0.015, 0.02 and 0.025 mm/rev, and depth of cut 0.2, 0.5, 1, and 1.5 mm, using a Box–Behnken design. The study highlights that the depth of cut has the most significant impact on all cutting force components − F c , F p , F f , followed by the feed rate, while cutting speed shows a reducing effect on the forces due to thermal softening at higher speeds. Several studies highlight the effect of cutting parameters on cutting forces; however, limited attention is given to the effect of machining conditions, such as dry and wet conditions, on cutting forces. Cutting force components are indicators of tool-workpiece interaction and directly influence surface formation through plastic deformation and tool deflection. Many studies primarily focus on the influence of cutting parameters on surface roughness. There is a need to understand the effect of cutting forces on the surface quality. These studies of machining conditions are important to manufacturers, as they help identify optimal machining parameters that maximize productivity and improve product quality.
This study aims to investigate the influence of cutting parameters (feed and spindle speed) and cutting conditions (dry and wet) on cutting forces through a full factorial (31 × 22) design of experiments (DOE) in outer-diameter turning of X5CrNi18-10 steel; furthermore, to develop a multilinear regression model based on dry and wet machining conditions with spindle speed and feed variation to predict the cutting forces. In addition, this study also analyzes the root mean square surface roughness parameters to check the effect of machining parameters and cutting forces on the quality of the machined part.

2. Materials and Methods

2.1. Full Factorial Design of Experiment (DoE)

The design of the experiment plays an important role in the sustainability of the manufacturing process; a proper selection of the DoE can help control material waste and improve efficiency by reducing initial cycle time [21].
Before the experiment, several studies were reviewed and the parameters selected. The chosen cutting parameters were selected primarily based on the literature review and to find new responses, secondly, on the manufacturer’s recommendation for the X5CrNi18-10 material and tool. In previous studies [13,15,22], the parameters studied were cutting speed (vc) 100–200 m/min, feed (f) 0.08–0.6 mm/rev, and depth of cut (ap) 0.2–0.5 mm.
To find new responses, the experiment was conducted using three spindle speeds—1000 rpm (vc—141.4 m/min), 1500 rpm (vc—212.1 m/min), and 2000 rpm (vc—282.7 m/min). The feed was set at two levels, 0.1 mm/rev and 0.3 mm/rev, while the depth of cut remained constant at 0.5 mm. In a previous study [22], it was found that depth of cut did not significantly affect cutting force variation, so it was kept constant. The most important factor is the selection of machining conditions (dry and wet). Full factorial (31 × 22) DoE was created as shown in Table 1. The DoE provides sufficient variation in a limited number of experiments to understand the effect of machining parameters and conditions on cutting forces. Also, the effect of cutting forces on the surface quality.

2.2. Workpiece Preparation

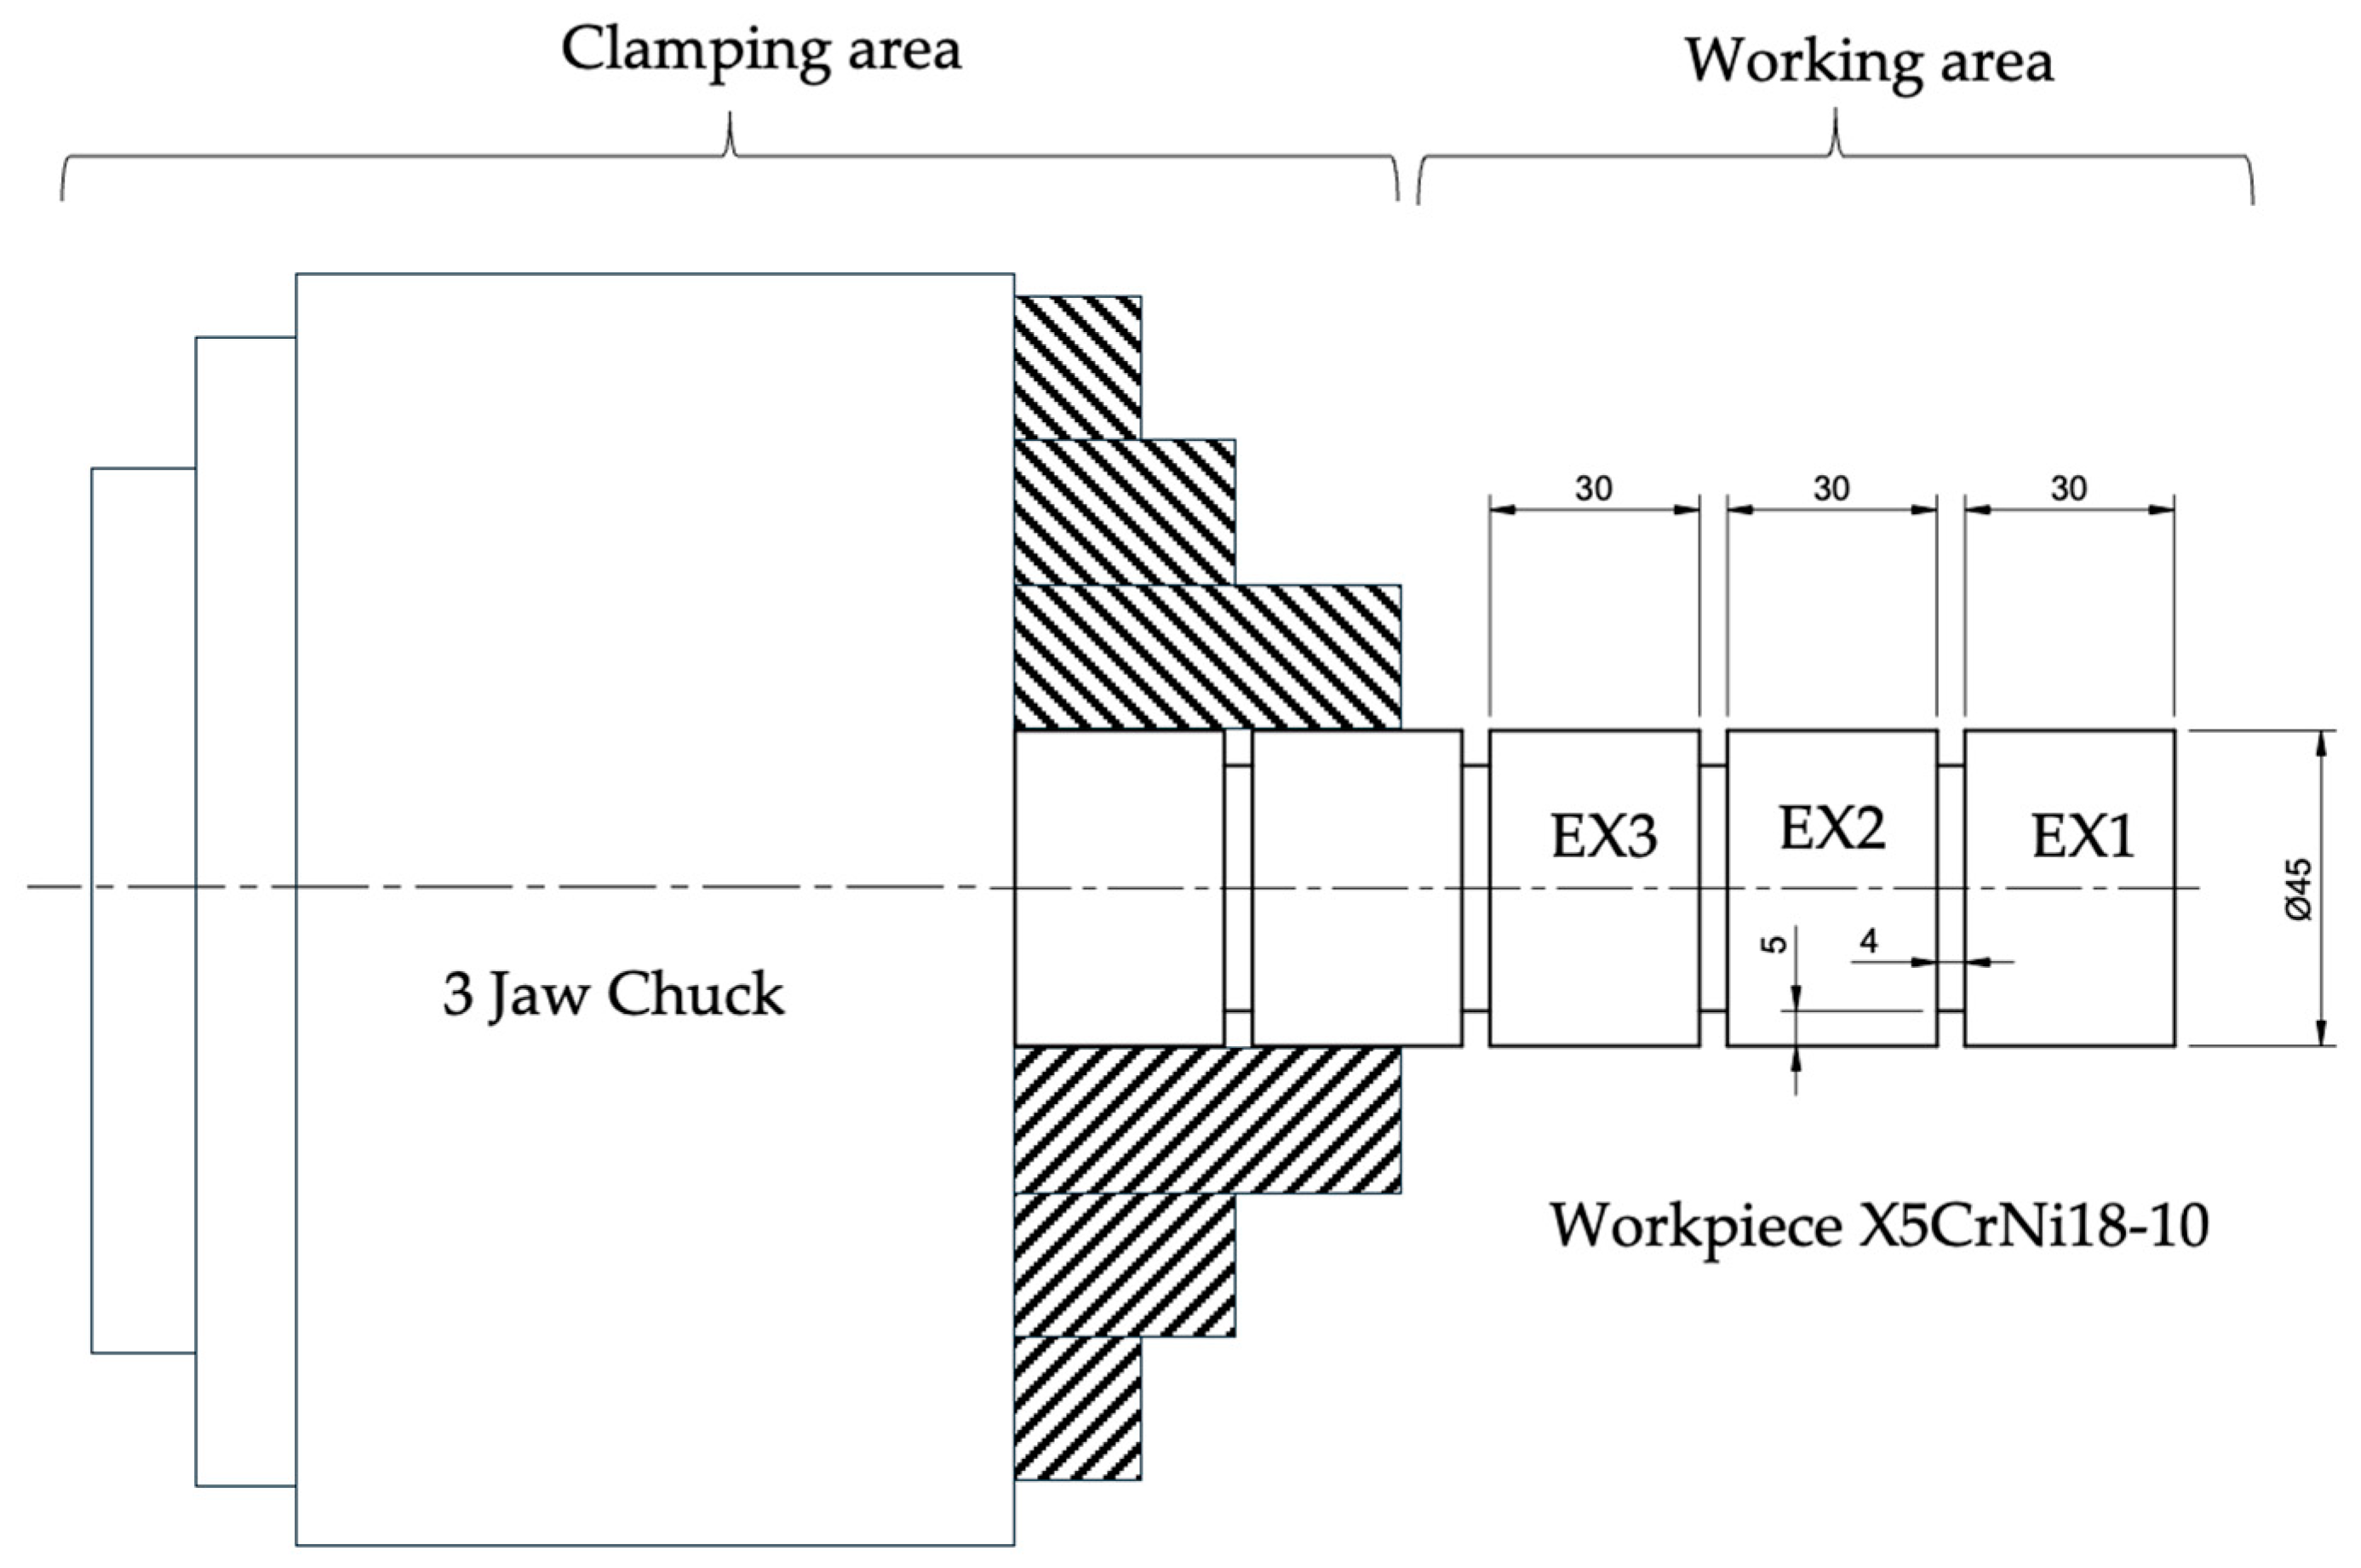
Based on the experimental design, the workpiece was prepared from X5CrNi18-10 material for the outer-diameter turning operation on a cylindrical bar with a 45 mm diameter, with 30 mm sections divided by a deep groove with a 4 mm gap. In total, four cylindrical bars were used for the experiment. The schematic diagram of the workpiece is presented in Figure 1. The X5CrNi18-10 is widely used in marine industries because of its quality, such as corrosion resistance and high toughness [13].

2.3. Machine Tools

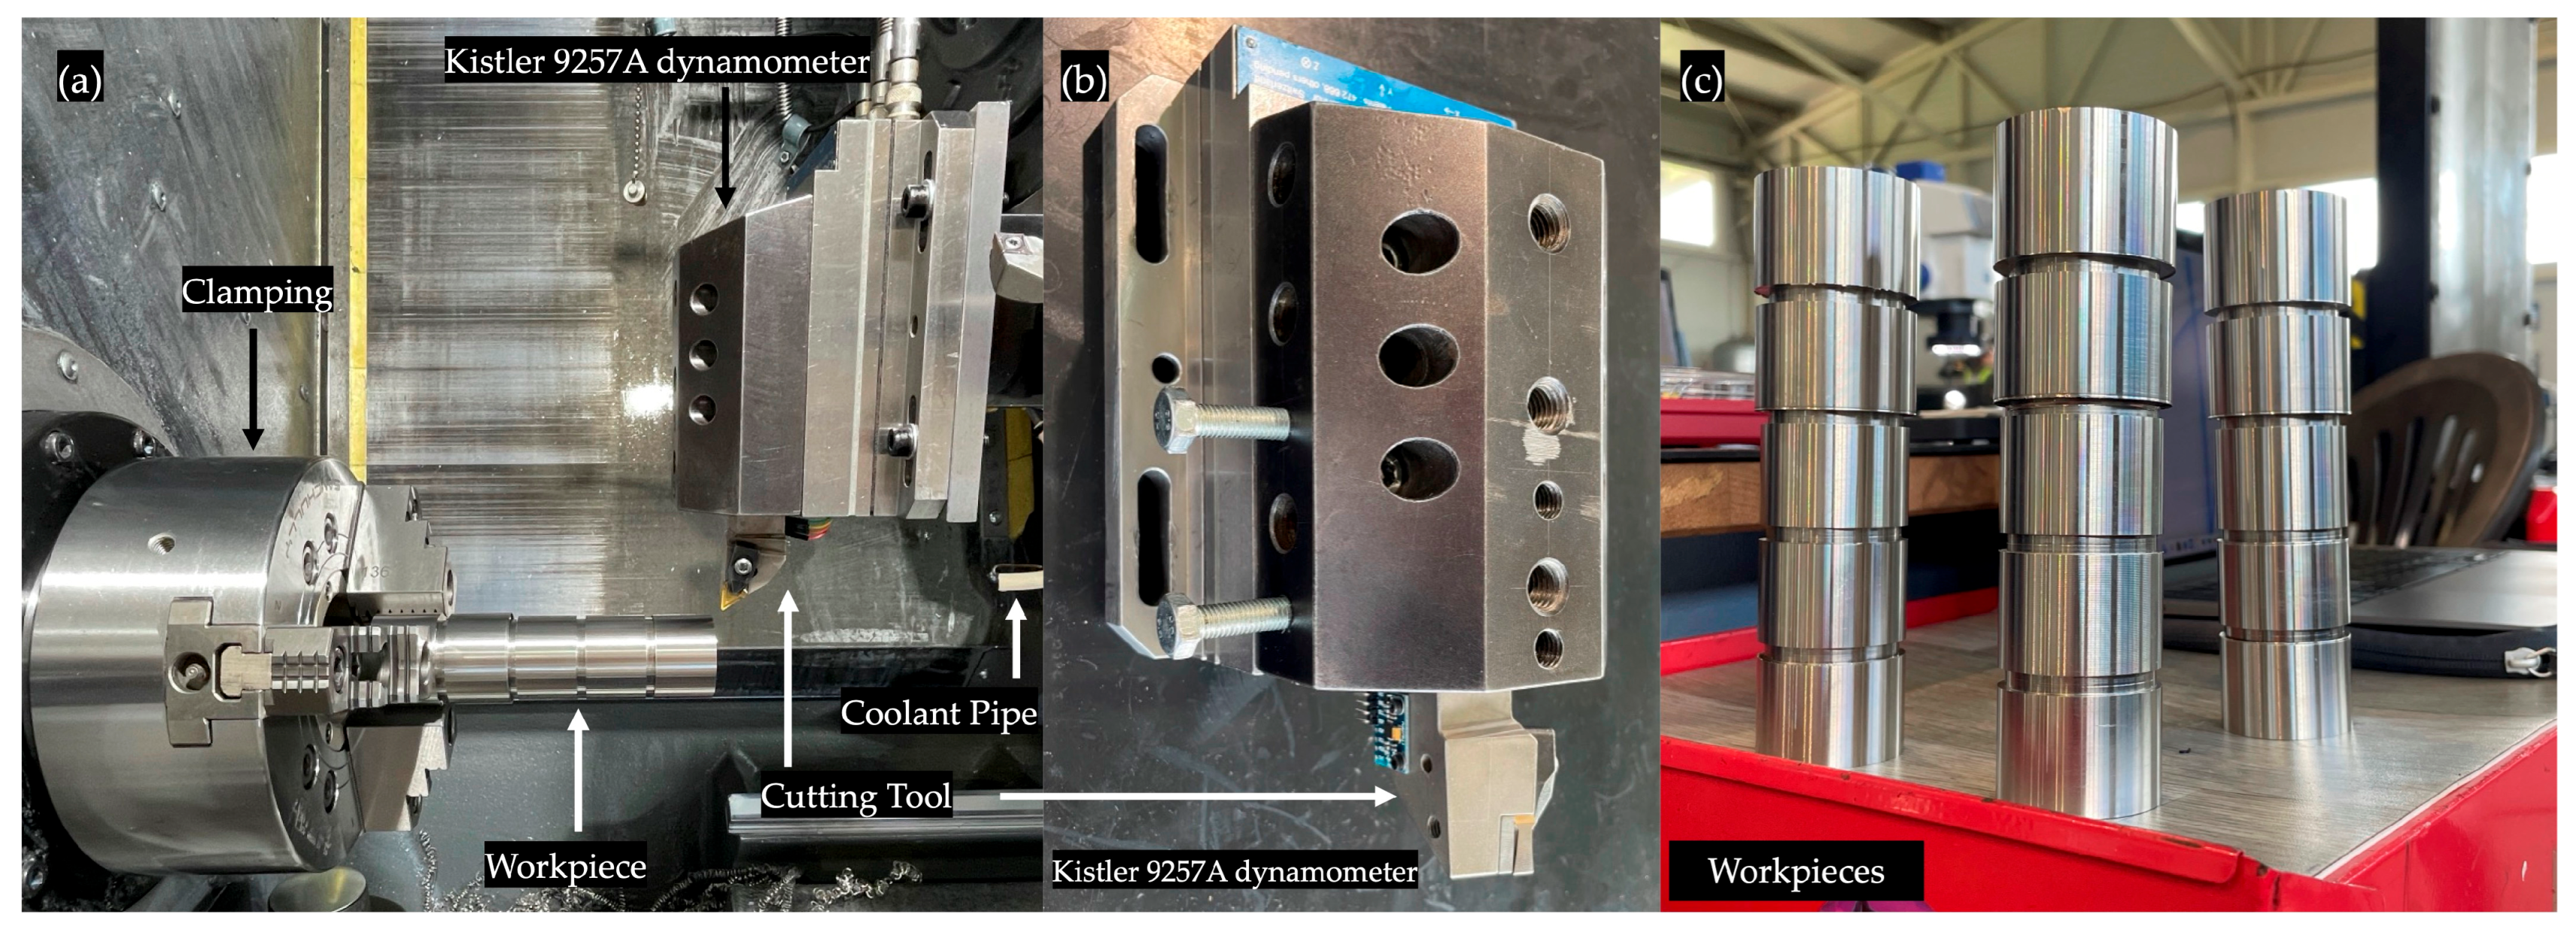
The machine used for the experiment was a Haas Automation ST-20Y (Haas Automation, Inc., Leoben, Austria) series CNC Lathe. The machine can reach a maximum of 4000 rpm; however, the experiments were conducted under 2000 rpm [Refer to Table 1]. The experimental setup is shown in Figure 2. The holder used for cutting insert was DDJNL2525M15 from Seco Tools (Seco Tools, Björnbacksvägen, Sweden) [23]. Its shank is 25 mm in length and 25 mm in width. According to the manufacturer (Seco tool), it provides good rigidity and helps reduce vibration during machining. The insert used in the experiment was DNMG150604-MF1 CP500 from Seco Tools (Seco Tools, Björnbacksvägen, Sweden) [23]. The insert is CP500-coated with PVD Carbide. The coating helps to prevent unwanted tool wear in the machining of hard steel. The insert is equipped with an MF1 chip breaker designed to support smoother chip flow and provide good surface quality. The nose radius of the tool was 0.4 mm, which is suitable for semi-finishing, and the 55-degree diamond-shaped profile helps reduce power requirements during turning. New inserts were used for the dry and wet machining conditions separately, so the tool wear does not affect the cutting forces during the machining operation. The cutting fluid used for the wet machining condition is 5% HKF 420 emulsion oil (CIKS Kft., Miskolc, Hungary). It is a high-performance sulphur-containing liquid specifically for metal cutting. It has corrosion inhibitors and biocides, which provide microbial stability and protect machined surfaces from corrosion.

2.4. Measurement Setup

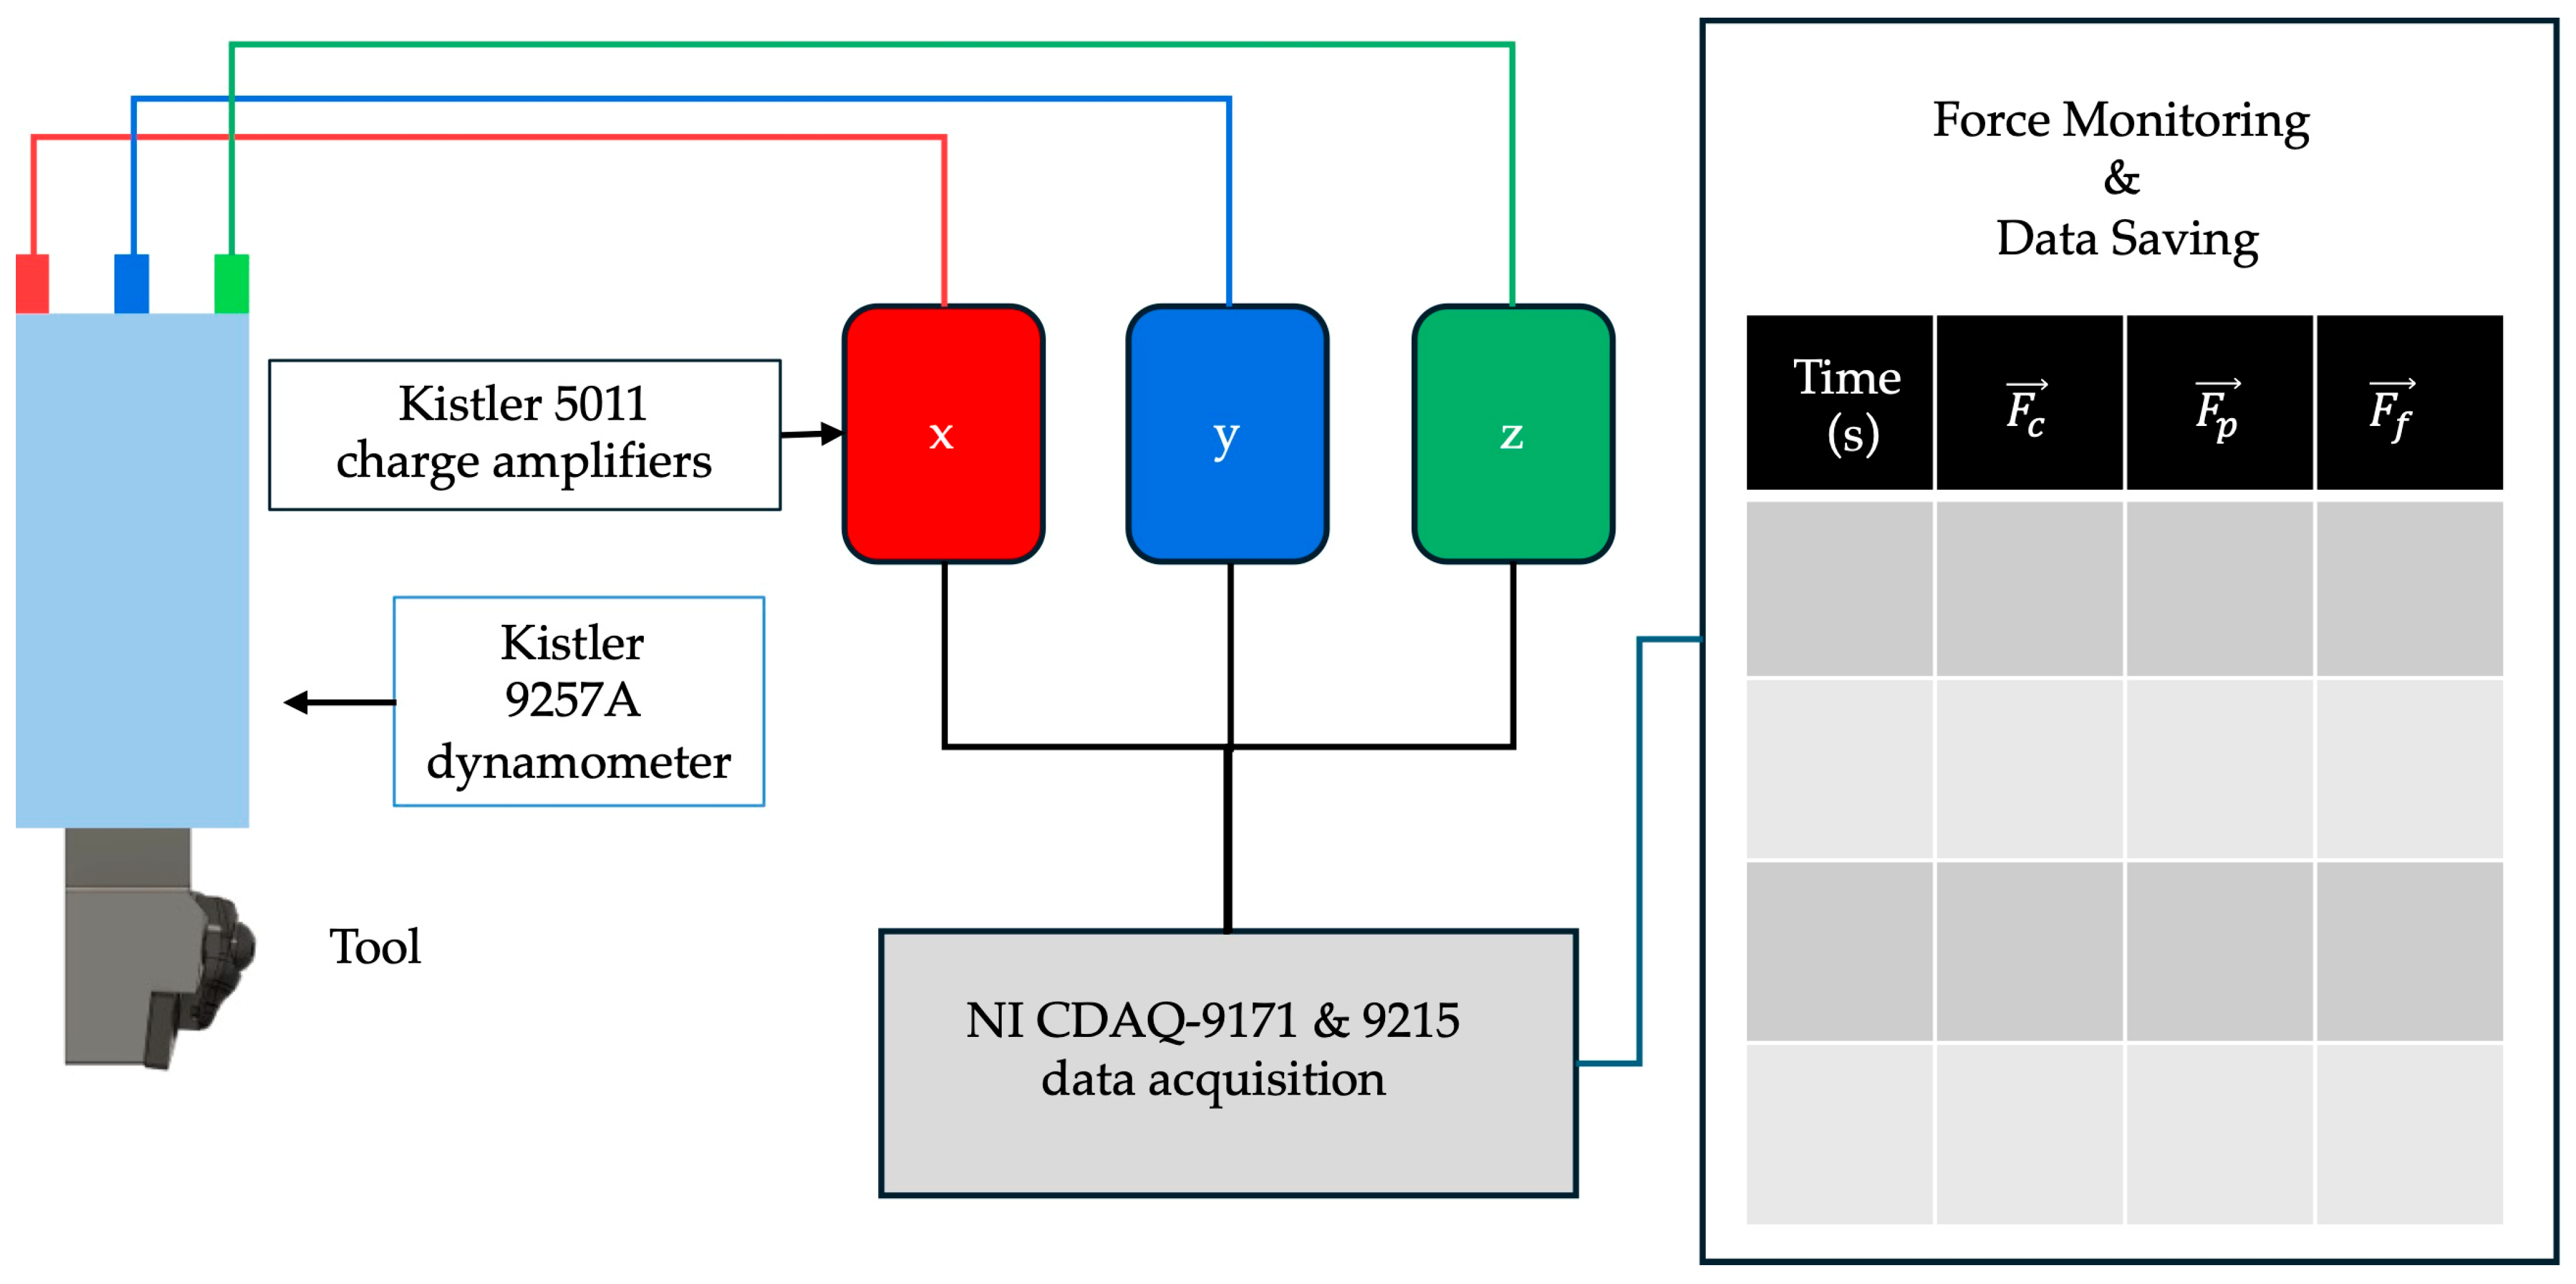
The key part of the study is measuring the cutting forces under the dry and wet machining conditions and analyzing their effect on the quality of machined workpieces. In this study, the cutting force measurements were recorded using the three-component piezoelectric dynamometer 9257A from Kristler Corporation (Kistler AG, Winterthur, Switzerland). The signals were routed through a 5015A charge amplifier with a shield cable to protect it from chips. The amplified signals were then sent to an analog-to-digital converter. The digital data was transferred to a computer, which served as the main platform for data monitoring and storage as shown in Figure 3. For the measurement of surface roughness, an AltiMap 6.2 using AltiSurf 520 (Altimet SAS, Thonon-les-Bains, France) 3D surface topography analyzer equipment was used with a CL2 confocal chromatic probe and with an MG140 magnifier. The surface 2D profile was determined according to ISO 21920-2 [24], and a filter (λc) was applied as specified in ISO 21920-3 [25].

2.5. Analysis

The first part of the analysis consists of the measurement of cutting forces using a three-component piezoelectric dynamometer. The dynamometer data were then stored in the spreadsheet. The spreadsheet was evaluated in OriginPro 2025b with an academic license version of the software. At first, the raw data was gathered in a spreadsheet, and then, with the chart, it was divided into experiments. To visualize the effect of machining parameters and cutting conditions, a chart was generated with raw data. After that, the RMS value of cutting forces was calculated. The RMS of all cutting force components—Tangential ( F c ), Radial ( F p ), and Axial ( F f )—were computed, and then resultant cutting forces ( F R ) were calculated. To address the primary goal of the study, the percentage reduction was calculated from dry to wet.
In another part, a multilinear regression model was developed to predict the cutting forces. ANOVA was used to identify the significance of the cutting forces, and a regression equation was developed with feed, spindle speed, and machining condition (dry and wet). The application of ANOVA in this study is supported by assumptions of statistical analysis; analysis of variance implies independence and homogeneity of observations.
Furthermore, to understand the effect of machining parameters and cutting forces on the quality of the machined product, the root mean square (RMS) surface roughness (Rq) was measured, and ANOVA between cutting forces and Rq was performed. Rq is a surface roughness parameter representing the statistical deviation of surface heights from the mean line; it is calculated as the square root of the average of squared height deviations, essentially the standard deviation of the profile [26]. It quantifies surface roughness, indicating peaks and valleys in the surface. In this study, Rq surface roughness parameter is used to compare with the cutting forces because it reflects the RMS in surface deviation. This parameter is sensitive to surface texture and influenced by the cutting dynamics. Studies suggest that Rq sensitivity aligns with cutting forces and vibration and can be predicted by monitoring them [27,28].

3. Results

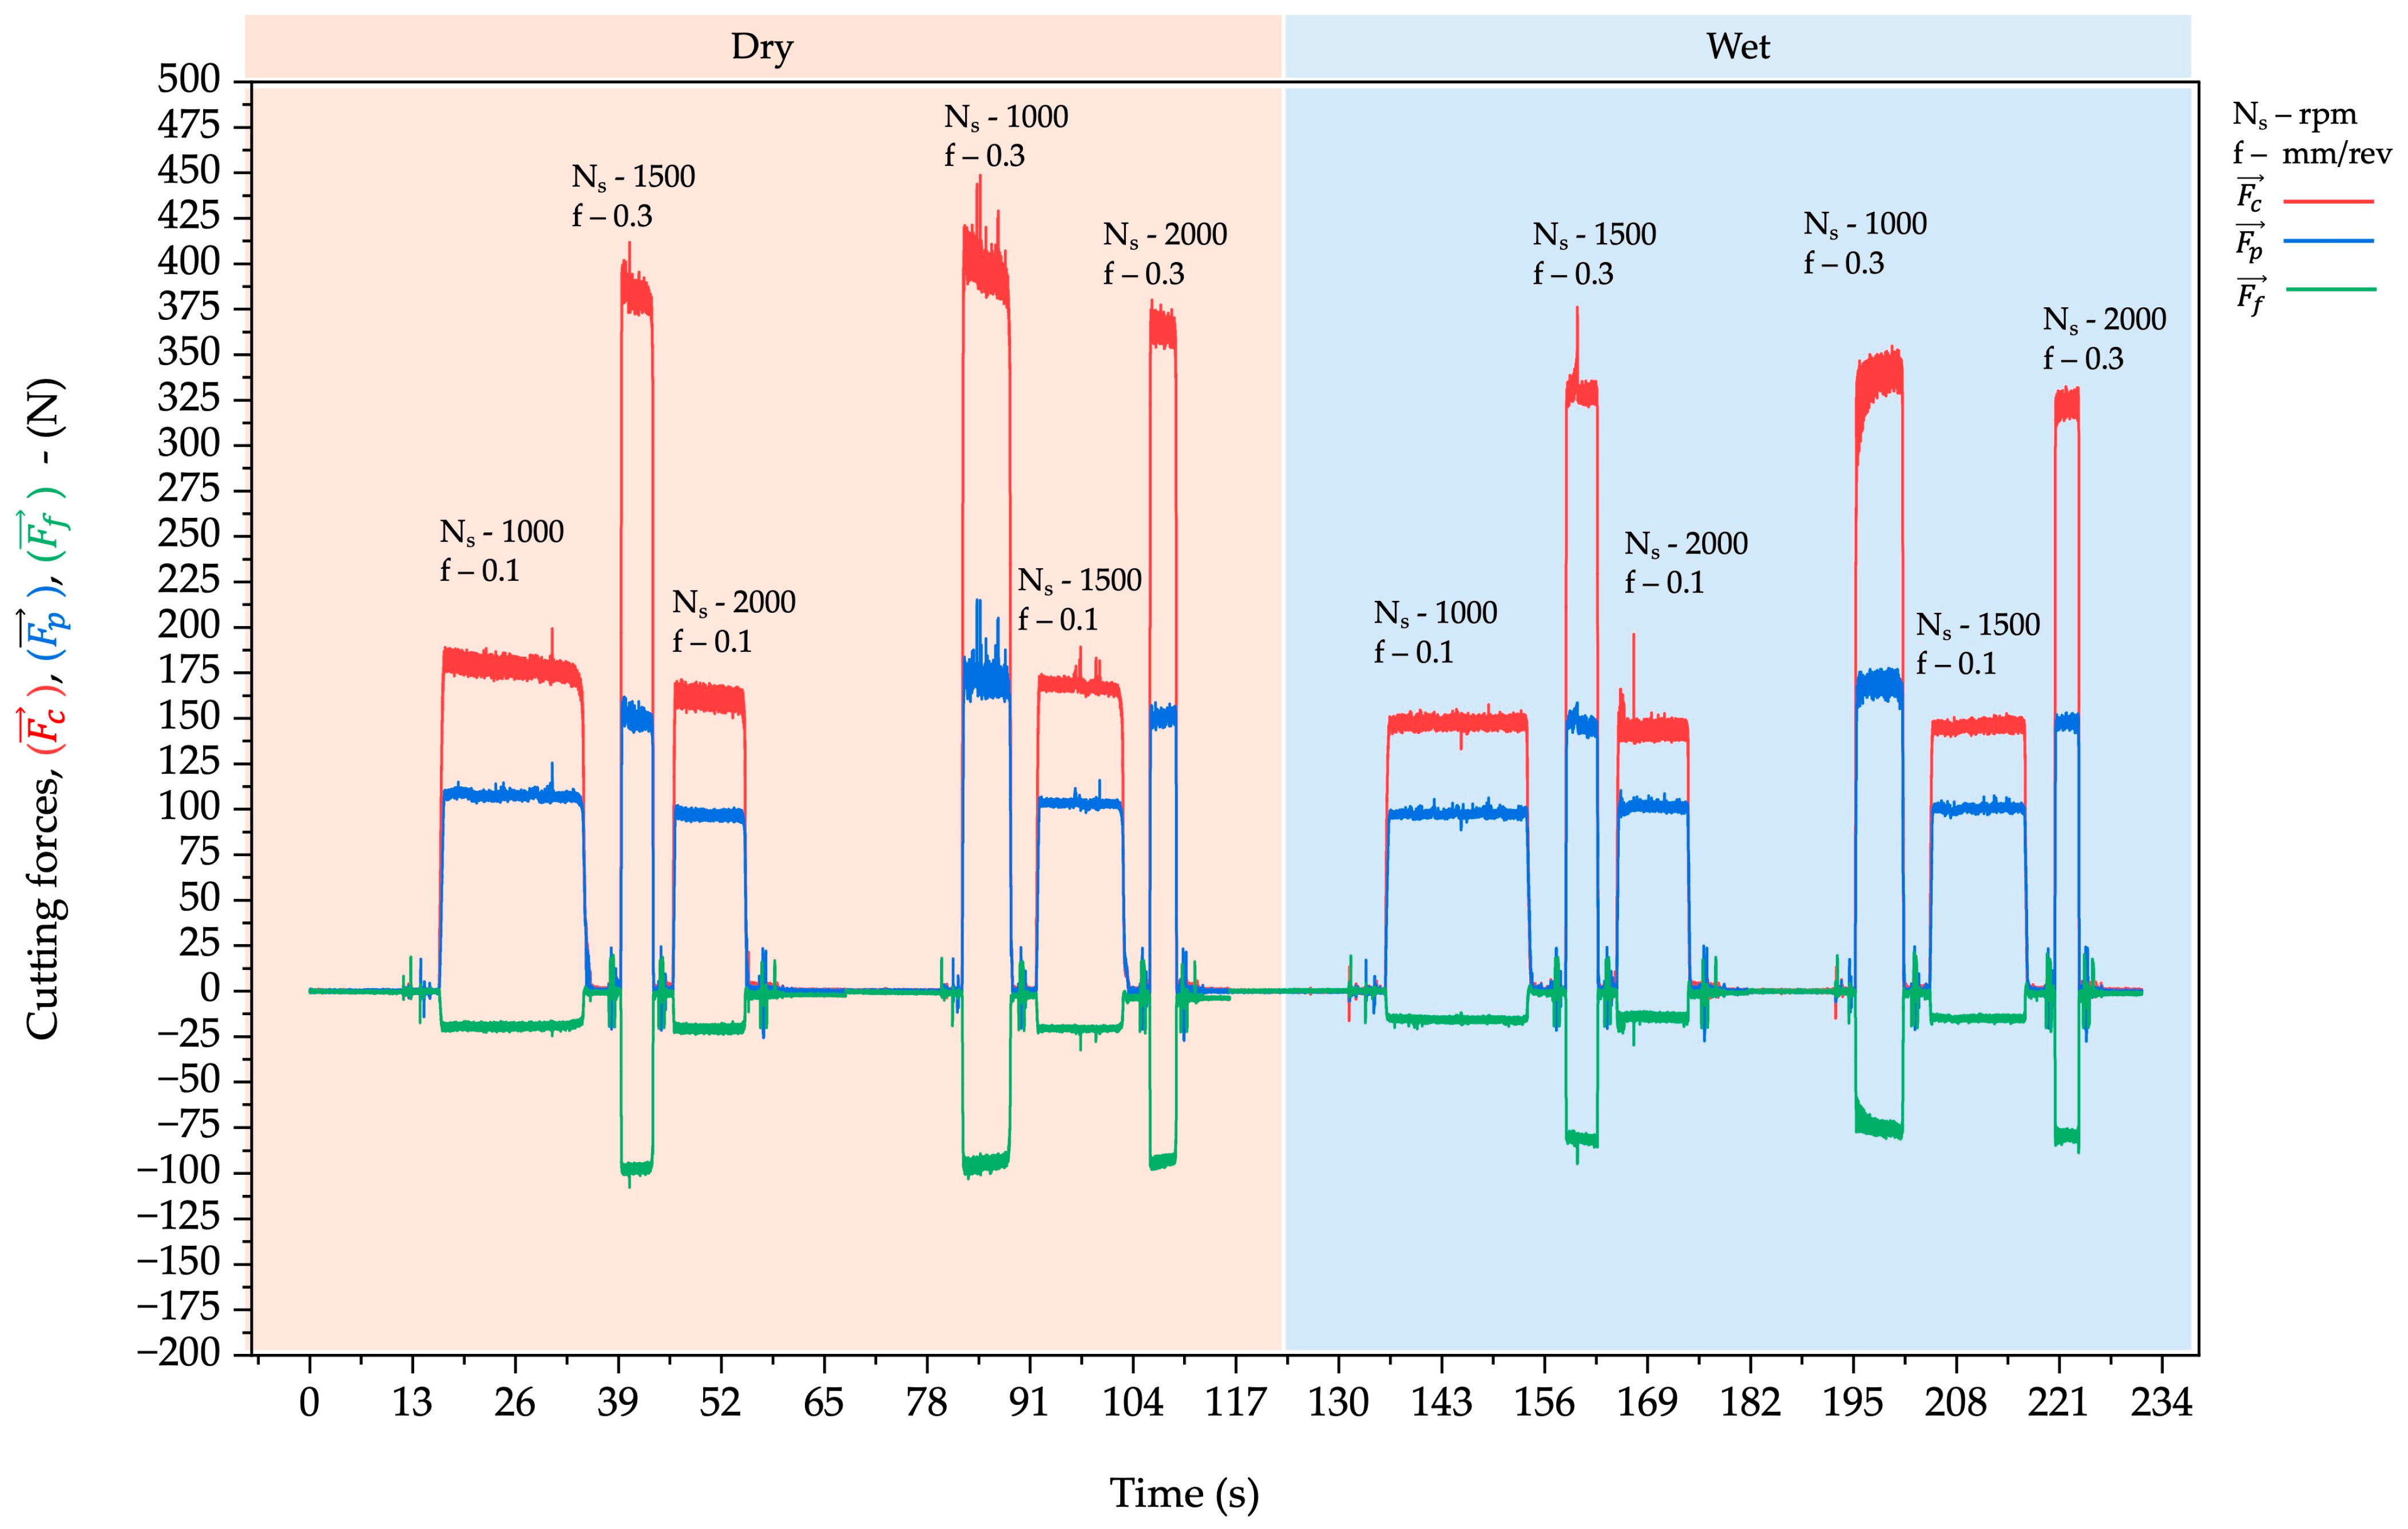
Figure 4 represents the variation in cutting forces in X, Y, and Z directions with time and different machining parameters under dry and wet machining conditions. The machining parameters used for the study were 1000, 1500, and 2000 rpm, and feeds of 0.1 and 0.3 mm/rev. Figure 4 is divided into two sections: one in light brown representing dry machining and one in light blue representing wet machining conditions. Figure 4 shows 12 cutting passes. Each peak represents the response of the cutting forces to varying machining parameters. F c represents the cutting forces in the tangential direction represented by the red line. F p   represents the cutting forces in radial directions, which is denoted by the blue line, and F f represents the cutting forces in the axial direction, highlighted by the green color.
A clear trend in Figure 4 shows that the feed rate has the strongest effect on the cutting forces. When the feed increases from 0.1 mm/rev to 0.3 mm/rev, a significant increase in all components of cutting force is observed. This is evident across all experiments. Spindle speed does have an influence; however, it is smaller than the effect of the feed rate.
Comparing dry and wet machining conditions, it can be seen that in the dry region, the cutting forces are higher and more variable. In wet machining conditions, the cutting forces are lower than in dry machining for the same machining parameters.
To better understand the results, the RMS of each component and the resultant is computed. Table 2 presents the computed RMS values for each force component and the resultant.
Twelve turning tests were conducted under different spindle speeds, feed, and machining environments. The RMS value represents the cutting forces responses in the tool. Table 2 clearly shows that F c is the dominant force, as shown in Figure 4. F p   is the secondary dominant cutting force and F f is the smallest, since thrust forces are lower in turning. A similar trend can be seen in the data: feed influence is strong regardless of machining conditions (dry or wet) or spindle speed. Increasing feed from 0.1 to 0.3 mm/rev affects cutting forces across all three components, especially, F f . Spindle speed shows a much weaker effect. Table 2 also highlights the consistent reduction in cutting force under wet machining conditions. Table 2 highlights the important observations with changing parameters.
For similar cutting parameters, spindle speed of 1000 rpm and feed 0.1, the resultant cutting forces RMS for dry is 189.30 N and 173.06 N for wet. Wet machining condition significantly reduces the force by 8–9 percent. When the spindle speed is 1500 rpm and the feed is 0.1 mm/rev, the RMS of resultant cutting force is 189.37 for dry machining conditions and 176.58 in wet machining conditions, where wet machining conditions reduce resultant force by nearly 7 percent. Similar results can be seen with spindle speed of 2000 rpm and feed of 0.1 mm/rev; under dry machining conditions, the RMS of resultant cutting forces is 185.99 N, and under wet machining conditions, it is 172.28 N. For a lower feed of 0.1 mm/rev, the wet machining condition reduces the resultant force by 7–9 percent.
At a higher feed of 0.3 and a similar spindle speed in both dry and wet machining conditions, similar results are observed. At 1000 rpm, the resultant RMS value is 422.76 N in dry, and in wet the value of F R is 376.69 percent. The wet machining condition reduced the resultant force by nearly 11 percent. At a spindle speed of 1500 rpm, the dry machining condition shows a resultant RMS of 416.51 N, and the wet machining condition shows a resultant RMS of 355.19 N. Wet machining conditions reduce the resultant force by nearly 15 percent. Similarly, for a spindle speed of 2000 rpm and a higher feed, the dry machining condition shows a resultant of 374.99 N, and the wet machining condition shows a resultant RMS of 332.91 N. Wet machining conditions reduce the resultant force by nearly 11 percent. The results show that, for higher feed rates, wet machining reduces cutting forces by 11–15 percent. It can also be seen that for the same feed rate and different spindle speeds, there is no significant variation in the cutting forces. However, at 1500 rpm, the cutting force values are higher than at 1000 rpm and 2000 rpm, highlighting the results of the reduction in cutting forces from dry to wet machining conditions.

3.1. Reduction in Forces from Dry to Wet

To clearly understand the effect of coolant during machining, the reduction in the resultant cutting forces was calculated. Table 3 presents the calculations of the reduction in cutting forces from dry to wet in the experiments.
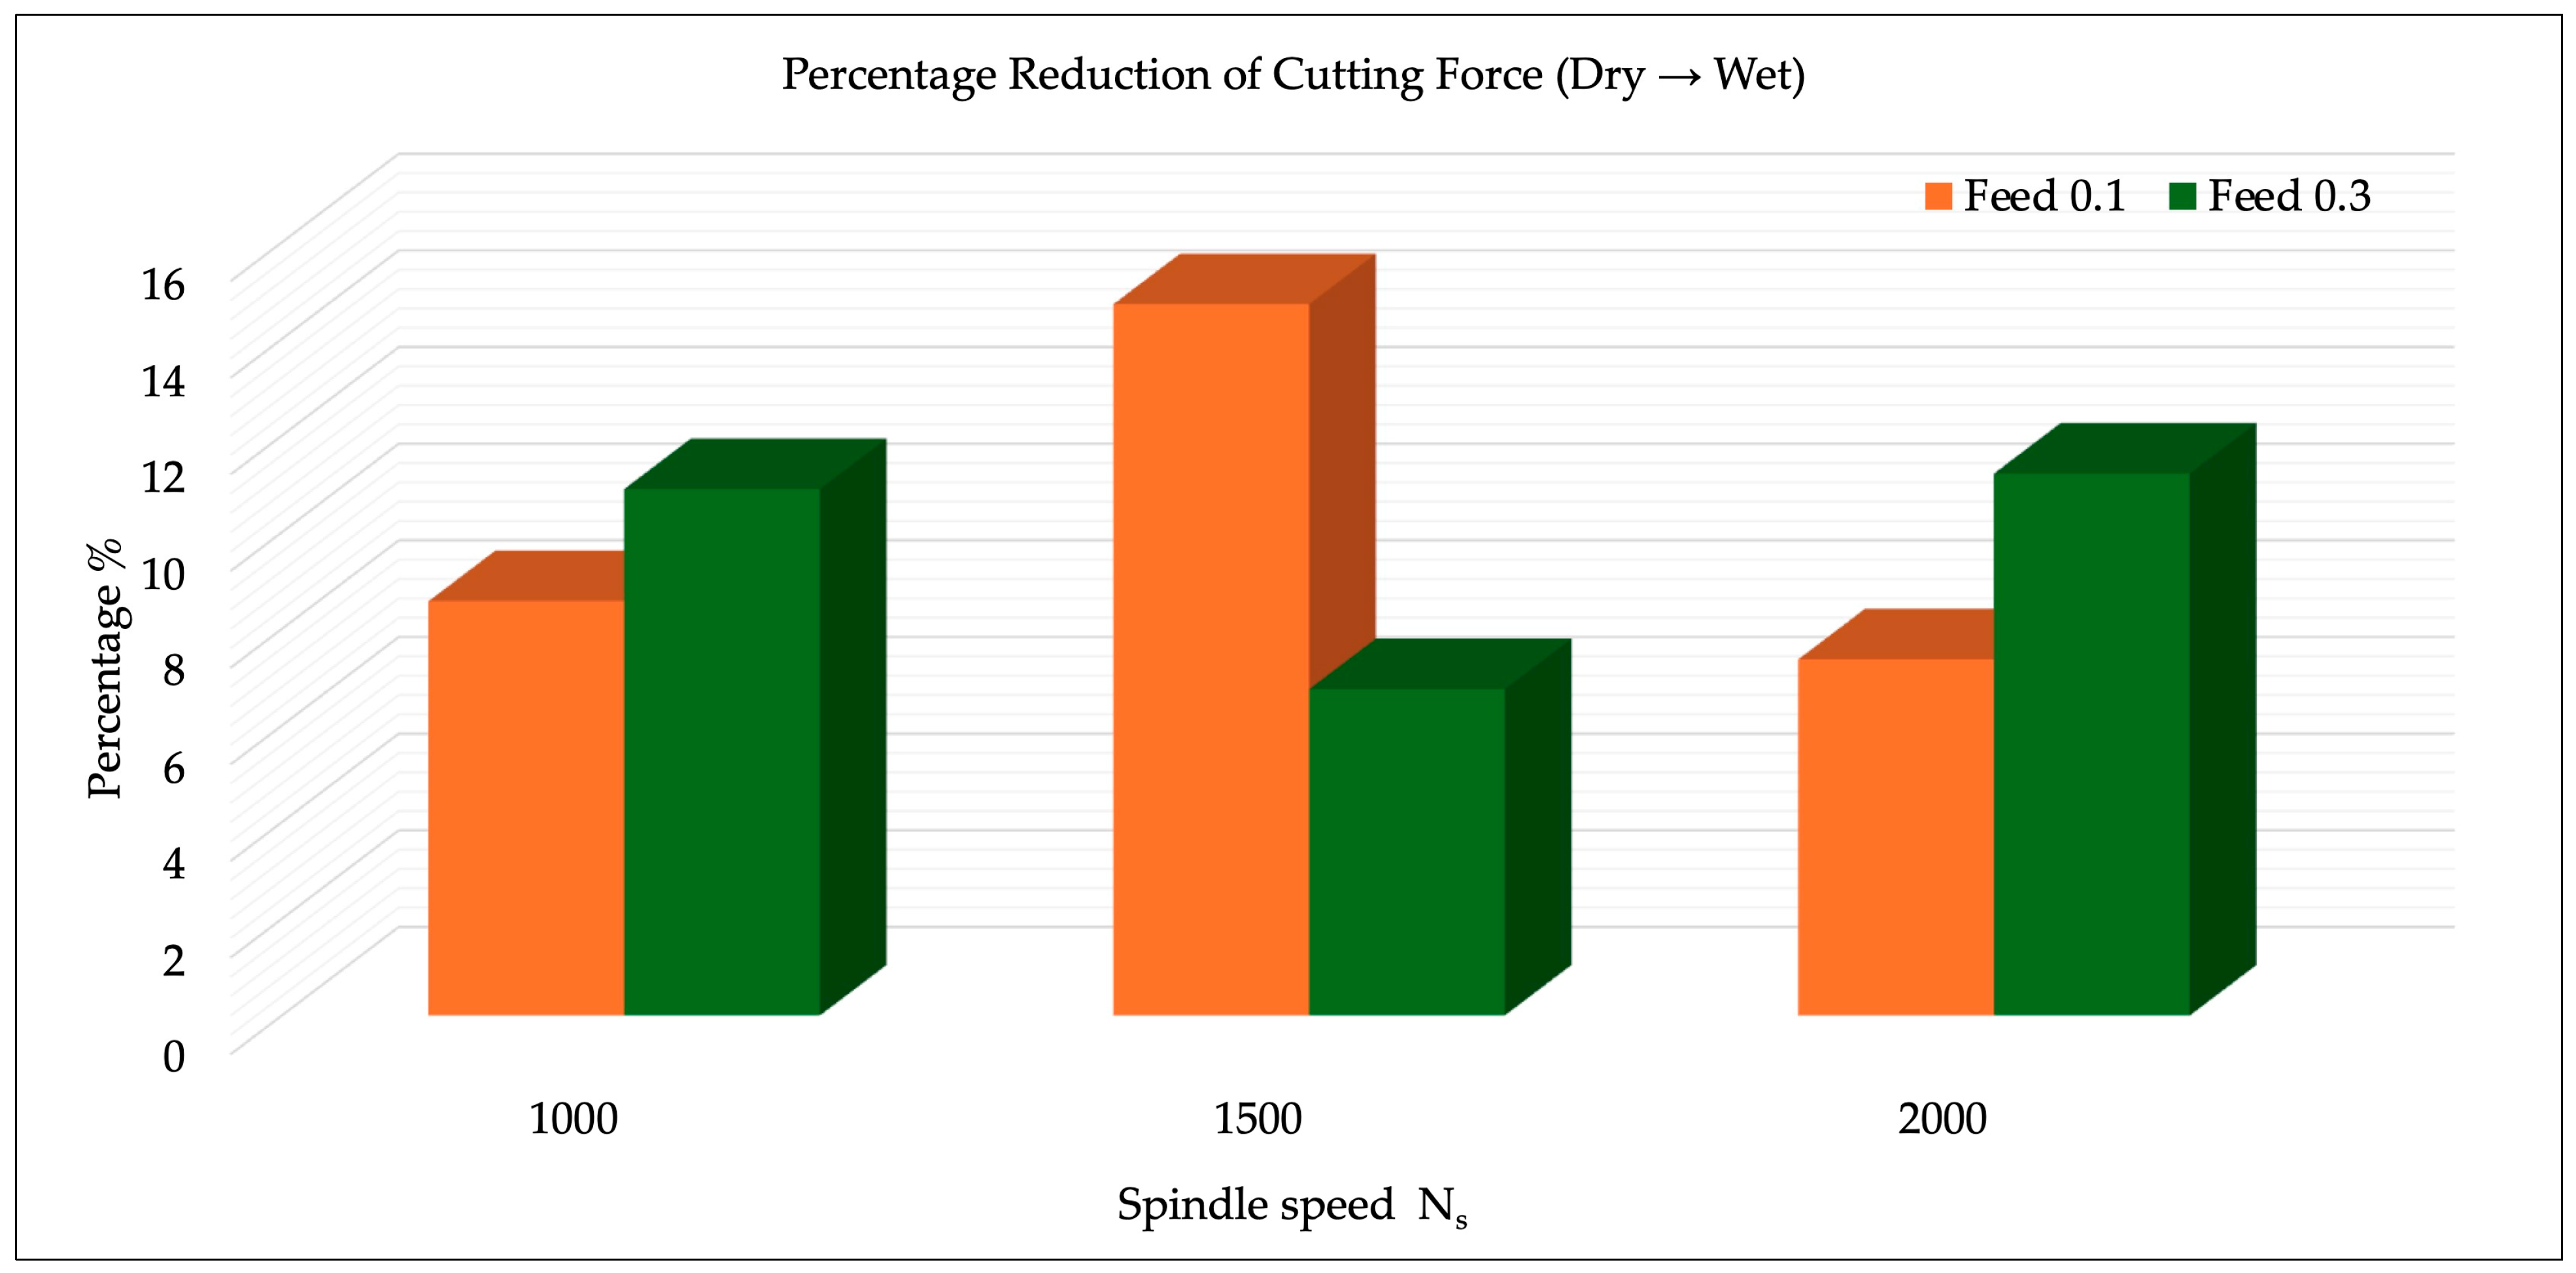
It can be visualized that between EX1 and EX7, there is an 8.5 percent reduction in the cutting forces. Figure 5 provides a clear explanation of the percentage reduction in cutting forces when the same experiment was repeated from dry to wet conditions. Each group in Figure 5 represents spindle speed. Within the group, the orange and green bars represent the feed, and their heights indicate the percentage reduction.
It can be seen that wet machining conditions consistently reduce cutting forces across all spindle speeds and feeds. The percentage reduction is positive, indicating that wet machining conditions require less force than dry machining conditions. This not only helps reduce friction between the tool and the workpiece but also lowers cutting temperature and improves chip evacuation.
Across all experiments, the feed generally shows the higher percentage reduction, indicating that increased feed use requires coolant to reduce cutting forces. It is also noticeable that at a spindle speed of 1500 rpm, the reduction in cutting forces is highest. At higher and lower spindle speeds, the effect of coolant on force reduction is less than 1500 rpm. Thermal and frictional effects are large enough for the coolant to make a difference.

3.2. Statistical Analysis

The regression model uses spindle speed, feed, and machining condition (dry and wet) as predictors to estimate the resultant cutting force ( F R ). The dry machining condition was provided with the value of 0, and the wet machining condition was provided with the value of 1. The model summary in Table 4 provides insights into the analysis. R represents the correlation between the predicted and actual force. The R value of 0.991 represents a strong positive relationship. Meaning that the model predicts cutting for values with high accuracy. R2 represents the variation in cutting forces that the model explains. This means 98.3 percent of changes in cutting forces are explained by Ns, f, and machining conditions. The adjusted R2 is also high, which means that the model is not overfit. The Significance p-value is 0.00, which represents that the model is highly significant.
The ANOVA results explain that the regression model is statistically significant. Table 5 presents the results of the ANOVA analysis. This indicates that the Ns, f, and machining condition explain a big part of the data variation in resultant cutting force. The regression sum of squares is much larger than the residual sum of squares, confirming that the majority of cutting force variability is explained by the model.
Table 6 presents the coefficient of the multiple linear regression model. The constant represents the baseline line of zero for all the parameters. For spindle speed, with every spindle speed increase, the resultant force decreases by 0.024 N. The beta value for spindle speed shows that it has a very weak correlation with cutting forces. In the results, spindle speed has a minor effect on the cutting forces. For f, with every feed value, the cutting forces also increase. The beta value of f is 0.974, which means that feed is the dominating factor. Machining condition coefficient explains that by using coolant during machining, the resultant cutting forces are reduced. The model is significant.
Based on the coefficient, the regression equation is presented by Equations (1) and (2).
F R = b 0 + b 1 ( Speed ) + b 2 ( Feed ) + b 3 ( Condition )
F R = 133.609 0.024 ( N s ) + 993.719 ( f ) 32.035 ( Condition )
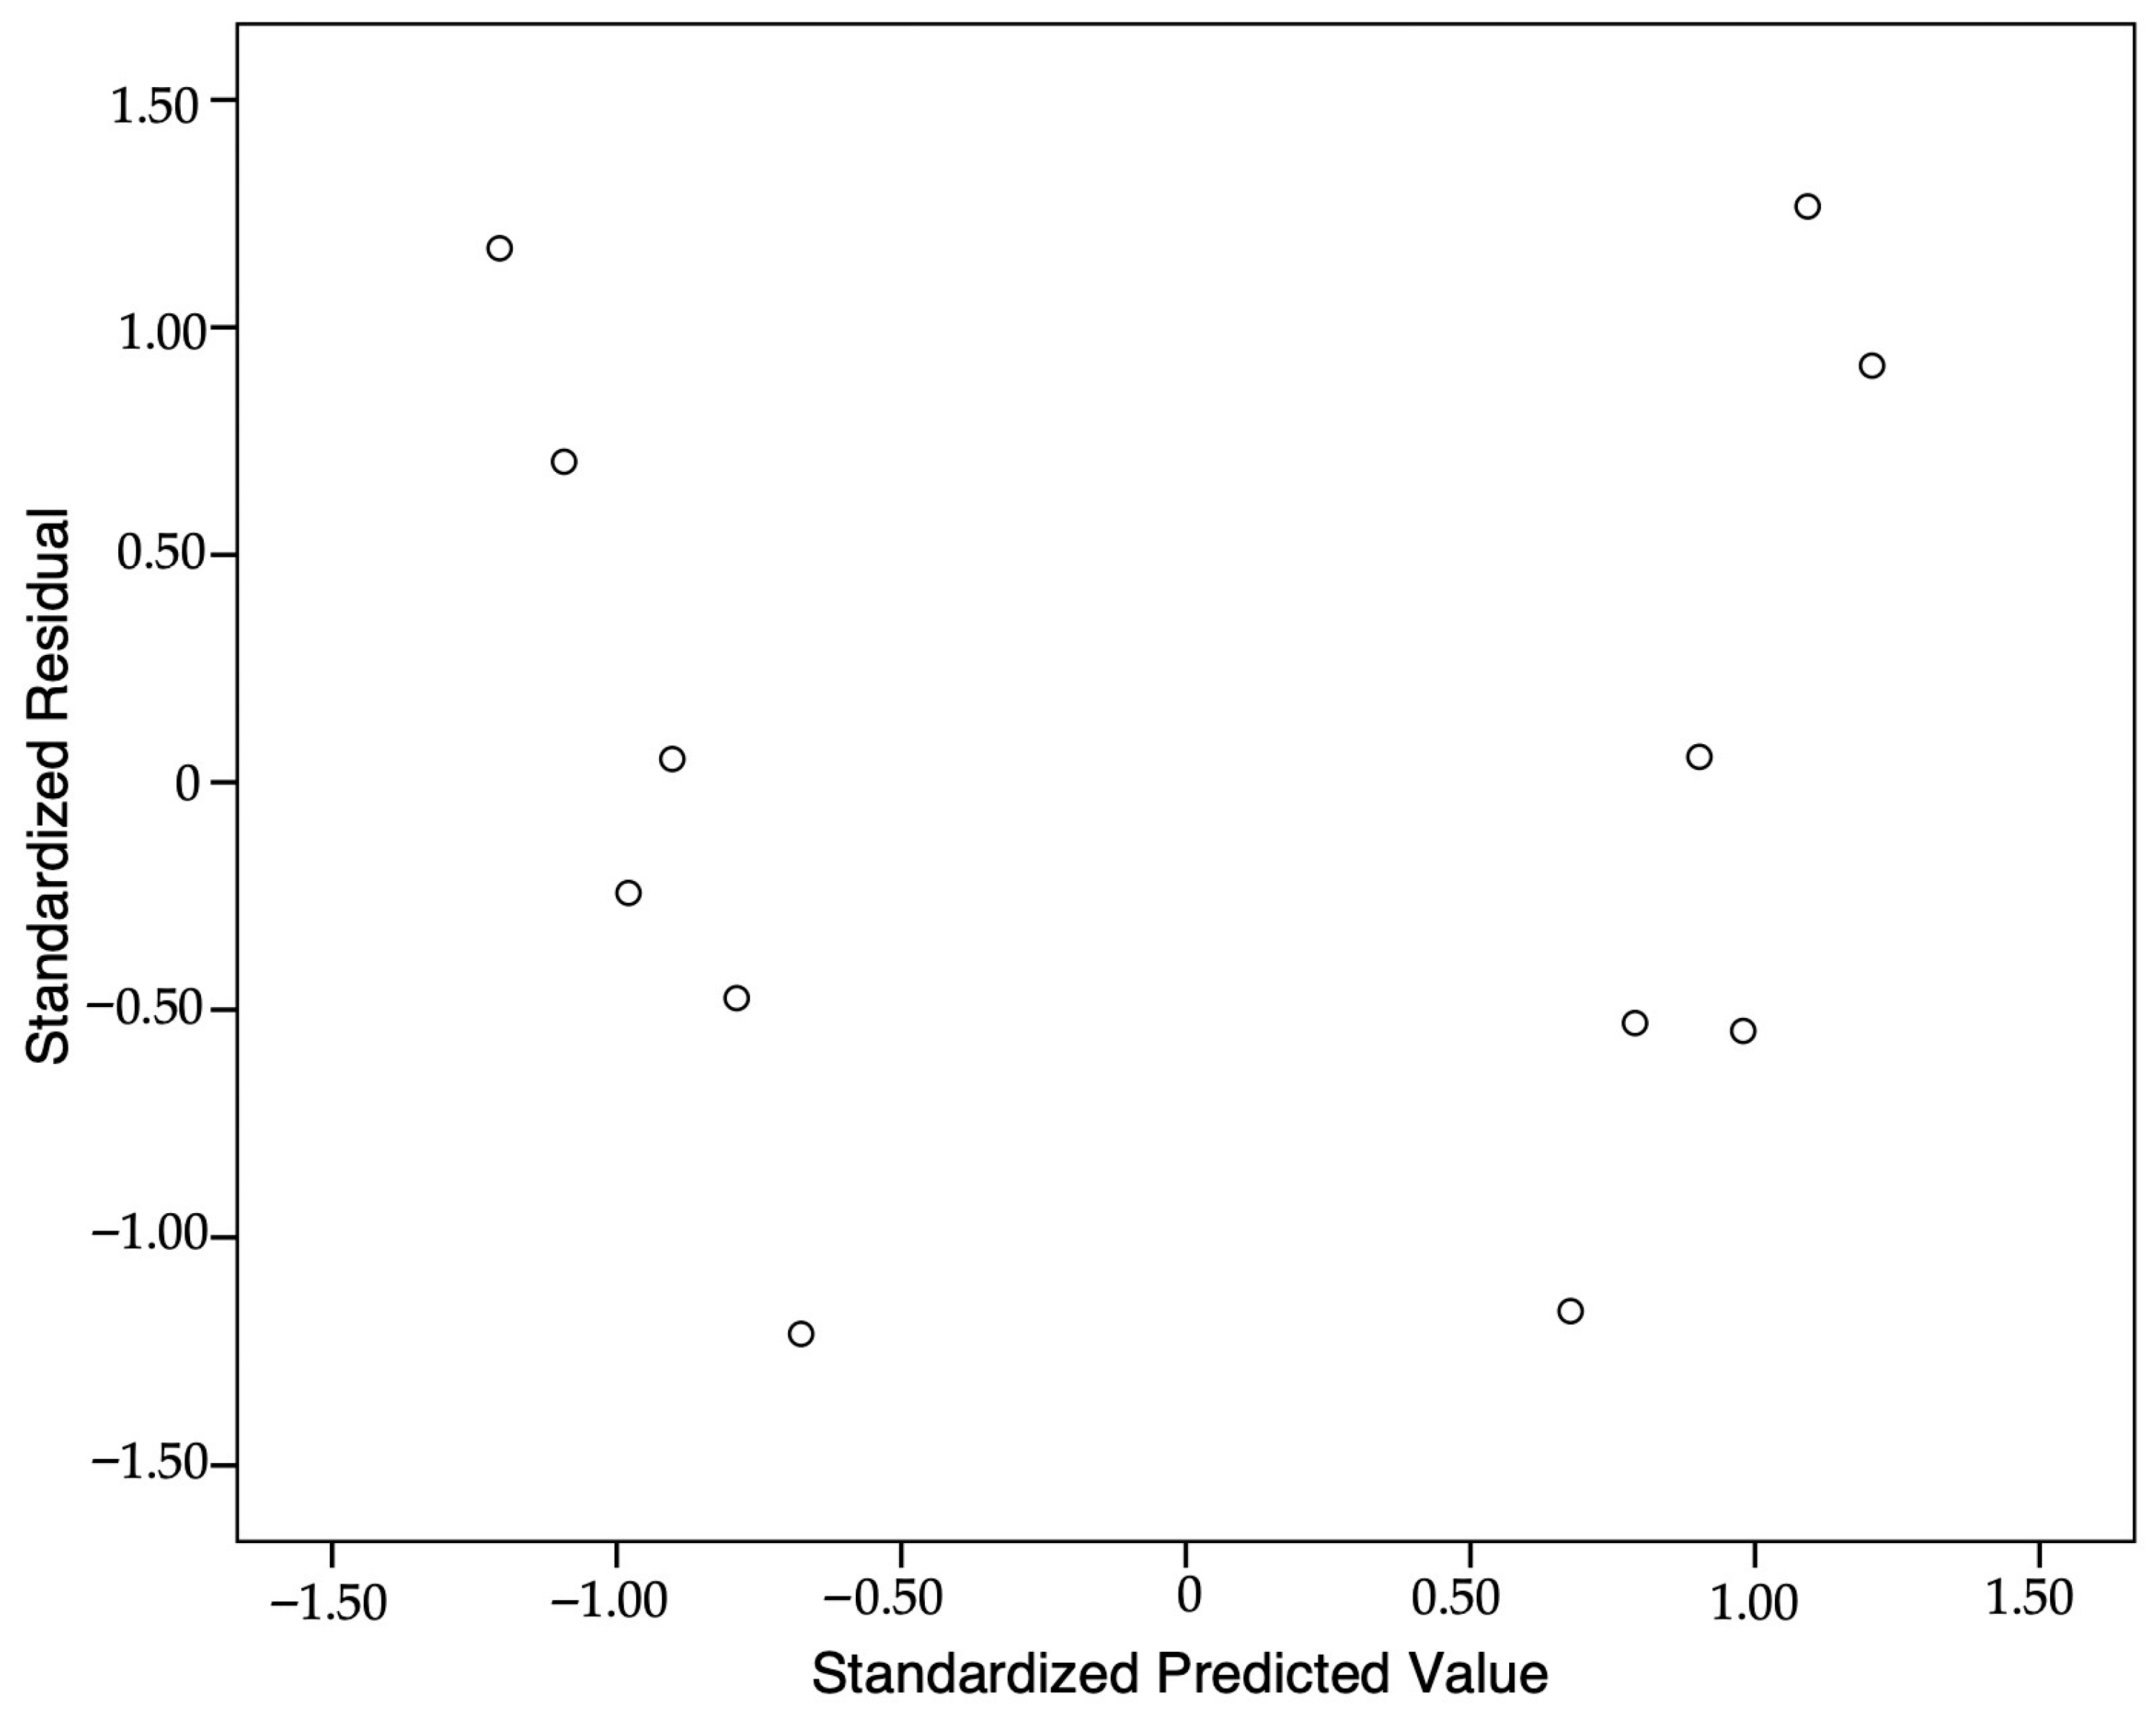
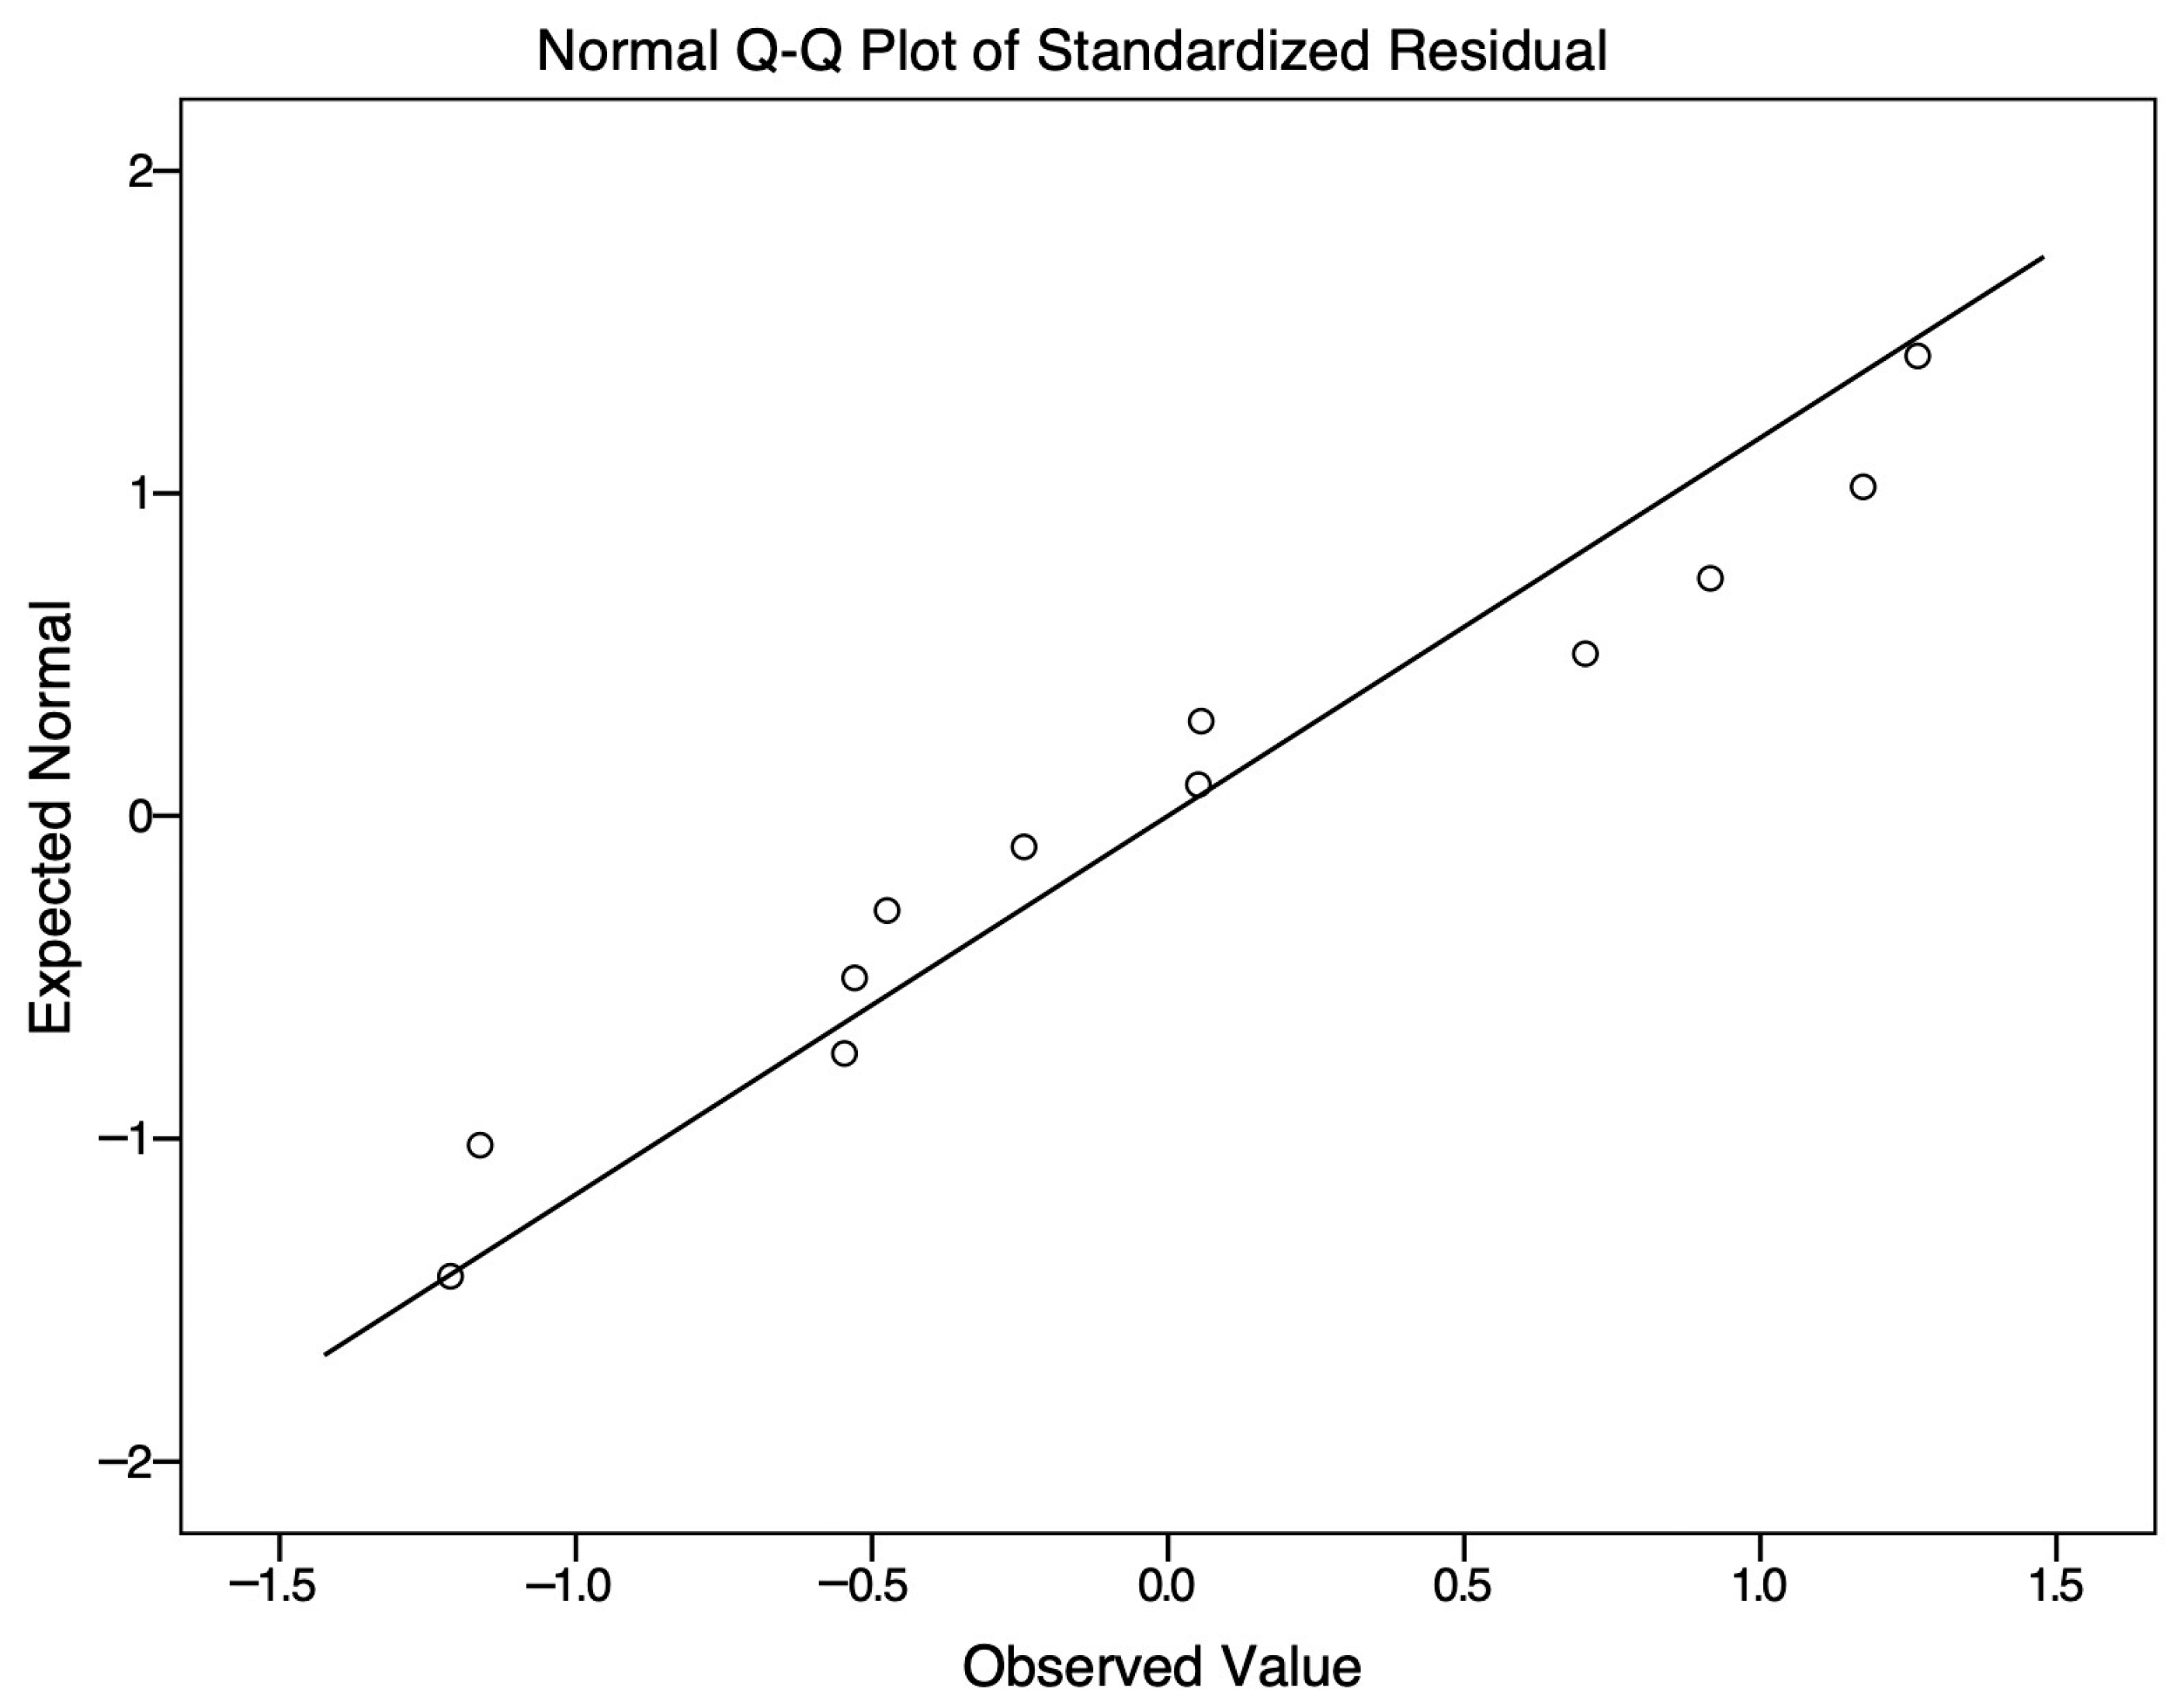
The equation suggests that the higher feed rate increases the cutting forces; however, the high spindle speed and wet machining reduce them. To check the prediction accuracy of the regression model, the residual statistics is provided in Appendix A [Table A1]. Furthermore, to validate the regression model, a plot between standardized residuals and standardized predicted value is given in Appendix B [Figure A1]. To check the normality distribution a Normal Q-Q plot is given in Appendix B [Figure A2]. The combined result of ANOVA, residual statistics, and plots suggests that the multiple linear regression model is accurate and statically valid. The model exhibits excellent goodness-of-fit.

3.3. Interaction Plot of f, Ns, Machining Condition and, F R

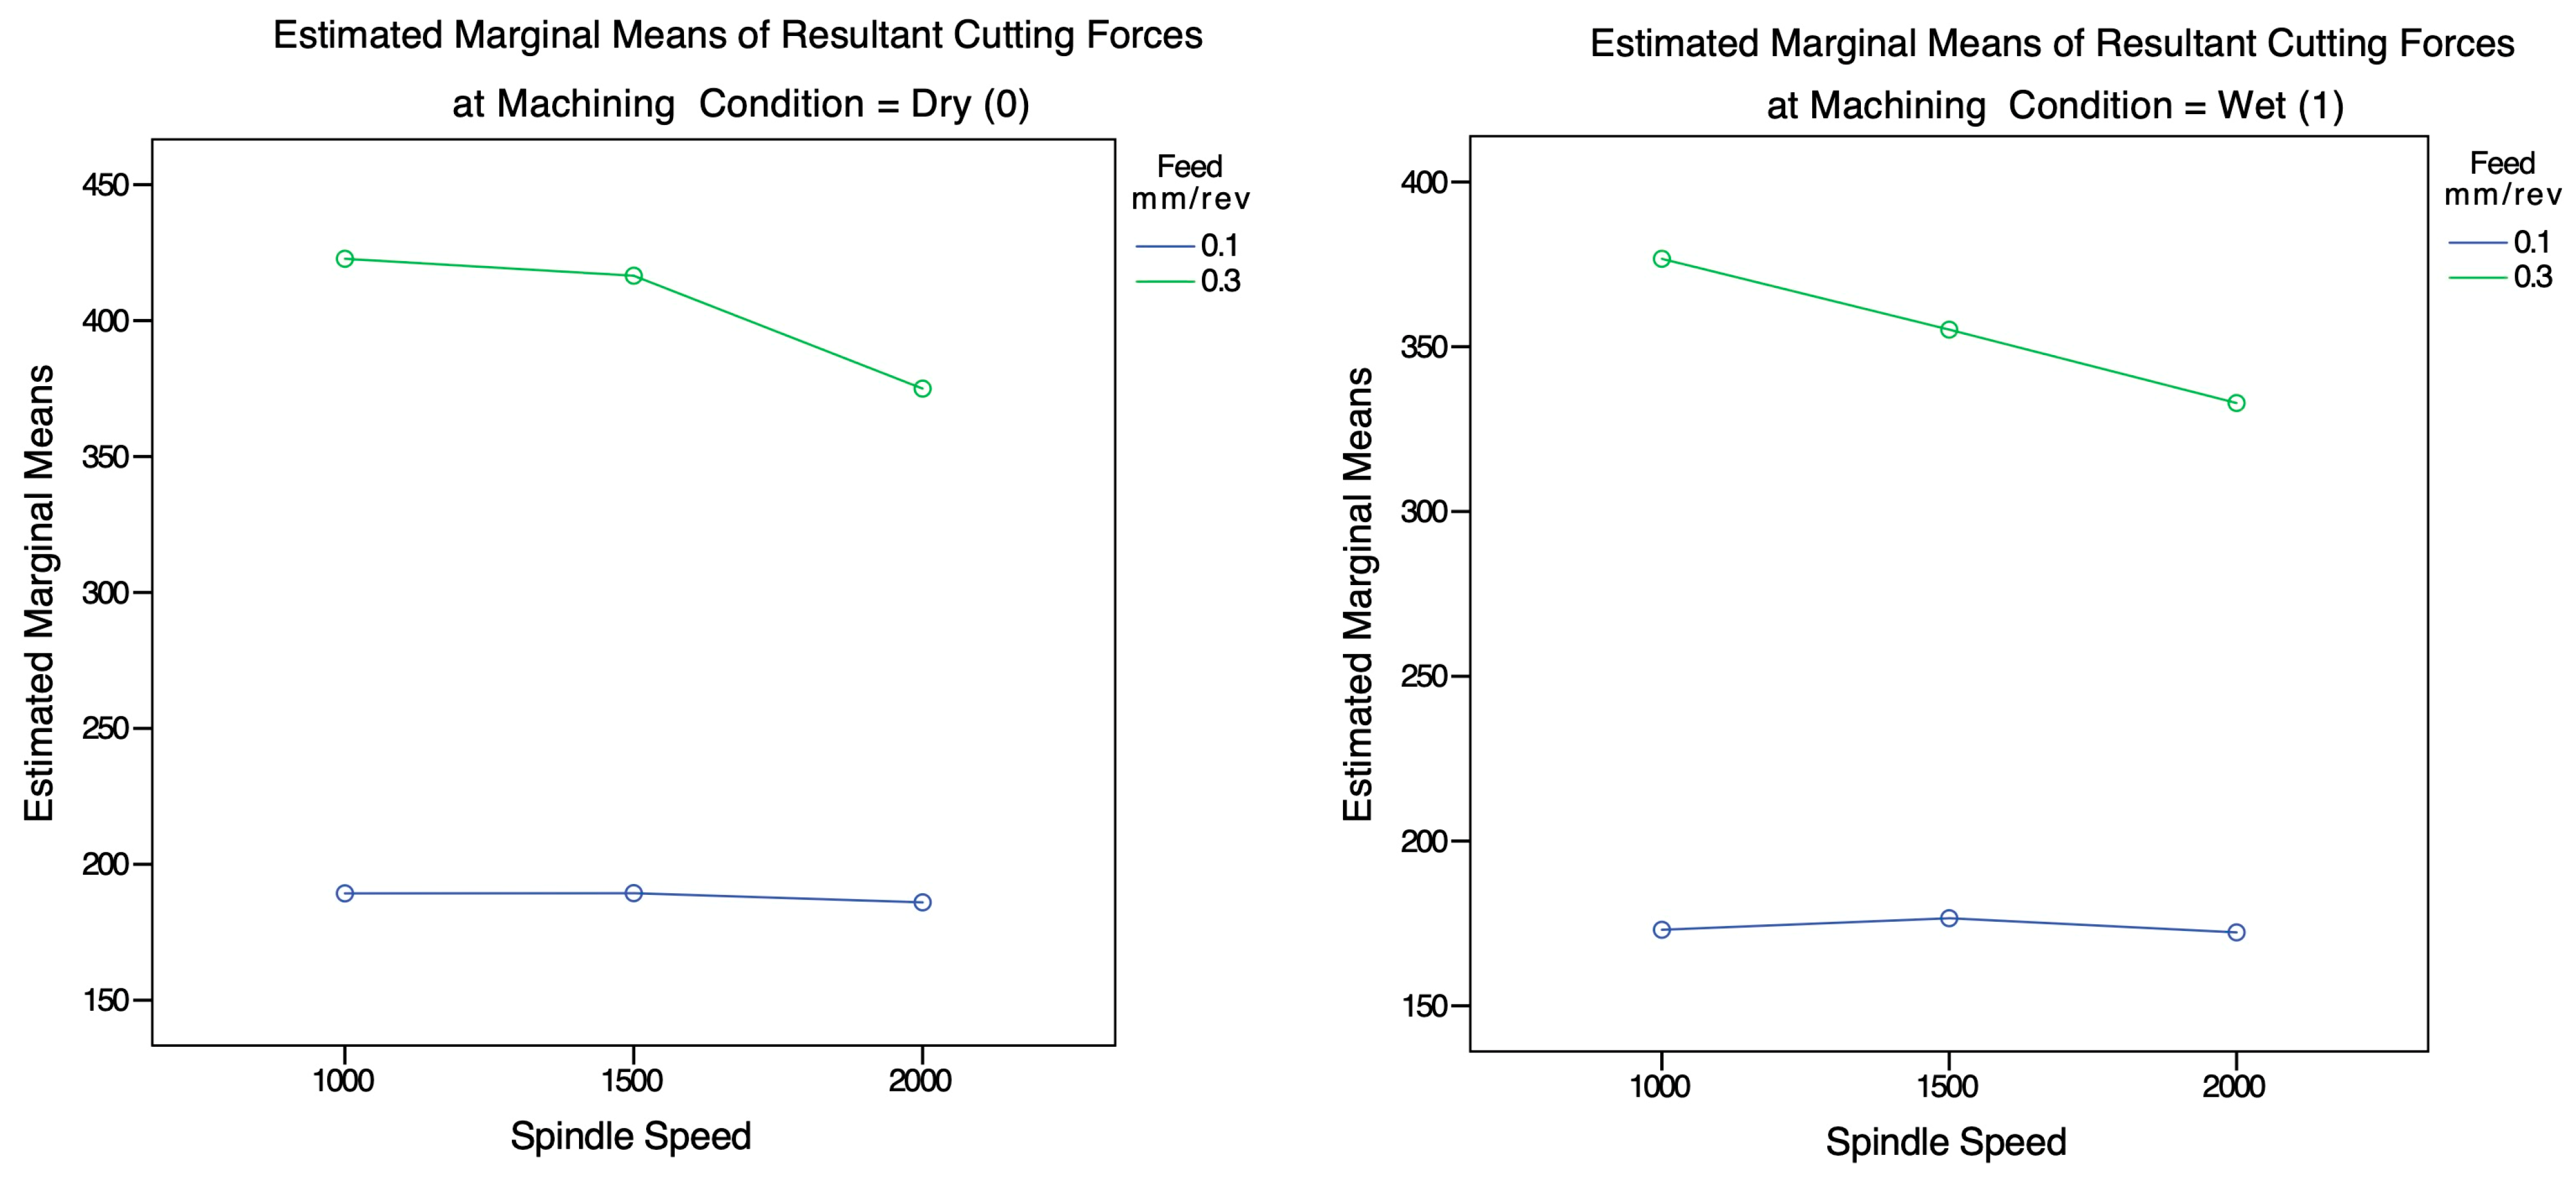
To clearly visualize the effect of machining parameters and machining conditions on the cutting forces, an interaction plot of spindle, feed, and dry and wet machining conditions is created, as shown in Figure 6. Across both dry and wet machining conditions, it is visible that cutting forces at 0.3 mm/rev feed are significantly higher; however, a reduction is also visible in wet machining conditions. At higher spindle speed and 0.3 mm/rev feed, the cutting forces decrease significantly. At lower feed and higher spindle speed, cutting forces remain nearly constant. So, if the feed requirement during machining is higher, the spindle speed should be higher as well. Wet machining conditions consistently reduce the cutting forces at higher feed rates, unlike in dry machining conditions. Due to improved lubrication, the friction at the tool-workpiece interface reduces. The nonparallel trends indicated the clear interaction between spindle speed and feed.

3.4. Root Mean Square (RMS) Surface Roughness (Rq)

Root mean square surface roughness was evaluated to understand the influence of cutting forces on the quality of the machined part. Table 7 provides the measured value of Rq with resultant cutting force and machining parameters.

3.4.1. Effect of Cutting Parameters on Rq

It can be visualized that the feed rate has a greater influence on the Rq; as the feed increases from 0.1 mm/rev to 0.3 mm/rev, the Rq increases. Experiment conducted at a lower feed of 0.1 mm/rev consistently produced low Rq values in the range of 0.7–1 μm, while the surfaces machined with the higher feed of 0.3 mm/rev show significantly higher Rq values with 4.5–4.9 μm. It confirms that the feed rate is a dominant factor.
It can also be noticed that the coolant use had a noticeable effect on Rq; surfaces machined under wet conditions showed a lower Rq value compared to dry conditions. Experiments number 7, 9, and 11 achieved Rq of less than 0.85 μm. Similar results can be visualized in the cutting forces, where feed rate had a significant influence.

3.4.2. Effect of Cutting Forces on Rq

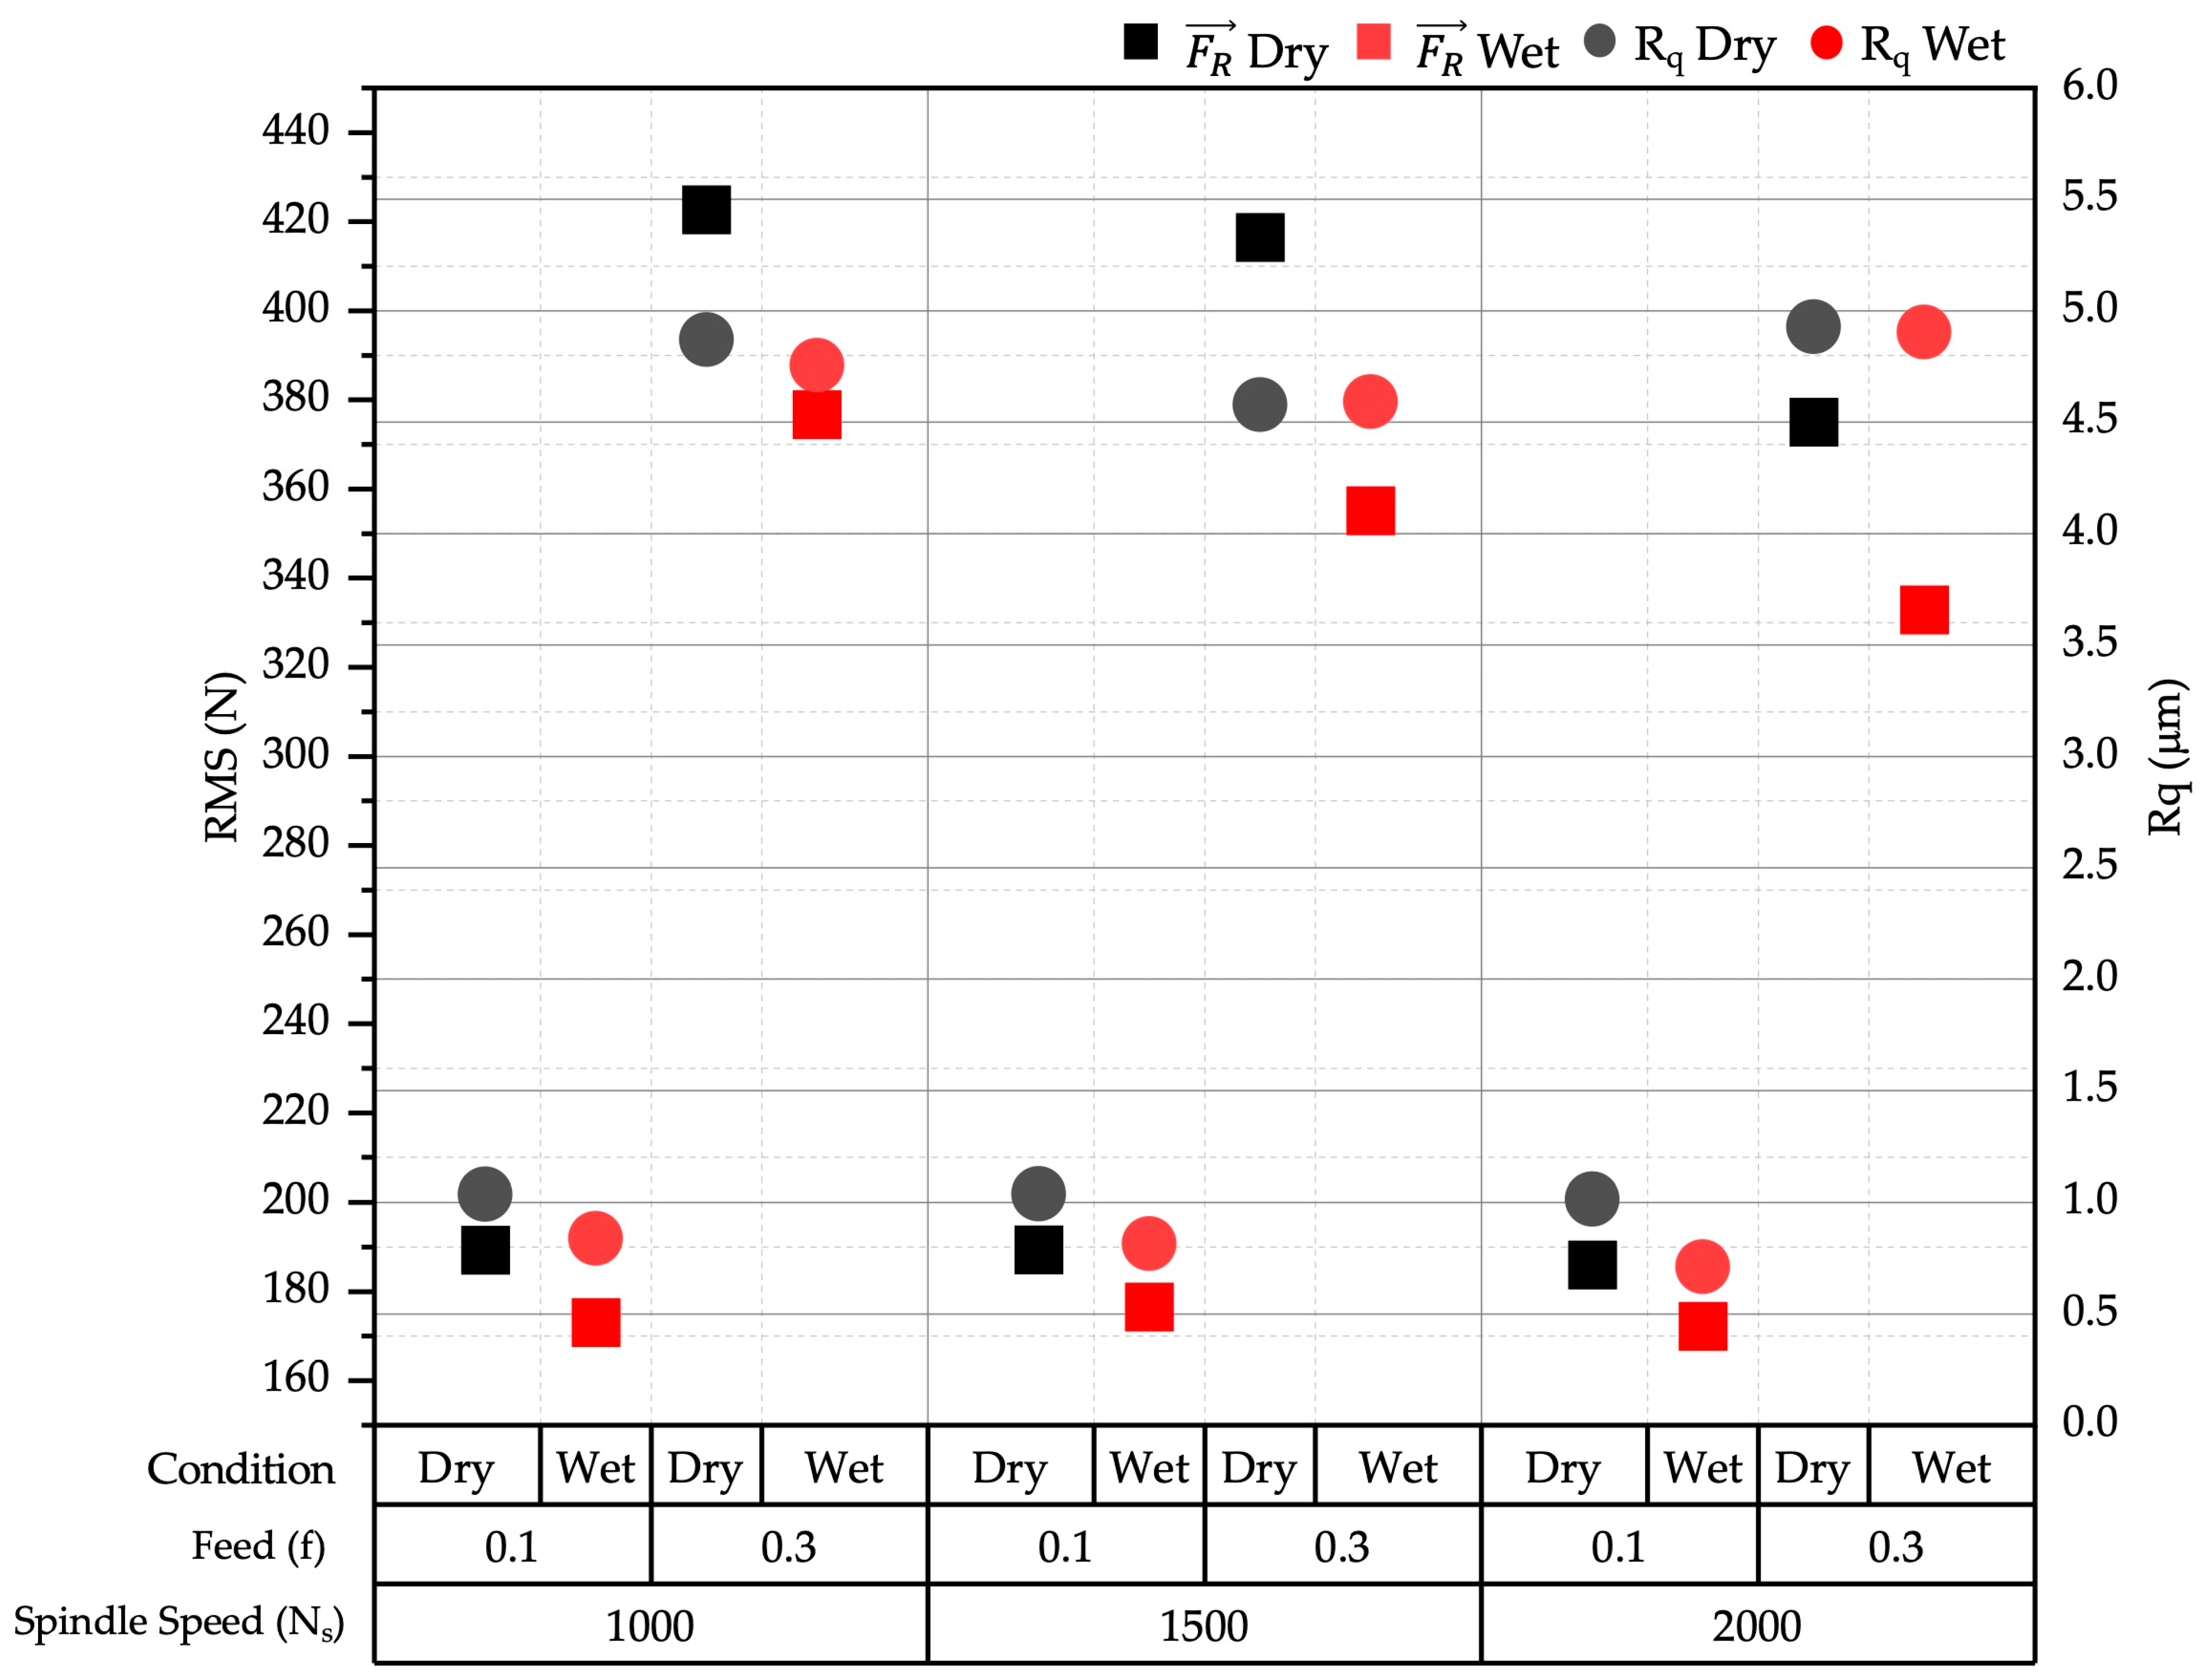
To understand the effect of cutting forces on Rq, a scatter plot diagram was used. Figure 7 represents the effect of cutting forces on the Rq surface roughness. The squares represent the cutting forces, and the circles represent the root mean square surface roughness Rq. The black square and circle represent the dry machining condition, and the red squares and circles represent the wet machining condition. Each machining parameter can be seen at the bottom of the chart. It mentions the feed machining conditions at first, followed by the feed rate and spindle speed. On the left-hand side of the Y axis, the RMS of the resultant cutting forces is plotted, and on the right side of the axis, Rq is plotted.
It is visible from the scatter plot that at higher cutting forces the Rq values also increase. In contrast at lower cutting forces the Rq value decreases, which means that better surface roughness can be achieved at lower cutting forces. From Figure 3, it can be seen that the cutting forces are lower during the wet machining condition. And the effects can be seen in the Rq value as well; at wet machining conditions, the Rq values are also lower. However, feed rate is the primary factor influencing the surface roughness. Higher cutting forces result in poorer surface finish.
To find the clear effect of the cutting forces on Rq an analysis of variance was performed. ANOVA requires independent categorical data, and cutting forces are continuous and not naturally divided into separate categories. The cutting forces were first divided using visual binning between low, medium, and high cutting forces. A one-way ANOVA was performed between the cutting forces group and Rq, as shown in Table 8.
The analysis suggests that there is a significant effect of cutting forces on Rq. At lower cutting forces, the Rq is lower; similarly, at higher cutting forces, the Rq is higher. This method helped to clear the understanding of the effect of cutting forces on Rq.

4. Discussion

The feed rate has a greater influence on the increase in cutting forces, as seen in both machining conditions. Feed rate directly controls the uncut chip thickness. A thicker chip means the material ahead of the tool must undergo greater plastic deformation on the shear plane. For greater deformation of the material, greater resistance is observed, and the cutting forces are higher. In an uncut chip, the combined increase in shear plane area, friction, and contact stress affects material removal, resulting in higher cutting forces.
In all the passes, the F c remains the dominating force component, consistently showing the high peaks. It can be understandable, as the F c is a tangential force or the main cutting force in a turning operation. This force is directly responsible for shearing and removing the material. This force acts along the direction of chip formation; therefore, it experiences the highest deformation and the highest value.
A multilinear regression model developed shows that by increasing feed, the cutting forces increase; however, by increasing spindle speed, they decrease. The use of coolant also reduces the cutting forces during the turning operation.
The coolant helps with the reduction in cutting forces during the machining operation. The reduction in cutting forces components under the wet machining conditions is caused by the combined cooling and lubrication effect. Coolant acts as a lubricant, forming a thin film between the tool and the workpiece that reduces friction and improves chip evacuation, thereby lowering cutting forces. Heat is generated in the deformation zones, and using cutting fluid dissipates the heat mainly in the primary zone. Lower temperature prevents the tool from softening and adhering. Therefore, decreasing the cutting forces due to thermal effects. Cutting fluids reduce the friction at the tool chip and tool workpiece interfaces by forming a layer that prevents chip welding on the rake face. It lowers the cutting temperature and suppresses the built-up-edge formation, which overall decreases the shear resistance during chip formation. Additionally, due to the flow of coolant at high pressure, the chip evacuation reduces the tool wear, which contributes to more stable cutting forces and a consistent decrease in cutting forces compared to dry machining conditions [29,30]. Coolant not only reduces the cutting forces but also reduces the tool wear [31].
The effect of cutting forces on the surface roughness, specifically the Rq parameter, can be understood by the phenomenon that higher cutting forces indicate that chips are larger, and larger chip load produces deeper feed marks on the machined surfaces. Moreover, as cutting forces rise, the tool experiences greater deflection and vibrations. These mechanical instabilities generated surface irregularities in the peak and depth of the valleys. Additionally, the increase in cutting forces can lead to more surface tearing due to mechanical stresses imposed on the workpiece, as presented in the study [32]. Surface tearing suggests rougher surfaces. The overall effect of higher cutting forces is degradation of surface quality because of tool vibrations and feed marks. Therefore, the roughness becomes higher even though there is more surface tearing, which reduces the quality of the surface. Understanding cutting forces is important to optimize the surface finish, as larger forces can lead to lower surface quality. The effect on Ra and Rz can be seen in the study [32].

5. Conclusions

The study aimed to understand the effect of machining parameters and changes in machining conditions on cutting forces and machined surfaces during the machining of stainless steel. The following conclusions can be drawn:
  • Coolant reduces the cutting forces during machining by 7–15 percent. Wet machining conditions show consistent reduction in cutting forces compared to dry machining conditions.
  • It is evident that at a spindle speed of 1500 rpm and 0.1 mm/rev feed, the reduction in cutting forces is highest.
  • Feed rate is the dominant factor that influences the cutting forces under both dry and wet machining conditions. Tangential cutting force is higher across all the cutting passes. This is expected since it directly impacts material shearing and chip formation.
  • The machining parameters and conditions used in experiment 9; Ns—2000 rpm, f—0.1, and ap—0.5 mm in wet condition—led to lower cutting forces and best surface quality.
  • The regression model developed shows that feed significantly increases the cutting forces; however, the spindle speed reduces them. The developed multiple linear regression model effectively describes the influence of machining parameters and machining conditions on cutting forces.
  • The ANOVA analysis between the cutting force group and Rq suggests that there is a relation between the variables, and higher cutting forces lead to rougher surfaces. To receive better surfaces, the cutting forces must be low.
  • ANN-based approaches can be explored for future work to further enhance the prediction of cutting forces and surface quality.
The results presented in this study establish a relationship between machining parameters, cutting forces, and the root mean square surface roughness parameter. These findings provide practical guidance for manufacturing industries, demonstrating the influence of cutting forces on surface quality and the effect of coolant on reducing cutting forces. These results serve as a reference for selecting machining parameters in the turning of X5CrNi18-10 steel for achieving stable cutting conditions and improved surface quality.

Author Contributions

Conceptualization, C.F., T.N. and D.R.D.S.; methodology, T.N.; software, T.N.; validation, C.F., T.N. and D.R.D.S.; formal analysis, C.F.; investigation, T.N.; resources, C.F.; data curation, C.F.; writing—original draft preparation, C.F. and T.N.; writing—review and editing, D.R.D.S.; visualization, T.N.; supervision, C.F.; project administration, D.R.D.S.; funding acquisition, C.F. All authors have read and agreed to the published version of the manuscript.

Funding

The creation of this scientific communication was supported by the University of Miskolc with funding granted to the author Dr. Csaba Felhő within the framework of the institution’s Scientific Excellence Support Program. (Project identifier: ME-TKTP-2025-095).

Institutional Review Board Statement

Not applicable.

Informed Consent Statement

Not applicable.

Data Availability Statement

The original contributions presented in the study are included in the article; further inquiries can be directed to the corresponding author.

Conflicts of Interest

The authors declare no conflicts of interest.

Abbreviations

The following abbreviations are used in this manuscript:
F c Tangential cutting force
F p Radial cutting force
F f Axial cutting force
F R Resultant cutting force
RqRoot mean square (RMS) surface roughness
RMSRoot mean square
NsSpindle speed
vcCutting speed
fFeed
apDepth of cut
rpmRotational per minute

Appendix A

Table A1. Residuals statistics table for regression model.
Residuals Statistics
MinimumMaximumMeanStd. DeviationN
Predicted Value153.1247253407.8140869280.4694075105.623428912
Residual−19.7711868320.65480614013.9170666412
Std. Predicted Value−1.2061.2060112
Std. Residual−1.2121.26600.85312
Dependent Variable: FR.

Appendix B

Appendix B.1

Figure A1. Standardized residuals vs. standardized predicted values plot for regression model.
Eng 07 00033 g0a1

Appendix B.2

Figure A2. Normal Q–Q plot of standardized residuals.
Eng 07 00033 g0a2

References

  1. Tyagi, A.K.; Richa, R.; Tyagi, A.K.; Richa, R. Smart Manufacturing Using Internet of Things, Artificial Intelligence, and Digital Twin Technology. In Global Perspectives on Robotics and Autonomous Systems: Development and Applications; IGI Global: Hershey, PA, USA, 2023; pp. 184–205. [Google Scholar] [CrossRef]
  2. Nancy, P.; Gnanavel, S.; Sudha, V.; Deepika, G.; Elsisi, M. Industry 4.0 in Manufacturing, Communication, Transportation, Healthcare. In Artificial Intelligence-Enabled Digital Twin for Smart Manufacturing; Scrivener Publishing LLC: Beverly, MA, USA, 2025; pp. 19–38. [Google Scholar] [CrossRef]
  3. Ostaševičius, V. Digital Twins for Smart Manufacturing. In Digital Twins in Manufacturing: Virtual and Physical Twins for Advanced Manufacturing; Ostaševičius, V., Ed.; Springer International Publishing: Cham, Switzerland, 2022; pp. 11–147. ISBN 978-3-030-98275-1. [Google Scholar]
  4. Pashmforoush, F.; Ebrahimi Araghizad, A.; Budak, E. Tool Wear Prediction in Milling Process Using Physics-Informed Machine Learning and Thermo-Mechanical Force Model with Monitoring Applications. J. Manuf. Syst. 2025, 82, 1192–1212. [Google Scholar] [CrossRef]
  5. Traini, E.; Bruno, G.; D’Antonio, G.; Lombardi, F. Machine Learning Framework for Predictive Maintenance in Milling. IFAC-PapersOnLine 2019, 52, 177–182. [Google Scholar] [CrossRef]
  6. Gobinath, V.M. An Overview of Industry 4.0 Technologies and Benefits and Challenges That Incurred While Adopting It. In Advances in Industrial Automation and Smart Manufacturing: Select Proceedings of ICAIASM 2019; Lecture Notes in Mechanical Engineering; Springer: Singapore, 2021; Volume 23, pp. 1–12. [Google Scholar] [CrossRef]
  7. Shah, S.; Nautiyal, H.; Gugliani, G.; Kumar, A.; Namboodri, T.; Singla, Y.K. Sustainability in Smart Manufacturing: Trends, Scope, and Challenges; CRC Press: Boca Raton, FL, USA, 2024; pp. 1–318. [Google Scholar] [CrossRef]
  8. Tebassi, H.; Yallese, M.A.; Khettabi, R.; Belhadi, S.; Meddour, I.; Girardin, F. Multi-Objective Optimization of Surface Roughness, Cutting Forces, Productivity and Power Consumption When Turning of Inconel 718. Int. J. Ind. Eng. Comput. 2016, 7, 111–134. [Google Scholar] [CrossRef]
  9. Karthik Reddy, T.; Kosaraju, S.; Nuka, R. Experimental Study and Optimization of Turning Inconel 718 Using Coated and Uncoated Inserts. Mater. Today Proc. 2019, 19, 512–516. [Google Scholar] [CrossRef]
  10. Balwan, V.R.; Dabade, B.; Wankhade, L. Influence of Hard Turning Parameters on Cutting Forces of EN 353 Steel. Mater. Today Proc. 2022, 63, 149–156. [Google Scholar] [CrossRef]
  11. Sztankovics, I.; Kundrák, J. Determination of the Chip Width and the Undeformed Chip Thickness in Rotational Turning. In Key Engineering Materials; Trans Tech Publications Ltd.: Stafa-Zurich, Switzerland, 2014; Volume 581, pp. 131–136. [Google Scholar] [CrossRef]
  12. Kundrák, J.; Gyáni, K.; Deszpoth, I.; Sztankovics, I. Some Topics in Process Planning of Rotational Turning. Eng. Rev. 2014, 34, 23–32. Available online: https://engineeringreview.org/index.php/ER/article/view/349 (accessed on 9 December 2025).
  13. Labuda, W.; Charchalis, A. Influence of Reduced Cutting Speed Values on Operator Safety and Cutting Tool Life in the Processes of Manufacturing and Regeneration of Marine Machinery Parts. J. KONBiN 2022, 52, 1–26. [Google Scholar] [CrossRef]
  14. Lalwani, D.I.; Mehta, N.K.; Jain, P.K. Experimental Investigations of Cutting Parameters Influence on Cutting Forces and Surface Roughness in Finish Hard Turning of MDN250 Steel. J. Mater. Process. Technol. 2008, 206, 167–179. [Google Scholar] [CrossRef]
  15. Bhokse, V.; Chinchanikar, S.; Anerao, P.; Kulkarni, A. Experimental Investigationson Chip Formation and Plowing Cutting Forces During Hard Turning. Mater. Today Proc. 2015, 2, 3268–3276. [Google Scholar] [CrossRef]
  16. Korkmaz, M.E.; Yaşar, N.; Günay, M. Numerical and Experimental Investigation of Cutting Forces in Turning of Nimonic 80A Superalloy. Eng. Sci. Technol. Int. J. 2020, 23, 664–673. [Google Scholar] [CrossRef]
  17. Hong, S.N.; Vo Thi Nhu, U. Multi-Objective Optimization in Turning Operation of AISI 1055 Steel Using DEAR Method. Tribol. Ind. 2021, 43, 57–65. [Google Scholar] [CrossRef]
  18. Zerti, A.; Yallese, M.A.; Meddour, I.; Belhadi, S.; Haddad, A.; Mabrouki, T. Modeling and Multi-Objective Optimization for Minimizing Surface Roughness, Cutting Force, and Power, and Maximizing Productivity for Tempered Stainless Steel AISI 420 in Turning Operations. Int. J. Adv. Manuf. Technol. 2019, 102, 135–157. [Google Scholar] [CrossRef]
  19. Patra, K.; Anand, R.S.; Steiner, M.; Biermann, D. Experimental Analysis of Cutting Forces in Microdrilling of Austenitic Stainless Steel (X5CrNi18-10). Mater. Manuf. Process. 2015, 30, 248–255. [Google Scholar] [CrossRef]
  20. Laghari, R.A.; Li, J.; Mia, M. Effects of Turning Parameters and Parametric Optimization of the Cutting Forces in Machining SiCp/Al 45 wt% Composite. Metals 2020, 10, 840. [Google Scholar] [CrossRef]
  21. Felhő, C.; Namboodri, T.; Sisodia, R.P.S. Taguchi’s L18 Design of Experiments for Investigating the Effects of Cutting Parameters on Surface Integrity in X5CrNi18-10 Turning. Designs 2025, 9, 59. [Google Scholar] [CrossRef]
  22. Felhő, C.; Namboodri, T. Statistical Analysis of Cutting Force and Vibration in Turning X5CrNi18-10 Steel. Appl. Sci. 2025, 15, 54. [Google Scholar] [CrossRef]
  23. Seco Tools. Available online: https://www.secotools.com/article (accessed on 1 November 2025).
  24. ISO 21920-2:2021; Geometrical Product Specifications (GPS)—Surface Texture: Profile—Part 2: Terms, Definitions and Surface Texture Parameters. ISO: Geneva, Switzerland, 2021. Available online: https://www.iso.org/standard/72226.html (accessed on 10 November 2025).
  25. ISO 21920-3:2021; Geometrical Product Specifications (GPS)—Surface Texture: Profile—Part 3: Specification Operators. ISO: Geneva, Switzerland, 2021. Available online: https://www.iso.org/standard/72228.html (accessed on 10 November 2025).
  26. Affatato, S.; Grillini, L. Topography in Bio-Tribocorrosion. In Bio-Tribocorrosion in Biomaterials and Medical Implants; Woodhead Publishing: Cambridge, UK, 2013; pp. 1–21, 21a–22a. [Google Scholar] [CrossRef]
  27. Özdemir, M.; Kaya, M.T.; Akyildiz, H.K. Analysis of Surface Roughness and Cutting Forces in Hard Turning of 42CrMo4 Steel Using Taguchi and RSM Method. Mechanika 2020, 26, 231–241. [Google Scholar] [CrossRef]
  28. Hreha, P.; Radvanska, A.; Knapcikova, L.; Królczyk, G.M.; Legutko, S.; Królczyk, J.B.; Hloch, S.; Monka, P. Roughness Parameters Calculation by Means of On-Line Vibration Monitoring Emerging from AWJ Interaction with Material. Metrol. Meas. Syst. 2015, 22, 315–326. [Google Scholar] [CrossRef]
  29. Yang, K.Z.; Pramanik, A.; Basak, A.K.; Dong, Y.; Prakash, C.; Shankar, S.; Dixit, S.; Kumar, K.; Vatin, N.I. Application of Coolants during Tool-Based Machining—A Review. Ain Shams Eng. J. 2023, 14, 101830. [Google Scholar] [CrossRef]
  30. Soori, M.; Arezoo, B. The Effects of Coolant on the Cutting Temperature, Surface Roughness and Tool Wear in Turning Operations of Ti6Al4V Alloy. Mech. Based Des. Struct. Mach. 2024, 52, 3277–3299. [Google Scholar] [CrossRef]
  31. Namboodri, T.; Felhő, C.; Sztankovics, I. Early Signs of Tool Damage in Dry and Wet Turning of Chromium–Nickel Alloy Steel. J 2025, 8, 28. [Google Scholar] [CrossRef]
  32. Namboodri, T.; Felhő, C.; Sztankovics, I. Optimization of Machining Parameters for Improved Surface Integrity in Chromium–Nickel Alloy Steel Turning Using TOPSIS and GRA. Appl. Sci. 2025, 15, 8895. [Google Scholar] [CrossRef]
Figure 1. Schematic diagram of the workpiece for the experiment.
Eng 07 00033 g001
Figure 2. (a) Experimental setup, (b) dynamometer, (c) workpieces.
Eng 07 00033 g002
Figure 3. Schematic diagram of the cutting force measurement setup.
Eng 07 00033 g003
Figure 4. Variation in cutting force components under different machining parameters and conditions for each experiment.
Eng 07 00033 g004
Figure 5. Chart of percentage reduction in cutting forces from dry to wet.
Eng 07 00033 g005
Figure 6. Interaction plot of f, Ns, and resultant cutting force under dry and wet machining condition.
Eng 07 00033 g006
Figure 7. Scatter plot to find the effect of cutting forces on the Rq.
Eng 07 00033 g007
Table 1. Full factorial DoE.
Experiment No.Spindle Speed (Ns)Feed
(f)
Depth of Cut
(ap)
Machining Condition
rpmmm/revmmDry/Wet
EX110000.10.5Dry
EX215000.3
EX320000.1
EX410000.3
EX515000.1
EX620000.3
EX710000.10.5Wet
EX815000.3
EX920000.1
EX1010000.3
EX1115000.1
EX1220000.3
Table 2. Cutting forces RMS for each component and resultant.
Experiment No.Spindle Speed (Ns)Feed
(f)
Machining ConditionTangential Cutting Force RMS
F c
Radial Cutting Force RMS
F p
Axial Cutting Force RMS
F f
Resultant Cutting Force RMS
F R
rpmmm/revDry/WetNNNN
110000.1Dry161.4103997.3264817.56194189.29918
215000.3377.4738147.4943596.13854416.51371
320000.1158.5253295.1128520.42163185.99401
410000.3379.19535163.8073690.01096422.75754
515000.1160.3945198.7175419.75654189.37231
620000.3337.27867139.3614586.22995374.98549
710000.1Wet143.7711795.1224315.26039173.06446
815000.3316.65959140.7930277.85476355.18634
920000.1140.4101998.8284114.05384172.27764
1010000.3330.4806165.2279173.33779376.69102
1115000.1144.7652999.99614.94935176.57766
1220000.3295.40404135.1795872.76231332.91353
Table 3. Calculated percentage reduction in cutting forces from dry to wet.
Spindle Speed (Ns)Feed
(f)
Machining ConditionResultant Cutting Force RMS
F R
Reduction Percentage
rpmmm/revDry/WetN%
10000.1Dry189.299188.576223098
Wet173.06446
1500Dry416.5137114.72397391
Wet355.18634
2000Dry185.994017.374629968
Wet172.27764
10000.3Dry422.7575410.89667614
Wet376.69102
1500Dry189.372316.756346796
Wet176.57766
2000Dry374.9854911.21962346
Wet332.91353
Table 4. The developed regression model summary.
ModelRR SquareAdjusted R SquareStd. Error of the EstimateChange Statistics
R Square ChangeF Changedf1df2Sig. F Change
0.991 a0.9830.97716.319207180.983153.601380
a Predictors: Machining Condition, Feed, Spindle Speed. df1: Between-Group Degrees of Freedom (Numerator). df2: Within Group Degrees of Freedom (Denominator).
Table 5. Analysis of variance in the developed model.
ANOVA a
Model Sum of SquaresdfMean SquareFSig.
Regression122,719.396340,906.465153.6010.000 b
Residual2130.5328266.317
Total124,849.92811
a Dependent Variable: F R . b Predictors: Machining Condition, Feed, Spindle Speed.
Table 6. Coefficients of the regression model.
Model Unstandardized Coefficients Standardized CoefficientstSig.95 Percent Confidence
Interval for B
BStd. ErrorBeta Lower BoundUpper Bound
(Constant)133.60920.803 6.423085.637181.581
Spindle Speed−0.0240.012−0.096−2.0720.072−0.0510.003
Feed993.71947.1090.97421.0940885.0841102.353
Machining Condition−32.0359.422−0.157−3.40.009−53.762−10.308
Dependent Variable: F R .
Table 7. Measured value of root mean square (RMS) surface roughness (Rq) with machining parameters and resultant cutting forces.
Experiment No.Spindle SpeedFeedMachining ConditionResultant Cutting Force RMS
F R
Root Mean Square Surface Roughness
Rq
rpmmm/rev Nμm
110000.1Dry189.299181.036
215000.3416.513714.578
320000.1185.994011.014
410000.3422.757544.870
515000.1189.372311.038
620000.3374.985494.928
710000.1Wet173.064460.839
815000.3355.186344.592
920000.1172.277640.712
1010000.3376.691024.756
1115000.1176.577660.816
1220000.3332.913534.904
Table 8. ANOVA between the cutting forces group and Rq.
ANOVA
Sum of SquaresdfMean SquareFSig.
Between Groups44.756222.378954.1220
Within Groups0.21190.023
Total44.96711
Disclaimer/Publisher’s Note: The statements, opinions and data contained in all publications are solely those of the individual author(s) and contributor(s) and not of MDPI and/or the editor(s). MDPI and/or the editor(s) disclaim responsibility for any injury to people or property resulting from any ideas, methods, instructions or products referred to in the content.