Abstract
Electricity distribution systems face increasing challenges due to demand growth, regulatory requirements, and the integration of distributed generation. In this context, distribution companies must make strategic and well-supported investment decisions, particularly in asset reinforcement actions such as reconductoring. This paper presents a multi-stage methodology to optimize reconductoring investments under load forecasting uncertainties. The approach combines a decomposition strategy with Monte Carlo simulation to capture demand variability. By discretizing a lognormal probability density function and selecting the largest loads in the network, the methodology balances computational feasibility with modeling accuracy. The optimization model employs exhaustive search techniques independently for each network branch, ensuring precise and consistent investment decisions. Tests conducted on the IEEE 123-bus feeder consider both operational and regulatory constraints from the Brazilian context. Results show that uncertainty-aware planning leads to a narrow investment range—between USD 55,108 and USD 66,504—highlighting the necessity of reconductoring regardless of demand scenarios. A comparative analysis of representative cases reveals consistent interventions, changes in conductor selection, and schedule adjustments based on load conditions. The proposed methodology enables flexible, cost-effective, and regulation-compliant investment planning, offering valuable insights for utilities seeking to enhance network reliability and performance while managing demand uncertainties.
1. Introduction
Throughout the 20th century, the Brazilian electricity sector experienced a nationalization process due to insufficient private investments to support the expansion of generation, transmission, and distribution infrastructure. By the 1980s, the state-controlled model began to exhibit signs of inefficiency [1,2]. In the 1990s, the Brazilian electricity sector underwent a restructuring process, introducing entities for generation, commercialization, transmission, and distribution into the market, each operating under specific regulatory guidelines. This reorganization commenced with the enactment of Law No. 9427 in December 1996, establishing the regulatory framework for the sector [3]. This process involved the privatization of operating companies and the establishment of the National Electric Energy Agency (ANEEL). The concession contracts between the state and electricity sector entities—particularly distribution, transmission, and generation companies—are regulated and monitored by the ANEEL. The evaluation process encompasses multiple factors, including tariff structures and service quality, assessed from both a technical perspective and customer service performance standards [3,4].
In this context, distribution entities are exclusively responsible for determining whether to proceed with or defer asset investments, as well as for selecting the type of investment to be made each year within the established planning horizon. The regulatory agency, in turn, is responsible for supervising the provision of public services to ensure compliance with sectoral guidelines. Furthermore, distribution entities are required to continuously enhance their internal technical processes to adapt to evolving market conditions, which are increasingly influenced by the Smart Grid paradigm and the growing integration of distributed generation.
The asset-related decision-making process is inherently influenced by uncertainties, which may stem from factors such as load fluctuations, variations in generation capacity, or the occurrence of operational failures, individually or in combination [5,6,7,8,9,10,11,12,13,14,15,16,17,18,19,20,21,22,23]. In power distribution systems, the primary sources of uncertainty are deviations from forecasted demand in market studies, either exceeding or falling short of expectations. If the actual demand () is significantly lower than the forecasted demand (), the utility company may face investment disallowances, as these expenditures were based on
[24]. Investments deemed imprudent are not incorporated into the tariff structure in the subsequent tariff review cycle and are consequently deducted from the company’s profits. Conversely, if
, the electricity distribution system may be unable to accommodate the load, necessitating emergency investments and corrective measures to prevent load shedding and mitigate penalties for non-compliance with the technical quality standards [4]. Emergency investments and corrective actions are typically more costly than investments executed within an adequate planning framework [25].
The expansion planning of power distribution systems involves multiple decision-making aspects, including conductor replacement (reconductoring), substation expansion, reactive power compensation, and other technical interventions. Among these, reconductoring is a widely adopted strategy in Brazilian power distribution systems to enhance network capacity and reliability.
Due to the combinatorial nature that typically characterizes reconfiguration and reconductoring problems, most methodologies in the literature employ metaheuristic algorithms to obtain feasible and near-optimal solutions [26,27]. These approaches help address the high computational complexity associated with large-scale distribution networks. In this context, this article proposes a multi-stage decomposition approach for the reconductoring problem.
The proposed methodology integrates exhaustive search and decomposition by dividing the decision-making process into independent sub-stages, with the distinctive feature of independently optimizing the reconductoring process for each branch. This combination explores the entire solution space within acceptable computational time and ensures efficient identification of optimal solutions. Furthermore, this study incorporates uncertainties associated with load points into the decision-making framework, representing the variation in net load at each point (the balance between consumption and generation), thus ensuring robustness in asset investment planning for electricity distribution networks. The proposed methodology seeks to provide a practical and computationally efficient solution for reconductoring decisions, contributing to the optimization of power distribution system expansion.
2. Methodology
This section describes the proposed methodology, which is structured into four main aspects. Section 2.1 presents the general framework, highlighting the distinct dynamics of asset investment decisions and the reconductoring optimization process. Section 2.2 introduces the optimization model, detailing the problem decomposition strategy, the mathematical formulation, and the constraints applied to ensure feasible solutions. Section 2.3 discusses the computational aspects, including the software tools and hardware specifications used for simulations. Finally, Section 2.4 outlines the testing and validation process, describing the case study, system parameters, and evaluation criteria used to assess the proposed methodology.
2.1. General Information on the Proposed Approach
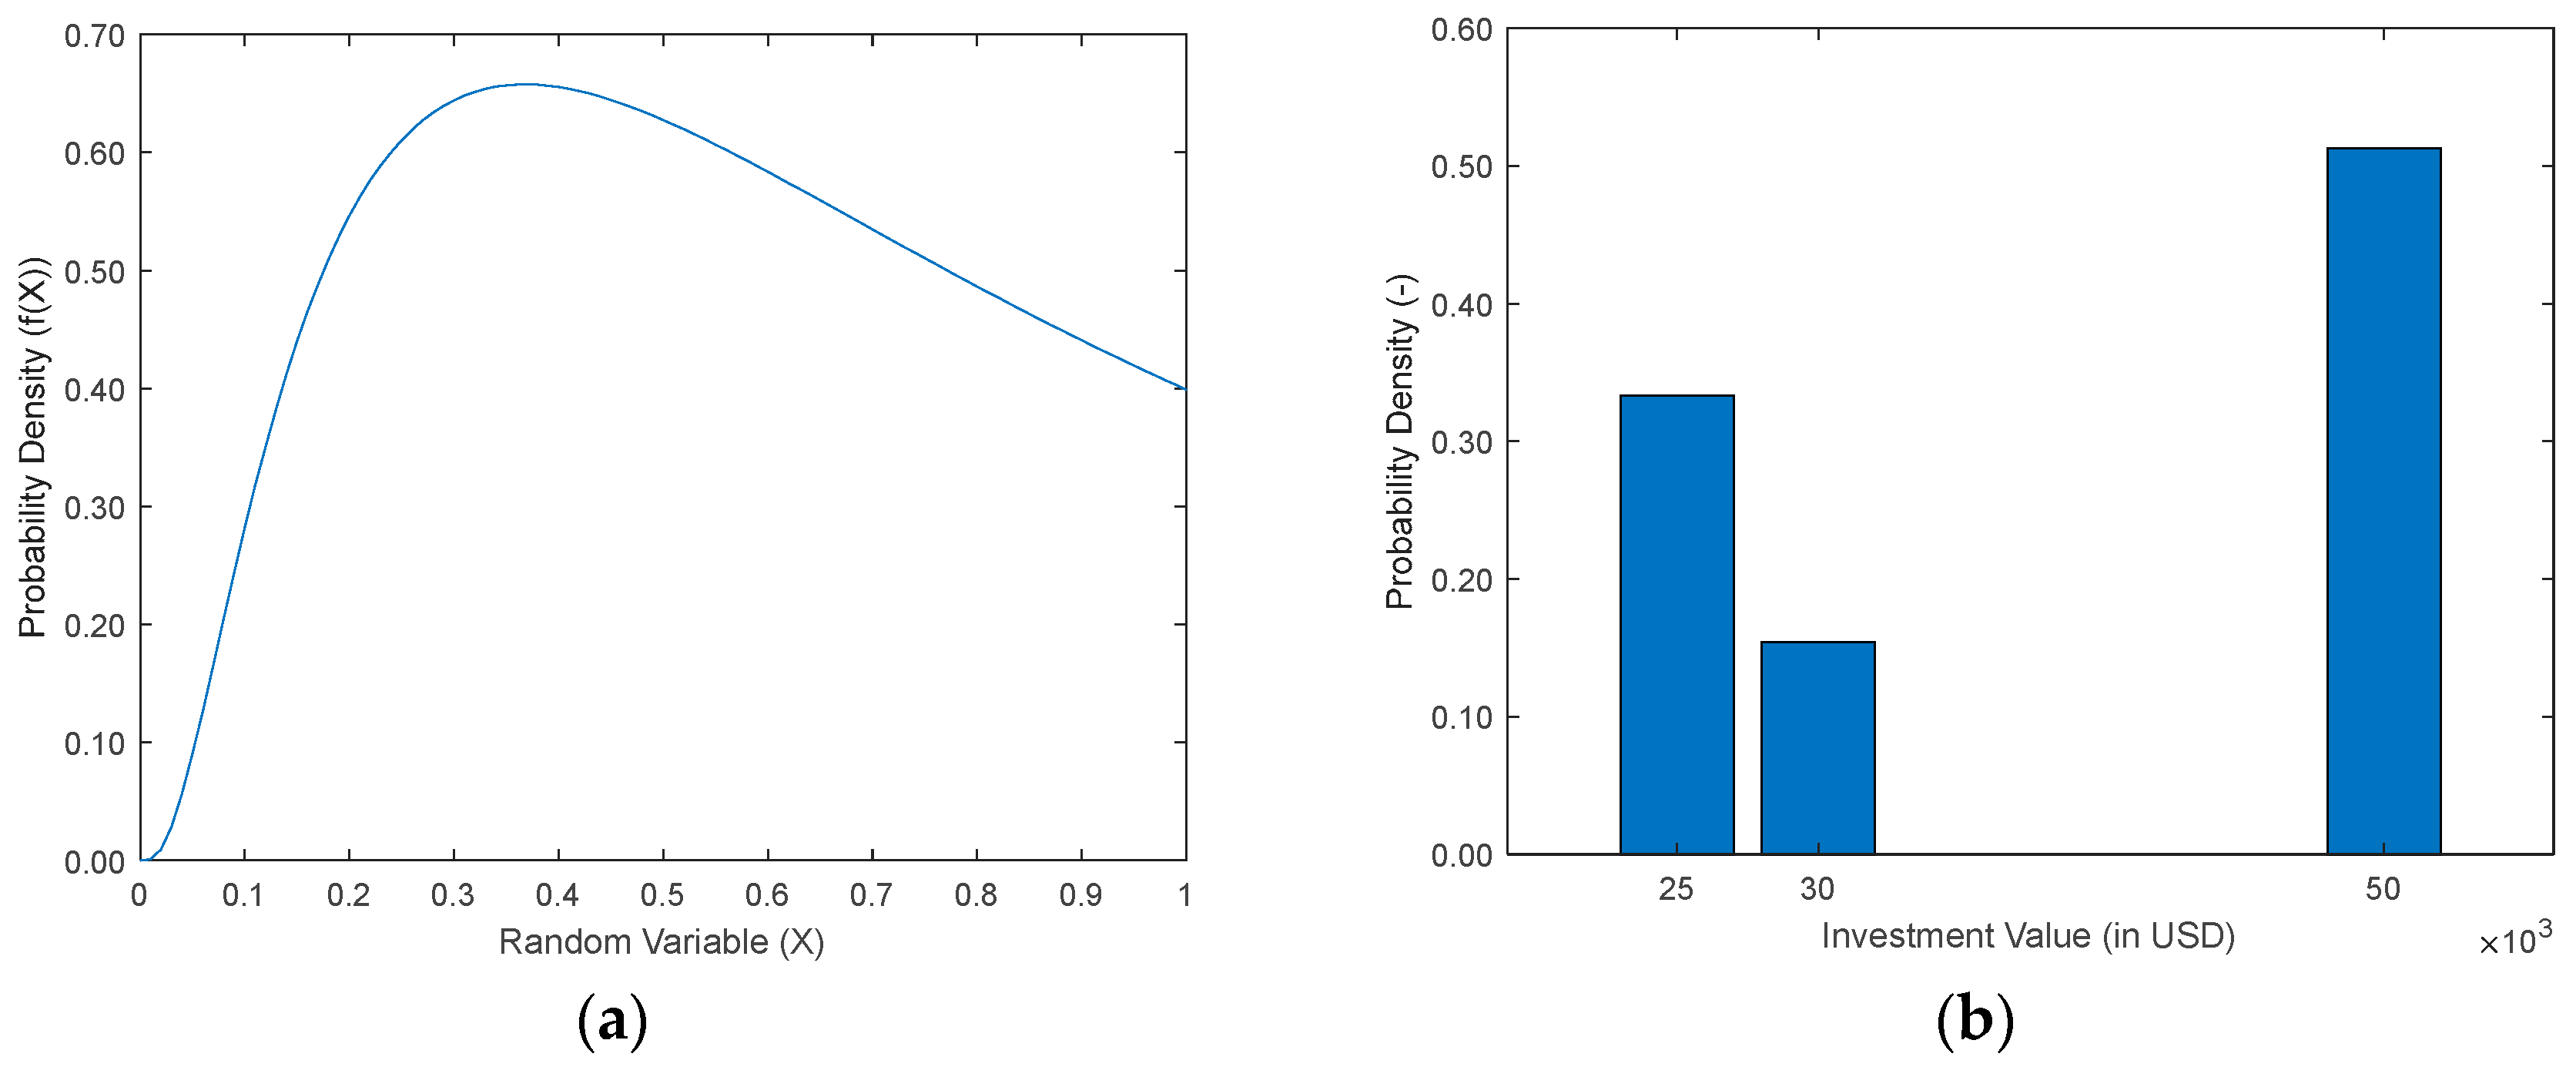
The decision-making process regarding asset investments in electricity distribution networks involves two distinct dynamics, which must first be analyzed separately to properly characterize their influence. The load variation around the expected value follows a continuous pattern, best represented by a continuous probability density function (PDF), as illustrated in Figure 1a. However, for computational applications, discretizing the continuous PDF becomes necessary. This discretization should employ an adequate number of classes, ensuring a balance between computational efficiency and accuracy, rather than an excessively large number that could increase computational complexity without significant gains in precision. Moreover, the investment dynamics exhibit a strongly discrete nature, since the capacity of the equipment installed in the network—and consequently its cost—varies in distinct increments, as illustrated in Figure 1b.
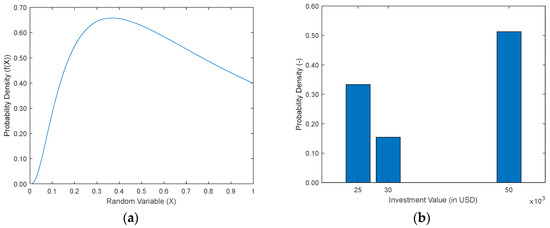
Figure 1.
Example of a discrete PDF associated with (a) expected load value and (b) asset investments in electricity distribution networks.
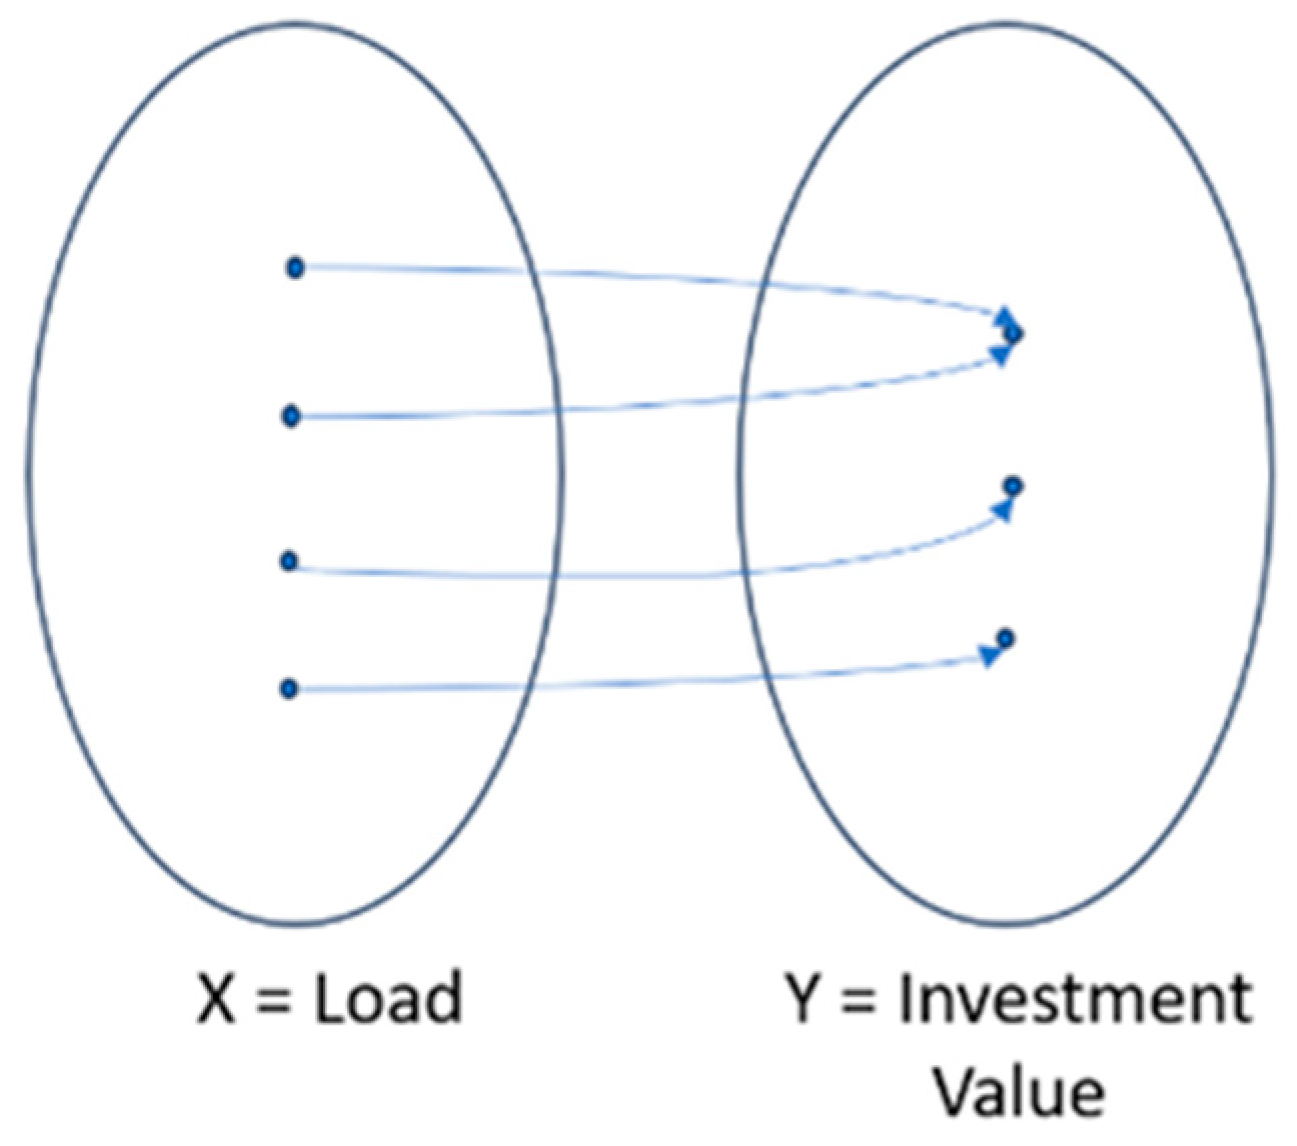
Thus, the relationship between the estimated load and the required investment can be represented as a function
, which lacks an inverse function, as illustrated in Figure 2. Consequently, variations in load relative to its estimate should not alter the investment requirement estimation. Therefore, a comprehensive understanding of this function’s behavior plays a crucial role in supporting the decision-making process.
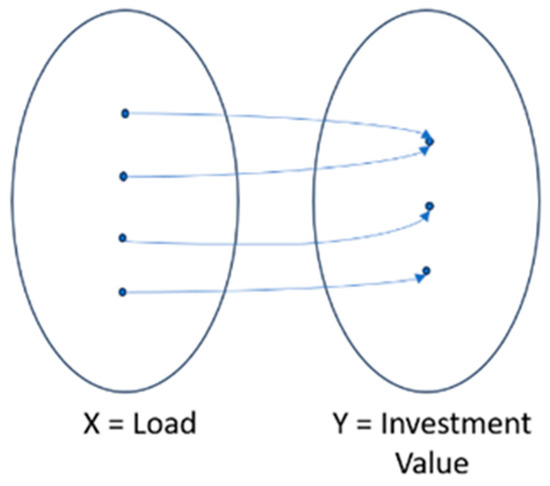
Figure 2.
Example of a f(load).
This study examines the reconductoring process, a widely adopted strategy among operators of electricity distribution systems in Brazil. Reconductoring involves replacing conductors that operate beyond their permissible loading limits with higher-capacity alternatives. This practice plays a crucial role in enhancing network capacity and operational efficiency while mitigating the impacts of load growth and system constraints.
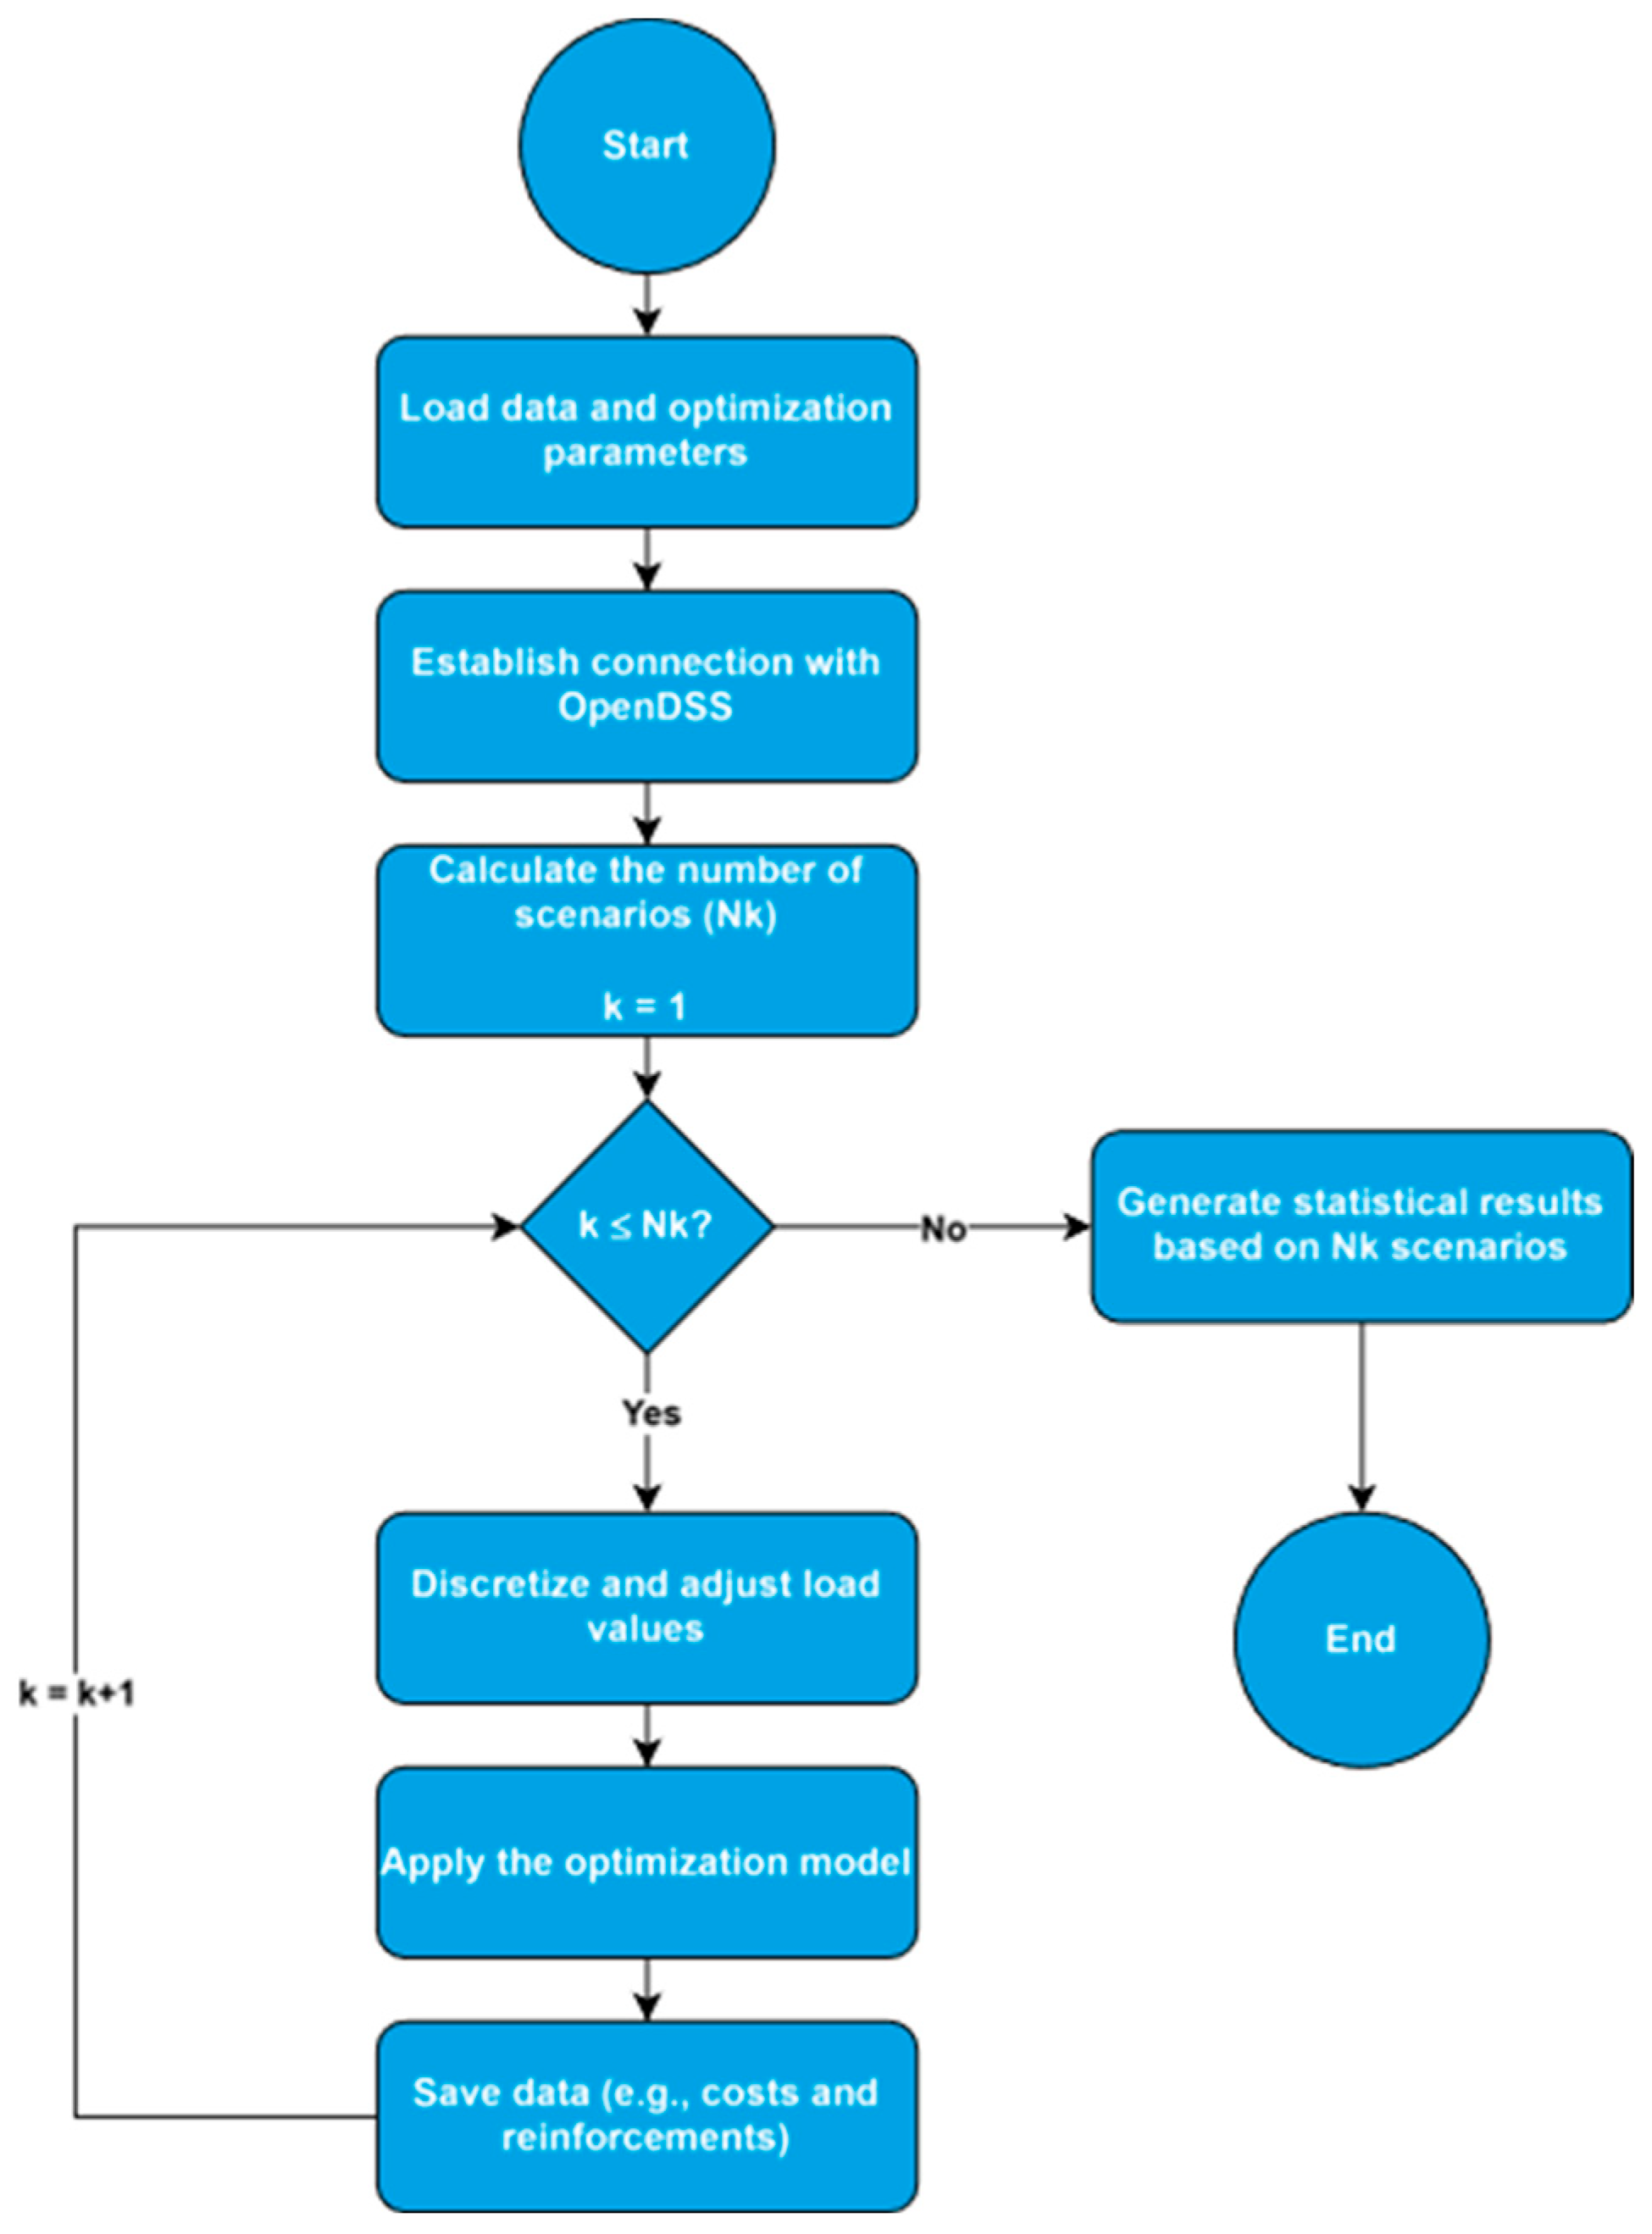
The proposed methodology follows a multi-stage framework, structured in annual stages, enabling investment allocation in reconductoring over a five-year planning horizon, starting from a designated reference year. This analysis horizon aligns with [24], which establishes the appropriate timeframe for such investments within the Brazilian regulatory framework. To incorporate load estimation uncertainties, the methodology employs Monte Carlo simulation [28], allowing a probabilistic evaluation of load variations and their impact on investment decisions. The influence of these uncertainties is assessed through the resulting investment values over the planning horizon, ensuring a more robust and data-driven decision-making framework for asset allocation in electricity distribution networks. Figure 3 presents the flowchart of the proposed algorithm.
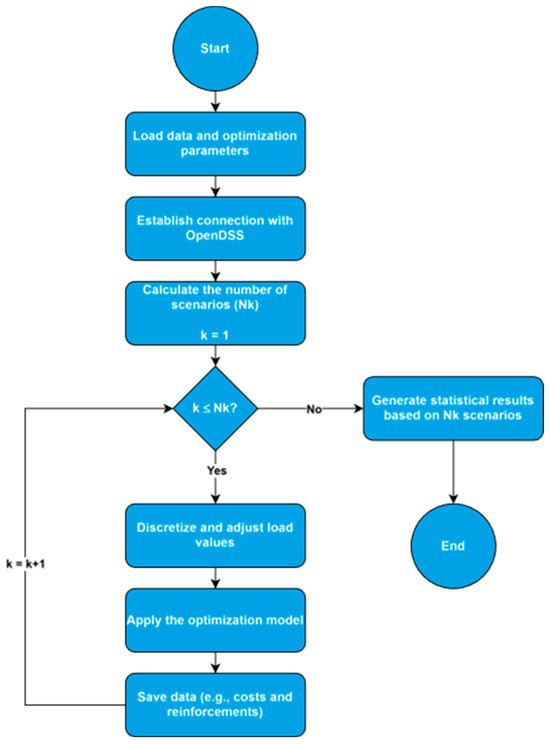
Figure 3.
Flowchart of the proposed methodology.
2.2. Optimization Model
Given the combinatorial nature of the problem, most existing methodologies utilize metaheuristic algorithms to obtain feasible and near-optimal solutions. While these approaches effectively explore the high-dimensional search space, they often introduce result variability and require extensive parameter fine-tuning to achieve satisfactory performance. To address these challenges, this study proposes a problem decomposition strategy for reconductoring optimization, dividing the problem into independent sub-stages. This approach facilitates the application of exhaustive search as a computational method for identifying optimal solutions, thereby enhancing precision and reliability in the decision-making process.
The distinctive feature of the proposed approach is the independent optimization of the reconductoring process for each branch. However, modifying the conductor in a specific branch may affect the current flow in other branches of the network. Nevertheless, this impact can be considered negligible within the adopted variation margin, ensuring that the methodology remains both computationally efficient and practically viable.
A total of
loads are selected from the available options for evaluation. The PDF is discretized into
points, resulting in
possible load combinations for analysis. This discretization provides a structured representation of load variations while ensuring computational feasibility.
The proposed optimization model is mathematically formulated in Equations (1)–(5), which define the decision variables, constraints, and objective function used to determine the optimal reconductoring strategy.
For each combination belonging to [N_points] (Nloads ):
in its decomposed form:
subject to:
where:
| Set of buses. | |
| Set of branches. | |
| Set of years within the analysis horizon. | |
| Set of available conductors. | |
| Binary variable indicating whether the conductor of branch in year was replaced from conductor to conductor . | |
| Minimum allowed voltage at the bus . | |
| Maximum allowed voltage at the bus | |
| Voltage at bus . | |
| Maximum allowed current for branch | |
| Current value in branch | |
| Reconductoring cost per unit length from conductor to conductor . | |
| Length of branch . | |
| Number of selected loads. | |
| Number of points at which the PDF was discretized. |
Equations (3) and (4) define the operational limits for voltage and current, respectively. Equation (5) ensures that the selected conductors are within the specified set of available conductors. The power flow constraints are ensured by the power flow analysis software, as detailed in Section 2.3.
2.3. Computational Aspects
The power flow analysis was conducted using OpenDSS® Version 10 , an open-source software developed by the Electric Power Research Institute (EPRI) in 1997 for power flow studies in electrical distribution systems. To facilitate parameter manipulation, control, editing, and result visualization, C# was integrated with OpenDSS®. All graphical representations were produced in MATLAB® R2013. The simulations were executed on an Acer notebook equipped with an Intel Core i7 processor, 16 GB of RAM, and Microsoft Windows 11 as the operating system.
2.4. Testing and Validation
The proposed methodology was tested on the IEEE 123-bus feeder, an electric distribution network provided by the Institute of Electrical and Electronics Engineers (IEEE) and widely used to validate computational methodologies [29,30].
The typical annual growth rate was set to 5% [31]. Bus voltage values were considered adequate when maintained within the range of 0.93 pu to 1.05 pu, in accordance with medium-voltage network regulations established by ANEEL [4]. Line loading percentages were deemed acceptable when remaining at or below 66% of the conductor’s capacity throughout the planning horizon, following the emergency circuit criterion presented in [32].
The lognormal PDF was selected for load modeling due to its suitability for representing non-negative values—see Equation (6). Variables representing loads often follow a normal or lognormal probability density function, or another suitable distribution when justified. This study adopts the lognormal distribution because it enables straightforward implementation and aligns with the goal of analyzing how load variations affect reconductoring costs. Selecting a simpler and more interpretable probability density function offers clear insight into these variations, and this benefit outweighs any minor differences from the original variable shape.
where
| Average value | |
| Standard deviation | |
| Random variable value |
The lognormal PDF was discretized into 5 points to facilitate computational processing. A relative standard deviation of 10% was adopted to characterize the variability of load estimates. To ensure computational efficiency while maintaining the accuracy of the proposed approach, the 3 largest loads in the test network were selected for modeling using the lognormal PDF. This selection ensures that computational effort remains compatible with the study’s objectives, focusing on the most critical demand points while preventing excessive complexity. The total number of simulated scenarios is given by Equation (7).
where
| Number of simulated scenarios. |
The confidence interval (
) can be obtained from [33]—Equation (8):
where
| Confidence interval. | |
| Z-score relative to the adopted confidence interval. |
Considering a relative standard deviation of 10% and a 90% confidence level, the confidence interval can be obtained from (9), considered reduced as per [33].
Conductors were assigned to the test network, and the associated specifications are presented in Table 1. The conductor capacities listed are based on [34] and represent typical feasible values for thermal limits in distribution systems. These values were chosen to approximate realistic operating conditions, ensuring that the modeled network reflects practical constraints. The cost values in Table 1 were also derived from [34], representing the direct cost of conductors. Additionally, a 20% surcharge was incorporated into the total cost to account for potential expenditures related to the replacement of supporting infrastructure elements, such as poles, crossarms, and insulators—resulting in a more comprehensive investment estimate for network upgrades. Out of the 12 conductors listed in Table 1, 5 were used in the proposed reconductoring actions. The selection aimed to standardize conductor types across the network—an approach commonly adopted and permitted in various regulatory environments [24]. The conductors chosen for the reconductoring process are indicated in Table 1 with an asterisk (*).

Table 1.
Technical and economic characteristics of the conductors applied in the test system.
3. Results and Discussion
This section presents the main results derived from the simulations outlined in Section 2. Since all cases complied with voltage regulation standards, the analysis focuses on the current-carrying capacity of each branch throughout the planning horizon.
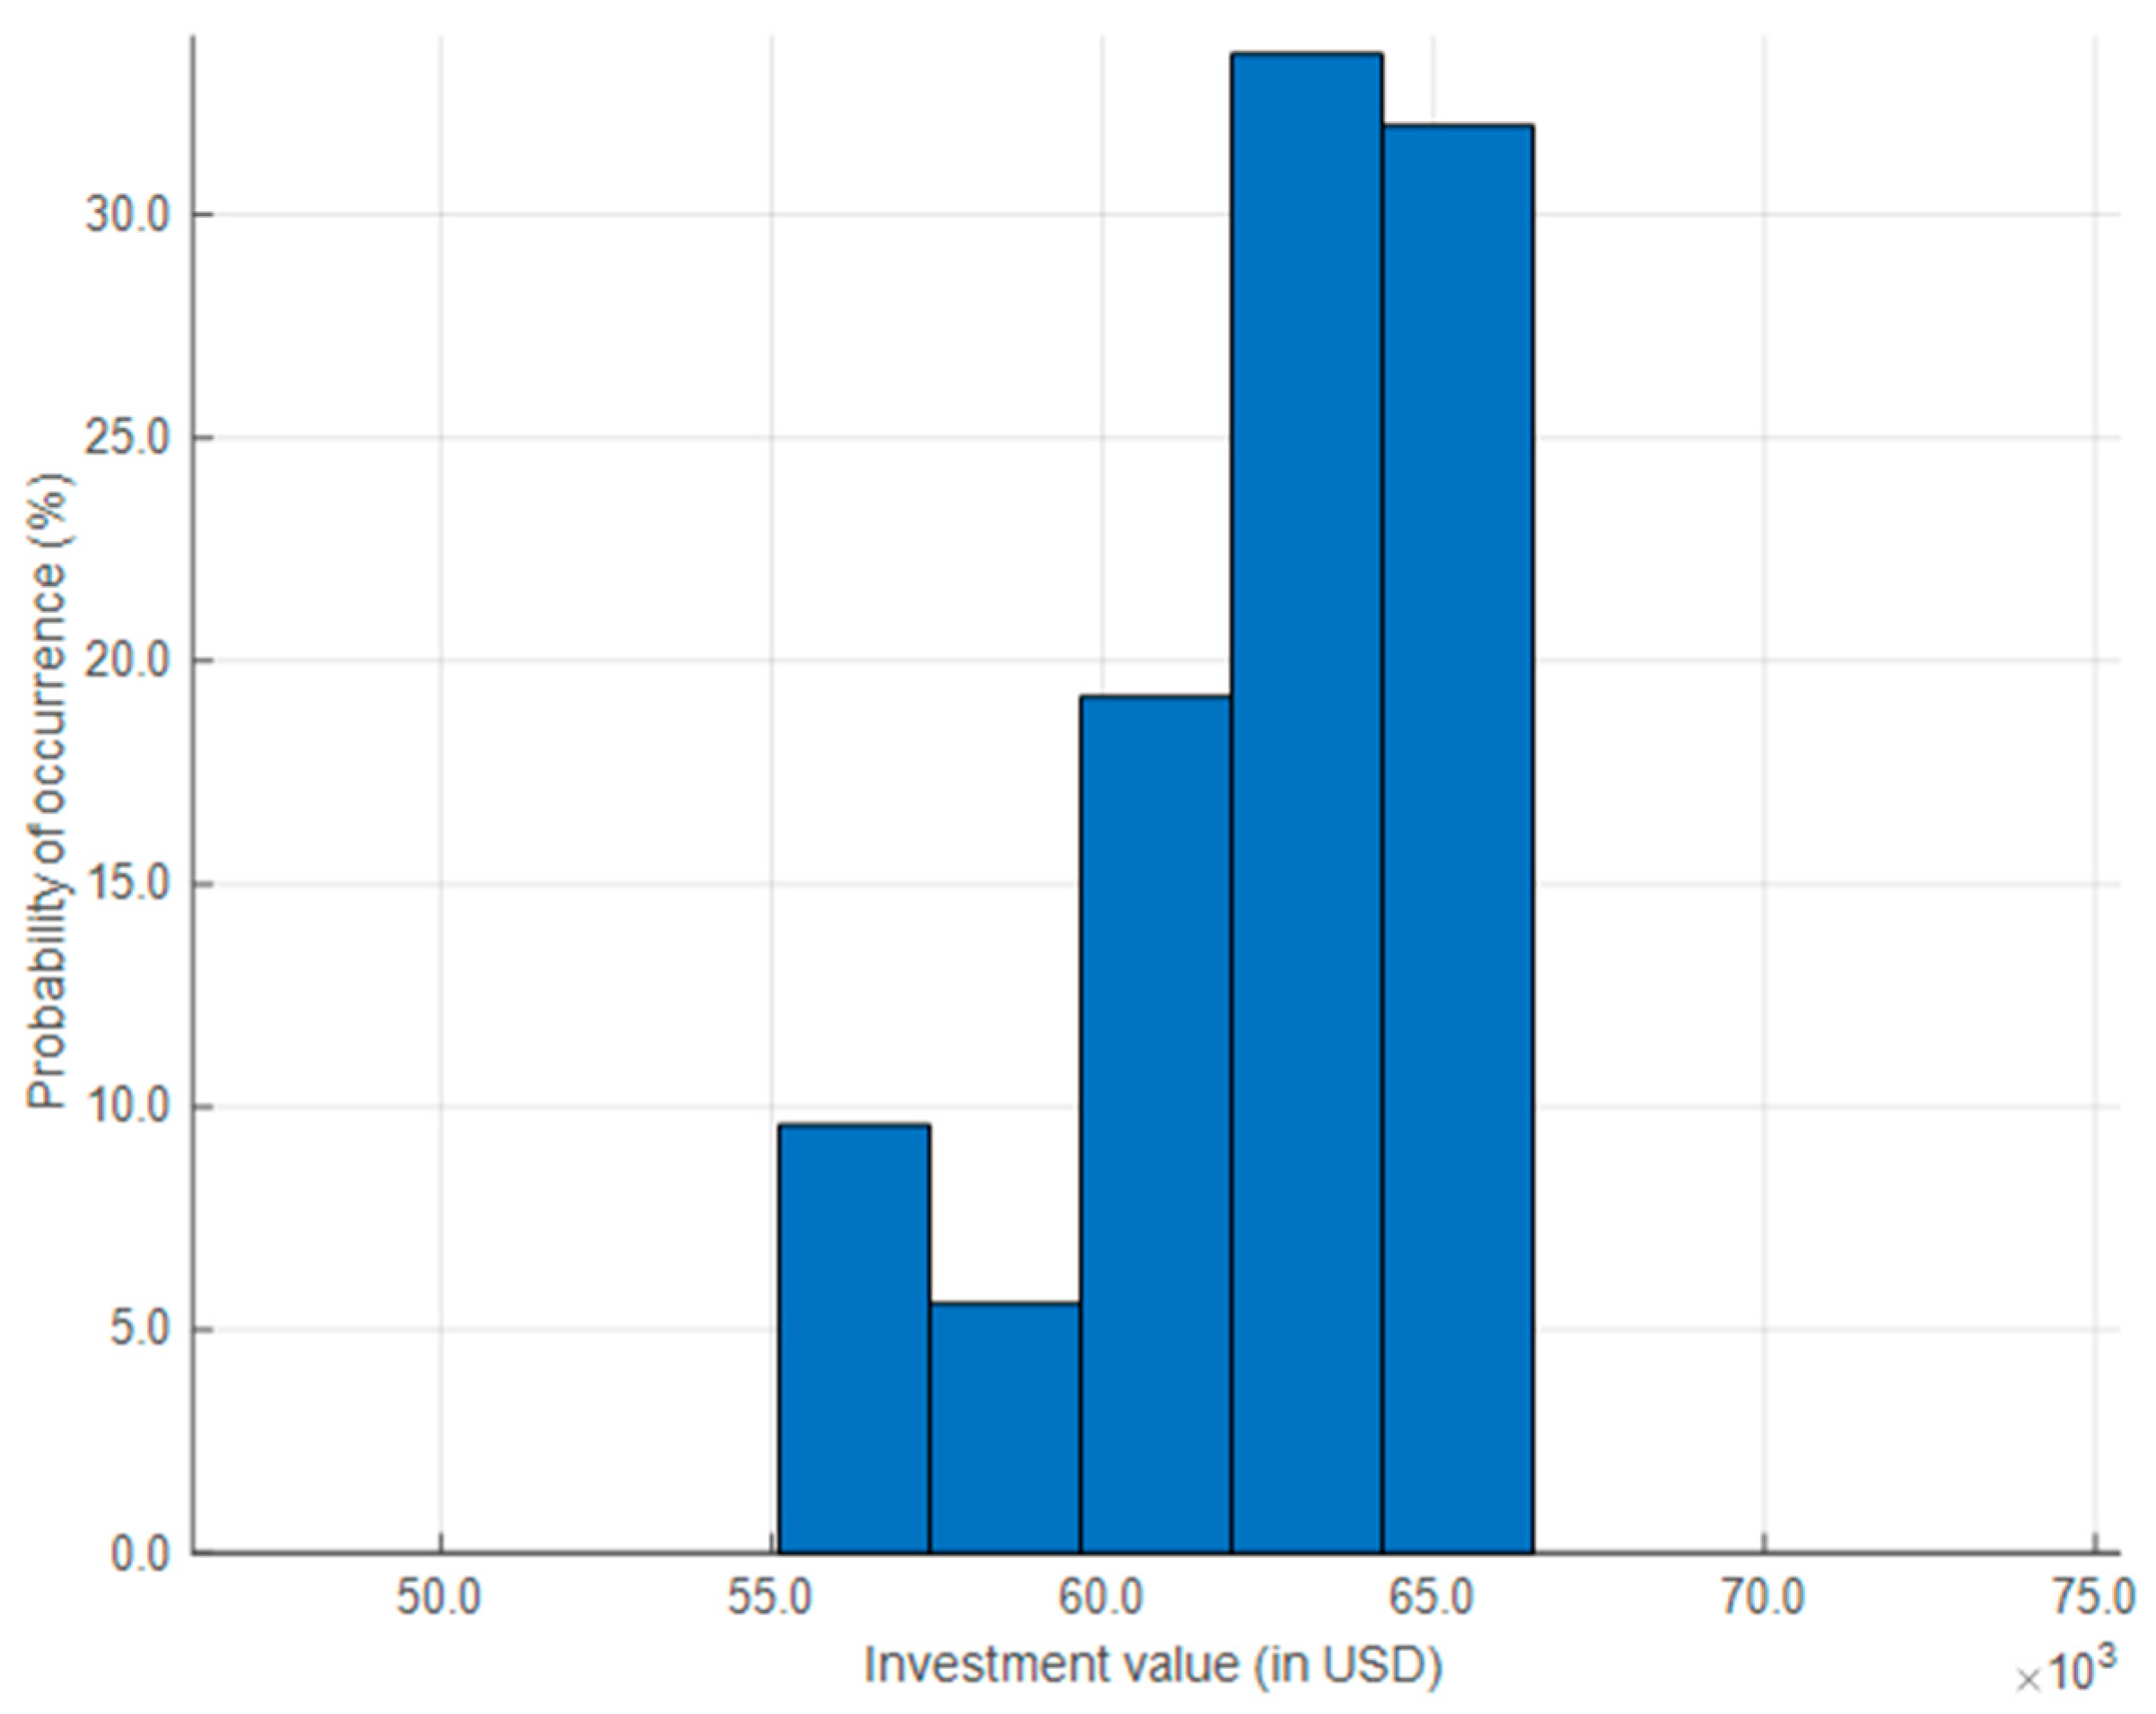
The results are organized into two parts. The first part examines the overall investment behavior across all simulated scenarios using a histogram, shown in Figure 4. The x-axis represents the total investment values in United States dollars over the five-year planning horizon, while the y-axis indicates the probability of occurrence for each value. Considering a 90% confidence interval, investment amounts range approximately from USD 56,000 to USD 66,000, which means there is a 90% probability that the investment value will fall within this range. The probability distribution is asymmetric and skewed to the right, highlighting a greater likelihood of higher investment levels. For instance, there is a 65.6% probability that the total investment will reach or exceed USD 63,000. This trend reflects a consistent growth in load that increases the risk of exceeding conductor capacities, thereby requiring more frequent reconductoring. Under these conditions, reconductoring should be considered not only from a technical standpoint but also within an economic framework, supporting more informed and strategic investment decisions.
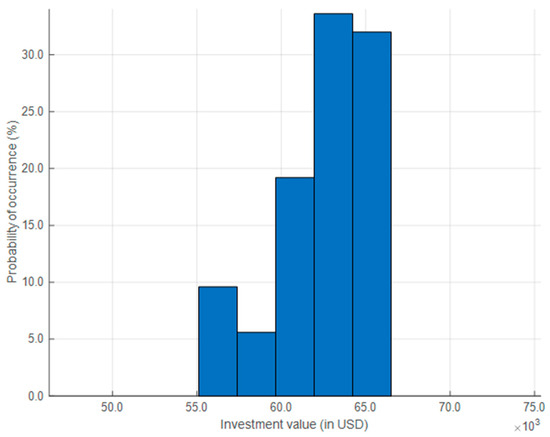
Figure 4.
Investment histogram over the analysis horizon.
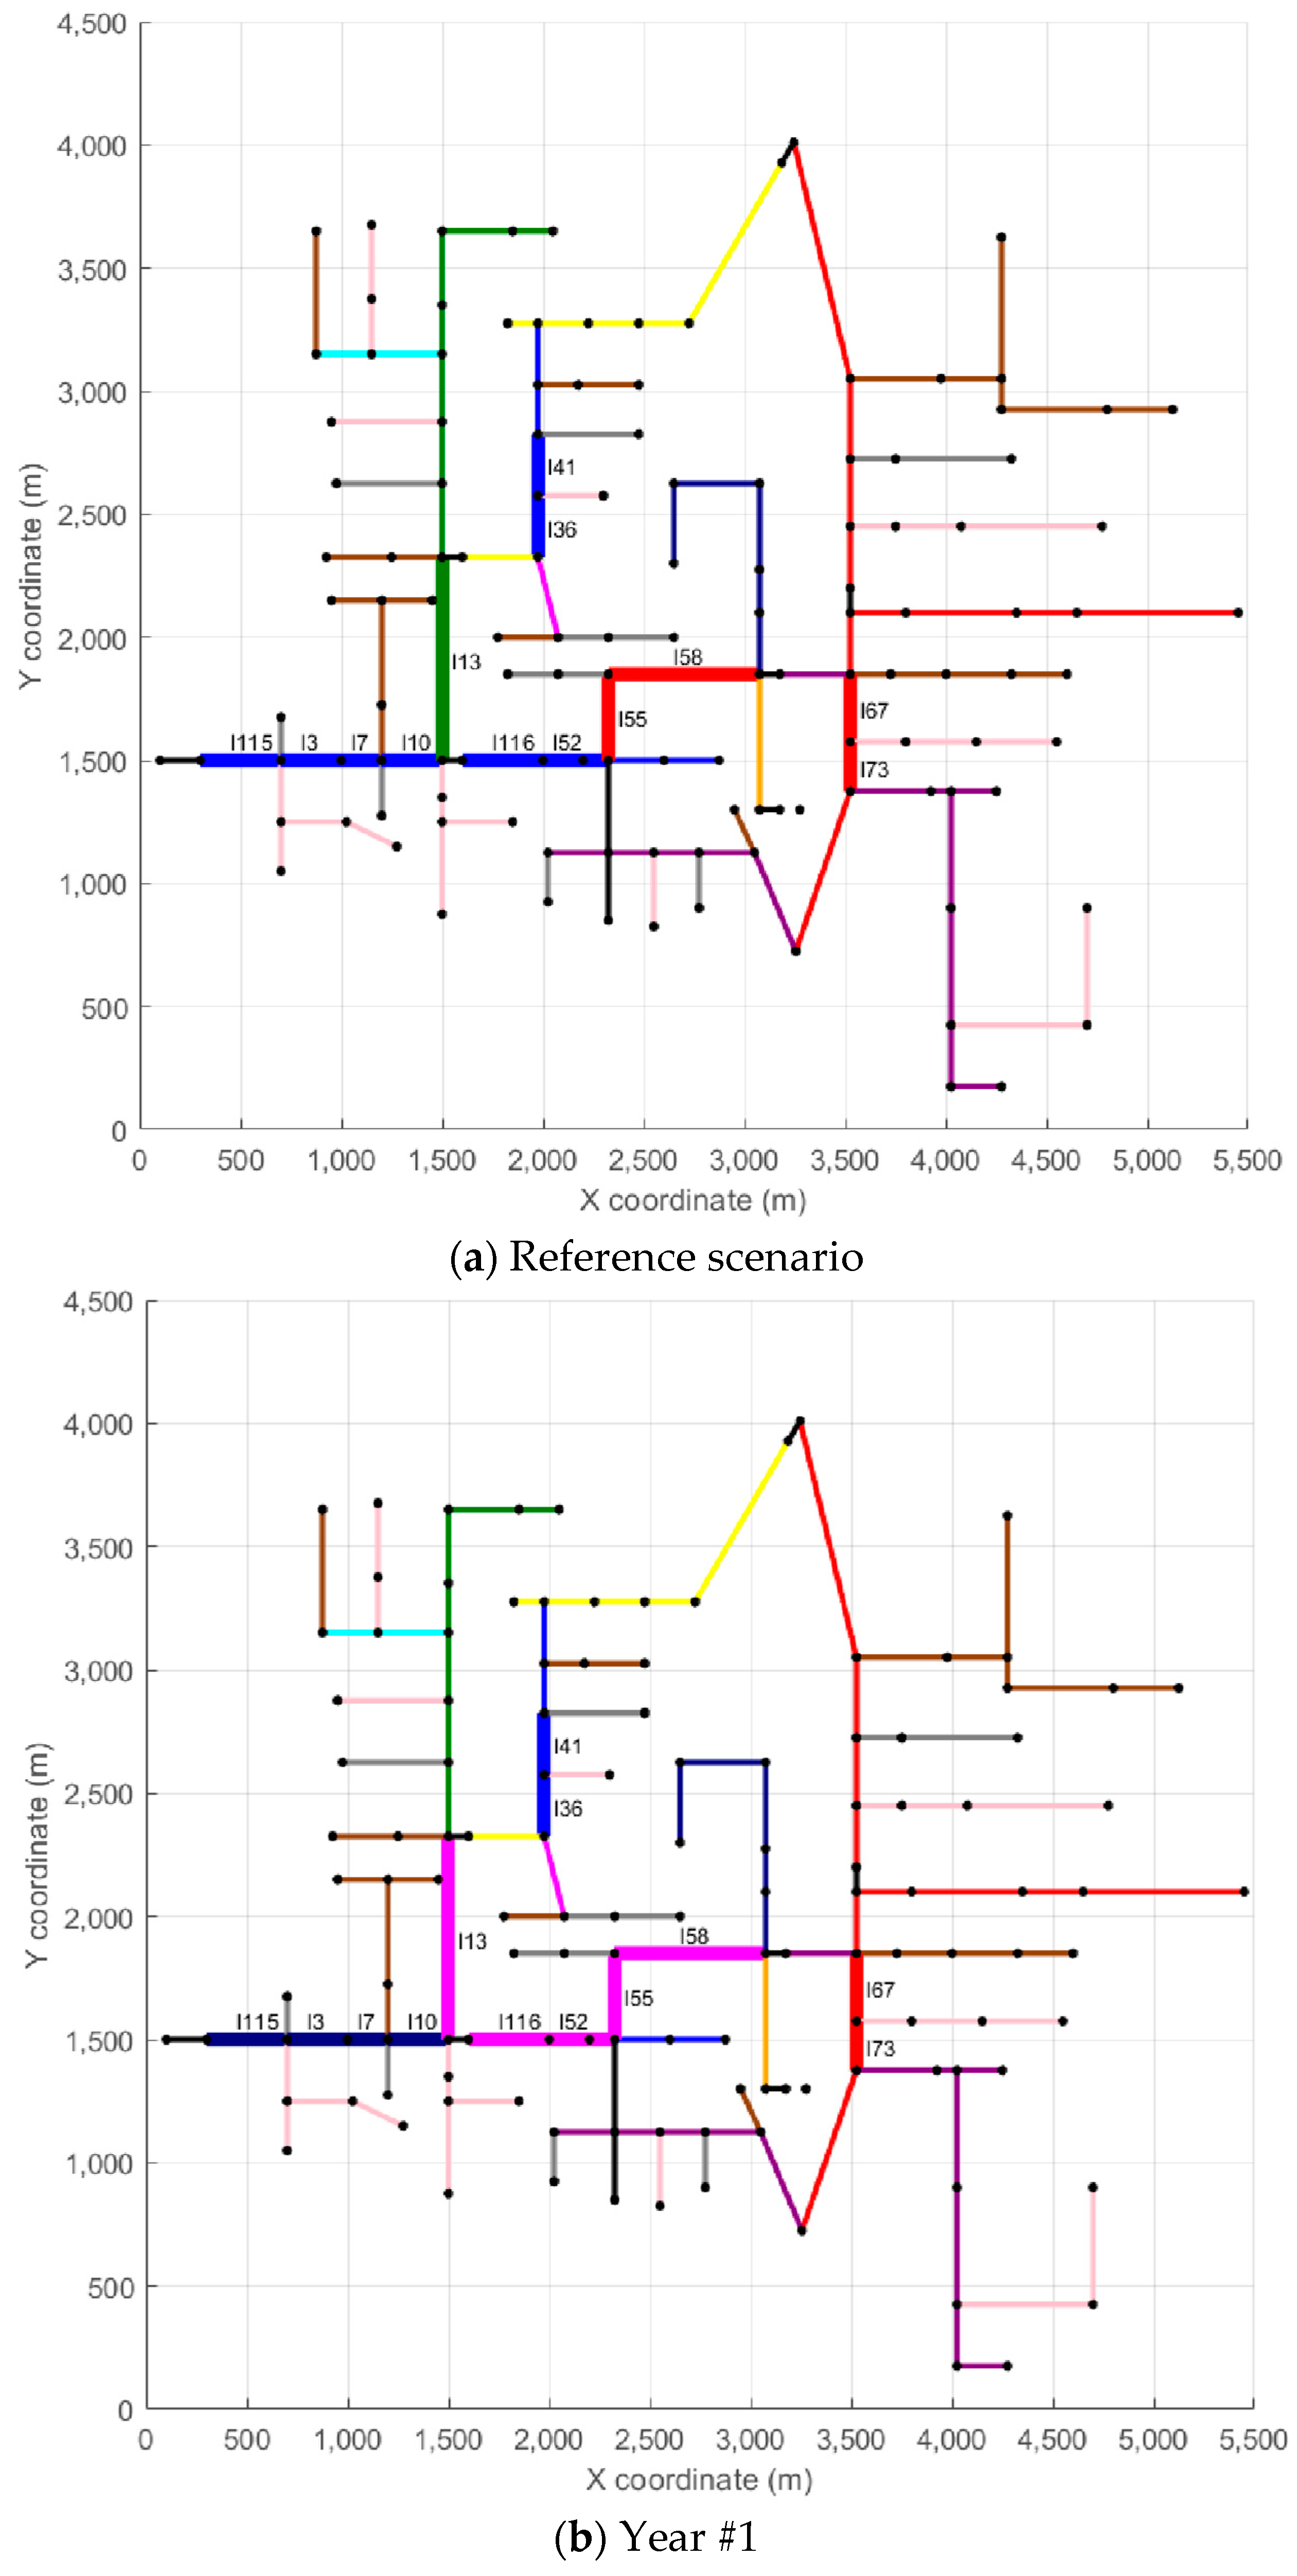
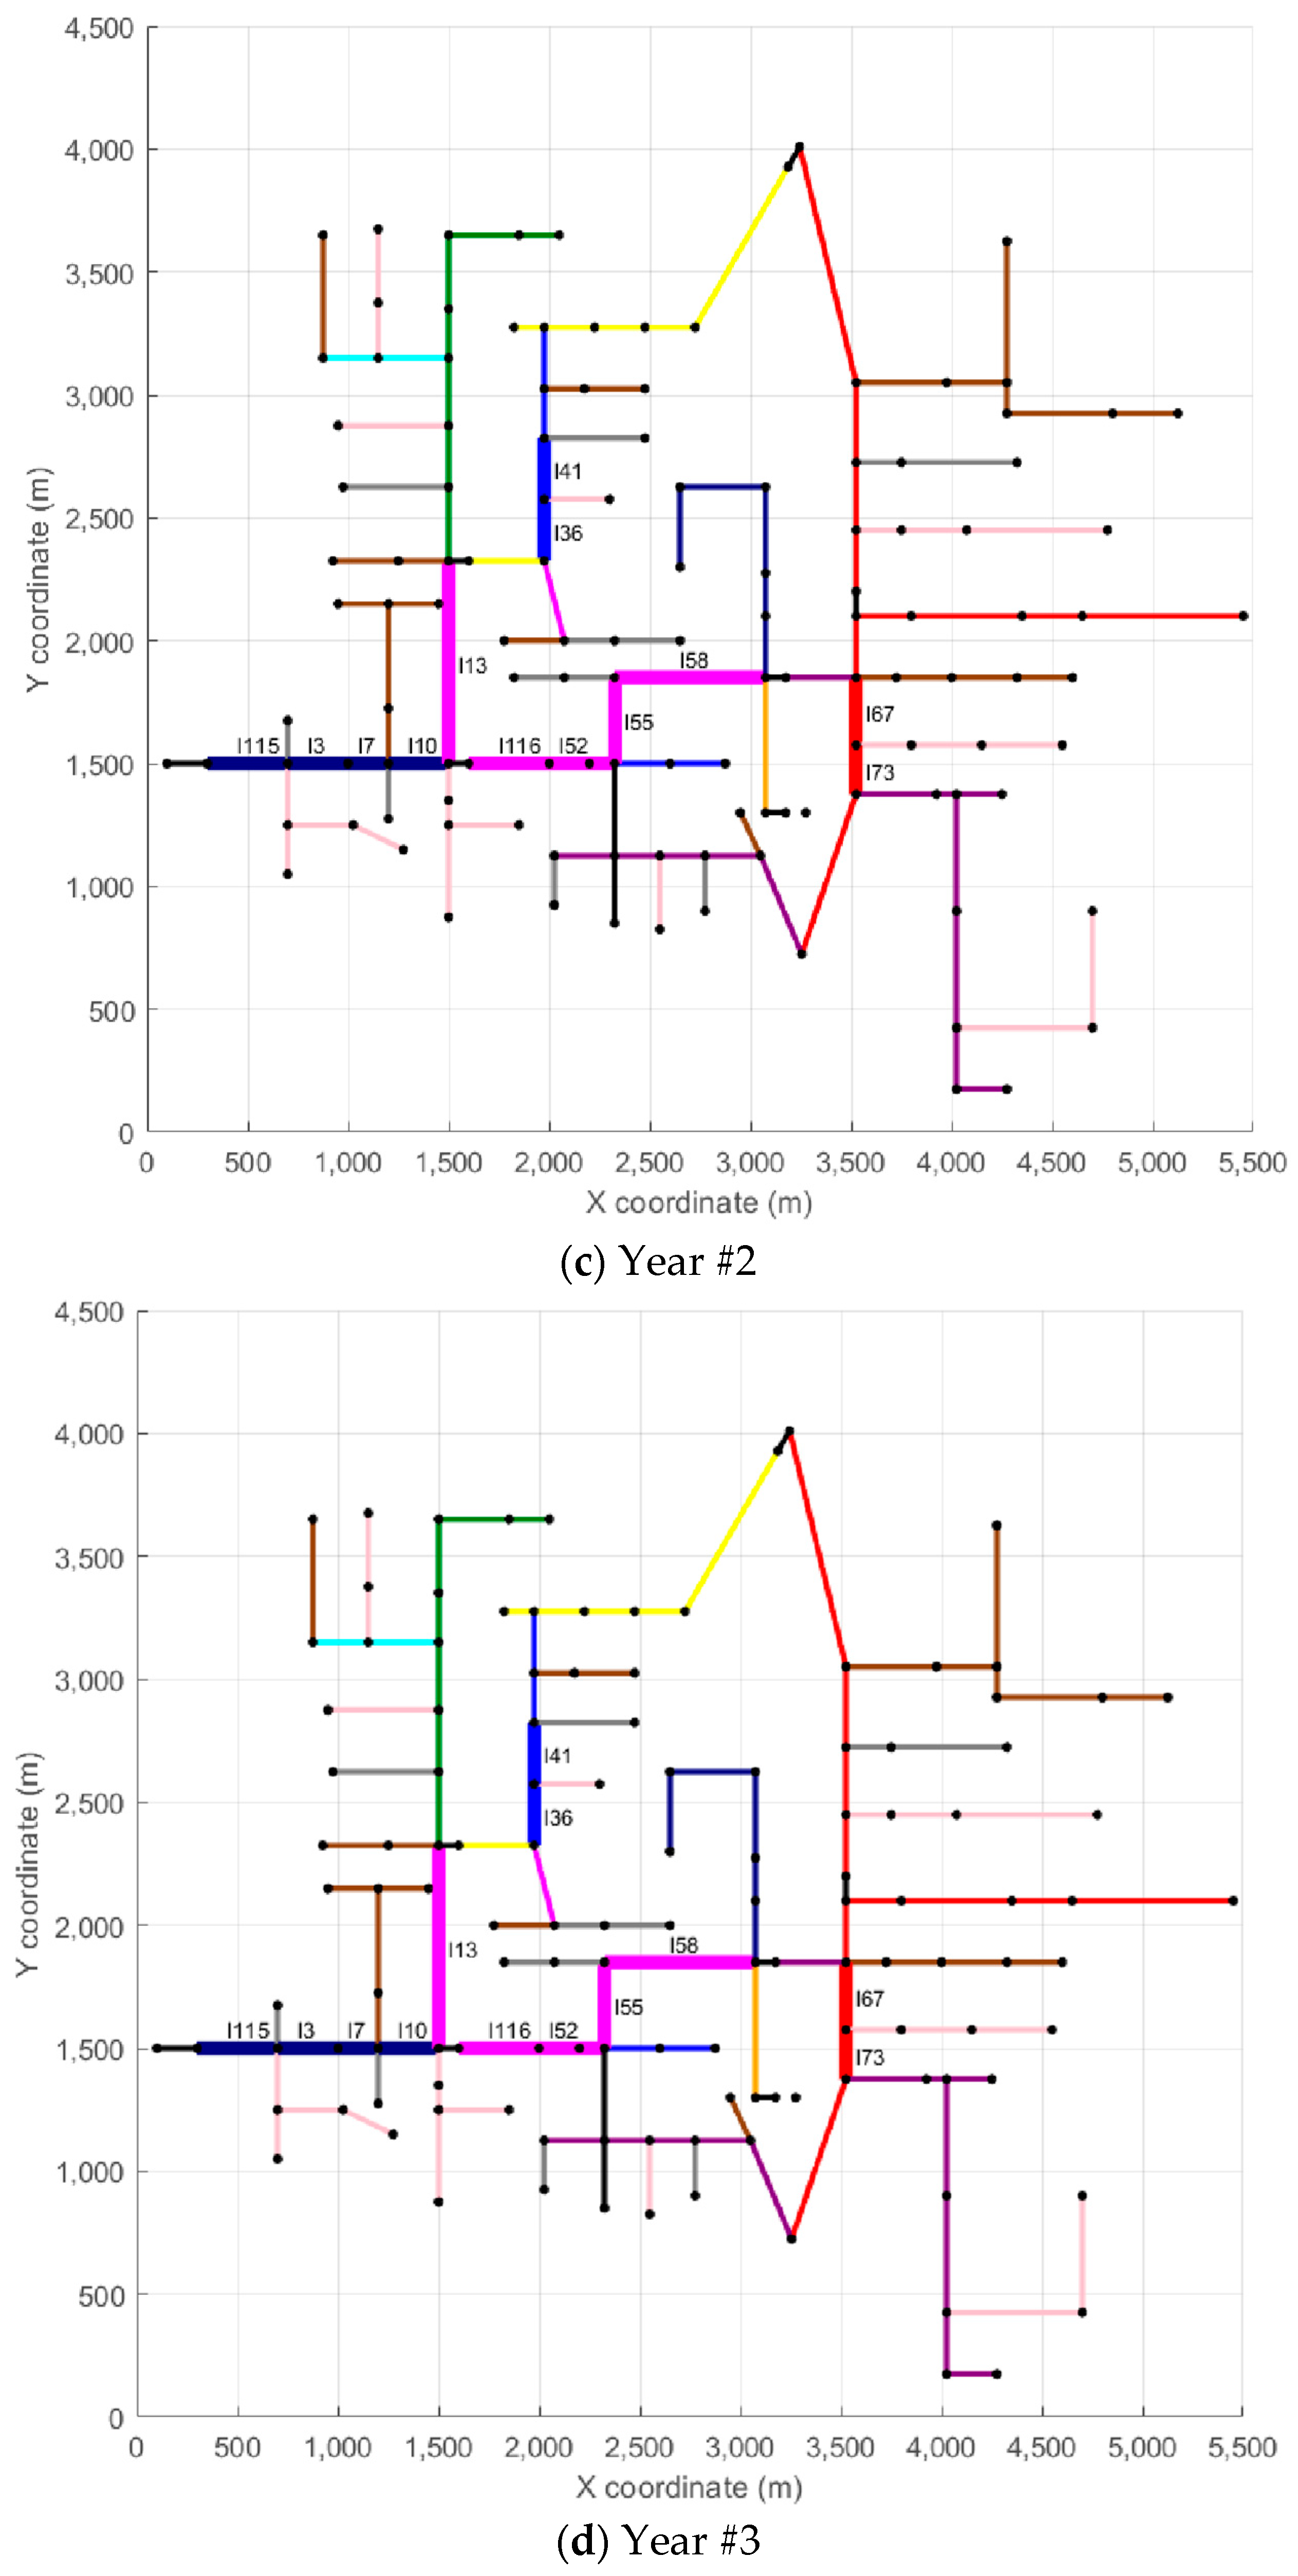
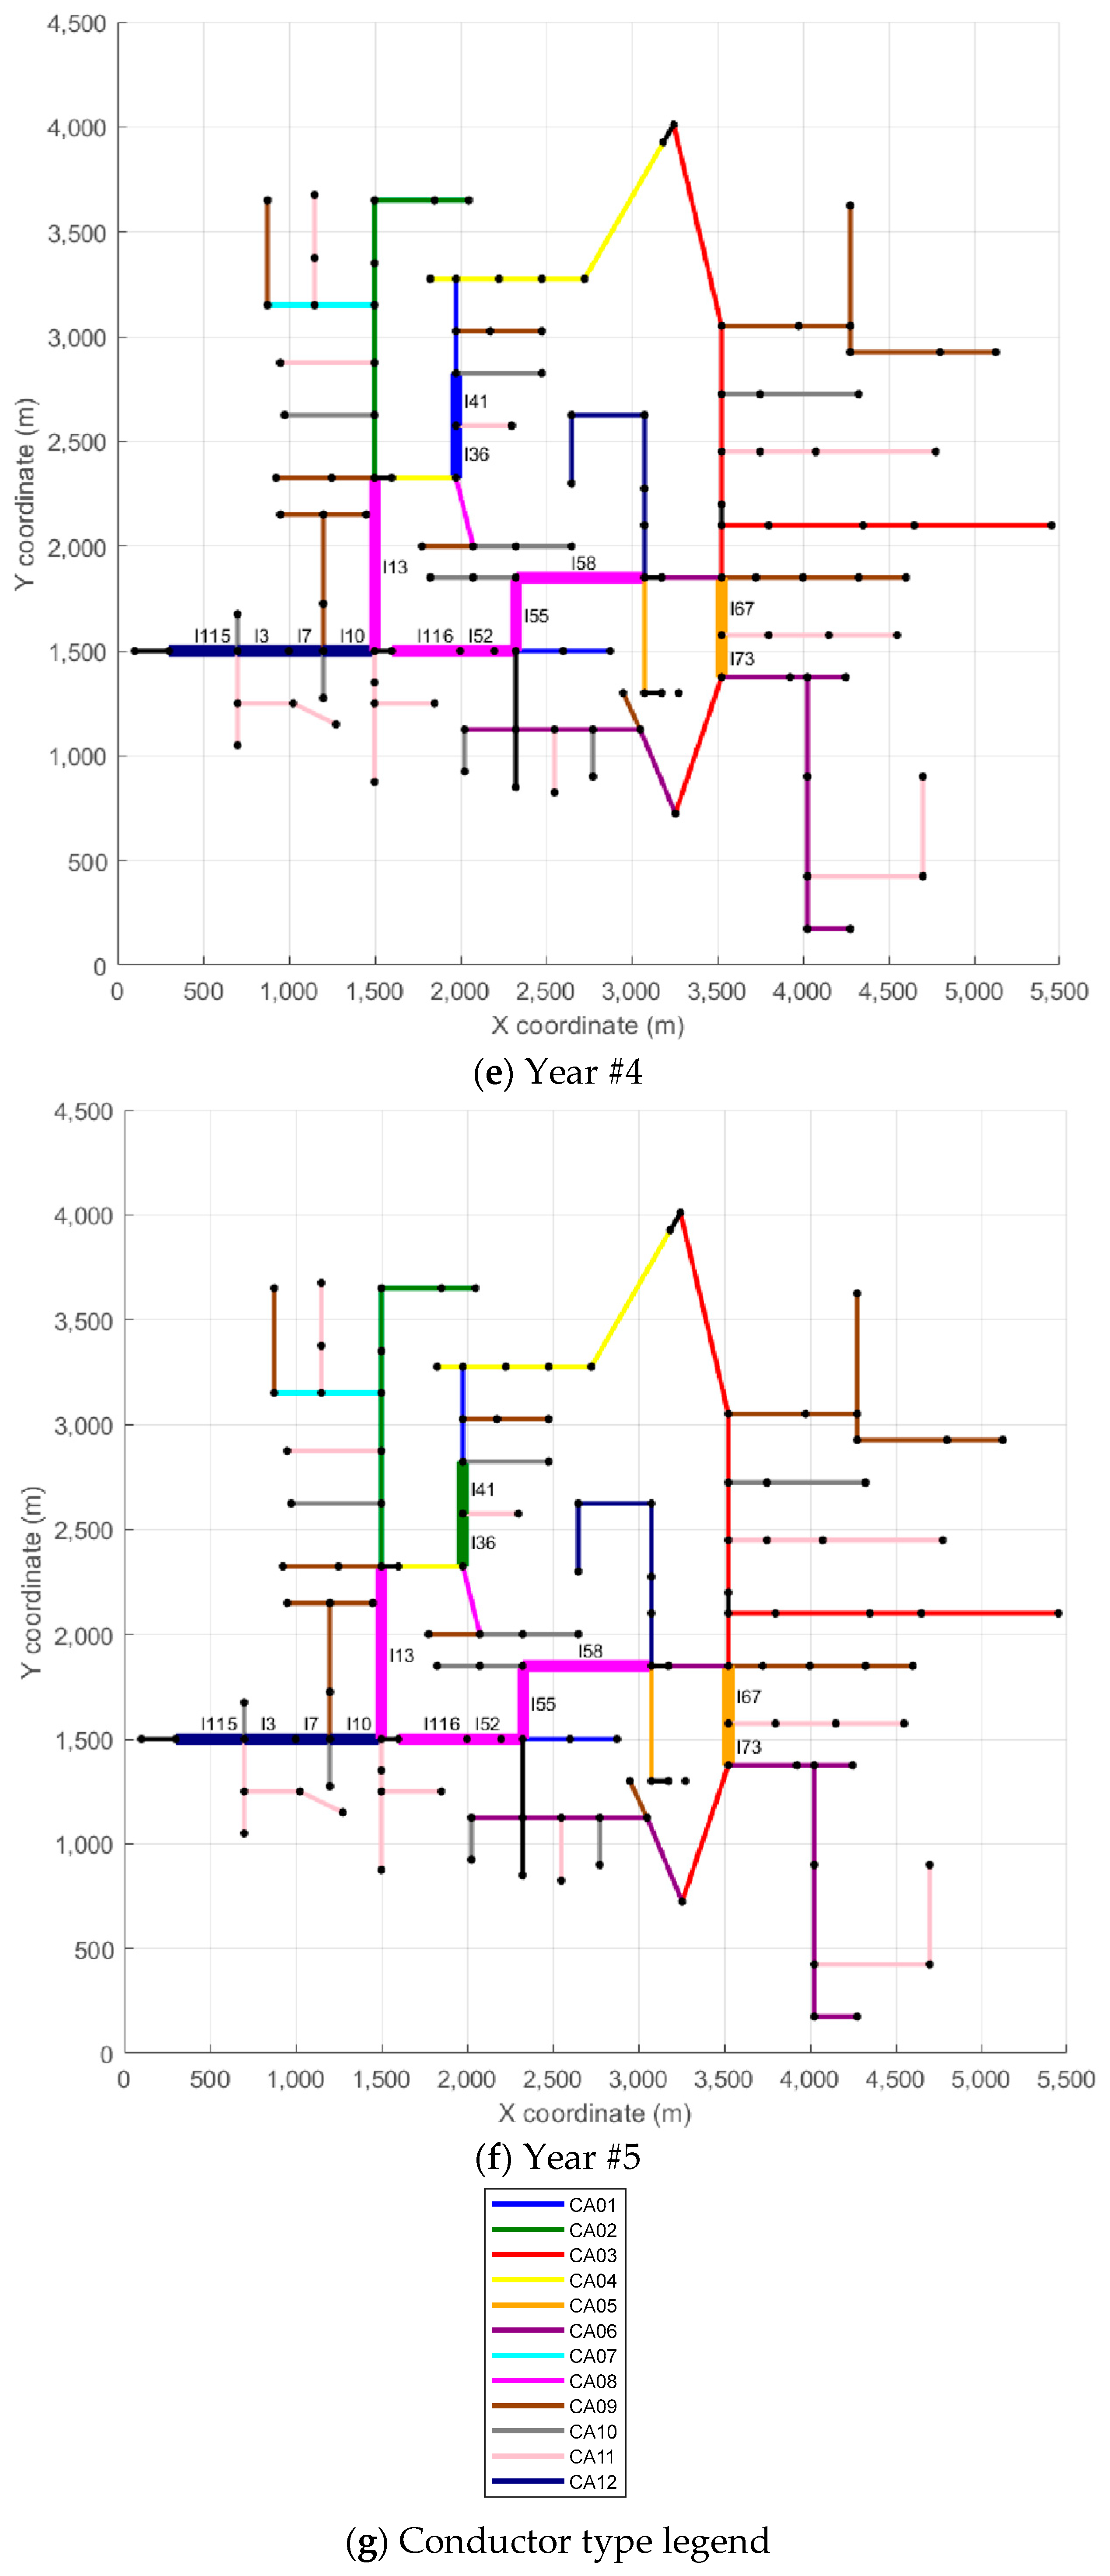
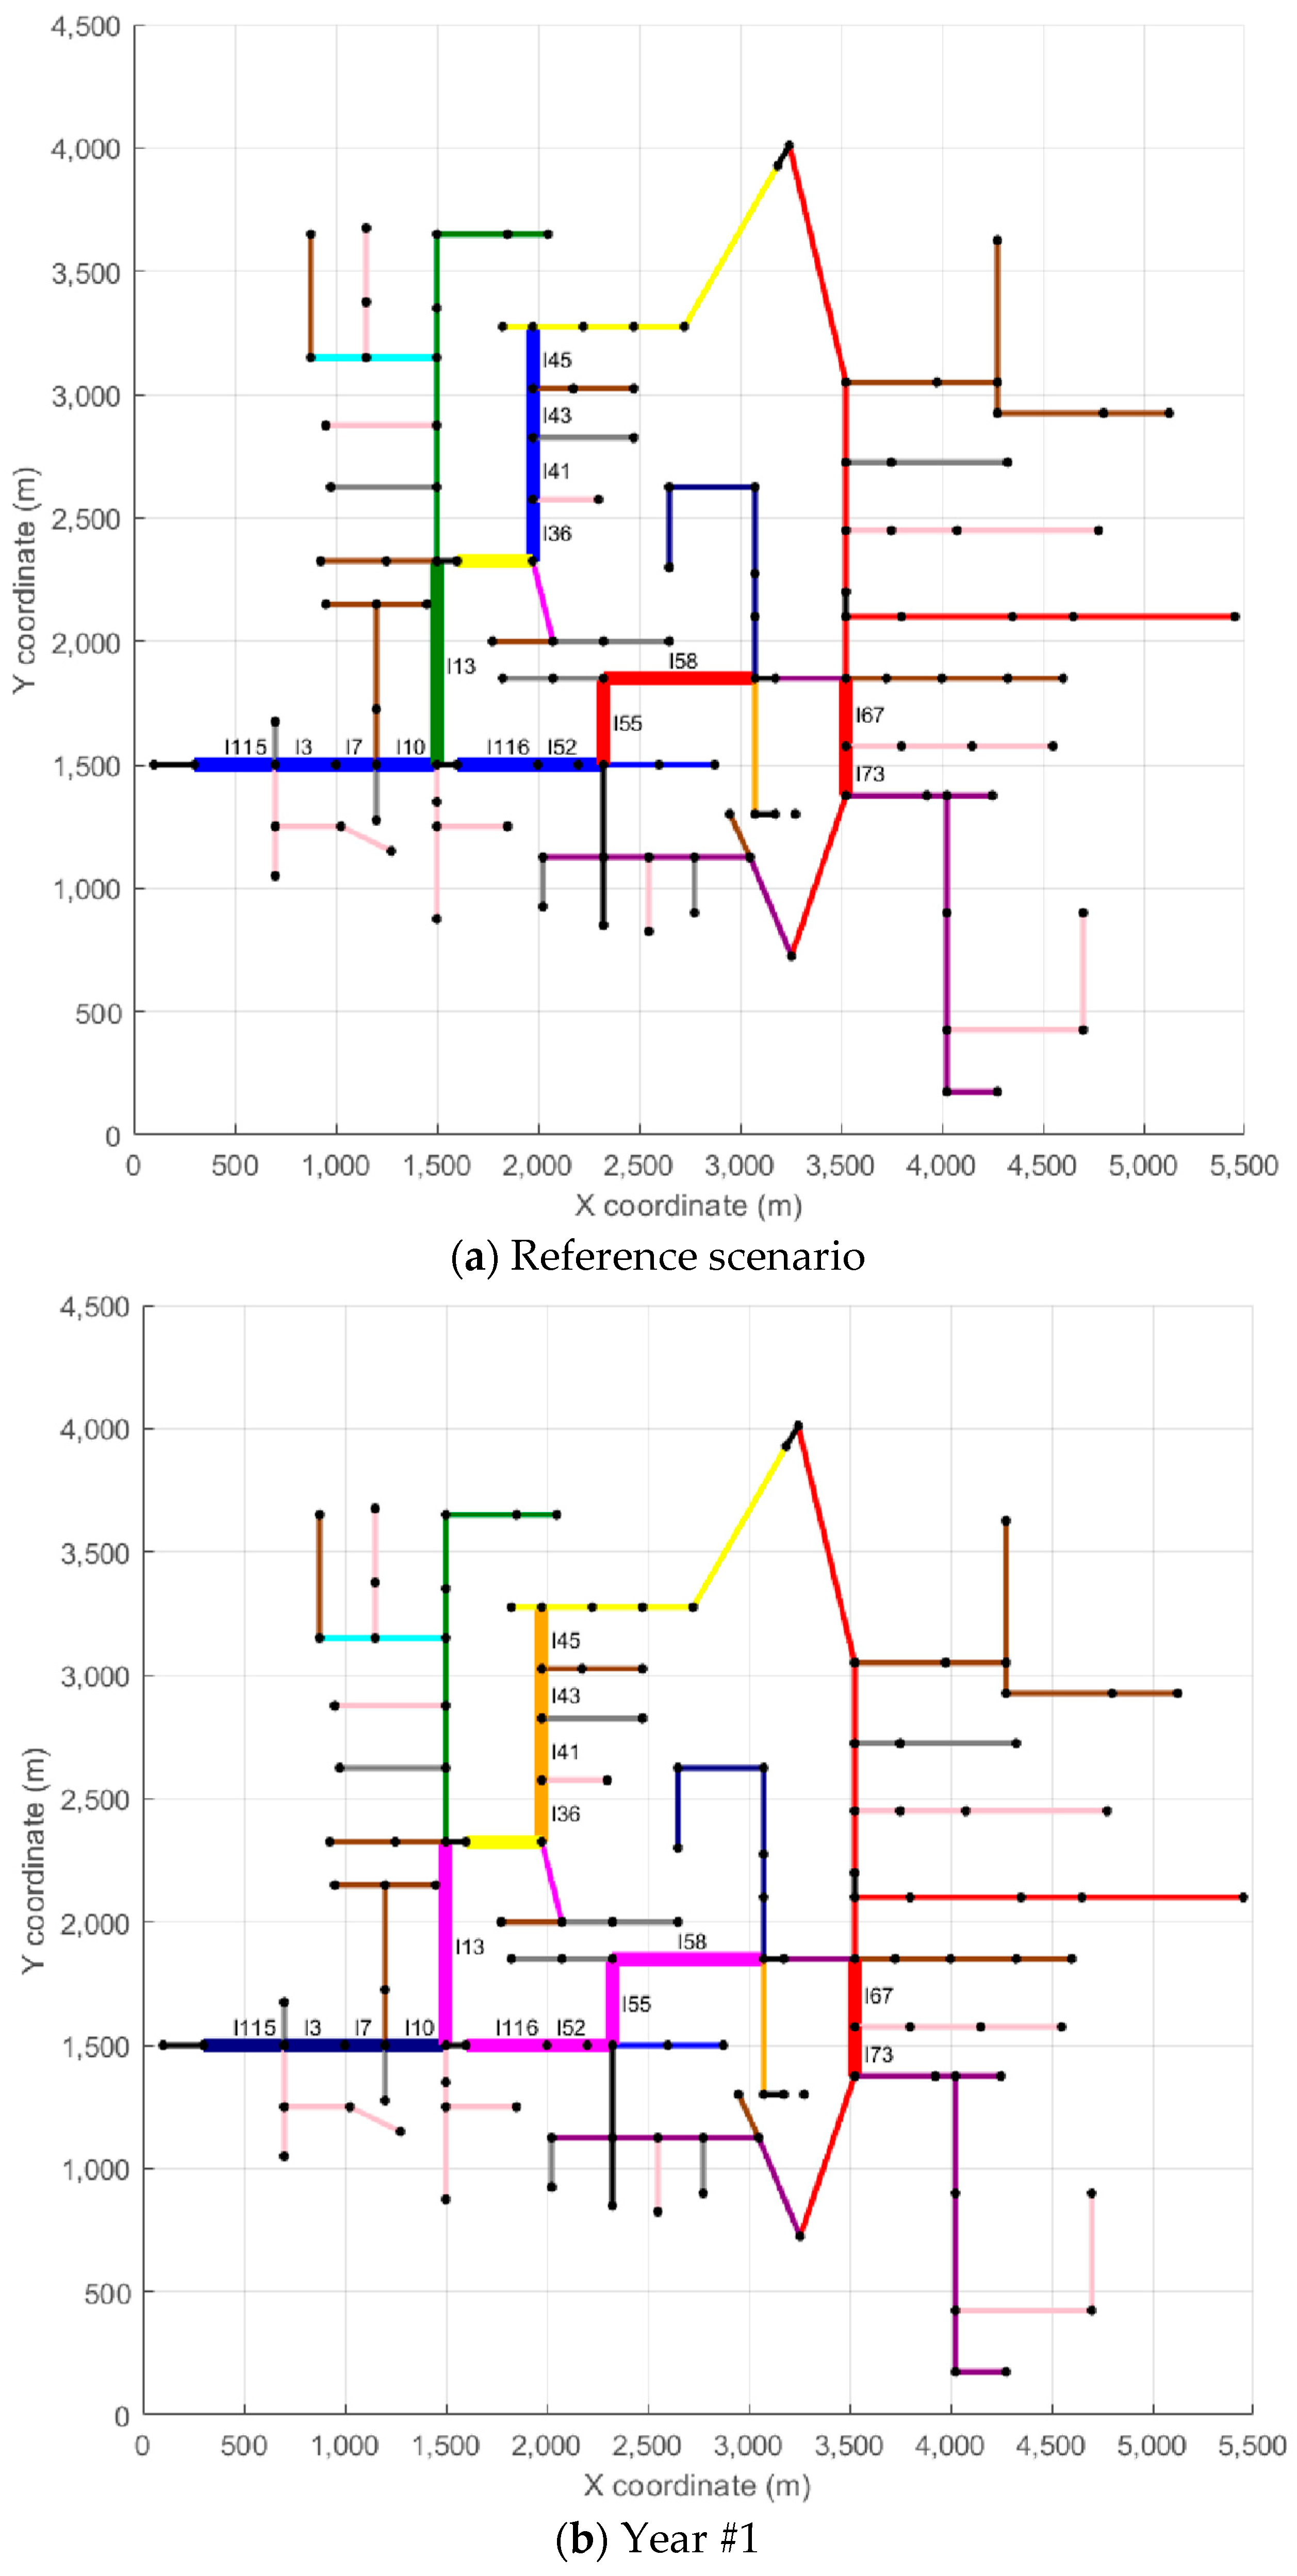
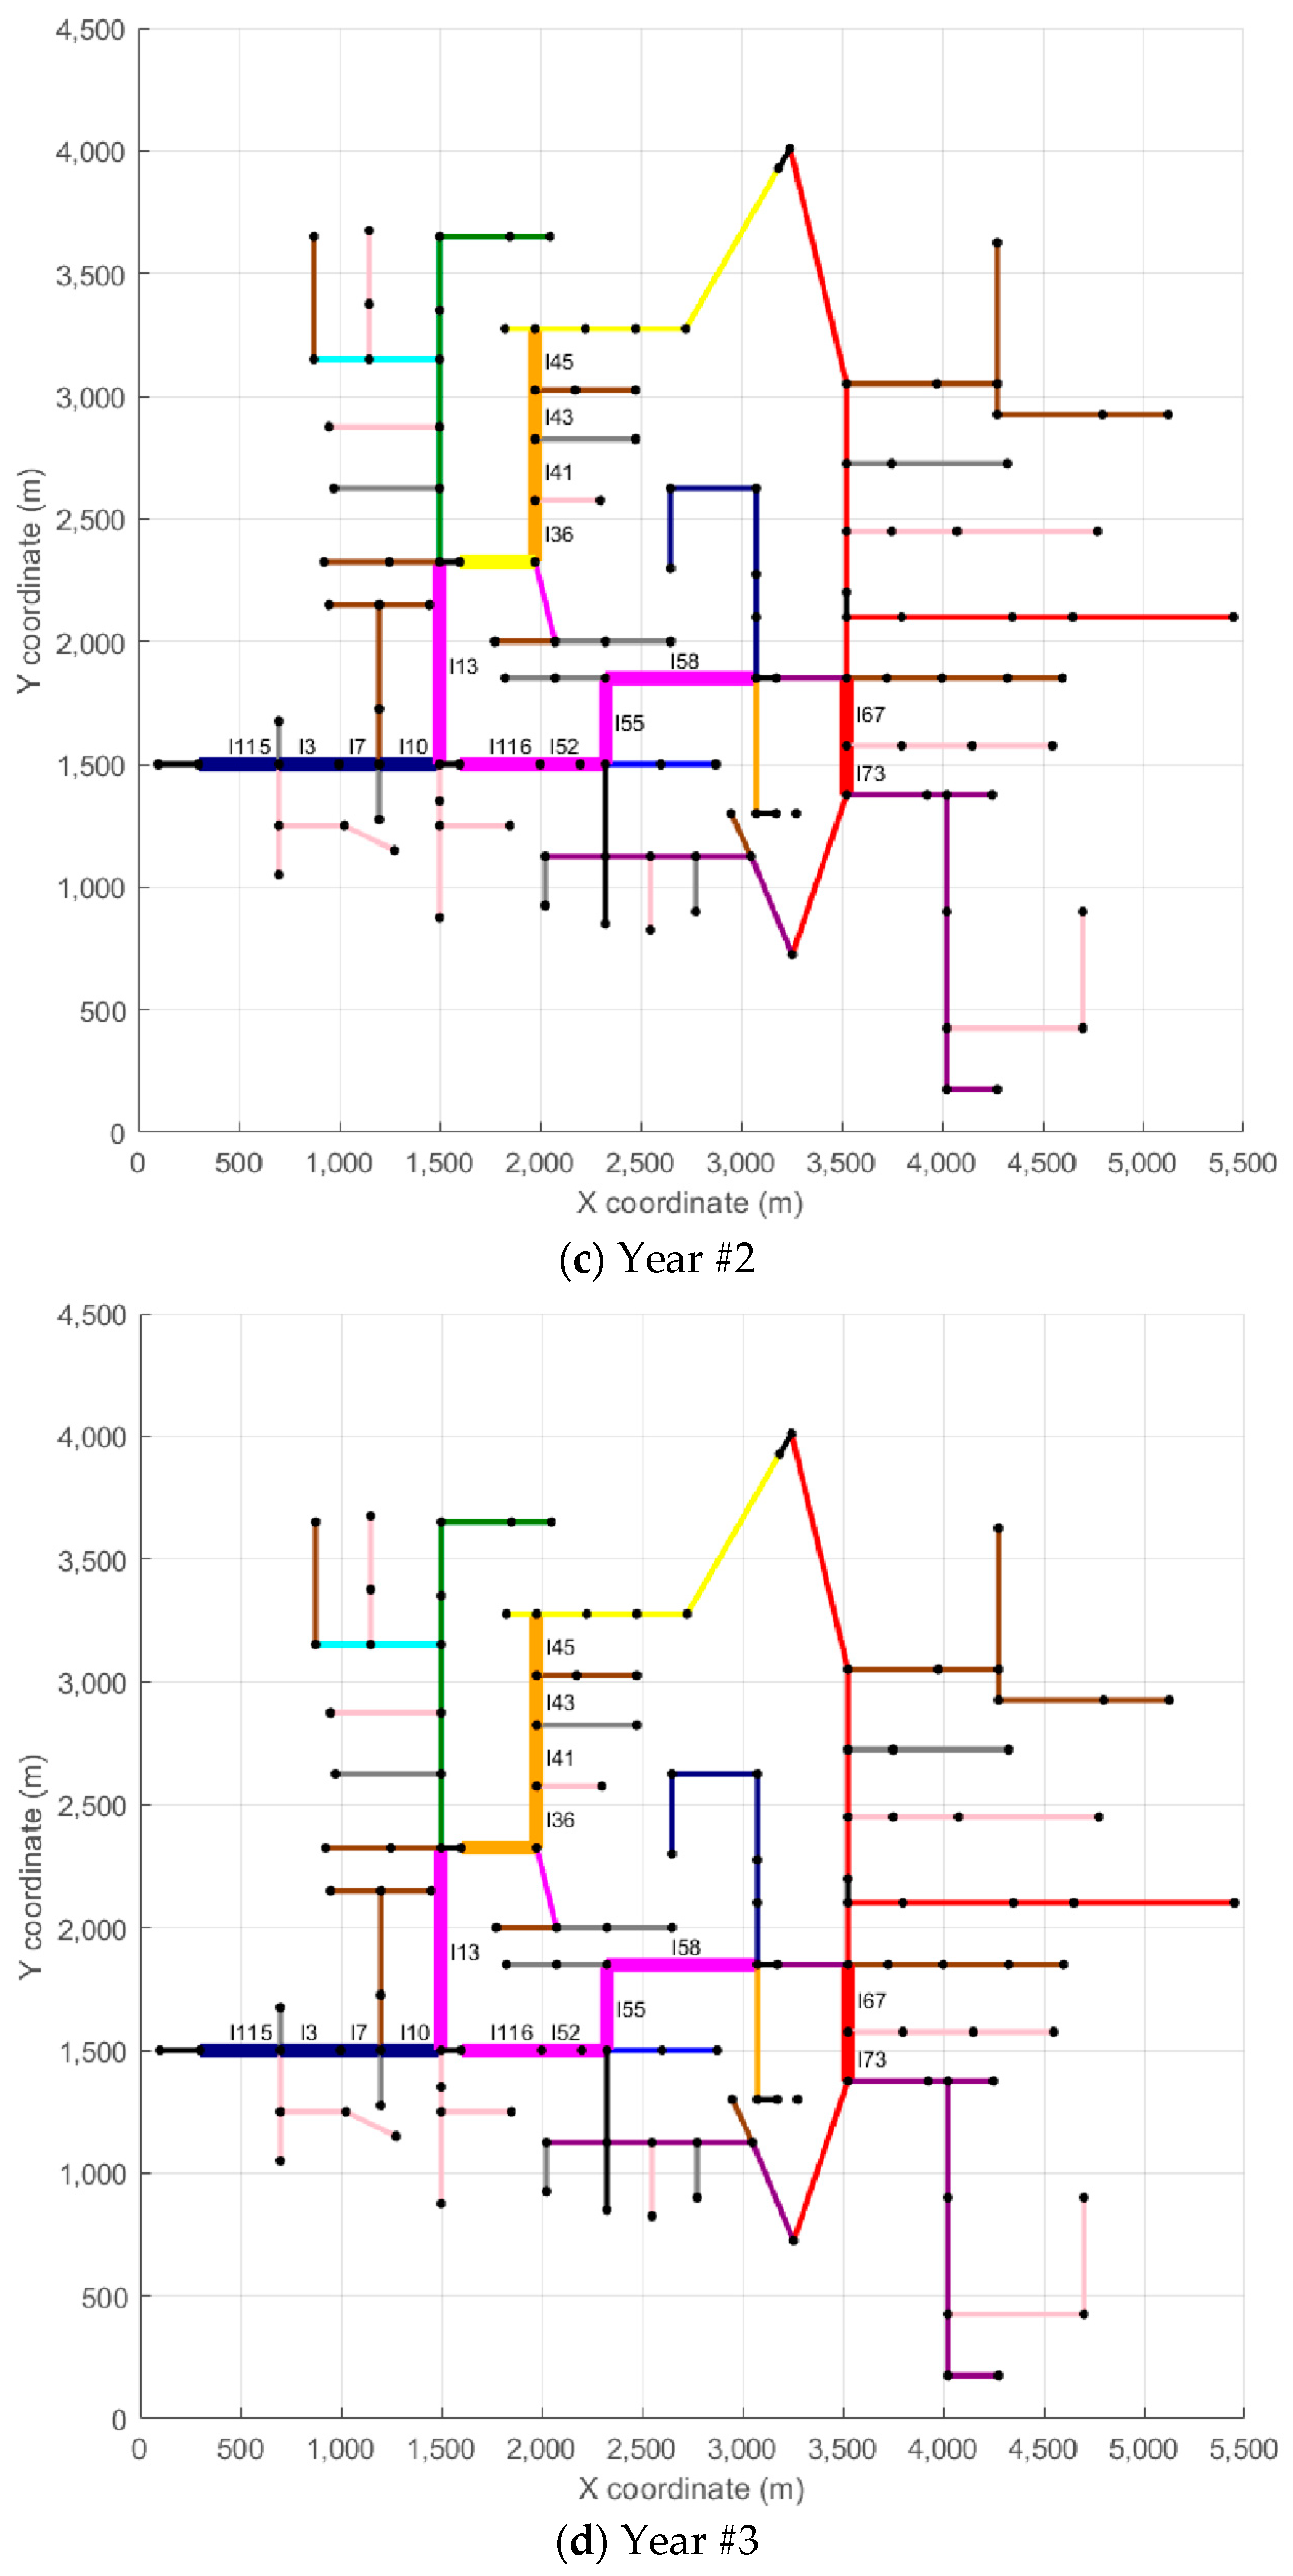
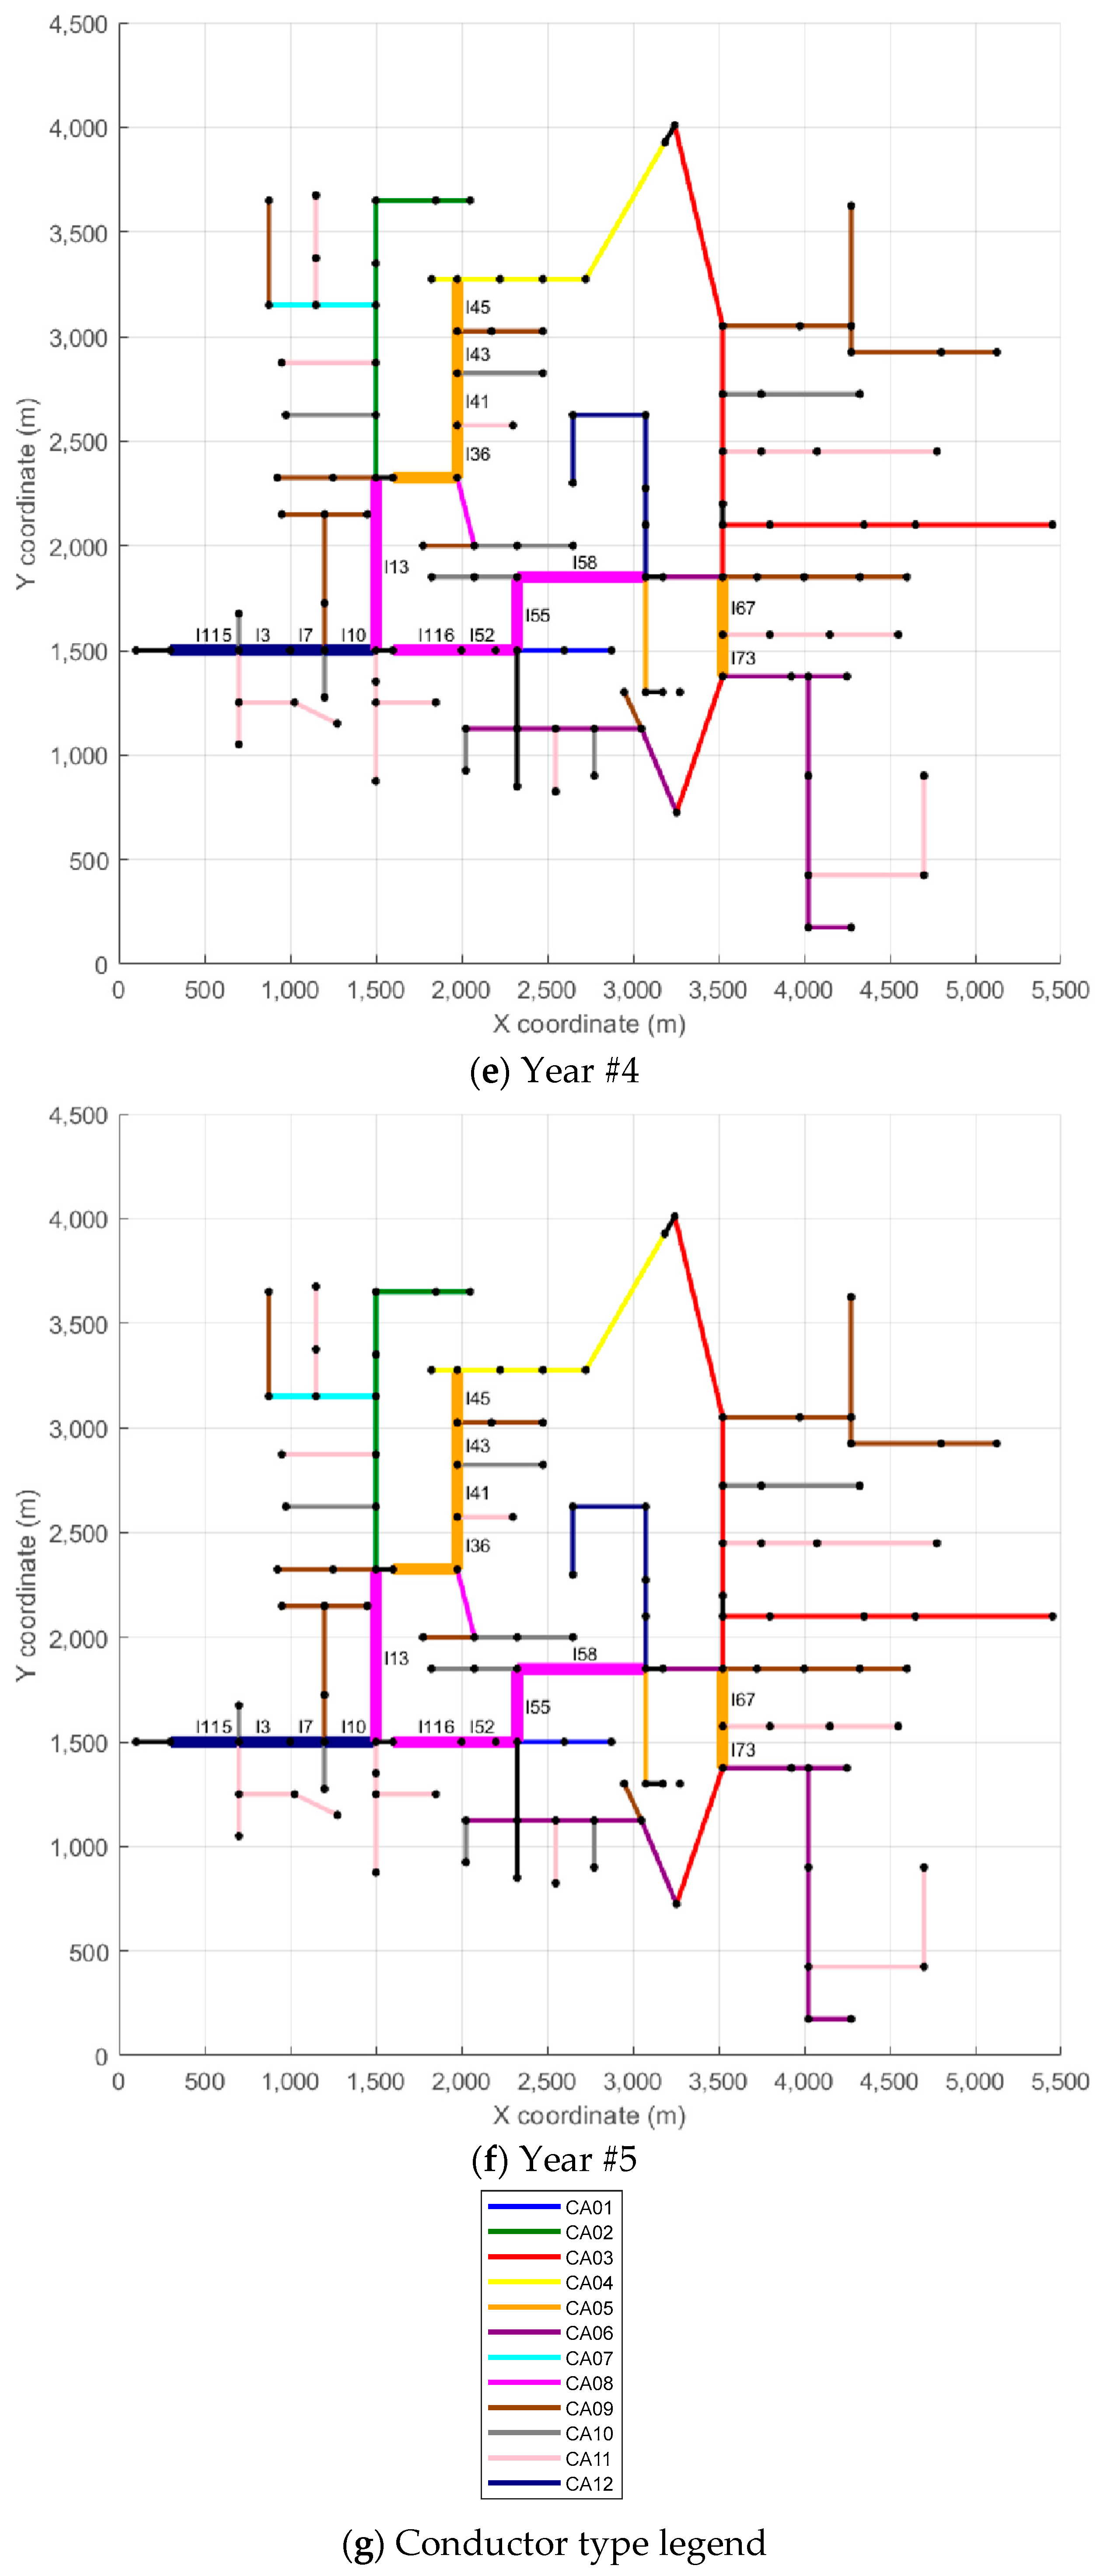
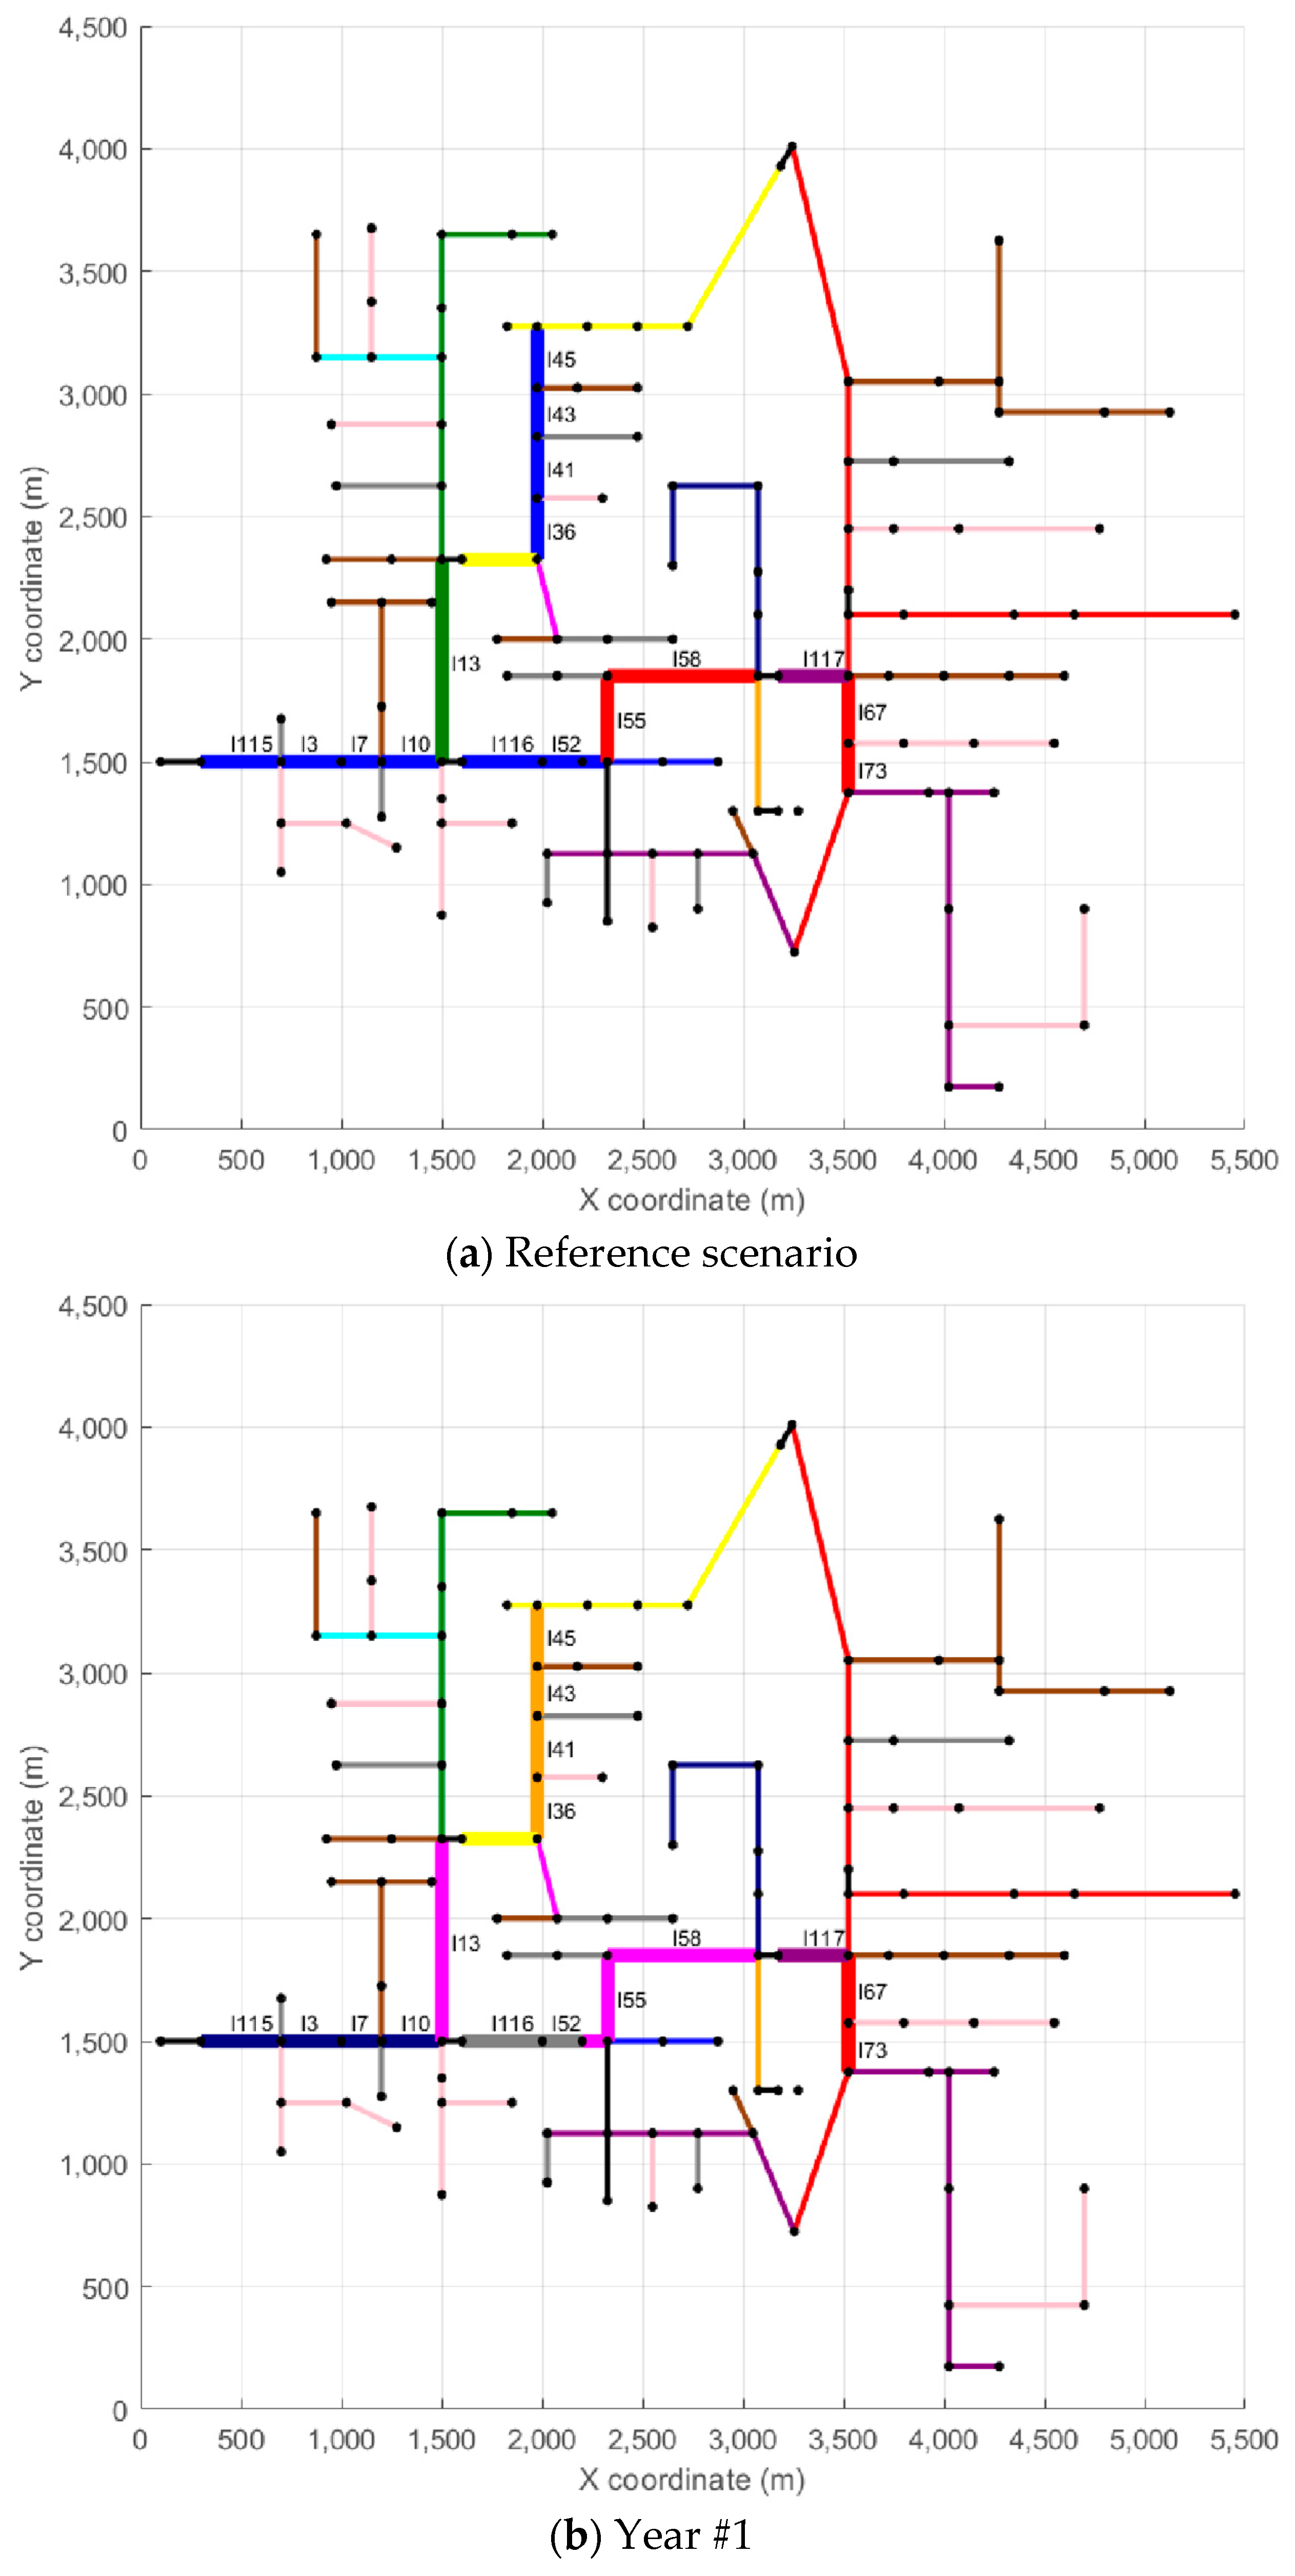
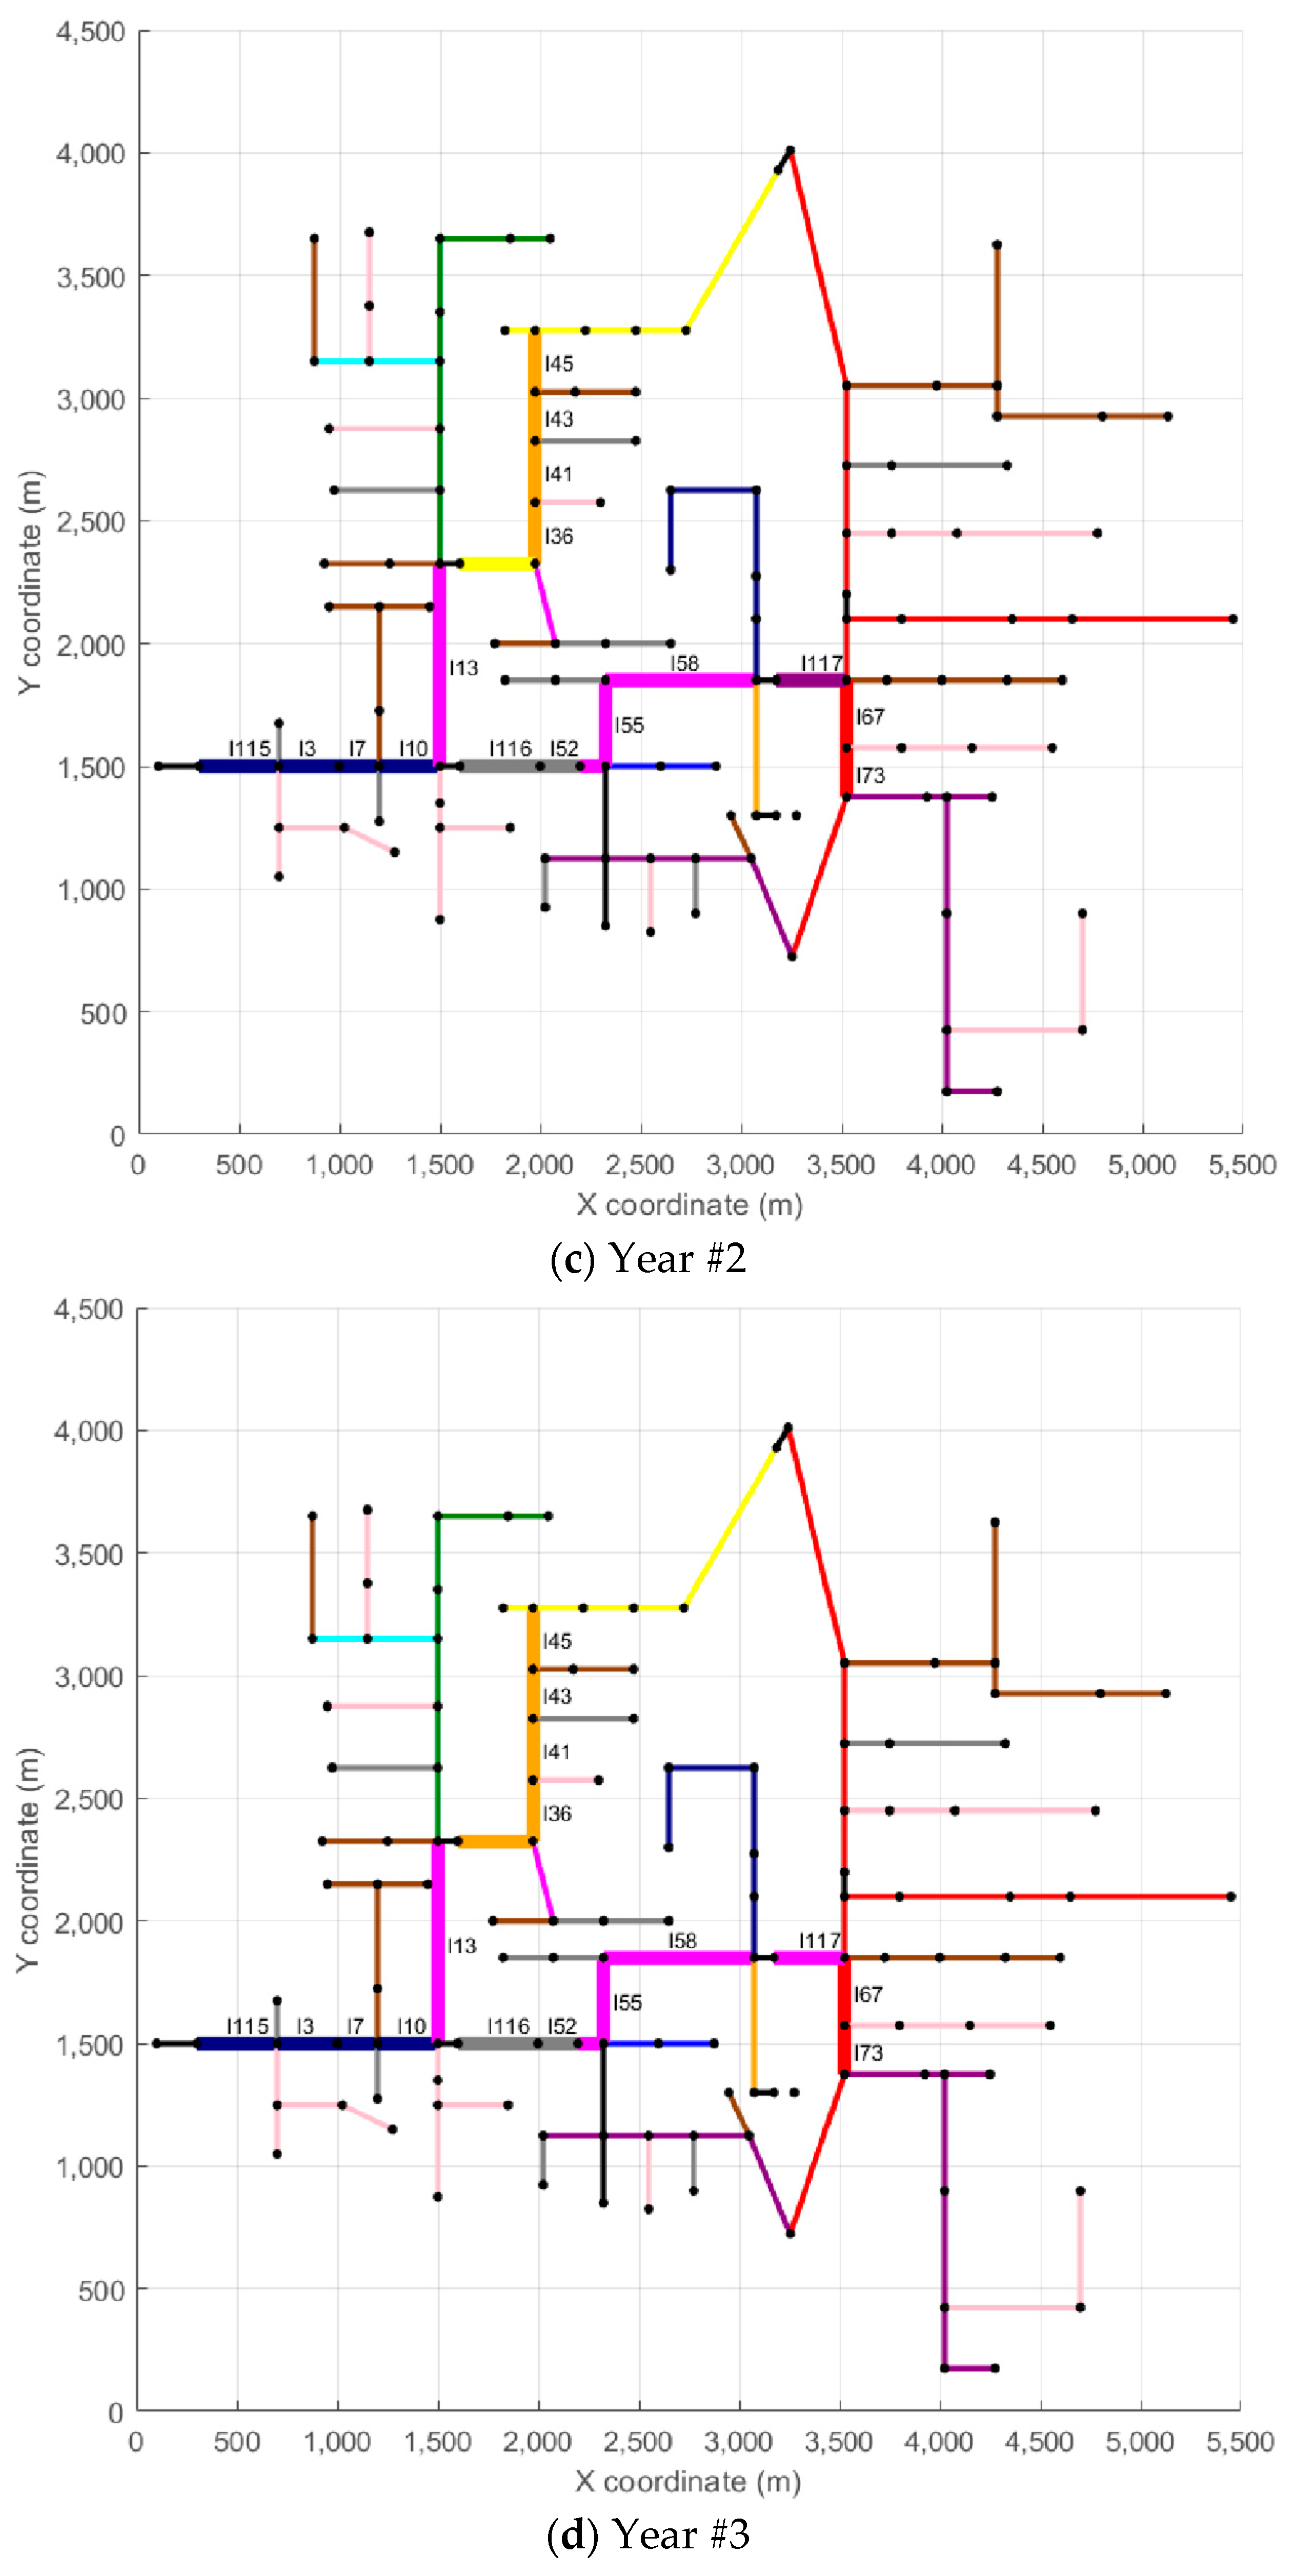
The second part of the analysis focuses on three representative scenarios selected from the full set of 125 simulations: Scenario #1, which resulted in the lowest total investment; Scenario #96, which represents an intermediate investment level; and Scenario #125, which presented the highest. Displaying all scenarios would be impractical, so these three cases serve to illustrate contrasting network behaviors under low, medium, and high investment conditions. Figure 5, Figure 6 and Figure 7 depict the evolution of each scenario across the five-year planning horizon. Each figure contains six subplots: the first represents the base case with no conductor replacements, while the remaining five correspond to each year of the analysis.
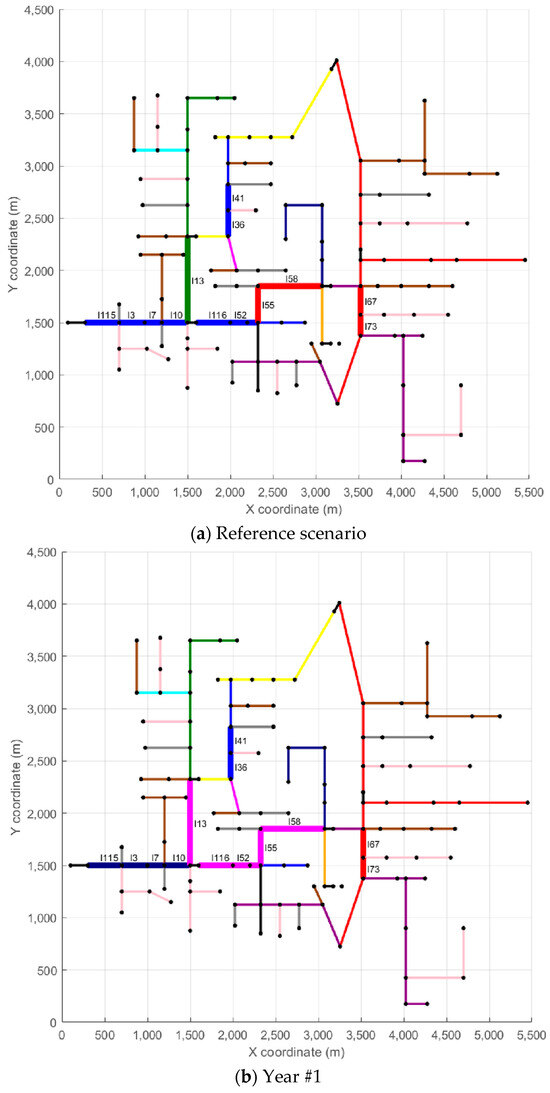
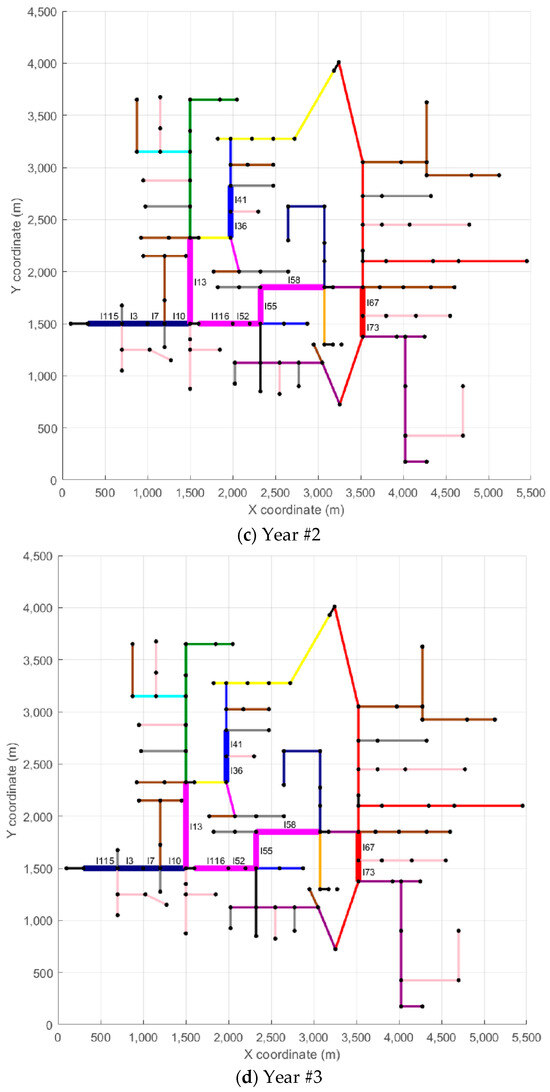
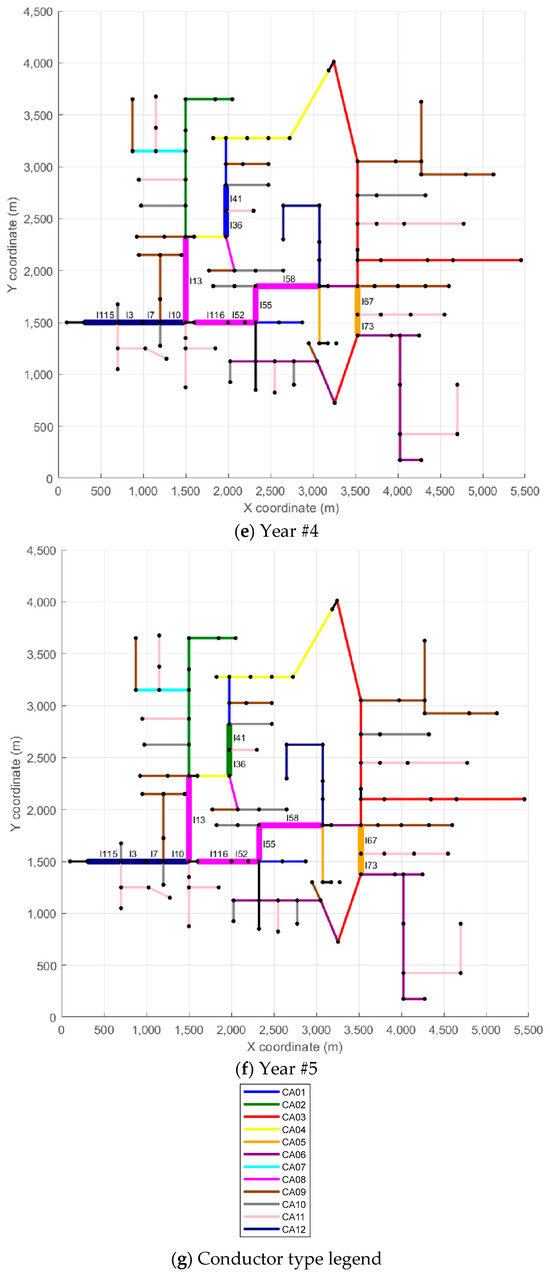
Figure 5.
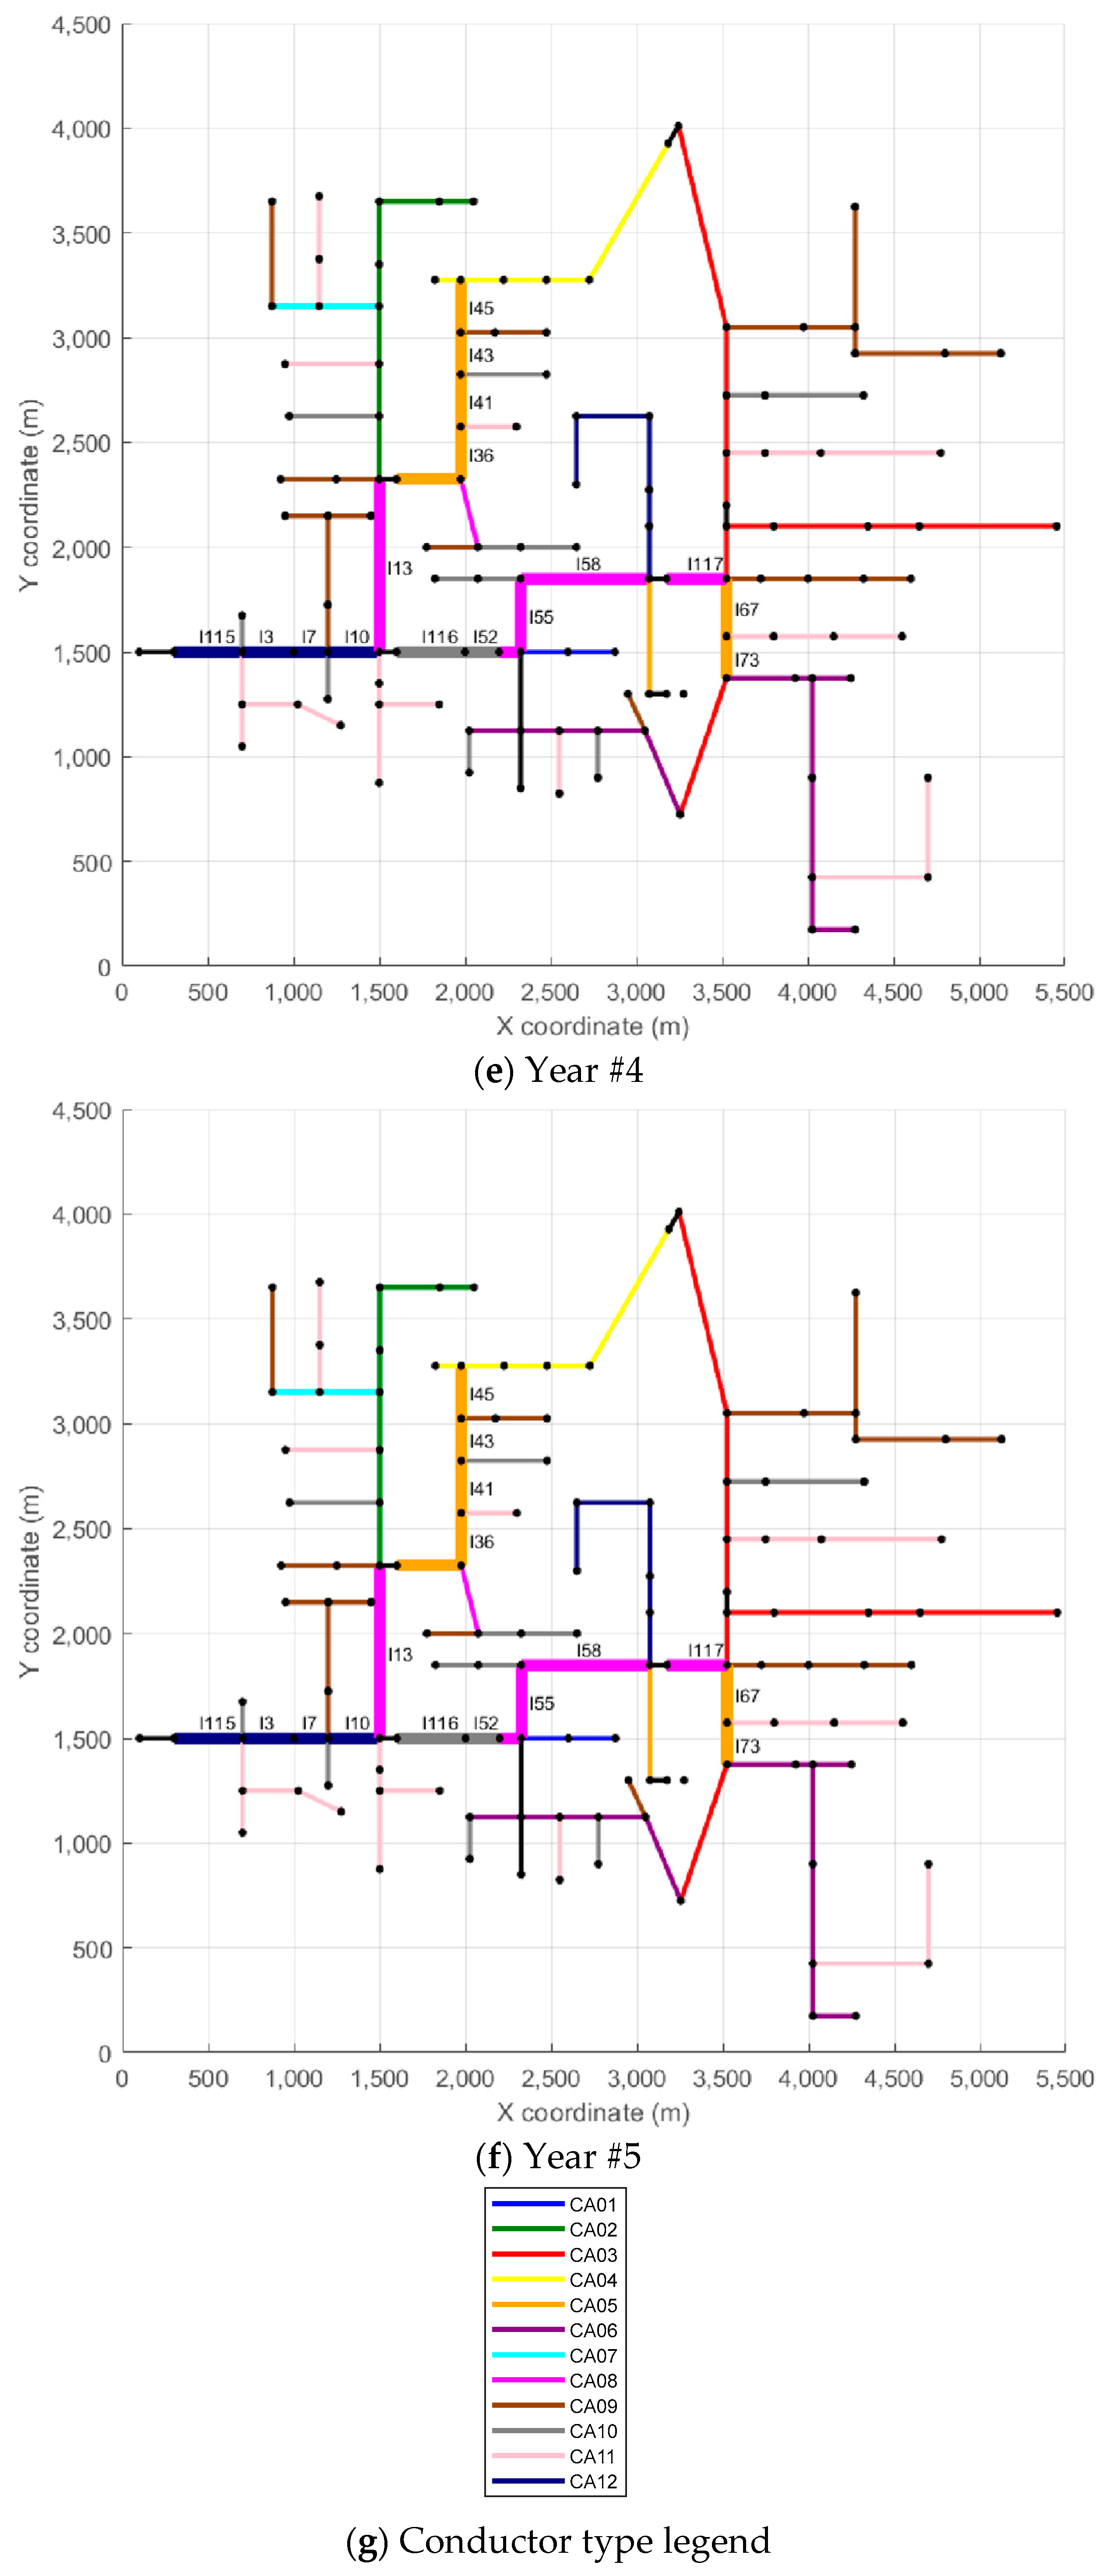
Yearly reconductoring configuration for Scenario #1: (a) reference scenario, (b) Year 1, (c) Year 2, (d) Year 3, (e) Year 4, (f) Year 5, and (g) color legend for conductor types.
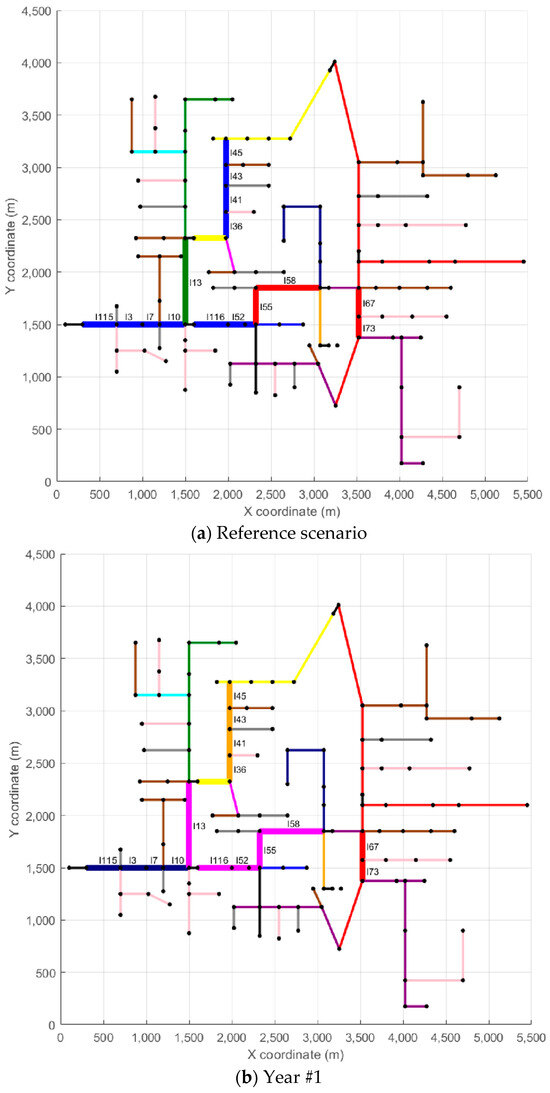
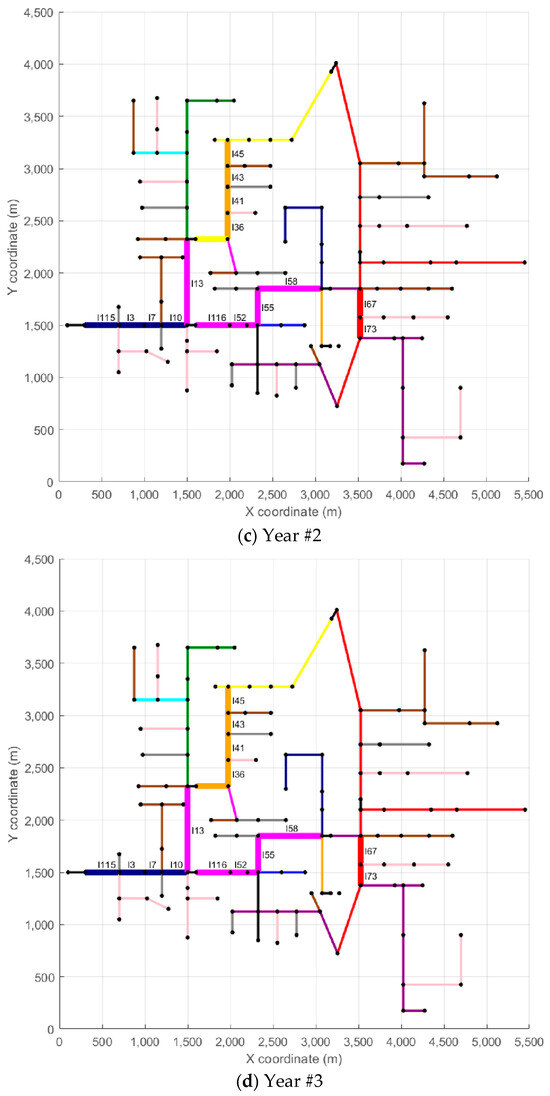
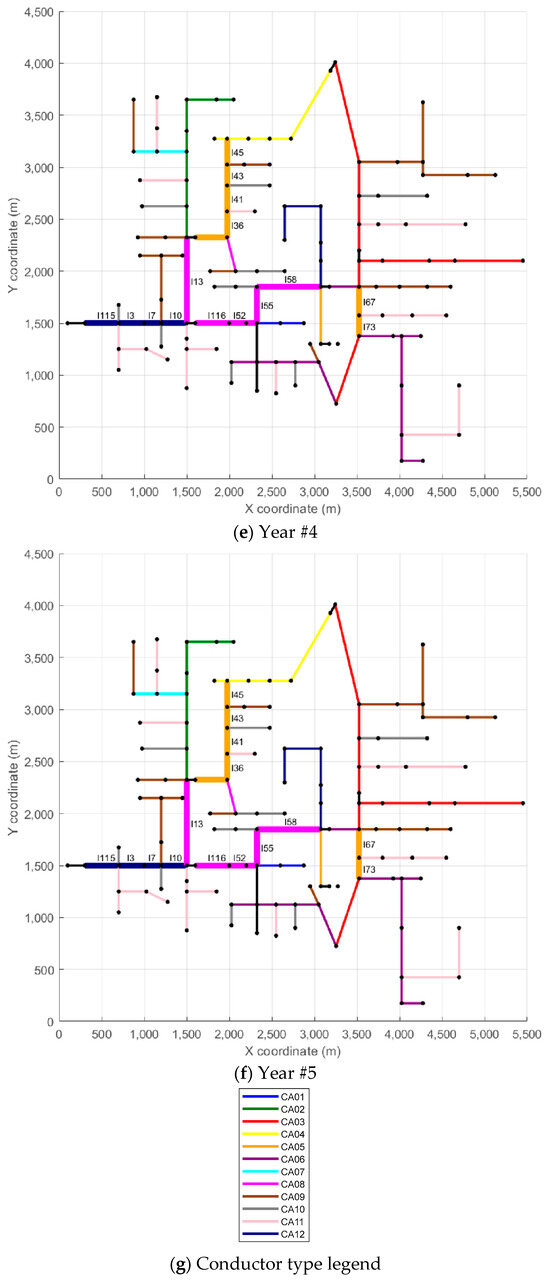
Figure 6.
Yearly reconductoring configuration for Scenario #96: (a) reference scenario, (b) Year 1, (c) Year 2, (d) Year 3, (e) Year 4, (f) Year 5, and (g) color legend for conductor types.
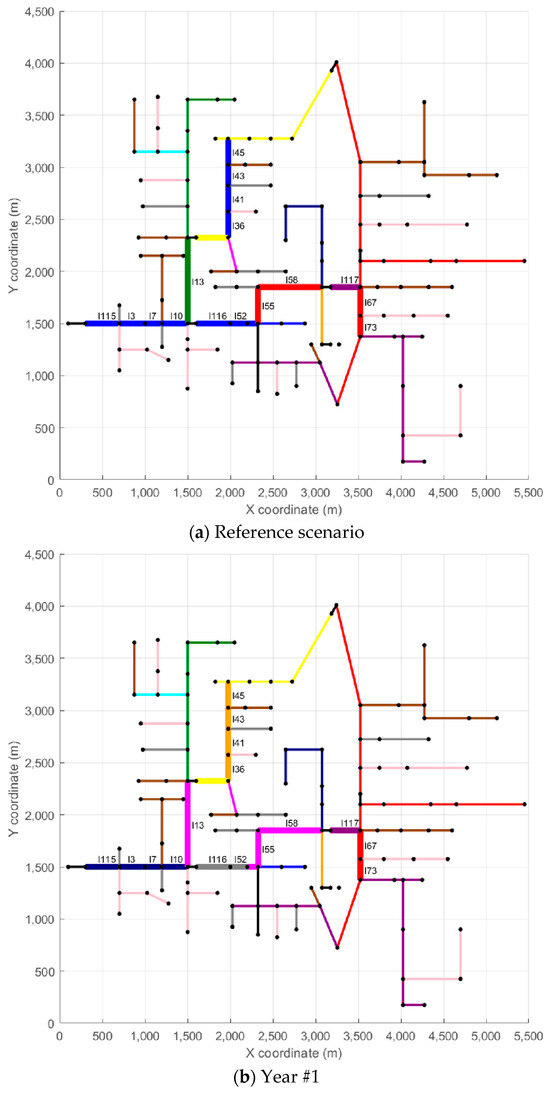
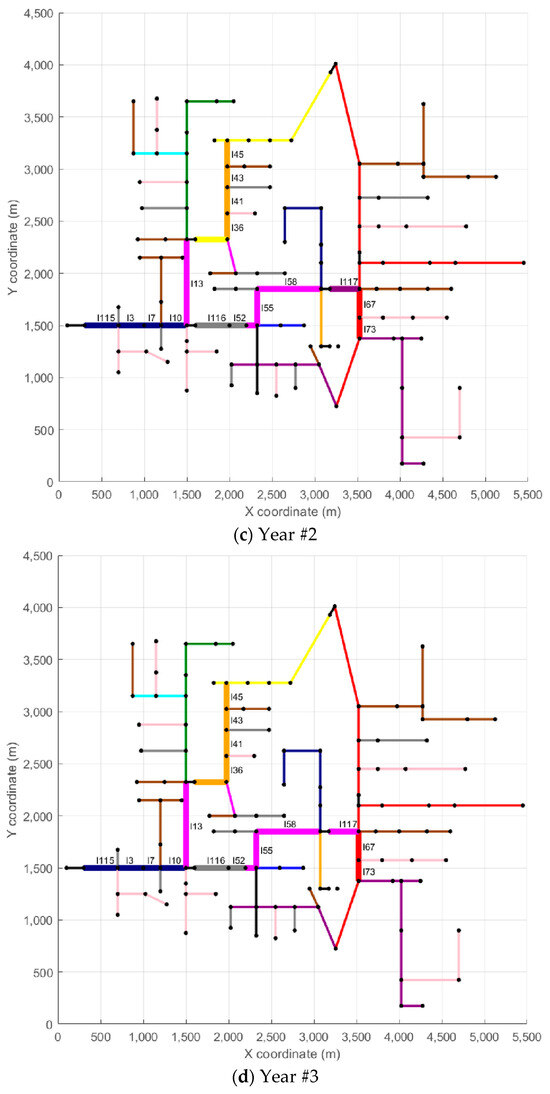
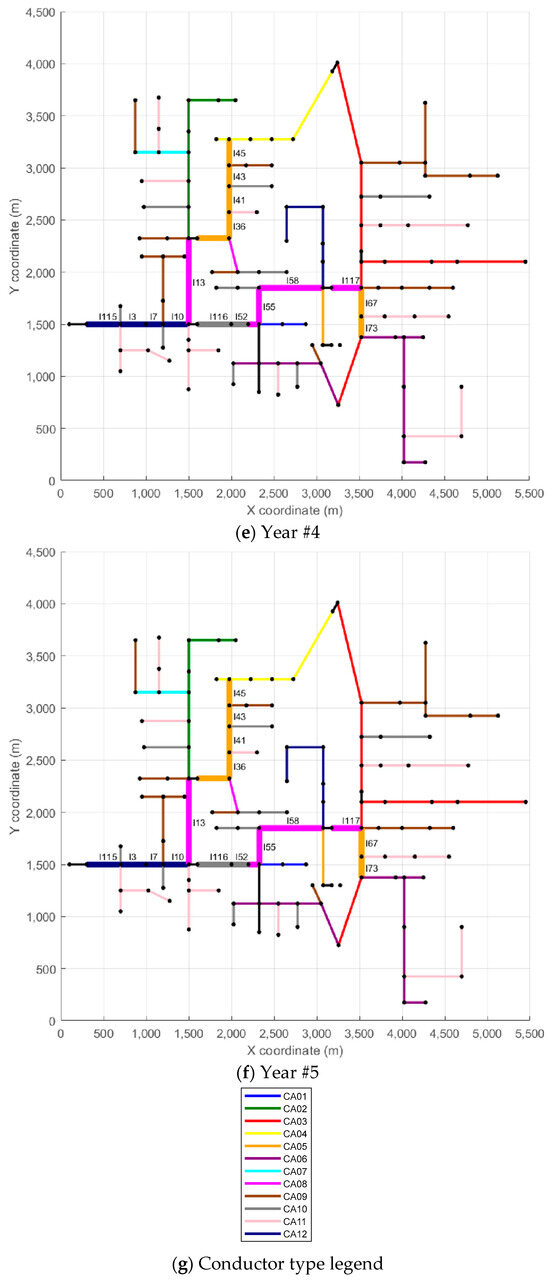
Figure 7.
Yearly reconductoring configuration for Scenario #125: (a) reference scenario, (b) Year 1, (c) Year 2, (d) Year 3, (e) Year 4, (f) Year 5, and (g) color legend for conductor types.
In Figure 5, Figure 6 and Figure 7, each branch is color-coded according to the type of conductor in use, as indicated in the legend. To improve clarity, branches that underwent reconductoring in at least one year appear with thicker lines and display their IDs to facilitate identification. For example, in Scenario #1, line l115 appears in light blue in the Reference Scenario (conductor CA01), while in Year #1, the same line shows in dark blue (conductor CA12), indicating the reconductoring action—in this case, replacing conductor CA01 in the Reference Scenario with conductor CA12 in Year #1. In the remaining years of the analysis horizon (Years #2 to #5), line l115 stays unchanged. Another example, also from Scenario #1, is line l67, which appears in red in the Reference Scenario and in Years #1 to #3 (conductor CA03). In Year #4, line l67 appears in orange (conductor CA05), indicating a reconductoring action from conductor CA03 to conductor CA05. Line l67 remains unchanged in Year #5. A similar analysis can be carried out for the other lines and scenarios.
To provide more detailed insight into the reconductoring actions, each scenario also includes a table that summarizes the reconductoring measures implemented. These tables provide details on the affected branches, the year of intervention, the length of each modified section, and the corresponding investment cost. The reconductoring actions carried out in Scenario #1 are presented in Table 2, those related to Scenario #96 are shown in Table 3, and those for Scenario #125 are included in Table 4. Returning to the examples of lines l115 and l67, both from Scenario #1, Table 2 indicates that line l115 measures 121.92 m and has a reconductoring cost of USD 9437 (Year #1), while line l67 has a length of 83.82 m with a reconductoring cost of USD 1068 (Year #4).

Table 2.
Details of reconductoring interventions in Scenario #1.

Table 3.
Details of reconductoring interventions in Scenario #96.

Table 4.
Details of reconductoring interventions in Scenario #125.
This combined visual and tabular analysis enhances the understanding of how load uncertainty influences reconductoring needs over time. The results also emphasize the impact of different investment strategies on network performance, offering valuable guidance for long-term planning and asset management in electricity distribution systems.
Scenario #1 presents the lowest investment value, with total reconductoring costs of USD 55,108, while Scenario #125 shows the highest investment value at USD 66,504. In parallel, the total length of reconductored lines increased from 1470.66 m to 1828.80 m. Scenario #96, representing an intermediate case, resulted in a total investment of USD 59,801 and a reconductoring length of 1722.12 m.
In addition to these overall increases, the analysis revealed distinct behavioral patterns in reconductoring decisions across scenarios:
- (i).
- Some reconductoring actions remained unchanged even with variations in the net load between the boundary scenarios (#1 and #125). This indicates that, regardless of the load scenario considered, these reconductoring measures continue to be necessary in the same year of intervention. For instance, line l115 was consistently scheduled for reconductoring in Year #1, replacing conductor CA01 with CA12, and this configuration was fully maintained. This behavior was observed in all three scenarios (#1, #96, and #125).
- (ii).
- Certain segments experienced an anticipated reconductoring schedule. This indicates that the reconductoring action remains necessary and may be brought forward if required, highlighting the possibility of anticipating financial resources in the distributor’s cash flow. For example, line l36 was initially scheduled for Year #5 in Scenario #1 but was moved to Year #1 in both Scenarios #96 and #125.
- (iii).
- The choice of conductor for reconductoring was modified in some cases. In Scenario #1, line l36 was planned to be upgraded from CA01 to CA02, whereas in Scenarios #96 and #125, it was upgraded from CA01 to CA05. In cases like this, a risk analysis should guide the selection of the conductor type. A more conservative approach may suggest using conductor CA05 from the outset, while a higher-risk, lower-initial-cost decision may opt for conductor CA02, accepting the possibility of requiring another reconductoring process in the future if the load increases further.
- (iv).
- New reconductoring proposals emerged. For instance, line l114 was not included in Scenario #1 but appeared in the plans for both Scenarios #96 and #125, scheduled for reconductoring in Year #3. In such cases, the risk of not executing the planned action implies that a new reconductoring process may need to be carried out within a short period if the load increases in the future.
Overall, the comparison between scenarios highlights how uncertainty-aware planning can lead to more flexible, efficient, and context-sensitive decisions in network reinforcement strategies. The minimum and maximum investment values define a relatively narrow range, which signals to decision-makers that reconductoring investments are necessary and that opting not to implement the proposed interventions may carry higher operational and reliability risks.
Regarding computational time, the execution time for all scenarios was three hours, which is considered low for medium- and long-term planning applications that do not involve real-time decision-making. The use of higher-performance computing resources, which are readily available within electricity distribution companies, could further reduce this execution time significantly.
4. Conclusions
This paper presents a multi-stage methodology for optimizing reconductoring investments in electricity distribution networks under load forecasting uncertainties. By combining a decomposition strategy with Monte Carlo simulation and exhaustive search techniques, the proposed approach supports the evaluation of multiple demand scenarios while maintaining computational feasibility and decision-making precision.
Simulation results using the IEEE 123-bus feeder show that reconductoring investments remain necessary even under varying load conditions, with total costs ranging within a narrow band—from USD 55,108 to USD 66,504 at a 90% confidence interval, which means there is a 90% probability that the investment value will fall within this range. The total length of reconductored lines increases from 1470.66 m (Scenario #1) to 1828.80 m (Scenario #125). These results suggest that postponing or ignoring reinforcement actions creates greater operational and regulatory risks for utilities.
The Monte Carlo simulation results use a histogram to help decision-makers assess the risk profile associated with load variation. This probabilistic view supports more informed and resilient investment planning. Additionally, a graphical analysis of three representative scenarios clarifies where reconductoring actions occur across the network, helping to visualize spatial and temporal intervention patterns.
Four distinct reconductoring behaviors emerge across the evaluated scenarios: some reconductoring actions remain unchanged despite variations in net load between the boundary scenarios; certain segments follow an anticipated reconductoring schedule; the choice of conductor for reconductoring changes in some cases; and new reconductoring proposals appear. This indicates that the probabilistic analyses strongly reinforce certain reconductoring actions, while the decision to implement others depends on the level of risk that the decision-maker chooses to assume.
The analysis of reconductoring behaviors highlights consistent decisions across scenarios, including early interventions on critical branches, the standardization of conductor types, and strategic adjustments to intervention timing. These recurring outcomes demonstrate the methodology’s effectiveness in identifying technically sound and economically viable investment strategies. Moreover, the use of only 5 out of 12 available conductor types shows a practical and regulation-compliant approach to network planning.
Future research could apply the proposed methodology to multi-objective optimization problems that also incorporate reliability and resilience metrics, enabling planners to balance cost efficiency with service quality. Additionally, illustrating the application of the approach using real utility data and different network configurations would help demonstrate its practical relevance and adaptability. Integrating reconductoring decisions with broader asset management strategies, such as demand response or distributed storage, could further enhance flexibility and cost-effectiveness in distribution network planning.
Funding
APC was supported by the Federal Institute of Espírito Santo (IFES, notice 10/2025). The author received a research scholarship from the Foundation for Research Support of Espírito Santo (FAPES) under Call for Proposals No. 06/2021.
Institutional Review Board Statement
Not applicable.
Informed Consent Statement
Not applicable.
Data Availability Statement
The data presented in this study are available on request from the corresponding author.
Acknowledgments
The author acknowledges the financial and institutional support provided by the Foundation for Research Support of Espírito Santo (FAPES, Grant Agreement No. 348/2022, Administrative Proceeding No. 2022-Z253R) and the Federal Institute of Espírito Santo (IFES).
Conflicts of Interest
The author declares no conflict of interest.
References
- Filho, M.J. General Theory of Public Service Concessions; Dialética: São Paulo, Brazil, 2003. (In Portuguese) [Google Scholar]
- Prado, F.A.A., Jr.; da Silva, A.L.R.; Vieira, R.G. Considerations about memory on electricity tariffs: A case study from Brazil. Int. J. Adv. Eng. Res. Sci. (IJAERS) 2020, 7, 217–223. [Google Scholar] [CrossRef]
- National Electric Energy Agency—ANEEL. Brazilian Law No. 9,427, Enacted on December 26, 1996; National Electric Energy Agency—ANEEL: Brasília, Brazil, 1996.
- National Electric Energy Agency—ANEEL. Electricity Distribution Procedures in the National Electric System (PRODIST)—Module 8—Power Quality; National Electric Energy Agency—ANEEL: Brasília, Brazil, 2021. (In Portuguese)
- Mazhari, S.M.; Monsef, H.; Romero, R. A Hybrid Heuristic and Evolutionary Algorithm for Distribution Substation Planning. IEEE Syst. J. 2015, 9, 1396–1408. [Google Scholar] [CrossRef]
- Lei, Y.; Wang, D.; Jia, H.; Chen, J.; Li, J.; Song, Y.; Li, J. Multi-objective stochastic expansion planning based on multi-dimensional correlation scenario generation method for regional integrated energy system integrated renewable energy. Appl. Energy 2020, 276, 115395. [Google Scholar] [CrossRef]
- Tavares, B.; Soares, F.J. An innovative approach for distribution network reinforcement planning: Using DER flexibility to minimize investment under uncertainty. Electr. Power Syst. Res. 2020, 183, 106272. [Google Scholar] [CrossRef]
- Nahman, J.M.; Perić, D.M. Radial distribution network planning under uncertainty by applying different reliability cost models. Int. J. Electr. Power Energy Syst. 2020, 117, 105655. [Google Scholar] [CrossRef]
- Seta, F.D.S.; de Oliveira, L.W.; de Oliveira, E.J. Comprehensive approach for distribution system planning with uncertainties. IET Gener. Transm. Distrib. 2019, 13, 5467–5477. [Google Scholar] [CrossRef]
- Shin, J.; Kim, J.; Kim, S. Transmission network expansion planning considering risk level assessment and scenario-based risk level improvement. IET Gener. Transm. Distrib. 2018, 12, 1081–1088. [Google Scholar] [CrossRef]
- Moradijoz, M.; Moghaddam, M.P.; Haghifam, M.R. A flexible active distribution system expansion planning model: A risk-based approach. Energy 2018, 145, 442–457. [Google Scholar] [CrossRef]
- Qiu, J.; Zhao, J.; Wang, D.; Dong, Z.Y. Decomposition-based approach to risk-averse transmission expansion planning considering wind power integration. IET Gener. Transm. Distrib. 2017, 11, 3458–3466. [Google Scholar] [CrossRef]
- Karimi, M.; Haghifam, M.R. Risk based multi-objective dynamic expansion planning of sub-transmission network in order to have eco-reliability, environmental friendly network with higher power quality. IET Gener. Transm. Distrib. 2017, 11, 261–271. [Google Scholar] [CrossRef]
- Najafi Ravadanegh, S.; Jahanyari, N.; Amini, A.; Taghizadeghan, N. Smart distribution grid multistage expansion planning under load forecasting uncertainty. IET Gener. Transm. Distrib. 2016, 10, 1136–1144. [Google Scholar] [CrossRef]
- De Lima, T.D.; Franco, J.F.; Lezama, F.; Soares, J.A. Specialized Long-Term Distribution System Expansion Planning Method with the Integration of Distributed Energy Resources. IEEE Access 2022, 10, 19133–19148. [Google Scholar] [CrossRef]
- Gao, H.; Wang, R.; He, S.; Wang, Z.; Liu, J. Bi-level stackelberg game-based distribution system expansion planning model considering long-term renewable energy contracts. Prot. Control Mod. Power Syst. 2023, 8, 62. [Google Scholar] [CrossRef]
- Ayalew, M.; Khan, B.; Giday, I.; Mahela, O.P.; Khosravy, M.; Gupta, N.; Senjyu, T. Integration of Renewable Based Distributed Generation for Distribution Network Expansion Planning. Energies 2022, 15, 1378. [Google Scholar] [CrossRef]
- Zare, P.; Dejamkhooy, A.; Davoudkhani, I.F. Efficient expansion planning of modern multi-energy distribution networks with electric vehicle charging stations: A stochastic MILP model. Sustain. Energy Grids Netw. 2024, 38, 101225. [Google Scholar] [CrossRef]
- Kabirifar, M.; Fotuhi-Firuzabad, M.; Moeini-Aghtaie, M.; Pourghaderi, N.; Dehghanian, P. A Bi-Level Framework for Expansion Planning in Active Power Distribution Networks. IEEE Trans. Power Syst. 2022, 37, 2639–2654. [Google Scholar] [CrossRef]
- Kabiri-Renani, Y.; Fotuhi-Firuzabad, M.; Shahidehpour, M. Robust Coordinated Distribution System Planning Considering Transactive DSO’s Market. IEEE Trans. Power Syst. 2023, 38, 1896–1907. [Google Scholar] [CrossRef]
- Xiang, Y.; Xue, P.; Wang, Y.; Xu, L.; Ma, W.; Shafie-Khah, M.; Li, J.; Liu, J. Robust Expansion Planning of Electric Vehicle Charging System and Distribution Networks. CSEE J. Power Energy Syst. 2024, 10, 2457–2469. [Google Scholar] [CrossRef]
- Li, J.; Li, F.; Sun, K.; Sun, B. Bi-level coordinated expansion planning of high-PV-penetration active distribution networks incorporating multiple flexible resources considering WGAN-GP-based uncertainty generation. Energy 2025, 330, 136685. [Google Scholar] [CrossRef]
- Giannelos, S.; Konstantelos, I.; Zhang, X.; Strbac, G. A stochastic optimization model for network expansion planning under exogenous and endogenous uncertainty. Electr. Power Syst. Res. 2025, 248, 111894. [Google Scholar] [CrossRef]
- National Electric Energy Agency—ANEEL. Electricity Distribution Procedures in the National Electric System (PRODIST)—Module 2—Power Distribution System Expansion Planning; National Electric Energy Agency—ANEEL: Brasília, Brazil, 2021. (In Portuguese)
- Donadel, C.B.; Fardin, J.F.; Encarnacao, L.F. The Influence of Distributed Generation Units Penetration in the Technical Planning Process of Electrical Distribution Networks. IEEE Lat. Am. Trans. 2017, 15, 2144–2151. [Google Scholar] [CrossRef]
- Gampa, S.R.; Makkena, S.; Goli, P.; Das, D. FPA Pareto optimality-based multiobjective approach for capacitor placement and reconductoring of urban distribution systems with solar DG units. Int. J. Ambient. Energy 2022, 43, 1581–1597. [Google Scholar] [CrossRef]
- Alvarez, R.; Rahmann, C.; Palma-Behnke, R.; Estévez, P.A. A novel meta-heuristic model for the multi-year transmission network expansion planning. Int. J. Electr. Power Energy Syst. 2019, 107, 523–537. [Google Scholar] [CrossRef]
- Fishman, G.S. Monte Carlo: Concepts, Algorithms and Applications; Springer: New York City, NY, USA, 1996. [Google Scholar]
- Schneider, K.P.; Mather, B.A.; Pal, B.C.; Ten, C.W.; Shirek, G.J.; Zhu, H.; Fuller, J.C.; Pereira, J.L.R.; Ochoa, L.F.; de Araujo, L.R.; et al. Analytic Considerations and Design Basis for the IEEE Distribution Test Feeders. IEEE Trans. Power Syst. 2018, 33, 3181–3188. [Google Scholar] [CrossRef]
- IEEE. 1992 Test Feeder Cases. 1992. Available online: https://cmte.ieee.org/pes-testfeeders/resources/ (accessed on 1 March 2022).
- ONS. National Electric System Operator (ONS). 2025. Available online: https://www.ons.org.br/ (accessed on 1 April 2022).
- Kagan, N.; Oliveira, C.C.B.; Robba, E.J. Introduction to Electrical Distribution Systems, 1st ed.; Blucher: São Paulo, Brazil, 2005. (In Portuguese) [Google Scholar]
- Montgomery, D.C.; Runger, G.C. Applied Statistics and Probability for Engineers, 6th ed; John Wiley & Sons, Inc.: Hoboken, NJ, USA, 2013. [Google Scholar]
- Martínez-Gil, J.F.; Moyano-García, N.A.; Montoya, O.D.; Alarcon-Villamil, J.A. Optimal Selection of Conductors in Three-Phase Distribution Networks Using a Discrete Version of the Vortex Search Algorithm. Computation 2021, 9, 80. [Google Scholar] [CrossRef]
Disclaimer/Publisher’s Note: The statements, opinions and data contained in all publications are solely those of the individual author(s) and contributor(s) and not of MDPI and/or the editor(s). MDPI and/or the editor(s) disclaim responsibility for any injury to people or property resulting from any ideas, methods, instructions or products referred to in the content. |
© 2025 by the author. Licensee MDPI, Basel, Switzerland. This article is an open access article distributed under the terms and conditions of the Creative Commons Attribution (CC BY) license (https://creativecommons.org/licenses/by/4.0/).

