1. Introduction
Since entering the new century, China has experienced unprecedented urbanization development, which has not only been on a large scale but has also proceeded at a rapid pace. Urban diseases such as environmental pollution, traffic congestion, shortage of land resources, and urban waterlogging caused by the blind expansion of urbanization have become increasingly prominent. Urban safety and sustainable development are facing huge challenges. Underground space is a natural resource with great potential and rich resources. Underground engineering is an important aspect of urban construction and renewal, as is the implementation of the strategy to building a transportation powerhouse. How to improve the disaster risk resistance ability of underground engineering and enhance the resilience and sustainable development of underground engineering has become the issue most focused on for contemporary designers and managers of underground engineering construction [
1].
The Report to the 20th National Congress of the Communist Party of China pointed out that it is necessary to strengthen infrastructure construction and build livable, resilient, and smart cities. The construction of resilient cities is also emphasized in the 14th Five-Year Plan. Compared with above-ground projects, underground projects, due to their isolation and independence, can adapt to the expansion of point-like, linear, and network-like layouts of underground spaces. In addition, underground projects also have superior sound insulation effects as well as stability in temperature and humidity [
2]. For underground projects, it is necessary not only to improve the ability to prevent unknown risks and pay attention to the resistance during disasters, but also to attach importance to the recovery ability after disasters. It is necessary to emphasize improving the systematic resilience of disaster risk control of underground projects.
The concept of resilience was applied relatively early in engineering materials and the seismic resistance of engineering structures, and it is an important mechanical concept related to the ductile energy consumption of engineering structures [
3]. The most direct expression of resilience is recovery, rebound, or rehabilitation [
4], which refer to the ability to return to the original state after being disturbed by a certain factor, emphasizing the capacity to resist external disturbances and impacts. Once an underground project encounters a disaster (such as tunnel collapse and water inrush shown in
Figure 1), it will inevitably cause casualties and significant economic losses. The existing design theories cannot accurately estimate the disaster-affected location and scope of underground projects. In the field of disaster prevention and damage reduction, enhancing the resilience of underground projects can not only improve the daily living standards of residents during normal times, but also ensure rapid and effective communication of personnel and information when disasters occur [
1]. Therefore, evaluating and improving the resilience of underground projects have practical significance.
The risk assessment of underground engineering diverges from that of above-ground structures. This is attributable to its distinct construction methods, operation teams, management systems, and other non-technical elements, along with its intrinsic properties. As a result, scholars commonly explore the resilience evaluation system for underground engineering disaster risks, often centering on networked underground infrastructures like subways. In the existing research regarding the evaluation and enhancement of urban underground space resilience, the majority starts from the resistance resilience of individual projects [
5,
6,
7,
8].
Zheng Gang et al. [
9], in the context of evaluating and controlling the resilience of geotechnical and underground structures, pointed out that underground engineering structures fall into the category of low-resilience structures. Wei Qiang et al. [
3], leveraging the ideal fuzzy matter-element and commencing from the characteristics of resilience, proposed and established a resilience evaluation system encompassing nine resilience assessment indicators. Based on the BN structure, Yin et al. [
10] appraised the resilience of the Beijing subway by integrating historical data. Weng Yuan et al. [
11] identified influencing factors from five aspects of ‘people, machine, material, method, and environment’ and introduced the resilience theory into the tunnel engineering system safety framework to construct an evaluation model. Zhao Dongyue et al. [
12] put forward five factors influencing urban resilience and developed a model. Makana et al. [
13] utilized this framework to assess the utilization rate of the multi-functional tunnel in East End Birmingham, UK. Shi Zhenwu et al. [
14], from a seismic-resistance perspective, combined the Delphi method with an analytic hierarchy process to conduct a resilience evaluation of the underground utility tunnel.
When it comes to researching safety resilience in tunnel fires, Ouyang et al. [
15] and Huang Lang et al. [
16], from a resilience standpoint, established a fire safety resilience evaluation. Huang Yajiang et al. [
17] formulated a fire safety resilience evaluation system for subway stations using the ISM-ANP-Fuzzy algorithm. Taking the Shanghai People’s Square Transfer Station as an example for evaluation, they concluded that enhancing the levels of resistance and adaptability, as well as improving the quality of the fire-protection system and personnel capabilities, can effectively boost the fire safety resilience of subway stations. Lin Xingtao et al. [
18] and Xiao Mingqing et al. [
19], considering the structural features and disaster characteristics of shield tunnels, proposed an index system for enhancing the structural design resilience of shield tunnels. Analogously, Hua et al. [
20] proposed a novel model employing the longitudinal relative differential settlement as the recoverability performance index of tunnel structure and applied it to a case in Shanghai.
The objective of this paper is to develop a comprehensive resilience assessment and enhancement framework specifically tailored for underground infrastructure. This framework aims to address the unique challenges faced by underground engineering during the construction and operation phases, particularly in the context of China’s “dual carbon” strategic goals. The scope of this study encompasses the identification of key resilience indicators, the establishment of a systematic evaluation methodology, and proposing practical strategies to enhance resilience. Unlike a state-of-the-art review, this paper focuses on innovating assessment methods and strategies that can directly inform the design and management of underground engineering projects.
2. Routinization Evaluation Concept and Objectives
2.1. The Connotation of Resilience Evaluation and Improvement
Currently, the evaluation of resilience from the perspective of disaster resistance capacity assessment has been gradually integrated and developed in various professional fields. When divided by region, it can be classified into continental, urban, community, and infrastructure resilience. According to the research fields of resilience assessment for different disaster types, it can be categorized into seismic resilience, flood resilience, resilience against severe weather, typhoon resilience, etc., as shown in
Figure 2.
Currently, there is no universally accepted definition or systematic set of evaluation indicators for disaster risk resilience in underground engineering [
21]. However, considering the unique characteristics of underground engineering systems, resilience assessments typically focus on critical parameters such as structural load-bearing capacity and deformation. In post-disaster recovery assessments, the time and economic costs required for restoration are key indicators of recoverability, which also relate to system redundancy, adaptability, and response speed. Based on these factors, a resilience assessment framework for underground engineering can be established. To study the resilience assessment and enhancement of underground engineering, it is essential to start with the fundamental theories and attributes of resilience. This involves proposing targeted resilience concepts and frameworks that describe the system’s ability to resist and adapt to disasters (or disturbances). By selecting appropriate resilience indicators based on the characteristics of the research object and integrating qualitative and quantitative assessment methods, a comprehensive resilience evaluation of this field can be achieved.
The resilience assessment and enhancement of underground engineering disaster risks can be divided into three main aspects:
Pre-disaster resilience assessment: This refers to the system’s ability to resist disaster risks and estimate potential impacts. It requires the system to quantitatively assess the probability and potential losses of disasters, thereby predicting the scale of potential hazards.
During-disaster resilience resistance: This refers to the system’s ability to withstand damage or resist interference within its resistance and recovery thresholds. It demands that the system maintain critical functionality even when operational capacity is reduced to a certain level.
Post-disaster resilience recovery: This refers to the system’s ability to recover rapidly after exceeding its threshold. It involves leveraging internal and external measures, as well as adaptive structural improvements learned from previous disasters, to enhance resilience against future hazards.
By addressing these three dimensions, a comprehensive framework for resilience assessment and enhancement in underground engineering can be developed.
2.2. Resilience Evaluation and Improvement Characteristics
Under traditional disaster prevention and mitigation concepts, risk assessments of underground engineering disasters often treat risks and affected objects as separate considerations. This approach focuses narrowly on pre-disaster risk prevention (i.e., “disaster prevention”) while neglecting the mid- and post-disaster stages where system safety is compromised [
21]. Traditional methods primarily rely on fuzzy comprehensive evaluation theory [
22,
23,
24] to identify disaster risks and predict consequences, thereby achieving risk prevention. However, resilience, by definition, encompasses risk assessment and recovery evaluation. Unlike risk assessment, resilience assessment emphasizes the system’s ability to absorb and recover from disasters (i.e., “disaster adaptation”).
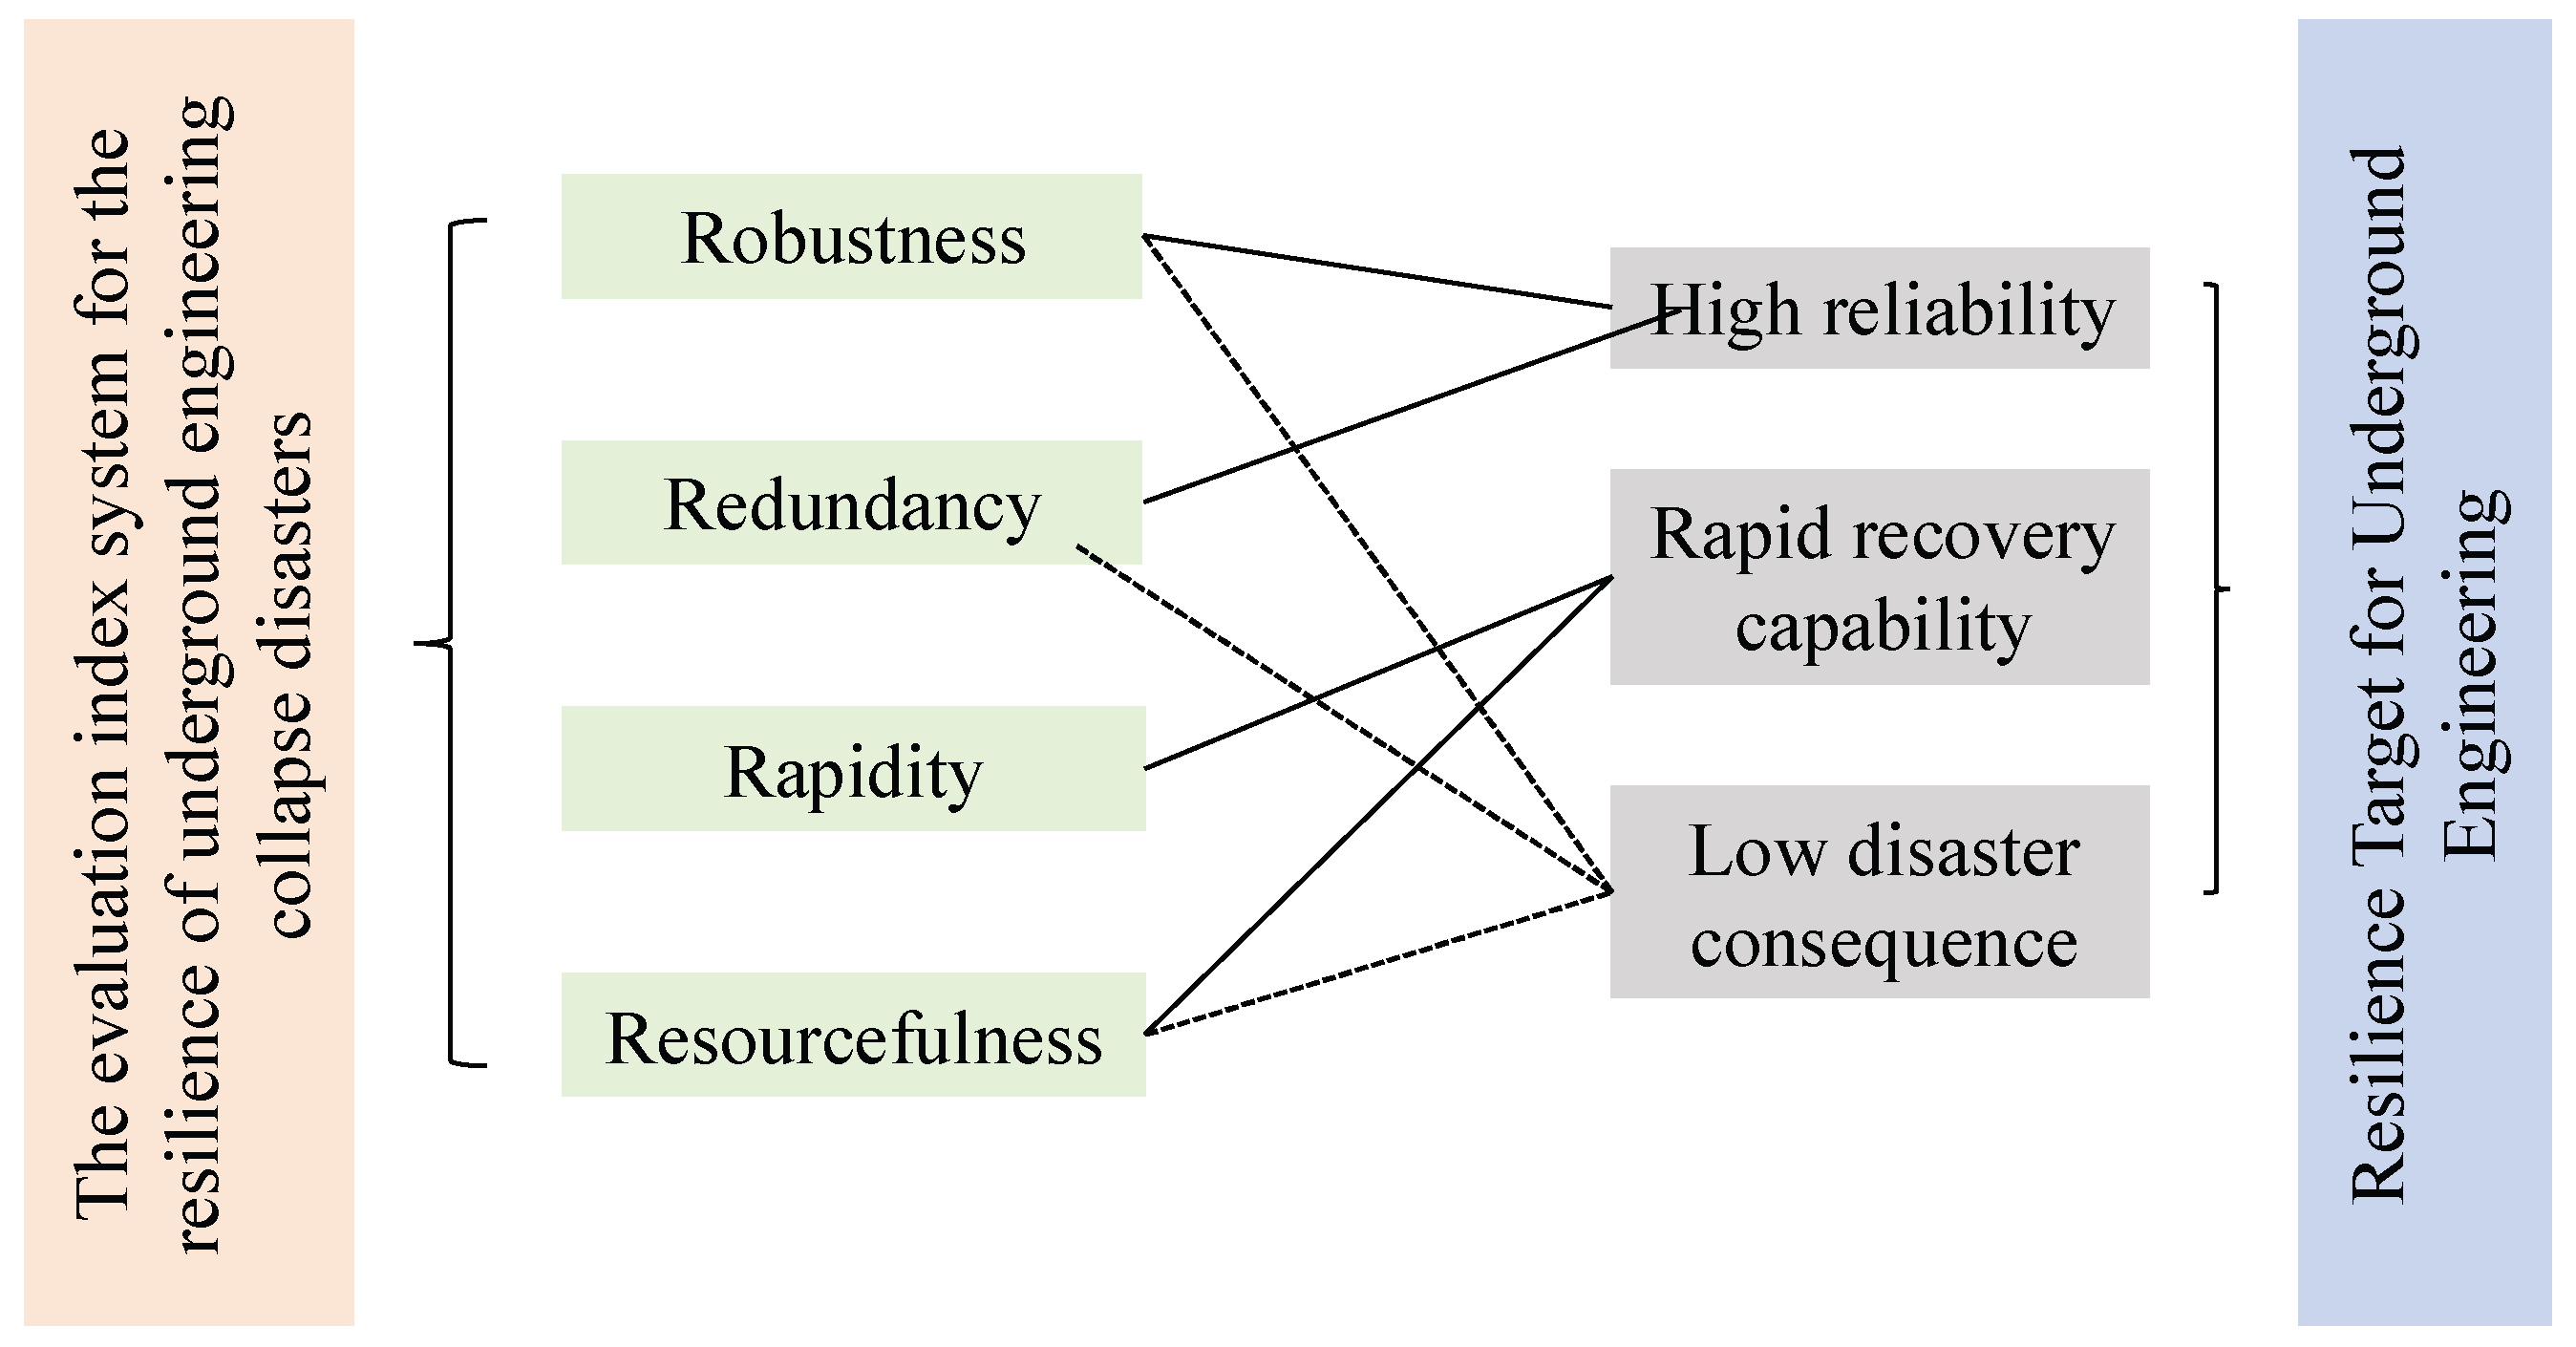
Current research identifies four key resilience indicators for underground engineering: robustness, rapidity, resourcefulness, and redundancy [
9]. Robustness reflects the system’s capacity to absorb shocks; higher robustness results in reduced disaster impacts. Rapidity and resourcefulness highlight the system’s ability to adapt and recover, while redundancy, considered the most critical characteristic of resilient systems, refers to the availability of reserve capacity to counteract disasters.
During the construction phase of underground engineering, the primary resilience objectives are high reliability, rapid recovery, and mitigation of disaster consequences, as illustrated in
Figure 3.
Based on current research on system resilience [
11,
25,
26], we define the disaster risk resilience level of underground engineering as UGR. The disaster risk resilience of underground engineering during the construction phase can be categorized into four levels:
- (1)
No resilience: The system has low resistance capability and poor adaptability when encountering disturbances. After a disturbance occurs, the system cannot recover to its original safe state.
- (2)
Low resilience: The system has relatively low resistance capability and poor adaptability when encountering disturbances. After a disturbance occurs, the system requires a long time to recover to its original safe state.
- (3)
Moderate resilience: The system has good resistance and adaptability when encountering disturbances. After a disturbance occurs, the system can quickly recover to its original safe state through emergency rescue measures.
- (4)
High resilience: The system has strong resistance and adaptability when encountering disturbances. After a disturbance occurs, the system can enhance its safety state by summarizing and learning from the incident.
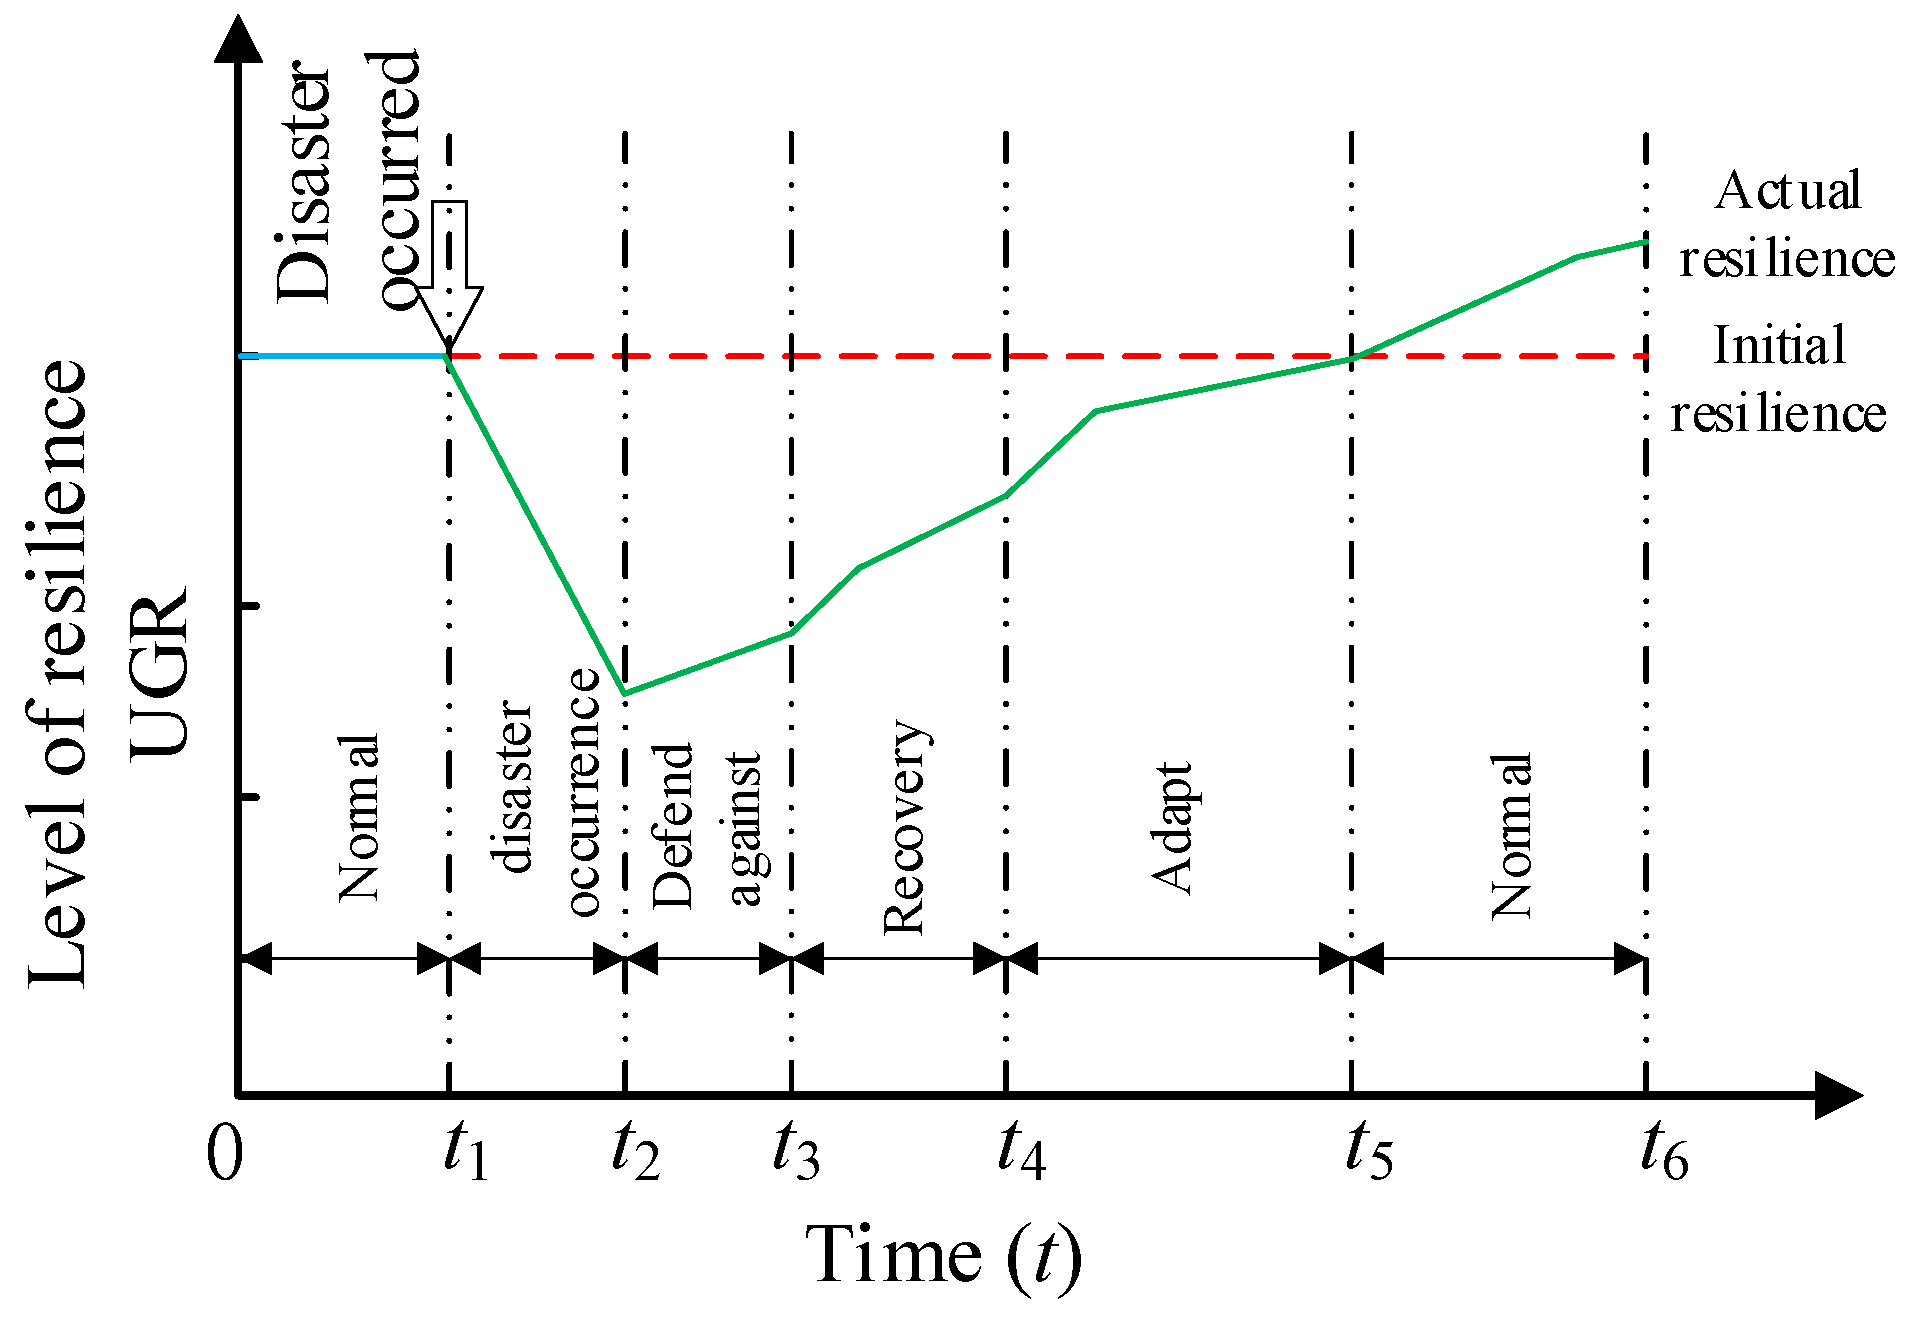
By integrating resilience performance indicators with resilience evaluation levels, the states of underground engineering resilience at various stages are summarized, as shown in
Figure 4.
This framework provides a systematic approach to assess and enhance the resilience of underground engineering during construction, emphasizing the transition from traditional risk assessment to a more comprehensive resilience-based perspective. The integration of resilience metrics with evaluation levels not only facilitates the identification of system vulnerabilities but also supports the development of targeted strategies to improve disaster resistance, adaptability, and recovery capabilities.
2.3. Evaluation and Improvement of Resilience of Underground Engineering
The establishment of a resilience assessment system for underground engineering disasters is critical for transitioning from passive to proactive disaster prevention. The resilience of underground engineering systems is time-dependent and can be categorized into three phases: pre-disaster, during-disaster, and post-disaster. Correspondingly, the resilience system reflects three core capabilities: resistance (pre-disaster), adaptability (during-disaster), and recovery (post-disaster). During a disaster, underground engineering systems rely on their protective capabilities to resist disaster impacts, and after the disaster, they leverage their restorative capabilities to return to normal functionality. Managers review existing vulnerabilities and optimize protective and restorative measures to enhance the system’s disaster response capabilities.
The influencing factors of underground engineering resilience can be broadly divided into internal and external factors. Among these, external factors primarily relate to the severity of the disaster, while internal factors involve structural vulnerability, disaster resistance, adaptability, and recovery capacity. For the resilience assessment of underground engineering disaster risks, the focus lies in evaluating robustness and recoverability.
Drawing on current relevant standards [
27,
28,
29,
30] and integrating practical engineering experience with the characteristics of underground engineering, specific resilience objectives for disaster risk assessment are proposed, as shown in
Table 1. These objectives provide a framework for systematically enhancing the resilience of underground engineering systems.
3. Risk Resilience Evaluation Model for Underground Engineering Disasters
3.1. Construction of Evaluation Index System for Resilience of Underground Engineering
In line with the connotations and objectives of resilience assessment, the evaluation of collapse disaster resilience in underground engineering should not be conducted solely after robustness assessment. Moreover, while complying with existing design load standards, it is necessary to reduce structural vulnerability and enhance recovery capacity and economic efficiency.
Current research on recovery capacity assessment primarily focuses on urban buildings and structures, strengthening the post-disaster recovery ability of urban buildings through evaluation criteria and resilience quantification. However, these assessment systems cannot be directly applied to underground engineering and require adaptation. This is because underground and above-ground structures differ significantly in terms of environmental conditions, types of disasters, and damage severity, leading to distinct post-disaster recovery pathways. Additionally, the development goals and principles of urban underground spaces differ from those of above-ground spaces, and non-technical factors such as construction methods, operation and maintenance teams, and management systems are also unique.
Establishing a comprehensive evaluation indicator system is crucial for accurately assessing the resilience of underground engineering to collapse disasters. This study has developed such a system by considering the interplay of factors across five key dimensions: “personnel, machinery, materials, methods, and environment”. These dimensions form the foundation of our resilience assessment framework, as they encompass the human, technological, resource-related, process-oriented, and contextual elements that influence the system’s ability to withstand, adapt to, and recover from disasters.
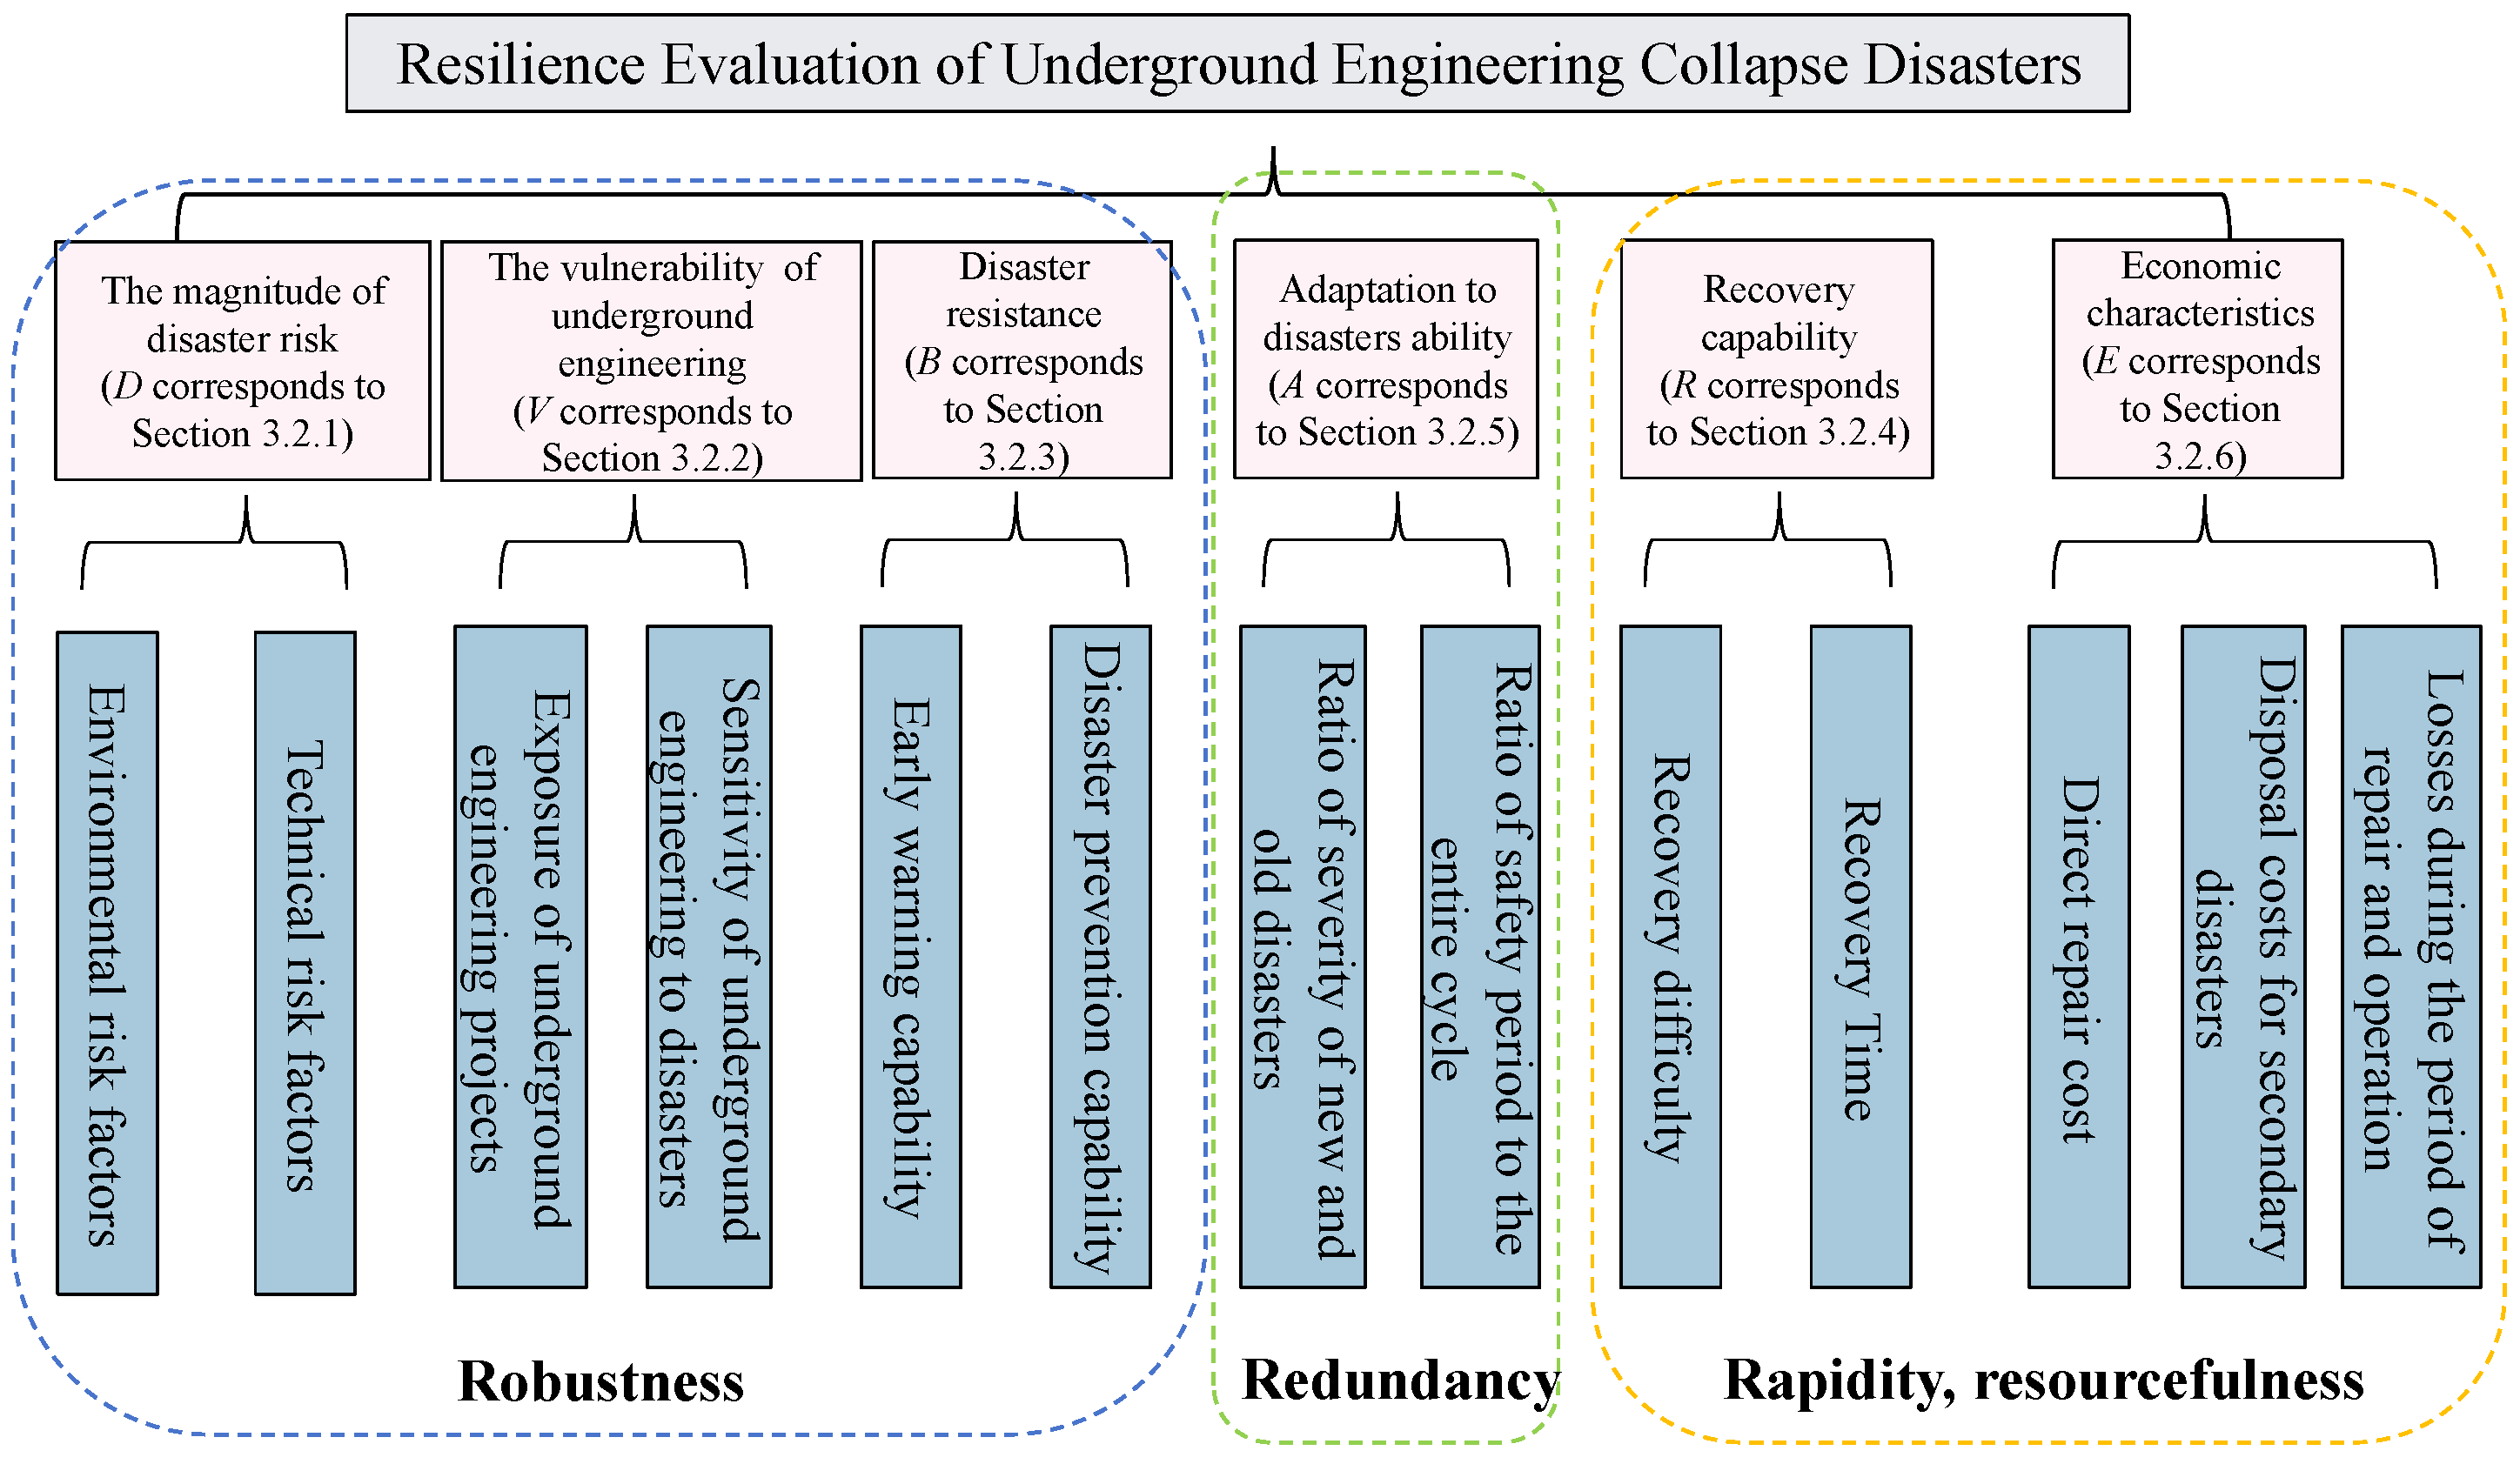
As depicted in
Figure 5, the evaluation index system is structured around several primary indicators, including disaster risk magnitude, vulnerability of underground engineering, disaster resistance, adaptability, recovery capacity, and economic efficiency. Each of these primary indicators is further broken down into specific secondary indicators, totaling 13, which collectively provide a detailed and multi-faceted view of the underground engineering system’s resilience.
The connections between the five dimensions and the evaluation index system in
Figure 5 are as follows:
Figure 5.
Evaluation index system of resilience to underground engineering collapse disaster.
Figure 5.
Evaluation index system of resilience to underground engineering collapse disaster.
Personnel: this dimension is reflected in the early warning capability and disaster prevention capability indicators, emphasizing the role of skilled personnel in disaster preparedness and response.
Machinery: the technical risk factors and sensitivity of underground engineering to disasters indicators are closely tied to machinery, as they involve the technical aspects and equipment used in underground engineering.
Materials: the disaster relief ability and adaptability to disasters indicators are related to materials, considering the availability and effective use of materials in disaster resistance and adaptation.
Methods: the entire evaluation index system embodies the methods dimension, as it represents a systematic approach to assessing resilience, incorporating various methods and techniques for disaster risk management.
Environment: the environmental risk factors and exposure of underground engineering projects indicators directly correspond to the environment dimension, highlighting the impact of environmental conditions on underground engineering resilience.
Through this structured approach, the evaluation index system comprehensively captures the resilience of underground engineering collapse disasters by integrating the five dimensions into the primary and secondary indicators presented in
Figure 5.
3.2. Evaluation Method of Resilience of Underground Engineering
Current research on resilience evaluation in underground space primarily explores the impact of disasters on the resilience of underground engineering from a social perspective. This study draws on existing research [
2,
12] and integrates factors influencing the construction phase with economic benefit indicators. Approaching from the perspective of construction practice, it investigates the impact of disasters on the resilience of underground engineering. The study extends the analysis from the social level and geological environment level to the engineering practice level, further linking the geological environment to engineering construction. Additionally, it expands the applicability of the evaluation model to address shortcomings in resilience assessment research for underground engineering.
In this context, this paper analyzes six factors influencing the disaster risk resilience of underground engineering and constructs a resilience evaluation model, as shown in Equation (1).
where
UGR is the resilience level of underground engineering disasters;
D is the magnitude of disaster risk;
V is the vulnerability of underground engineering;
R is recovery capability;
B is disaster resistance;
A is adaptability;
E is economy. The risk level of resilience is shown in
Table 1.
3.2.1. The Magnitude of the Disaster Risk
The magnitude of disaster risk refers to the overall degree of disaster risk for underground engineering, considering both natural and artificial factors. It is determined by the combined effects of natural environmental risk factors and technical risk factors. Natural environmental risk factors include elements such as topographic and geological conditions, the risk of karst collapse, and the risk of earthquakes. Technical risk factors involve aspects like the construction contractor’s capabilities, construction progress, safety management, and design parameters. These factors collectively influence the potential for disaster occurrence and the extent of its impact on underground engineering.
To assess disaster risk, the risk magnitude
D can be divided into natural environmental risk factors
DN and technical risk factors
DT. The severity of the disaster is determined by combining these two risk magnitudes. Drawing on relevant standards [
29,
30] and research findings [
31,
32], and using tunnel engineering as an example, an evaluation indicator system for disaster risk magnitude is established. The weights of various risk factors and the consequences of each indicator can be calculated using the research findings of Wu et al. [
22,
23,
32]. The corresponding disaster risk severity and indicator system are shown in
Figure 6 and
Table 2.
3.2.2. The Vulnerability of Underground Engineering
The vulnerability of underground engineering is related to the expected disaster losses caused by external disturbances. Under disasters of equal intensity, the higher the vulnerability and exposure of underground engineering, the more susceptible it is to losses. The vulnerability of underground engineering is characterized by the product of exposure and damage sensitivity, as shown in Equation (2):
where
V represents vulnerability,
Ex represents exposure, and
M represents damage sensitivity. The above indicators are dimensionless.
Exposure (Ex) refers to the degree to which underground engineering is subjected to potentially hazardous environmental factors. These factors include, but are not limited to, water-rich zones (e.g., groundwater erosion), extreme climate conditions (e.g., extreme heat or cold), geological faults and fractures, high-stress zones, and uneven pressure. Damage sensitivity (M), on the other hand, represents the inherent vulnerability of the underground engineering and its surrounding geological conditions to withstand these hazardous factors without experiencing significant damage. It encompasses characteristics such as the thickness of weak strata, the degree of subsidence, and the mechanical properties of weak strata that influence how susceptible the engineering is to damage when exposed to hazards.
The disaster risk of underground engineering is influenced by both exposure and damage sensitivity. Higher exposure indicates a greater likelihood of the engineering being affected by hazardous environmental factors, while higher damage sensitivity suggests that the engineering is more prone to damage when such factors occur. Based on engineering practice and corresponding disaster events, relevant indicators are used to characterize these two distinct aspects of vulnerability in underground engineering, as shown in
Table 3. The vulnerability classification of underground engineering, as shown in
Table 4, refers to the classification system proposed by [
2].
3.2.3. Disaster Resistance
Disaster resistance capability refers to the ability of underground engineering to maintain its original functionality despite exposure to disasters, achieved through enhanced early warning systems and disaster prevention structures. This includes measures such as sealing, drainage, reinforcement of surrounding rock, and the establishment of warning systems to control the impact scope of disasters.
The disaster resistance capability is evaluated using the indicators listed in
Table 5, and the assessment method can be calculated using Equation (3).
where
B is the disaster resistance capability,
Pb is the ability to prevent disaster, and
Wb is the warning capability. The exponential function in Equation (3) is employed to capture the non-linear relationship between disaster prevention capability (
Pb) and warning capability (
Wb) in determining the disaster resistance capability (
B). This relationship is non-linear because even small improvements in warning capability can lead to disproportionately large enhancements in the overall disaster resistance capability when the disaster prevention capability is at a certain level. For example, a slight increase in the accuracy or timeliness of early warning systems (which contributes to
Wb) can significantly enhance the ability of underground engineering to prepare for and mitigate the impact of disasters, thereby greatly boosting the disaster resistance capability. The exponential form allows for a more flexible and realistic representation of how these factors interact to influence the resistance capability, as opposed to a linear relationship which might not adequately reflect the complex and potentially compounding effects in real-world scenarios. Additionally, the exponential function can also reflect that the effectiveness of disaster prevention measures in enhancing resistance may increase at an accelerating rate with better warning capabilities, which is a common phenomenon in many engineering and safety-related contexts.
Specifically, even if localized structural damage occurs due to accidental events, the overall structural system remains functional, and the extent of damage is disproportionate to the cause of localized injury. This disaster prevention capability, combined with the early warning capability through the exponential function in Equation (3), forms the comprehensive disaster resistance capability of underground engineering.
The disaster prevention capability Pb can be defined as the ability of underground engineering structures to avoid overall system failure, even when subjected to singular or multiple disasters exceeding standard design criteria, or in the event of cascading disasters. Specifically, even if localized structural damage occurs due to accidental events, the overall structural system remains functional, and the extent of damage is disproportionate to the cause of localized injury.
3.2.4. Recovery Capability
Recovery capability refers to the ability of underground engineering to swiftly return to its normal functional state through human intervention. This involves the use of emergency response technologies, such as grouting reinforcement, structural support, and component replacement, to repair damaged areas and enhance load-bearing capacity. Primarily reflected in the recovery capacity of the structure, this study, building on the work of Su et al. [
2] and Lin et al. [
6], develops a recovery capability evaluation model for underground engineering.
The recovery capability is evaluated using the indicators listed in
Table 1, and the assessment method can be calculated using Equation (4).
where
R is the ability of an underground engineering structure to recover quickly after damage, covering the time and difficulty required for recovery;
is the proportion of underground space areas that have been weakened by disasters and whose bearing capacity has been reduced or lost.
,
is the ratio between the reinforced area and the area with reduced bearing capacity caused by the disaster. Divide the levels into
: 0 to 0.3 is severe injury, 0.3 to 0.5 is moderate injury, 0.5 to 0.7 is mild injury, 0.7 to 0.9 is relatively mild injury, and 0.9 to 1.0 is generally intact.
is the expected recovery time corresponding to each level, which refers to the time required for the structure to recover its function after a disaster.
, as shown in
Table 1.
The logarithmic function in Equation (4) is chosen to represent recovery capability due to its ability to capture the non-linear relationship between the proportion of weakened underground space areas (ΔV) and the ratio of reinforced area to weakened bearing capacity area (ΔF), in relation to the recovery time (ΔT). This non-linear relationship is appropriate because the recovery process typically has different dynamics depending on the severity of damage and the proportion of areas affected.
In the early stages of recovery, when the proportion of weakened areas (ΔV) is relatively small and the reinforced area ratio (ΔF) is relatively low (indicating severe damage), even small increases in ΔF can lead to a significant improvement in recovery capability as the structure begins to stabilize and recover its load-bearing capacity. The logarithmic function effectively reflects this rapid increase in recovery capability at lower values of ΔF. As the recovery process progresses and ΔF increases further, the rate at which recovery capability improves may slow down, which is also captured by the logarithmic function’s gradually flattening curve.
Additionally, the logarithmic function helps to bound the recovery capability value within a reasonable range. It prevents the recovery capability from increasing without limit as ΔF approaches 1.0 (generally intact), which is more realistic as there are always practical limits to how quickly and effectively a structure can recover, even when most of the damaged areas have been reinforced.
While other models like linear or exponential could also be considered, the logarithmic function provides a better fit for the expected behavior of recovery in underground engineering structures, especially when accounting for the varying difficulty and time required to recover from different levels of damage severity and spatial distribution of weakened areas.
3.2.5. Disaster Adaptability
Disaster adaptability refers to the ability of underground engineering structures to adapt following exposure to single or multiple cascading disasters. This capability is enhanced through design to enable the engineering structure to respond effectively to extreme conditions. During sudden events, the system can mitigate disaster impacts and reduce overall damage by utilizing backup components or alternative load transfer paths. The assessment method can be calculated using Equation (5).
where
A is the adaptability;
T is the engineering or operation cycle after recovery;
Ts is the safety period of the engineering or operation after recovery;
D represents the severity of the old disaster event;
is the severity of new disaster events. If the same disaster does not occur repeatedly, it is considered that the disaster adaptation ability is the best,
A = 1; if the disaster occurs again, the result depends on both severity and proportion of safety period duration, and the value is taken as 0 <
A < 1.
3.2.6. Economic Characteristics
The economic indicator E reflects the economic costs incurred during the recovery process of underground engineering after functional impairment, covering both direct and indirect economic losses. These losses require economic calculations based on repair design methods and expert assessments before indicator evaluation. Key evaluation indicators include direct repair costs C, costs for addressing secondary disasters S, and operational losses during the repair period Q.
In the context of underground engineering, “secondary disasters” refer to additional disasters or adverse events that occur as a result of the initial functional impairment or damage to the underground engineering structure. These can be triggered by the weakened structural integrity or altered environmental conditions caused by the primary disaster. For example, after an earthquake damages an underground tunnel, water leakage due to the broken lining could occur, leading to further structural weakening or even local collapse. Similarly, in the case of a sudden water inrush during construction, the subsequent flooding can cause electrical system failures or soil erosion around the tunnel, which are also considered secondary disasters. These secondary disasters can exacerbate overall damage and increase the complexity and cost of recovery efforts.
3.3. Application of Performance Evaluation Index System
3.3.1. Case Overview
This study applies the resilience evaluation indicator system to a yellow sand aquifer tunnel engineering project [
22]. The tunnel, located in a hilly area, is designed as a single-directional dual-lane tunnel with a total length of 1250 m and a maximum burial depth of 161 m. Both tunnel portals feature end-wall structures.
Geological exploration reports indicate that the slope at the tunnel entrance is composed primarily of residual soil and fully or strongly weathered rock layers, resulting in poor soil quality and unstable slope conditions. The slope at the tunnel exit consists mainly of sandy clay and fully or strongly weathered rock layers, with poor rock mass integrity. Surface water in the tunnel area is primarily sourced from streams in the valleys, particularly on the right side of the tunnel, where narrow gullies concentrate large volumes of water during the rainy season. Groundwater level analysis shows it is above the design elevation. Both ends of the tunnel experience lateral pressure and water surging issues, posing risks of collapse, water gushing, and mud bursts during construction.
This study focuses on the segment LZK1 + 060 to LZK1 + 080 of the tunnel for collapse disaster risk resilience evaluation and analysis.
3.3.2. Analysis of Disaster Risk Size
Based on project data and the relevant literature [
22,
32,
33], this study establishes a two-level risk evaluation indicator system for water-rich soft rock mountain tunnels. This system synthesizes two major risk factors: technical and natural environment, which are each broken down into 27 specific, practical, and actionable third-level indices (see
Figure 6).
The weights of the evaluation indicators are calculated using the game-theoretic combination weighting-TOPSIS method. Additionally, the indicators are classified and scored by referencing the relevant literature [
2,
22,
33]. The results indicate that the collapse risk magnitude
D for the tunnel project is 4.882 (see
Table 6 for detailed calculations).
The assessment results show that the disaster severity is relatively high, indicating that the disaster has had a significant negative impact on the engineering environment. Specifically, it has altered the working conditions of the tunnel and reduced the load-bearing capacity of the surrounding rock.
3.3.3. Analysis of the Vulnerability of the Project
Using the collapse disaster of this tunnel project as an example, the engineering vulnerability is calculated based on the project’s geological conditions, with details provided in
Table 7. The assessment reveals that due to the impact of construction activities, the exposure and sensitivity of the geological environment are relatively low. Combining these two factors, the engineering vulnerability is rated as moderate, suggesting that the likelihood of collapse disasters caused by construction interference is low.
3.3.4. Analysis of Engineering Disaster Resistance
The collapse of the tunnel segment LZK1 + 060 to LZK1 + 080 was caused by insufficient lining support strength. Once the settlement displacement of the crown exceeded the normal range, it was impossible to reinforce and support the surrounding rock in time, leading to a collapse. This resulted in economic losses and delays in project progress.
Following the incident, relevant authorities promptly implemented emergency measures to stabilize the situation and prevent further collapse. These measures included the following: constructing two reinforced concrete walls, 9 m high and 2.7 m thick, inside the tunnel to seal the entrance; installing eight reinforced concrete reinforcement structures around the tunnel area; injecting water into the tunnel to balance internal and external pressures; injecting concrete through boreholes 160 m from the accident site to form barriers and prevent mud and sand from entering the completed tunnel sections; conducting sand backfilling operations on the ground, particularly in the subsidence funnel area, to prevent further expansion and control disaster spread.
These actions demonstrate the availability of adequate disaster prevention funds, advanced emergency technology, and efficient personnel response capabilities in the region. According to relevant data, the disaster resistance before the incident was 18.66, which increased to 21.45 after the incident (see
Table 8). This indicates that human intervention has consistently maintained the region’s disaster resistance at a high level.
3.3.5. Project Recovery Capability Analysis
Following the implementation of a series of control measures, the geological conditions demonstrated a certain level of disaster resistance, effectively preventing further disaster spread. Subsequently, a double-liquid cement slurry injection operation was performed using underground grouting, with a total injection area of approximately 5000 to 6000 m2 and a volume of about 18,000 m3. This measure aimed to fill voids caused by the collapse, compact the soil, and promote the coagulation of newly filled sand, thereby enhancing the stability and load-bearing capacity of the geological environment and creating conditions for subsequent project repairs.
Considering the underground cement grouting technology used in this incident and based on the damaged volume of the upper and lower tunnels and the surface subsidence characteristics primarily involving silty clay layers, the recovery force was calculated using Equation (4), and was found to be 2.43 (see
Table 9 for details). The results indicate that the supporting capacity of the geological environment was not only restored to its initial state but also further enhanced following the emergency response measures.
3.3.6. Disaster Resilience Analysis
To minimize the risk of tunnel collapse during excavation, the CD method combined with incremental excavation is employed. For the fractured zone cross-section, a three-step excavation method is adopted (upper bench, middle bench, and lower bench). In this method, the right pilot tunnel lags approximately 15 m behind the left pilot tunnel. Each excavation step within a single cycle is 1 m in length, with a total length per step controlled between 5 and 7 m. Excavation is carried out using blasting or manual methods. During blasting, strict control of hole depth and charge quantity ensures the integrity of the surrounding rock while minimizing overbreak and enhancing its load-bearing capacity.
Initial support is applied within 60 min of excavation. On-site management is strengthened to achieve a quality compliance rate of over 98%, and monitoring frequency is increased to four times per day. During the implementation of the repair project, no collapses occurred, and the project was completed successfully and passed final inspection. This indicates that the geological conditions, after experiencing disturbance and repair, have enhanced their capacity to respond to similar events.
By inputting the duration of the repair project and the absence of new geological disasters into Equation (5), the adaptability score for the project is calculated as A = 1. This result underscores the effectiveness of the implemented measures in enhancing geological adaptability.
3.3.7. Comprehensive Assessment of Resilience Hazards
Based on the collected data and the disaster risk resilience evaluation indicator system for underground engineering, calculations were conducted to assess the magnitude of sudden collapse disaster risks, engineering vulnerability, disaster resistance, recovery capability, and adaptability. The actual resilience level was calculated (see
Table 10), providing a comprehensive evaluation of the tunnel engineering resilience throughout the entire process of the sudden collapse disaster event.
Prior to any disaster impact, the resilience of the tunnel project in this example was primarily determined by its vulnerability and disaster resistance. From
Figure 4, we can see that at time
t1, a collapse disaster occurred, reducing the stability of the surrounding rock at the excavation face and triggering tunnel collapse, causing the resilience level to plummet. By time
t2, human intervention halted the disaster’s spread, stabilizing and slightly recovering the resilience level. At
t3, grouting measures reduced engineering vulnerability, leading to a moderate increase in resilience, though only to a low level. Starting at
t4, risk control measures such as reinforcing weak surrounding rock were implemented. Between
t5 and
t6, no collapses occurred during construction, demonstrating high adaptability and elevating the tunnel project’s resilience to a new level.
4. Direction for Enhancing Resilience Evaluation
4.1. Static Resilience Evaluation Based on Artificial Intelligence Algorithm
As we enter the big data era, artificial intelligence algorithms based on data-driven approaches offer significant advantages in solving high-dimensional non-linear problems. Their introduction into underground engineering resilience assessment has partially automated the evaluation process and made it more intelligent, thereby enhancing the objectivity and reliability of assessment outcomes.
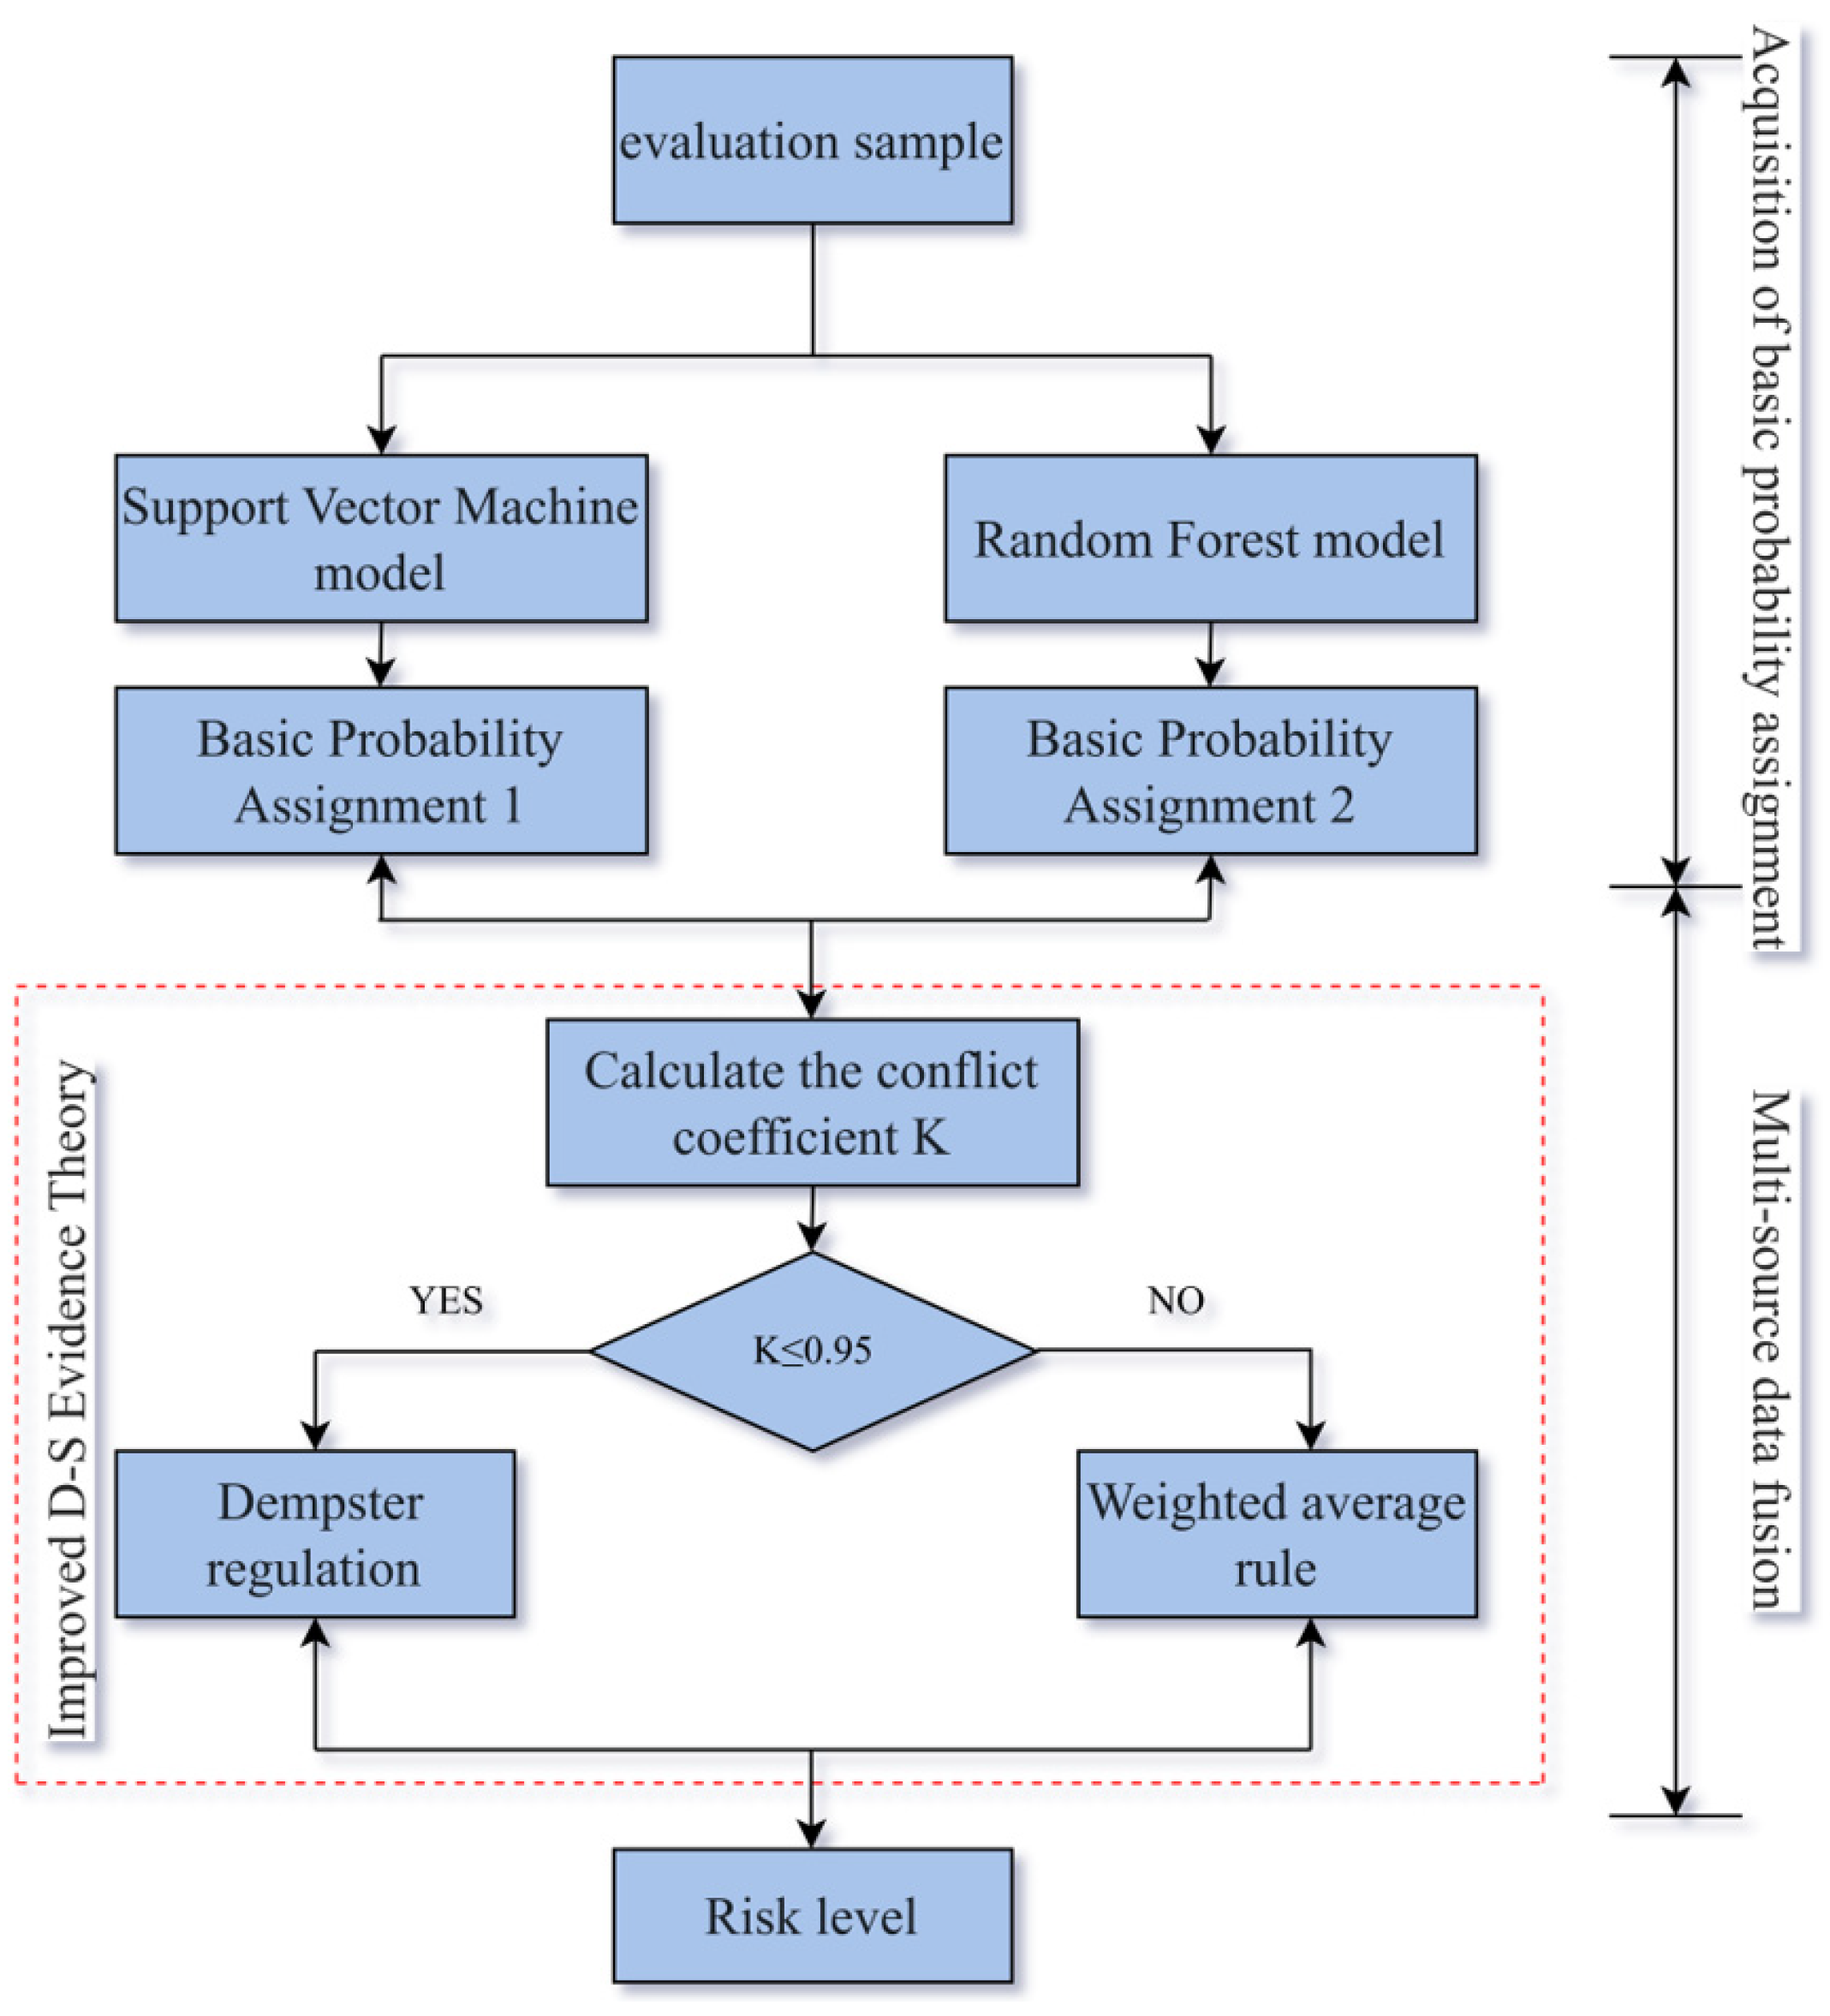
Machine learning algorithms, including artificial neural networks, decision trees, random forests, support vector machines (SVMs), and Gaussian process regression, have been widely applied in predicting geological risks such as rock bursts, water inrush, and collapses. For instance, a hybrid intelligent assessment model for tunnel collapse risk has been developed by integrating SVM and random forest (RF) models with the improved Dempster–Shafer (D-S) evidence theory [
32,
33]. This model, based on a binary classifier, effectively improves the discrimination of risk levels, with the corresponding evaluation process illustrated in
Figure 7.
This approach not only leverages the strengths of machine learning algorithms but also enhances decision-making reliability in complex geological conditions.
4.2. Combined Study of Numerical Simulation and Toughness Evaluation
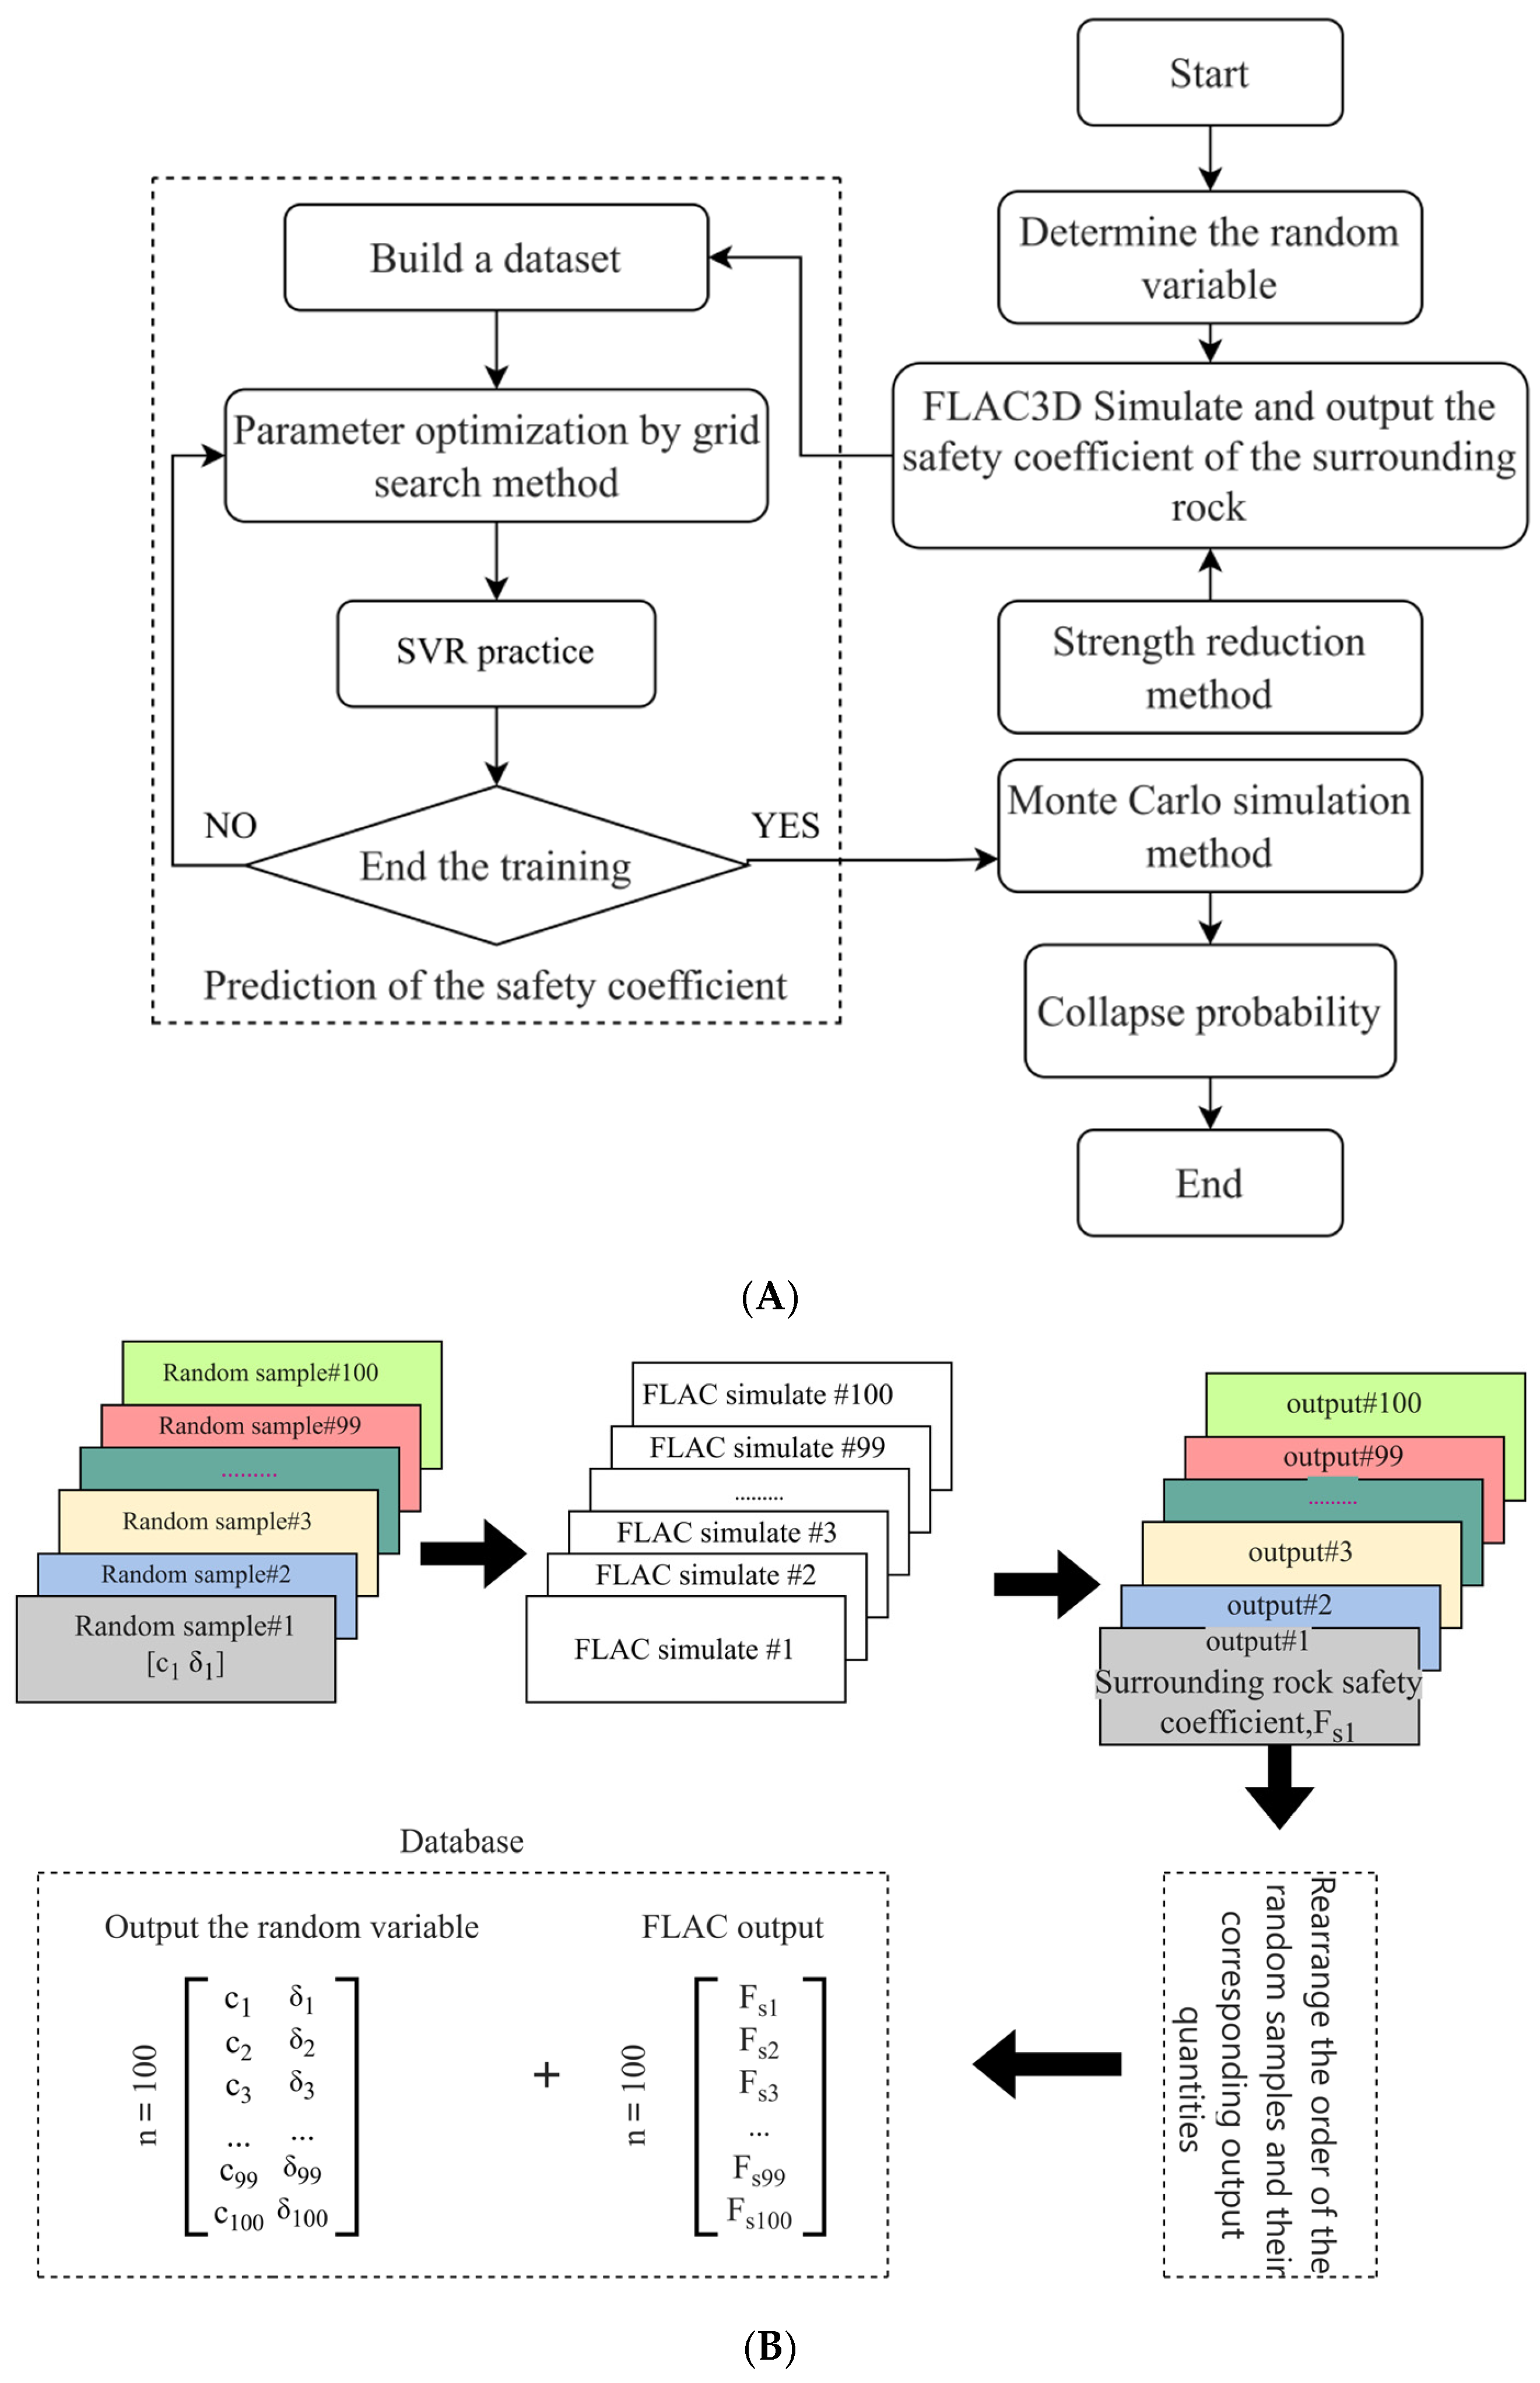
Combining AI-based resilience assessment methods with numerical simulation is an effective way to enhance the reliability and objectivity of evaluation results. Numerical simulation methods can incorporate diverse factors such as the non-linear behavior of geotechnical materials, interactions between geotechnical bodies and structures, and excavation methods, making them a proven tool for analyzing tunnel construction safety.
By leveraging numerical simulations, it is possible to accurately reproduce the process of disaster risk occurrence and determine the probability level of risk events. This significantly improves the resilience of underground engineering in responding to disaster risks. For example, in assessing tunnel collapse risk probabilities, integrating numerical simulation with support vector regression (SVR) algorithms and Monte Carlo simulations combines the strengths of these methods. This integration enables a quantitative description of tunnel collapse likelihood under different construction scenarios. The corresponding workflow is illustrated in
Figure 8.
This approach not only enhances the accuracy of risk prediction but also provides a robust framework for decision-making in complex underground engineering projects.
4.3. Dynamic Resilience Evaluation Based on Multi-Data Fusion
Currently, research on resilience assessment in the context of tunnel engineering is relatively limited. However, risk theory and resilience theory share a degree of compatibility. Drawing on research findings from the field of risk assessment can provide a clear direction for dynamic resilience evaluation.
In the field of tunnel engineering risk research, assessment methods and theories are transitioning from static to dynamic approaches and from qualitative to quantitative analyses. The risk assessment process still heavily relies on expert involvement and subjective experience, leaving room for improvement in objectivity. Introducing numerical simulation methods into risk assessment shows significant potential. Additionally, automated and intelligent assessment methods based on machine learning are still underexplored in terms of their application and research.
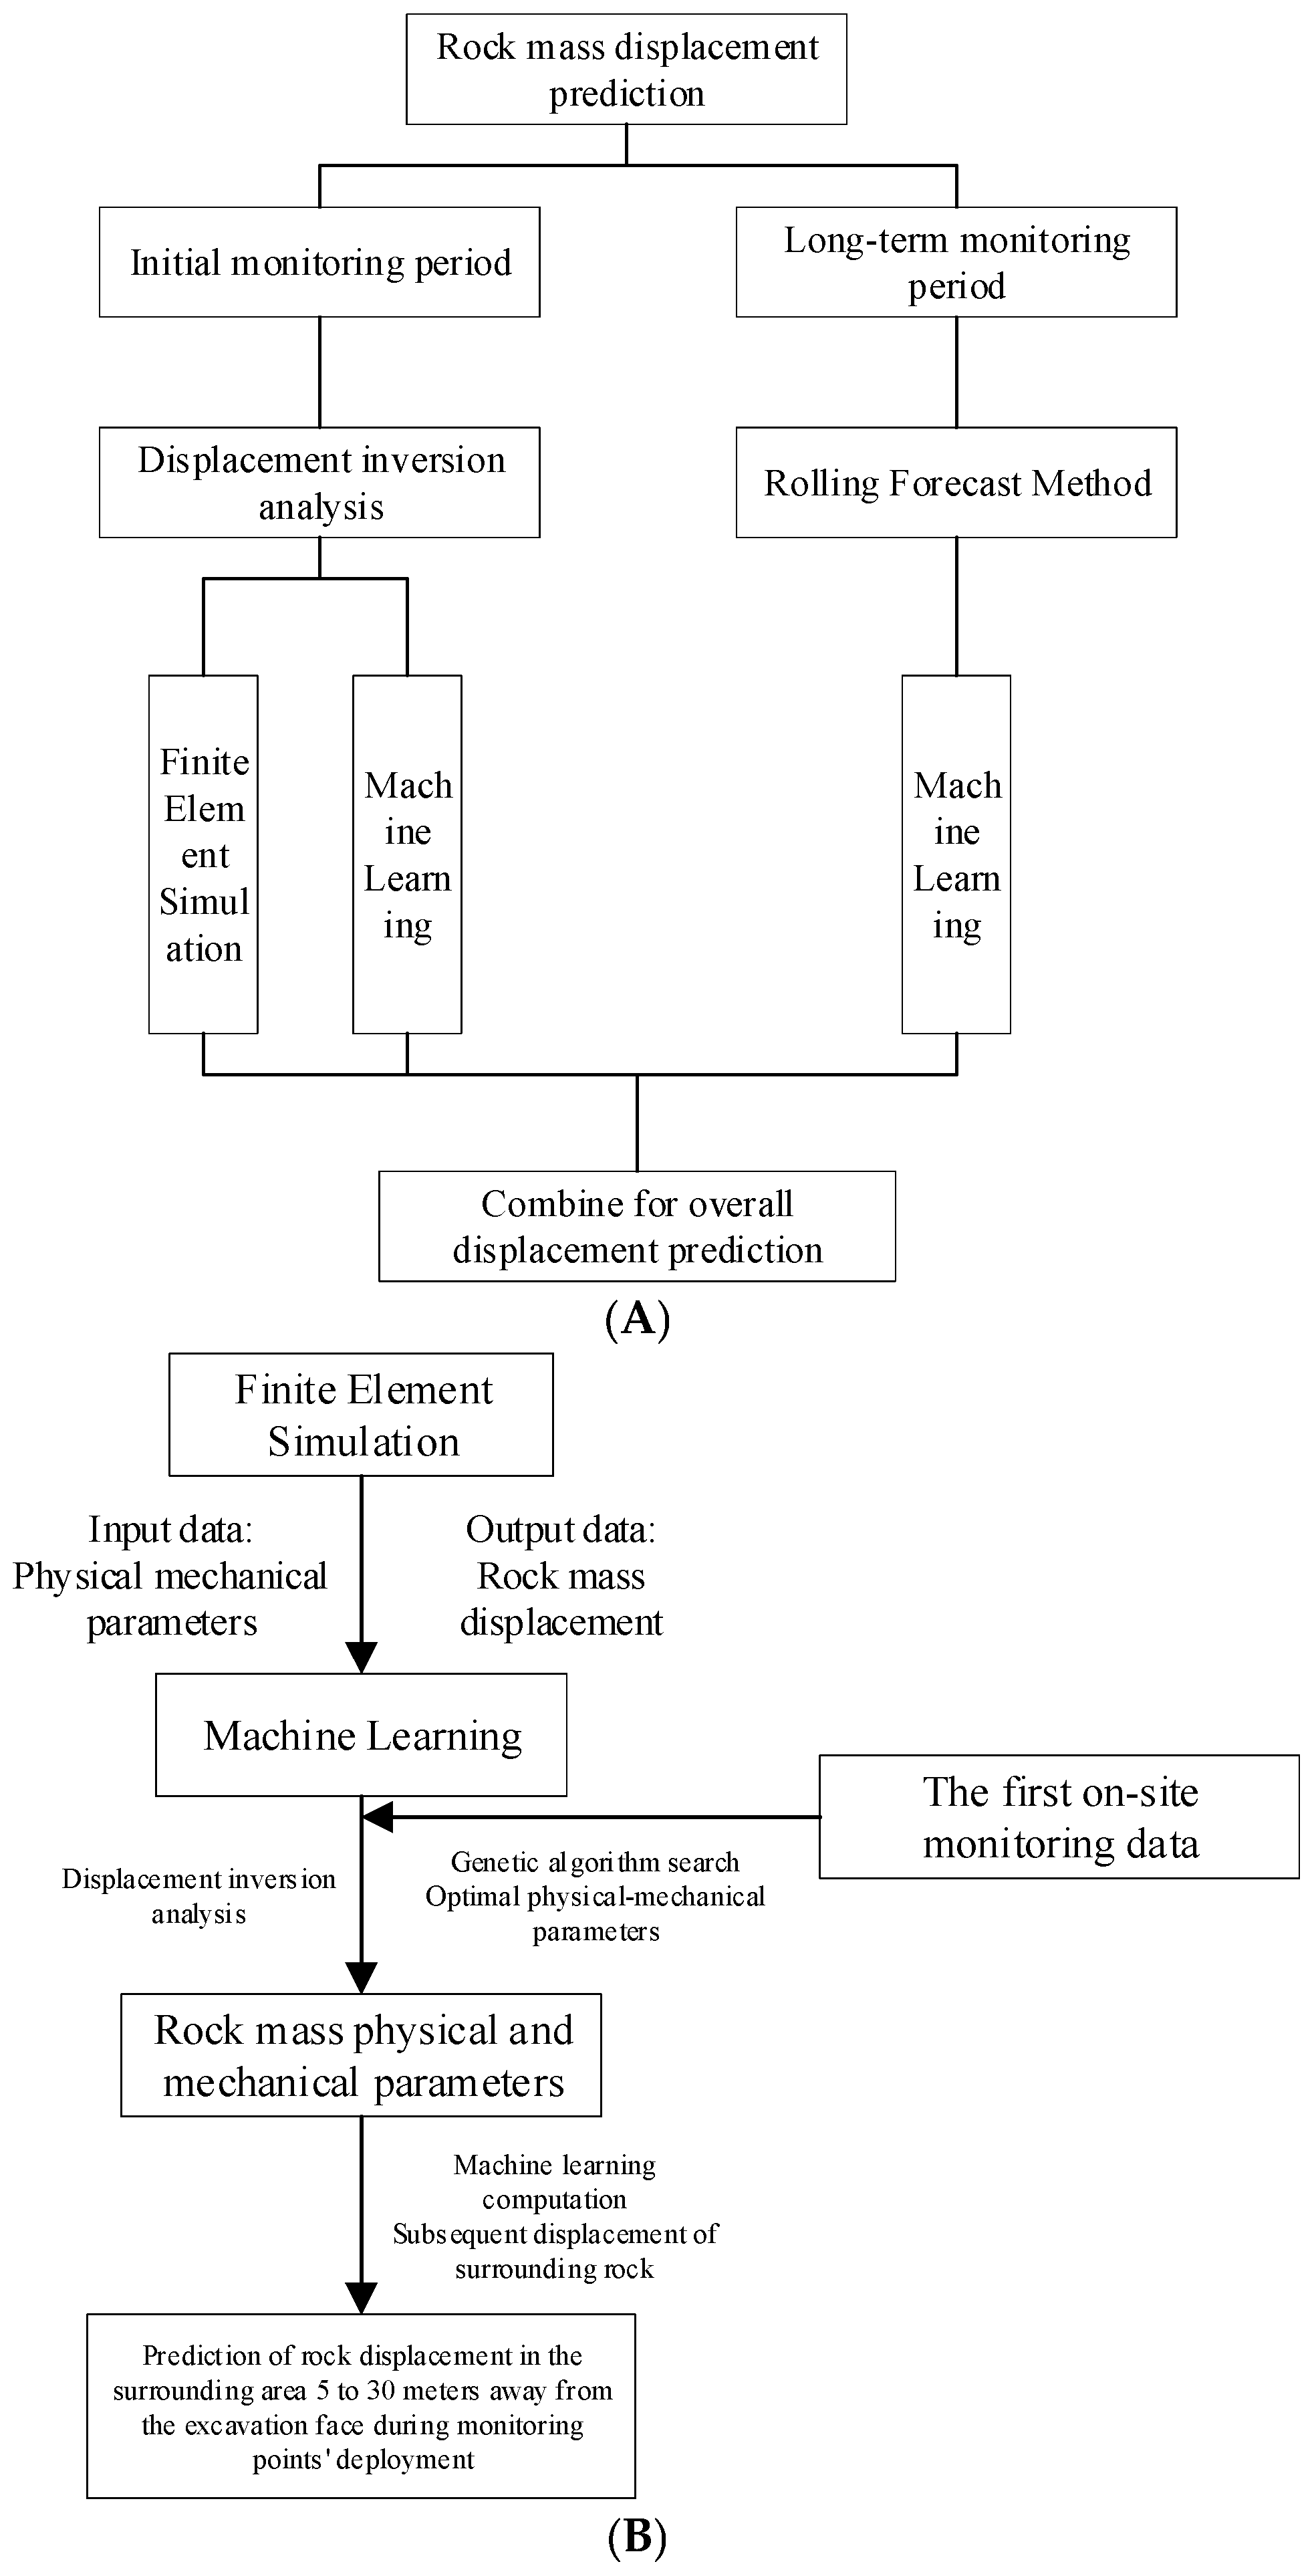
The use of multi-source information for risk assessment is emerging as a promising approach. For example, in the intelligent prediction of surrounding rock deformation and dynamic risk assessment, combining initial surrounding rock displacement monitoring data with rolling prediction methods based on artificial intelligence algorithms can effectively address the issue of insufficient training samples for machine learning algorithms such as artificial neural networks (ANNs), support vector regression (SVR), and Gaussian process regression (GPR) [
34]. The corresponding workflow is illustrated in
Figure 9.
This approach not only enhances the accuracy of risk prediction but also provides a robust framework for decision-making in complex underground engineering projects.
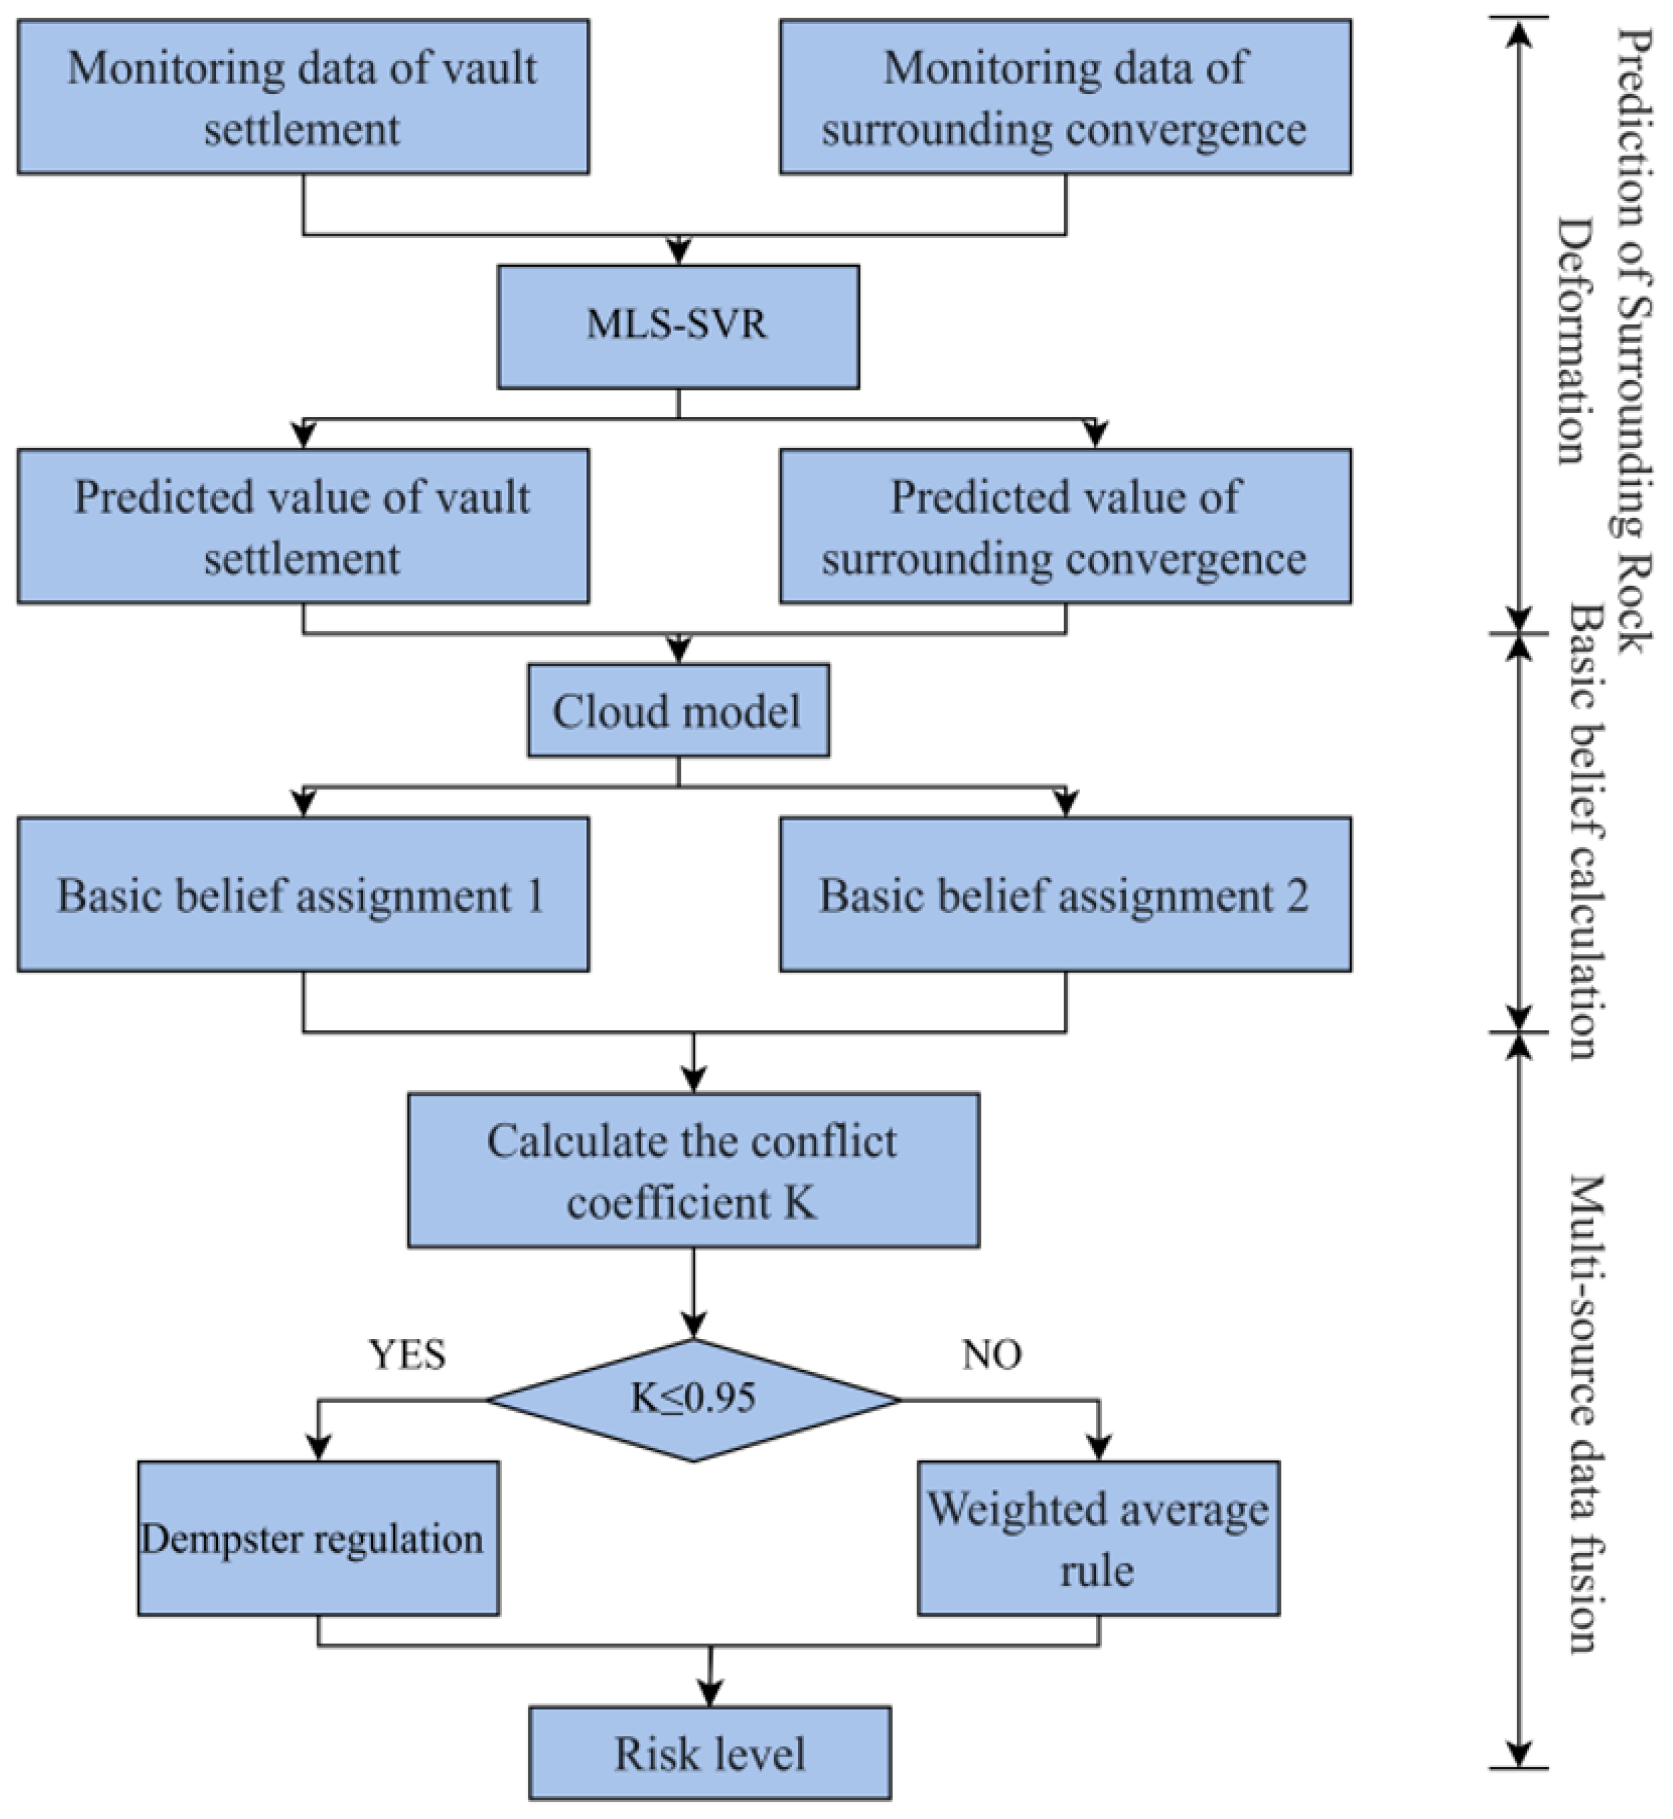
Given that deformation of the surrounding rock intuitively reflects its stability and the rationality of tunnel support measures, this study uses deformation prediction results as a basis for dynamic assessment of tunnel collapse risks. This approach enhances the proactivity and dynamic nature of risk assessment, providing constructors with ample response time to implement risk control measures.
This method enables decision-makers to fully grasp the actual conditions of the construction site, preliminarily identify the main risk factors causing collapses, and implement targeted measures. This ensures precise policy implementation, significantly improving construction efficiency and enhancing the tunnel project’s ability to resist collapse risks.
The proposed dynamic assessment model for collapse risk, based on surrounding rock deformation prediction, is illustrated in
Figure 10.
5. Discussion
Currently, researchers construct a resilience evaluation system from five dimensions: environmental resilience, social resilience, economic resilience, infrastructure resilience, and organizational resilience. At the same time, combined with the bearing capacity, deformation, etc., of underground structures as system robustness evaluation indicators, they have carried out beneficial discussions on the resilience evaluation system of underground spaces. Construction requirements and restoration countermeasures have been proposed under specific circumstances. Although some achievements have been made, the overall research is still in the exploratory stage. In particular, there is still no evaluation system for assessing the resilience of underground engineering collapse risk disasters. Therefore, in order to reduce the risk losses of underground engineering collapse disasters and improve the level of resilience evaluation of underground engineering disaster risks, this paper takes the collapse disasters during the construction period of tunnel engineering as an entry point. Based on the analysis of the influencing factors of underground engineering resilience and the sorting out of the resilience evaluation index system for underground engineering disaster risks, it proposes a resilience evaluation system for underground engineering collapse disaster risks and the direction of improvement, to provide new ideas for the resilience construction of underground engineering and the prevention of disaster risks.


 ,
, 


