Article

Enhancing Electrical Conductivity of Commercially Pure Aluminium via Deep Cryogenic Treatment and Subsequent Annealing

by
Dhandapani Chirenjeevi Narashimhan
and
Arul Sanjivi
*
Department of Mechanical Engineering, Amrita School of Engineering, Amrita Vishwa Vidyapeetham, Coimbatore 641112, India
*
Author to whom correspondence should be addressed.
Eng 2025, 6(11), 328; https://doi.org/10.3390/eng6110328
Submission received: 9 October 2025 / Revised: 1 November 2025 / Accepted: 11 November 2025 / Published: 17 November 2025
(This article belongs to the Topic Surface Engineering and Micro Additive Manufacturing)

Abstract

Aluminium is widely used in electrical and structural applications; however, its lower electrical conductivity compared to copper limits broader adoption in high-performance systems. Deep cryogenic treatment (DCT) and DCT followed by annealing (DCT+A) have recently appeared as promising techniques to refine microstructures and enhance functional properties in metallic materials. In this study, commercially pure aluminium was subjected to DCT and DCT+A with soaking hours of 6, 12, 18, and 24 at −196 °C. The results revealed that both DCT-12 and DCT+A-12 treatments produced significant grain refinement. XRD confirmed the smallest crystallite size (32.39 nm) and maximum dislocation density (9.53 × 10¹⁴ m−2) in DCT-12, while extended soaking of 18 h facilitated recovery, yielding larger crystallite sizes (52.82 nm), reduced density, and microstrain. EBSD analysis showed texture strengthening in the (100) and (111) planes and a notable transition from HAGB to LAGB fractions. TEM and Raman analysis further confirmed defect recovery and phonon coherence at longer soaking hours. Electrical conductivity and mobility were enhanced across all treated specimens, with peak values seen for DCT-18 (4.91 × 10⁷ S/m, 50.8 cm2/V·s) and DCT+A-18 (4.52 × 10⁷ S/m, 46.9 cm2/V·s). These findings confirm that 18 h of soaking is optimal, particularly when combined with annealing, and yields a stable microstructure, improved electron transport, and superior conductivity.

1. Introduction

Globally, approximately 30–35% of aluminium is produced through recycling processes, owing to its high recyclability [1]. Aluminium and its alloys are widely used in automotive, aircraft, defence sector, and electrical applications due to their high strength-to-weight ratio, low density, high formability, high corrosion resistance, low cost, and for their electrical properties [2]. Despite these advantages, aluminium inherently possesses lower strength and electrical conductivity than copper, restricting its broader use in high-efficiency electrical systems. Such limitations can be addressed through microstructural engineering approaches, like severe plastic deformation (SPD), which includes various process like equal channel angular pressing (ECAP), high-pressure torsion (HPT), and accumulative roll bonding (ARB) [3] and primarily refines grains through intense plastic strain and dislocation generation at elevated or ambient temperatures, and creates ultrafine-grained or even nanocrystalline structures by generating dense dislocation networks and subgrain boundaries [4]. These microstructural transformations lead to remarkable improvements in mechanical strength and hardness; however, they often reduce conductivity [5] and ductility [6]. To address these limitations, thermal treatment provides a more controlled approach to modifying the microstructure, electrical, and other functional properties of advanced materials such as aluminium, copper, and CFRP composites [7], enabling enhanced performance and stability under cryogenic conditions.
DCT (deep cryogenic treatment) is a thermal process that involves the cooling of materials to a low temperature [8], typically around –196 °C. Deep cryogenic treatment provides promising results, like refined grain structure, reduced lattice defects, improved corrosion resistance [9], and enhances electron mobility [10] through improved phonon coherence [6,11].
DCT influences the crystallographic texture of AA1050. Comparing room-temperature processing and cryogenic processing, texture development is seen and results in a change in anisotropic properties [12].
In recent studies on pure aluminium at cryogenic temperatures (−196 °C), a significant number of grains were caused to rotate into the (111) plane, forming a strong (111) texture [13]. This microstructural change is a key reason for the improvement of the functional properties at low temperatures. This suggests that creating a strong (111) plane texture in elongated grains is an effective way to enhance the strength and electrical conductivity of aluminium [14].
Pure aluminium undergoes a superconducting transition at approximately −272 °C, resulting in a state of zero electrical resistance and exceptional conductivity [11]. High strength and good electrical conductivity are often contradictory properties in metallic materials, but with the help of cryogenic dual-direction torsion (CDDT) on aluminium wires, they show better strength and conductivity [15]. CDDT induce multiple gradient structures (MGS) in dislocation density, grain size, precipitate size, and precipitate volume fraction. The formation of nanoscale precipitates is observed, and they contribute to strength and conductivity [14].
At cryogenic temperatures, the electrical conductivity of aluminium increases due to minimised electron–phonon scattering, and conductivity is placed behind only beryllium and lithium. At low temperatures, embrittlement is avoided due to the FCC structure of aluminium, which makes it a good conductor [16].
Hyper-aluminium (Hyper-Al) is an ultra-pure form of aluminium that works well for hydrogen-cooled aeroplane motors. At −250 °C, it matches the conductivity of copper, has half the weight, and produces twice the power produced by a copper motor [17].
Aluminium also plays a crucial role in minimising radiative heat transfer and has low emissivity [18] at cryogenic temperatures which makes it a material for radiation shields and reflective coatings in spacecrafts, improving insulation efficiency and thermal stability in longer missions. Similarly, it offers high thermal conductivity at cryogenic temperatures, making it suitable for honeycomb structure face sheets [19].
When a post annealing process is carried out after deep cryogenic treatment (DCT), it reduces the internal stresses and a slight reduction in dislocation density is seen due to recovery, which may cause grain coarsening [20,21].
Recent studies on DCT of aluminium alloys focused largely on microstructural stabilisation, residual-stress relief, and mechanical properties which, through hybrid SPD–cryogenic [22] and annealing approaches, reported a moderate conductivity gain and partial texture stabilisation [23].
The electrical conductivity of copper is better than aluminium, but it has high density and fabricating in lightweight electrical systems requires high precision. However, aluminium is lighter, cheaper, and its conductivity per unit weight is good, which makes it a better choice when weight and cost are critical.
Earlier investigations on aluminium under cryogenic treatment were often restricted to a fixed soaking hour, and a systematic evaluation of multiple cryogenic soaking durations in commercially pure aluminium, combined with post-annealing recovery, remains largely unreported.
This study systematically investigates multiple soaking hours (6, 12, 18, and 24) under both DCT and DCT+A treatments and helps in proving a clear correlation between soaking hours, microstructural refinement, and electrical conductivity for lightweight applications.

2. Materials and Methods

The studies on the effect of cryogenic treatment on pure aluminium are limited compared to pure copper and hence Aluminium AA 1100 (99.3%) is chosen for this study. AA1100 with dimensions of 300 × 300 mm × 6 mm plate was machined per ASTM standards as needed for the analysis.
In this work, two cryogenic treatment routes were employed: (1) deep cryogenic treatment (DCT) and (2) deep cryogenic treatment followed by annealing treatment (DCT+A). The complete process flow of the study is illustrated in Figure 1.

2.1. Specimen Preparation

Grain Size: Specimen preparation for microstructural characterisation of pure aluminium followed the ASTM E3 [24] standards. Using wire electrical discharge machining (WEDM), specimens were made to a size of 10 mm × 6 mm × 5 mm.
Machined specimens are ground with the help of an emery sheet in the following order: (#240, #320, #600, #800, #1200, and #2000) under water lubrication and followed by diamond suspension (3 µm), colloidal silica (0.05 µm–0.25 µm), and finally etched.
Crystallite size and dislocation density: Specimens are sliced to a thickness of 2 mm and 10 mm × 6 mm, using a WEDM machine.
Grain boundary and texture analysis: Specimens are prepared as per ASTM E1558 [25]. Specimens are sliced to a thickness of 2 mm and 10 mm × 6 mm, using a WEDM machine, and then specimens are mechanically ground with an emery sheet ranging from 240 to 2000 grit. Electropolishing was performed using Struer’s electropolishing machine with the help of an A2 electrolyte solution which holds 25% of perchloric acid and 75% of ethanol. This is operated at a constant voltage of 20 V, and polishing is conducted for 30 s.
D-Spacing: Specimens are sliced to a thickness of 0.1 mm and 3 mm diameter, using a WEDM. Specimens were ion milled with the help of the precision ion polishing system (PIPS).
Vibrational Intensity: Specimens were machined using WEDM to a dimension of 8 mm × 6 mm in diameter and 0.1 mm thickness.
Electron mobility and conductivity: The aluminium is machined with the help of WEDM for a dimension of 8 mm × 6 mm and a thickness of 0.1 mm.

2.2. Deep Cryogenic Treatment (DCT)

Deep cryogenic treatment (DCT) was conducted using liquid nitrogen (LN2) stored in a thermally insulated vacuum flask, ensuring a steady temperature of −196 °C. The pure aluminium specimens were subjected to soaking hours of 6, 12, 18, and 24 h to investigate the effect of cryogenic treatment.

2.3. Deep Cryogenic Treatment + Annealing Treatment (DCT+A)

Following Deep cryogenic treatment (DCT), the specimens were subjected to annealing treatment at 150 °C for 15 min [26] to stabilise the cryogenically refined structure and enhance functional properties and dimensional stability by relieving internal stresses without sacrificing the benefits gained from cryogenic treatment. Specimens are brought to ambient temperature prior to testing. Specimen classification is given in Table 1.

2.4. Metallographic Analysis

The microstructures were examined using an optical microscope, and quantitative grain size and grain count analysis was conducted with MIPAR software (Version 5.12) [27] as per ASTM E1382 [28] standards, with the help of the aluminium recipe module.

2.5. Quantitative Assessment of Crystallite Size, Dislocation Density and Microstrain

The diffraction patterns were recorded using a Bruker D8 Advance diffractometer (Bruker Corporation, Billerica, MA, USA) with Cu Kα radiation (λ = 1.5406 Å) source and used at a voltage of 40 kV and a current of 30 mA. Diffraction patterns were recorded from 5° to 90° (2θ), with a step increment of 0.02° and a scan rate of 2° min−1. A single scan was acquired; no statistical average and error bars are not reported in XRD analysis.
Crystallite size (D) is calculated with the help of Scherrer’s equation [29].
D = k λ β cos θ
where:
  • D—crystallite size (nm);
  • k—Scherrer constant (0.94);
  • λ—X-ray wavelength (1.5406 Å);
  • β—full width at half maximum (FWHM) of the peak in radians;
  • θ—Bragg angle in degrees.
The dislocation density ( ρ ) was calculated to evaluate lattice imperfections, using this relation [30].
ρ = 1 D 2
The Stoke–Wilson formula is used to evaluate the microstrain (ε) [31]:
ɛ = β 4 tan θ

2.6. Grain Boundary Characterisation via EBSD: LAGB and HAGB Quantification

Focused Ion Beam–Scanning Electron Microscopy (FIB-SEM JIB-4700F) (JOEL Ltd., Mintaka, Tokyo, Japan) is used to capture EBSD data at a voltage of 20 kV, a working distance of 13 mm, and with a step size of 0.15 µm. The EBSD scan was performed on the RD–TD surface plane of the sheet, with the ND direction corresponding to the through-thickness (6 mm) of the specimen. A single scan was acquired, and no statistical average and error bars are reported for the mrd values. Scanned EBSD data is analysed with the help of ATEX software (Version 5.03) [32] to generate the pole figure intensity maps.
The dark or irregular regions observed in the EBSD maps are attributed to minor surface preparation artefacts and not to actual pores or inclusions; hence, they can be regarded as insignificant and have no measurable effect on the microstructural interpretation.

2.7. TEM Imaging and Selected Area Electron Diffraction (SAED) Analysis

A Transmission Electron Microscope—JEM F200 (JOEL LTD, Mintaka, Tokyo, Japan)— is employed to capture the SAED images. TEM was performed at 200 kV accelerating voltage with a 300 mm camera length. Captured images are analysed with the help of CrysTbox software (Version 1.10) [33] for measuring their d-spacing values.

2.8. Raman Spectroscopy for Vibrational and Structural Analysis

Using a Renishaw Confocal Raman microscope (Renishaw plc, Gloucestershire, UK), spectroscopy was performed with a 532 nm laser with a spectral resolution of 1 cm−1 and a laser power of 10 mW.

2.9. Electrical Conductivity

The four-point probe apparatus is used to measure conductivity and mobility. The ASTM B193 [34] standards are followed for the measurement of the conductivity and mobility of aluminium. Measurements were conducted on the RD–TD surface region of the aluminium sheet.
Electrical conductivity (σ) [35] is calculated from the corresponding resistivity (ρ):
σ = 1 ρ
This relation is used to estimate the electron mobility ( μ ) [35]:
μ = σ n · q
where:
  • μ—electron mobility (cm2/V·s);
  • n—charge carrier concentration for aluminium (1.8 × 1029 m−3);
  • q—electron charge (1.6 × 10⁻¹⁹ C);
  • σ—electrical conductivity (S/m).

3. Results

3.1. Effect of Soaking Hours on Microstructural Evolution

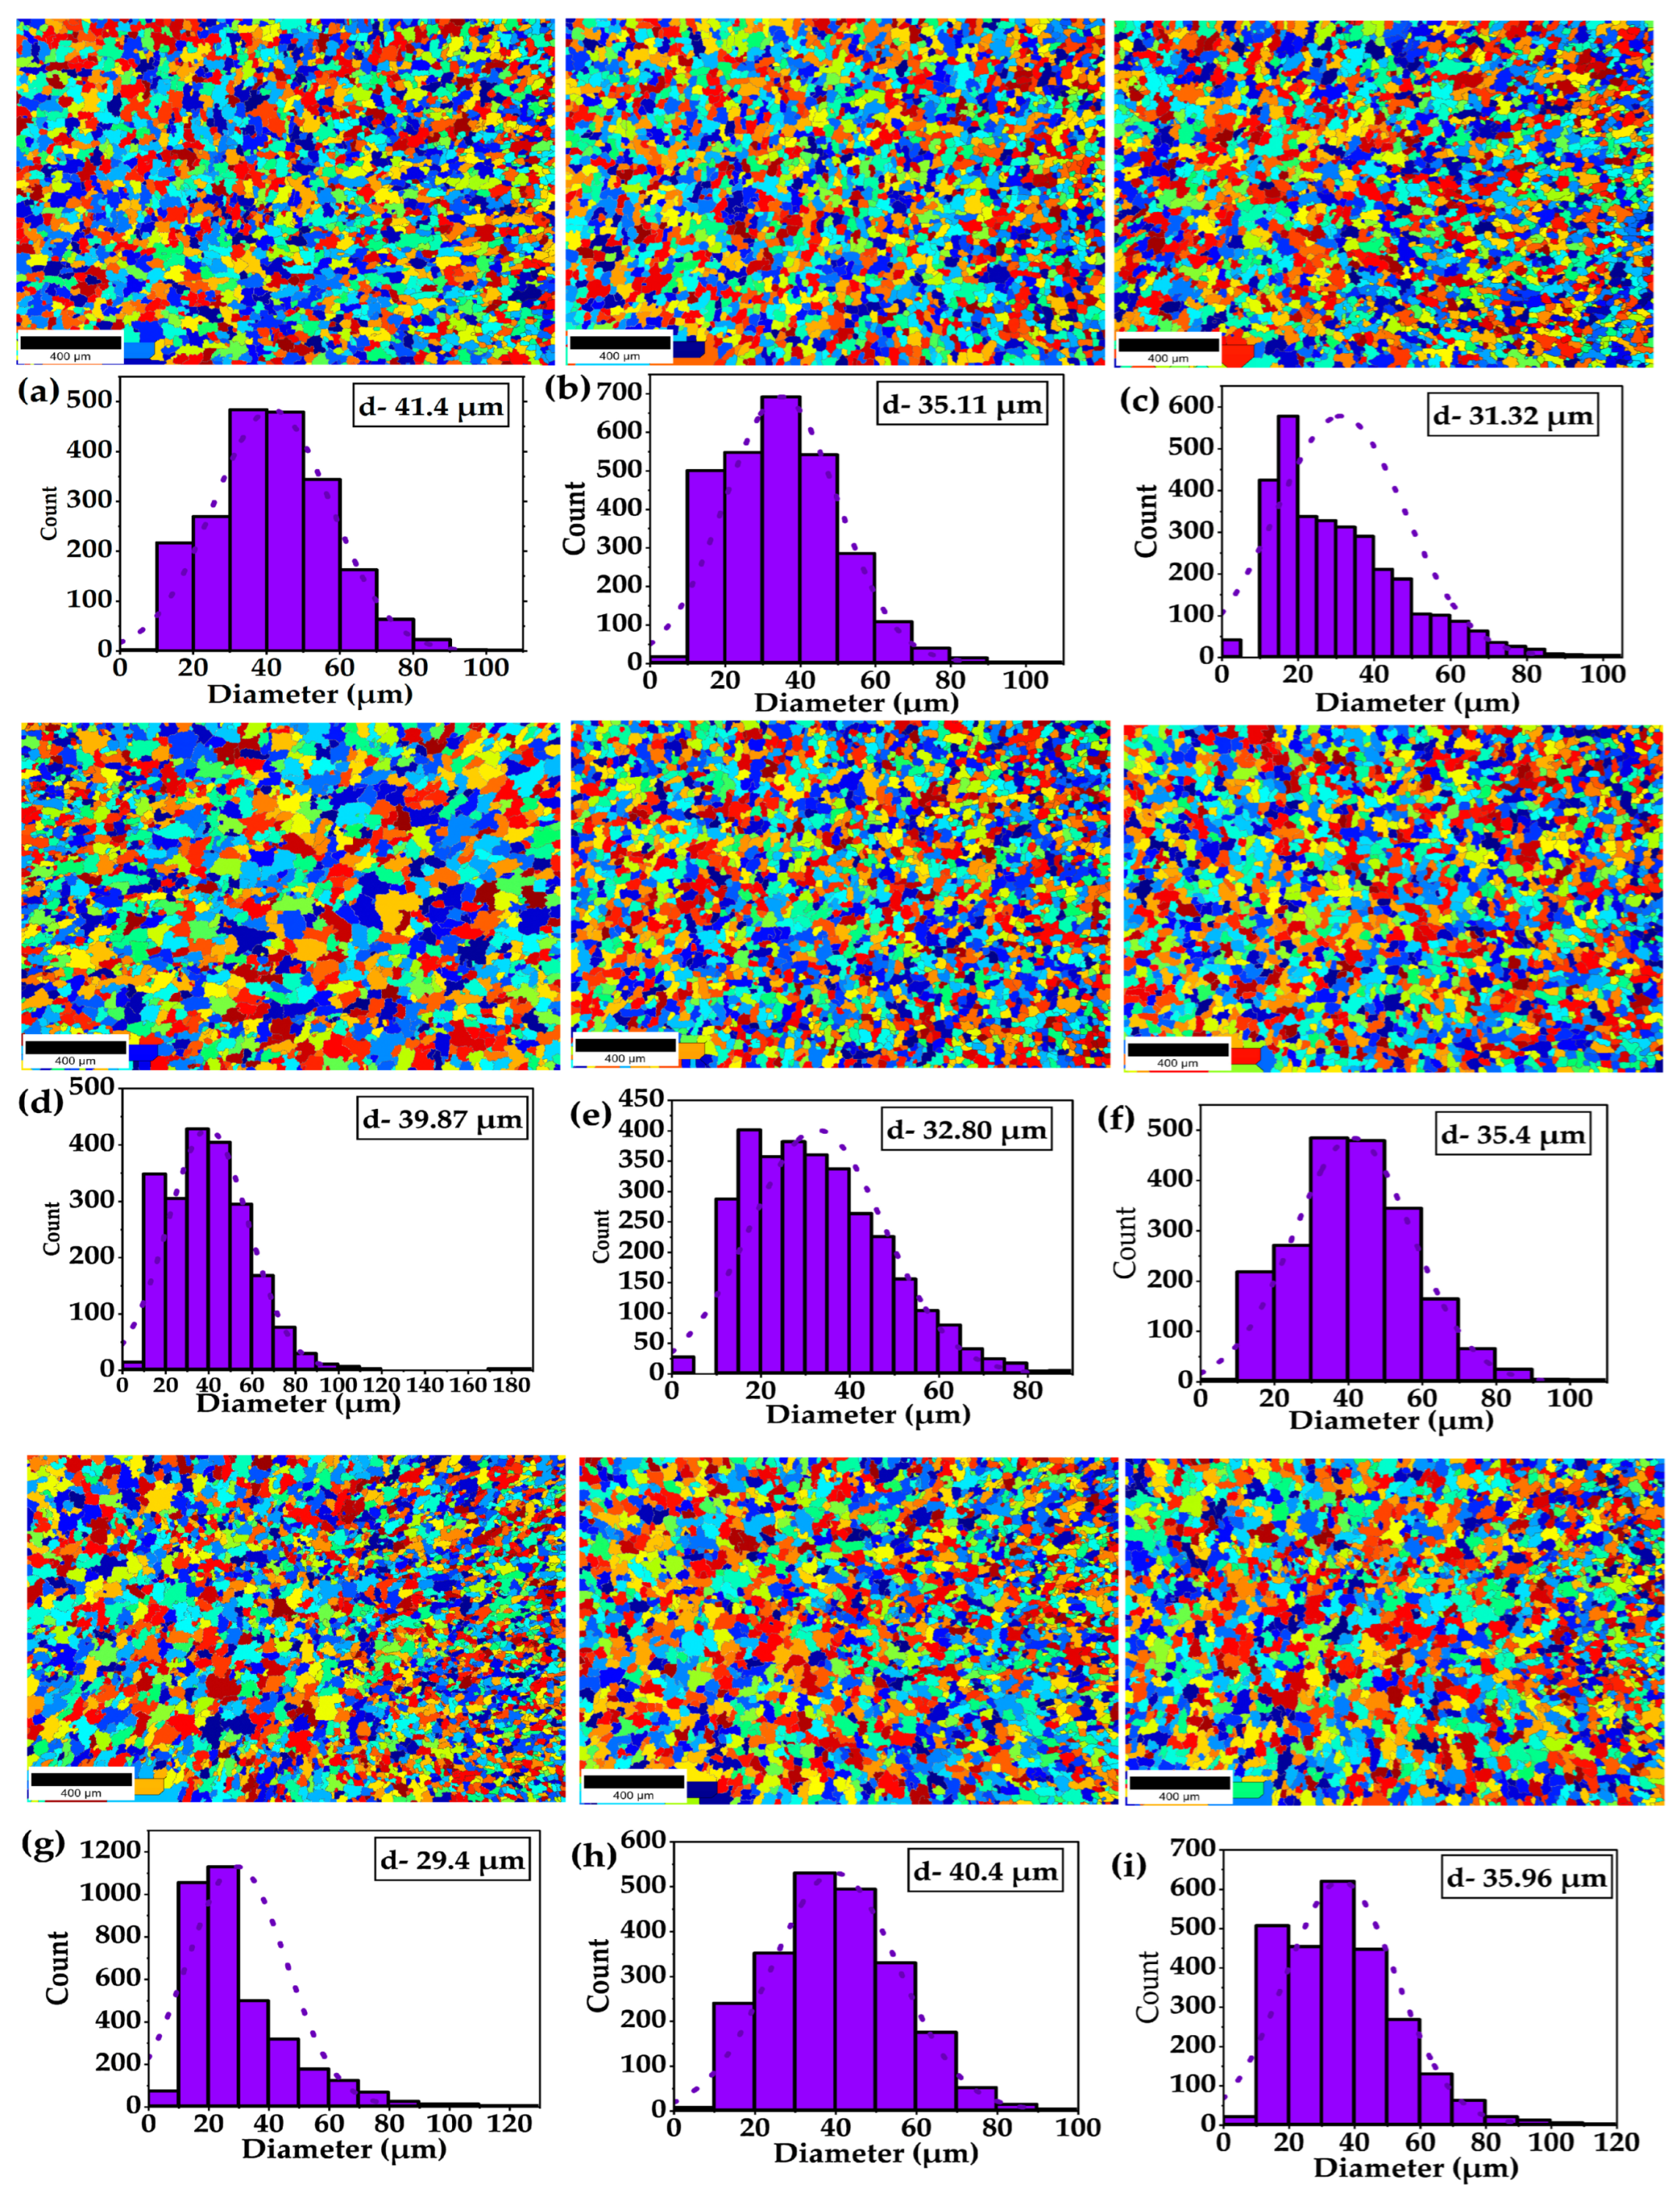
Microstructural images and grain count are illustrated in Figure 2. The average grain size of pure aluminium is found to be 41.4 µm. Following DCT, a reduction in grain size is seen in all soaking hours of DCT. The DCT-6 and DCT-12 specimens showed a grain size of 35.11 µm and 31.32 µm, respectively.
At the 18 h of soaking in DCT, coarsening of grain occurs and grain size reached 39.87 µm, while in DCT-24 grain size reduced to 32.8 µm. A similar trend is seen in DCT+A treatment. Again, a reduction in grain size is seen in all soaking hours of DCT+A treatment. Grain sizes were reduced to 35.4 µm in DCT+A-6 and 29.4 µm in DCT+A-12, with the latter showing the smallest grains among all treatments. The DCT+A-18 showed coarsening grains to 40.4 µm, while DCT+A-24 showed a grain size of 35.96 µm.
Grain refinement occurs till 12 h of soaking in both treatments, due to subgrain formation. Coarsening of grains occurs at 18 h due to recovery and grain boundary migration and interestingly, at 24 h partial refinement reappears due to extended soaking hours and results in reduced grain size.

3.2. XRD-Based Crystallographic Structure and Analysis

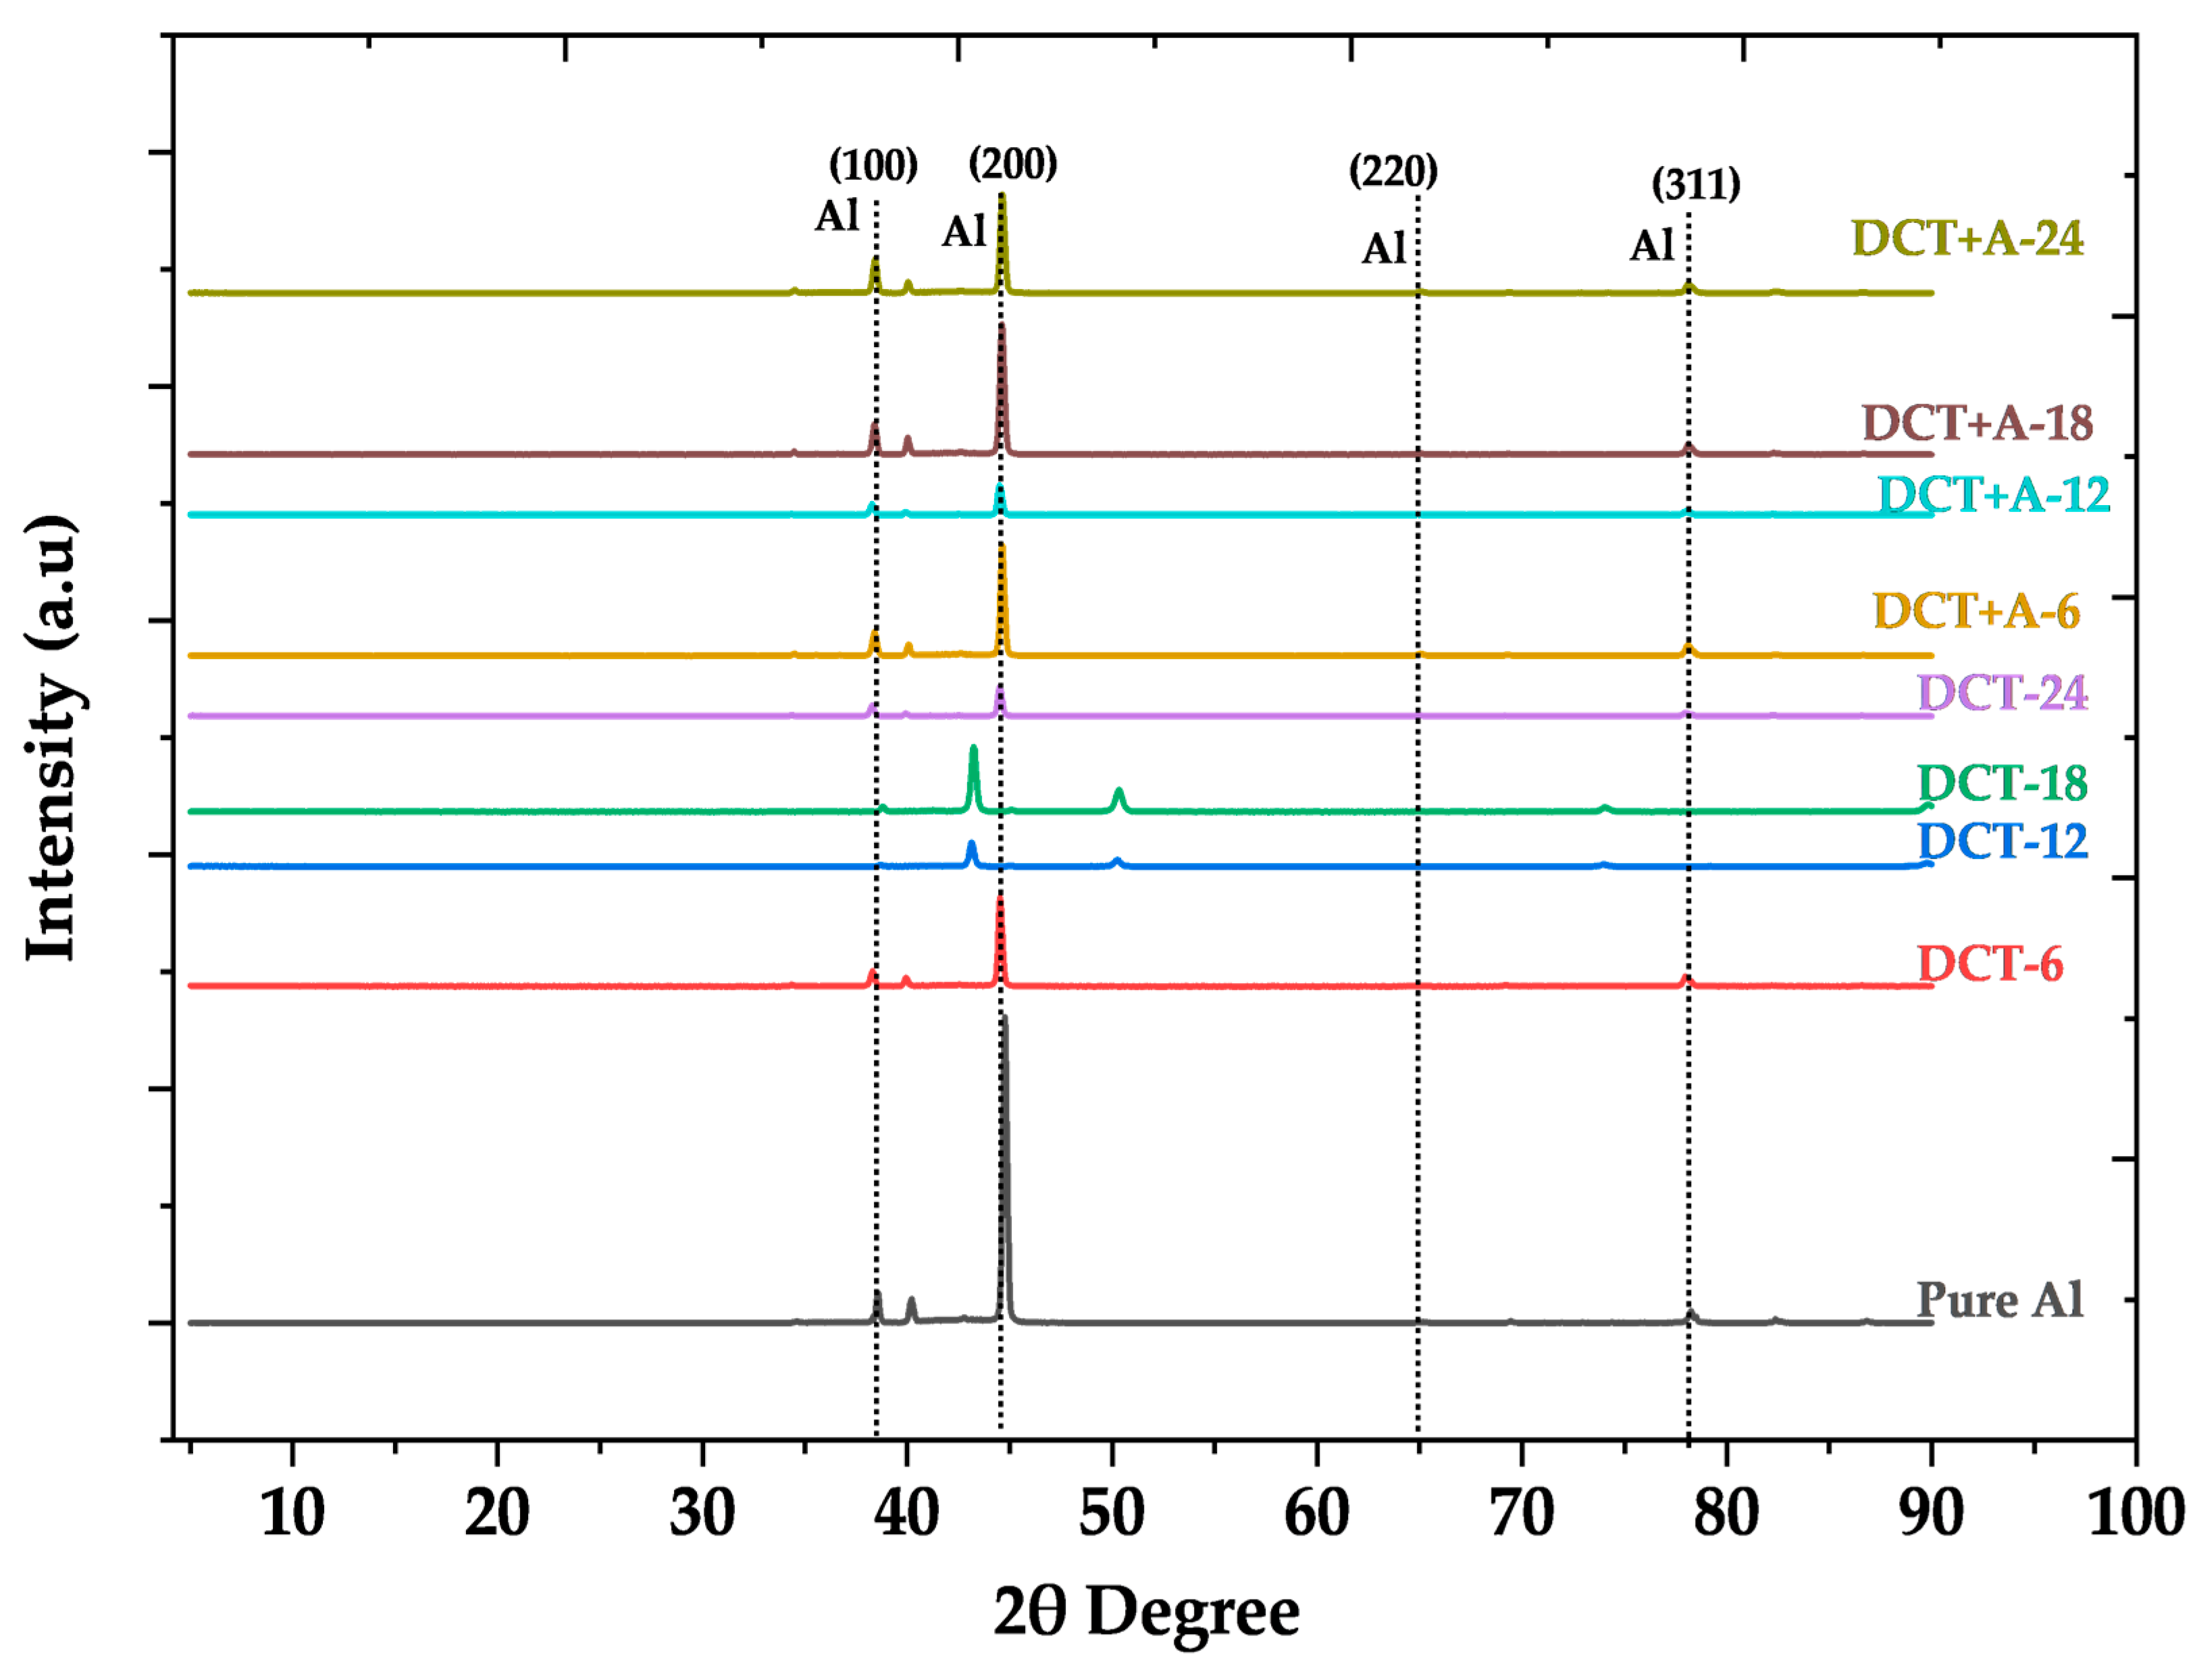
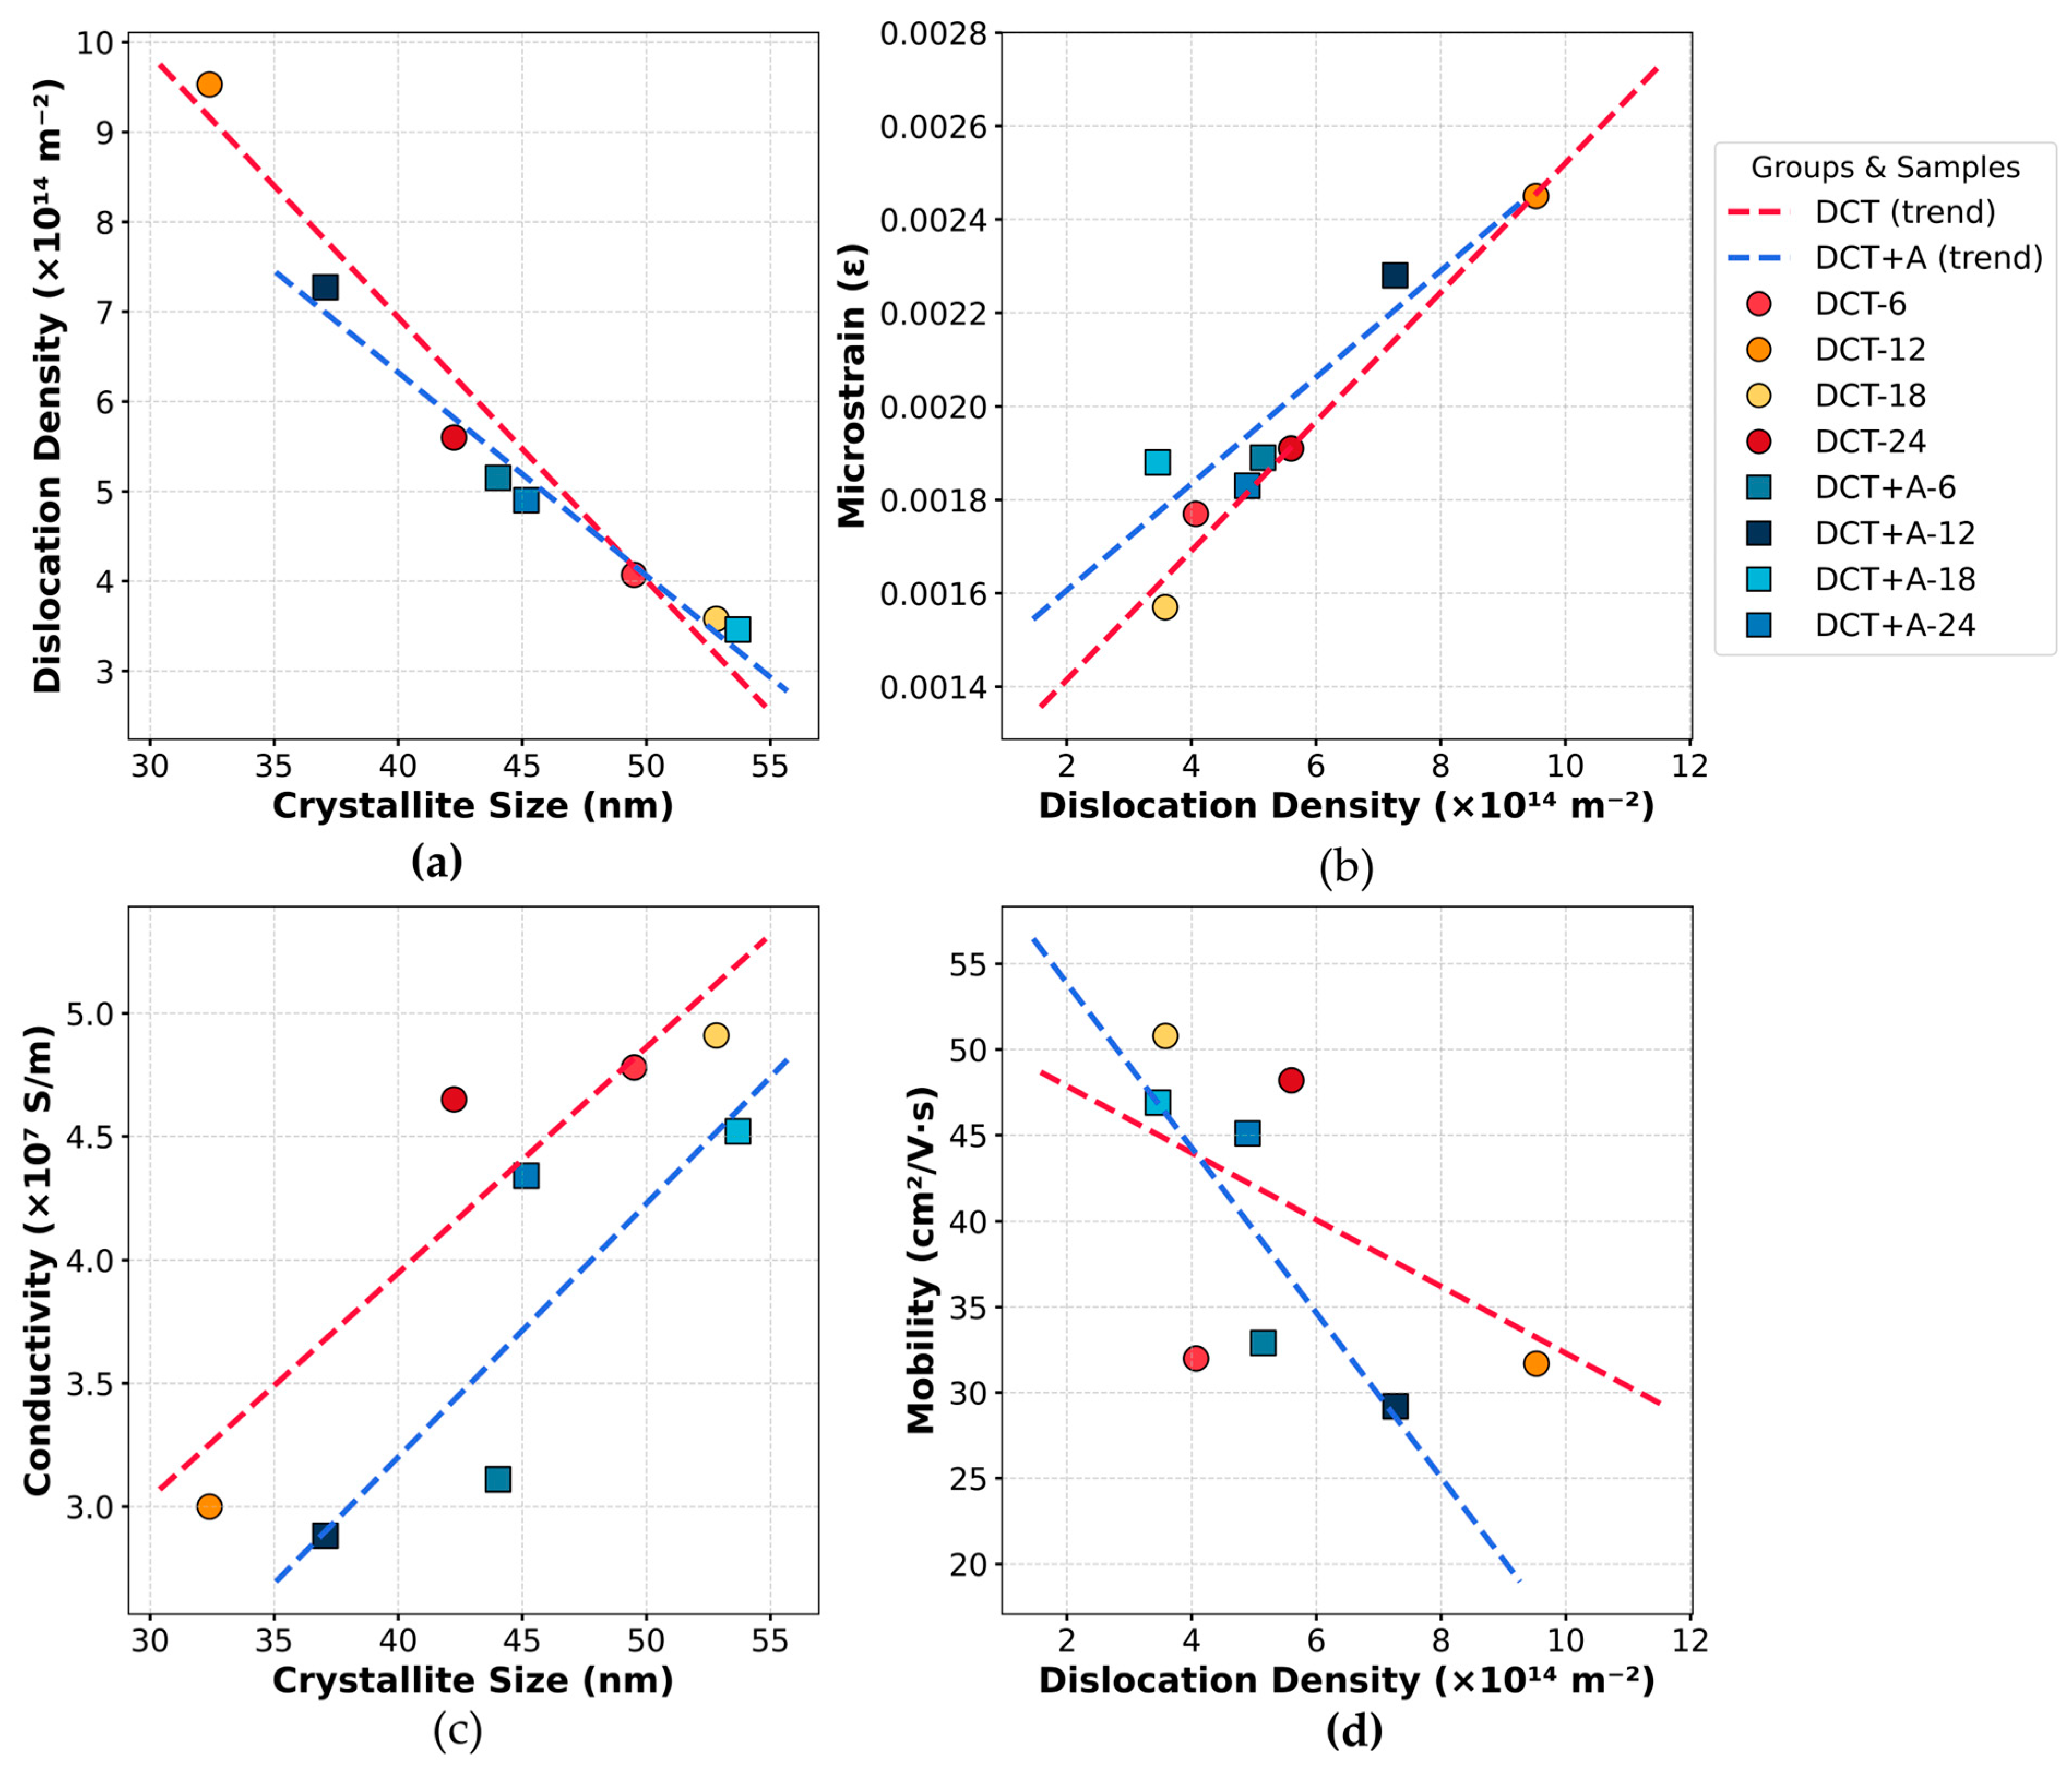
The X-ray diffraction (XRD) line profile of aluminium is illustrated in Figure 3. Crystallite size, dislocation density, and microstrain are plotted and illustrated in Figure 4. X-ray diffraction is widely used for analysing both metallic and cementitious systems [36]. In metals, sharp and well-defined peaks reflect a high degree of crystallinity, and changes in peak intensity, width, or position provide information on crystallite size, defect density, internal strain, and crystallographic texture.
The main diffraction peaks at the (111), (200), (220), and (311) planes correspond well with standard face-centred cubic aluminium patterns as reported in the literature [37,38].
Pure Al displayed an intense peak that correlates with its crystallite size of 49.82 nm, a dislocation density of 4.02 × 10¹⁴ m−2, and a microstrain of 0.00198.
After 12 h of soaking (DCT-12), the diffraction peak intensity reduced, which reflects a reduction in crystallite size by 32.39 nm. This point also has the highest dislocation density of 9.53 × 10¹⁴ m−2 and microstrain of 0.00245. Similarly, a reduction in crystallite size (37.07 nm) and an increase in dislocation density (7.27 × 10¹⁴ m−2), and microstrain (0.00228) is seen in DCT+A-12.
Conversely, at 18 h of soaking in DCT-18, a sharp peak was produced, corresponding to the larger crystallite size of 52.82 nm and the lowest dislocation density of 3.58 × 10¹⁴ m−2. A similar trend was observed in DCT+A-18, where a sharp peak is exhibited and a further coarsening of crystallite size to 53.69 nm, the lowest dislocation density of 3.46 × 10¹⁴ m−2, and microstrain of 0.00188, confirms the recovery of lattice order.
A slight decrease in crystallite size was seen after 24 h of soaking in both DCT and DCT+A treatments (42.25 nm and 45.71 nm, respectively) and a decrease in microstrain is seen in both 0.00191 and 0.00183.
From the results, 12 and 18 h of soaking showed the most significant changes in the structure of aluminium. These two treatments are key stages in the material’s behaviour, so they were selected for further analysis using FIB-SEM-EBSD, TEM, and Raman spectroscopy.

3.3. Grain Boundary Characteristics: LAGB and HAGB Distribution

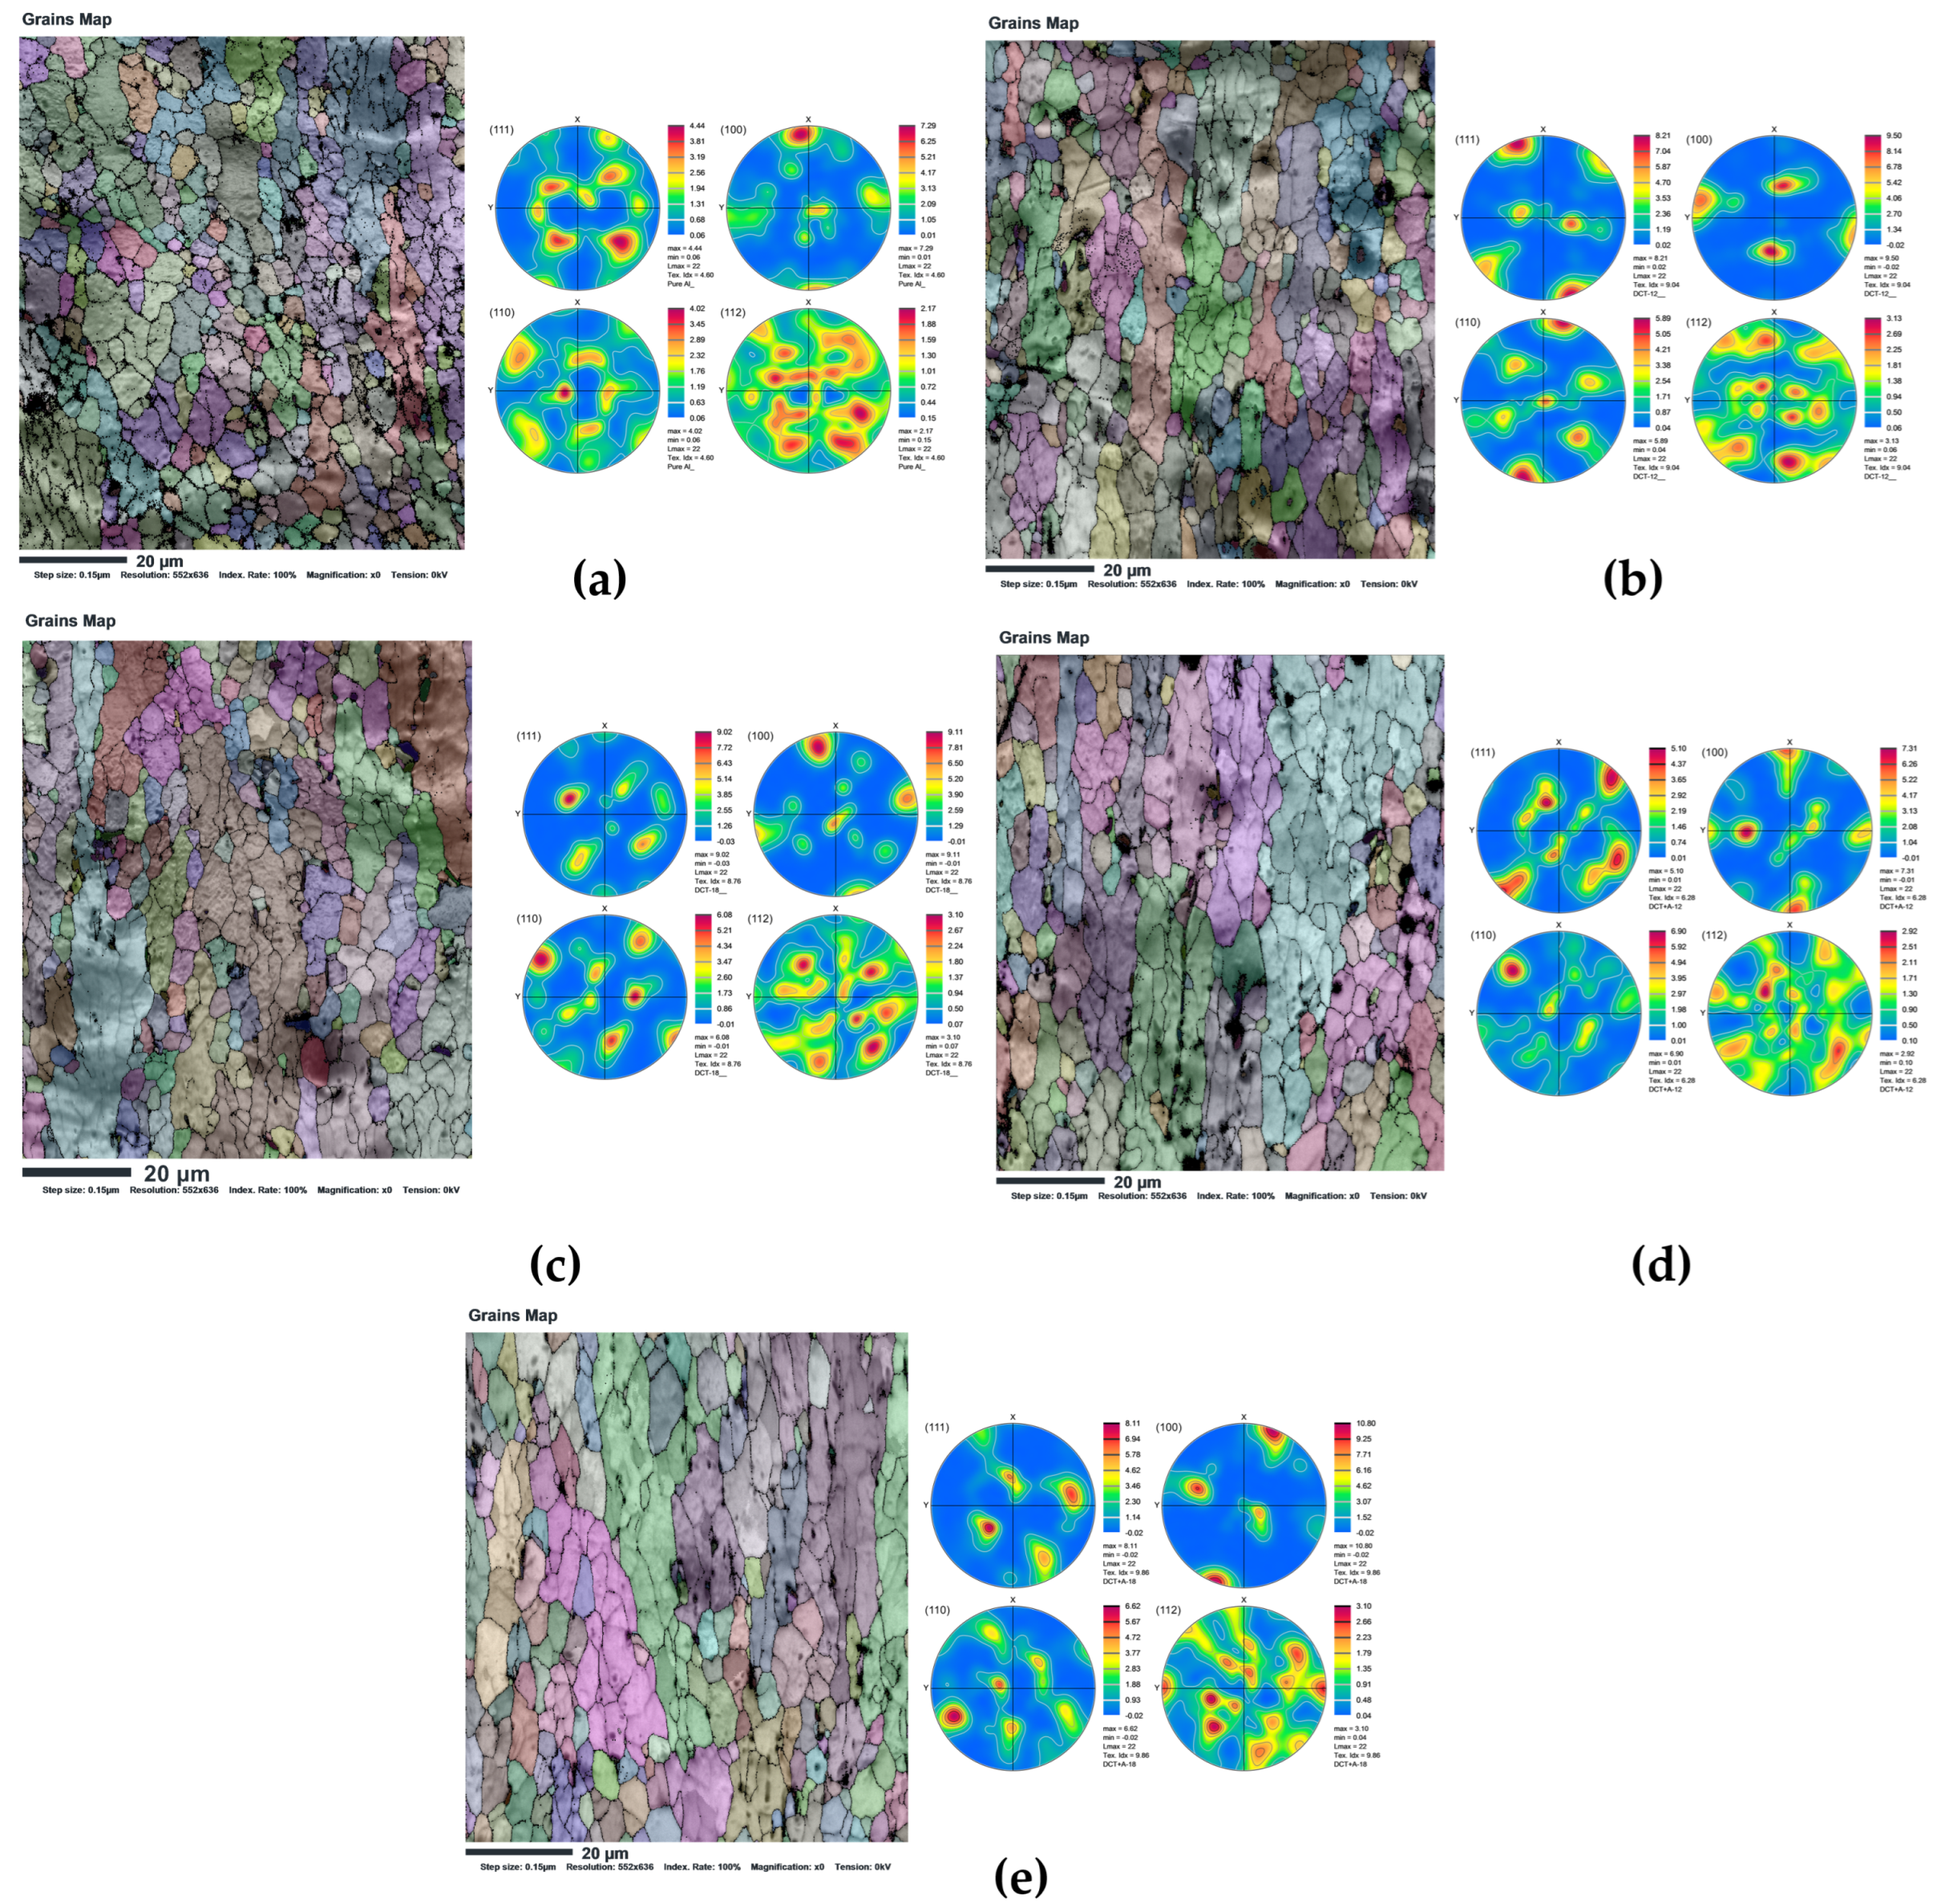
Using FIB-SEM-EBSD, grain boundary features of aluminium are studied. Pole figure (PF) intensity and the distribution of high-angle grain boundaries (HAGBs) and low-angle grain boundaries (LAGBs) are summarised in Table 2. Grain map and PF maps are shown in Figure 5. From the pole figure analysis, significant orientation development is seen along the key crystallographic planes due to DCT and DCT+A treatments.
In pure aluminium, the (100) plane showed an intensity of 7.29 mrd, followed by (111) 4.44 mrd, (110) 4.02 mrd, and (112) 2.17 mrd, suggesting a weakly textured microstructure. The structure is dominated by HAGB (74.3%), showing a strain-free state.
Following DCT, the (100), (111), (110), and (112) plane intensities increased to 8.21 mrd, 9.21 mrd, 5.89 mrd, and 3.13 mrd in DCT-12, reflecting strong orientation. HAGBs decreased to 59.9%, with LAGBs increasing to 40.1%. While in the DCT+A-12 specimen, a slight reduction is seen in (100) 5.1 mrd, (111) 7.31 mrd, (110) 6.9 mrd, and (112) 2.92 mrd, with LAGBs remaining high (45.3%), indicating a partial recovery due to texture relaxation after the annealing process.
In DCT-18, the (111) plane showed a high intensity of 9.02 mrd, confirming a dominant deformation. The (100) and (110) planes have the intensities of 9.11 mrd and 6.08 mrd, respectively, showing activation of multiple slip systems during prolonged DCT. A near-equal of HAGB–LAGB distribution (51.7–48.3%) is achieved due to dislocation rearrangement. In contrast, the DCT+A-18 specimen showed the highest intensity of 10.8 mrd in the (100) plane, along with an elevated intensity of 6.82 mrd in (110) planes. The (111) plane slightly reduces to 8.11 mrd, while the (112) orientation remains unchanged at 3.10 in both DCT-18 and DCT+A-18. The HAGB and LAGB fraction are 54.8% and 45.2%.

3.4. Microstructural Analysis via TEM and SAED Patterns

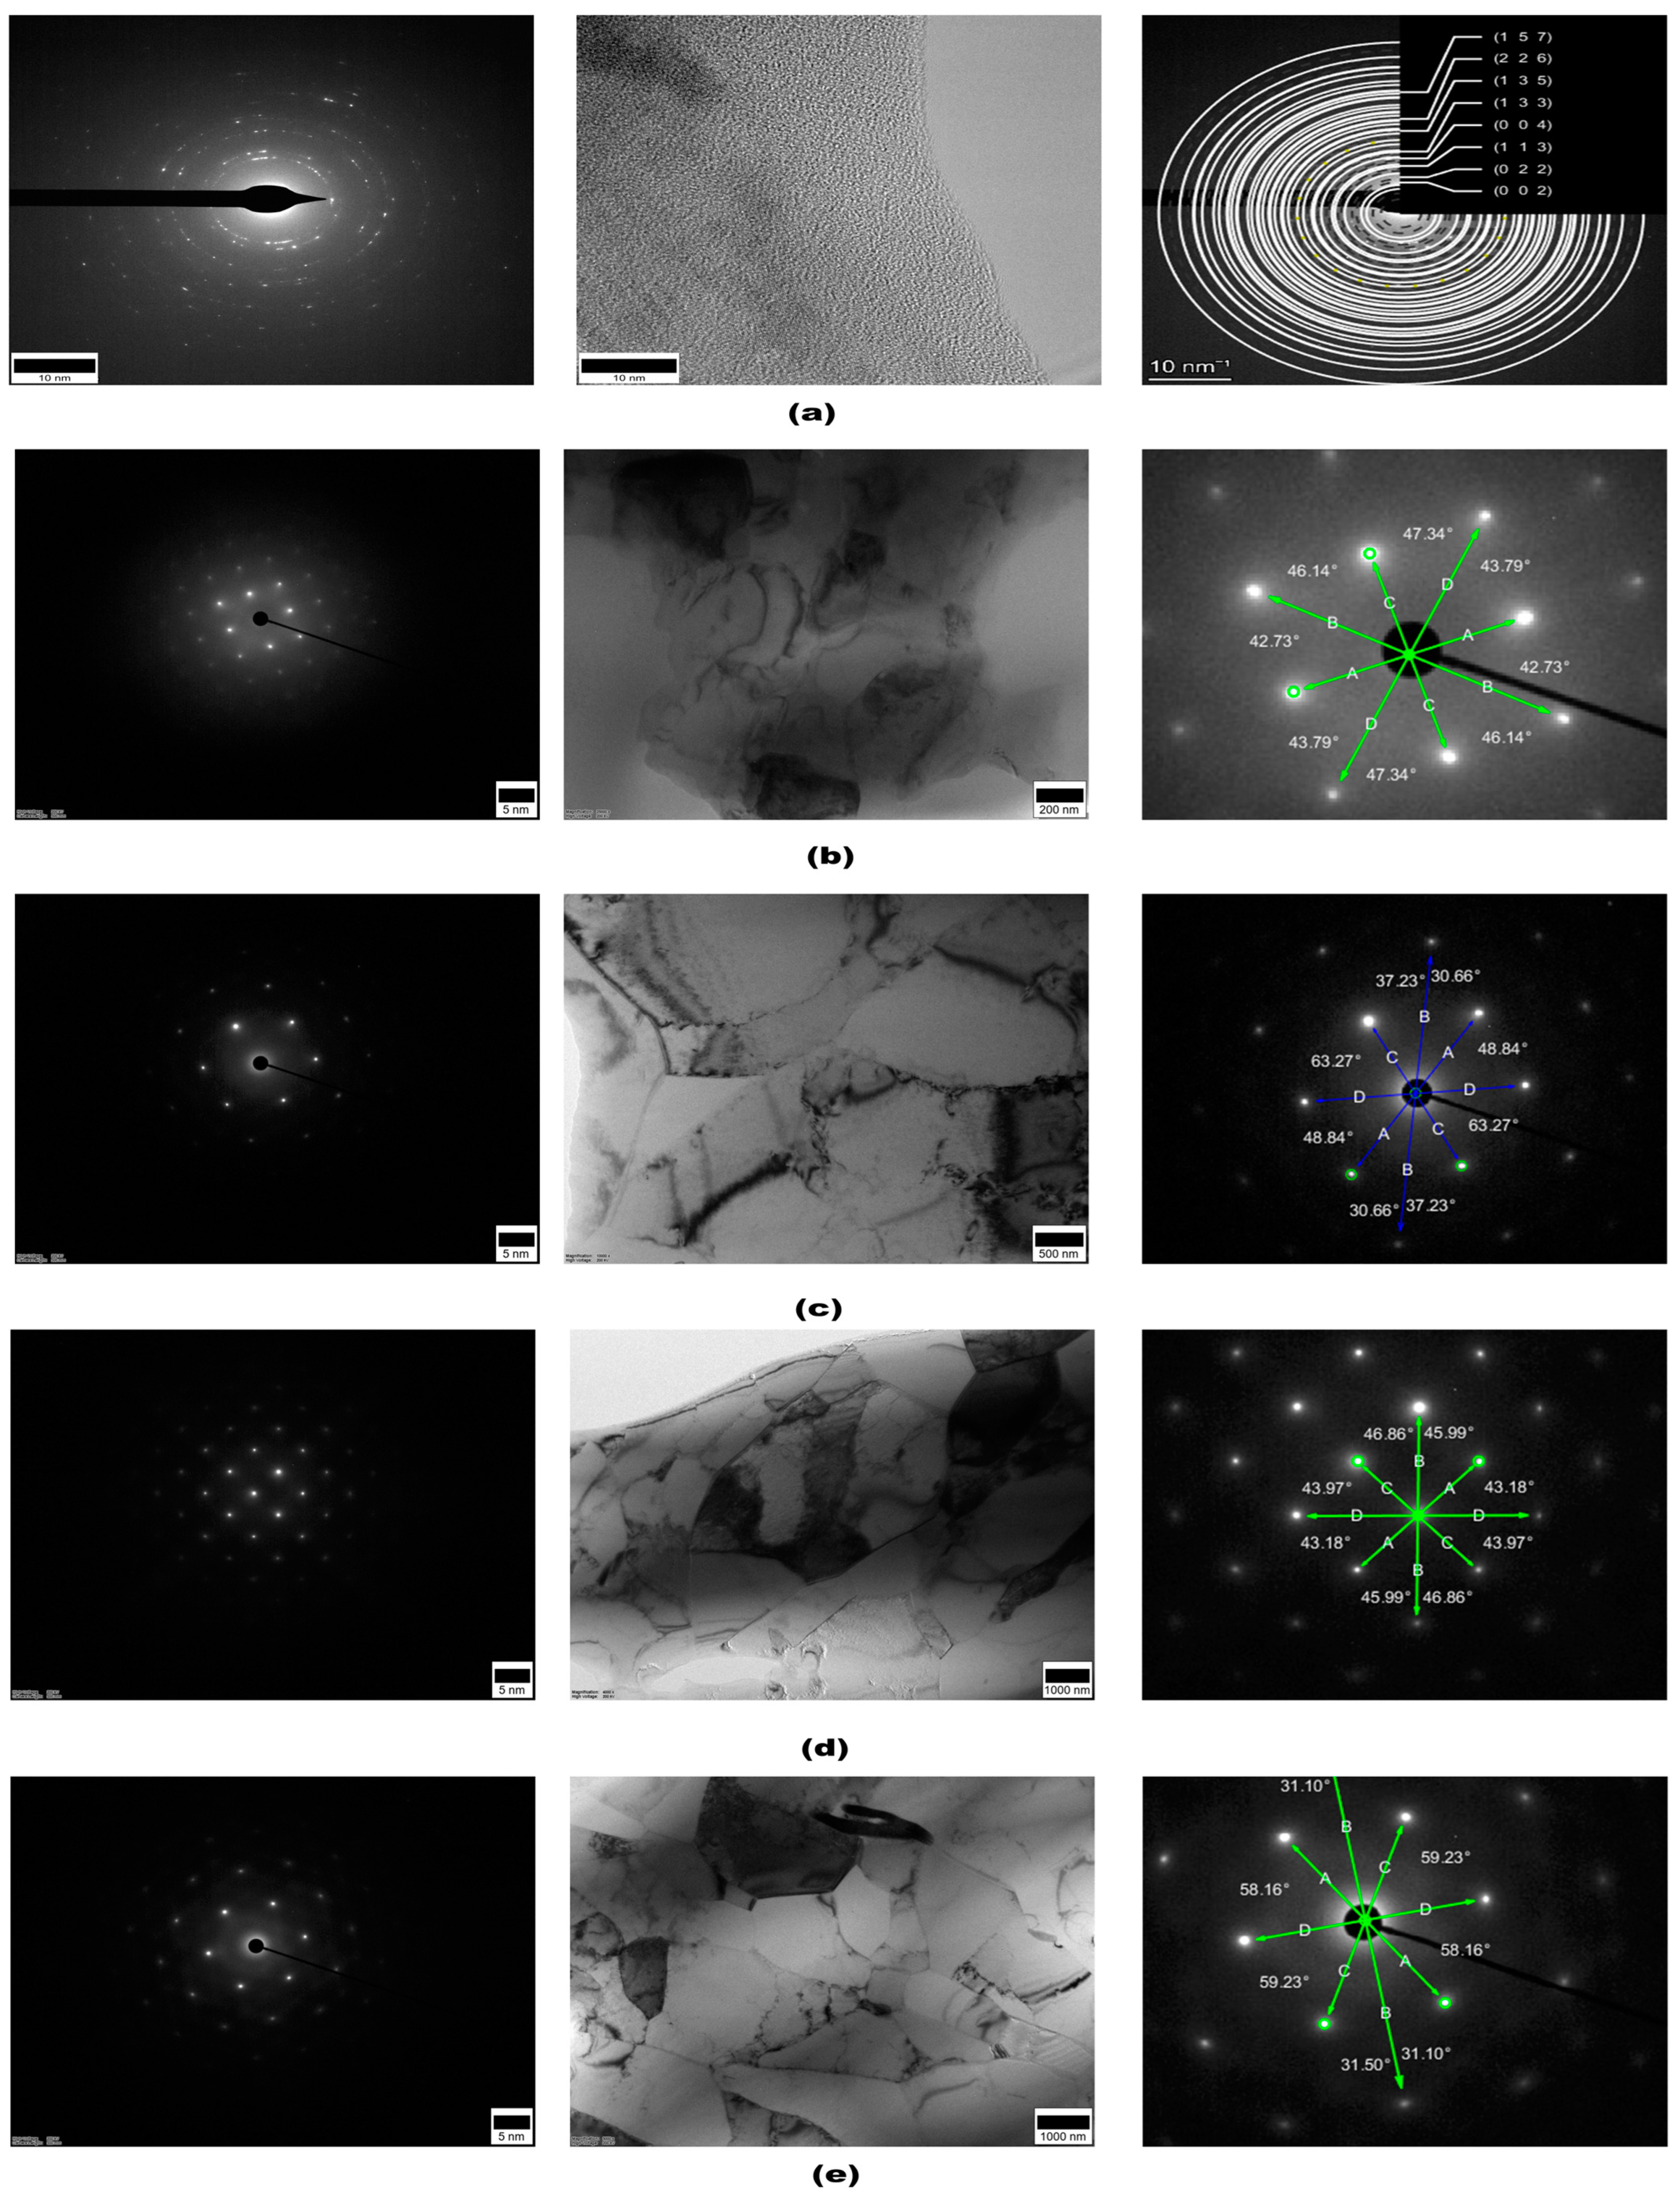
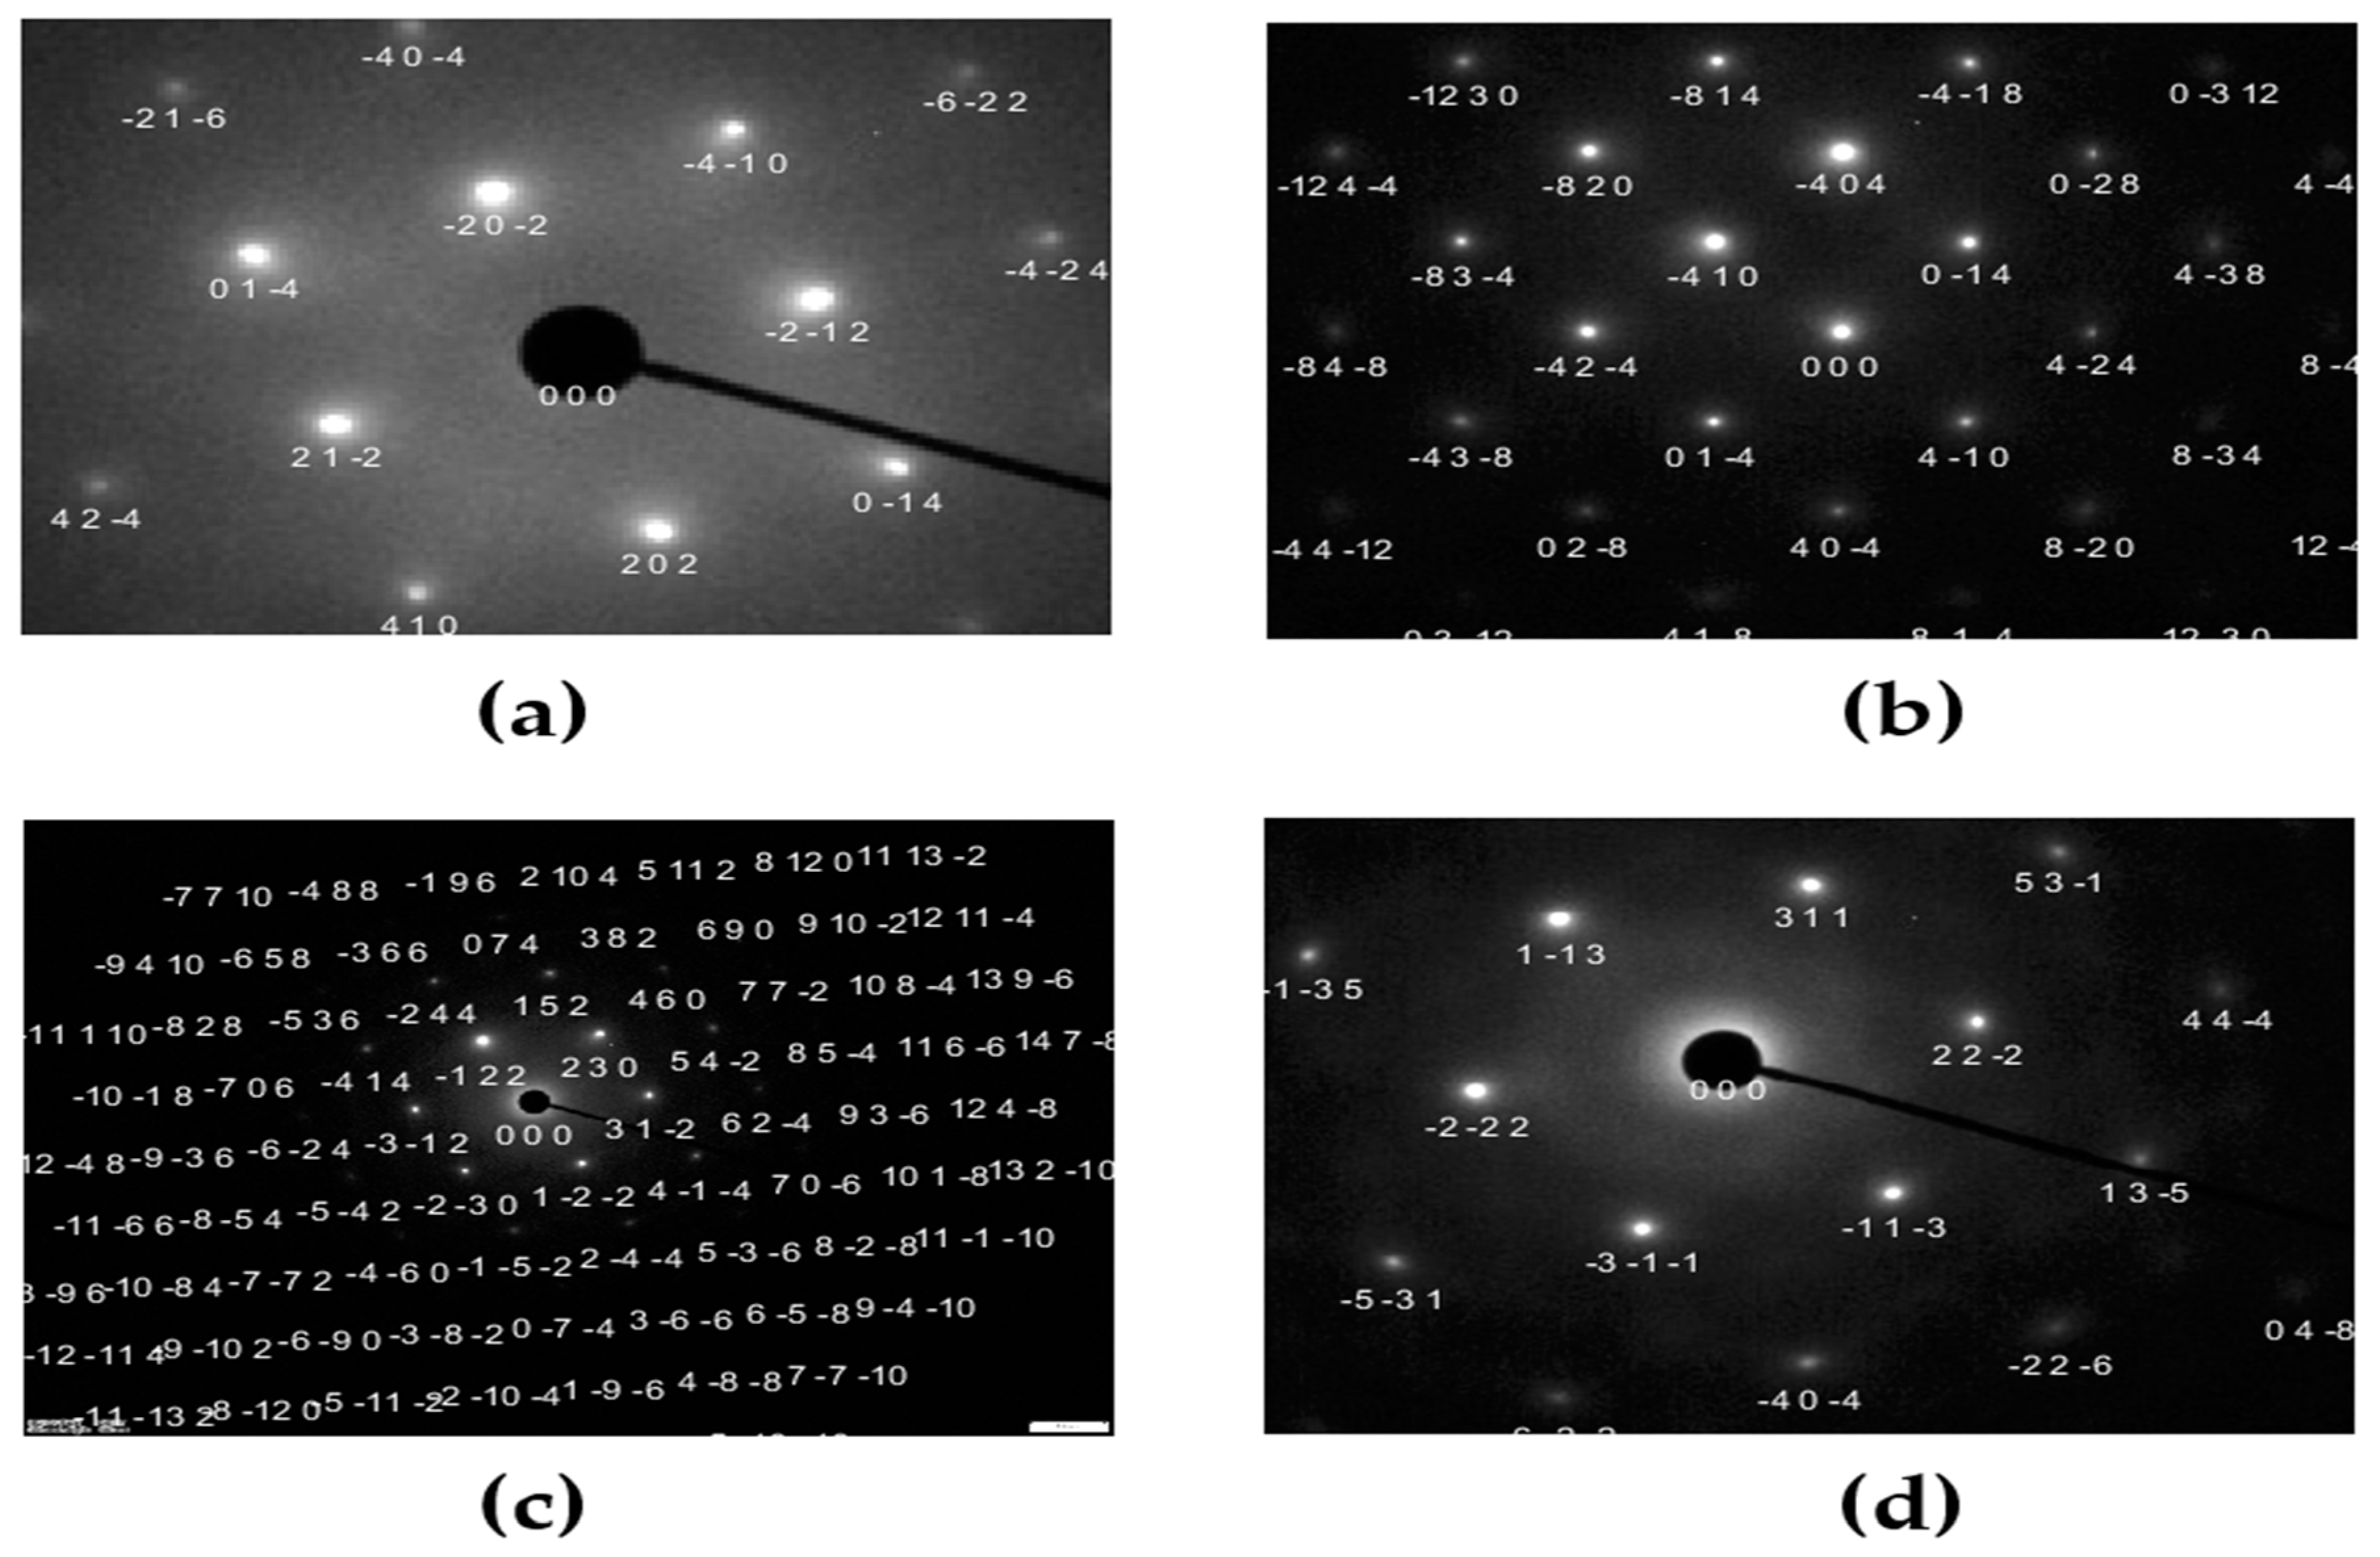
Using TEM, SAED, and Zone, axis images were captured and are shown in Figure 6 and Figure 7. Captured images are evaluated for crystallographic study and to assess lattice consistency between pure and cryogenically treated aluminium. Pure aluminium has a distinct ring pattern diffraction, and d-spacing values are found to be 0.136 nm, 0.117 nm, 0.083 nm, 0.071 nm, 0.068 nm, and 0.054 nm and correspond to their indexed (022), (222), (224), (044), (006), and (246) planes, respectively. Spot patterns are seen in cryogenically treated specimens.
At the (−1 4 1) zone axis, a spot pattern is seen in DCT-12. From TEM analysis, it is revealed that large and inconsistent d-spacing values are found across multiple vectors, and measured values are 0.22318 nm, 0.16096 nm, 0.23719 nm, and 0.16417 nm in DCT-12. Similarly, the DCT+A-12 specimen at the (1 4 1) zone axis showed a slight improvement in the symmetry. However, the TEM d-spacing variation remained significant: 0.21229 nm, 0.15510 nm, 0.21538 nm, and 0.14757 nm.
At the (−1 2 1) zone axis, d-spacing values of DCT-18 are 0.14994 nm, 0.08825 nm, 0.15167 nm, and 0.14511 nm, whereas DCT+A-18 values are measured at (6 −4 7) zone axis and show well-defined, symmetric diffraction spots. TEM showed tight clustering of d-spacing values at 0.13077 nm, 0.085396 nm, 0.15513 nm, and 0.112606 nm. Comparing other treatments, DCT-18 and DCT+A-18 showed the refined pattern.
In DCT-12 specimens, the presence of irregularity is seen due to lattice strain and high dislocation density. The corresponding measured angles between adjacent spots were 42.73°, 43.79°, 46.14°, and 47.34°, suggesting support for the presence of lattice distortion. The measured angles between the diffraction vectors (A–D) are highly consistent, ranging from 43.18°, 43.97°, 45.99°, and 46.86°, showing a more uniform lattice than is seen in DCT+A-12. This confirms the presence of a well-ordered crystalline structure after cryogenic treatment followed by an annealing process.
The wider angular spread is seen in DCT-18; the vector angles measured is 30.66°, 37.23°, 48.84°, and 63.27°, suggesting intensified local lattice distortions and increased orientation spread within grains due to lower dislocation content formed during extended cryogenic soaking hours.
Conversely, in DCT+A-18, angular measurements between prominent diffraction spots were measured across vectors A–D, yielding the following values: 31.10°, 31.50°, 58.16°, and 59.23°. The angular spread is narrow and consistent with minimal lattice distortion and a high degree of crystallographic order.

3.5. Raman Spectroscopy

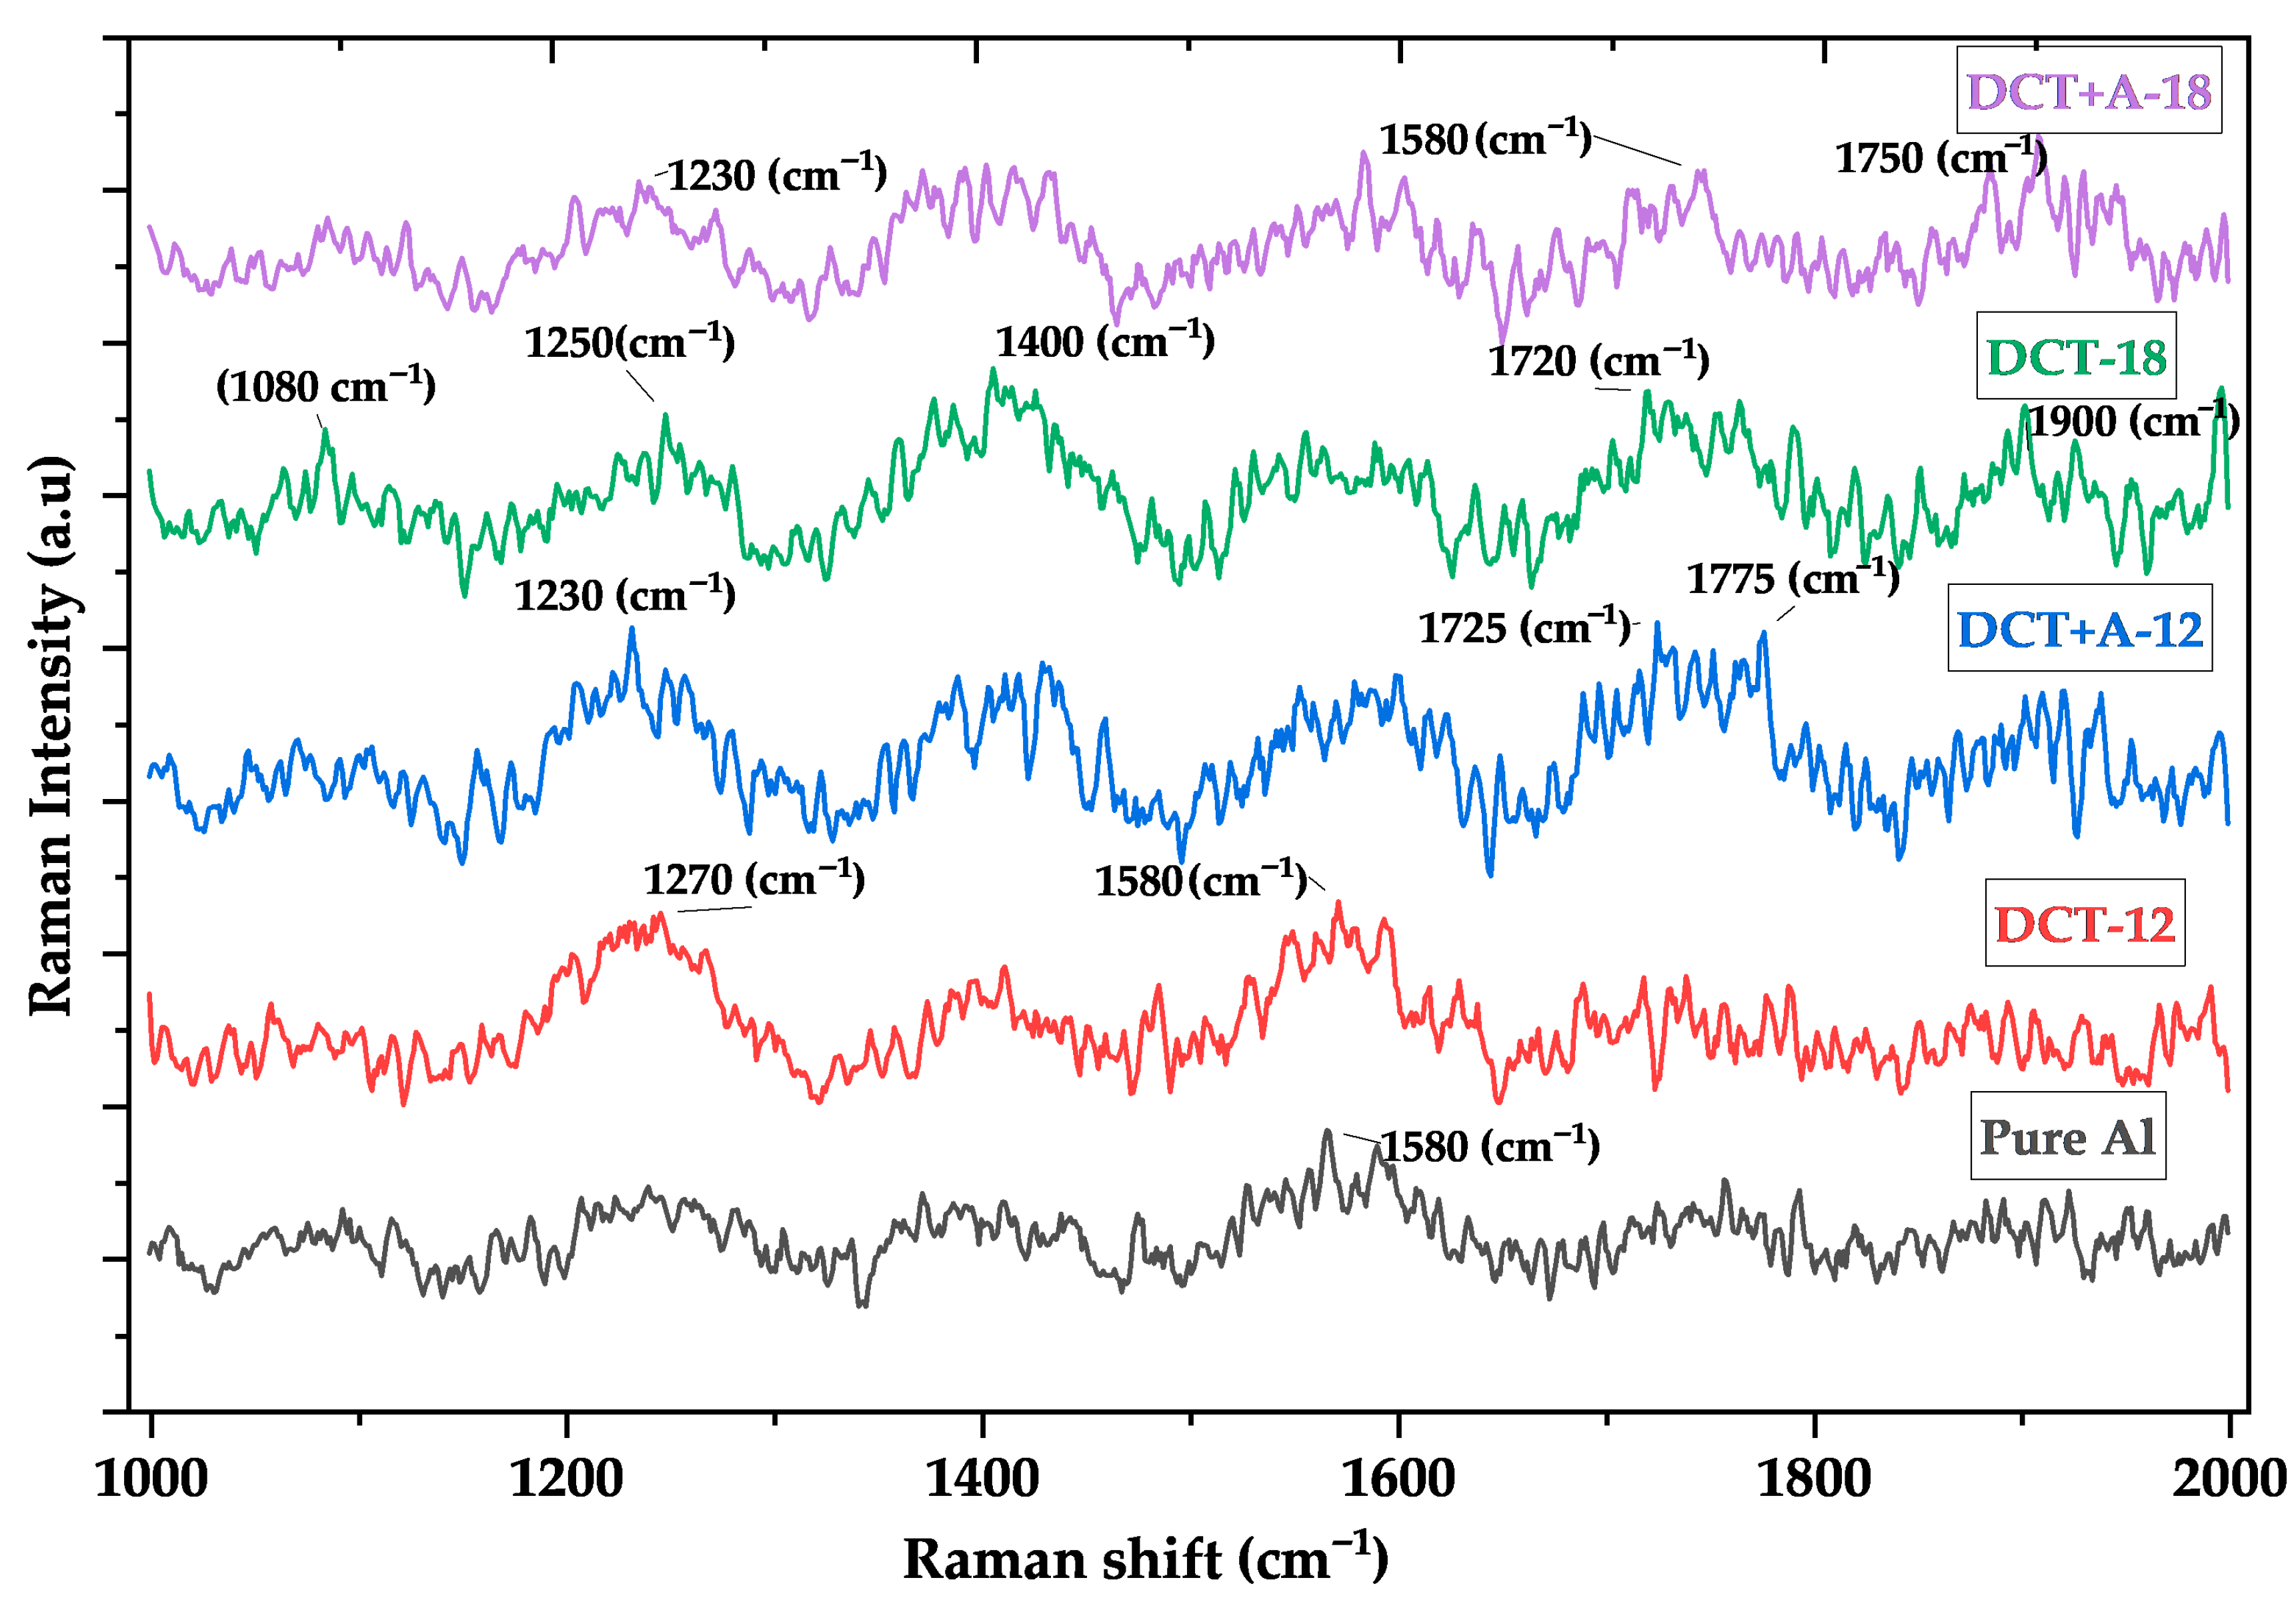
Raman spectroscopy is conducted for pure aluminium and cryogenically treated aluminium, as shown in Figure 8. The spectral range for Al falls between 1000 and 2000 cm−1. From the spectral analysis, vibrational behaviour and phonon scattering are studied.
Pure aluminium displayed a broad and weak Raman signal at 1580 cm−1 and had a spectral intensity of 850 (au). DCT-12 specimen showed a Raman intensity of 950 a.u and 1000 a.u enhanced phonon activity, and sharp peaks are found around 1270 cm−1 and 1580 cm−1. DCT+A-12 showed the higher Raman intensities (1077 a.u, 1110 a.u, and 1050 a.u) among all specimens, with broader and intense peaks at 1230 cm−1, 1725 cm−1, and 1775 cm−1.
The DCT-18 specimen presented a complex multi-peak profile at 1080 cm−1, 1250 cm−1, 1400 cm−1, 1720 cm−1, and 1900 cm−1 and showed respective intensities of 507 a.u, 700 a.u, 1000 a.u, 850 a.u, 1000 a.u. Although the intensity is slightly lower than the DCT+A-12 specimen, from the spectral structure, it is seen that it was the most detailed, showing saturation of cryogenic strain and microstructural reorganisation.
The DCT+A-18 specimen showed a broader peak, particularly around 1230 cm−1, 1580 cm−1, and 1750 cm−1 and showed 502 a.u, 770 a.u, 650 a.u, and 690 a.u. The peak complexity decreased, suggesting a reduction in density and microstrain following annealing treatment.

3.6. Electrical Conductivity Analysis Using Four-Point Probe Technique

Figure 4 provides the conductivity and mobility trend of aluminium. Pure aluminium exhibits 2.74 × 10⁷ S/m conductivity and 28.4 cm2/V·s of mobility. After DCT, improvement of conductivity and mobility is seen. The DCT-6 specimens recorded a conductivity of 4.78 × 10⁷ S/m and mobility of 49.6 cm2/V·s, while DCT-12 showed an increase of 3.0 × 10⁷ S/m and 31.7 cm2/V·s, respectively. Particularly, the DCT-18 specimen proved the highest conductivity and mobility, reaching 4.91 × 10⁷ S/m and 50.8 cm2/V·s.
A slight decline was seen for DCT-24, with conductivity and mobility measuring 4.65 S/m and 48.2 cm2/V·s. DCT+A-6 showed a minimal improvement of conductivity and mobility of 3.11 × 10⁷ S/m and 32.9 cm2/V·s. In DCT+A-12, a marginal improvement of conductivity (2.88 × 10⁷ S/m) and mobility (29.2 cm2/V·s) is seen. DCT+A-18 and DCT+A-24 proved substantial enhancements of conductivities of 4.52 × 10⁷ S/m and 4.34 × 10⁷ S/m, and mobilities of 46.9 cm2/V·s and 45.1 cm2/V·s, respectively. These trends suggest that both DCT and DCT+A treatments significantly influence electron transport behaviour in aluminium.

4. Discussion

4.1. Influence of Soaking Hours on Microstructural Evolution

The results demonstrate that DCT induces substantial grain refinement in pure aluminium, and that variation in soaking hours [39] plays a vital role in the refinement of grains [12,40].
The most significant refinement occurred at 12 h of soaking in both DCT (31.32 µm) and DCT+A (29.4 µm) treatments, suggesting an optimal cryogenic soaking hour, and that refinement of grains occurs due to the formation of subgrain boundaries and inhibits grain refinement [10].
18 h of soaking resulted in grain coarsening due to partial recovery processes and the annihilation or rearrangement of dislocations, which reduced the driving force for boundary pinning. Conversely, the grain coarsening observed in DCT+A-18 indicates that excessive thermal recovery [20] can enhance grain boundary mobility, leading to microstructural coarsening.
Again, slight refinement of grain is seen after 24 h of soaking due to the secondary stabilisation mechanism, while DCT+A treatment [41] promotes dislocation rearrangement into stable subgrain boundaries.
Both DCT and DCT+A treatments are effective in refining the grain size [42] of pure aluminium. The refinement of grain is mainly driven by increased dislocations and the formation of subgrains, which is further stabilised by the annealing process [41,43] in the DCT+A treatment. However, prolonged soaking leads to partial recovery and grain coarsening in 18 h of soaking.

4.2. Effect of Cryogenic Treatment on Crystallite Size, Dislocation Density, and Microstrain

The observed variations in crystallite size, dislocation density, and microstrain across all soaking durations highlight the influence of DCT [44] and the synergistic effect of DCT+A [45]. In DCT-6, the peak remained sharp because of short soaking hours and caused only a minor defect in crystallite refinement. Conversely, in DCT+A-6, peaks are sharp and intense due to the annealing process, and this promotes subgrain formation and retains residual strain and increases density [39]. At 12 h of soaking in DCT-12 and DCT+A12, a weak peak occurs due to severe refinement of crystallite size and density [3,40].
At 18 h of soaking, in both DCT-18 and DCT+A-18, sharp and intense peaks are produced, and this leads to a significant increase in crystallite sizes [46] and results in the low dislocation density and microstrain. These specimens show favourable microstructural characteristics, such as reduced crystallographic defects, which promote grain coarsening [47] and enhance the overall electrical conductivity [45].
At 24 h of soaking in DCT-24 and DCT+A-24, the specimens’ microstrain tends to decrease, showing that internal stresses in the material are reducing [48]. A slight increase in density is seen. This suggests that soaking beyond 18 h triggers rearrangement into finer dislocation networks. The changes in crystallite size, dislocation density, and microstrain reveal a clear transition from dislocation generation in DCT-12 to recovery of dislocation in DCT-18 and finally to stabilisation in DCT-24 [49].

4.3. Effect of Cryogenic Treatment on Grain Boundary Features and Texture

When pure aluminium is cryogenically treated, structural changes are reflected in PF intensity and grain boundary. The increase in (111) and (100) textures is seen in DCT and DCT+A treatment [13].
From the SEM-EBSD analysis, grain boundary transition is observed, where HAGB tends to decrease in DCT and DCT+A specimens, which correlates with XRD analysis [41].
DCT-12 and DCT+A-12 showed an increase in LAGB due to the formation of subgrain boundaries. This structural reorganisation increases strain and retains a defect-rich state. But DCT-12 and DCT+A-12 showed a strong (100) plane which results in a slight improvement of conductivity.
Specifically, in DCT+A-18, the equal ratio of HAGB and LAGB indicates that the material has undergone significant recovery, where dislocations have reorganised into smaller grain structures, which helps lower internal stress [45] and enhances the stability of the microstructure.
The increase in LAGB fraction reached 48.3% in DCT-12, confirming that dislocations have rearranged into low-angle boundaries during extended soaking.
DCT-18 and DCT+A-18 have the PF intensity of (9.11 mrd) and (10.8 mrd) in the (100) plane due to recovery and dislocation rearrangement. This orientation is particularly favourable in FCC metals like aluminium, contributing to improved electron transport [14,50] and mechanical uniformity.
In DCT+A treatment, recovery initiates and improves the preferred direction of the material and keeps its texture stable. These orientations are more energy-efficient and are known to improve electrical conductivity [45] in aluminium. The enhancement of this orientation highlights the role of annealing in driving the grain boundary migration and grain growth [41].

4.4. TEM Microstructural Analysis and SAED Pattern Evaluation

The measured d-spacing values and diffraction vector angles offer quantitative support for microstructural transformations and are inferred with SEM-EBSD and XRD. In the DCT-12, TEM revealed distorted lattice fringes and irregular d-spacing values, reflecting significant lattice strain and deformation. Angular deviations ranged from 42.73° to 47.34°, confirming local misorientation and increased dislocations. These features align with EBSD data showing a rise in LAGB fraction (up to 40.1%) and with XRD findings indicating the smallest crystallite size (32.39 nm) and highest dislocation density (9.53 × 10¹⁴ m−2) among all specimens [38,40,41].
The TEM analysis of the DCT+A-12 specimen reveals a partially recovered microstructure with improved lattice order compared to DCT-12. This interpretation is supported by the XRD data, which show crystallite size of 37.02 nm and dislocation density of 7.27 × 10¹⁴ m−2, and microstrain of 0.00189 [12]. The SAED pattern shows sharp diffraction spots with angular separations of 43.18°, 43.97°, 45.99°, and 46.86°, showing a more symmetric and strain-relieved crystallographic arrangement when comparing the DCT-12.
EBSD analysis further supports this interpretation. The LAGB [43] reaches 45.3% in DCT+A-12, indicating a retained substructure, while texture sharpening is observed with increased intensity along the (100) and (110) directions [41].
While in DCT-18, SAED pattern shows significant angular asymmetry, with measured vector angles of 30.66°, 37.23°, 48.84°, and 63.27°. This wide angular spread decreases misorientation and residual strain due to extended cryogenic soaking hours. XRD analysis aligns with this interpretation. While the crystallite size increases to 52.82 nm, the dislocation density remains at 3.58 × 10¹⁴ m−2, and microstrain [49] is reduced to 0.00157. EBSD analysis supports this transitional microstructure, and a near-equal mix of HAGBs (51.7%) and LAGBs (48.3%) was observed [20].
In contrast, DCT+A-18 exhibited well-aligned lattice fringes and uniform d-spacing distribution and has minimal diffraction vectors (31.10°, 31.50°, 58.16°, and 59.23°), indicating excellent lattice regularity and minimal local strain [48]. This is consistent with the XRD results showing a large crystallite size (53.69 nm), lowest dislocation density (3.46 × 10¹⁴ m−2), and reduced microstrain 0.00188 [10].
From the analysis it is seen that DCT-12, DCT+A-12, DCT+A-18, and DCT-18 exhibit a steady decrease in d-spacing values, while DCT+A-18 showed the lowest d-spacing values. The DCT-12 and DCT+A-12 specimens have more structural disorder and have internal strain which is caused by DCT. On the other hand, the decrease in d-spacing values for DCT-18 and DCT+A-18 indicates the reduction in dislocations [51] and microstrain [52].

4.5. Vibrational Analysis by Raman Spectroscopy

The Raman spectral characteristics of DCT and DCT+A aluminium correlate strongly with the microstructural changes, which are seen in XRD analysis. DCT-12 and DCT+A-12 produced the smallest crystallite size and displayed sharper and more intense Raman peaks [53].
This confirms phonon confinement and leads to restriction of phonon delocalization and results in stronger Raman activity and vibrational intensity [48,54].
The highest dislocation densities were seen in DCT-12 and DCT+A-12, which correlate with Raman intensities and spectral complexity. Dislocations act as scattering centres, amplifying the Raman signal by interacting with phonons [55]. The DCT+A-12 appeared as the most defect-rich state, showing maximum Raman activity and confirming high lattice distortion. This is aligned with its smallest crystallite size and maximum dislocation density.
Conversely, larger crystallite sizes in DCT-18 (52.82 nm) and DCT+A-18 (53.69 nm) allowed phonon delocalization, resulting in broader features with slightly reduced intensity. DCT-18 and DCT+A-18 have lower dislocation densities, which aligns with the Raman features, indicating recovery of lattice strain, and a reduction in defects and microstrain [55].
The microstrain significantly dropped in DCT-18 and DCT+A-18 compared to pure Al. Annealing after DCT induces grain growth, recovery of dislocations, and partial strain relaxation. This results in a broader Raman peak.
Raman spectral analysis is highly sensitive to microstructural defects [56], and the observed trends in intensity, peak position, and broadening are in strong agreement with XRD-derived crystallite size, dislocation density [57], and microstrain.

4.6. Influence of Cryogenic Treatment on Conductivity and Mobility

The electrical properties of pure aluminium show a clear dependence on its microstructural characteristics. Untreated aluminium showed a larger crystallite size of 49.82 nm and microstrain of 0.00198. These factors promote strong electron scattering, resulting in low electrical conductivity and mobility.
In DCT-6, an improvement of conductivity and mobility was seen, and this enhancement is attributed to a reduced microstrain due to substructural refinement, which helped to improve the electron flow [58].
A reduction in conductivity is seen in DCT-12 due to excessive deformation due to the smaller crystallite size, high dislocation density, higher percentage of HAGB (59.9%), irregular lattice fringes, and strain accumulation, which leads to intense phonon and electron scattering [6].
In DCT-18, conductivity reached 4.91 × 10⁷ S/m due to the larger crystallite size of 52.82 nm, and reduced dislocation density and microstrain [22]. These structural improvements result in increasing the mobility to 50.8 cm2/V·s. TEM analysis showed well-aligned lattice fringes and symmetrical spot pattern, and EBSD analysis revealed enhanced texture intensity [59].
In DCT-24, conductivity reached to 4.65 × 10⁷ S/m, reflecting saturation of recovery processes. XRD confirmed slight coarsening of crystallite size (42.25 nm) and microstrain remained low (0.00191).
In DCT+A-6 and DCT+A-12, a conductivity of 3.11 and 2.88 × 10⁷ S/m was shown, respectively, lower than their DCT counterparts due to partial recovery [22]. DCT+A-18 has the largest crystallite size of 53.69 nm, the lowest dislocation density of 3.46 × 10¹⁴ m−2, and a microstrain of 0.00188. This structural consistency resulted in a conductivity of 4.52 × 10⁷ S/m and a mobility of 46.9 cm2/V·s.
TEM displayed ordered lattice fringes and a symmetric spot pattern, and the Raman spectra featured broader peaks [10]. DCT+A-24 retained a similar performance of DCT+A-18 due to saturation of recovery processes.
The electrical conductivity and mobility properties correlate with microstructural recovery, grain boundary characterisation [10], dislocation rearrangement, and phonon scattering mechanisms. DCT enhances conductivity by microstrain and dislocation reduction, whereas the annealing [20] process reduces distortions and defects, leading to recovery and enhanced conductivity [60].
Among all treatments, DCT+A-18 has the most balanced crystallite size, microstrain, and HAGB and LAGB fractions. Microstructural properties like crystallite size, dislocation density, and microstrain play an important role in increasing the conductivity and mobility of aluminium [14].
Electrical conductivity of pure aluminium (99.99%) is often cited at around 3.6 to 3.8 × 10⁷ S/m. Even highly optimised conventional commercial alloys demonstrate substantially lower conductivities, such as the 1350 alloy at 3.6 × 10⁷ S/m [61], and the 6201 alloy series typically reached a maximum of 3.3 × 10⁷ S/m. Advanced thermomechanical processes (TMPs) al alloys could reach 3.4 × 10⁷ S/m, while Al-Mg-Si wires subjected to T8 tempering achieved conductivity up to 3.6 × 10⁷ S/m [62].
Similarly, successful optimisation techniques focusing on purity enhancement, such as adding Al-B8 master alloy combined with heat treatment to commercially pure aluminium, increased the conductivity to 3.7 × 10⁷ S/m [23], and microalloying pure Al with telluride (Te) achieved a maximum of 3.6 × 10⁷ S/m [63]. Lower conductivity is observed in DCT-12, due to structural defects, intense phonon confinement, and electron scattering and longer soaking hours confirm subsequent recovery in DCT-18, which led to conductivity enhancements of nearly 1.2 × 10⁷ S/m. Improved conductivity is achieved with a perfected microstructural state, and the DCT process was uniquely able to achieve this with a lower internal defect [23]. The contribution to resistivity is higher than materials produced by conventional TMT or SPD methods.

5. Conclusions

This study investigates the effect of deep cryogenic treatment (DCT) and deep cryogenic treatment followed by annealing (DCT+A) on aluminium and reveals pronounced microstructural transformations that critically influence its electrical conductivity. Soaking durations of 12 and 18 h emerged as pivotal stages, with characterisation techniques like XRD, EBSD, TEM, and RAMAN spectroscopy providing complementary insights.
DCT-12, undergoes intense lattice deformation and refinement. XRD analysis confirmed a significant reduction in crystallite size to (32.39 nm), accompanied by the highest recorded dislocation density of (9.53 × 10¹⁴ m−2), indicating a defect-rich microstructure. In contrast, DCT-18 and DCT+A-18 facilitated notable recovery. DCT+A-18 exhibited the largest crystallite size of 53.69 nm and the lowest dislocation density 3.46 × 10¹⁴ m−2.
SEM-EBSD results revealed a shift from HAGB in untreated aluminium (74.3%) to a substantial increase in LAGB, reaching 40.1% in DCT-12, which is evidence of subgrain formation and dislocation accumulation. DCT-18 and DCT+A-18 showed a near-balanced grain boundary distribution (51.7% HAGB, 48.3% LAGB) and strong (100) texture (10.8 mrd) is achieved in both treatments, which is favourable for electron mobility in FCC metals.
TEM micrographs and SAED patterns of DCT-12 displayed distorted lattice fringes, irregular d-spacing, and angular deviations, consistent with high internal strain. The DCT+A-12 sample showed partial lattice recovery. While DCT-18 and DCT+A-18 revealed well-aligned lattice fringes and symmetric diffraction spots, indicative of minimal local strain.
Raman spectroscopy correlated strongly with microstructural integrity. DCT-12 and DCT+A-12, with high defect densities, exhibited sharp and intense Raman peaks (1110 a.u in DCT+A-12), signifying elevated phonon activity and lattice distortion. In contrast, DCT-18 and DCT+A-18 showed broader peaks, reflecting reduced microstrain and defect density.
DCT-12 showed a reduced conductivity of 3.0 × 10⁷ S/m due to enhanced electron scattering from defects, and DCT-18 achieved a peak conductivity of 4.91 × 10⁷ S/m, attributed to a crystallite size of 52.82 nm. DCT+A-18 followed with a conductivity of 4.52 × 10⁷ S/m, benefiting from the largest crystallite size, lowest dislocation density, and optimal lattice orientation.
The study confirms that 12 h cryogenic treatment induces a defect-rich state with high dislocation density and lattice strain, while 18 h soaking, especially when followed by an annealing process, promotes recovery, coarsening of the grain boundary, and lattice ordering. These microstructural improvements directly enhance electrical conductivity, establishing DCT+A-18 as the most electrically efficient condition.

Author Contributions

Conceptualization, A.S. and D.C.N.; methodology, A.S. and D.C.N.; formal analysis, A.S. and D.C.N.; resources, D.C.N.; data curation, A.S. and D.C.N.; writing—draft preparation, D.C.N.; writing—review and editing, A.S.; supervision, A.S.; project administration, A.S. All authors have read and agreed to the published version of the manuscript.

Funding

This research received no external funding.

Institutional Review Board Statement

Not applicable.

Informed Consent Statement

Not applicable.

Data Availability Statement

The original contributions presented in this study are included in the article. Further inquiries can be directed to the corresponding author.

Conflicts of Interest

The authors declare no conflicts of interest.

Abbreviations

WEDMWire Electrical Discharge Machining
AlAluminium
SPGSevere Plastic Deformation
UFGUltrafine Grained
MGSMultiple Gradient Structures
ECAPEqual Channel Angular Pressing 
CDDTCryogenic Dual-Direction Torsion 
DCTDeep Cryogenic Treatment
DCT+ADeep Cryogenic Treatment followed by Heat Treatment
FIB-SEM-EBSDFocused Ion Beam–Scanning Electron Microscopy-Electron Backscatter Diffraction
HAGBHigh-Angle Grain Boundary
LAGBLow-Angle Grain Boundary
(mrd)Multiple of Random Distribution
PFPole Figure
TEMTransmission Electron Microscopy
SAEDSelected Area Electron Diffraction
FCCFace-Centered Cubic
NDNormal Direction
RDRolling Direction
TDTransverse Direction

References

  1. Li, S.; Yue, X.; Li, Q.; Peng, H.; Dong, B.; Liu, T.; Yang, H.; Fan, J.; Shu, S.; Qiu, F.; et al. Development and Applications of Aluminum Alloys for Aerospace Industry. J. Mater. Res. Technol. 2023, 27, 944–983. [Google Scholar] [CrossRef]
  2. Premkumar, R.; Vignesh, R.V.; Padmanaban, R.; Govindaraju, M.; Santhi, R. Investigation on the Microstructure, Microhardness, and Tribological Behavior of AA1100-hBN Surface Composite. Koroze Ochrana Materiálu 2021, 65, 1–11. [Google Scholar] [CrossRef]
  3. Huang, F.; Lu, K. Effects of Impurity on Microstructure and Hardness in Pure Al Subjected to Dynamic Plastic Deformation at Cryogenic Temperature. J. Mater. Sci. Technol. 2011, 27, 628–632. [Google Scholar] [CrossRef]
  4. Lipińska, M.; Bazarnik, P.; Lewandowska, M. The Influence of Severe Plastic Deformation Processes on Electrical Conductivity of Commercially Pure Aluminium and 5483 Aluminium Alloy. Arch. Civ. Mech. Eng. 2016, 16, 717–723. [Google Scholar] [CrossRef]
  5. Wang, Y.; Zhu, L.; Niu, G.; Mao, J. Conductive Al Alloys: The Contradiction between Strength and Electrical Conductivity. Adv. Eng. Mater. 2021, 23, 2001249. [Google Scholar] [CrossRef]
  6. Czerwinski, F. Aluminum Alloys for Electrical Engineering: A Review. J. Mater. Sci. 2024, 59, 14847–14892. [Google Scholar] [CrossRef]
  7. Fu, H.; Guo, K.; Wu, Z.; Mai, R.; Chin, C.-L.; Ma, C.-K. Experimental Investigation of a Novel CFRP-Steel Composite Tube-Confined Seawater-Sea Sand Concrete Intermediate Long Column. Int. J. Integr. Eng. 2024, 16, 466–475. [Google Scholar] [CrossRef]
  8. Aravind, T.V.; Arul, S. Effect of Deep Cryogenic Treatment on C93700 Bearing Bush Material Used in Submersible Pumps. Mater. Today Proc. 2021, 46, 4685–4690. [Google Scholar] [CrossRef]
  9. Praveen Kumar, R.; Arul, S. Improving the Wear and Corrosion Resistance of Nickel Aluminium Bronze by Deep Cryogenic Treatment. Mater. Today Proc. 2021, 46, 4915–4918. [Google Scholar] [CrossRef]
  10. Yao, E.; Zhang, H.; Ma, K.; Ai, C.; Gao, Q.; Lin, X. Effect of Deep Cryogenic Treatment on Microstructures and Performances of Aluminum Alloys: A Review. J. Mater. Res. Technol. 2023, 26, 3661–3675. [Google Scholar] [CrossRef]
  11. Woodcraft, A.L. Recommended Values for the Thermal Conductivity of Aluminium of Different Purities in the Cryogenic to Room Temperature Range, and a Comparison with Copper. Cryogenics 2005, 45, 626–636. [Google Scholar] [CrossRef]
  12. Su, L.; Deng, G.; Luzin, V.; Wang, H.; Wang, Z.; Yu, H.; Li, H.; Tieu, A.K. Effect of Cryogenic Temperature Equal Channel Angular Pressing on Microstructure, Bulk Texture and Tensile Properties of AA1050. Mater. Sci. Eng. A 2020, 780, 139190. [Google Scholar] [CrossRef]
  13. Wang, Y.; Zuo, J.; Xu, C.; Liu, W.; Li, D.; Wang, G.; Tang, G.; Geng, L. Deformation Behavior of Pure Aluminum at Room and Cryogenic Temperatures. J. Mater. Res. Technol. 2024, 31, 2355–2366. [Google Scholar] [CrossRef]
  14. Cai, S.L.; Li, D.Q.; Liu, S.C.; Si, J.J.; Gu, J.; Zhou, L.X.; Cheng, Y.F.; Koch, C.C. Cryogenic Reciprocating Torsion Induced Nanoscale Precipitation in Aluminum Wire with Exceptional Strength and Electrical Conductivity. Mater. Sci. Eng. A 2022, 860, 144276. [Google Scholar] [CrossRef]
  15. Cai, S.L.; Li, D.Q.; Liu, S.C.; Cheng, Y.F.; Li, J.H.; Koch, C.C. Multiple Gradient Structures Driving Higher Tensile Strength and Good Capacity to Absorbed Energy in Aluminum Wire Processed by Cryogenic Pre-Torsion. Scr. Mater. 2022, 210, 114436. [Google Scholar] [CrossRef]
  16. Cruz Feliciano, A.; Ghosh, A.; Kacher, J.; Graber, L.; Jin, Z. Lightweight Clad Bi-Metal Conductors for Cryogenic Applications. IOP Conf. Ser. Mater. Sci. Eng. 2024, 1302, 012036. [Google Scholar] [CrossRef]
  17. Kalsi, S.S.; Storey, J.G.; Lumsden, G.; Badcock, R.A. Airplane Motors Employing Superconducting DC Field Windings and Conventional Conductor AC Windings. IOP Conf. Ser. Mater. Sci. Eng. 2024, 1302, 012017. [Google Scholar] [CrossRef]
  18. Kumar, U.; Swaminathan, P.; Vaghela, H. Investigation of the Emittance Properties of Multilayer Insulation Used in Cryogenic Applications. IOP Conf. Ser. Mater. Sci. Eng. 2025, 1327, 012225. [Google Scholar] [CrossRef]
  19. Shinozaki, K.; Mizutani, T.; Fujii, T.; Onaka, T.; Nakagawa, T.; Sugita, H. Thermal Property Measurements of Al-Alloy for Space Cryogenic Missions. IOP Conf. Ser. Mater. Sci. Eng. 2022, 1241, 012013. [Google Scholar] [CrossRef]
  20. Alyani, A.; Kazeminezhad, M. Annealing Behavior of Aluminum after Low-Temperature Severe Plastic Deformation. Mater. Sci. Eng. A 2021, 824, 141810. [Google Scholar] [CrossRef]
  21. Achuthankutty, A.; Saravanan, R.; Nagarajan, H.; Pasunuri, V.; Gopal, N.H.; Ramesh, A.; Arangot, S.; Thekkuden, D.T. Cryo-Rolled AA5052 Alloy: Insights into Mechanical Properties, Formability, and Microstructure. J. Manuf. Mater. Process. 2024, 8, 284. [Google Scholar] [CrossRef]
  22. Mavlyutov, A.M.; Bondarenko, A.S.; Murashkin, M.Y.; Boltynjuk, E.V.; Valiev, R.Z.; Orlova, T.S. Effect of Annealing on Microhardness and Electrical Resistivity of Nanostructured SPD Aluminium. J. Alloys Compd. 2017, 698, 539–546. [Google Scholar] [CrossRef]
  23. Zeybek, Y.; Kayış, C.; Diler, E.A. Improving Electrical Conductivity of Commercially Pure Aluminium: The Synergistic Effect of AlB8 Master Alloy and Heat Treatment. Materials 2025, 18, 364. [Google Scholar] [CrossRef]
  24. ASTM E3; Standard Guide for Preparation of Metallographic Specimens. ASTM International: West Conshohocken, PA, USA, 2017.
  25. ASTM E1558; Guide for Electrolytic Polishing of Metallographic Specimens. ASTM International: West Conshohocken, PA, USA, 2021.
  26. Loganathan, C.; Narayanasamy, R.; Sathiyanarayanan, S. Effect of Annealing on the Wrinkling Behaviour of the Commercial Pure Aluminium Grades When Drawn through a Conical Die. Mater. Des. 2006, 27, 1163–1168. [Google Scholar] [CrossRef]
  27. Sosa, J.M.; Huber, D.E.; Welk, B.; Fraser, H.L. Development and Application of MIPARTM: A Novel Software Package for Two- and Three-Dimensional Microstructural Characterization. Integr. Mater. Manuf. Innov. 2014, 3, 123–140. [Google Scholar] [CrossRef]
  28. ASTM E1382-9; Standard Test Methods for Determining Average Grain Size Using Semiautomatic and Automatic Image Analysis. ASTM International: West Conshohocken, PA, USA, 2015.
  29. Cullity, B.D.; Stock, S.R. Elements of X-Ray Diffraction, 2nd ed.; Addison-Wesley Series in Metallurgy and Materials; Addison-Wesley: Glenview, IL, USA, 1978; ISBN 978-0-201-01174-6. [Google Scholar]
  30. Williamson, G.K.; Smallman, R.E. III. Dislocation Densities in Some Annealed and Cold-Worked Metals from Measurements on the X-Ray Debye-Scherrer Spectrum. Philos. Mag. 1956, 1, 34–46. [Google Scholar] [CrossRef]
  31. Parveen, B.; Mahmood-ul-Hassan; Khalid, Z.; Riaz, S.; Naseem, S. Room-Temperature Ferromagnetism in Ni-Doped TiO 2 Diluted Magnetic Semiconductor Thin Films. J. Appl. Res. Technol. 2017, 15, 132–139. [Google Scholar] [CrossRef]
  32. Beausir, B.; Fundenberger, J.-J. Fundenberger Analysis Tools for Electron and X-Ray Diffraction, ATEX-Software; Université de Lorraine: Metz, France, 2017; Available online: http://www.atex-software.eu/ (accessed on 6 October 2025).
  33. Klinger, M. More Features, More Tools, More CrysTBox. J. Appl. Crystallogr. 2017, 50, 1226–1234. [Google Scholar] [CrossRef]
  34. ASTM B 193-02; Standard Test Method for Resistivity of Electrical Conductor Materials. ASTM International: West Conshohocken, PA, USA, 2009.
  35. Kittel, C. Introduction to Solid State Physics, 8th ed.; Wiley: Hoboken, NJ, USA, 2005; ISBN 978-0-471-41526-8. [Google Scholar]
  36. Wu, X.; He, J.; Tian, J.; Zheng, Y.; Fu, H.; Yuan, J.; Lu, S.; Huang, W. Degradation Behaviors and Damage Model of the Interface between ECC and Concrete under Sulfate Wet-Dry Cycling. Constr. Build. Mater. 2025, 476, 141283. [Google Scholar] [CrossRef]
  37. Alvarado, E.E.; Figueroa, I.A.; Gonzalez, G. Microstructural and Mechanical Analysis of an 1100 Aluminum Alloy Processed by Repetitive Corrugation and Straightening. Phys. Metals Metallogr. 2020, 121, 1319–1325. [Google Scholar] [CrossRef]
  38. Zakaria, S.A.; Anasyida, A.S.; Zuhailawati, H.; Dhindaw, B.K.; Jabit, N.A.; Ismail, A. Characterization of Mechanical and Corrosion Properties of Cryorolled Al 1100 Alloy: Effect of Annealing and Solution Treatment. Trans. Nonferrous Met. Soc. China 2021, 31, 2949–2961. [Google Scholar] [CrossRef]
  39. Yu, C.; Chen, L.; Jiang, H.; Zhou, Q.; Yang, C. Effect of Deep Cryogenic-Aging Treatment on Microstructure and Mechanical Properties of 7075 Al-alloy. Chin. J. Mater. Res. 2023, 37, 120–128. [Google Scholar] [CrossRef]
  40. Chandra Sekhar, K.; Narayanasamy, R. Mechanical Properties and Formability of Cryorolled Commercial Pure Aluminium at Various Reductions. Mater. Today Proc. 2018, 5, 6888–6896. [Google Scholar] [CrossRef]
  41. Zahid, G.H.; Huang, Y.; Prangnell, P.B. Microstructure and Texture Evolution during Annealing a Cryogenic-SPD Processed Al-Alloy with a Nanoscale Lamellar HAGB Grain Structure. Acta Materialia 2009, 57, 3509–3521. [Google Scholar] [CrossRef]
  42. Aminah, Z.S.; Noraini, S.A.S.M.; Zuhailawati, H.; Anasyida, A.S. Effect of Solution Treatment on Al 1100 Cryorolled Sheet Alloy. IOP Conf. Ser. Mater. Sci. Eng. 2016, 114, 012127. [Google Scholar] [CrossRef]
  43. Cao, Y.; He, L.; Zhou, Y.; Wang, P.; Cui, J. Contributions to Yield Strength in an Ultrafine Grained 1050 Aluminum Alloy after DC Current Annealing. Mater. Sci. Eng. A 2016, 674, 193–202. [Google Scholar] [CrossRef]
  44. Izumi, M.T.; Quintero, J.J.H.; Crivoi, M.R.; Maeda, M.Y.; Namur, R.S.; De Aguiar, D.J.M.; Cintho, O.M. In Situ X-Ray Diffraction Analysis of Face-Centered Cubic Metals Deformed at Room and Cryogenic Temperatures. J. Mater. Eng. Perform. 2019, 28, 4658–4666. [Google Scholar] [CrossRef]
  45. Rangaraju, N.; Raghuram, T.; Krishna, B.V.; Rao, K.P.; Venugopal, P. Effect of Cryo-Rolling and Annealing on Microstructure and Properties of Commercially Pure Aluminium. Mater. Sci. Eng. A 2005, 398, 246–251. [Google Scholar] [CrossRef]
  46. Wang, R.; Liu, W.; Yao, M. Cooperative Effect of Grain Size and Cryogenic Temperature on Deformation Behavior and Mechanism of Commercial Pure Al Sheets. Mater. Sci. Eng. A 2024, 899, 146411. [Google Scholar] [CrossRef]
  47. George, S.; Mias, C. Effect of Rolling Temperature on Annealing of Aa1050 Aluminium Alloy. MSF 2015, 828, 200–205. [Google Scholar] [CrossRef]
  48. Tang, P.; Wang, H.; Cheng, X.; Zang, J.; Zhao, Y. Effects of Cryogenic Thermal Cycling Treatment on Microstructure, Mechanical Properties and Residual Stress of Selective Laser Melted Alsi10mg Alloy. Mater. Sci. Eng. A 2025, 944, 148963. [Google Scholar] [CrossRef]
  49. Mani, S.; Subramanian, R.K. Experimental Investigation on the Low Cycle Fatigue Performance and Fractographic Analysis of Deep Cryogenic Treated 6063 Aluminium Alloy. Structures 2023, 58, 105588. [Google Scholar] [CrossRef]
  50. Xu, B.; Lu, Q.; Liu, C.; Peng, Y.; Miao, K.; Wu, H.; Li, R.; Li, X.; Fan, G. Anisotropic Behavior and Temperature-Dependent Mechanical Properties of AA1060 Aluminum Alloy: A Comprehensive Microstructural Study. Mater. Sci. Eng. A 2024, 901, 146550. [Google Scholar] [CrossRef]
  51. Liu, W.; Wang, R.; Zhou, H.; Yao, M.; Sun, W.; Zhu, Y.; Li, Y. Modeling of Cryo-Deformation Based on Grain Size-Dependent Dislocation Evolution. Int. J. Mech. Sci. 2025, 285, 109813. [Google Scholar] [CrossRef]
  52. Zhou, F.; Witkin, D.; Nutt, S.R.; Lavernia, E.J. Formation of Nanostructure in Al Produced by a Low-Energy Ball Milling at Cryogenic Temperature. Mater. Sci. Eng. A 2004, 375, 917–921. [Google Scholar] [CrossRef]
  53. Karar, N. Usefulness of X-Ray Diffraction and Raman Spectra for Understanding Metal Alloy Microstructure Repeatability. IJEMS 2024, 31, 327–334. [Google Scholar] [CrossRef]
  54. Wu, W.; Gui, J.; Zhu, T.; Xie, Z. The Effect of Residual Stress on Whisker Reinforcements in SiCw-Al2O3 Composites during Cooling. J. Alloy. Compd. 2017, 725, 639–643. [Google Scholar] [CrossRef]
  55. Solonenko, D.; Žukauskaitė, A.; Pilz, J.; Moridi, M.; Risquez, S. Raman Spectroscopy and Spectral Signatures of AlScN/Al2O3. Micromachines 2022, 13, 1961. [Google Scholar] [CrossRef]
  56. Woo, D.J.; Hooper, J.P.; Osswald, S.; Bottolfson, B.A.; Brewer, L.N. Low Temperature Synthesis of Carbon Nanotube-Reinforced Aluminum Metal Composite Powders Using Cryogenic Milling. J. Mater. Res. 2014, 29, 2644–2656. [Google Scholar] [CrossRef]
  57. Revo, S.; Hamamda, S.; Ivanenko, K.; Boshko, O.; Djarri, A.; Boubertakh, A. Thermal Analysis of Al + 0.1% CNT Ribbon. Nanoscale Res. Lett. 2015, 10, 170. [Google Scholar] [CrossRef]
  58. González-Hernández, J.E.; Cubero-Sesin, J.M. Electrical Conductivity of Ultrafine-Grained Cu and Al Alloys: Attaining the Best Compromise with Mechanical Properties. Mater. Trans. 2023, 64, 1754–1768. [Google Scholar] [CrossRef]
  59. Wang, M.; Knezevic, M.; Chen, M.; Li, J.; Liu, T.; Wang, G.; Zhao, Y.; Wang, M.; Liu, Q.; Huang, Z.; et al. Microstructure Design to Achieve Optimal Strength, Thermal Stability, and Electrical Conductivity of Al-7.5wt.%Y Alloy. Mater. Sci. Eng. A 2022, 852, 143700. [Google Scholar] [CrossRef]
  60. Orlova, T.S.; Mavlyutov, A.M.; Bondarenko, A.S.; Kasatkin, I.A.; Murashkin, M.Y.; Valiev, R.Z. Influence of Grain Boundary State on Electrical Resistivity of Ultrafine Grained Aluminium. Philos. Mag. 2016, 96, 2429–2444. [Google Scholar] [CrossRef]
  61. Atanacio-Sánchez, X.; Garay-Reyes, C.G.; Martínez-García, A.; Estrada-Guel, I.; Mendoza-Duarte, J.M.; Guerrero-Seañez, P.; González-Sánchez, S.; Rocha-Rangel, E.; De Jesús Cruz-Rivera, J.; Gutiérrez-Castañeda, E.J.; et al. Enhancement of the Electrical Conductivity and Mechanical Properties of Al-Mg-Si and Al-Mg-Zn Ternary Systems After a T8 Heat Treatment. Metals 2024, 14, 1286. [Google Scholar] [CrossRef]
  62. Liu, C.H.; Chen, J.; Lai, Y.X.; Zhu, D.H.; Gu, Y.; Chen, J.H. Enhancing Electrical Conductivity and Strength in Al Alloys by Modification of Conventional Thermo-Mechanical Process. Mater. Des. 2015, 87, 1–5. [Google Scholar] [CrossRef]
  63. Du, Z.; Ye, J.; Yang, L.; Zhang, J. Enhancing Strength and Electrical Conductivity of Pure Aluminum by Microalloying with Telluride. Mater. Res. Express 2021, 8, 086511. [Google Scholar] [CrossRef]
Figure 1. Process flow for treatments.
Eng 06 00328 g001
Figure 2. Metallographic analysis and grain size distribution of (a) pure Al, (b) DCT-6, (c) DCT-12, (d) DCT-18, (e) DCT-24, (f) DCT+A-6, (g) DCT+A-12, (h) DCT+A-18, and (i) DCT+A-24.
Eng 06 00328 g002
Figure 3. Comparison of X-ray diffraction patterns for cryogenically treated aluminium.
Eng 06 00328 g003
Figure 4. (a) Crystallite size vs. dislocation density. (b) Dislocation density vs. microstrain. (c) Crystallite size vs. conductivity. (d) Mobility vs. dislocation density for DCT and DCT+A aluminium samples.
Eng 06 00328 g004
Figure 5. EBSD grain orientation maps and corresponding pole figure intensity (PF) distributions of aluminium under different conditions: (a) Pure Al, (b) DCT-12, (c) DCT-18, (d) DCT+A-12, and (e) DCT+A-18.
Eng 06 00328 g005
Figure 6. SAED pattern, TEM micrograph, and crystallographic orientation analysis of (a) Pure Al, (b) DCT-12, (c) DCT-18, (d) DCT+A-12, and (e) DCT+A-18.
Eng 06 00328 g006
Figure 7. Zone axis of (a) DCT-12, (b) DCT+A-12, (c) DCT-18, and (d) DCT+A-18.
Eng 06 00328 g007
Figure 8. Comparison of Raman spectra for cryogenically treated aluminium.
Eng 06 00328 g008
Table 1. Classification of aluminium specimens based on treatment and soaking hours.
Specimen ClassificationTreatment ConditionSoaking Hours
Pure AlUntreated-
DCT-nDeep cryogenic treatmentn = 6, 12, 18, 24
DCT+A-nDeep cryogenic treatment + Annealingn = 6, 12, 18, 24
Table 2. SEM-EBSD Pole Figure Intensity and Grain Boundaries of Aluminium.
SamplesPole Figure Intensity (mrd)Grain Boundaries
(111)(100)(110)(112)HAGB > 15° (%)LAGB < 15° (%)
Pure Aluminium4.447.294.022.1774.325.7
DCT-128.219.55.833.1359.940.1
DCT+A-125.17.316.92.9254.745.3
DCT-189.029.116.083.151.748.3
DCT+A-188.1110.86.823.154.845.2
Disclaimer/Publisher’s Note: The statements, opinions and data contained in all publications are solely those of the individual author(s) and contributor(s) and not of MDPI and/or the editor(s). MDPI and/or the editor(s) disclaim responsibility for any injury to people or property resulting from any ideas, methods, instructions or products referred to in the content.