Review

Engineering Parameter Design for CO2 Geological Storage: Research Progress and Case Analyses

1
Karamay Campus, China University of Petroleum (Beijing), Karamay 834000, China
2
Hainan Institute of China University of Petroleum (Beijing), Sanya 572024, China
3
Oil Extraction Technology Research Institute of Xinjiang Oilfield Company, Karamay 834000, China
*
Author to whom correspondence should be addressed.
Eng 2025, 6(11), 329; https://doi.org/10.3390/eng6110329
Submission received: 24 September 2025 / Revised: 13 November 2025 / Accepted: 14 November 2025 / Published: 18 November 2025
(This article belongs to the Special Issue Geological Storage and Engineering Application of Gases)

Abstract

Carbon Capture and Storage (CCS) is a critical technology for promoting carbon reduction and achieving the carbon neutrality goal. As a vital component of CCS projects, the injection process makes it especially important to clarify wellsite layout methods, wellbore parameters, and injection parameters for the safe and efficient storage of CO2. This article presents a survey of engineering parameter design in typical domestic and international comprehensively compares and analyzes multi-dimensional parameters under different storage conditions such as saline aquifers and basalt, and clarifies the basic adaptation logic that storage types determine engineering parameters, the requirement that engineering designs should be formulated according to reservoir characteristics, and the need for dynamic adjustment of engineering parameters based on actual conditions. Meanwhile, the paper identifies various challenges, including geological hazards in wellsite selection, wellbore corrosion risks, loss of control over injection pressure, and storage safety, corrosion risks, and CO2 leakage risks caused by thermodynamic phase transitions. It puts forward suggestions such as risk prevention and control strategies, wellbore integrity guarantee systems, injection optimization methods, and leakage prevention and control systems, providing a basis for the engineering design and safety assessment of CCS projects.

1. Introduction

The application of CO2 in the petroleum industry can be traced back to the 1970s, when it was mainly used for CO2-enhanced oil recovery (CO2-EOR) [1]. Since the beginning of the 21st century, with improved understanding of the deterioration of the climate and environment caused by massive greenhouse gas emissions, carbon reduction has become a common goal of countries around the world [2]. In this context, Carbon Capture and Storage technology has emerged and found widespread application. For example, the Weyburn Project in Canada has permanently stored 20 million metric tonnes of CO2, and the depleted Rousse Gas Field in southwestern France stores 150,000 metric tonnes of CO2 annually [3]. The CO2 injection process is a crucial aspect of CCS technology, which refers to the process of injecting CO2 into reservoirs through wellbores. Since wellbores are the main channels for CO2 leakage [4], the success of the injection process is directly related to sequestration effectiveness and long-term safety. From an engineering perspective, the factors affecting CO2 injection and long-term sequestration can be divided into three categories. First, wellsite layout, including the number, distribution pattern, and spacing of injection/monitoring wells, affects the uniformity of CO2 distribution in reservoirs and the effectiveness of monitoring. Second, wellbore design, including cement slurry performance, casing setting depth, casing selection, and corrosion protection level, directly affects the integrity of wellbores in injection wells. For instance, the corrosion resistance of cement slurry and casing can directly determine the sealing performance of wellbores in corrosive environments, and high-performance cement slurry and casing can effectively prevent CO2 leakage along wellbores. Third, injection parameters, including injection temperature, pressure, displacement rate, and method, have a significant impact on plume morphology and migration behavior. A reasonable injection temperature and pressure can ensure that CO2 exists in a supercritical state in wellbores and formations, increasing plume fluidity and sequestration capacity. The supercritical state of CO2 refers to a state formed when CO2 exceeds the critical temperature and pressure, where the boundary between gas and liquid phases disappears. It combines the high density of liquids with the low viscosity and high diffusion coefficient of gases. High density can greatly increase the storage capacity per unit volume and reduce sequestration costs; low viscosity and high diffusivity can promote the migration and trapping of CO2 in reservoir pores, reduce injection energy consumption, and it is the optimal state for CO2 geological storage [5,6]. Meanwhile, an appropriate injection displacement rate can control the rate of pressure change, preventing CO2 from breaking through the caprock or activating faults.
There is a close mutual coupling effect among wellsite layout, wellbore design, and injection parameters (see Figure 1). Wellsite layout provides monitoring support for the regulation of injection parameters through the number, spacing, and distribution pattern of injection and monitoring wells: real-time pressure and temperature data obtained by monitoring wells can guide the dynamic adjustment of injection rate and pressure, and reasonable well spacing can avoid formation pressure rise caused by high injection rates. Wellbore design parameters such as well depth, casing material, and cement sheath corrosion resistance define the safe range of injection parameters: well depth determines the bottomhole temperature and pressure thresholds, which in turn affect the phase state of CO2; corrosion-resistant wellbore materials can resist carbonic acid formed by CO2 and formation water during injection, avoiding wellbore corrosion and leakage. Injection parameters, in turn, react on the previous two. Only the coordinated adaptation of the three can ensure the safe and efficient injection and storage of CO2.
This article aims to systematically sort out the operation and injection status of global CO2 geological storage projects, summarize the wellsite layout, wellbore design, and injection parameters of different projects. On this basis, through a comprehensive comparison of multi-dimensional parameters under different formation types such as sandstone reservoirs and basalt, it provides a reference for the optimal design of engineering parameters for subsequent CO2 geological storage. Meanwhile, it summarizes various challenges facing efficient injection operations, including geological hazards in wellsite selection, wellbore corrosion risks, loss of control over injection pressure, and storage safety, corrosion risks, and CO2 leakage risks caused by thermodynamic phase transitions and water accumulation, and puts forward targeted development suggestions and optimization paths.

2. Basic Overview of Global CCS Project Development

With the signing of the Paris Agreement and the proposal of the global temperature rise targets of 2 °C/1.5 °C, major countries around the world formulated carbon reduction plans and announced carbon commitments. In November 2023, the 28th Conference of the Parties (COP28) to the United Nations Framework Convention on Climate Change (UNFCCC) decided to further scale up climate action within the next decade [7]. With this decision, major countries worldwide have leveraged their unique resources and advantages to advance CCS projects, demonstrating strong momentum in the global movement toward sustainable development and the fulfillment of carbon neutrality commitments.
To ensure the representativeness of this paper and the reliability of the analysis conclusions, the selection criteria for CCS projects are as follows: First, geological representativeness—covering three mainstream storage formations (sandstone saline aquifers, basalt saline aquifers, and depleted oil and gas reservoirs) to reflect the law of technical adaptation under different geological conditions. Second, coverage of maturity levels—including different stages such as short-term demonstration, mid-term pilot, and long-term commercial operation, balancing innovative exploration and technical stability. Third, geographical extensiveness—covering major global CCS technology application regions such as Europe, the Americas, and the Asia-Pacific region to present the impact of regional geological differences on project design. Based on the above criteria, the following typical CCS projects are selected.

2.1. European and African Regions

The Sleipner Project, located in the Norwegian North Sea, is the world’s earliest commercial CCS project and the first offshore CCS project globally. It injects CO2 into the nearby Utsira Aquifer [8]. Since 2014, CO2 from the Gudrun Gas Field has also been sequestered here. As of 2024, the sequestration capacity of the Utsira formation has exceeded 20 million metric tonnes, with an injection rate of 2700 t/d [9].
The Snøhvit Project is the second commercial CCS project in Norway. CO2 separated from the Snøhvit Gas Field is reinjected through a single well into a saline aquifer with a water depth of 290–350 m and a formation depth of approximately 2500 m [10]. CO2 injection began in 2008, with an annual injection rate of 700,000 metric tonnes and a planned sequestration capacity of 23 million metric tonnes [11]. In April 2011, the pressure in the Tubåen Formation (where CO2 was originally injected) rose faster than expected; continued injection might have caused caprock damage, so injection was halted. As a result, the expected sequestration capacity of the Tubåen Formation was not reached. Afterwards, CO2 continued to be injected at a constant rate into the Stø Formation, an Early Jurassic sandstone reservoir [12].
The CarbFix Project in Iceland is the world’s first basalt mineralization-based CO2 storage project, which involves CO2 reacting with metal ions in formation rocks to form carbonate precipitates that are solidified in the formation. The project captures CO2-H2S waste gas generated by the Hellisheiði Geothermal Power Plant and injects it into the basalt formation at a depth of over 400 m [13]. The project is divided into two phases. In the first, CarbFix1, 248 metric tonnes of mixed gas was injected. By the end of 2017, in CarbFix2, a total of 23,104 metric tonnes of CO2 and 11,853 metric tonnes of H2S had been injected [14], and by the end of 2024, over 100,000 metric tonnes [15] of CO2 had been injected. Monitoring via isotope tracers (14C/12C) showed that approximately 95% of the CO2 [16] from CarbFix1 was mineralized two years after injection. This project demonstrates the potential of mineralization storage as a safe long-term storage method and provides a new perspective and solution for the selection of storage sites and formations.
The Ketzin Project in Germany is the longest-operating onshore CCS project in Europe [17], which was designed to capture and store CO2 from nearby power plants. Since June 2008, gaseous CO2 has been injected into the sandstone formation 630–650 m underground [18]. By August 2013, approximately 67,000 metric tonnes of CO2 had been injected into the saline aquifer for sequestration [19], with a total injection rate of 48 t/d [20].
The natural gas produced from the In Salah Oilfield in Algeria has a carbon content of 1–9%, which is far higher than the 0.3% requirement for marketable natural gas. Therefore, it is necessary to separate CO2 from the natural gas and inject it into the Carboniferous Krechba Formation for sequestration. The project commenced CO2 injection in April 2004 and ceased operations in 2011, with a total injection volume of 4 million tons of CO2 [21].

2.2. Americas

In 2015, Canada’s Quest Project injected CO2 emitted from the Scotford bitumen-ugrading facility in the oil sands into a Cambrian saline aquifer at a depth of approximately 2000 m [22]. In the first year after injection had commenced, the target injection rate of 1 million metric tonnes per year was achieved [23]. In July 2020, the Quest CCS Project had successfully sequestered 5 million metric tonnes of CO2, and by 2022, the safe injection volume had exceeded 7 million metric tonnes, meeting expectations [24].
The Decatur Project, also called the Illinois Basin—Decatur Project, is a CCS project located in Decatur, IL, USA, which was designed to store CO2 captured from an ethanol fermentation plant. Injection began in November 2011 and ceased in September 2014, with a total injection volume of 925,300 metric tonnes [25] and an injection rate of approximately 1000 t/d [26].
The Wallula Pilot Project was officially launched in 2009. It is the world’s first project to use supercritical CO2 for in situ mineralization storage in flood basalt formations at a depth of 800 to 900 m [27]. The project’s injection operation was completed within 25 days (from July to August 2013), with a total injection volume of 1000 metric tonnes. Well analysis after injection showed that CO2 was located at the top of the injection zone, with no upward migration [28]. In addition, analysis of shallow soil gas around the injection well found no leakage, indicating the success of the storage process. It is estimated that approximately 60% of the CO2 was sequestered through mineralization within two years [15].
Since the discovery of Brazil’s Pre-Salt Oilfield in 2006, the associated gas of several oilfields has been confirmed to be rich in CO2. Driven by the need to implement enhanced oil recovery (EOR) and expectations of stricter environmental regulations in the future, operators decided to begin reinjecting the produced CO2 into four sub-oilfields (Búzios, Mero, Tupi, and Sapinhoá) at the initial stage of production [29]. As of 2023, the injection volume of the Tupi Oilfield alone has exceeded 14 million metric tonnes, and the cumulative injection volume across the entire Santos Basin has exceeded 40 million metric tonnes. Compared with projects such as Gorgon and Quest, which face technical challenges and injection rate constraints, the Pre-Salt Oilfield has demonstrated significant progress [30].
The Weyburn Project is a major global Carbon Capture and Storage demonstration project. The CO2 for the project is derived from coal gasification by-products of the Great Plains Synfuels Plant in Beulah, ND, USA. Officially launched in October 2000, the project had a cumulative injection volume of 16.1 million metric tonnes by 2010, with an estimated total sequestration capacity exceeding 30 million metric tonnes. It achieves CO2 geological storage through CO2-enhanced oil recovery technology, providing important practical basis for global CCS technology.
The Pembina Oilfield CO2-EOR Project is located in Alberta, Canada. Its carbon source is high-concentration CO2 captured from industrial processes. In phases from 2005 to 2008, the project injected supercritical CO2 into the Cardium Formation, with a cumulative sequestration volume of approximately 66,000 metric tonnes. It is primarily used for enhancing oil recovery and testing carbon storage technology.

2.3. Asia-Pacific Region

Australia’s Gorgon Project is one of the world’s largest liquefied natural gas (LNG) projects. With a carbon content as high as 14% in its natural gas, a large amount of CO2 needs to be sequestered [31]. The project began construction in 2006, and CO2 injection started in 2019. It is expected to inject 129 million metric tonnes of CO2 into the Dupuy Formation, with an annual sequestration capacity of 4 million metric tonnes [32]. As of 2022, the actual sequestration volume had reached 7 million metric tonnes [33].
Shenhua CCS Project is China’s first and Asia’s largest coal-based CCS demonstration project, as well as the world’s first full-process project to realize multi-layer injection and zonal monitoring of CO2 in deep saline aquifers with low porosity and permeability [34]. The project captures CO2 emitted from the Shenhua Coal Liquefaction Plant and injects it into a saline aquifer approximately 10 km west of the plant for sequestration [35]. Injection officially started in May 2011 and finished in June 2014, with an injection rate of 100,000 metric tonnes per year. When injection was stopped, the sequestration volume had reached 300,000 metric tonnes [36,37].
In June 2023, China’s first 1-million-metric-tonnes-scale offshore CO2 sequestration demonstration project—the Enping 15-1 Oilfield CO2 Sequestration Demonstration Project—was officially put into operation. It is expected to have an annual sequestration capacity of approximately 300,000 metric tonnes and a cumulative sequestration volume of over 1.46 million metric tonnes [38]. The project separates and dehydrates the associated CO2 from the offshore oilfield and reinjects it into a saline aquifer 820 m underground, further contributing to China’s green and low-carbon development in offshore areas [39].
The Nagaoka Project is Japan’s first carbon sequestration pilot program. From July 2003 to January 2005, high-concentration CO2 (99.9%) was injected into the Haizume Formation on a daily basis, with a cumulative injection volume of 10,400 metric tonnes within 17 months. The project concluded in 2007, and subsequent work has focused primarily on reservoir monitoring [15]. During the injection process, pressure drove the diffusion of CO2, which in turn promoted the dissolution of rock minerals such as plagioclase and chlorite in the Haizume Formation, leading to the formation of more stable carbonate precipitates—providing conclusive evidence for the existence of mineralization mechanisms [40].
The Tomakomai Project, located in the marine area near Tomakomai, Hokkaido Prefecture, Japan, operated from 2016 to 2019. Its CO2 was sourced from the hydrogen production units of oil refineries in the coastal area of Tomakomai Port. The project’s target was to inject a total of 300,000 metric tonnes within three years, and as of April 2018, the injection volume had reached 170,000 metric tonnes [41]. This project, which was the first to implement the full CCS chain in a seismically active country, is characterized by low energy consumption throughout the CO2 capture process; two high-angle injection wells drilled from the onshore injection site to target the optimal storage locations in two independent subsea reservoirs; and a comprehensive marine monitoring system, which was used to observe CO2 migration in the reservoir, microseismic activity, and natural earthquakes [42].
On a global scale, the development of CO2 sequestration technology exhibits distinct geographical differences. Established developed countries such as the United States, Europe, and Canada are currently at the forefront. Although emerging economies like China, Brazil, and Japan started relatively late, they have also made significant progress in policy promotion and technological innovation in recent years. Projects including the Shenhua CCS Project, the Enping 15-1 Oilfield Demonstration Project, and Brazil’s Pre-Salt CCS Project demonstrate the great potential of emerging countries in the field of CO2 sequestration.
Table 1 summarizes the carbon sources, CO2 sequestration volumes, and other relevant information for various projects.

3. Saline Aquifer Storage Project

In CO2 geological storage, the intrinsic physical properties (porosity, permeability, mineral composition) of formation types (sandstone saline aquifers, basalt saline aquifers, depleted oil and gas reservoirs) and temperature-pressure conditions (dominated by burial depth) jointly determine CO2 behavior and injection rate from two aspects: phase state change and flow resistance. Pressure ≥7.38 MPa and temperature ≥31.1 °C can ensure CO2 reaches a supercritical state, which combines high density and low viscosity characteristics—significantly reducing flow resistance and improving injection rate. If the burial depth is shallow resulting in insufficient temperature and pressure, CO2 exists in a gaseous state; due to its low density and large volume, the injection rate will be greatly limited. For basalt, the sequestration effect is determined by mineralization reactions, and the impact of temperature and pressure on phase state is more closely related to mineralization efficiency. Therefore, dissolving CO2 is preferred to improve contact efficiency, which facilitates interaction with ions such as Ca2+ and Mg2+ in rocks, thereby enhancing mineralization reaction efficiency. For depleted oil and gas reservoirs, the geological structure can be clarified through prior development, and their temperature and pressure parameters meet supercritical conditions, so CO2 is injected in a supercritical state. The injection rate is mainly affected by the distribution of residual reservoir fluids and pore connectivity: high-permeability reservoirs have low injection resistance and high injection rate. If the reservoir contains closed faults or low-permeability interbeds, pressure accumulation is likely to occur, indirectly restricting the upper injection limit.
Saline aquifer storage is an important CO2 geological storage technology, which mainly involves injecting captured CO2 into deep underground saline aquifers to achieve long-term isolation and large-scale carbon emission reduction. These saline aquifers are usually located in formations below 800 m with high mineralization degree (salinity ≥ 3 g/L), making them ideal storage media. The injected CO2 diffuses into rock pores in a supercritical state and is stably trapped through various mechanisms. This technology has the advantages of large storage potential, low environmental risks, and no occupation of freshwater resources, and has become an important part of global carbon storage technology.

3.1. Norway’s Sleipner Project

The Sleipner Project utilizes Well 15/9-A-16 [43] for CO2 reinjection, which has a wellbore diameter of 177.8 mm. The section of the well where the reservoir is located is perforated, and a screen has been installed for sand control. To ensure a 25-year service life, the casing is made of 25% Cr duplex stainless steel. During injection, the wellhead temperature is maintained at 25 °C and the pressure ranges from 6.2 to 6.5 MPa [44], which ensures that CO2 enters the reservoir in the form of dense-phase flow. Dense-phase flow combines the characteristics of high density and low viscosity. Ensuring that CO2 enters the reservoir in the form of dense-phase flow can avoid phase transitions in the underground environment, guarantee that the injected fluid has high density and strong dissolution capacity, thereby improving sequestration efficiency [45]. The bottomhole temperature of the injected CO2 is 48 °C; the bottomhole pressure has not been measured, but it has been confirmed that the increase is less than 0.5 MPa. The injection rate can reach 2700 metric tonnes per day [46].
The injection rate is a key factor affecting the sequestration effect. Reasonably adjusting this injection rate can minimize the risk of CO2 leakage [47]. A lower injection rate may lead to a slower diffusion rate of CO2 in the saline aquifer, because CO2 requires more time to permeate into its pores, which delays CO2 convection and diffusion processes. A higher injection rate can improve CO2 injection efficiency, but it may fracture the formation and cause CO2 leakage [48]. The injection rate and volume of the Utsira Formation are significantly higher than those of other industrial projects. The continuous and stable injection rate featured in this project and the 4D seismic images show that the reservoir pressure is only slightly higher than the hydrostatic pressure; therefore, the injection parameters of this project are considered to be appropriate [44].

3.2. Norway’s Snøhvit Project

The identification number of the injection well in the Snøhvit Project is 7121/4-F-2H [49], and the well features a combination of two stainless-steel casings 114.3 mm and 177.8 mm in size, with a maximum well deviation angle of 27°. The CO2 transported to the wellhead via a pipeline has a temperature of 4 °C; after being injected into the wellbore at a rate of 2000 t/d, the CO2 is heated by the formation, with an initial temperature of 98 °C [50], and the bottomhole temperature drops to 95 °C [51]. The reservoir pressure before injection is 28.5 MPa, and the formation fracture pressure is 39 MPa, which means the bottomhole pressure needs to be controlled between 28.5 MPa and 39 MPa. Therefore, on the premise of ensuring bottomhole safety, the wellhead pressure range is set between 7.8 MPa and 17.4 MPa, which ensures that CO2 exists in a supercritical state downhole while guaranteeing the safety of the entire injection process [52].
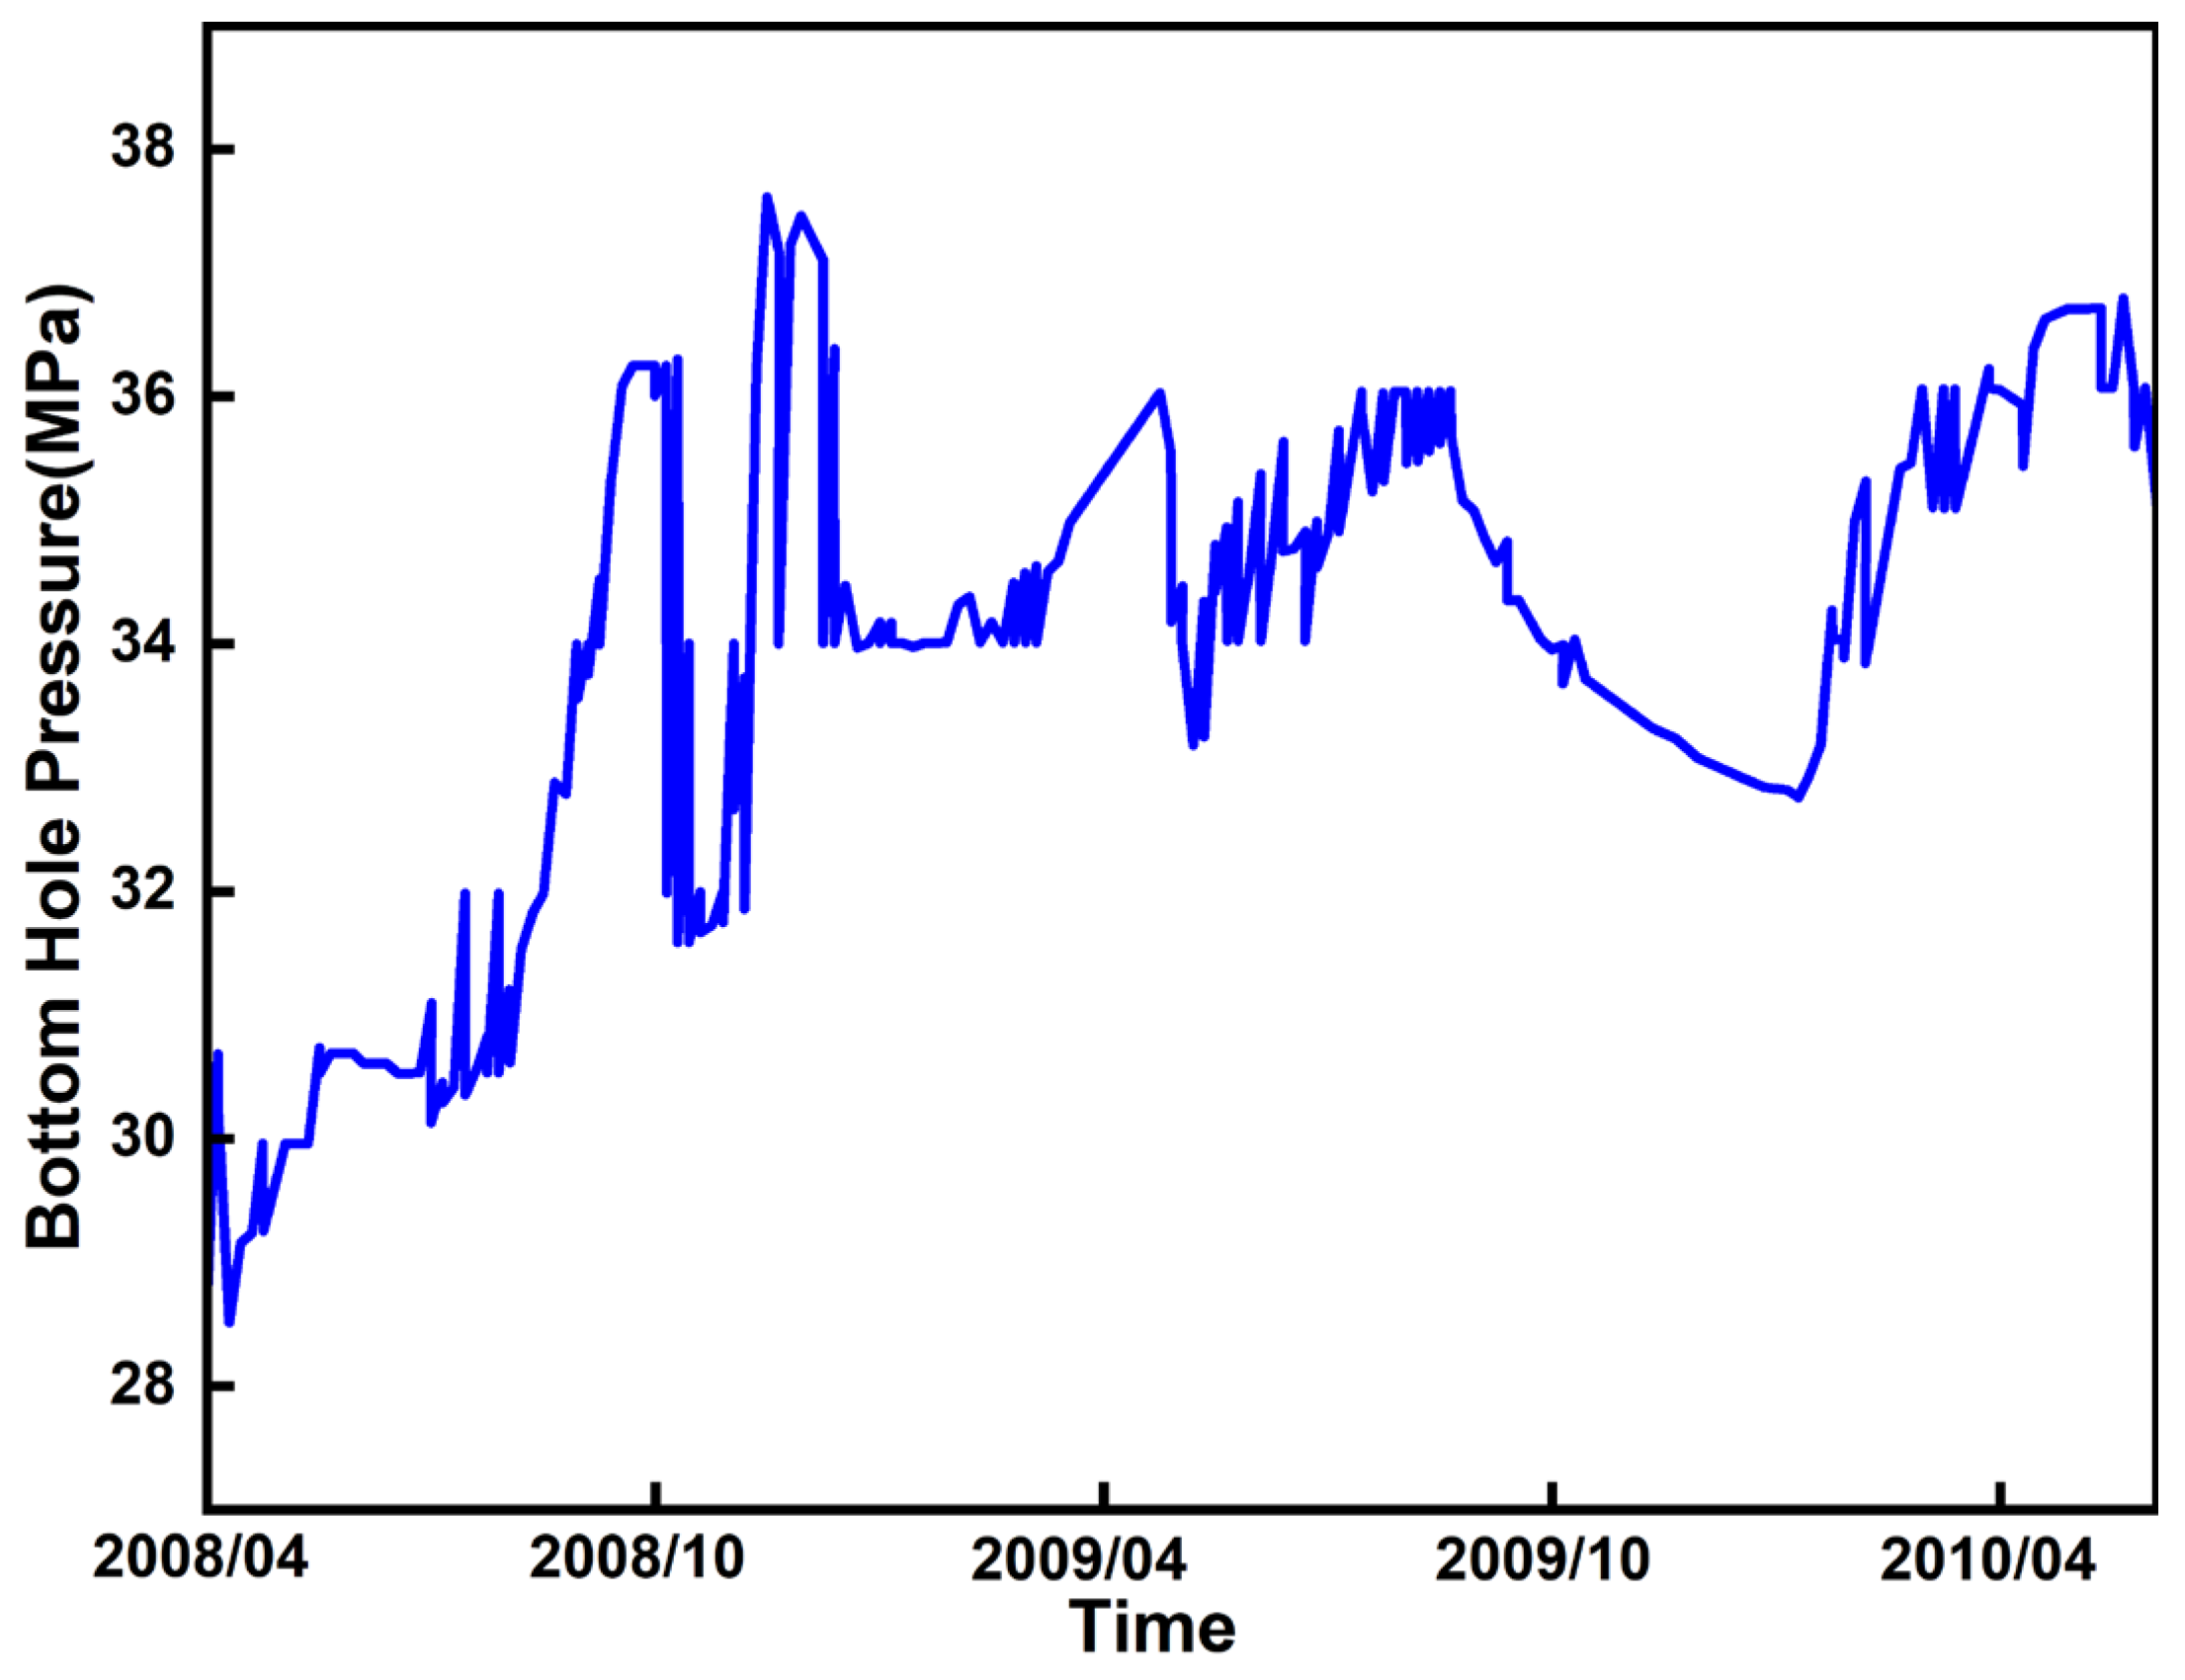
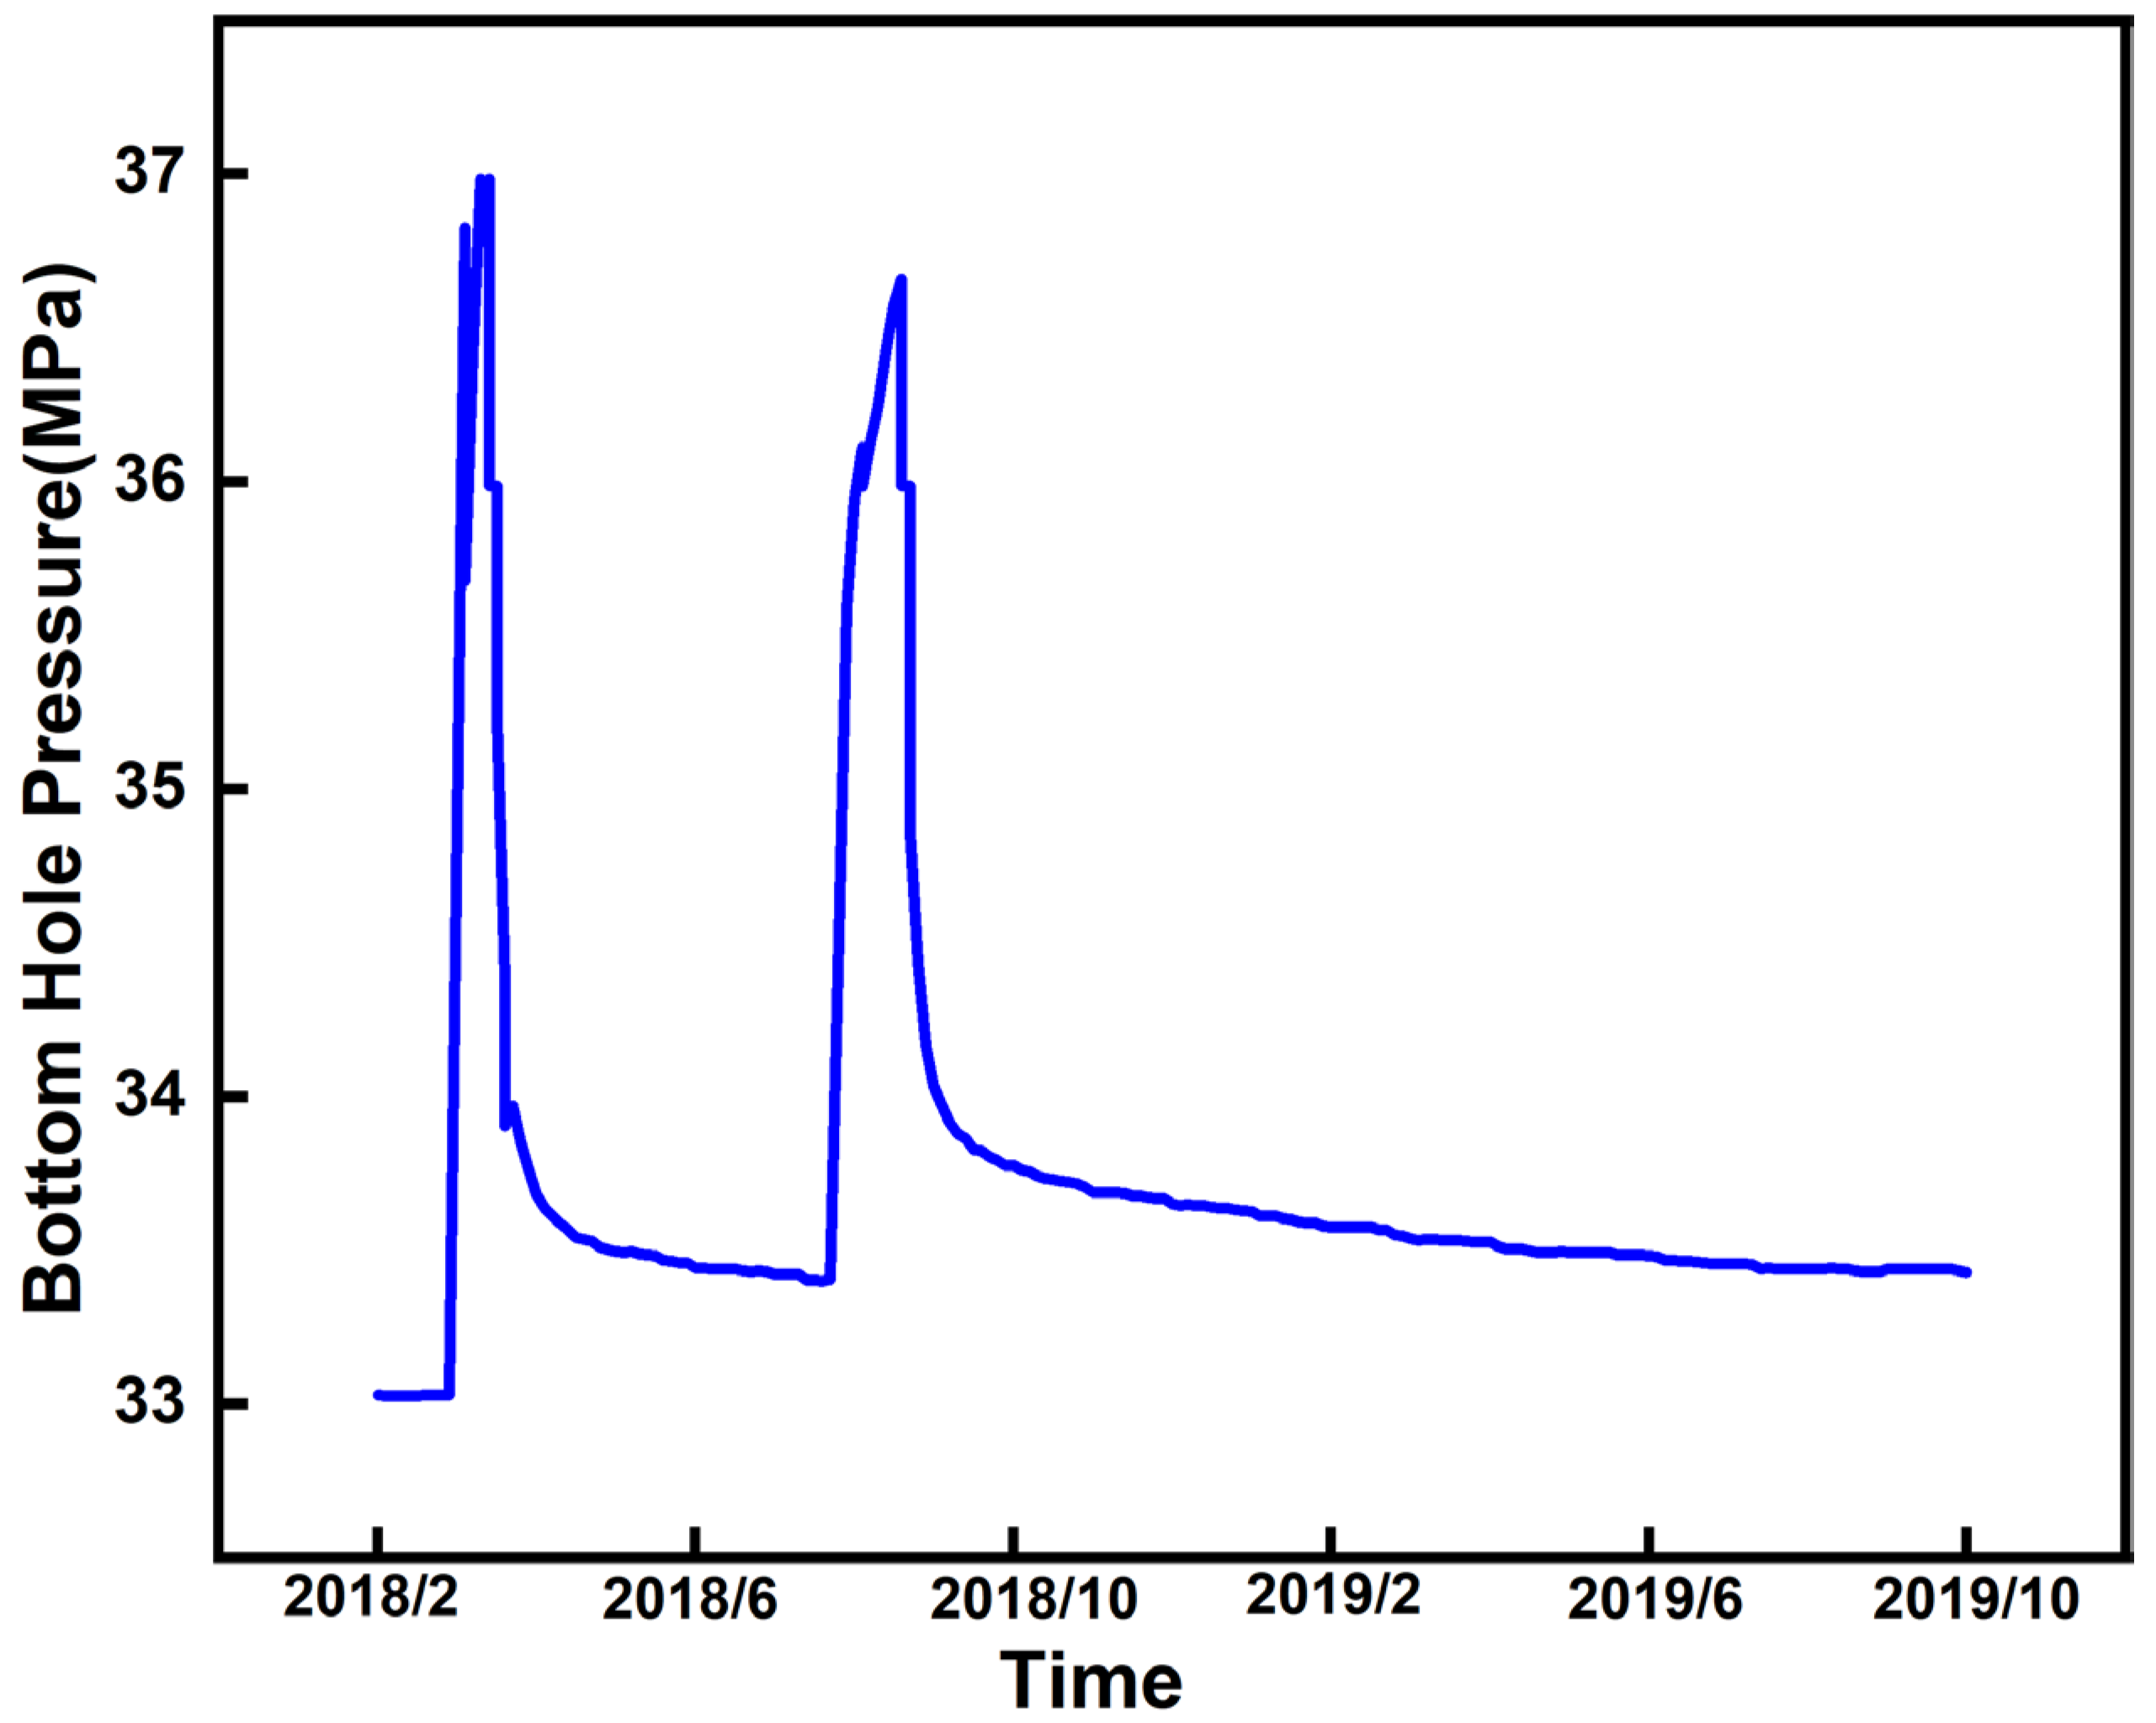
A serious problem was encountered during the injection process at the Snøhvit Project: a sharp rise in bottomhole pressure in the early stages. In 2009, after injecting approximately 500,000 metric tonnes of CO2, the bottomhole pressure reached 35.5 MPa when the well was shut in, 7 MPa higher than the initial reservoir pressure. This problem was alleviated after downhole MEG (monoethylene glycol) cleaning, but the rate at which the pressure rose still exceeded the expected rate for the project’s 25-year service life. The reason for the rise in pressure during this period is closely related to the high salinity of formation water (160,000 mg/L) and the salt precipitation effect caused by it; injection of dry CO2 dried out the formation sandstone and increased the salt concentration, leading to salt precipitation and reduced formation injectivity [50]. After CO2 injection resumed in January 2010, the pressure rose to 36 MPa by May 2010 and further increased to 36.8 MPa by December 2010. Figure 2 shows the variation in bottomhole pressure from April 2008 to May 2010; during this period, the peak bottomhole pressure reached 38 MPa, which is close to the formation fracture pressure and has posed a threat to sequestration safety. Therefore, injection into the Tubåen Formation was stopped [53], and subsequent injection was switched to the backup reservoir, the Stø Group [44].
Before the project’s initiation, it was predicted that injection into the Tubåen Formation would take place for between 6 months and 18 years, depending on the actual reservoir characteristics and the presence of faults and flow barriers in the reservoir. Even if the Tubåen Formation is completely sealed from its formation environment, its CO2 storage capacity is still sufficient for 7 to 12 years of injection. However, if the faults separating the southern and northern parts of the Tubåen Formation are also completely sealed, the pressure in the Tubåen Formation may reach the fracture pressure within 6 months. Therefore, the rapid pressure rise in the later stages is thought to be due to the sealing of the main faults in the Tubåen Formation, which hinder the lateral migration of the CO2 plume—this has been confirmed by 4D seismic monitoring [50].

3.3. Germany’s Ketzin Project

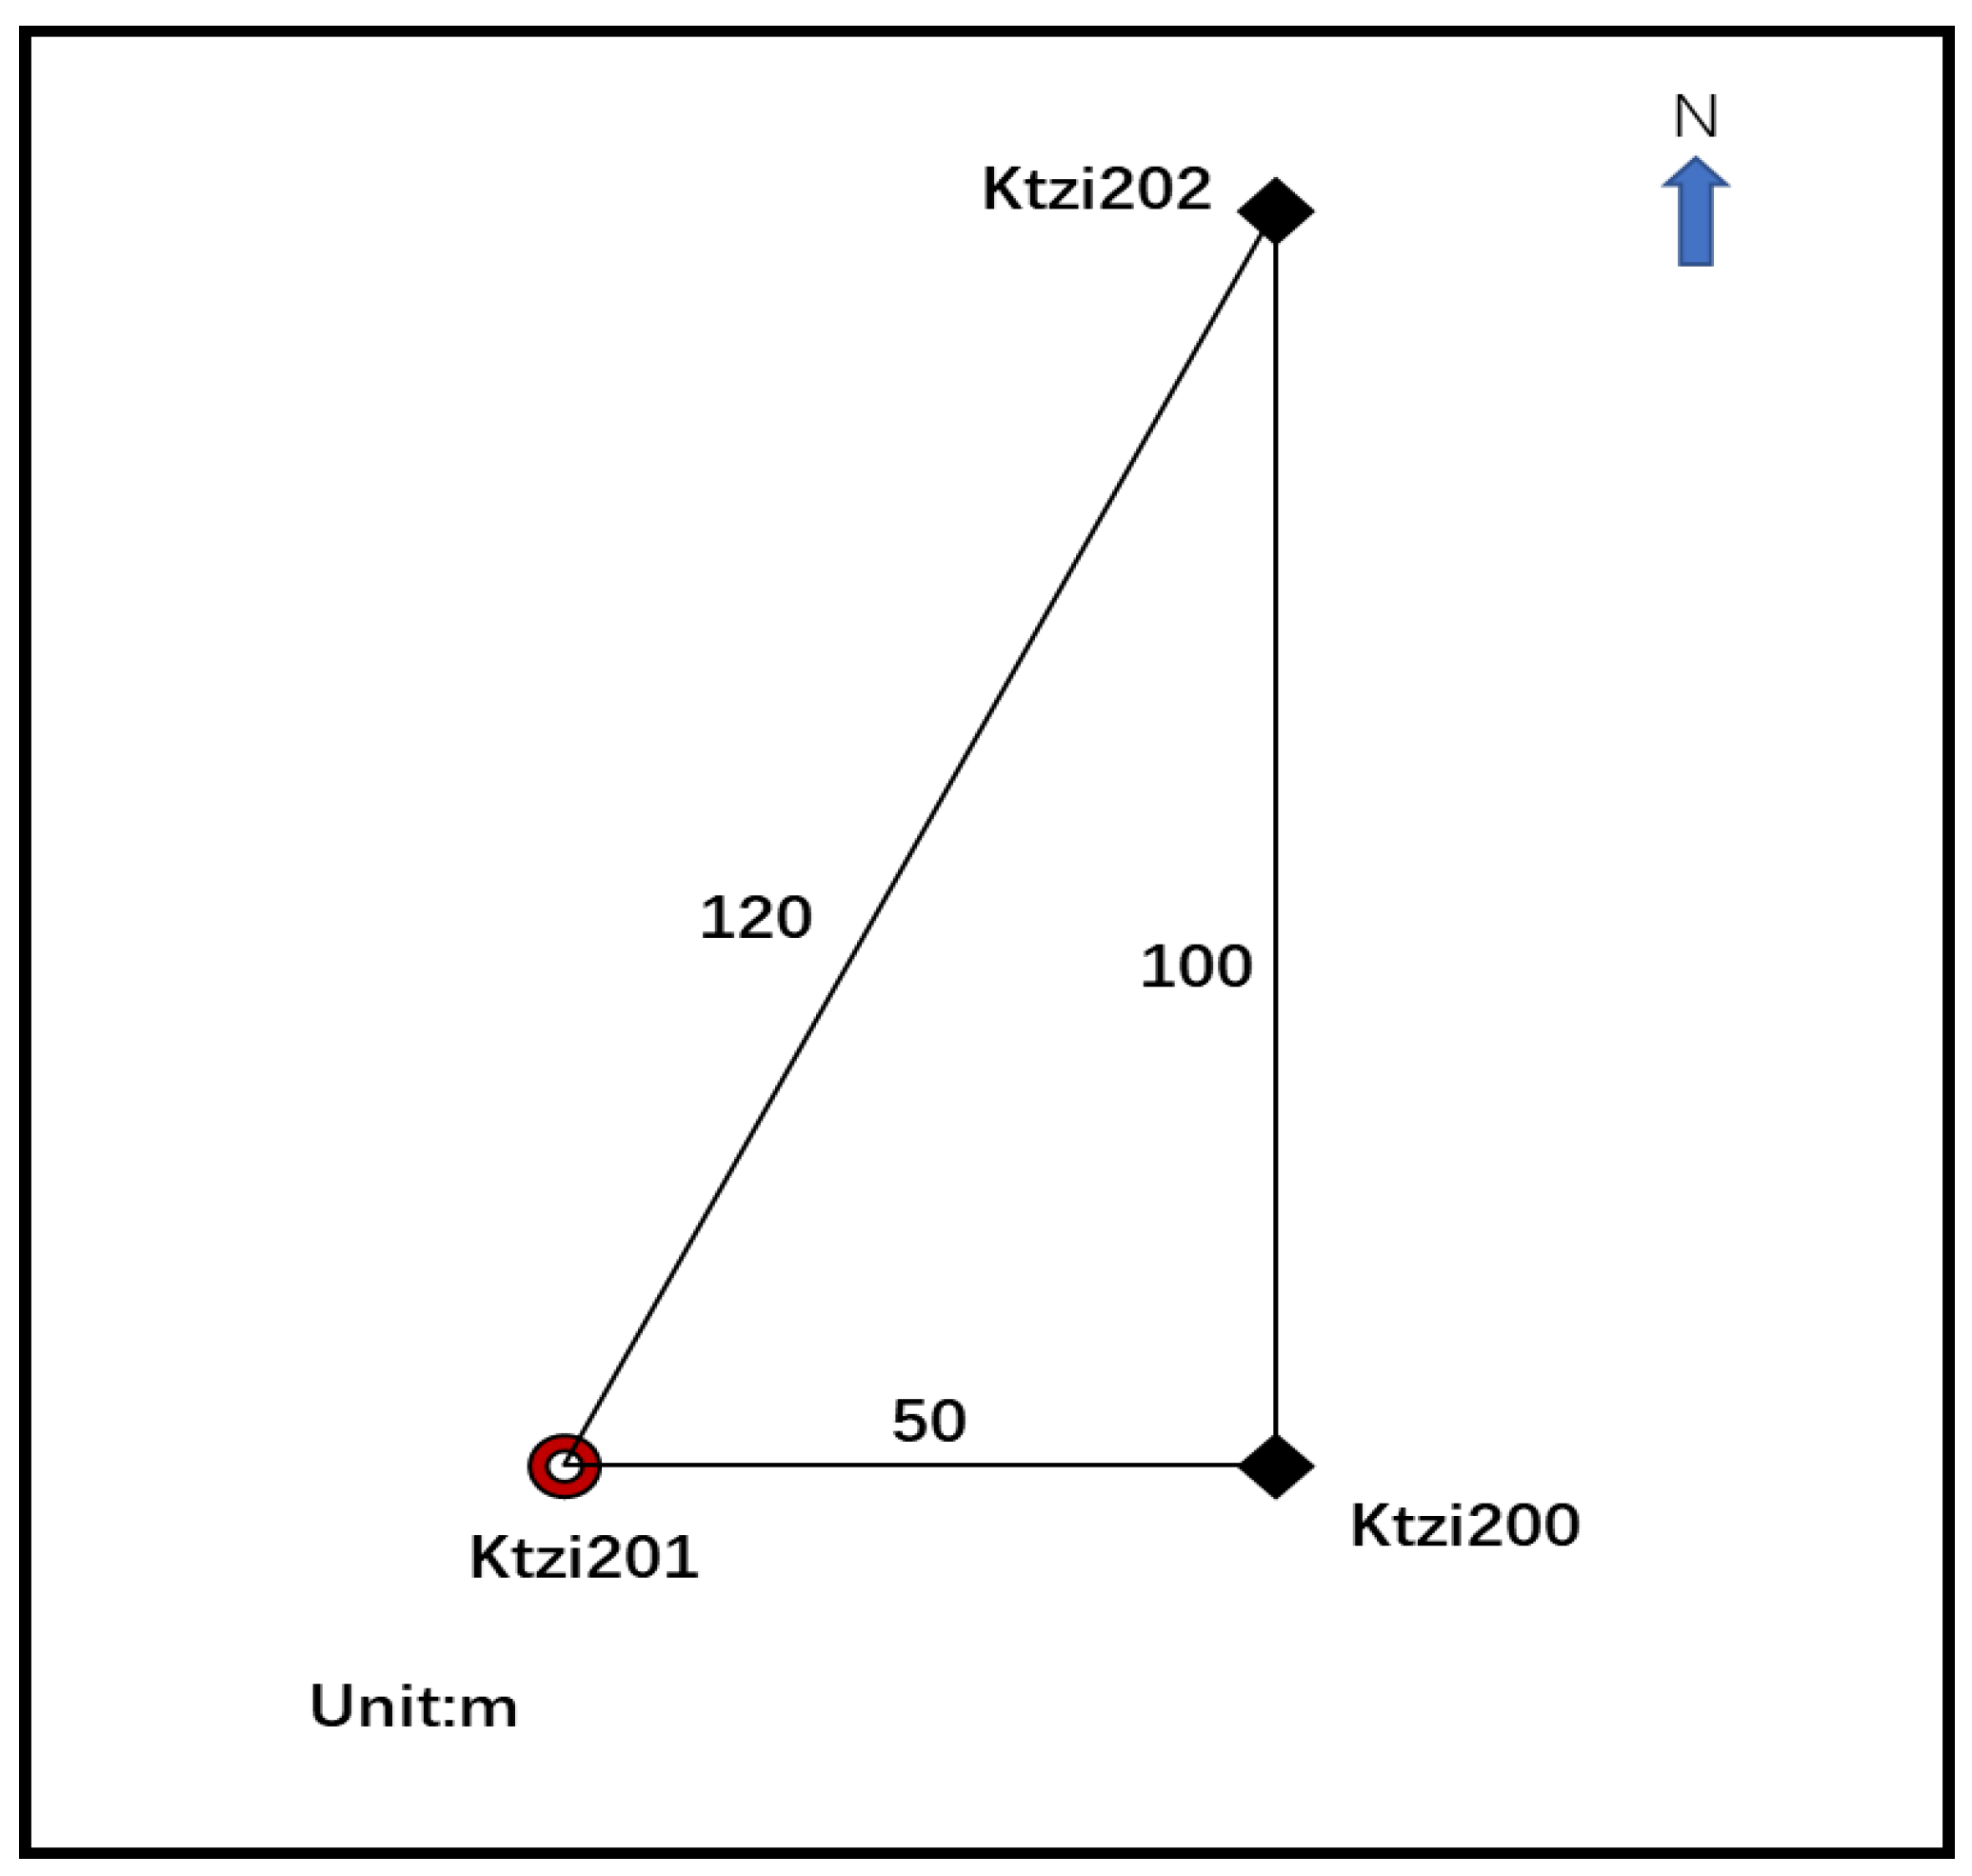
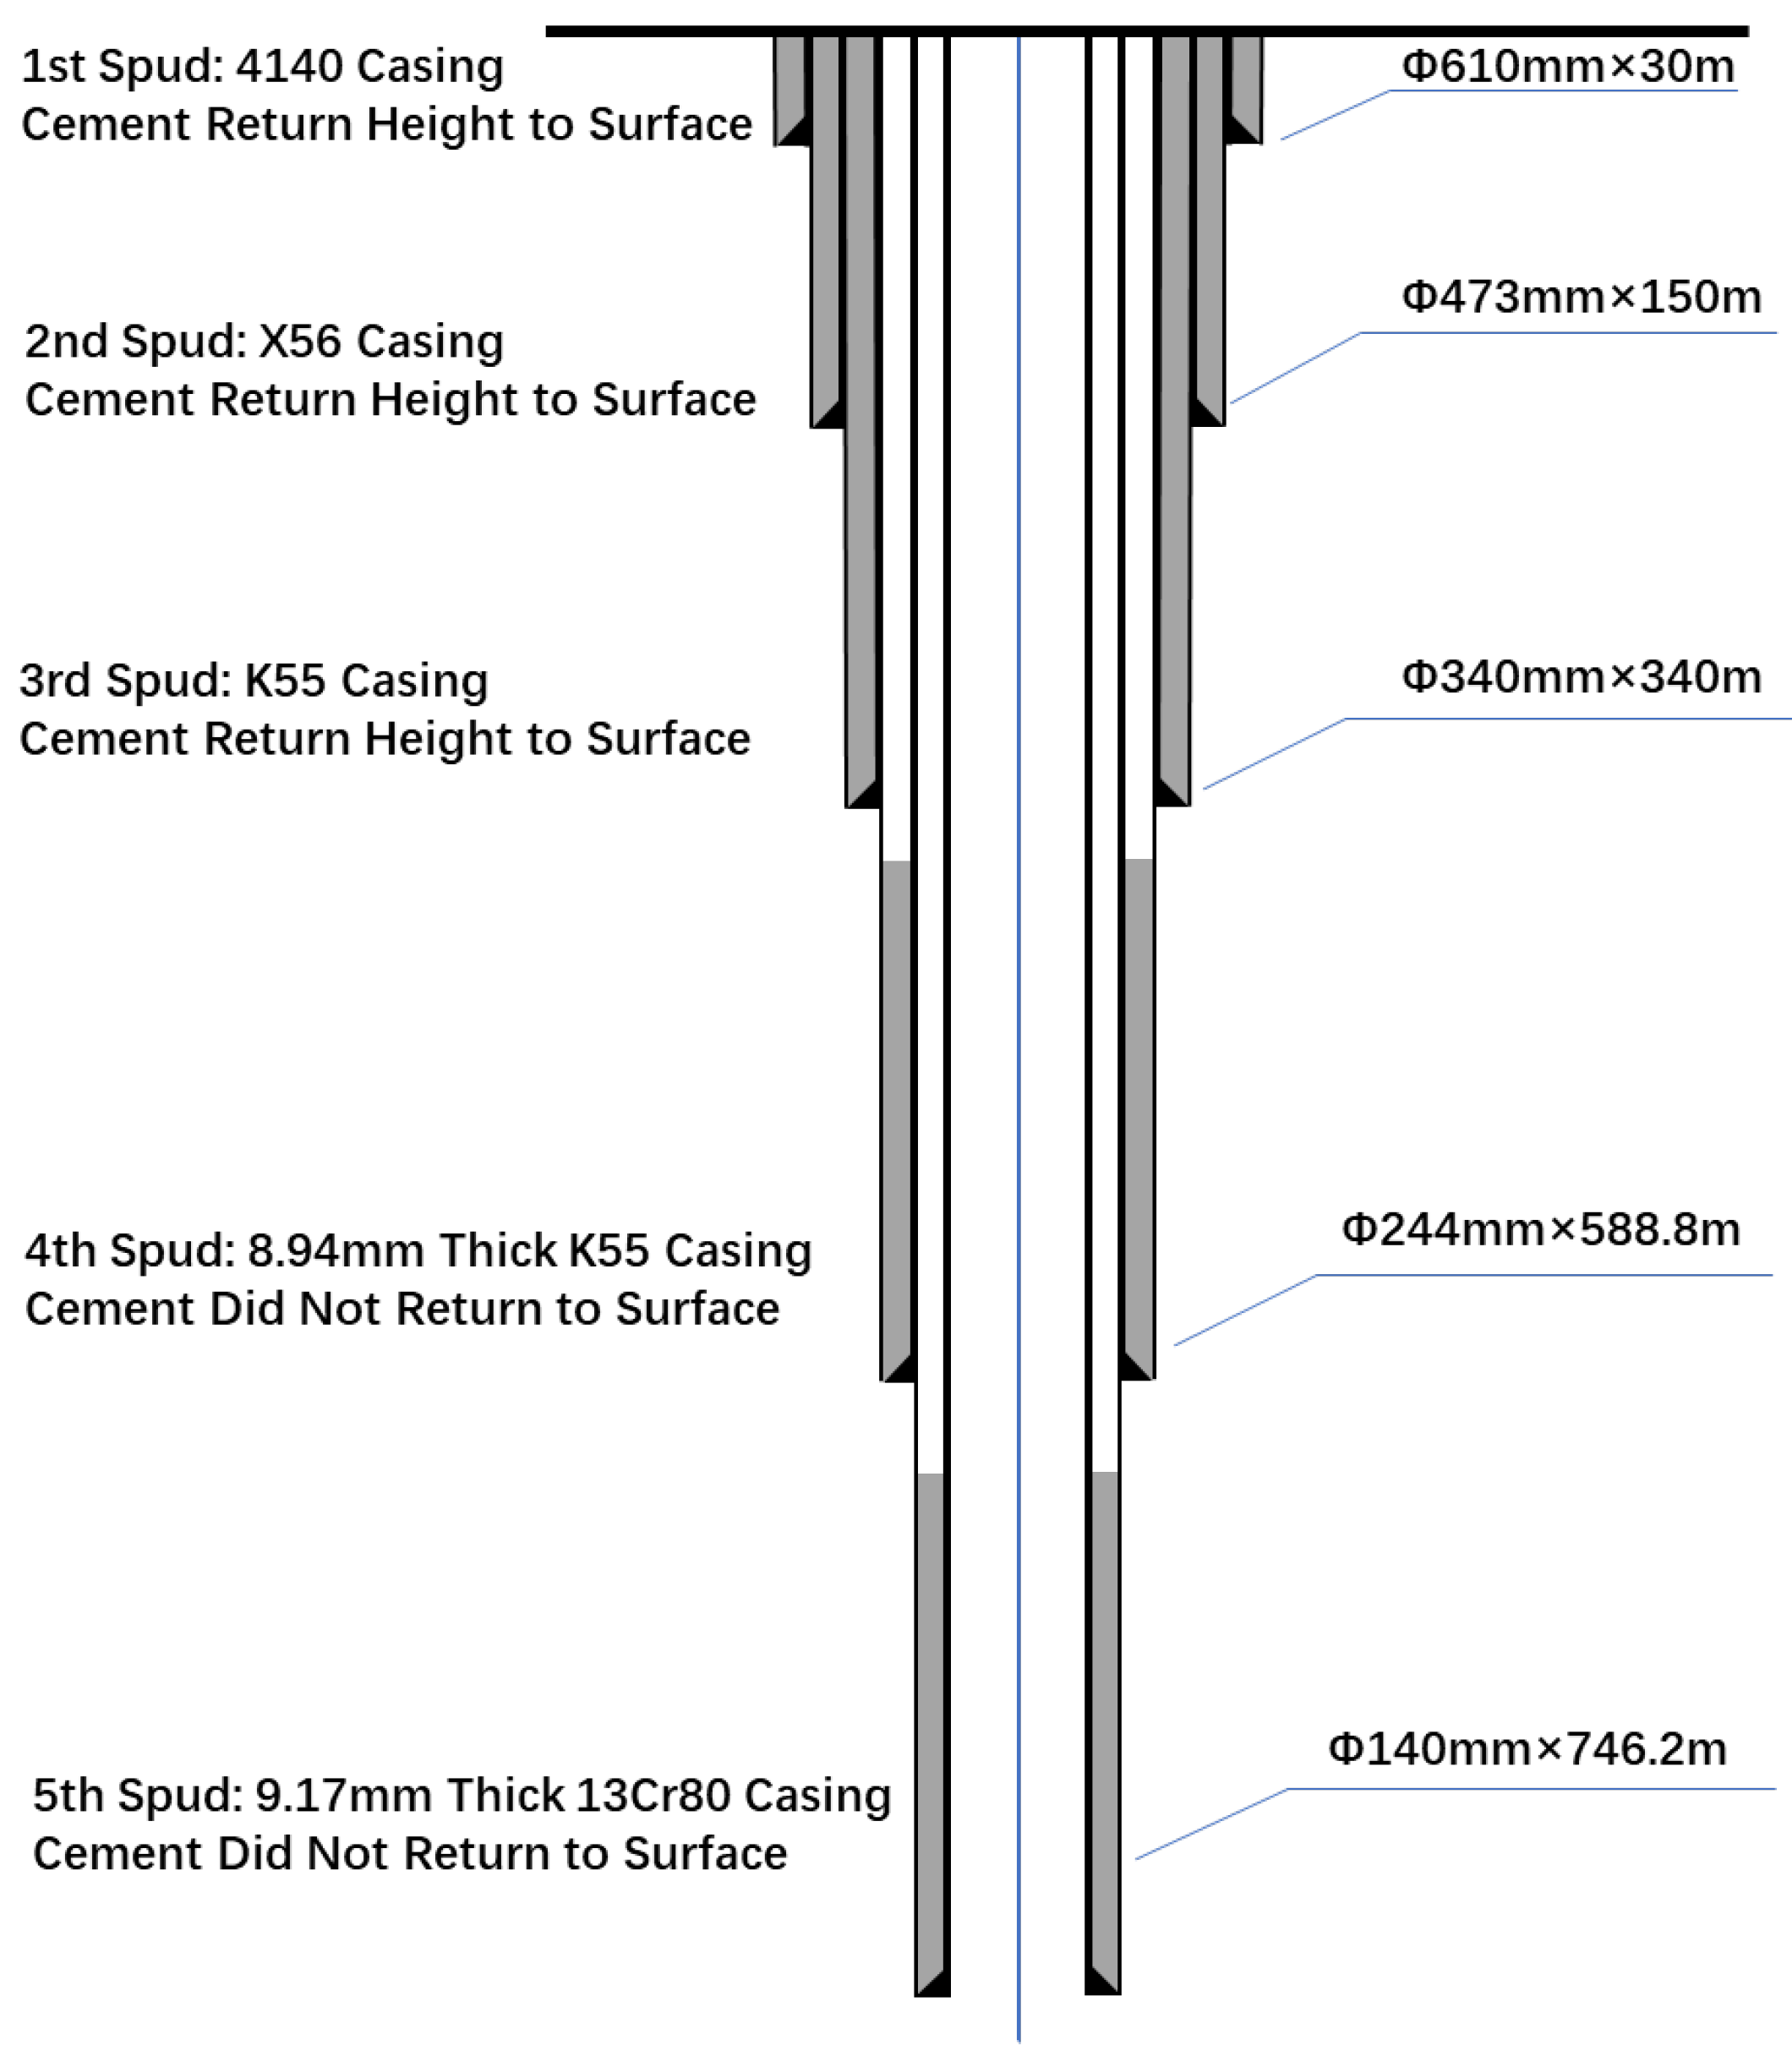
The Ketzin storage site has a total of five wells, namely Ktzi200, Ktzi201, Ktzi202, Ktzi203, and P300. In 2007, one injection well (Ktzi201) and two monitoring wells (Ktzi200 and Ktzi202) [54] were completed at the Ketzin storage site, with a depth of approximately 750–810 m, see Figure 3. The casing of the Ktzi201 well is made of stainless steel, and CO2 is injected through tubing with a diameter of 89 mm [55]; the wellbore structure of Ktzi201 is shown in Figure 4. International scholars, based on a reconstruction from CT slice data of cement sheath samples from the Ktzi201 well, found that the wellbore cement samples exhibited heterogeneity. EDX spectral analysis confirmed that the abnormal areas are rich in Na+ and Cl. Combined with the degree of corrosion found on the casing samples, it was determined that the cause of the corrosion was the dissolution of rust in brine rather than carbonation by CO2–brine [56,57]. Thus, it was confirmed that the cement used in the construction of the Ktzi201 well demonstrates CO2 corrosion resistance [58]. The third monitoring well, P300, was drilled to above the caprock, with a well depth of approximately 450 m, aiming to monitor whether CO2 breaks through the caprock. The fourth monitoring well, Ktzi203, was drilled into the reservoir [59].
The burial depth of the Ketzin project is less than 800 m, with an initial reservoir temperature and pressure of 33 °C and 6.2 MPa, respectively. Without additional measures, it cannot meet the supercritical condition of CO2 [26]. Therefore, to avoid phase change and near-critical phenomena, CO2 is preheated to 45 °C before being injected underground [60]. The monitoring data from wells Ktzi200 and Ktzi202 show that during the entire injection process, the reservoir temperature ranged between 31 and 35 °C, and the pressure exceeded 7.38 MPa, ultimately achieving the supercritical condition of CO2 [26,61].
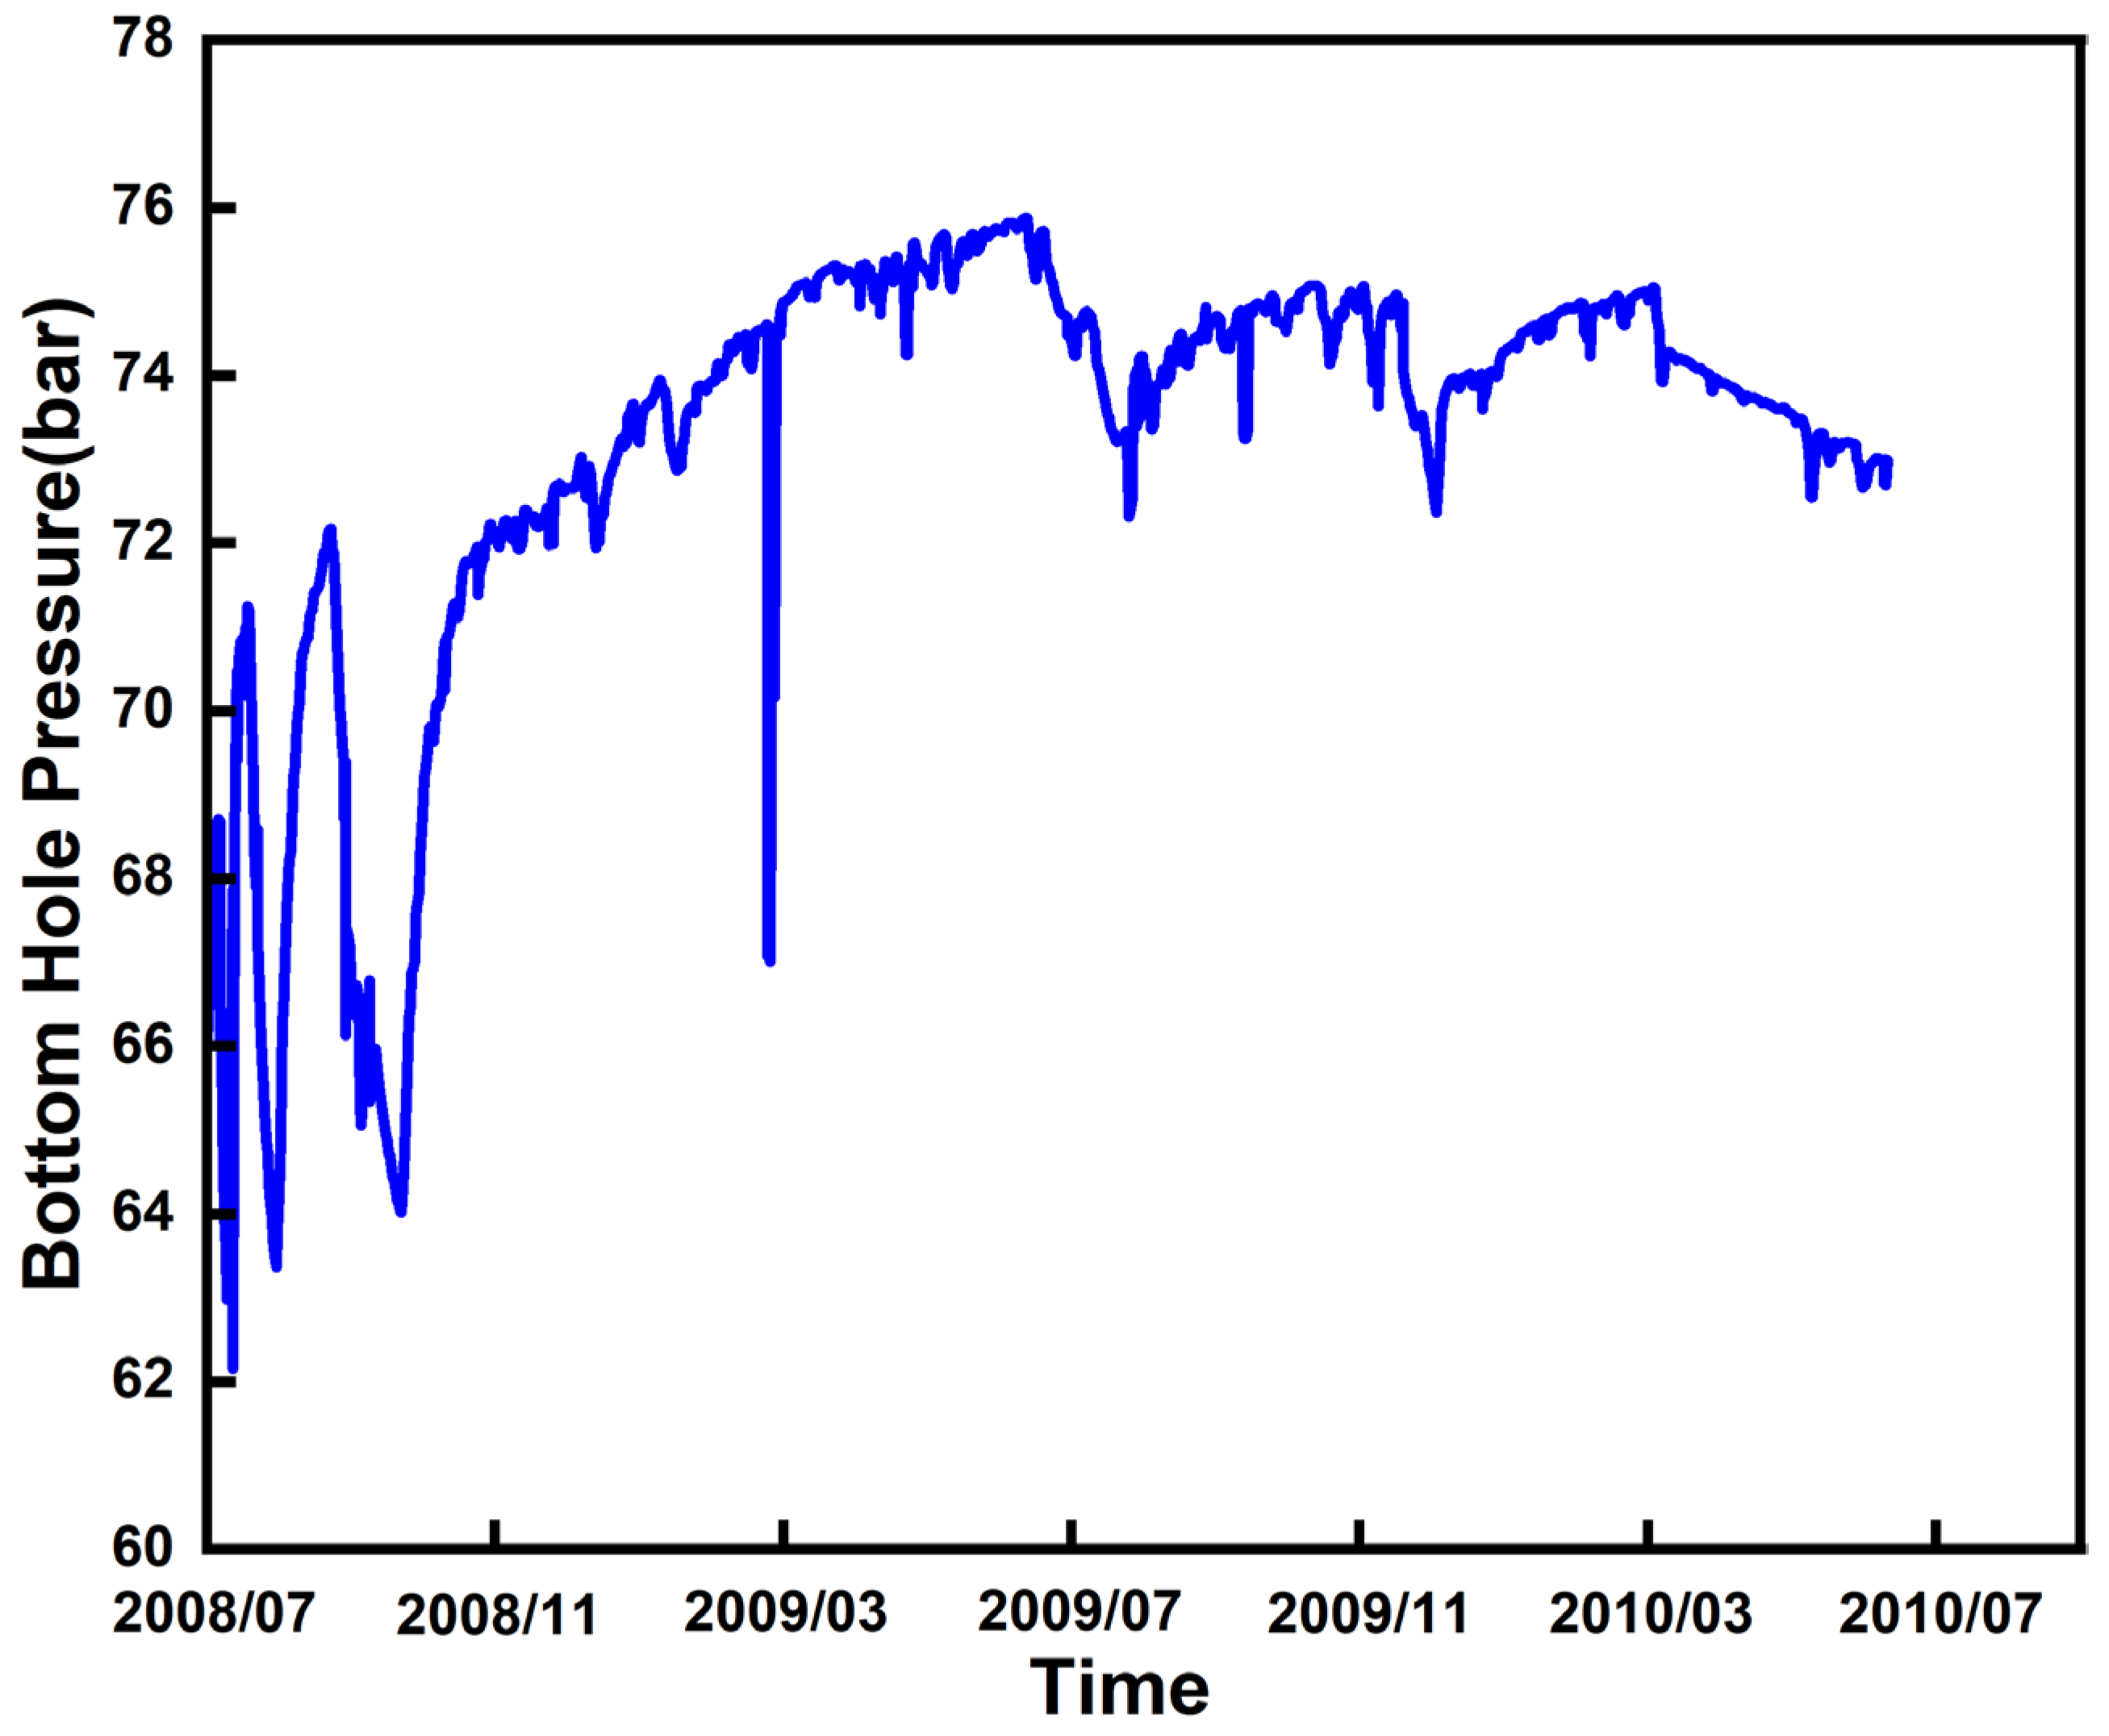
Two years before the start of the Ketzin Project, CO2 was injected at the maximum injection rate of 2340 t/month per design specifications, and the subsequent stable injection rate was 1000 t/month, with an average injection pressure and temperature of 6.5 MPa and 42 °C, respectively [62]. In June 2009, the reservoir reached a maximum pressure of 7.59 MPa, with an increase of 1.55 MPa (see Figure 5) [26]. After August 2009, the German Mining Authority set the following upper pressure limits: the injection pressure should be limited to 8.5 MPa, and the downhole pressure must not exceed 8.3 MPa. According to the pressure data 2 years after the start of injection, the reservoir pressure fluctuated within the allowable range and stabilized over time, indicating that CO2 had naturally entered the reservoir for sequestration [63].

3.4. Canada’s Quest Project

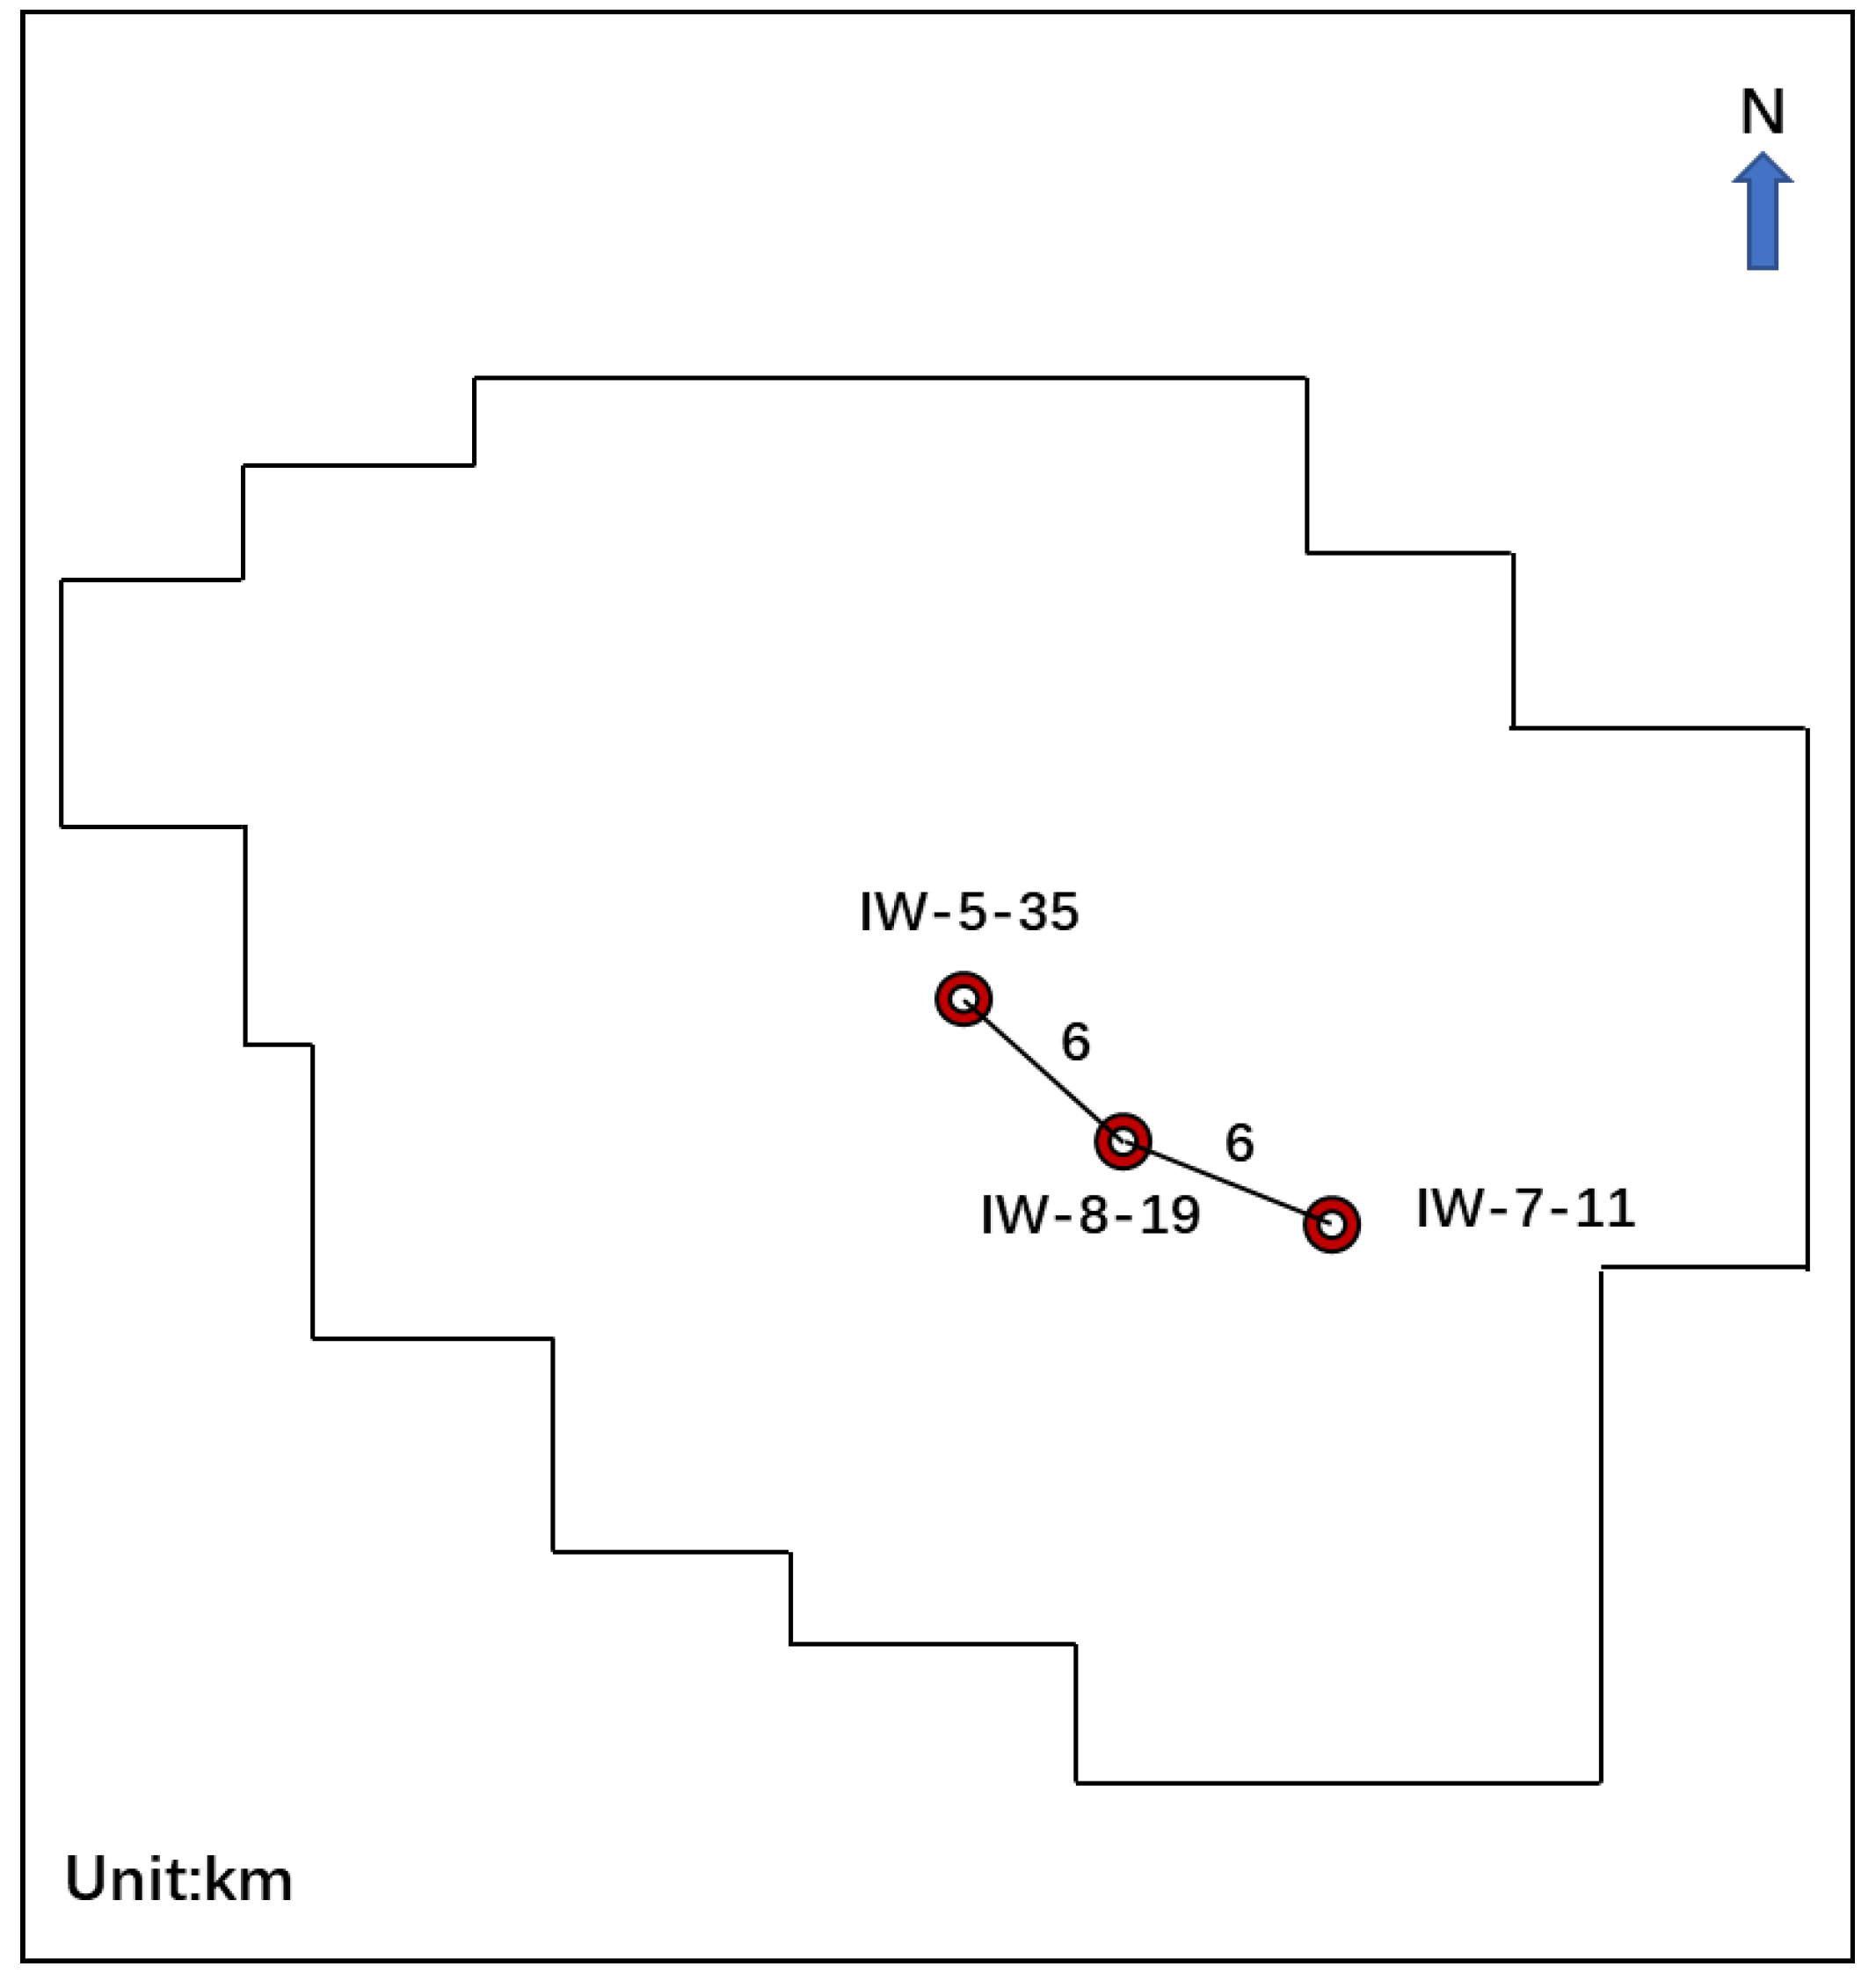
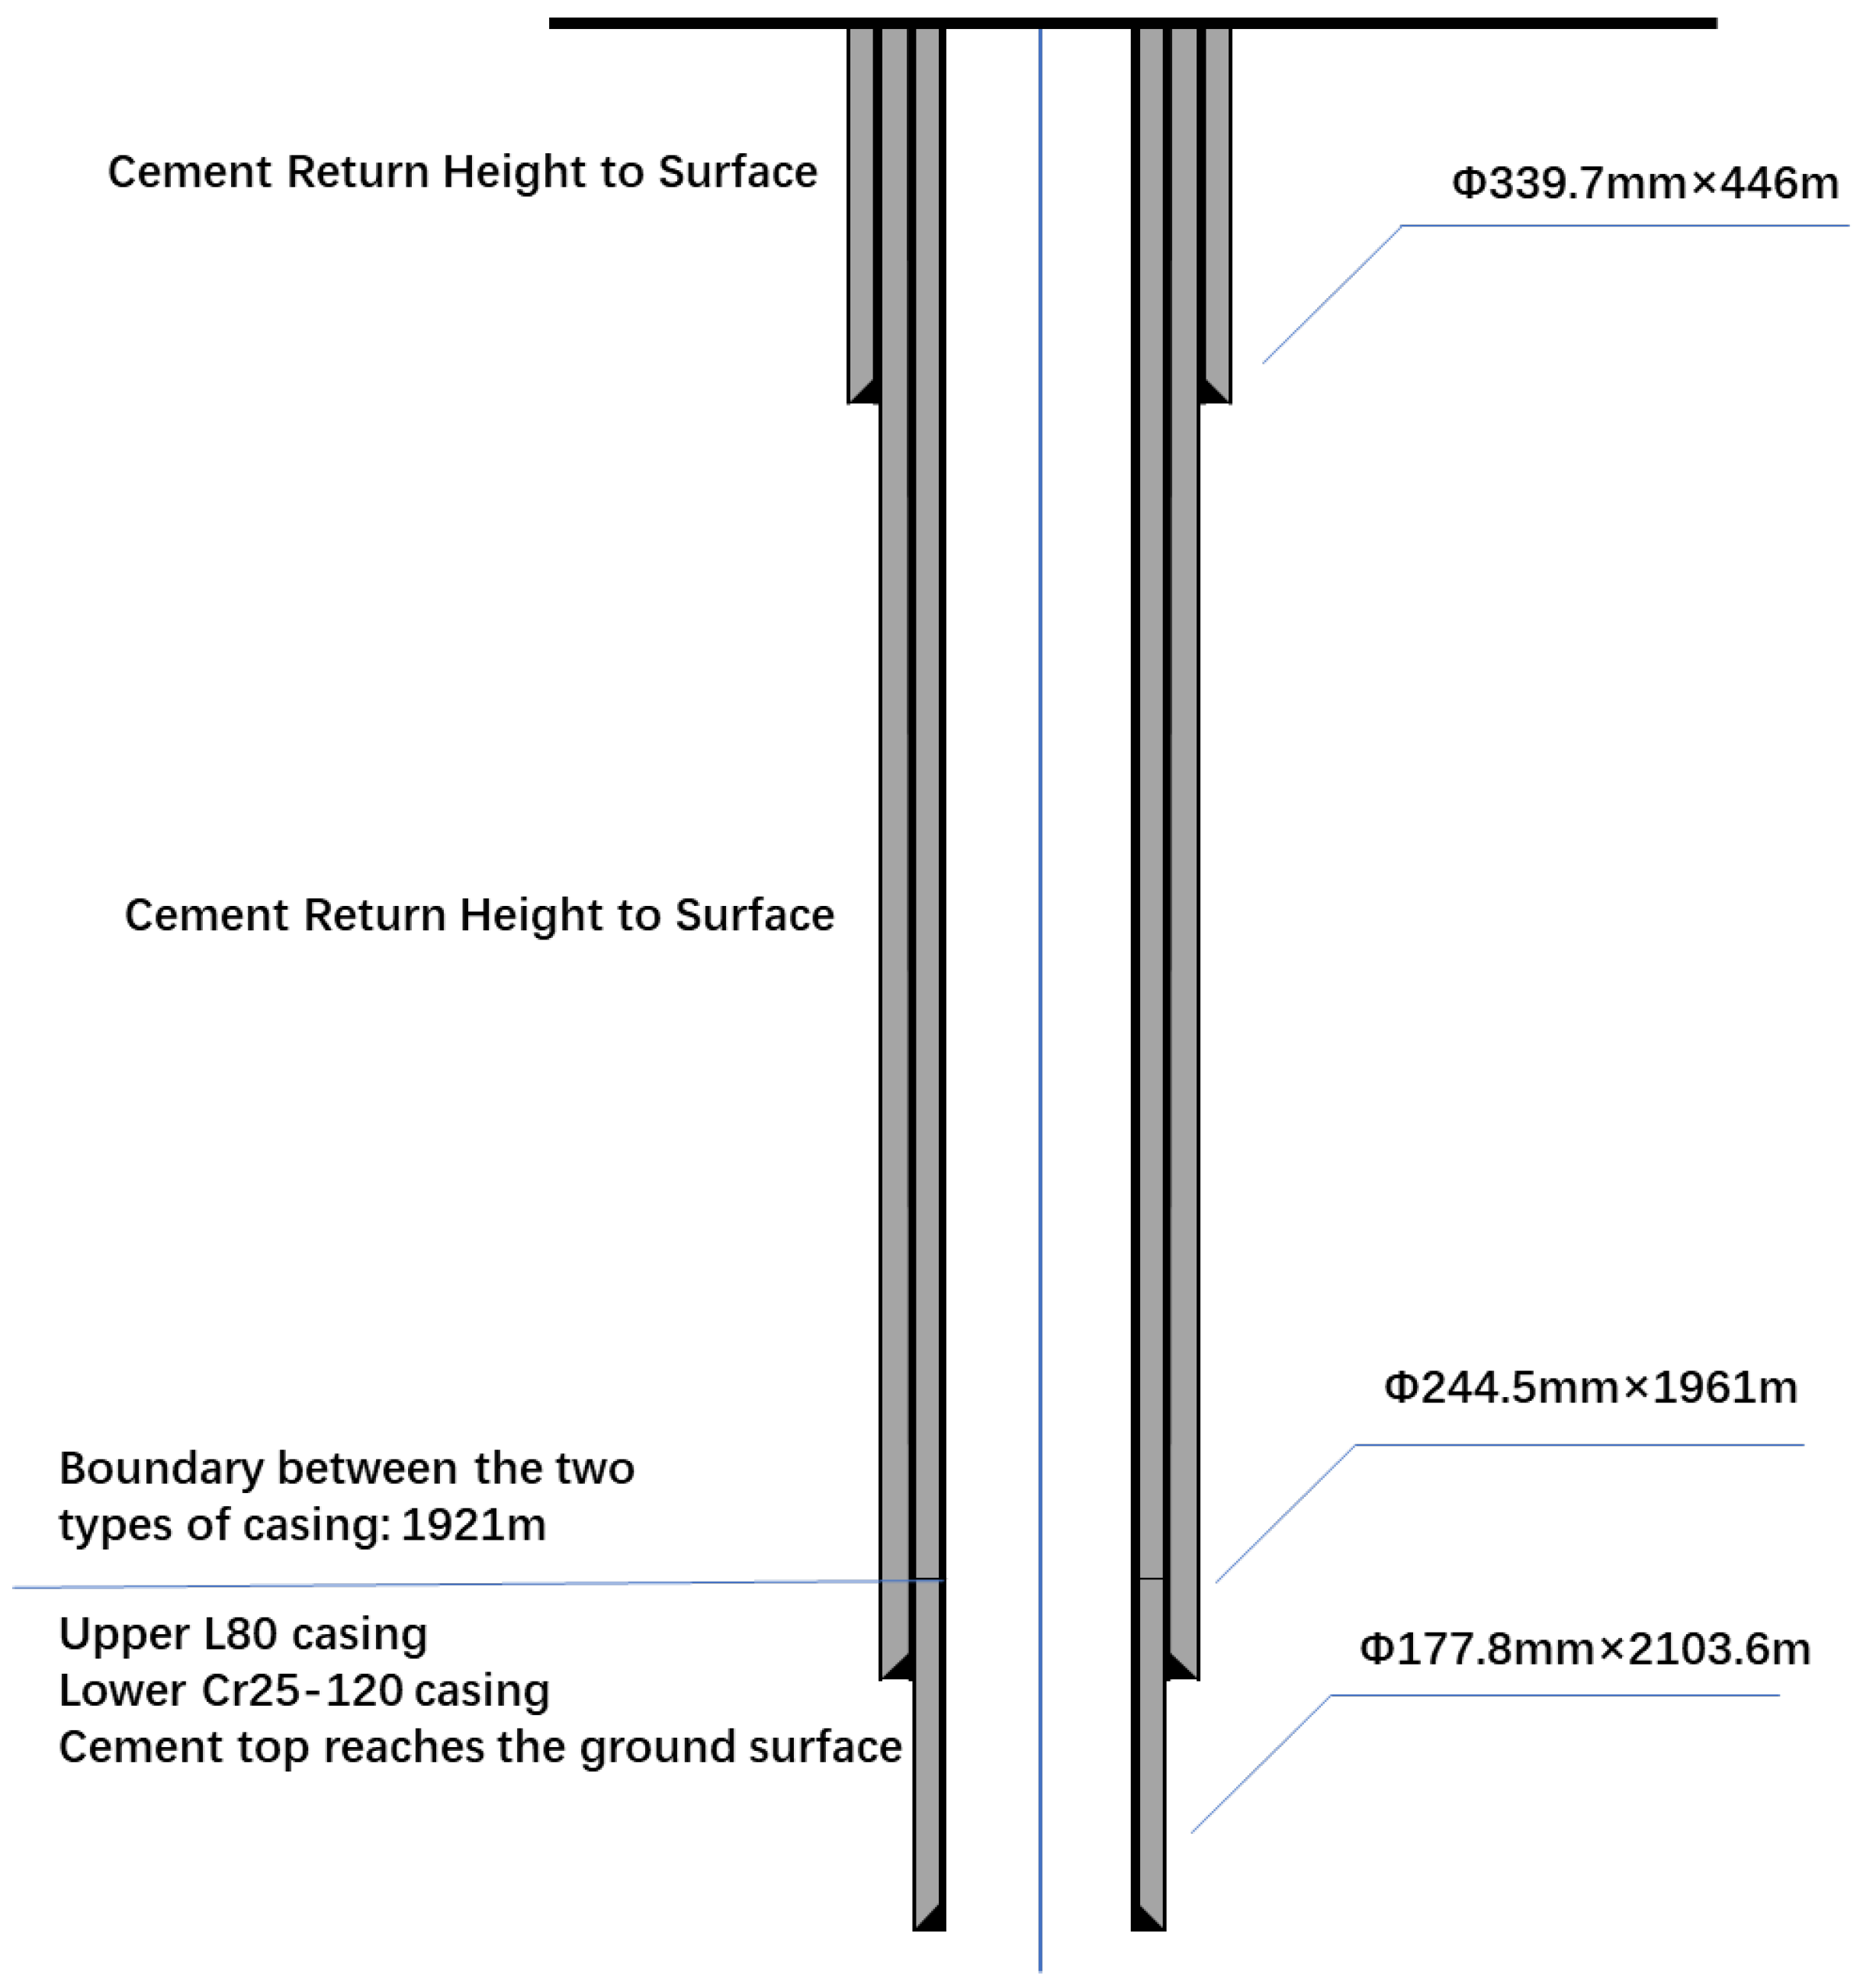
The Canadian Quest Project’s sequestration site is located in the Western Canadian Sedimentary Basin, with a total of three injection sites. Each site consists of one injection well, one deep monitoring well (approximately 1.7 km deep), and one shallow groundwater monitoring well (less than 0.2 km deep). The three injection wells are IW-5-35, IW-8-19, and IW-7-11, with each injection well separated by about 6 km [64], see Figure 6 for details. During the design stage, the total injection rate of the three injection wells was designated as 136 t/h. However, in the first year of operation, the target injection rate could be achieved using only IW-8-19 and IW-7-11. Therefore, only two injection wells were used in actual operation [65]. Figure 7 shows the wellbore structure of IW-7-11. The production casing of this injection well is divided into upper and lower sections, with 1921 m as the boundary. The surface, intermediate, and upper production casing are all L80 casings, while the lower production casing is Cr25-120. Perforations were made in the production casing section from 2025.5 m to 2060.5 m, with a perforation density of 39 holes per meter [64].
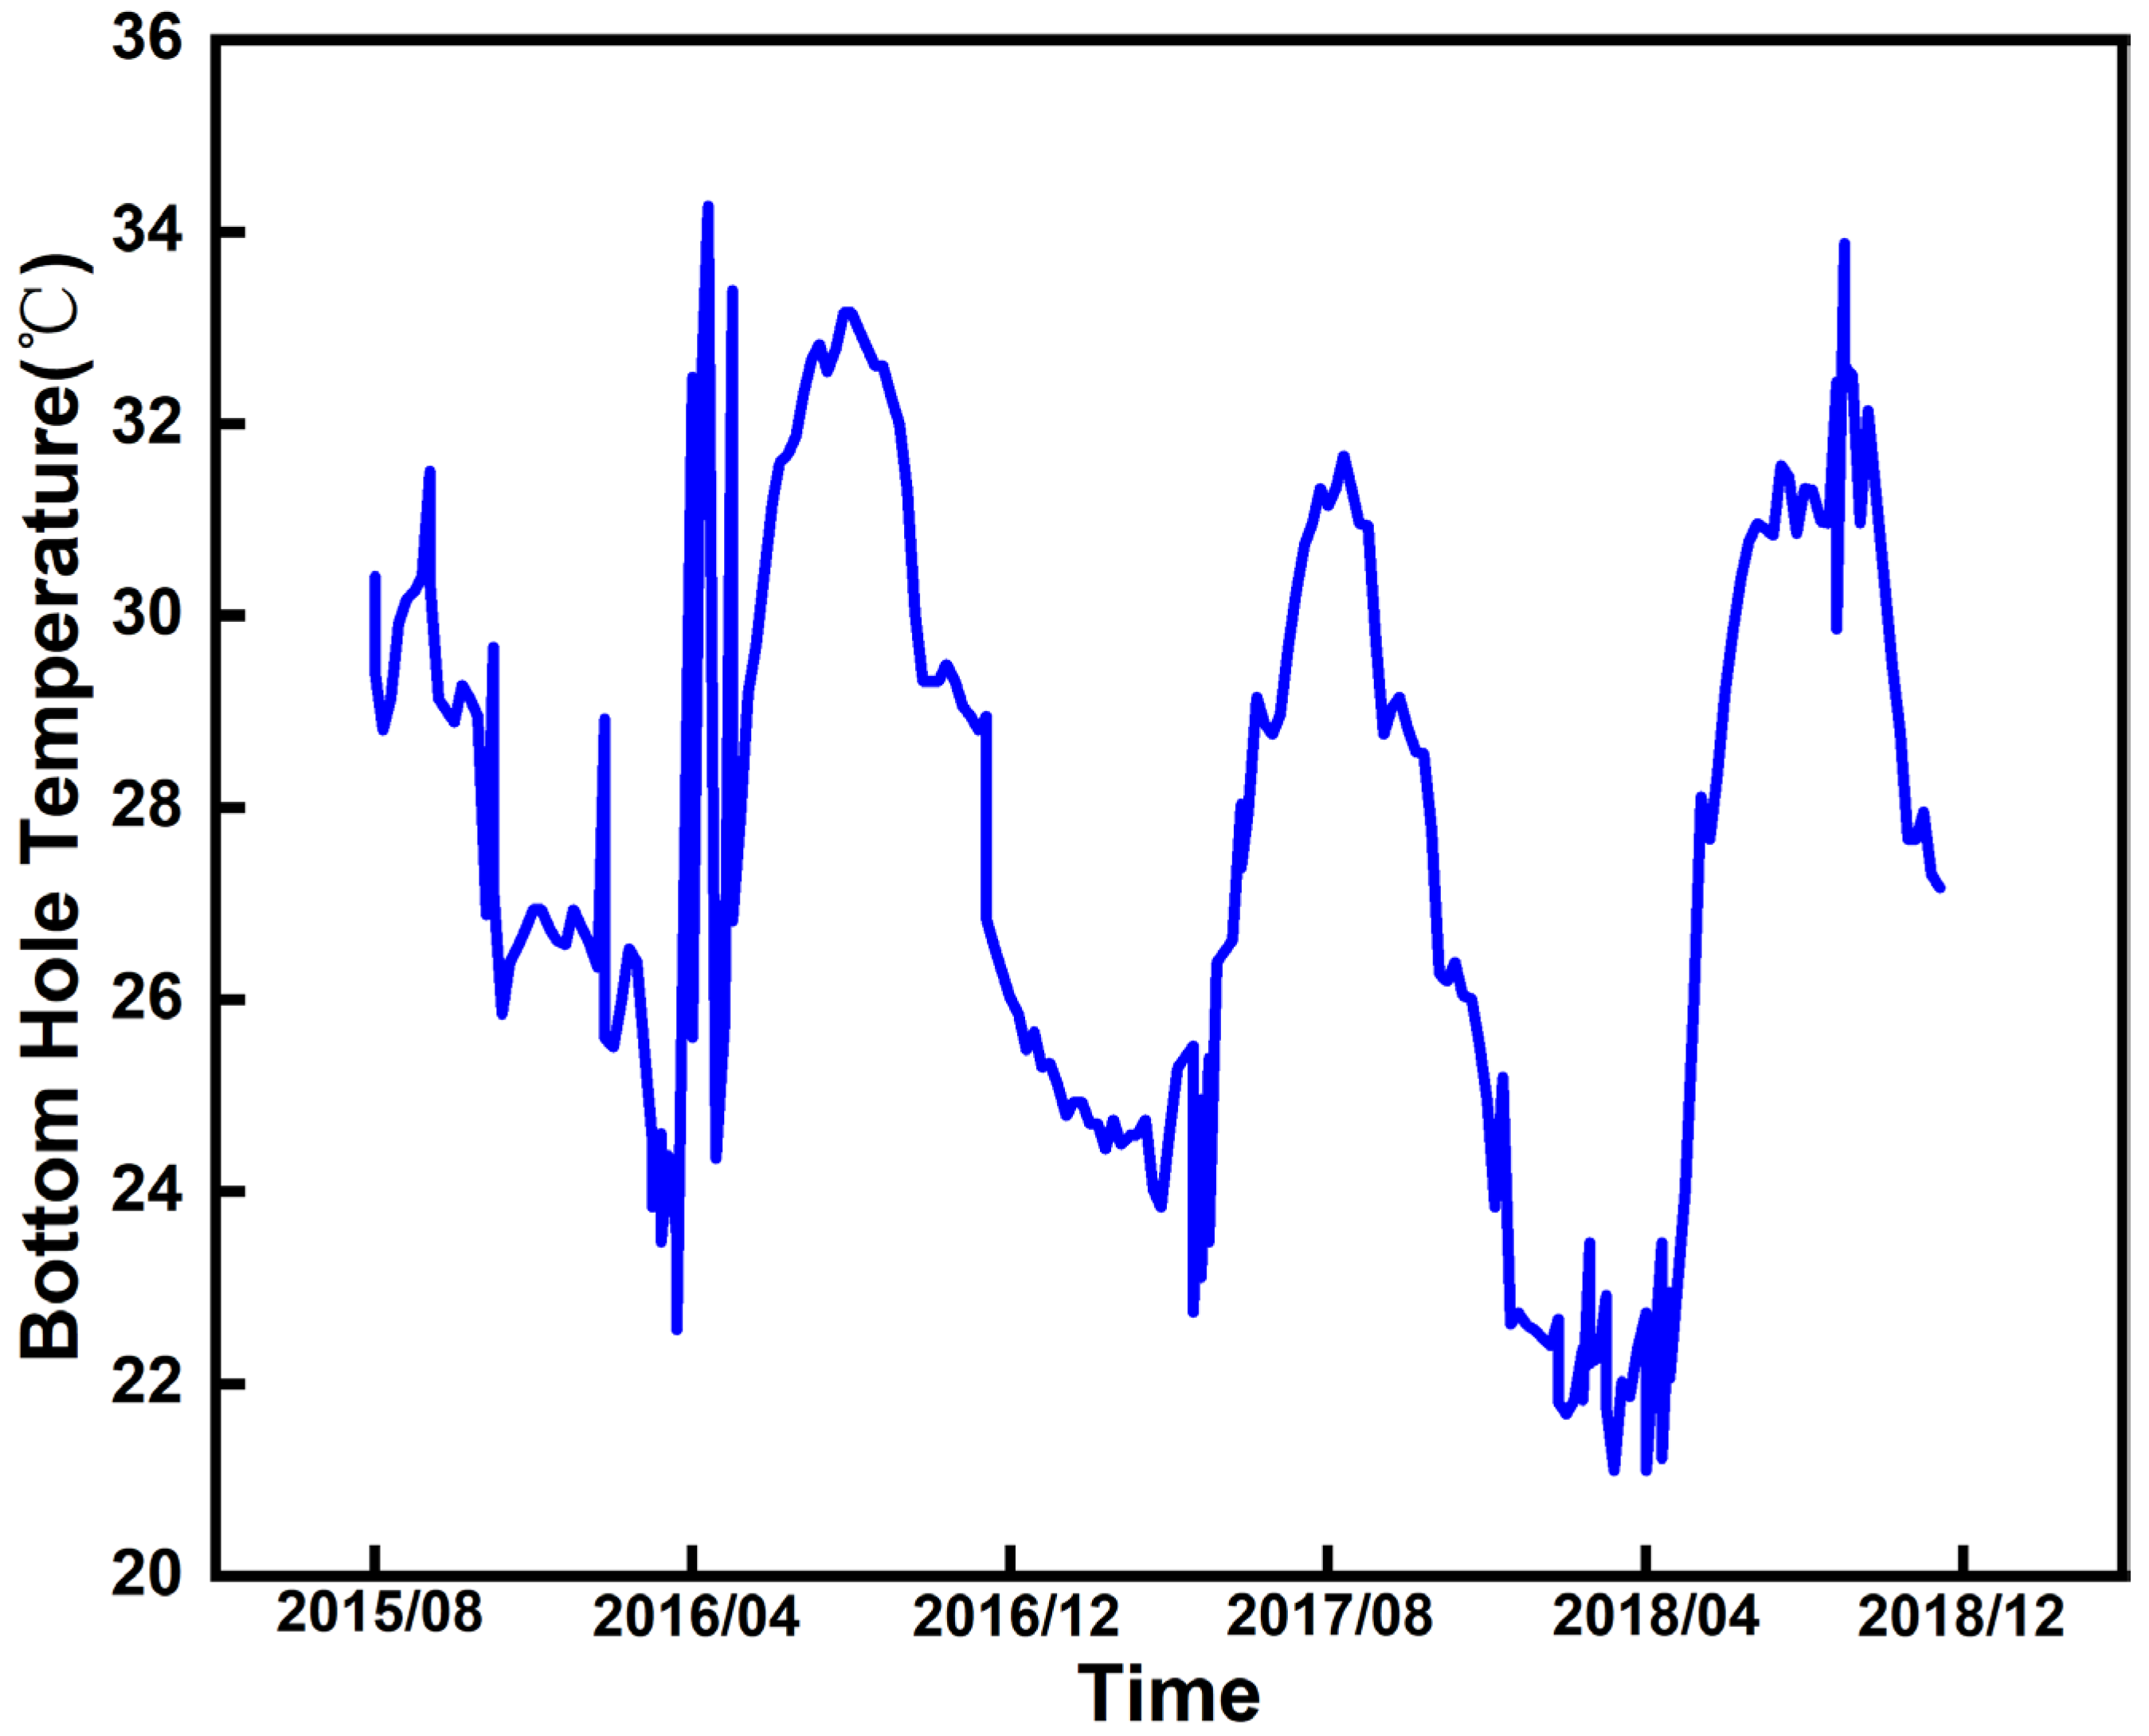
In August 2015, the project actually injected CO2 at an injection rate of approximately 120 t/h [66]. As the injection progressed, pressure buildup occurred at the bottomhole. Under the condition of a bottomhole temperature of approximately 30 °C, a pressure increase of 1–2 MPa was observed; however, the maximum bottomhole pressure did not exceed 21.8 MPa, which is far lower than the fracture pressure of 35 MPa (see Figure 8) [67].
In 2023, the wellhead and bottomhole temperatures of this project varied between 7–26 °C and 22–48 °C, respectively, and the wellhead and bottomhole pressures were 6.3 MPa and 22.3 MPa, respectively [68]. During the entire injection process, a certain correlation was observed between the injection effect and the season: the dynamic injection rate at low temperatures (e.g., 23 °C) was 2–12% higher than that at high temperatures (e.g., 32 °C) [69], with an average increase of approximately 8%, showing a significant negative correlation (see Figure 9) [67]. Therefore, for this phenomenon, not only should the influence of temperature on the fluid properties of CO2 be considered, but also the changes in reservoir characteristics. For instance, the injection of cold CO2 cools the reservoir rocks, causing rock contraction, which reduces in situ stress and lowers the fracture pressure; such stress changes may induce shear failure or tensile failure of the rocks, and the formed microfractures may increase local permeability, enhance the reservoir’s conductivity, and thereby improve CO2 injection efficiency. Under high temperatures, when dry CO2 is injected into the formation, water in the natural brine evaporates into CO2, and halite precipitates from the formation water under this condition, clogging the pore space in the near-wellbore area and leading to a decrease in CO2 injection rate [70,71]. Additionally, attention should be paid to the in-depth impact of the thermal-hydraulic-mechanical-chemical (THMC) coupling mechanism, including CO2 phase transition dominated by thermal-hydraulic coupling, reservoir microfractures induced by temperature difference stress through thermal-mechanical coupling, and changes in reservoir physical properties caused by halite precipitation or mineral dissolution/mineralization via hydraulic-chemical coupling.

3.5. U.S. Decatur Project

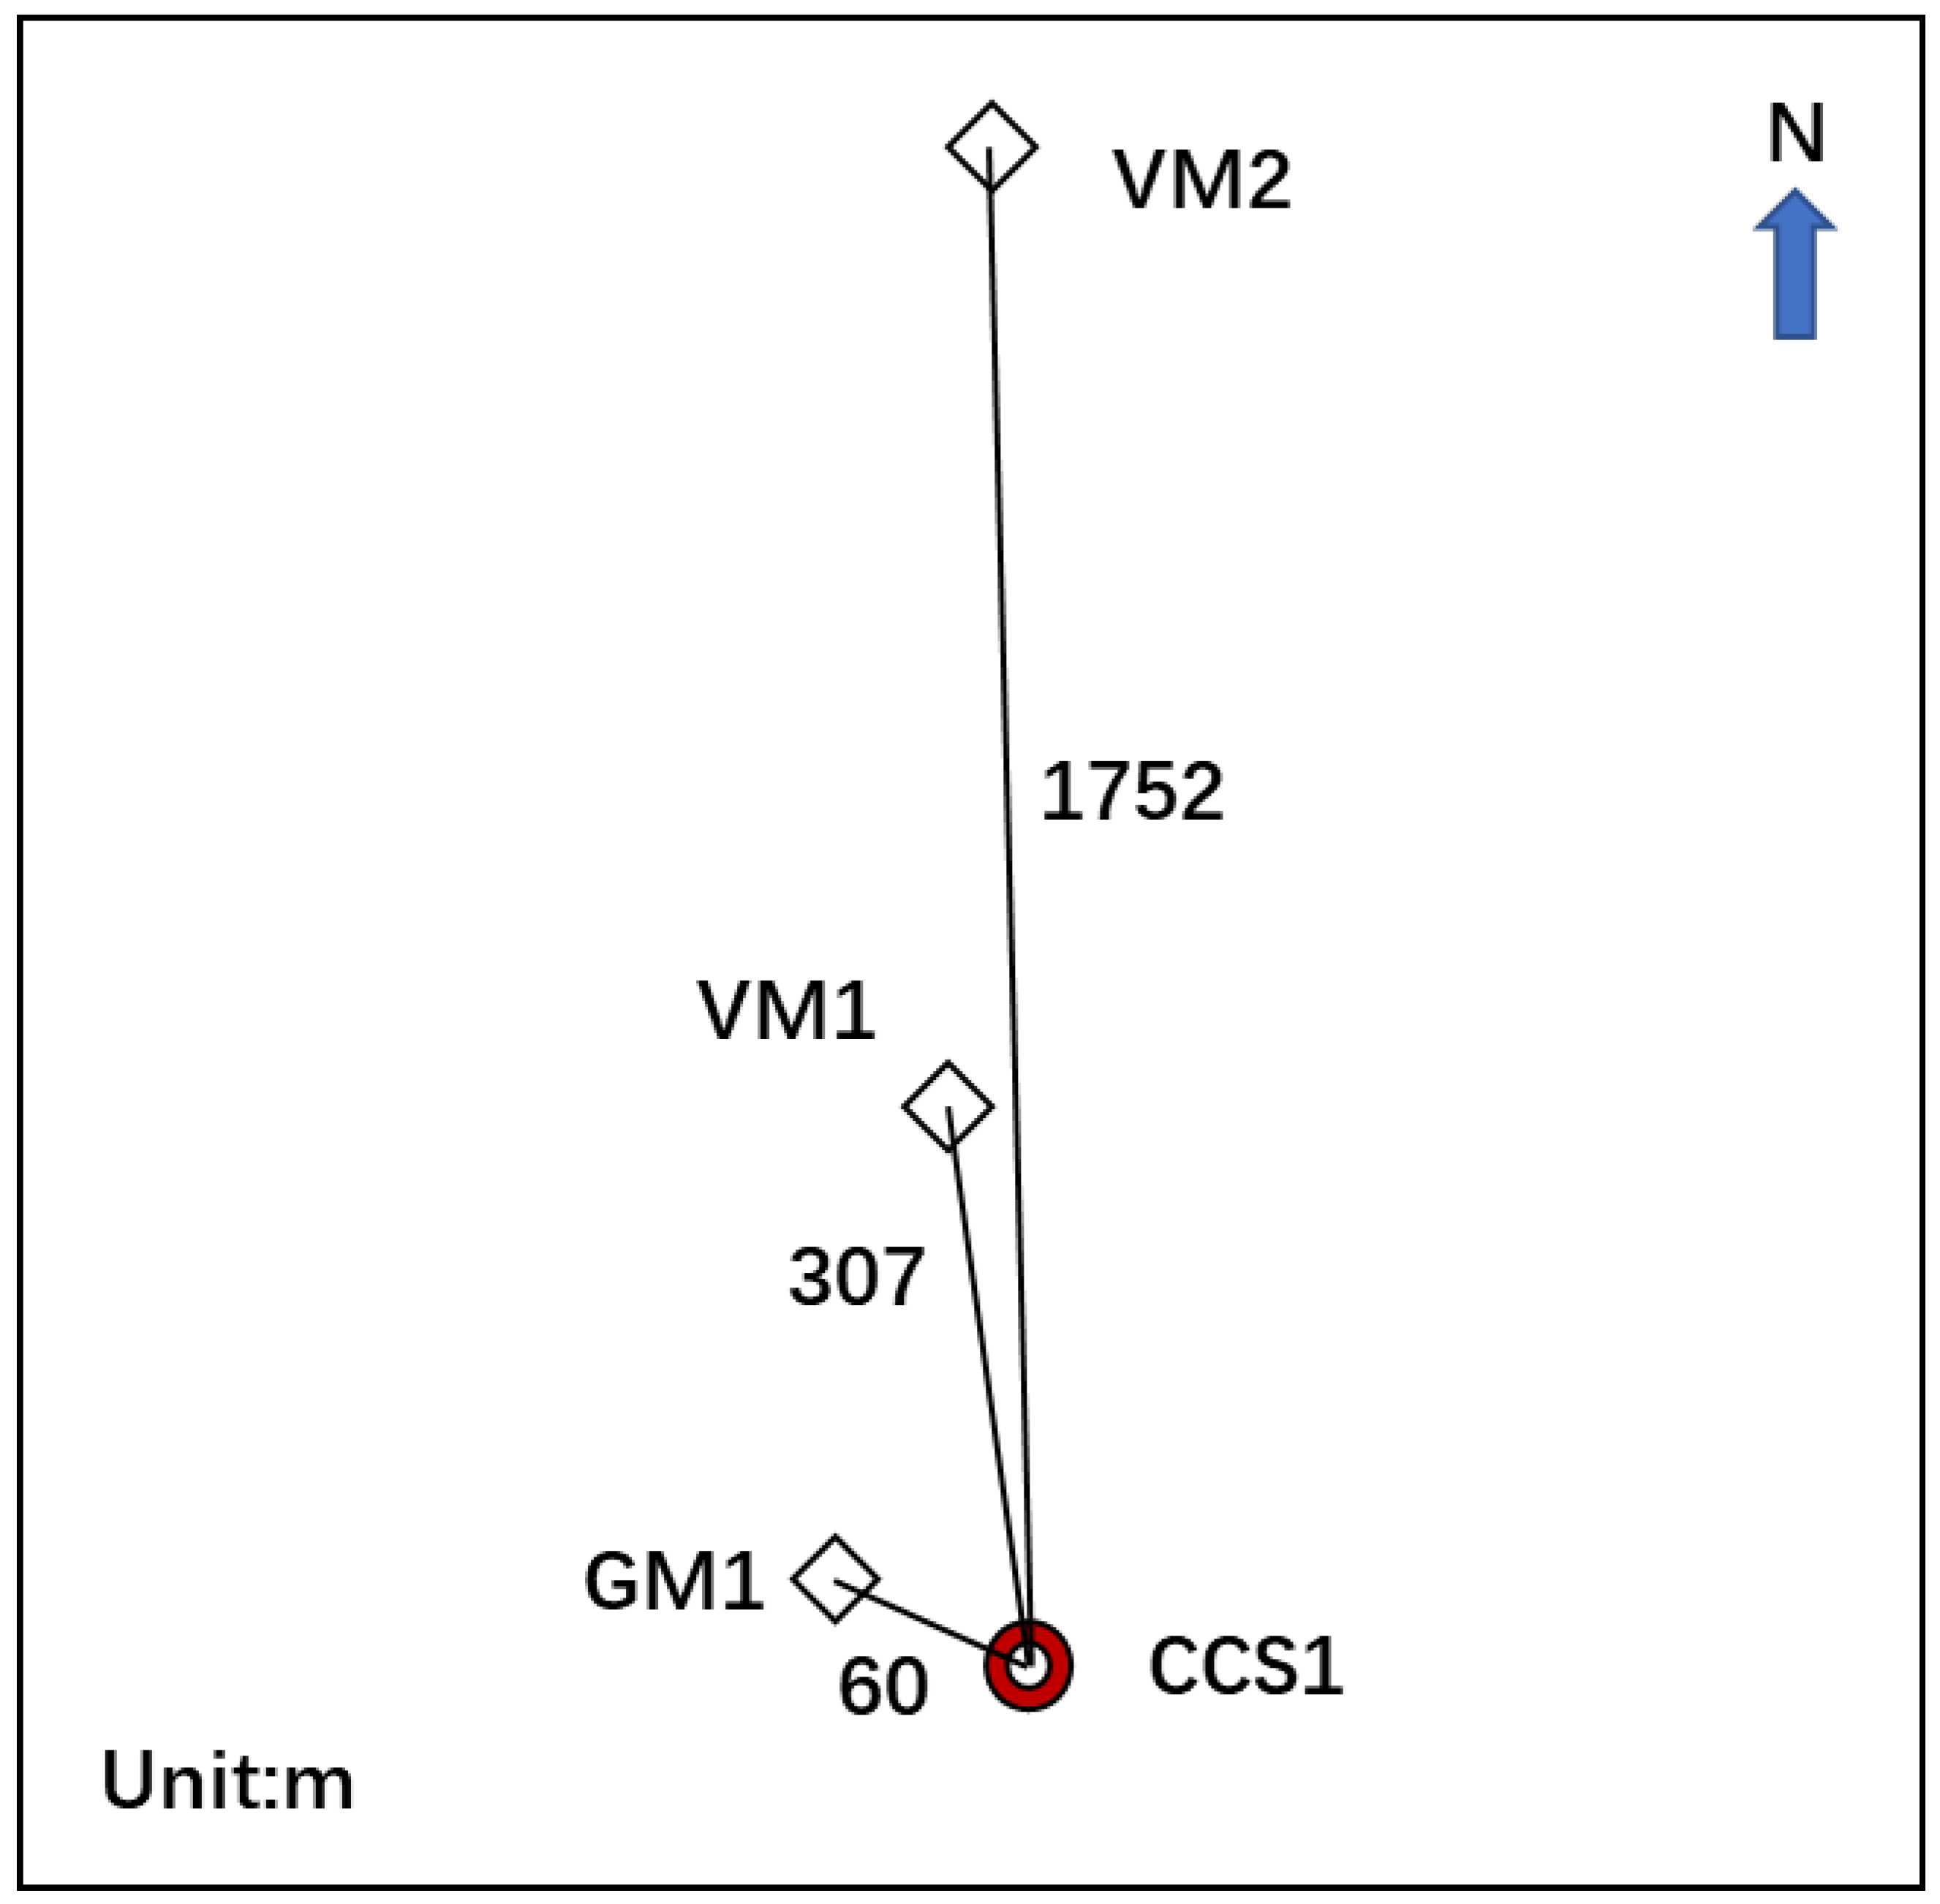
The Decatur Project comprises one injection well and three monitoring wells, with the wellsite layout shown in Figure 10 [72]. Among them, the injection well (CCS1) is approximately 2190 m deep and has two zones for injection between 2130 and 2149 m. The monitoring well (GM1) is approximately 1050 m deep, used for vertical seismic profiling (VSP) and microseismic monitoring; both were completed in 2009 [73]. The first observation well (VM1) is approximately 2201 m deep and is used for deep-reservoir fluid sample collection and monitoring. The second observation well (VM2) is approximately 2202 m deep, inside which a five-level geophone array is deployed to enhance microseismic monitoring performance. The wellbore structure and data of Well VM1 are shown in Figure 11 [25]. To effectively prevent corrosion, the section spanning from 1448 m to the bottom of the well is sealed with an anti-corrosion cement sheath. During perforation, the tubing annulus in the well is filled with an anti-corrosive synthetic NaCl completion fluid with a density of 1.124 g/mL, and the inhibitor contains ammonium bisulfite, isopropyl alcohol, and trisodium phosphate. However, there is still a lack of data on the qualitative and quantitative characteristics of cement sheath carbonation [74].
The burial depth of the Decatur injection zone is approximately 2130 m, and the downhole CO2 exists in a supercritical state. Well CCS1 has been continuously injecting since November 2011, with an injection pressure of 9.3 MPa and an injection temperature of 35 °C [24]; the bottomhole pressure and bottomhole temperature are 12.93 MPa and 27–42 °C, respectively [75]. At the start of injection, the reservoir pressure increased by 2.41 MPa [76]. After injecting 50,000 metric tonnes of CO2 at an injection rate of 1000 t/d, the reservoir pressure rose by 1.6 MPa and then tended to stabilize [73]. Thereafter, except for a brief interruption due to operational issues, CO2 was injected safely at an almost constant rate for three years [77].

3.6. China’s Shenhua Project

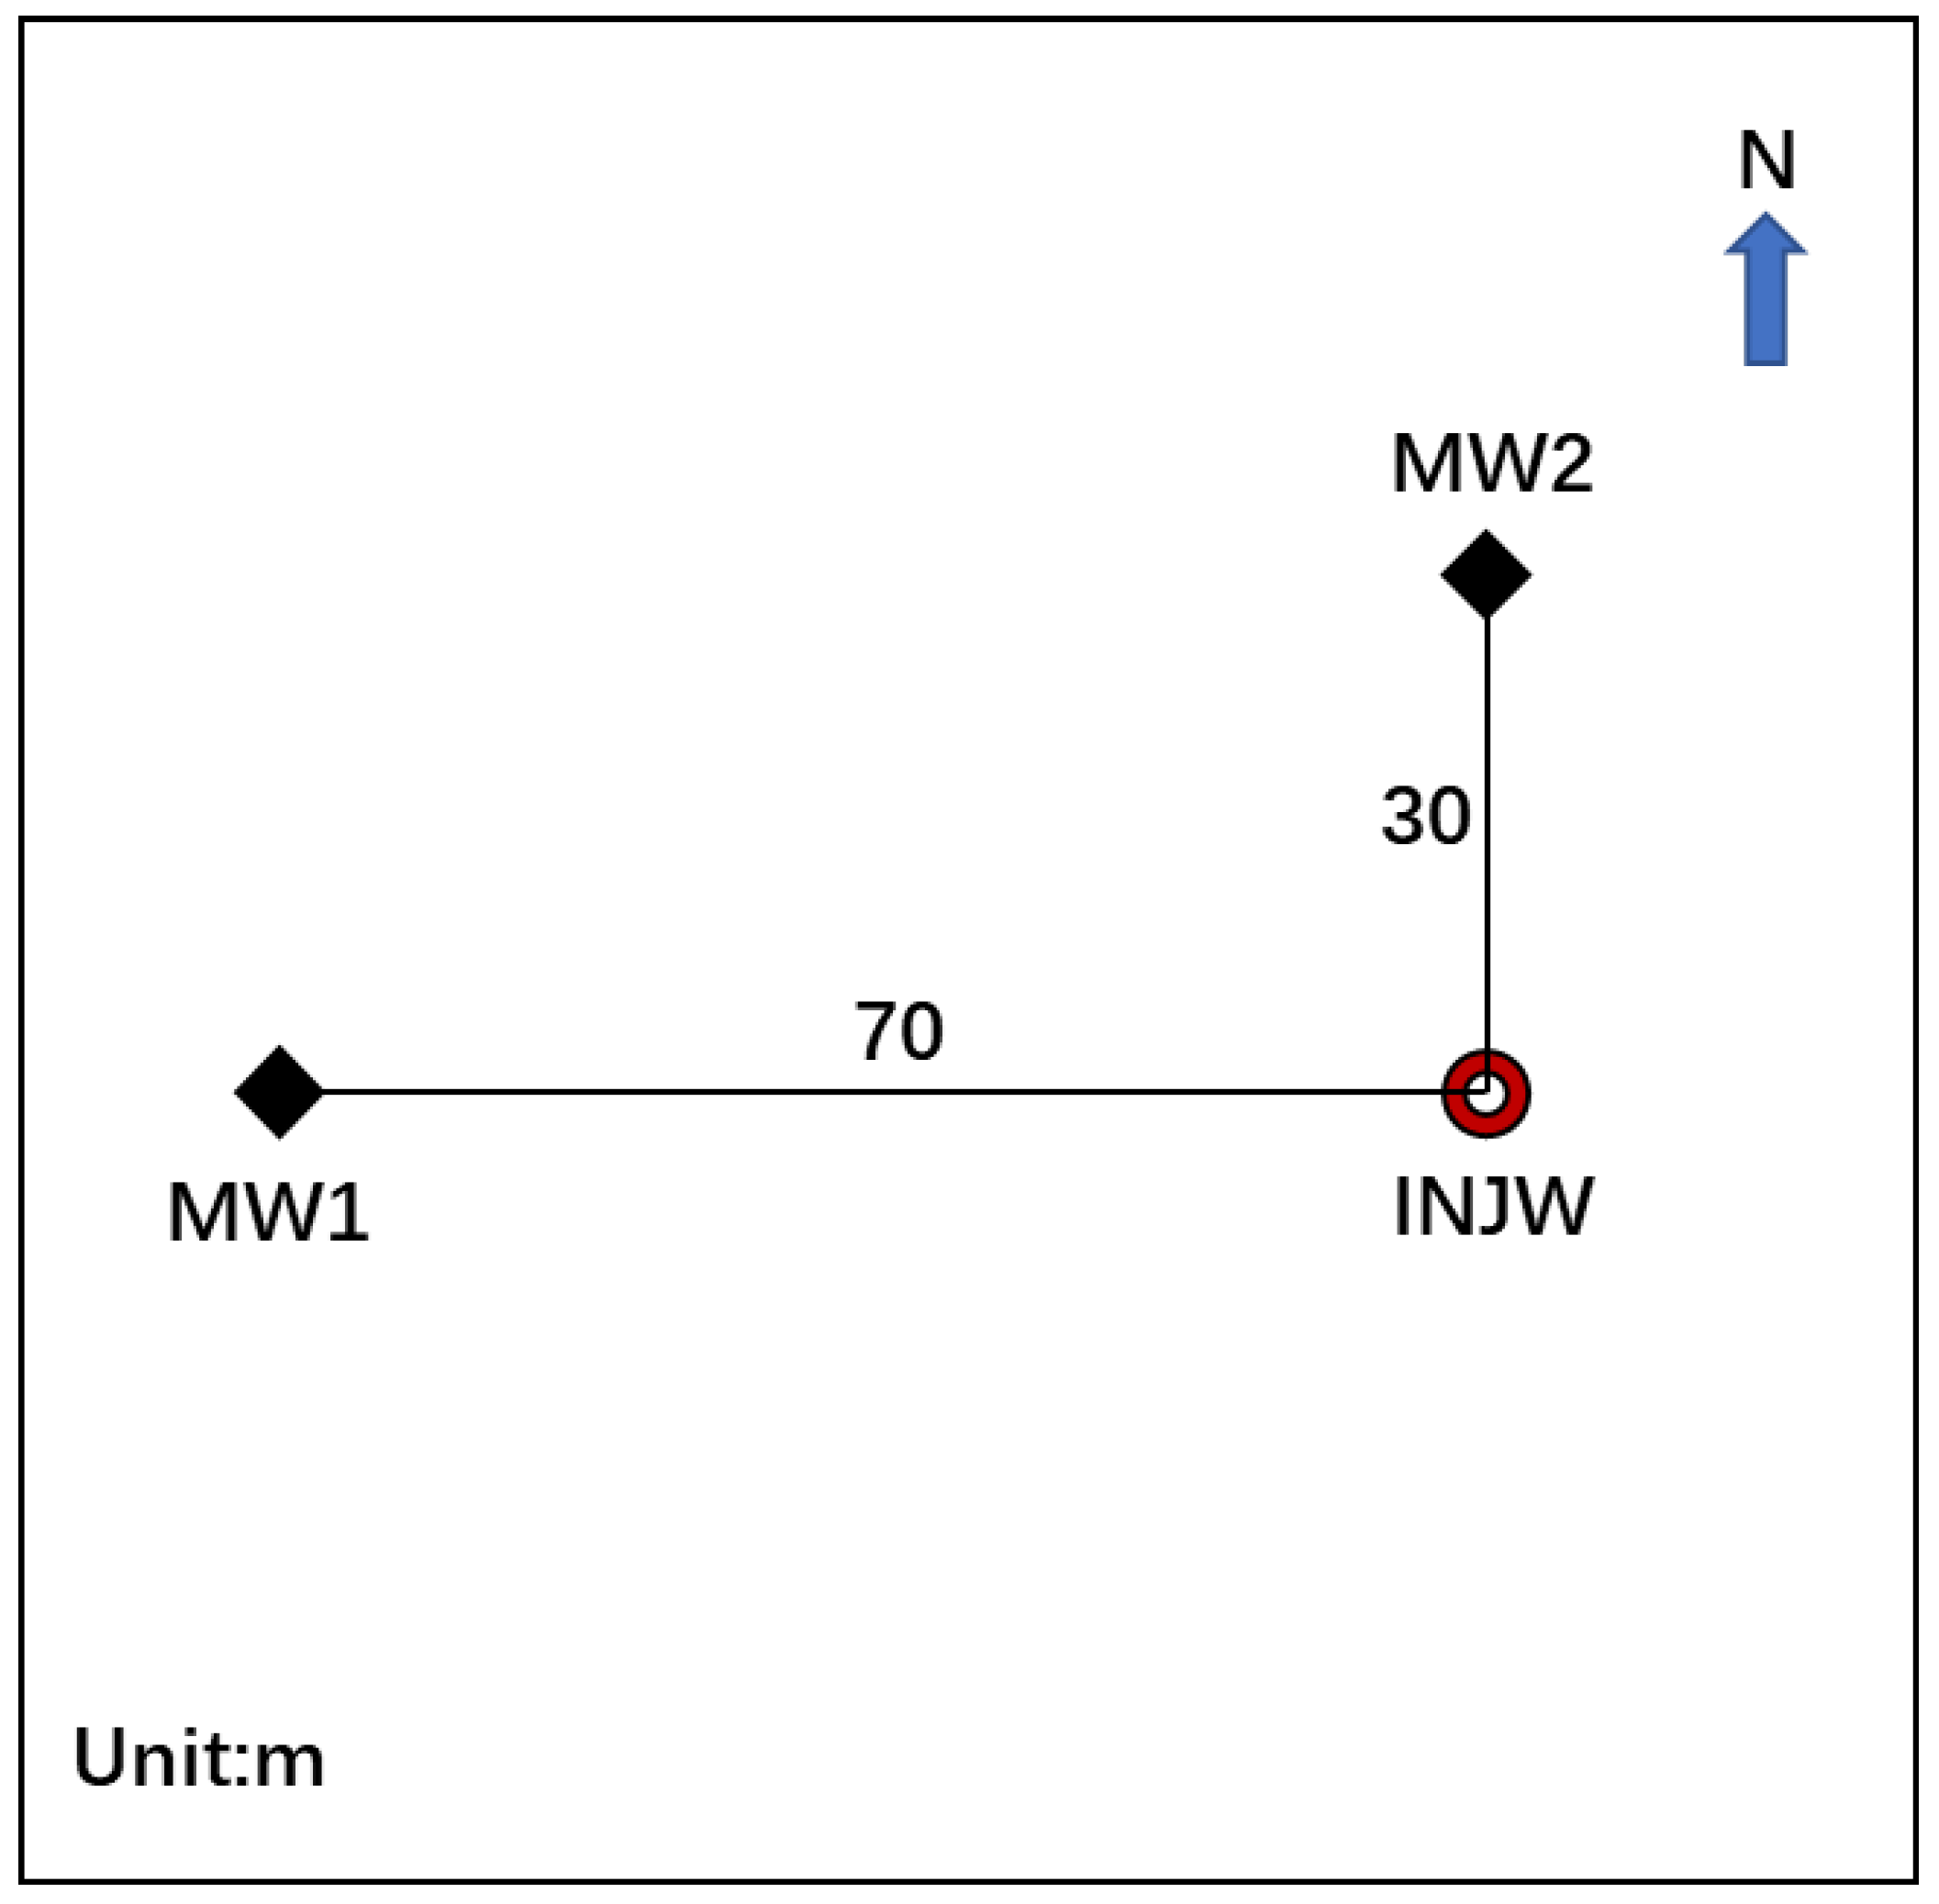
There is one injection well (INJW) and two monitoring wells (MW1 and MW2) in total at the injection site of the Shenhua CCS Project [78]. The layout of these wells is shown in Figure 12.
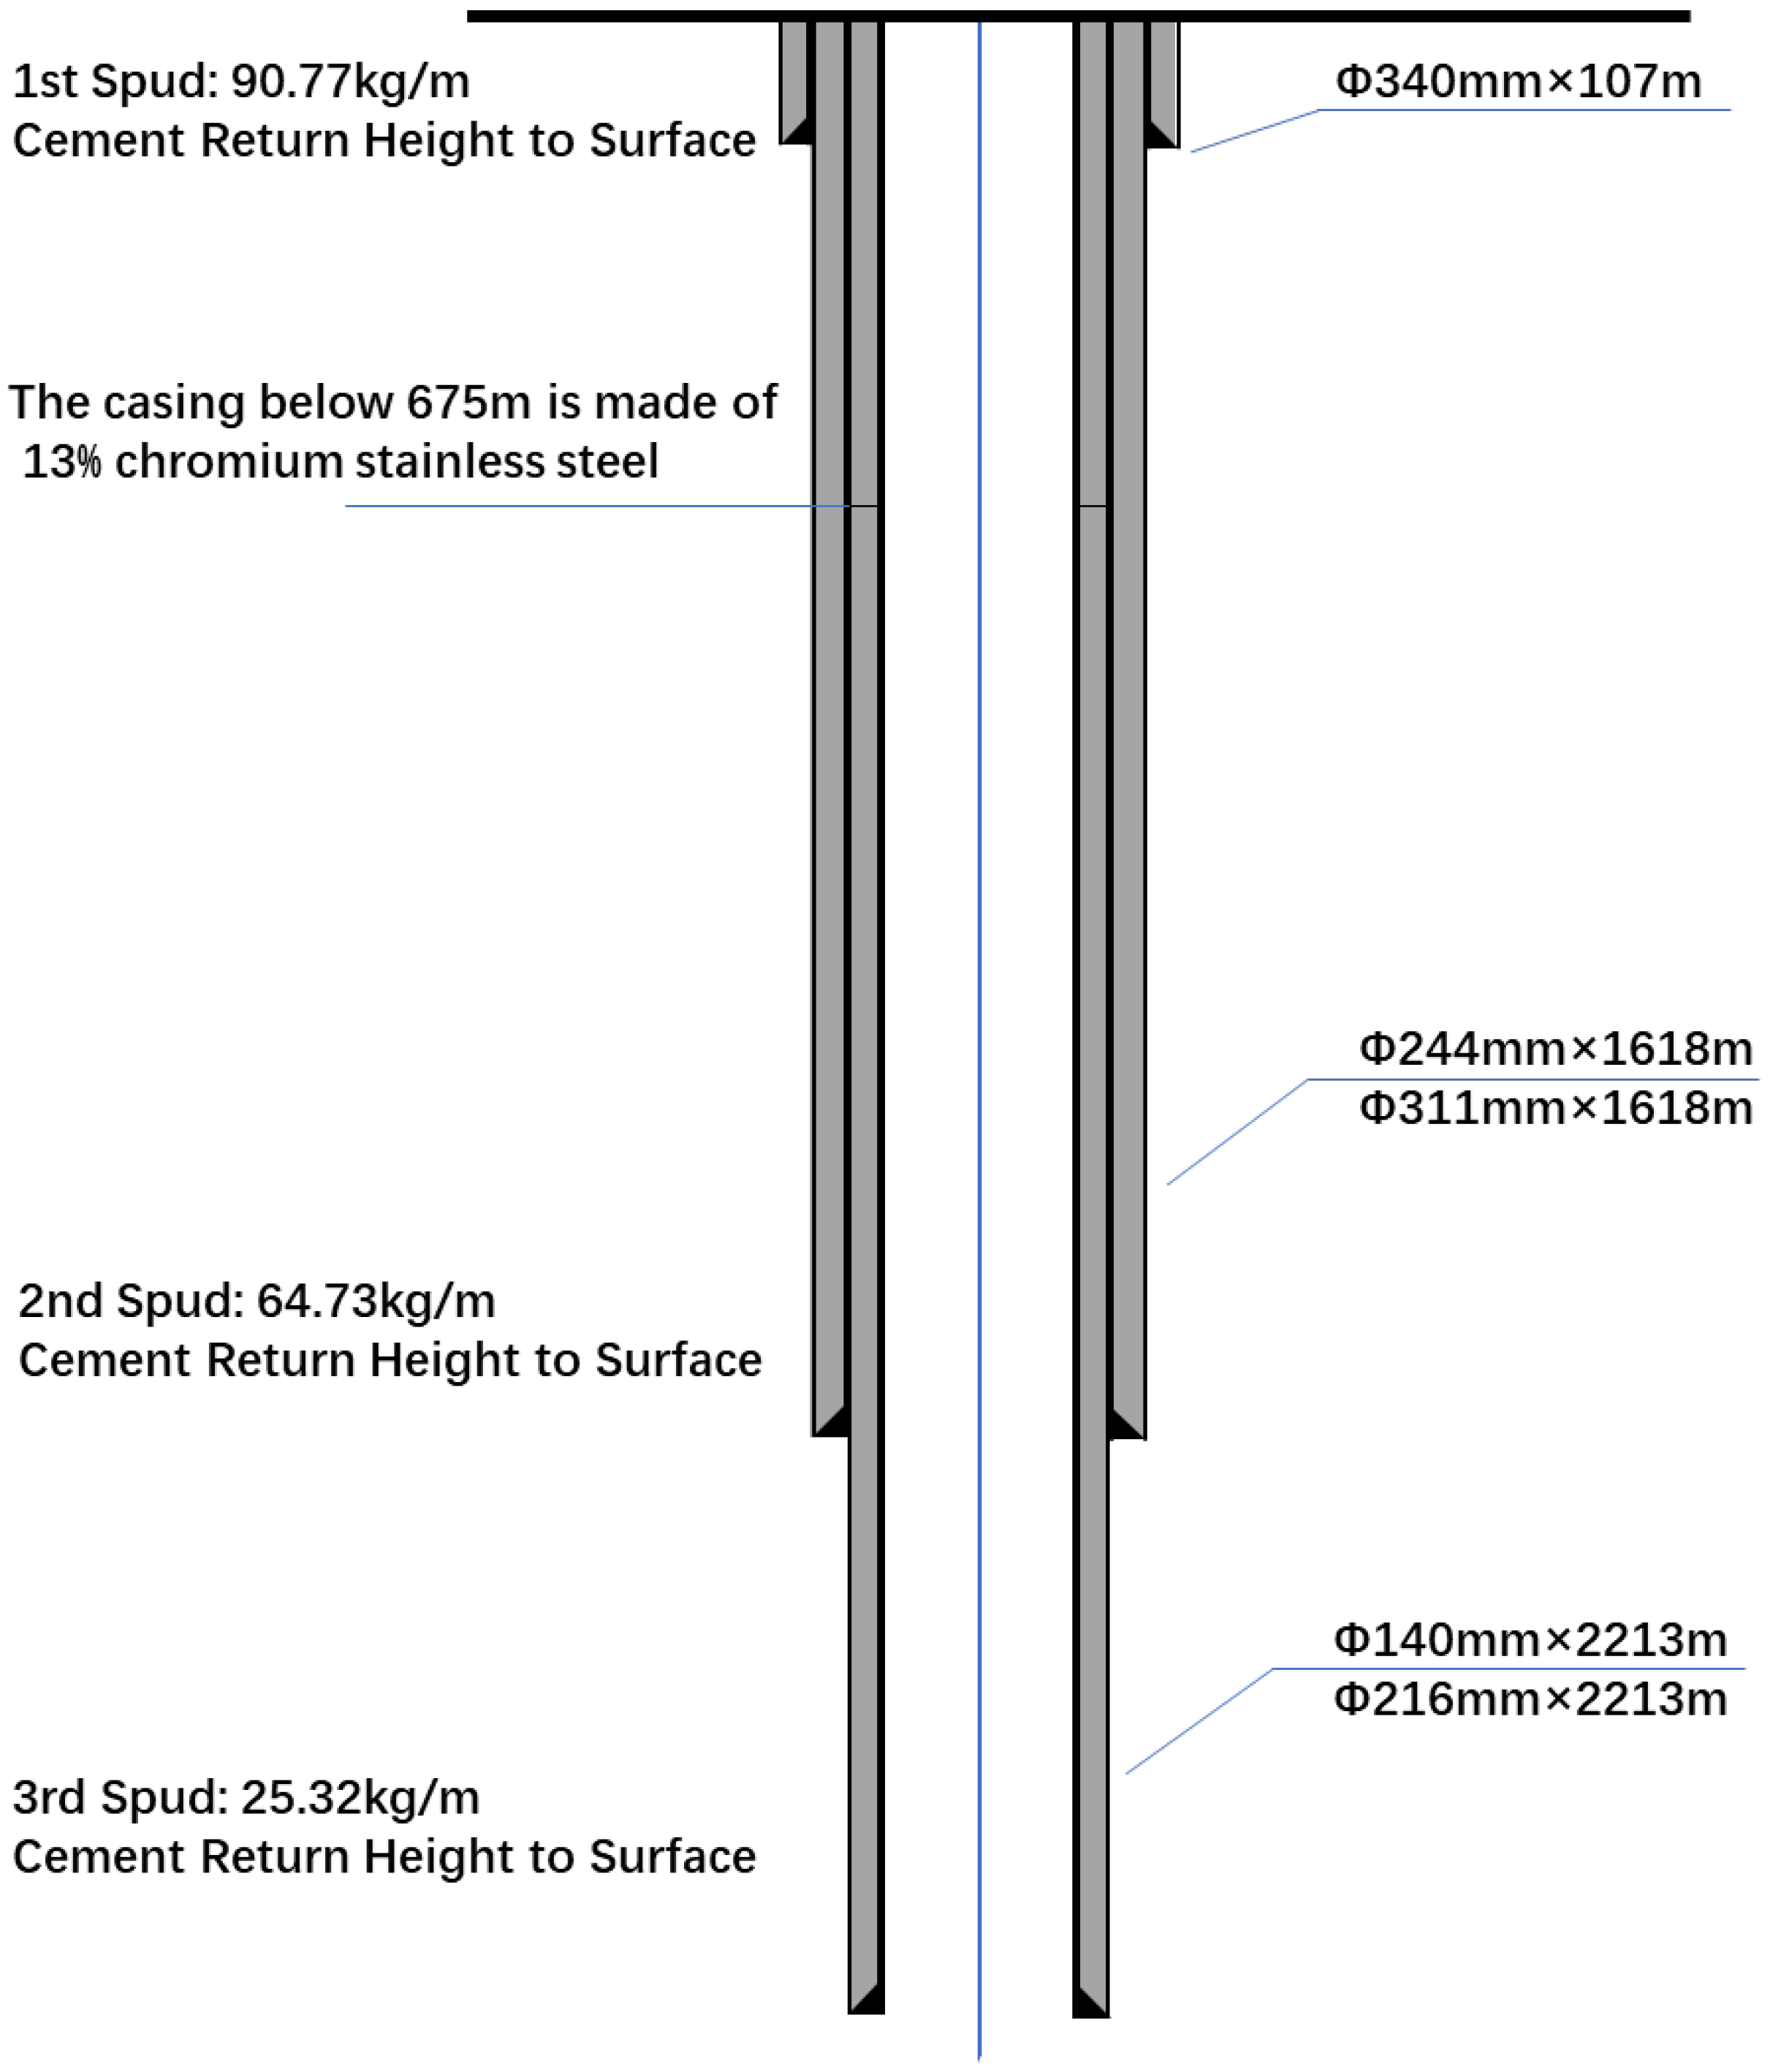
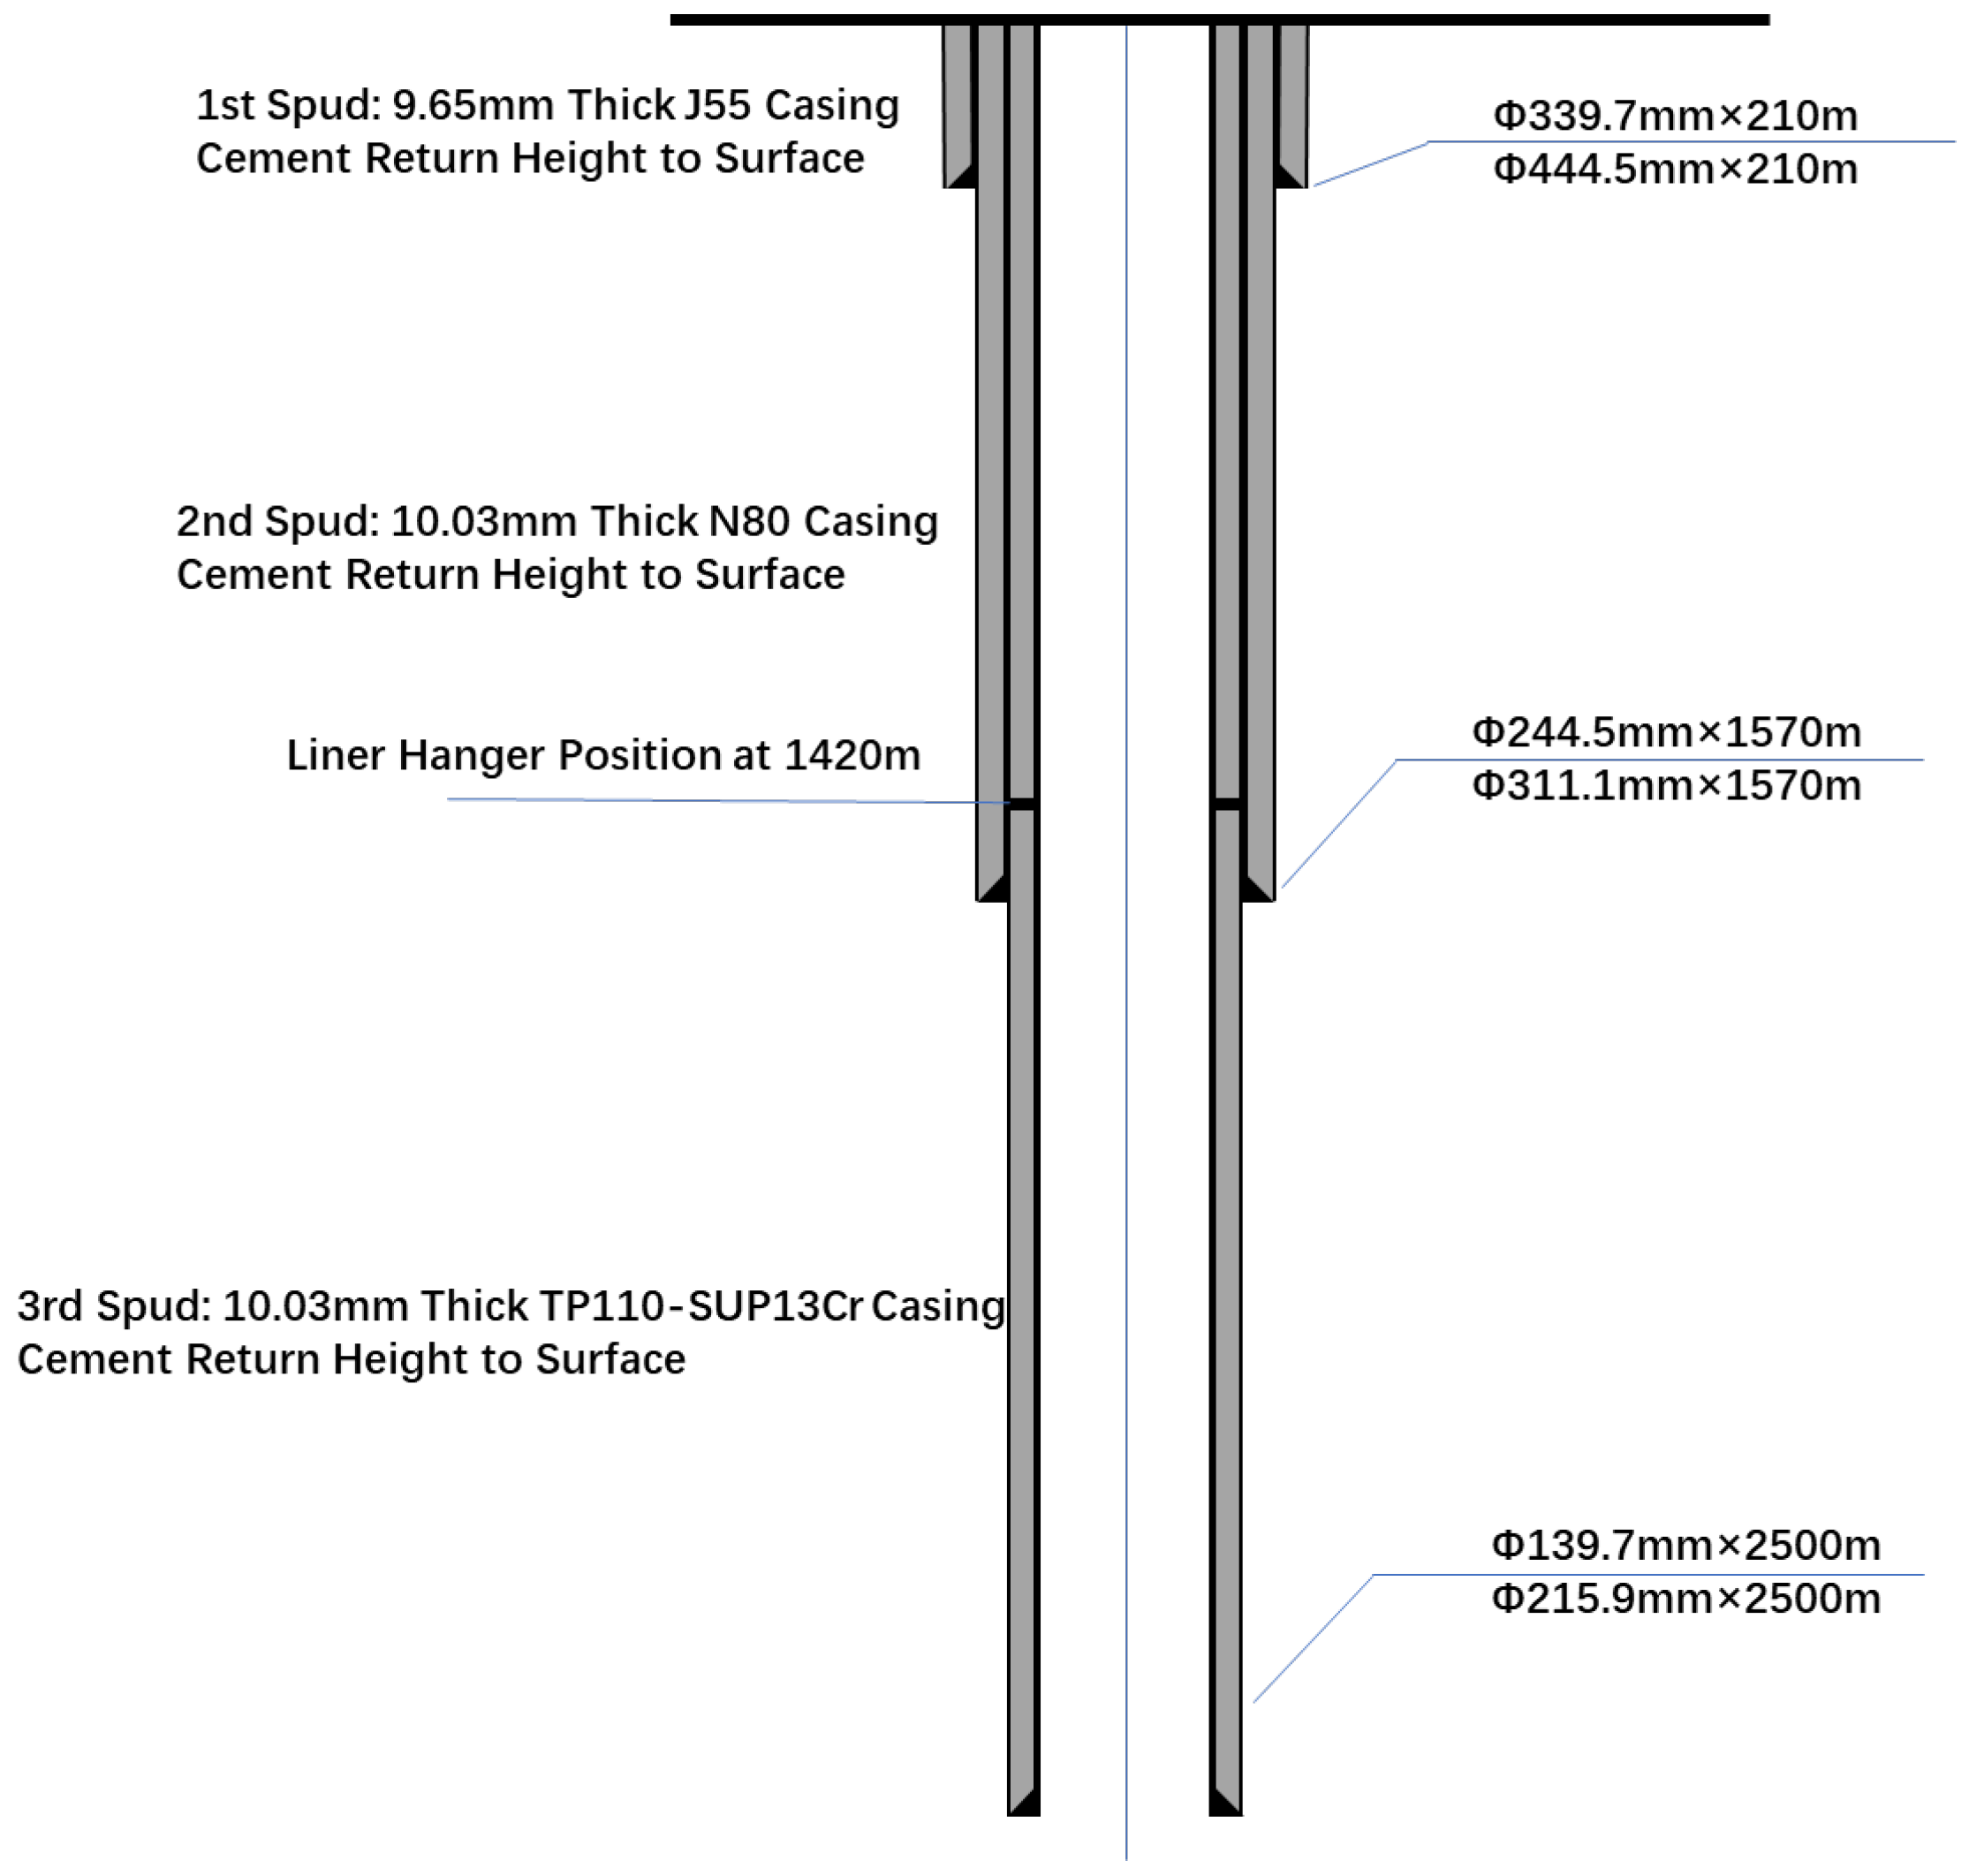
Well MW1 is responsible for monitoring the pore pressure and temperature of the Liujiaogou, Shiqianfeng, Shihezi, and Majiaogou Formations at four depths: 1690.447 m, 1907.447 m, 2196.431 m, and 2424.257 m. Well MW2 is responsible for conducting vertical seismic profiling (VSP) logging and collecting formation water samples to monitor vertical CO2 leakage [37]. Both the Shenhua INJW and MW1 are three-spud wells with stainless-steel casings, and the third spud was constructed through the use of liner cementing; the wellbore structure is shown in Figure 13. Both wells feature CO2 corrosion-resistant cement.
The sequestration body of the Shenhua CCS Project is composed of four sandstone layers and one carbonate layer, and a layered unified injection method is adopted after acid fracturing [44]. According to monitoring well data, the wellhead temperature ranges from −13.9 °C to 23.7 °C, the wellhead pressure ranges from 4.2 MPa to 8.4 MPa, and the displacement ranges from 0 to 20.2 m3/h [79]. From 2011 to 2014, four injection tests were conducted annually. After the first test, the injection pressure decreased over time while the injection index increased: the injection pressure dropped from 6.19 MPa in 2011 to 4.49 MPa in 2014, and the injection index rose from 4.06 m3/(h·MPa) to 33.92 m3/(h·MPa) [80].
During the early stages of the project, a relevant research institution conducted a feasibility study on injection methods and parameters, and it was determined that reservoir stimulation measures need to be adopted during actual injection. By stimulating the injection capacity, a constant-rate layered unified injection method was regarded as optimal and selected. Additionally, it was noted that a “difficult period” can be encountered at the initial injection stage—if an injection rate of 100,000 metric tonnes per year is to be maintained, the bottomhole flowing pressure needs to be increased significantly in a short period of time [81].
Over the two years prior to injection, the injection pressure changed significantly, dropping from the initial 8 MPa to 5.6 MPa. Meanwhile, the pressure required for supercritical CO2 to enter the main reservoir also decreased from 22.8 MPa to 20.5 MPa, which preliminarily indicates that CO2 is capable of optimizing and reconstructing the reservoir and channels, and highlights the occurrence of the aforementioned “difficult period”. According to the results of two production tests conducted in 2011 and 2012, it is shown that with the increase in injection volume, various parameters in the system continue to change. Under the layered unified injection mode, pressure is distributed freely between different formations, wherein different formations continuously and automatically adjust their injection volumes as CO2 exerts a reconstruction effect on the formations [81].

3.7. Japan’s Tomakomai Project

The storage site is 3~4 km offshore with a water depth of 10~35 m, including 2 injection wells and 3 monitoring wells. For injection well IW-2 in the Moebetsu Formation, its maximum deviation angle is 83°, total depth is 3650 m, vertical depth is 1188 m, horizontal section length is 3058 m, and bottomhole temperature is 87.5 °C. For Injection Well IW-1 in the Takinoue Formation, its maximum deviation angle is 72°, the well depth is 5800 m, the vertical depth is 2753 m, the horizontal distance is 4346 m, and bottomhole temperature is 35.9 °C. The injection spacing between the two wells is over 1100 m, and both are equipped with liners [41,82,83].
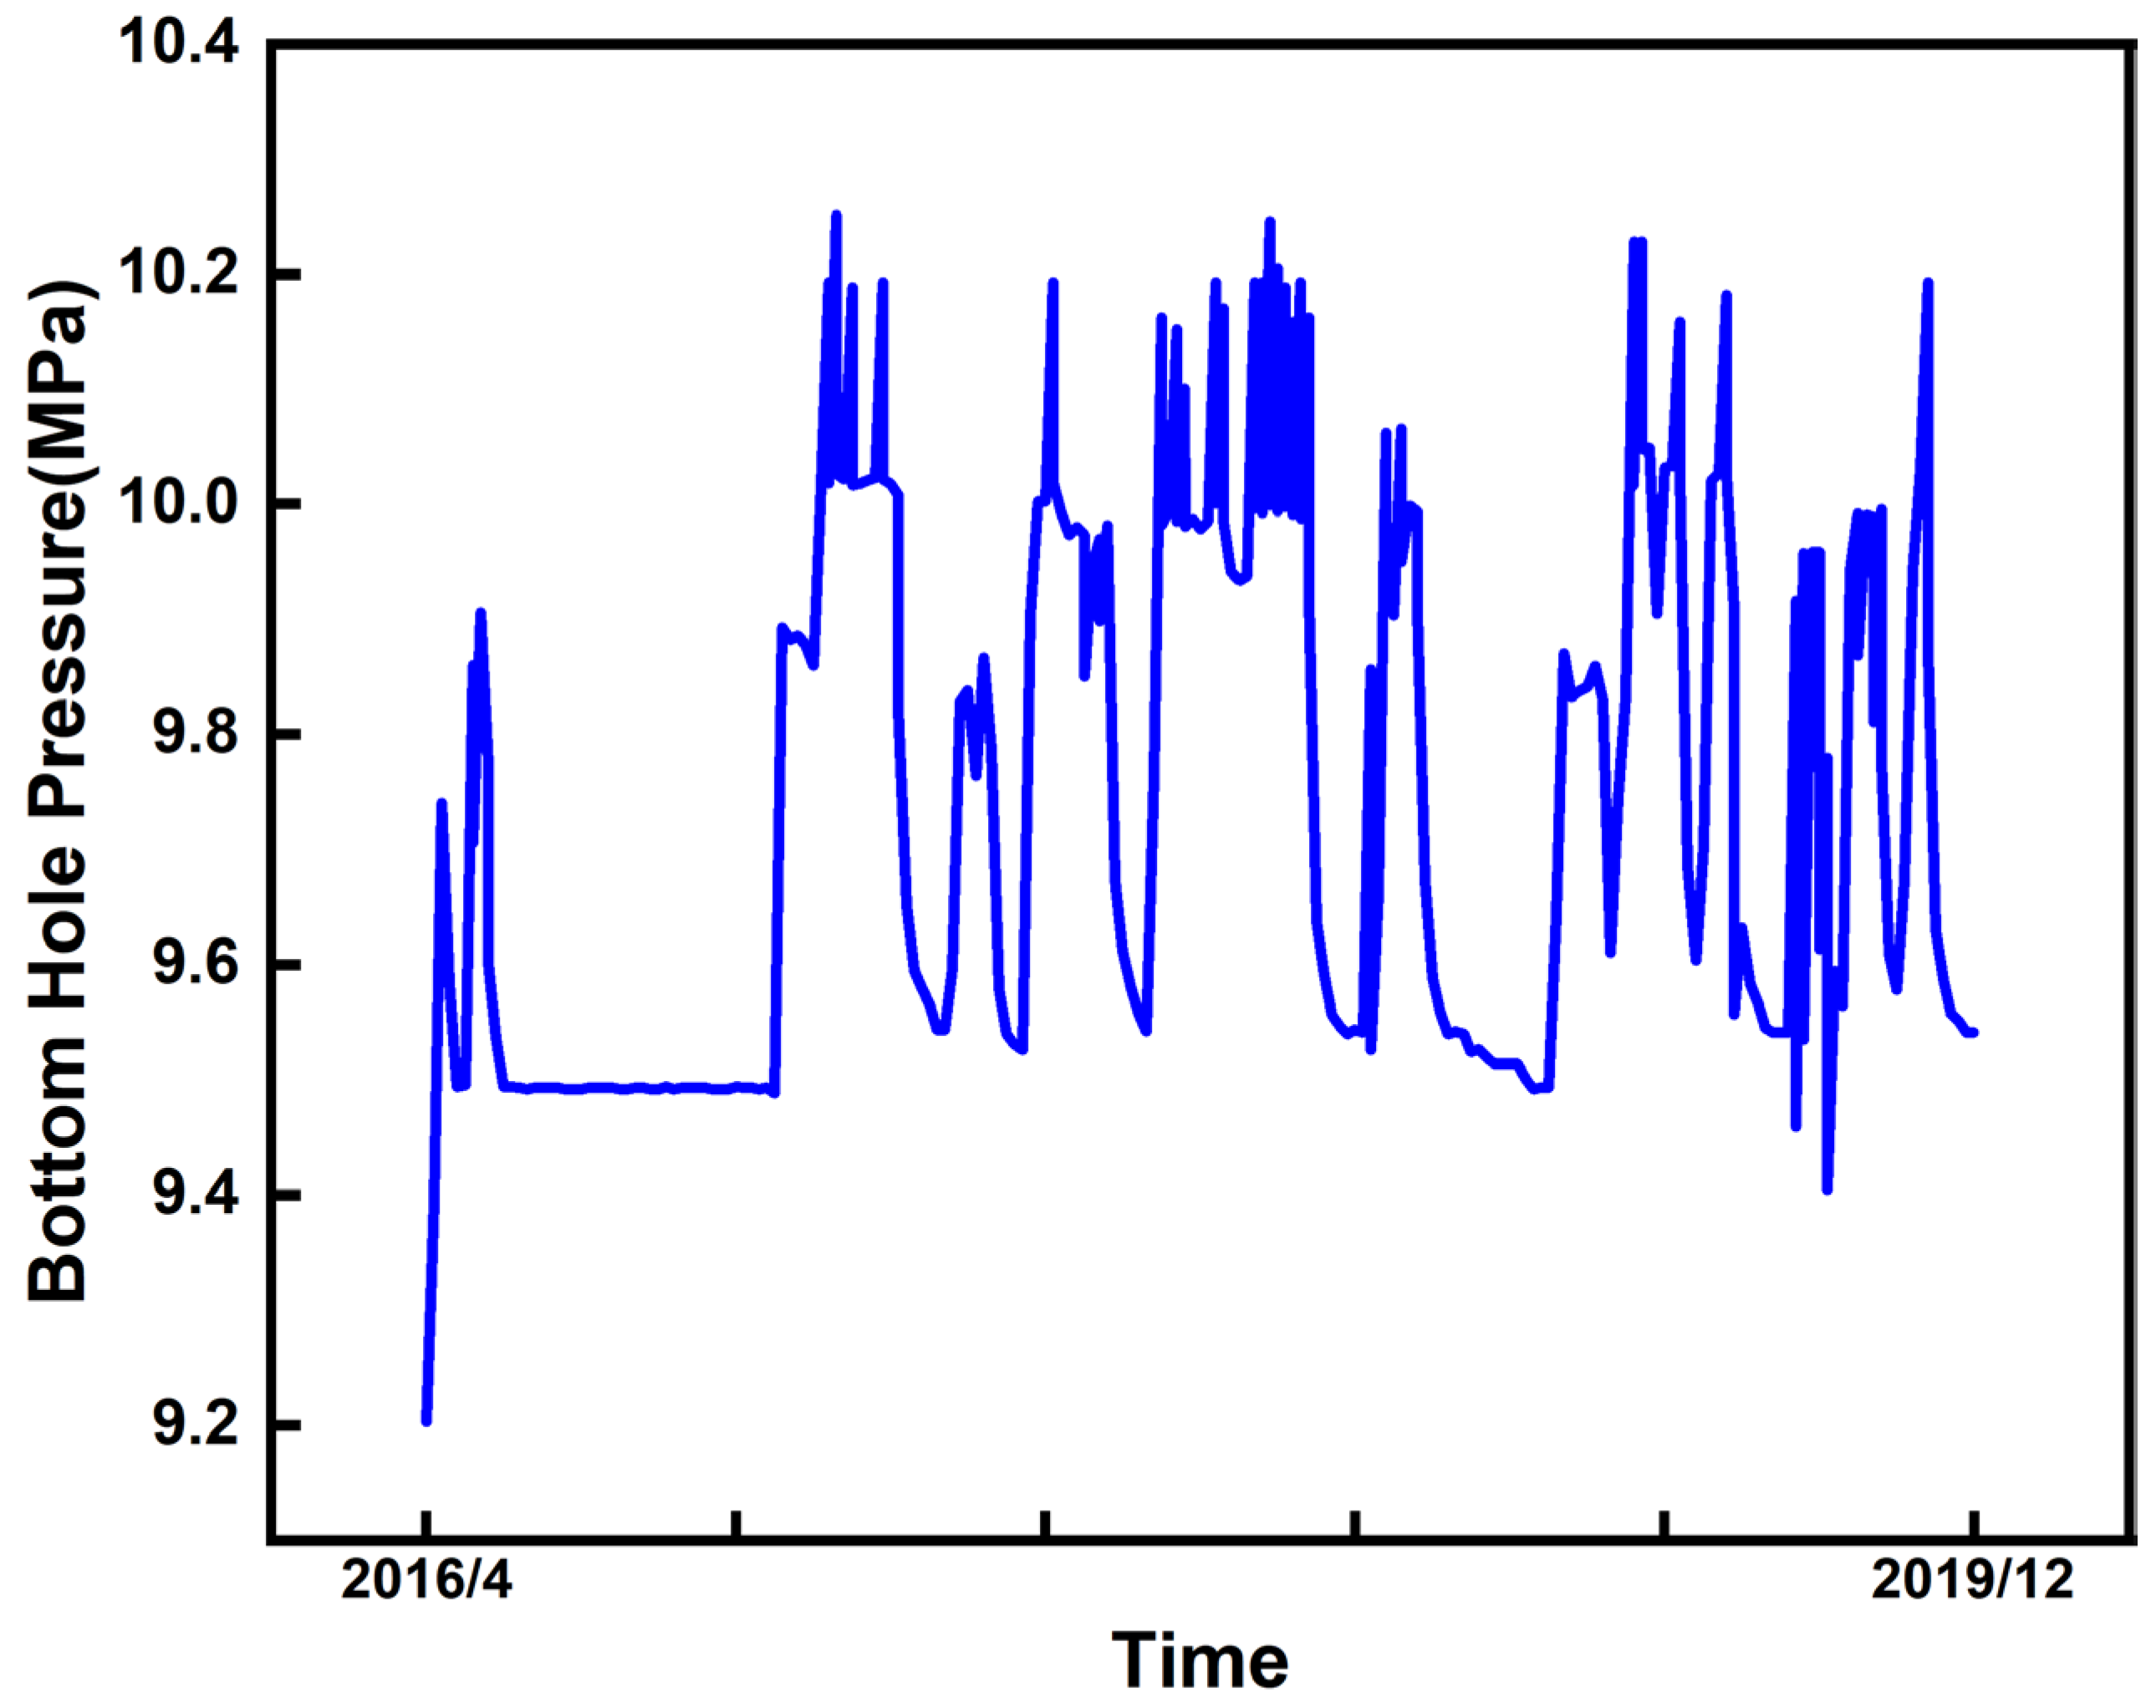
The CO2 generated from the hydrogen production unit of the refinery in this project is pressurized to the required injection pressure (up to 23 MPa) and injected into the reservoir [83]. In the initial design of the project, the maximum injection rate for the Takinoue and Moebetsu formations was 200,000 metric tonnes per year. However, after reservoir injection tests, it was found that the reservoir at the Takinoue Formation had poor physical properties—even injection was impossible during the test. Meanwhile, to avoid leakage from the Takinoue caprock, the maximum injection rate for the Takinoue Formation was adjusted to 1000 metric tonnes/year. In contrast, the Moebetsu Formation has demonstrated good reservoir performance, with an actual injection rate of 217,000 metric tonnes/year. The bottomhole pressure changes in the two wells are shown in Figure 14 and Figure 15; the bottomhole pressure of Well IW-2 is maintained at approximately 10 MPa, which is lower than the 12.6 MPa red line [42,82].

3.8. Australia’s Gorgon Project

To avoid fracturing the formations around the injection wells and to maximize the injection diffusion range, the organizers of the Gorgon Project opted for a wellsite layout consisting of nine CO2 injection wells, four produced water wells, two water treatment wells, and two monitoring wells [84]. During actual injection, the injection rate and bottomhole pressure are 10,900 t/d and 26.2 MPa, respectively [33], while the wellhead temperature and bottomhole temperature are 54 °C and 107 °C [85], respectively.
During the project’s injection period from 2019 to 2022, severe technical issues occurred, which affected reservoir pressure management and the stable injection of CO2. The first issue involved insufficient sand-control measures for the wells; sand particles damaged the submersible pumps in the water wells, resulting in injection being suspended in 2021. The second issue was the continuous increase in pressure in the Dupuy Formation, which approached the fracture pressure of the caprock and significantly restricted the CO2 injection rate [86]. The third issue was that the CO2 injection wells experienced water loading and blockages exceeding the threshold. The root cause of this problem lay in the premature condensation of CO2 into water, leading to water blockage in the injection wells; to prevent this situation, the CO2 supply pipelines need to be heated [87].
Taking the above issues into account, the operator announced the suspension of injection in 2023. Sidetracking was conducted on all wells, they were equipped with gravel packing and active sand-control systems, and the number of water wells was increased to address the sand-control and pressure management issues [86].

3.9. Summary of Saline Aquifer Storage Projects

Globally, the engineering parameters of saline aquifer CO2 storage projects are strongly correlated with CO2 behavior in reservoirs, with significant differences. For example: In terms of well depth, except that the Ketzin Project does not meet the supercritical condition (requiring a depth of 800 m), the well depths of other projects range from 800 m to 3000 m. Thus, Ketzin needs to preheat the injected gas to 45 °C to achieve the supercritical state, but still faces the risk of phase change. Regarding injection rate, the Shenhua Project reaches 274 t/d while the Sleipner Project reaches 2700 t/d, showing remarkable differences. The reservoir pressure increase also varies significantly—Sleipner and Decatur have reservoir pressure increases of <0.5 MPa and 2.41 MPa, respectively, while Snøhvit and Gorgon experience sudden pressure surges due to reservoir characteristics or design issues, reflecting the importance of injection parameters for storage safety. In engineering practice, Sleipner has achieved stable storage of over 20 million metric tonnes of CO2 for 25 years through the “corrosion-resistant casing + dense-phase flow injection” mode, with the key lying in the precise matching between injection rate and reservoir connectivity. Decatur maintained constant-rate injection and stable pressure for 3 years relying on reasonable wellsite layout and wellbore corrosion protection design, confirming the importance of proper wellsite arrangement and corrosion prevention design. On the contrary, Snøhvit failed to properly assess fault sealability, and the injection of dry CO2 caused salt precipitation and decreased injectivity, leading to the pressure rising from 28.5 MPa to 38 MPa (close to the fracture pressure), which forced a change in injection zone. Gorgon suffered injection interruption due to insufficient sand control, wellbore clogging by condensed water from CO2, and ineffective pressure control, requiring rectification measures such as sidetracking and well recompletion. The Shenhua Project encountered an “injection difficulty period” initially, with the injection pressure dropping from 8 MPa to 5.6 MPa, and the situation improved after acid fracturing optimization—highlighting the necessity of reservoir stimulation before injection for low porosity and low permeability reservoirs.
In summary, the core experiences of geological CO2 storage in saline aquifers can be summarized into three points: First, for injection parameters, the coupling relationship between reservoir characteristics, parameter design, and risk thresholds must be clarified. Injection parameters and site design need to be dynamically optimized through reservoir simulation and preliminary tests. Second, wellbore integrity requires adherence to full-life-cycle protection. Casing materials and cement sheath performance must match CO2 fluid characteristics, while offshore and high-pressure projects need additional considerations such as sand control and anti-condensation. Third, preliminary reservoir evaluation should cover three aspects: reservoir connectivity, fault development, and water-rock reactions, to avoid engineering failure caused by insufficient geological understanding. Future projects should focus on learning from Sleipner’s parameter adaptation experience and Decatur’s injection/monitoring system design, while avoiding issues such as Snøhvit and Gorgon’s lack of geological evaluation and inadequate multi-risk management. Through accurate geological modeling and dynamic parameter regulation, safe and efficient storage can be achieved.

4. Depleted Oil and Gas Reservoir Storage Project

Depleted oil and gas reservoir storage is a technology that utilizes the underground spaces of oil and gas fields temporarily unviable for economic exploitation for long-term CO2 storage. After years of development, the remaining oil and gas in these reservoirs cannot be further extracted due to economic or technical constraints, but their geological structures (such as intact trap structures and sealing caprocks) still possess good sealability, which can effectively prevent leakage. This technology can fully leverage existing exploration data and wellsite equipment, significantly reducing the cost and project duration of storage projects, and is one of the important approaches for the oil industry to achieve carbon emission reduction.

4.1. Algeria’s in Salah Project

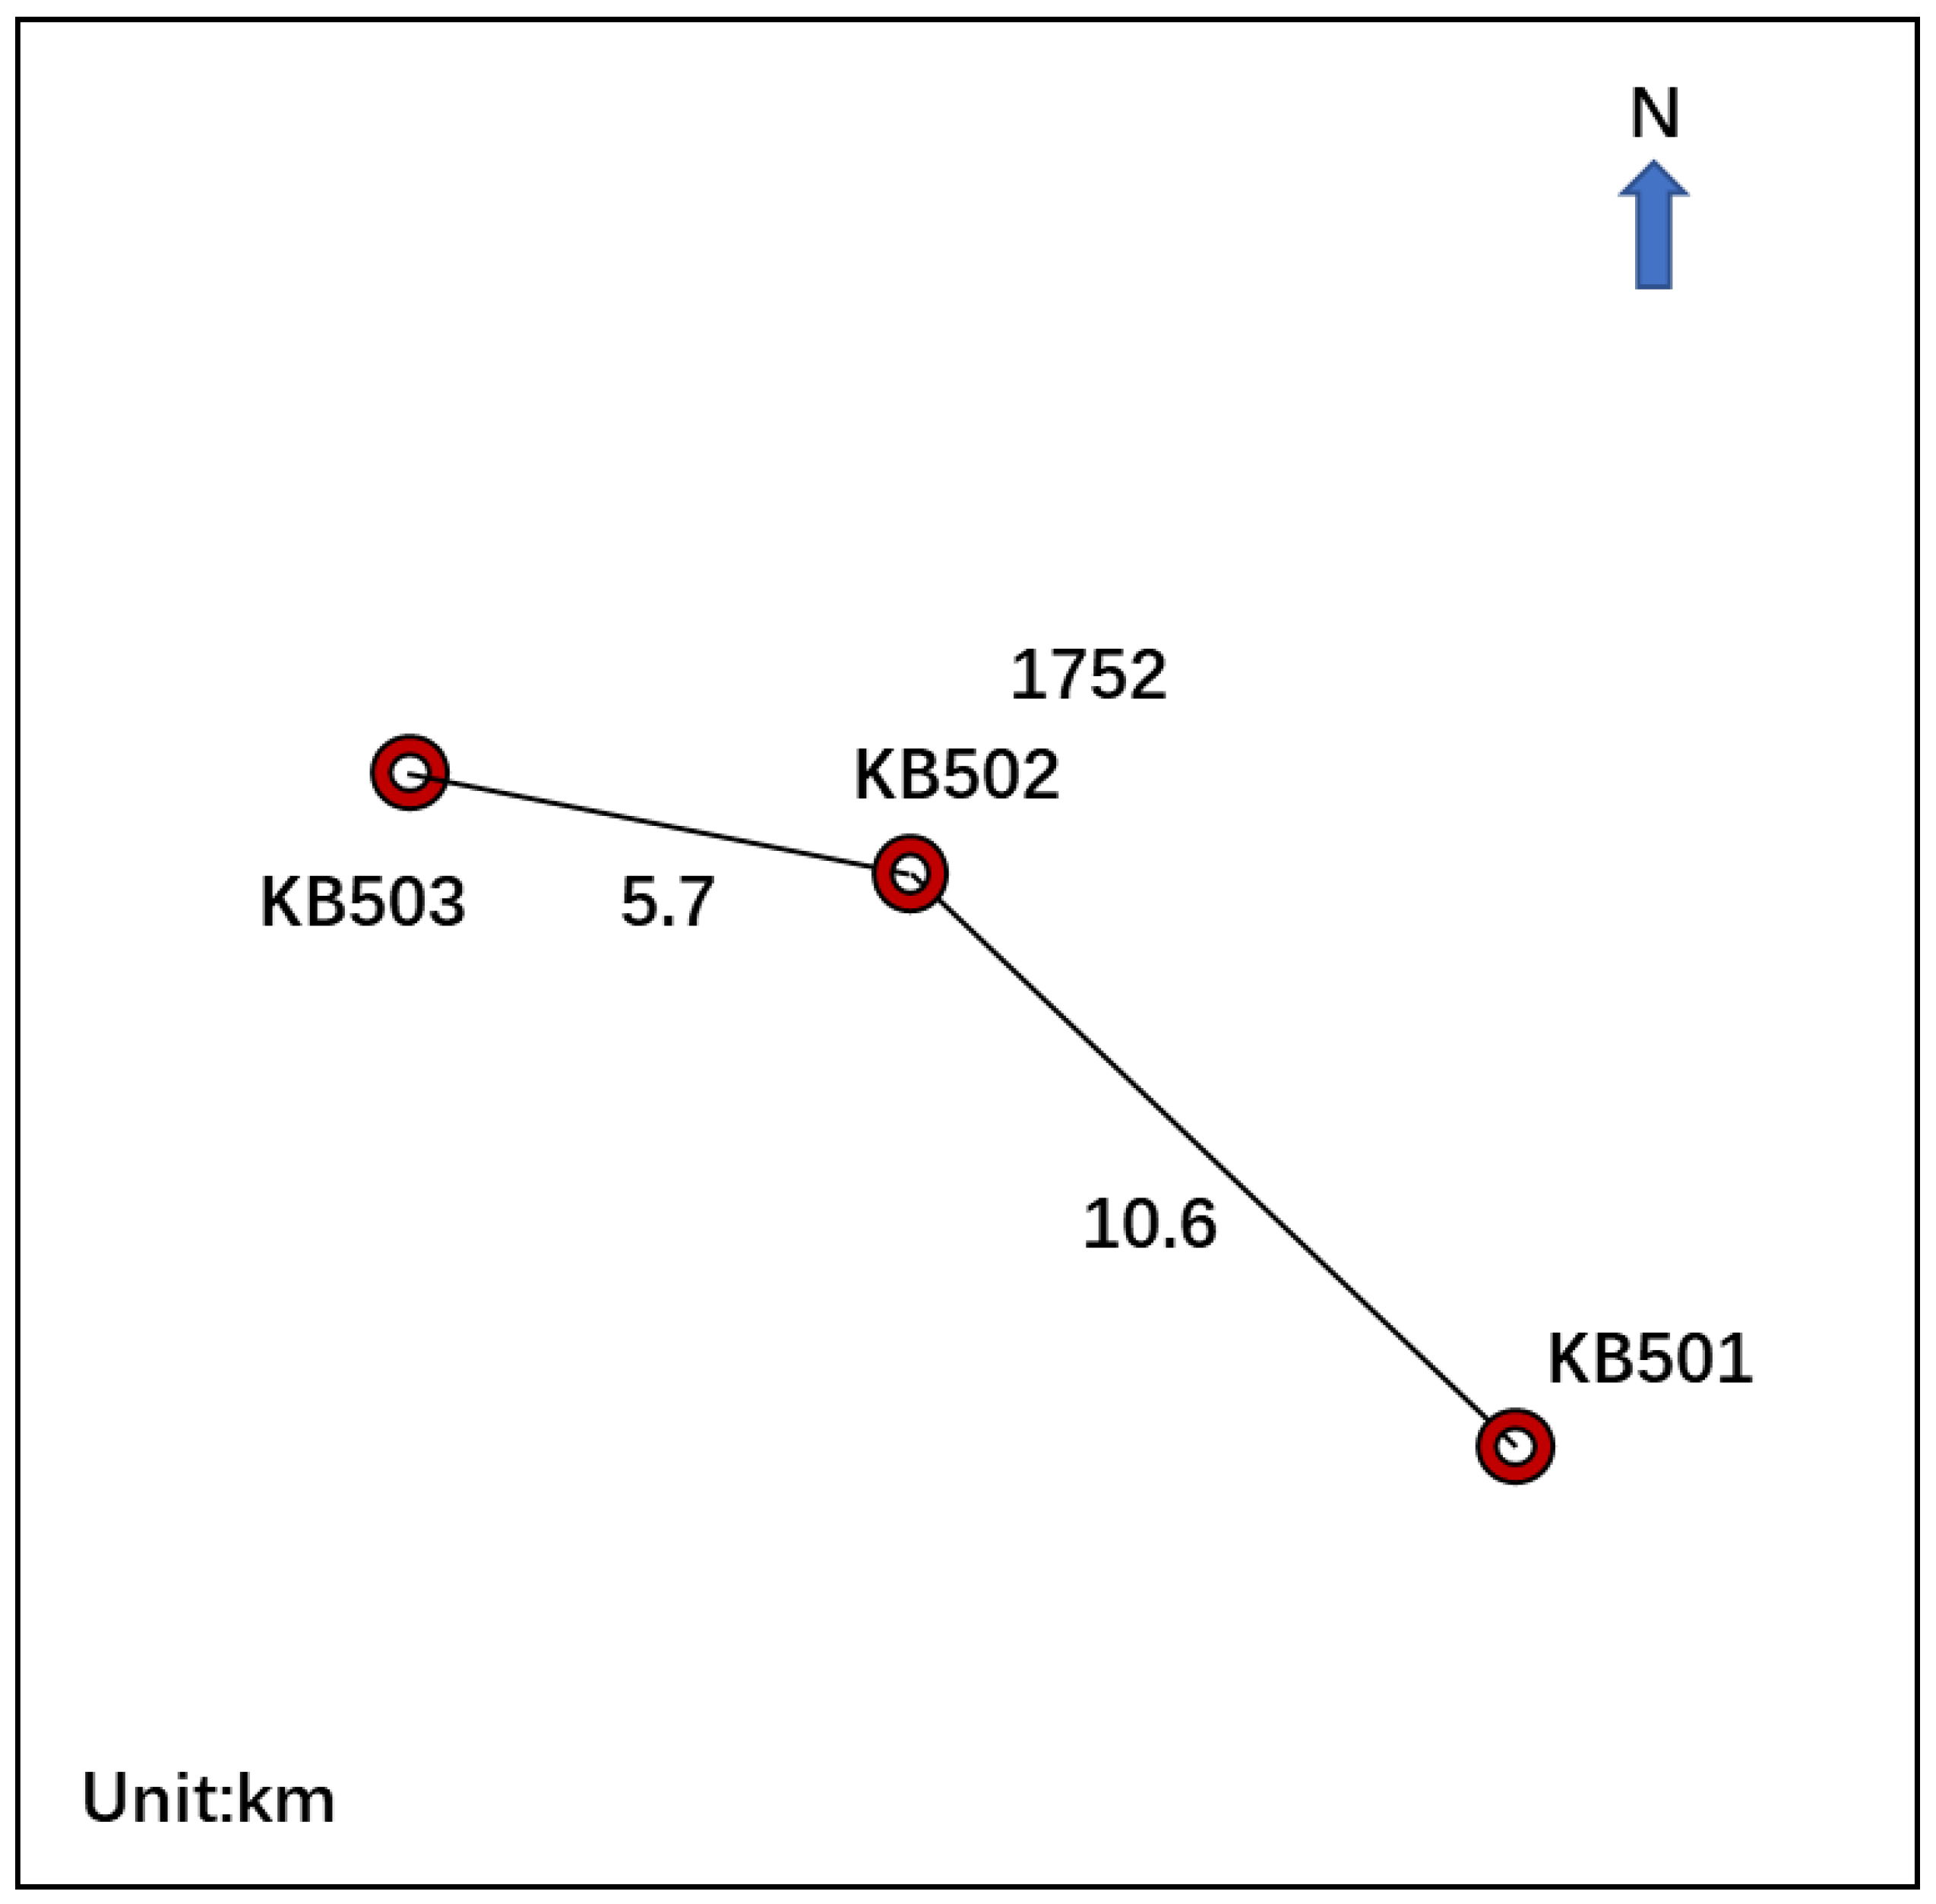
The In Salah Oilfield CCS Project includes three horizontal injection wells (KB501, KB502, KB503) and five shallow monitoring wells [20], with the length of the horizontal section ranging from 1500 to 1800 m [88]. The horizontal wells are parallel to the direction of the minimum horizontal stress [89]; the purpose of this is to maximize the additional permeability provided by the dominant fracture sets, thereby increasing the injection rate and ensuring a uniform CO2 distribution in the reservoir. The layout of the wells is shown in Figure 16. The injection pressure of the three wells ranges from 14 to 18 MPa, the bottomhole pressure is maintained at 29 MPa (higher than the initial reservoir pressure of 18 MPa), and the injection temperature ranges from 25 to 55 °C [21], and the bottomhole temperature is 48 °C [42].
In theory, CO2 is injected into the natural gas reservoir, but in reality, it is injected into the water-bearing zone of this reservoir, and the connectivity between the two is poor. Therefore, the rate of gas production cannot offset the injection rate, leading to a significant increase in formation pressure [89]. This resulted in severe geomechanical deformation, with the ground surface uplifting by nearly 2 cm [90] and thousands of microseismic events occurring [91]. It also activated a fracture network extending 100–200 m from the reservoir to the overlying strata. However, under the sealing effect of the 900 m thick caprock, this fracture does not pose a threat to sequestration safety [92]. The geological issues of the In Salah Project have provided important lessons to be learned in other projects with thinner caprocks.

4.2. Brazilian Pre-Salt Project

Taking the CO2 injection in the Lula Oilfield as an example, the initial temperature of the reservoir ranges from 60 to 70 °C, with low formation-fluid viscosity and high pressure. The pilot test features two WAG (Water-Alternating Gas) injection wells and one gas injection well. This design enables the injection wells to flexibly switch between water and gas injection, and supports alternating gas injection through different wells [93]. In April 2011, the injection wells began operating at a rate of 1,000,000 m3/d, with the injected gas mainly composed of hydrocarbons and containing a small amount of CO2; starting from September 2011, CO2 was separated from the produced gas, and the injection gas was adjusted to CO2 with a concentration exceeding 80% as the main injected medium at an injection rate of 350,000 m3/d [94].

4.3. Canada’s Weyburn Project

The Weyburn Oilfield is located in Saskatchewan, Canada. Since 2000, it has been injecting CO2—a byproduct of coal gasification from the United States—into the depleted oil and gas reservoirs of the Williston Basin [95]. The target formation is the Mississippian Midale Formation carbonates, with a burial depth of approximately 1450 m and a thickness of about 40 m. The upper part consists of high-porosity and low-permeability Marly dolomite (2–12 m thick, porosity of 26%, permeability of 10 mD), while the lower part is low-porosity and high-permeability Vuggy limestone (8–22 m thick, porosity of 15%, permeability of 30 mD). Compared with the Vuggy formation, the Marly formation is dense, with lower flow capacity and sweep efficiency. The overlying caprocks are the low-porosity and low-permeability Midale evaporites and Frobisher evaporites [96].
The depleted Weyburn Oilfield has been under production since 1954, started water flooding in 1964, and launched CO2 flooding in September 2000 [97]. The Weyburn injection site has approximately 300 injection wells, including 160 water injection wells, 17 CO2 injection wells, and 110 water-alternating-gas (WAG) wells; in addition, there are 60 groundwater monitoring wells and 4 shallow monitoring wells [98,99]. The injected CO2 includes captured CO2 and CO2 recovered from CO2-enhanced oil recovery (CO2-EOR), with an injection pressure of 10–11 MPa. After injection, the bottomhole pressure increased by 8 MPa and the temperature decreased by 7 °C [100]. The annual injection volume is approximately 2 million metric tonnes per year, i.e., an average of about 5500 tonnes per day [101]. By 2010, the cumulative injection reached 16.1 million metric tonnes, and it is expected that over 30 million metric tonnes of CO2 will be stored by the end of the project’s 30-year injection period.
The Weyburn Oilfield faced multiple challenges in CO2-EOR and geological storage practices, and targeted solutions have been developed for each: For caprock integrity risks, 4D seismic monitoring, microseismic monitoring, and geochemical modeling were used to confirm no signs of caprock leakage, while geological modeling was enhanced to identify low-permeability barriers. For the risks of cement sheath aging and casing corrosion in old wells, cement sheath repair technology was adopted and regular wellbore inspections were conducted. For CO2 migration and sweep efficiency issues caused by carbonate heterogeneity, the injection-production well pattern was optimized (combination of horizontal wells and vertical injection wells) and water-alternating-gas injection was used to control mobility. Ultimately, the project demonstrated the commercial feasibility of CO2-EOR and geological storage.

4.4. Canada’s Pembina Project

In 2005, Canada conducted CO2 injection in the Pembina Oilfield, Alberta, for CO2 storage and enhanced oil recovery (EOR). In this project, CO2 was injected into the Upper Cretaceous Cardium Formation sandstone reservoir, with a burial depth of approximately 1650 m and a thickness of about 20 m. The Cardium Formation is mostly distributed across three sandstone layers, with an average porosity ranging from 14.8% to 16.4%. The average permeability of the lower section is the lowest at 9.5 mD, while those of the middle and upper sections are 21.4 mD and 19.8 mD, respectively [102]. The average temperature and pressure are 50 °C and 19 MPa [103]. The overlying Wapiabi Formation shale serves as the main caprock, and its low permeability can effectively seal CO2. However, there are also local shale interbeds within the Cardium Formation, which further enhance the sealing capacity [104]. This CO2-EOR project consists of two injection wells, six production wells, and one monitoring well. The injection pressure and injection temperature are 7.1 MPa [105] and 37 °C, respectively, while the bottomhole pressure and bottomhole temperature are 26.9 MPa and 98 °C [106], respectively. The daily injection rate ranges from 35 to 100 t/d, and the cumulative CO2 injection reached 66,000 metric tonnes during 2005–2008 [107].
Similarly to Weyburn, the Pembina project also injects CO2 into depleted oil and gas reservoirs to restore pressure. However, reservoir heterogeneity and low permeability result in low CO2 sweep efficiency and injection difficulties. Long-term injection may cause an increase in pore pressure, leading to caprock microfractures or fault activation. Therefore, hydraulic fracturing and horizontal well technology were used to improve seepage capacity, and real-time pressure monitoring and injection rate control were adopted to avoid overpressure. Meanwhile, due to poor reservoir connectivity, CO2 is prone to channeling along high-permeability paths. Thus, the water-alternating-gas (WAG) injection mode was implemented to enhance displacement efficiency.

4.5. Summary of Depleted Oil and Gas Reservoir Storage Projects

In response to different geological challenges, each project has adopted differentiated injection strategies. The In Salah project experienced significant geomechanical responses due to drastic changes in injection pressure (a 18 MPa increase in bottomhole pressure), while the Weyburn project had an injection pressure of 10–11 MPa with no leakage accidents detected. Regarding injection rates, Weyburn’s rate is 13,000 t/d, the Pre-Salt project’s Lula Oilfield injects CO2 at 350,000 m3/d, and Pembina’s is only 35–100 t/d. Differences in engineering parameters are also reflected in storage safety: Weyburn and Pre-Salt maintain stable pressure with no risks, while In Salah suffered surface uplift and microseisms due to pressure accumulation, and Pembina had low injection efficiency restricted by low-permeability intervals.
In engineering practice, designs adapted to the characteristics of depleted oil and gas reservoirs have achieved remarkable results: Weyburn utilized the existing network of hundreds of wells. Targeting carbonate heterogeneity, it adopted a combination of horizontal and vertical wells plus water-alternating-gas (WAG) injection, which not only improved CO2 sweep efficiency but also controlled pressure within a safe range. Additionally, it solved the sealing problem of old wells through cement sheath repair technology, realizing long-term stable operation. Pre-Salt reused the oilfield’s existing injection-production system and designed a convertible wellbore structure for water/gas injection. After switching from hydrocarbon gas injection to 80% concentration CO2 injection in 2011, it was put into use without large-scale modifications, and its storage capacity far exceeded that of saline aquifer projects in the same period. In contrast, In Salah injected CO2 into an isolated water-bearing zone of a natural gas reservoir without evaluating reservoir connectivity; the imbalance between injection and gas production led to pressure loss control, activating a fracture network extending to the caprock. Pembina did not conduct reservoir stimulation targeting the permeability difference between sandstone layers of the Cardium Formation, resulting in decreased injection efficiency later.
In summary, the key to the successful implementation of depleted oil and gas reservoir projects lies in: conducting advance assessments of reservoir connectivity and wellbore integrity, formulating injection strategies based on reservoir physical properties, and retaining room for parameter adjustments when utilizing existing facilities. Failures are mostly caused by insufficient reservoir evaluation or neglect of interlayer differences. Future projects should learn from Weyburn’s experience in old well maintenance and Pre-Salt’s idea of facility reuse, avoid the design inadequacies of In Salah and Pembina, and maximize the unique advantages of depleted oil and gas reservoirs—safe storage plus resource reuse.

5. Basalt Storage Project

Basalt storage is a technology for permanent CO2 storage using basalt, mainly achieved through mineralization reactions. Its core principle is to inject captured CO2 into saline aquifers in underground basalt formations. It utilizes ions such as Ca2+, Mg2+, and Fe2+ abundant in basalt to undergo chemical reactions with CO2, forming stable carbonate minerals (e.g., calcite, magnesite, siderite, etc.), thereby immobilizing CO2 underground.

5.1. Iceland’s Carbfix Project

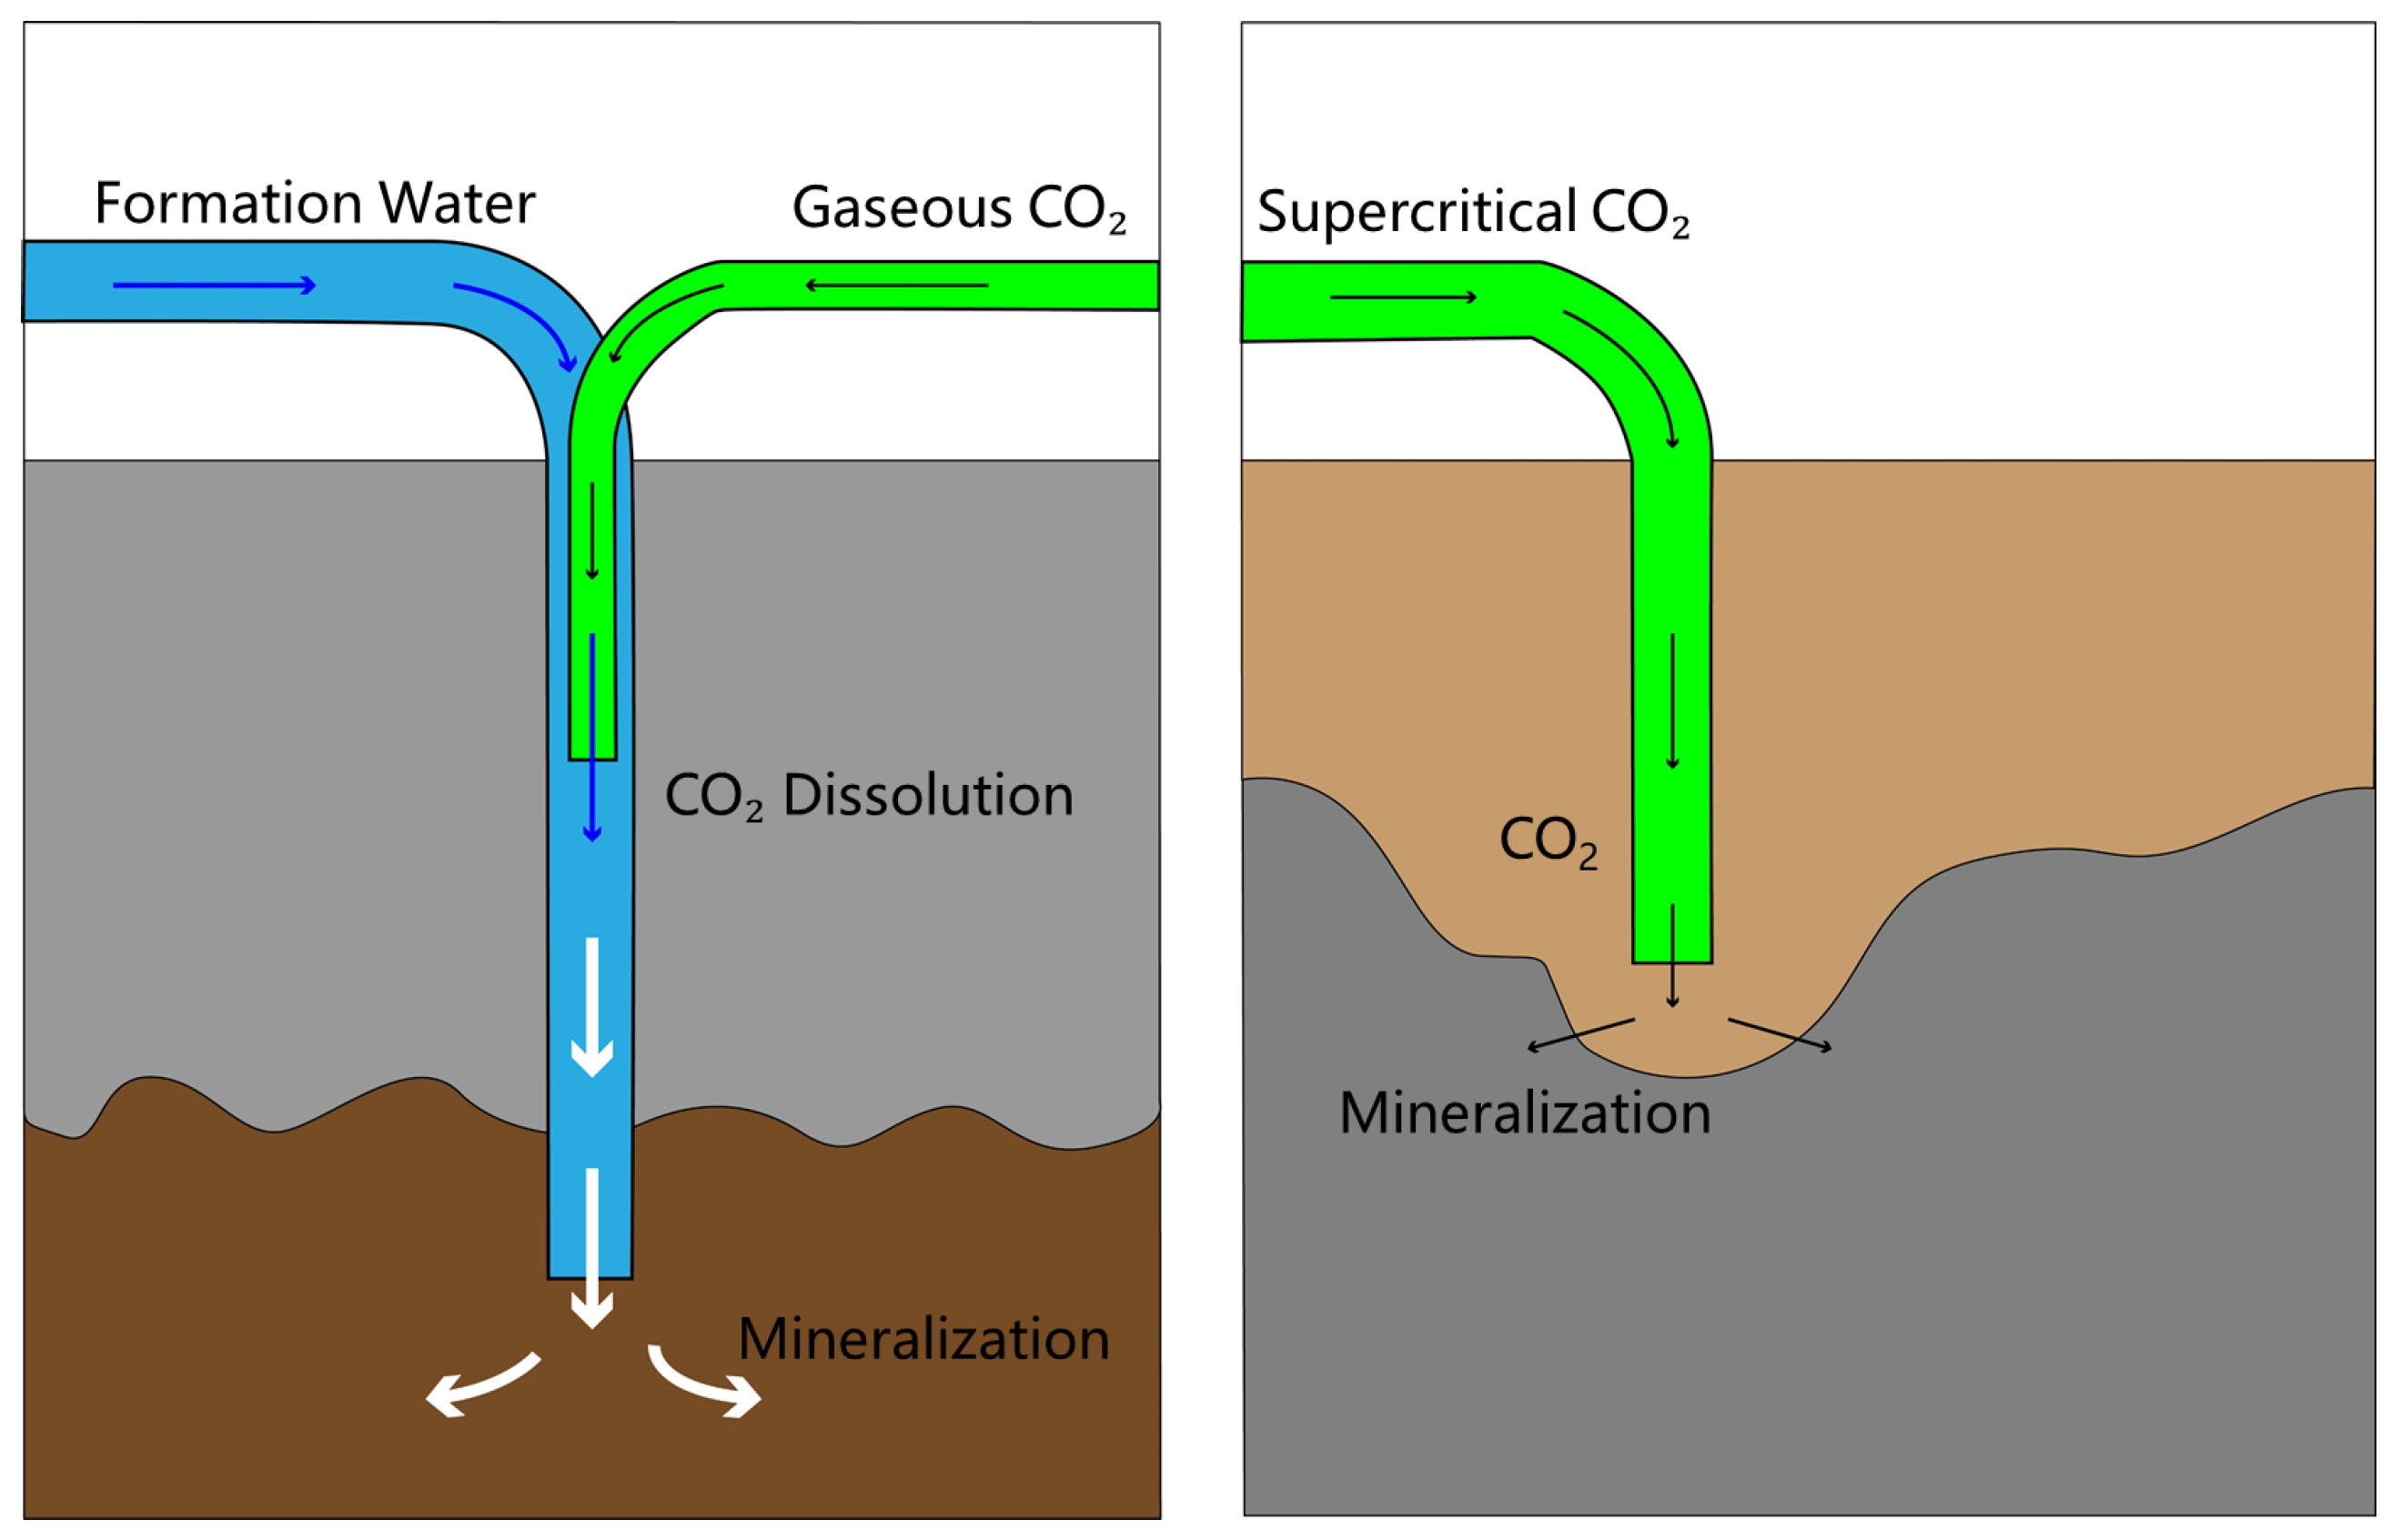
Three wells (HN-01, HN-02, and HN-04) have been drilled at the CarbFix injection site [108]. Well HN-02 is used for CO2 injection; the nearby Well HN-01 extracts water from the reservoir and injects it into Well HN-02 as the water source for CO2 dissolution; and Well HN-04 is a monitoring well [109]. To ensure the progress of the mineralization reaction, the supervisors of the project elected to dissolve CO2 in the water using the two injection methods, shown in Figure 17 [110]. By the end of the first phase of the CarbFix project, the cumulative injection of CO2 gas reached 175 metric tonnes, water reached 5000 metric tonnes, and the gas-water ratio was 1:28.5 [111]. Over the period in which injection was initiated, all CO2 was dissolved in the formation water extracted from the nearby Well HN-01 to increase the downhole fluid flow rate and maintain a stable bottomhole pressure. The temperature and pH value of the formation water were 25 °C and 9.3 [15], and the injection pressure is slightly higher than 2.5 MPa [112]. The average injection rates of dissolved gas in the first and second phases of the project were 6.05 t/day and 0.864–4.32 t/day, respectively [113]. The CO2 fluid entered the reservoir at a depth of 340 m in Well HN-02 [114], and at a depth of 525 m, the measured hydrostatic pressure in this well exceeded 4 MPa, which shows that all CO2 had been successfully dissolved in water before leaving the injection well [97].
In August 2013, the submersible pump used for sampling in Well HN-04 stopped working; after retrieval, it was found to be blocked by off-white sediment [16]. X-ray diffraction (XRD) analysis showed that the sediment was calcite, and the 14C contained in this calcite confirmed that the CO2 sequestered in these carbonates originated from the CarbFix injection [115], verifying the effectiveness of mineralization sequestration. It is estimated that more than 95% of the CO2 was mineralized in less than two years [113].

5.2. U.S. Wallula Project

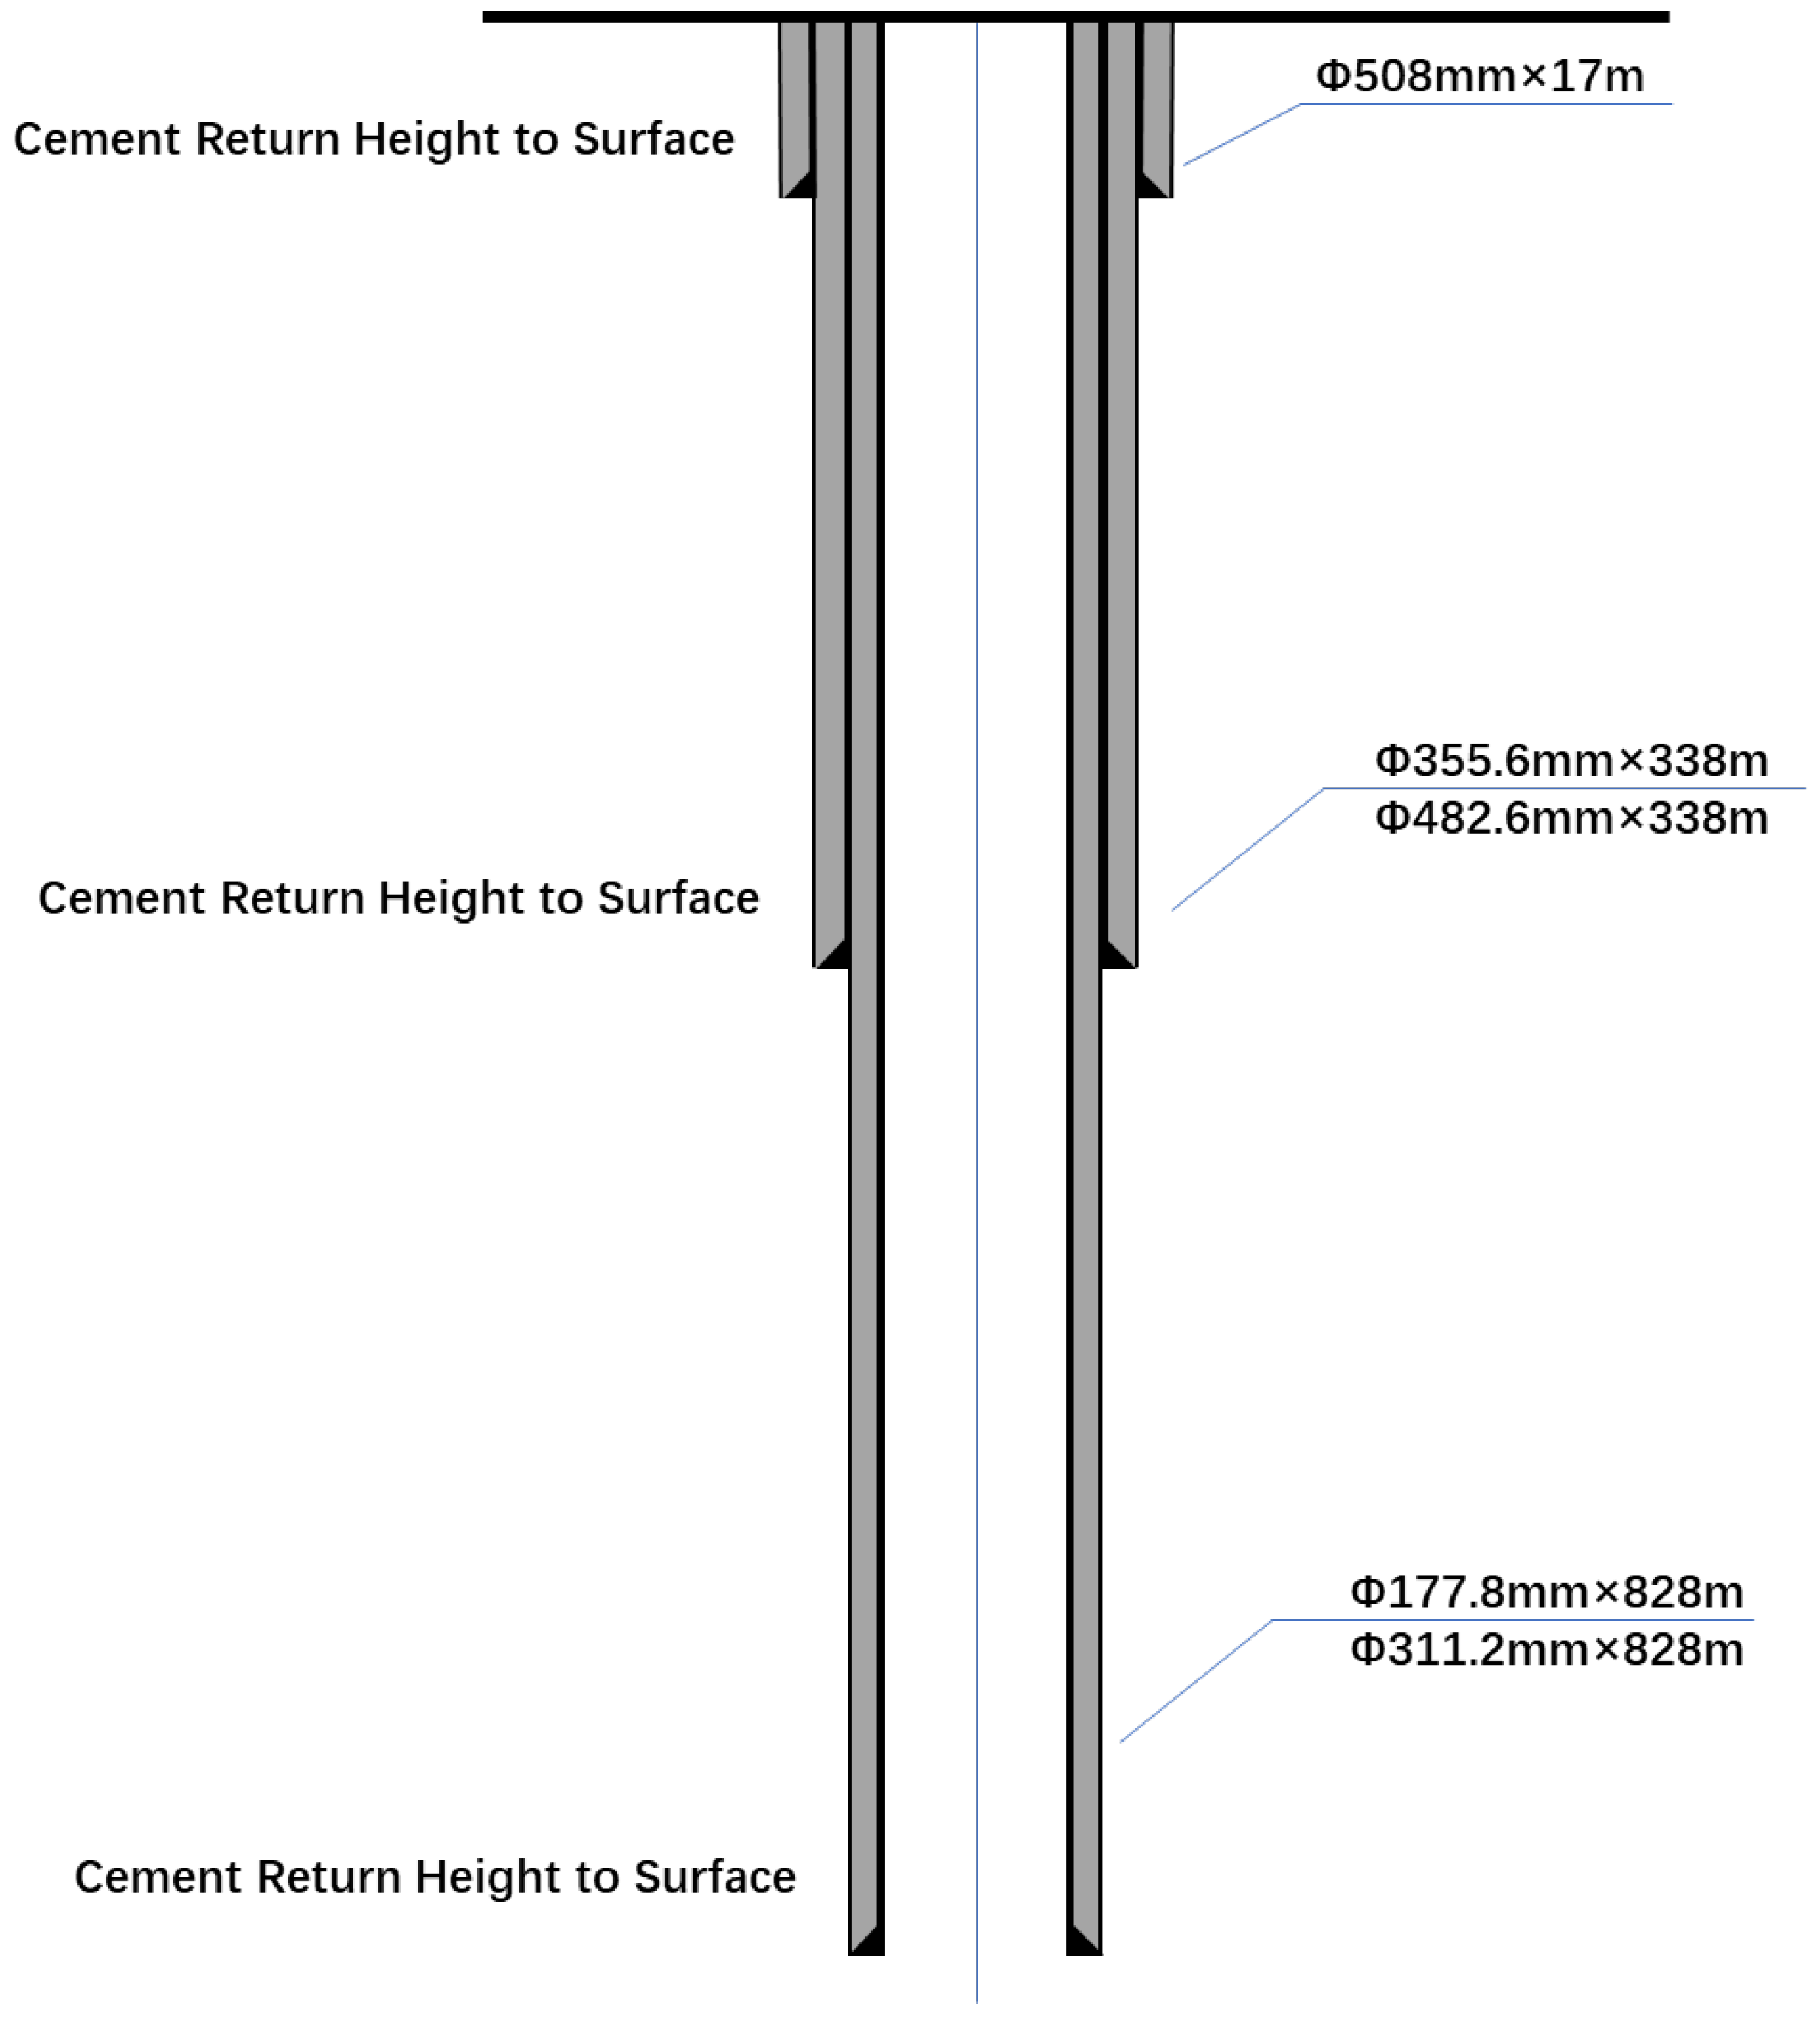
The Wallula project includes one injection well and two soil gas monitoring wells [116,117]. The wellbore structure diagram of the CO2 injection well is shown in Figure 18. To prevent sand blockage, gravel packing was adopted, and the gas lift method was used to protect the gravel layer [118]. During the injection period, the injection rate was maintained at 40 t/d. Within the first 24 h of injection, the downhole pressure increased by 2.1 MPa; after that, the increase in reservoir pressure tended to stabilize and subsequently rose steadily at a low rate of approximately 0.028 MPa/day [27].
Logging results indicate that the basalt and sedimentary rock in the injection interval are interbedded, featuring alternating porous interconnected zones and large internal flow units. In the section of the injection well below 700 m, there are at least 13 zones with porosity exceeding 15%. The local formations exhibit a high porosity and high permeability and have high mineral-trapping potential [27]. Multiple fluid-temperature-monitoring tests were conducted during the injection period, and it was observed that the rise in temperature at the top of the injection zone was the most significant, increasing by approximately 8 °C compared with the initial reservoir temperature—this indicates that most of the CO2 accumulated at the top of the reservoir [119].

5.3. Japan’s Nagaoka Project

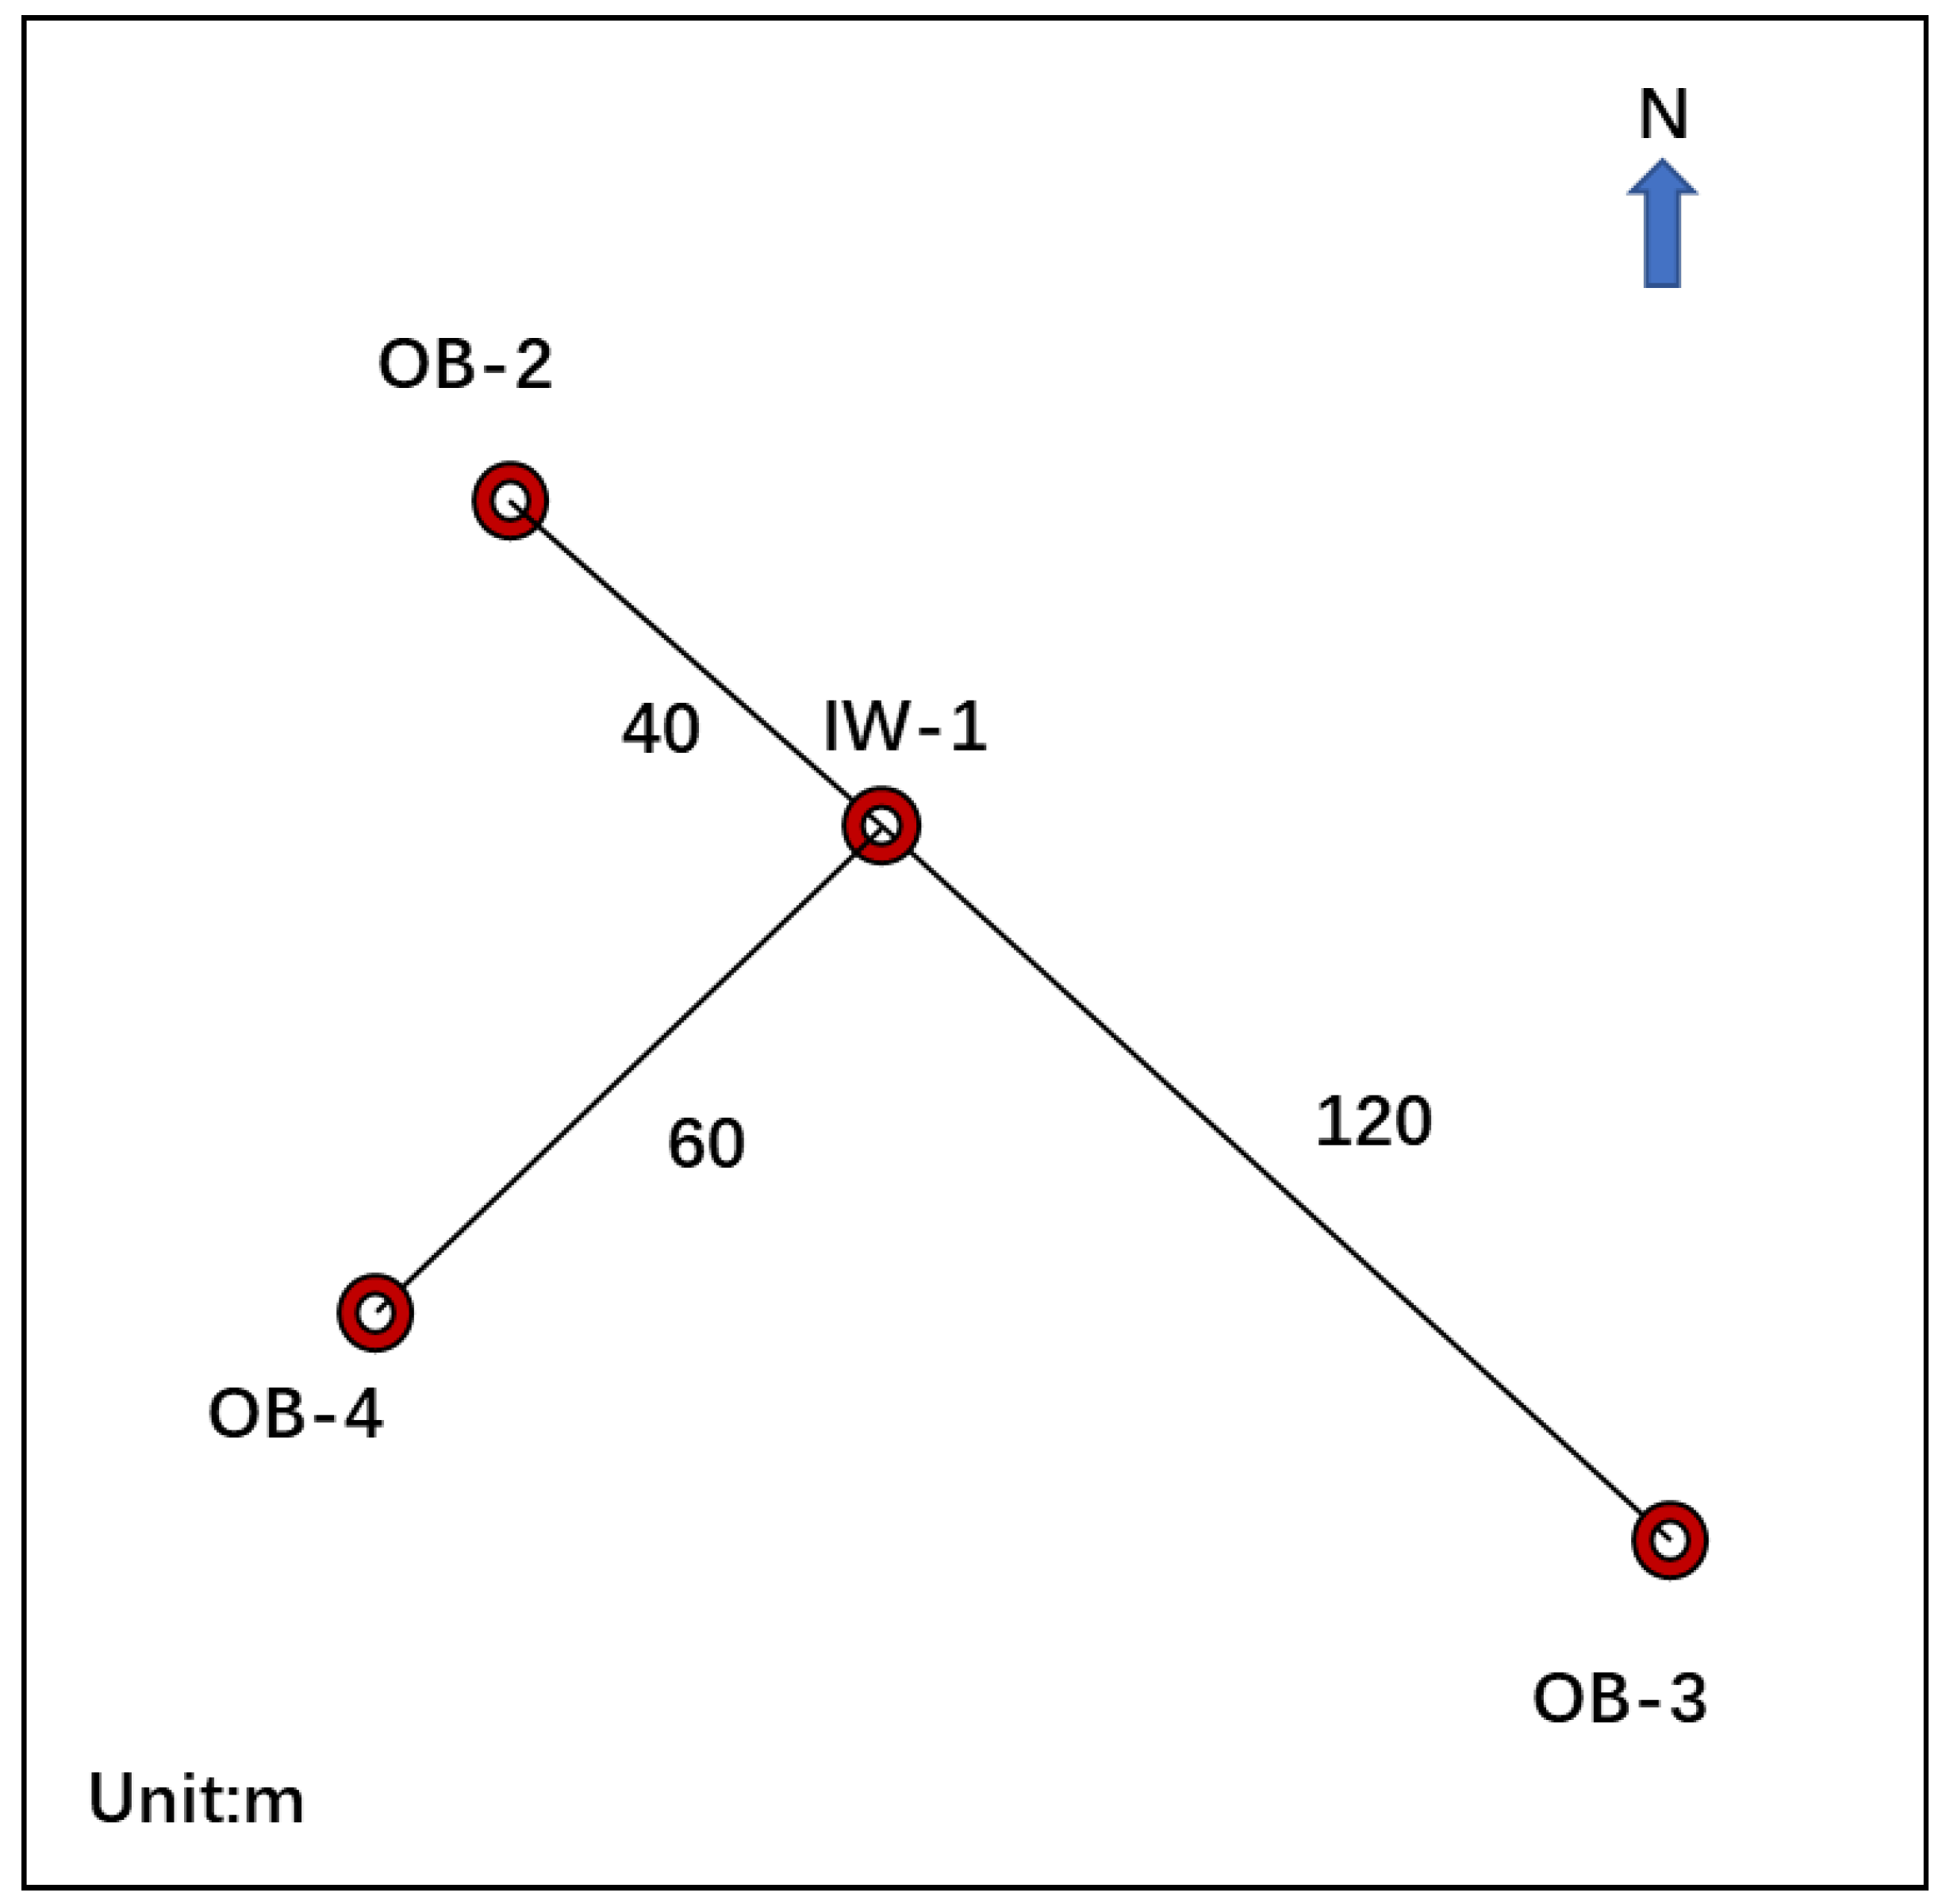
This project has one injection well (IW-1) and three observation wells (OB-2, OB-3, OB-4) [120], see Figure 19. From the perspective of the reservoir plane (Zone 2), Well OB-2 is located 40 m in the downdip direction of Injection Well IW-1, while Wells OB-3 and OB-4 are located 120 m and 60 m in the updip direction of IW-1, respectively [121]. The depths from the surface to the top of Zone 2 at Wells IW-1, OB-2, OB-3, and OB-4 are 1092 m, 1108 m, 1073 m, and 1084 m, respectively [107].
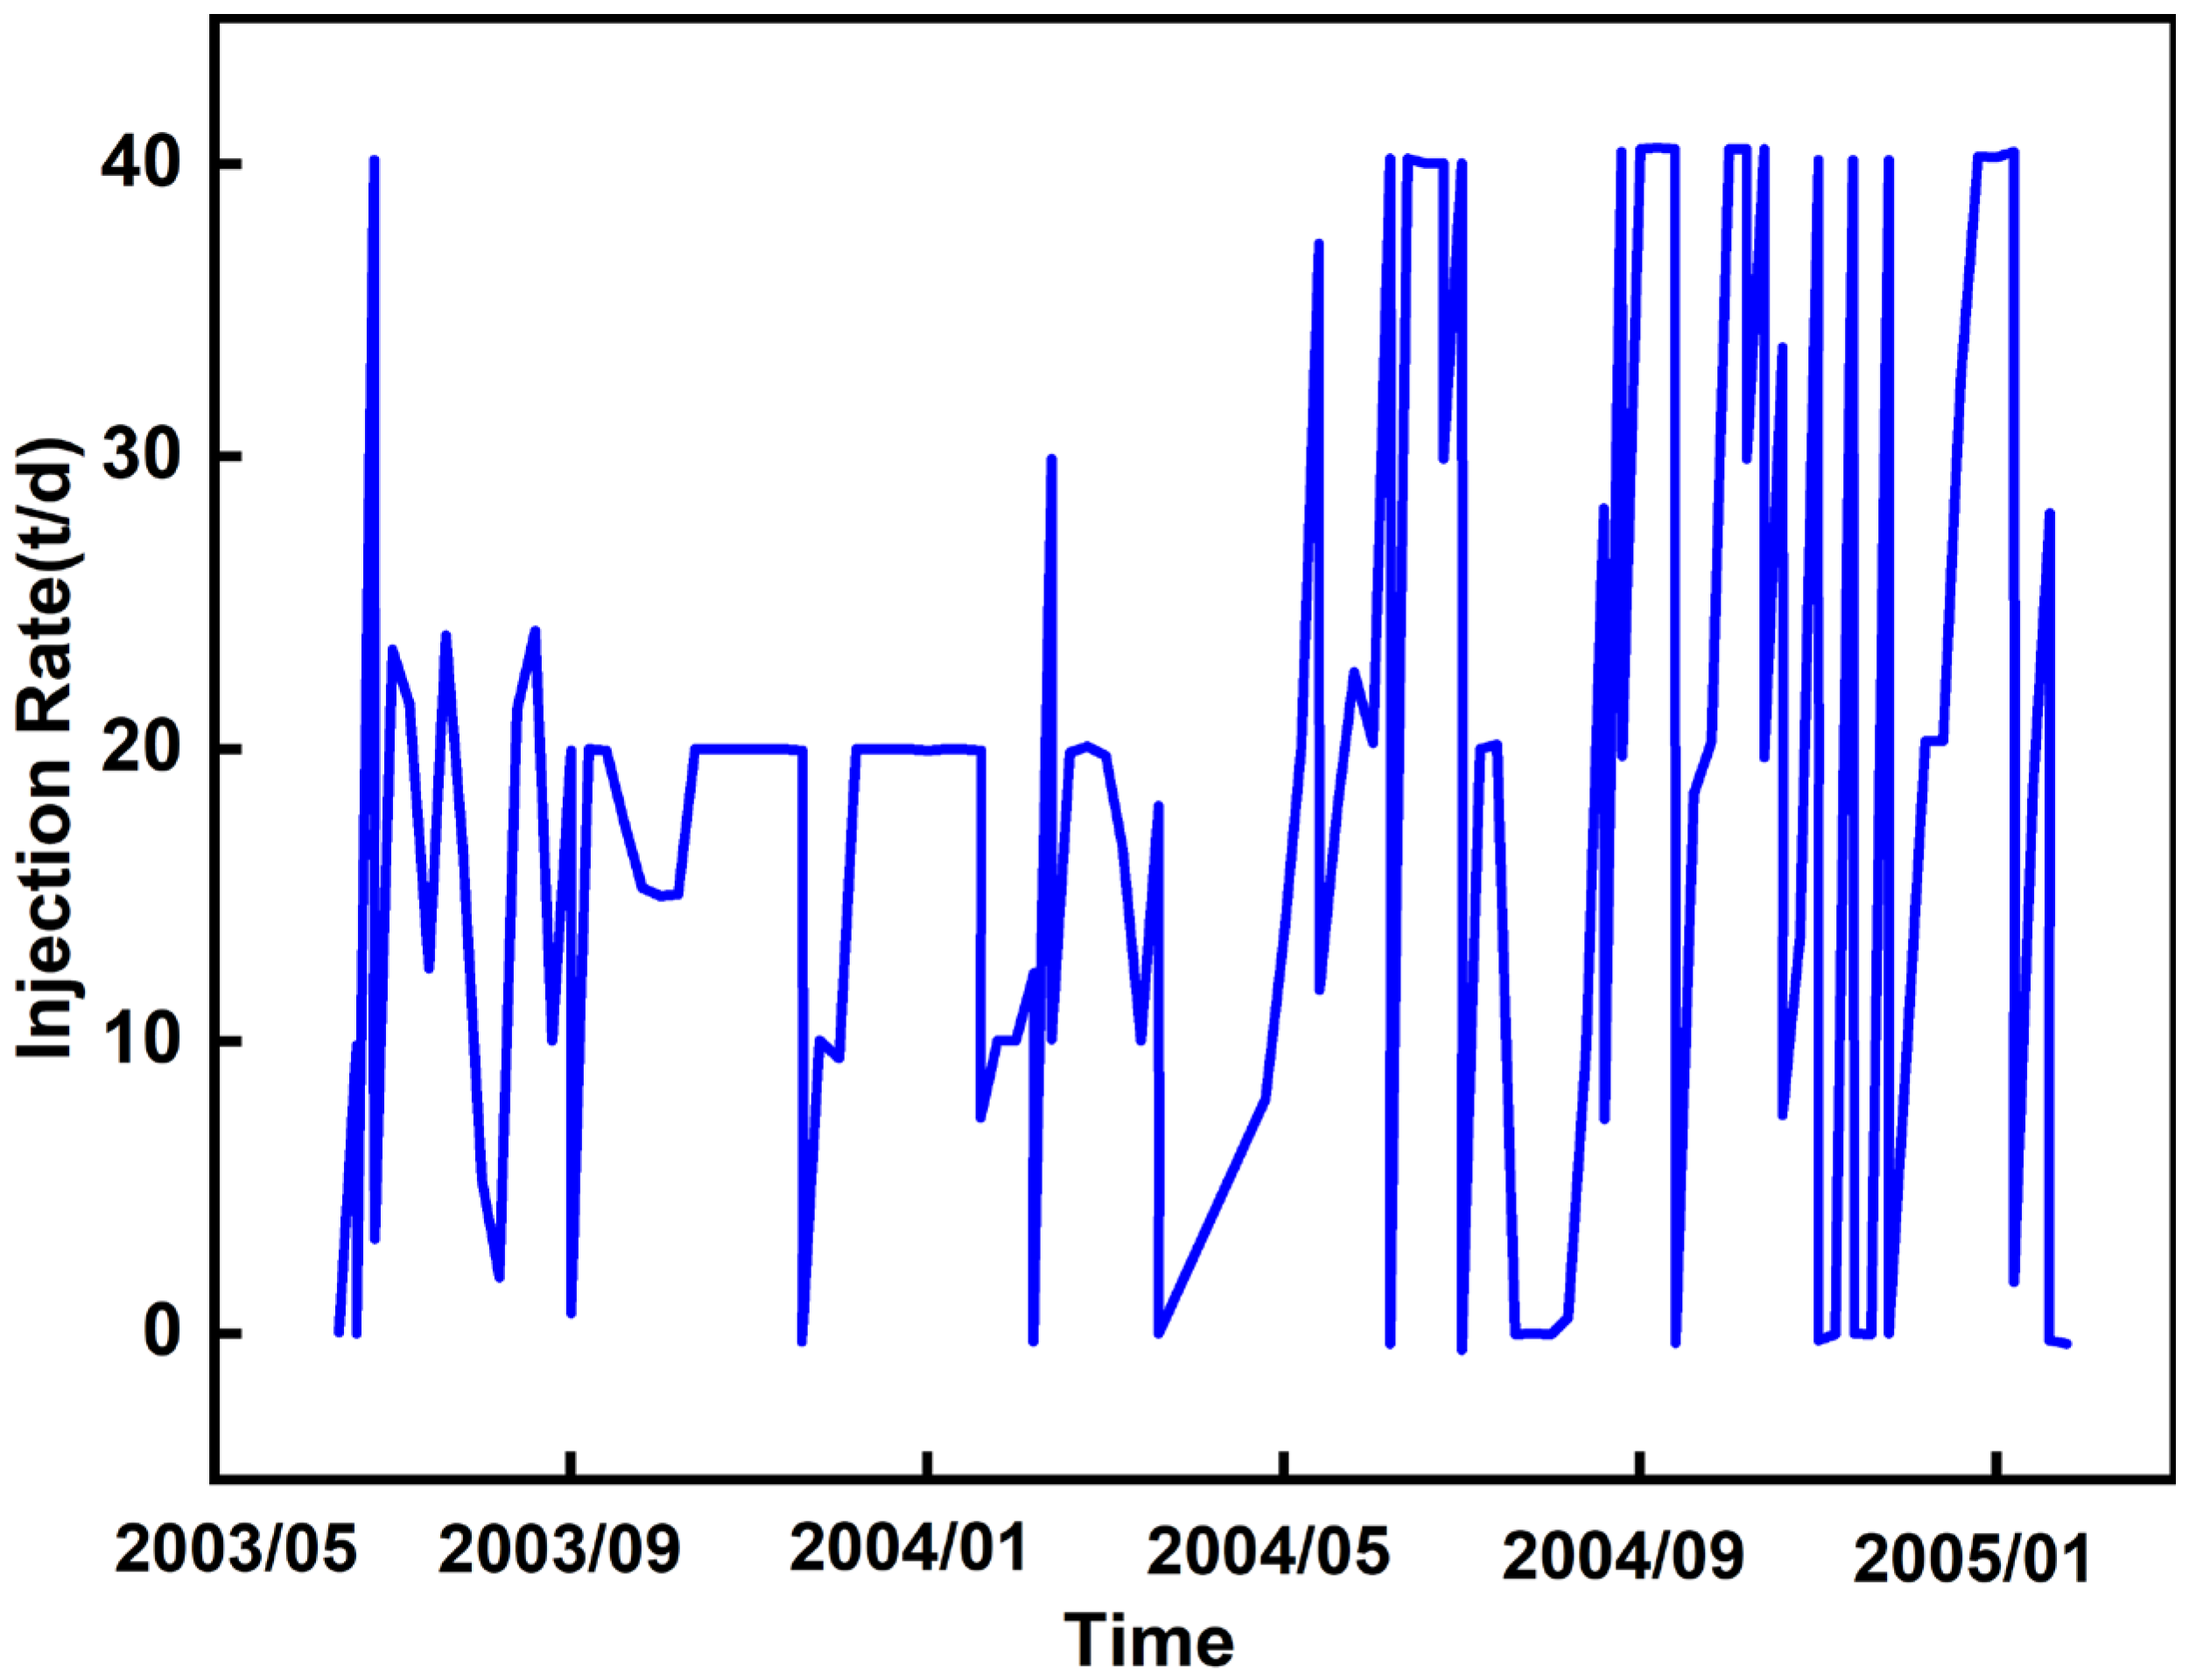
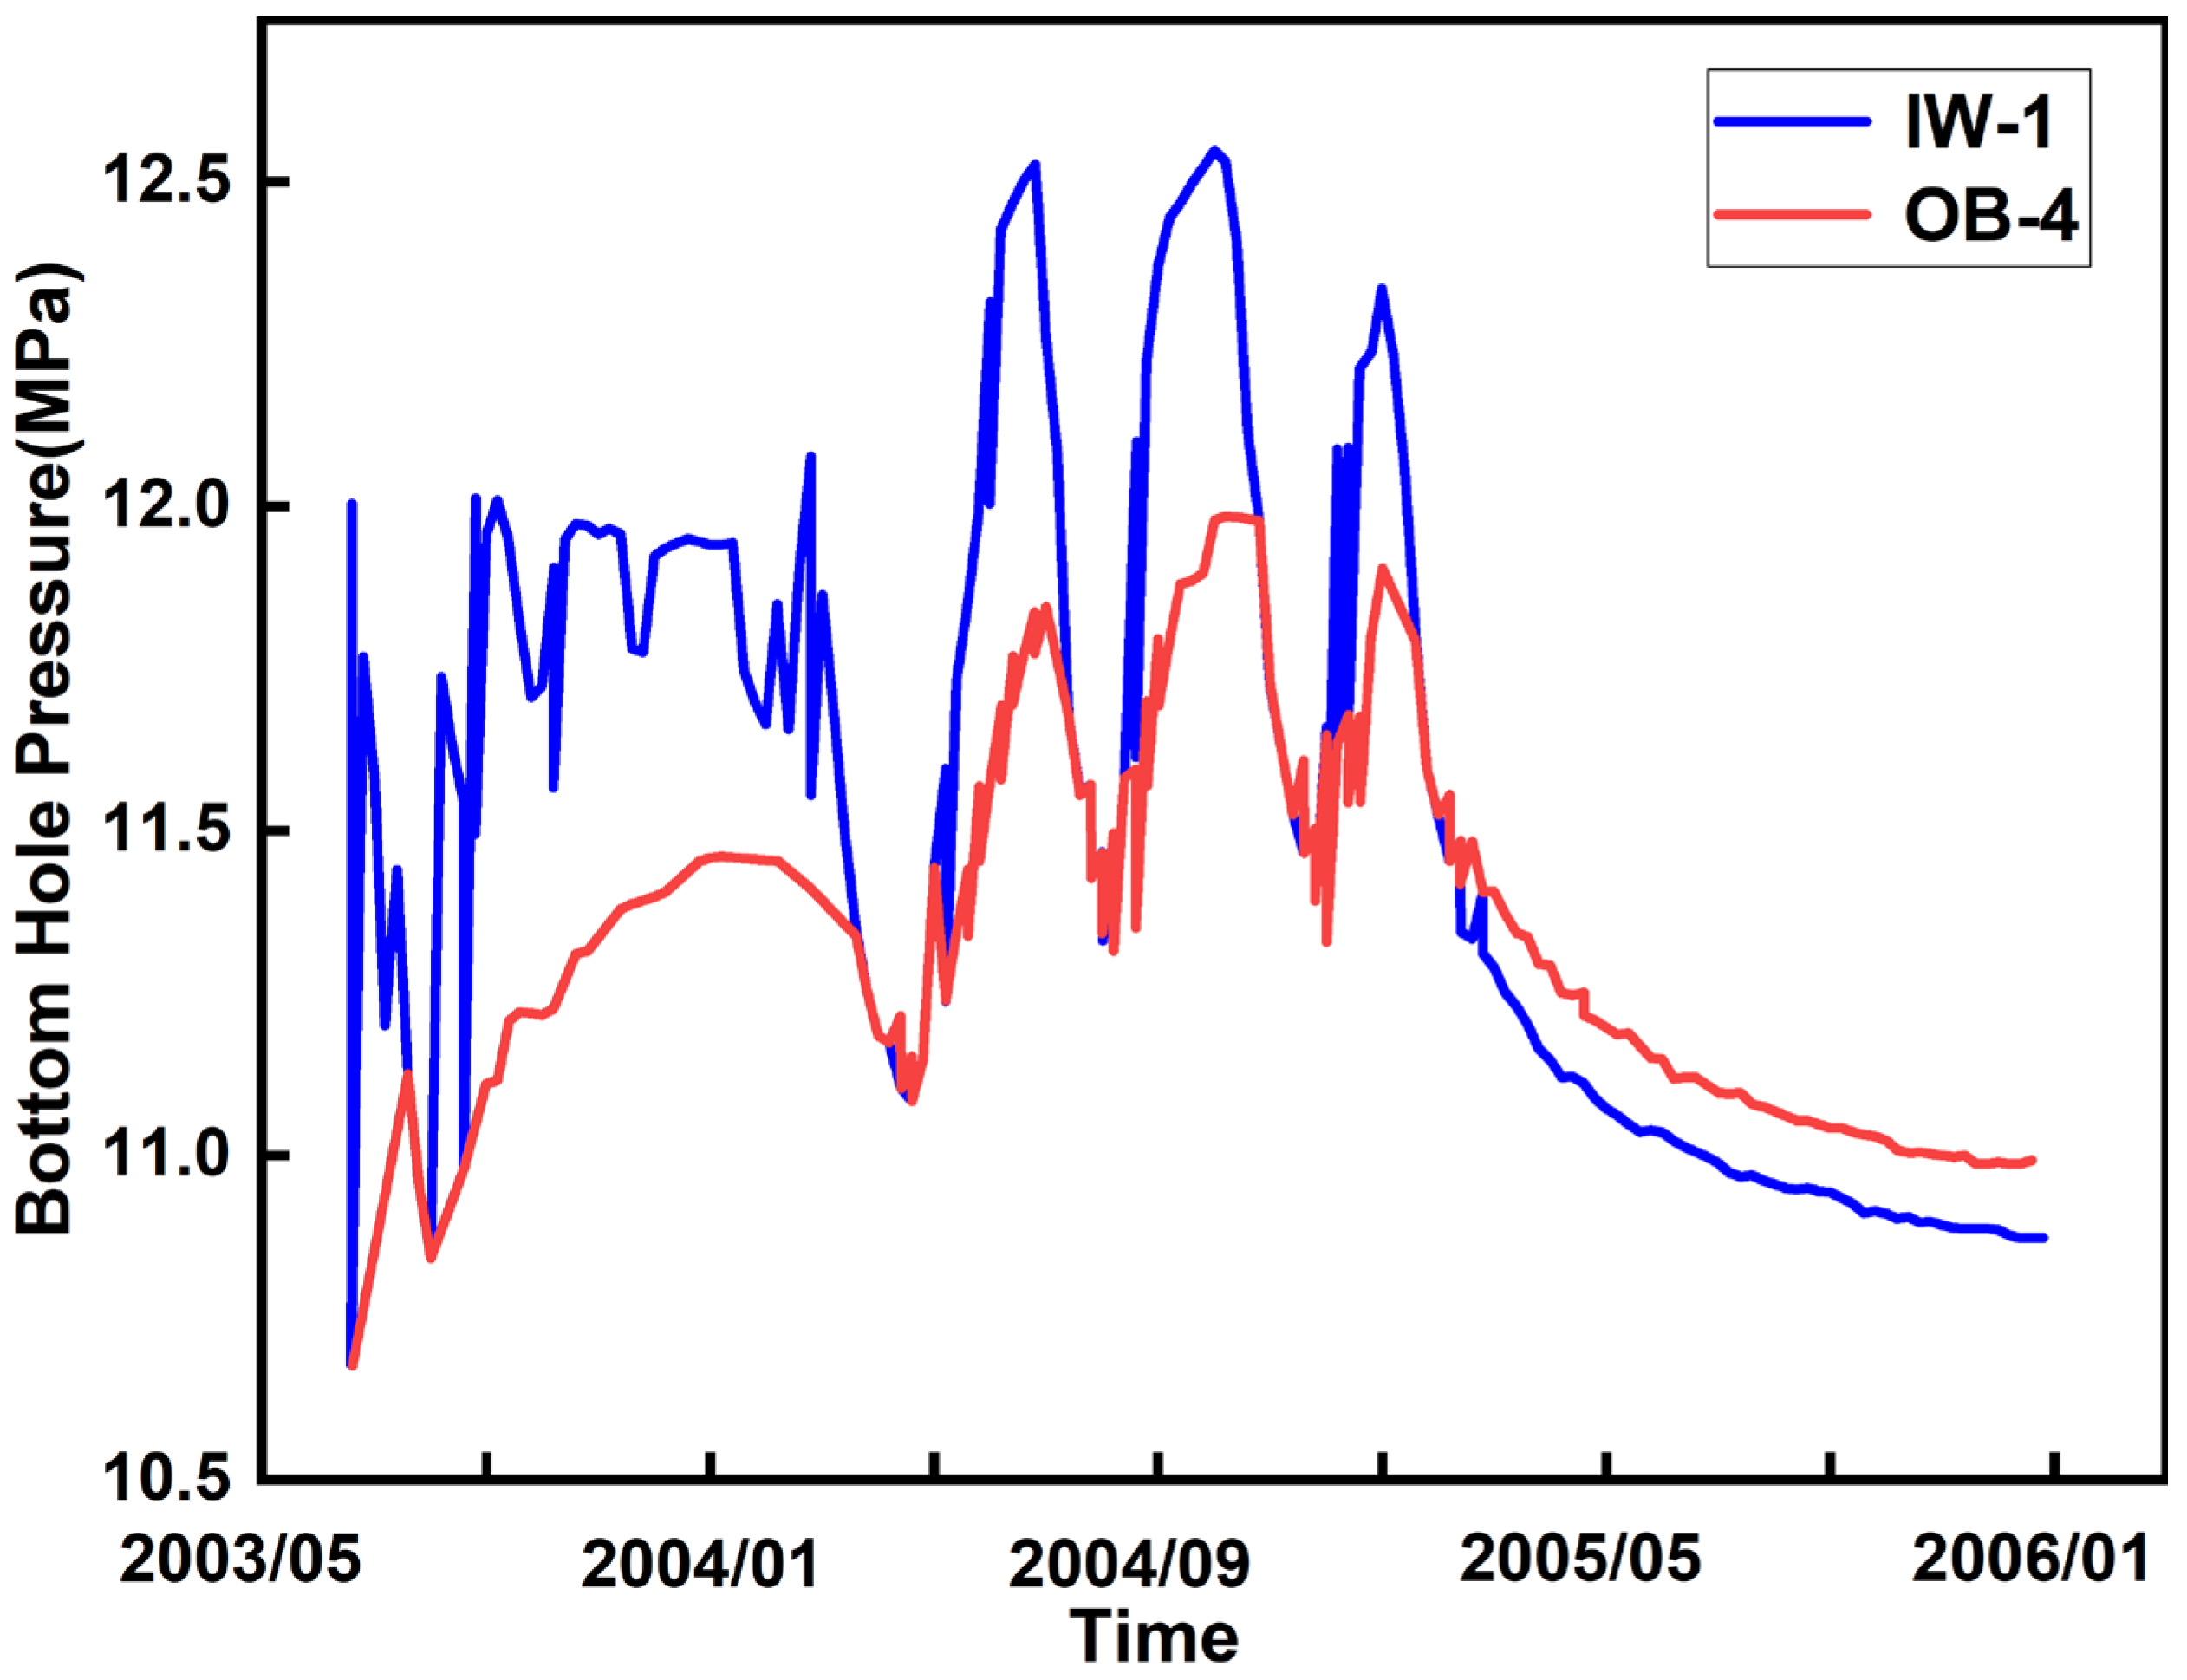
The injection rate was 20 t/d in the first nine months of the project and was later adjusted to 40 t/d after verifying the injectivity of CO2 (Figure 20) [122]. The wellhead temperature and pressure conditions were 32–36 °C and 6.6–7.4 MPa, respectively, while the bottomhole temperature and pressure were 45–49 °C and 11.9–12.6 MPa, respectively [123]. Before CO2 injection, the bottomhole pressure of Well IW-1 was 10.7 MPa, and that of Well OB-4 was 10.8 MPa. During the injection process, the pressure of the injection well (IW-1) was higher than that of Well OB-4. Shortly before injection was terminated, the pressure of Well IW-1 reached 12.4 MPa, and that of Well OB-4 was 11.9 MPa. Five days after injection ceased, the pressure of Well IW-1 dropped to 11.8 MPa, which was equal to the pressure of Well OB-4. Over the subsequent year, the pressure dropped sharply by approximately 1 MPa and then gradually stabilized [121], see Figure 21 for details.

5.4. Summary of Basalt Storage Projects

The injection rate of CarbFix ranges from 0.864 to 6.05 t/d, that of Wallula stabilizes at 40 t/d, and that of Nagaoka increases from 20 t/d to 40 t/d. The fundamental reason for the differences in injection rates lies in the choice of injection methods: CarbFix adopts the CO2 dissolved in water injection mode, which is restricted by the dissolution rate, so the rate remains at a low level; both Wallula and Nagaoka use direct CO2 injection, and their reservoirs are thicker, possessing larger fluid flow space, thus maintaining stable and relatively high rates.
Key experiences for basalt CO2 storage: In terms of geological selection, priority should be given to basalt formations rich in Ca2+ and Mg2+, while paying attention to reservoir porosity and interflow zone distribution—these are the foundations for mineralization reactions and storage capacity. In engineering design, if CO2 dissolved in water injection is adopted, mineralization efficiency and equipment wear risk must be considered; if direct injection is used, high-pressure resistant wellbore materials and a multi-monitoring well monitoring system are required. The injection rate needs dynamic adaptation to the reservoir: an excessively high rate is prone to causing sudden pressure surges, while an excessively low rate affects the storage scale.
A comprehensive comparison of the design characteristics of engineering parameters in CCS projects worldwide, as shown in Table 2, reveals that wellbores are the weakest link in long-term CO2 sequestration. An appropriate well layout, wellbore design, and rational injection design are crucial for efficient and safe sequestration.

6. Challenges and Measures for the Engineering and Technological Development of CCS Projects

6.1. Challenges in the Engineering and Technological Development of CCS Projects

(1) Wellsite layout ignores geological structures and seismic hazards
The reasonable layout of injection wells and monitoring wells can realize CO2 plume migration control, formation pressure field balance, and multi-angle risk monitoring, maximize the CO2 diffusion range and monitoring effect, and ensure the safety of long-term storage. If sufficient geological structure risk assessment is not carried out and the distribution characteristics of faults and fracture zones are ignored, the reservoir sealing capacity will be damaged [124], and the injected CO2 is prone to leak along these natural channels, triggering a series of problems such as earthquakes, formation water pollution, and soil acidification. Ignoring the analysis of formation stress changes during CO2 injection may cause formation deformation, which not only threatens the safe operation of the storage project but also may arouse concerns of surrounding residents about geological stability, leading to social public opinion risks. In severe cases, it may even have adverse impacts on surface ecology and construction facilities [125].
(2) Risk of wellbore integrity failure induced by wellbore corrosion and cement sheath aging
In CO2 injection wells, carbonic acid formed by CO2 and formation water will corrode the casing and cement sheath [126]. For example, the SACROC project suffered wellbore damage due to this corrosion mechanism. Casing corrosion may not only threaten wellbore integrity but also cause CO2 storage failure and environmental risks. Traditional cement sheaths are prone to carbonation reactions under long-term CO2 action, with their structure gradually damaged and the ability to seal the wellbore lost [127], providing channels for CO2 to channel along the wellbore. High-strength casing materials, if used in CO2 environments containing impurities such as H2S and chlorides, will also corrode and crack, damaging the structural strength of the wellbore and seriously threatening the safety of the entire storage system.
(3) Storage safety issues caused by reservoir pressure loss control and thermodynamic phase transition
During injection operations, uncontrolled reservoir pressure and overpressure will trigger formation fractures and even activate faults. For example, the In Salah project damaged caprock integrity due to this problem, leading to a sharp increase in CO2 leakage risk and potential geological hazards such as earthquakes. When CO2 undergoes phase transition from subcritical to supercritical state, it will cause drastic fluctuations in wellbore pressure and temperature, damaging injection stability and affecting storage efficiency [128].
(4) Safety challenges such as pressure management failure and salt precipitation faced during CCS project operation
During the operation of CCS projects, pressure management failure stems from deviations in pre-evaluation of reservoir connectivity, fault sealing capacity, and fracture pressure, resulting in ineffective CO2 diffusion and pore pressure accumulation. If the pressure reaches the caprock’s pressure-bearing capacity limit or the reservoir’s fracture pressure, it may activate microfractures and faults, damage sealing capacity, and change the effective stress and pore structure of the reservoir [129]. Salt precipitation occurs because CO2 injection changes the evaporation balance of formation water or causes salinity redistribution, leading to crystallization and precipitation of salt minerals in pore throats and near-wellbore areas. This weakens CO2 migration capacity, increases injection energy consumption, intensifies the difficulty of pressure management, and even induces the risk of wellbore integrity failure [130].

6.2. Engineering and Technological Response Measures for CCS Projects

(1) Risk Prevention and Control Strategy for Scientific Wellsite Site Selection and Facility Reuse
In wellsite selection, priority should be given to reservoirs with stable geological structures, strong sealing capacity, and few or no developed faults. For existing oil and gas field infrastructure, such as abandoned wellbores, integrated utilization can reduce development costs. However, it is necessary to strictly evaluate their well history and completion quality, conduct comprehensive inspections on wellbore corrosion and cement sheath integrity, ensure that old wellbores will not become potential channels for CO2 leakage, and guarantee the long-term safety of storage projects.
(2) Wellbore Integrity Assurance System through Material Upgrading, Design Optimization, and Real-Time Monitoring
To ensure wellbore integrity, casing should adopt corrosion-resistant alloys such as 13Cr stainless steel [131] and duplex stainless steel, or coated casing to resist CO2 corrosion. Meanwhile, corrosion-resistant cement, such as Portland cement or aluminophosphate cement, should be used to enhance the stability of the cement sheath in CO2 environments. It is recommended to deploy multi-angle and all-round real-time monitoring methods such as downhole pressure/temperature sensors and fiber optic logging technology [132] to dynamically track corrosion degree and micro-leakage, so as to timely detect and address wellbore integrity issues.
(3) Injection Optimization Strategy for Dynamic Pressure Control, Thermodynamic Behavior Prediction, and Impurity Gas Purification
Determine the reservoir’s safe pressure window through stepwise injection testing to achieve dynamic control of injection pressure and avoid formation damage. Couple the wellbore-reservoir numerical model to accurately predict CO2 phase transition behavior for optimizing injection parameters and maintaining thermodynamic stability during injection. Remove impurity gases such as H2S to ensure the long-term reliable operation of the injection system.
(4) Engineering Prevention and Control Strategy for Sudden Pressure Surges and Salt Precipitation
There are various engineering pressure management strategies for sudden pressure surges: control the injection rate to avoid excessive pressure gradients around the wellbore and reduce the risk of pressure breakthrough; adopt intermittent injection to reduce pressure accumulation near the wellbore [133]. For salt precipitation, fresh water or methyl ethylene glycol (MEG) flushing before injection can dissolve salt precipitation near the injection well and alleviate injection obstruction. Another method is to dissolve CO2 in water before injection, which can directly avoid brine evaporation and thus prevent salt precipitation [134].

7. Conclusions and Prospects

7.1. Conclusions

Through systematic investigation of the engineering practices of typical global CO2 geological storage projects, this paper reveals the in-depth coupling relationship between reservoir geological characteristics, engineering parameter design, and storage safety and efficiency, which can be summarized into three aspects:
First, storage type determines the basic adaptation logic of engineering parameters: Saline aquifer projects such as Sleipner rely on supercritical temperature and pressure conditions with a burial depth of more than 800 m, combined with corrosion-resistant wellbores, stable injection rates and pressures, to achieve long-term safe storage. Due to the demand for mineralization reactions, basalt storage projects present differentiated paths: low-rate injection of dissolved CO2 and high-rate direct CO2 injection. Depleted oil and gas reservoir projects leverage the advantages of existing well networks and need to adopt water-alternating-gas (WAG) injection plus old wellbore repair to address reservoir heterogeneity (permeability differences of Weyburn carbonate rocks) and wellbore integrity risks.
Second, engineering design must formulate schemes targeting reservoir characteristics: In terms of wellbore integrity, saline aquifers and depleted oil and gas reservoirs, which are in long-term contact with the CO2-formation water system, require the use of 13Cr stainless steel or duplex steel casings plus carbonation-resistant cement. In terms of injection management, saline aquifers need to determine the pressure window through stepwise testing; basalt projects need to consider the relationship between injection methods and mineralization efficiency; depleted oil and gas reservoir projects need to evaluate the quality of old well plugging to ensure that CO2 does not leak along the wellbore.
Third, engineering parameters need dynamic adjustment based on actual conditions: The injection rate is not simply the higher the better, but should be adjusted according to reservoir permeability and porosity; wellsite layout must balance monitoring coverage and cost; CO2 phase state control needs to be combined with burial depth, etc. These practices collectively indicate that the safety and efficiency of CO2 geological storage do not depend on the optimization of a single parameter, but on the systematic adaptation of reservoir, site, wellbore, and injection.

7.2. Prospects

In recent years, China has made remarkable progress in research on the mechanism of CO2 geological sequestration and project application. However, it is necessary to further strengthen research on the coupling mechanism between reservoir characteristics and engineering parameters during CO2 injection, especially considering the long-term impact of CO2 injection parameters on the reservoir’s physical properties during the sequestration process. Efforts should focus on leakage monitoring and risk management and control during CO2 injection, and on this basis, design schemes and monitoring strategies should be further optimized. In the future, efforts should be focused on the following aspects of research:
(1) Laboratory core experiments, multi-coupled THMC numerical simulations under reservoir conditions, and inversion of on-site monitoring data should be adopted to clarify the dynamic response laws between a reservoir’s physical and chemical properties, alongside engineering parameters such as the injection pressure and rate under different geological conditions. Methods for designing wellsite, wellbore, and injection parameters under the constraints of long-term sequestration safety should be designed to provide a scientific basis for the differentiated design of engineering parameters for geological sequestration wells.
(2) Research on control methods for wellhead injection parameters during the geological sequestration process and on recovery schemes after a decline in formation injectivity should be expanded so as to ensure the continuous, efficient, and stable CO2 injection.
(3) Multi-dimensional monitoring technologies should be incorporated, a risk management and control system covering the entire life cycle of injection, sequestration, and post-maintenance should be established, and full-process safety assurance should be provided for project application.

Author Contributions

H.L. conducted the literature review, analyzed the engineering-related content of the sequestration project, and created visualizations. W.L. conceptualized the overall framework and coordinated supervision and validation activities. J.L. performed data verification and contributed to manuscript review and editing. Y.W. validated the case data and provided critical resources. All authors have read and agreed to the published version of the manuscript.

Funding

This research was funded by the Key R&D Program of Xinjiang Uygur Autonomous Region (Grant No.: 2024B01012, 2024B01012-2), the PetroChina Science and Technology Innovation Fund Project (Grant No.: 2022DQ02-0605), and the “Case-by-Case” Strategic Talent Introduction Project of Xinjiang Uygur Autonomous Region (Grant No.: XQZX20240054).

Institutional Review Board Statement

Not applicable.

Informed Consent Statement

Not applicable.

Data Availability Statement

No new data were created or analyzed in this study. Data sharing is not applicable to this article.

Conflicts of Interest

Author Yanxian Wu is employed by Oil Extraction Technology Research Institute of Xinjiang Oilfield Company. The remaining authors declare that the research was conducted in the absence of any commercial or financial relationships that could be construed as a potential conflict of interest.

References

  1. Zang, Y.Q.; Gao, Z.J.; Zhong, W. Overview of Research and Application of CO2 Geological Sequestration at Home and Abroad. J. Environ. Eng. Technol. 2012, 2, 503–507. [Google Scholar]
  2. Luo, D.; Chen, J.W.; Yuan, Y.; Li, Q.; Liang, J.; Zhao, H. Progress of Norway’s Northern Lights project and its implications for offshore CO2 geological storage of China. Mar. Geol. Front. 2025, 41, 48–55. [Google Scholar]
  3. Bi, F.Q.; Li, F.; Liang, H. Domestic and Foreign Research and Application Progress on CO2-EOR Technology. Value Eng. 2011, 30, 206–207. [Google Scholar]
  4. Zheng, C.Y.; Cai, Y.N.; Lei, H.W.; Feng, G.H. Simulation of Two-Phase Reactive Flow Characteristics of Natural CO2 Leakage Along Wellbore. Saf. Environ. Eng. 2024, 31, 196–204. [Google Scholar]
  5. Li, X.G.; Li, K.Y.; Yang, Z.Z.; Zhu, J.G.; Yuan, J.F.; Yi, L.G. Dynamic characteristics of chemical reactions between supercritical CO2 and clay minerals. Fault-Block Oil Gas Fld. 2025, 32, 331–338. [Google Scholar]
  6. Peng, H.; Yang, J.; Peng, J.; Han, H.; Gou, X.; Jia, Y.; Li, Y.; Kadet, V. Influence of Supercritical CO2 on the Physical Property of Tight Sandstone. Petroleum 2024, 10, 520–526. [Google Scholar] [CrossRef]
  7. Fan, X.; Li, L.; Gao, X.; Chen, Z.-H. The analysis of COP28 Global Stocktake outcome and global climate governance prospects. Adv. Clim. Change Res. 2024, 20, 253–260. [Google Scholar]
  8. Michael, K.; Golab, A.; Shulakova, V.; Ennis-King, J.; Allinson, G.; Sharma, S.; Aiken, T. Geological Storage of CO2 in Saline Aquifers—A Review of the Experience from Existing Storage Operations. Int. J. Greenh. Gas Control 2010, 4, 659–667. [Google Scholar] [CrossRef]
  9. Furre, A.-K.; Eiken, O.; Alnes, H.; Vevatne, J.N.; Kiær, A.F. 20 Years of Monitoring CO2-Injection at Sleipner. Energy Procedia 2017, 114, 3916–3926. [Google Scholar] [CrossRef]
  10. Eiken, O.; Ringrose, P.; Hermanrud, C.; Nazarian, B.; Torp, T.A.; Høier, L. Lessons Learned from 14 Years of CCS Operations: Sleipner, In Salah and Snøhvit. Energy Procedia 2011, 4, 5541–5548. [Google Scholar] [CrossRef]
  11. Estublier, A.; Lackner, A.S. Long-Term Simulation of the Snøhvit CO2 Storage. Energy Procedia 2009, 1, 3221–3228. [Google Scholar] [CrossRef]
  12. Buscheck, T.A.; White, J.A.; Carroll, S.A.; Bielicki, J.M.; Aines, R.D. Managing Geologic CO2 Storage with Pre-Injection Brine Production: A Strategy Evaluated with a Model of CO2 Injection at Snøhvit. Energy Environ. Sci. 2016, 9, 1504–1512. [Google Scholar] [CrossRef]
  13. Aradóttir, E.S.; Sigurdardóttir, H.; Sigfússon, B.; Gunnlaugsson, E. CarbFix: A CCS Pilot Project Imitating and Accelerating Natural CO2 Sequestration. Greenh. Gases Sci. Technol. 2011, 1, 105–118. [Google Scholar] [CrossRef]
  14. Li, W.L.; Xu, J.J.; Jia, L.X.; Ma, B. Chen, J. Research progress on key technologies of CO2 storage in basalts. Hydrogeol. Eng. Geol. 2022, 49, 164–173. [Google Scholar]
  15. Ye, H.; Liu, Q.; Bao, Q.; Wang, Z.; Xie, Y.; Michelle, T.; Zhao, W.; Xian, C. Review on In-Situ CO2 Mineralization Sequestration: Mechanistic Understanding and Research Frontiers. Int. J. Coal Sci. Technol. 2025, 12, 15. [Google Scholar] [CrossRef]
  16. Matter, M.J.; Stute, M.; Snæbjörnsdottir, Ó.S.; Oelkers, H.E.; Gislason, R.S.; Aradottir, S.E.; Sigfusson, B.; Gunnarsson, I.; Sigurdardottir, H.; Gunnlaugsson, E.; et al. Rapid Carbon Mineralization for Permanent Disposal of Anthropogenic Carbon Dioxide Emissions. Science 2016, 352, 1312–1314. [Google Scholar] [CrossRef]
  17. Martens, S.; Kempka, T.; Liebscher, A.; Luth, S.; Moller, F.; Myrttinen, A.; Norden, B.; Schmidthattenberger, C.; Zimmer, M.; Kuhn, M. Europe’s Longest-Operating On-Shore CO2 Storage Site at Ketzin, Germany: A Progress Report After Three Years of Injection. Environ. Earth Sci. 2012, 67, 323–334. [Google Scholar] [CrossRef]
  18. Bergmann, P.; Kashubin, A.; Ivandic, M.; Lüth, S.; Juhlin, C. Time-lapse difference static correction using prestack crosscorrelations: 4D seismic image enhancement case from Ketzin. Geophysics 2014, 79(6), B243–B252. [Google Scholar] [CrossRef]
  19. Zheng, Y.-K.; Wang, C.; Liang, H.-H.; Wang, Y.-B.; Zeng, R.-S. 3D Seismic Forward Modeling from the Multiphysical Inversion at the Ketzin CO2 Storage Site. Appl. Geophys. 2024, 21, 593–605. [Google Scholar] [CrossRef]
  20. Martens, S.; Liebscher, A.; Möller, F.; Würdemann, H.; Schilling, F.; Kühn, M.; Ketzin Group. Progress Report on the First European On-Shore CO2 Storage Site at Ketzin (Germany)—Second Year of Injection. Energy Procedia 2011, 4, 3246–3253. [Google Scholar] [CrossRef]
  21. Zhou, Y.B.; Wang, R.; Cheng, C.J.; Dai, Q.Q. Enlightenment of CO2 Geological Storage Demonstration Project in In Salah Oilfield, Algeria. J. Earth Sci. Environ. 2023, 45, 1368–1379. [Google Scholar]
  22. Rock, L.; McNaughton, C.; Black, A. Assessment of CO2 Levels Prior to Injection Across the Quest Sequestration Lease Area. In Proceedings of the International Conference on Greenhouse Gas Control Technologies, Lausanne, Switzerland, 14–18 November 2016. [Google Scholar]
  23. Rock, L.; O’Brien, S.; Tessarolo, S.; Duer, J.; Bacci, V.O.; Hirst, B.; Randell, D.; Helmy, M.; Blackmore, J.; Duong, C.; et al. The Quest CCS Project: 1st Year Review Post Start of Injection. Energy Procedia 2017, 114, 5320–5328. [Google Scholar] [CrossRef]
  24. The Shell Quest Carbon Capture Project Reaches the Milestone of 5 Million Metric tonnes. Sino-Glob. Energy 2020, 25, 104.
  25. Couëslan, M.L.; Butsch, R.; Will, R.; Locke, R.A. Integrated Reservoir Monitoring at the Illinois Basin—Decatur Project. Energy Procedia 2014, 63, 2836–2847. [Google Scholar] [CrossRef]
  26. Streibel, M.; Finley, R.J.; Martens, S.; Greenberg, S.; Möller, F.; Liebscher, A. From Pilot to Demo Scale—Comparing Ketzin Results with the Illinois Basin-Decatur Project. Energy Procedia 2014, 63, 6323–6334. [Google Scholar] [CrossRef]
  27. McGrail, B.; Spane, F.; Amonette, J.; Thompson, C.; Brown, C. Injection and Monitoring at the Wallula Basalt Pilot Project. Energy Procedia 2014, 63, 2939–2948. [Google Scholar] [CrossRef]
  28. White, S.K.; Spane, F.A.; Schaef, H.T.; Miller, Q.R.S.; White, M.D.; Horner, J.A.; McGrail, B.P. Quantification of CO2 Mineralization at the Wallula Basalt Pilot Project. Environ. Sci. Technol. 2020, 54(22), 14609–14616. [Google Scholar] [CrossRef]
  29. Nunes, P.P.J.; Seabra, S.G.; Sousa, D.C.L. A Review of CO2-Injection Projects in the Brazilian Pre-Salt—Storage Capacity and Geomechanical Constraints. Int. J. Greenh. Gas Control 2024, 137, 104232. [Google Scholar] [CrossRef]
  30. Zhang, Y.; Jackson, C.; Krevor, S. An Estimate of the Amount of Geological CO2 Storage over the Period of 1996–2020. Environ. Sci. Technol. Lett. 2022, 9, 693–698. [Google Scholar] [CrossRef]
  31. Liu, H.J.; Were, P.; Li, Q.; Gou, Y.; Hou, Z. Worldwide Status of CCUS Technologies and Their Development and Challenges in China. Geofluids 2017, 2017, 6126505. [Google Scholar] [CrossRef]
  32. Li, Q.; Zhao, N.; Liu, L.C.; Xu, L.F. Environmental Risk Assessment Method for Geologic Carbon Dioxide Storage: Case Study of Australian Gorgon Project. Environ. Eng. 2019, 37, 22–26. [Google Scholar]
  33. Weijermars, R. Concurrent Challenges in Practical Operations and Modeling of Geological Carbon Dioxide Sequestration: Review of the Gorgon Project and FluidFlower Benchmark Study. Energy Strategy Rev. 2024, 56, 101586. [Google Scholar] [CrossRef]
  34. Wang, H.M.; Sun, D.W. Actively Exploring the Construction of Coal-Based Low-Carbon Energy Systems by Shenhua Group—Taking the Lead in Implementing the High-Concentration CO2 Capture and Sequestration Demonstration Project. Chin. Pet. Chem. Ind. 2010, 11, 22–24. [Google Scholar]
  35. Nguyen, M.C.; Zhang, Y.; Li, J.; Li, X.; Bai, B.; Wu, H.; Wei, N.; Stauffer, P.H. A Geostatistical Study in Support of CO2 Storage in Deep Saline Aquifers of the Shenhua CCS Project, Ordos Basin, China. Energy Procedia 2017, 114, 5826–5835. [Google Scholar] [CrossRef]
  36. Li, X.; Li, Q.; Bai, B.; Wei, N.; Yuan, W. The geomechanics of Shenhua carbon dioxide capture and storage (CCS) demonstration project in Ordos Basin, China. J. Rock Mech. Geotech. Eng. 2016, 8, 948–966. [Google Scholar] [CrossRef]
  37. Xie, J.; Zhang, K.N.; Hu, L.T. Numerical investigation of geological CO2 storage with multiple injection wells for the Shenhua Ordos CCS project. J. Beijing Norm. Univ. (Nat. Sci. Ed.) 2015, 51, 636–642. [Google Scholar]
  38. Yi, H.L.; Guo, X.; Jia, J.Y.; Hualei, Y.; Xin, G.; Jinyao, J. Research on CO2 re-injection and storage engineering scenario of EP15-1 oilfield development. Chin. Offshore Oil Gas 2023, 35, 163–169. [Google Scholar]
  39. Zhou, S.W.; Li, Q.P.; Zhu, J.L.; Zhou, Y.J.; Zhao, C.Z.; He, Y.F. Consideration on CO2 marine storage and exploration of new paths. Nat. Gas Ind. 2024, 44, 1–10. [Google Scholar]
  40. Yamamoto, H.; Nakajima, T.; Xue, Z. Quantitative interpretation of trapping mechanisms of CO2 at Nagaoka pilot project—A history matching study for 10-year post-injection. In Proceedings of the International Conference on Greenhouse Gas Control Technologies, Lausanne, Switzerland, 14–18 November 2016. [Google Scholar]
  41. Sawada, Y.; Tanaka, J.; Suzuki, C.; Tanase, D.; Tanaka, Y. Tomakomai CCS Demonstration Project of Japan, CO2 Injection in Progress. Energy Procedia 2018, 154, 3–8. [Google Scholar] [CrossRef]
  42. Tanaka, Y.; Sawada, Y.; Tanase, D.; Tanaka, J.; Shiomi, S.; Kasukawa, T. Tomakomai CCS Demonstration Project of Japan, CO2 Injection in Process. Energy Procedia 2017, 114, 5836–5846. [Google Scholar] [CrossRef]
  43. Ringrose, P.; Sæther, Ø. CO2 injection operations: Insights from Sleipner and Snøhvit. In Proceedings of the Carbon Capture Utilisation and Storage Conference—Virtual Event, Aberdeen, UK, 26 October 2020. [Google Scholar]
  44. Zhou, Y.B.; Wang, R.; He, Y.F.; Zhao, S.X.; Zhou, Y.L.; Zhang, Y. Analysis and comparison of typical cases of CO2 geological storage in saline aquifer. Pet. Geol. Recovery Effic. 2023, 30, 162–167. [Google Scholar]
  45. Liu, G.Y.; Zhi, S.J.; Liu, X.; Chai, C.; Wang, C.; Yu, X.R.; Hu, Q.H.; Rao, S.D. Research progress on internal corrosion of supercritical/dense-phase CO2 pipelines for CCUS. Oil Gas Storage Transp. 2024, 43, 510–523. [Google Scholar]
  46. Zheng, X.P. Offshore Capture and Reinjection Technology for Associated CO2 in Offshore Natural Gas Fields. In Proceedings of the 2007 Annual Conference on Ocean Engineering, Aberdeen, UK, 24–27 June 2007. [Google Scholar]
  47. Li, C.; Zhang, K.N.; Xu, Y.Q.; He, Q.C. Analysis of Impacts of Variation in Injection Rate on the Potential of Proposed Reservoir for CO2 Geological Sequestration. Shanghai Land Resour. 2011, 32, 24–27. [Google Scholar]
  48. Department of Economic and Social Affairs United Nations. Energy Statistics Yearbook 2014; United Nations Publication: New Your, NY, USA, 2017; pp. 18–27. [Google Scholar]
  49. Shi, J.-Q.; Imrie, C.; Sinayuc, C.; Durucan, S.; Korre, A.; Eiken, O. Snøhvit CO2 Storage Project: Assessment of CO2 Injection Performance Through History Matching of the Injection Well Pressure Over a 32-months Period. Energy Procedia 2013, 37, 3267–3274. [Google Scholar] [CrossRef]
  50. Hansen, O.; Gilding, D.; Nazarian, B.; Bård, O.; Ringrose, P.; Kristoffersen, J.-B.; Eiken, O.; Hansen, H. Snøhvit: The history of injecting and storing 1 Mt CO2 in the fluvial Tubåen Fm. Energy Procedia 2013, 37, 3565–3573. [Google Scholar] [CrossRef]
  51. Rahman, M.J. Compaction, Rock Properties Evaluation, Rock Physics Diagnostics, AVO Modeling and Seismic Inversion in the 3N/8WHT Field, SW Barents Sea. Master’s Thesis, University of Oslo, Oslo, Norway, 6 June 2012. [Google Scholar]
  52. Maldal, T.; Tappel, I. CO2 underground storage for Snøhvit gas field development. Energy 2004, 29, 1403–1411. [Google Scholar] [CrossRef]
  53. Ringrose, S.P. The CCS hub in Norway: Some insights from 22 years of saline aquifer storage. Energy Procedia 2018, 146, 166–172. [Google Scholar] [CrossRef]
  54. Bergmann, P.; Ivandic, M.; Norden, B.; Rücker, C.; Kiessling, D.; Lüth, S.; Schmidt-Hattenberger, C.; Juhlin, C. Combination of seismic reflection and constrained resistivity inversion with an application to 4D imaging of the CO2 storage site, Ketzin, Germany. Geophysics 2014, 79, B37–B50. [Google Scholar] [CrossRef]
  55. Zemke, K.; Liebscher, A.; Möller, F. Monitoring of well integrity by magnetic imaging defectoscopy (MID) at the Ketzin pilot site, Germany. In Proceedings of the EGU General Assembly Conference, Vienna, Austria, 23–28 April 2017. [Google Scholar]
  56. Carey, J.W.; Wigand, M.; Chipera, S.J.; WoldeGabriel, G.; Pawar, R.; Lichtner, P.C.; Wehner, S.C.; Raines, M.A.; Guthrie, G.D. Analysis and performance of oil well cement with 30 years of CO2 exposure from the SACROC Unit, West Texas, USA. Int. J. Greenh. Gas Control 2007, 1, 75–85. [Google Scholar] [CrossRef]
  57. Shone, B.E. Corrosion in the petrochemical industry. Br. Corros. J. 2013, 30, 190. [Google Scholar] [CrossRef]
  58. Gawel, K.; Todorovic, J.; Liebscher, A.; Wiese, B.; Opedal, N. Study of materials retrieved from a Ketzin CO2 monitoring well. In Proceedings of the International Conference on Greenhouse Gas Control Technologies, Lausanne, Switzerland, 14–18 November 2016. [Google Scholar]
  59. Martens, S.; Liebscher, A.; Möller, F.; Henninges, J.; Kempka, T.; Lüth, S.; Norden, B.; Prevedel, B.; Szizybalski, A.; Zimmer, M.; et al. CO2 Storage at the Ketzin Pilot Site, Germany: Fourth Year of Injection, Monitoring, Modelling and Verification. Energy Procedia 2013, 37, 6434–6443. [Google Scholar] [CrossRef]
  60. Bergmann, P.; Diersch, M.; Götz, J.; Ivandic, M.; Ivanova, A.; Juhlin, C.; Kummerow, J.; Liebscher, A.; Lüth, S.; Meekes, S.; et al. Review on geophysical monitoring of CO2 injection at Ketzin, Germany. J. Pet. Sci. Eng. 2016, 139, 112–136. [Google Scholar] [CrossRef]
  61. Eunseon, J.; Bernd, W.; Peter, P.; Fischer, S.; Schmind-Hattenberger, C. Geochemical modeling of CO2 injection and gypsum precipitation at the Ketzin CO2 storage site. Environ. Earth Sci. 2022, 81, 286. [Google Scholar] [CrossRef]
  62. Liebscher, A.; Möller, F.; Bannach, A.; Köhler, S.; Wiebach, J.; Schmidt-Hattenberger, C.; Weiner, M.; Pretschner, C.; Ebert, K.; Zemke, J. Injection operation and operational pressure–temperature monitoring at the CO2 storage pilot site Ketzin, Germany—Design, results, recommendations. Int. J. Greenh. Gas Control 2013, 15, 163–173. [Google Scholar] [CrossRef]
  63. Martens, S.; Möller, F.; Streibel, M.; Liebscher, A.; The Ketzin Group. Completion of Five Years of Safe CO2 Injection and Transition to the Post-closure Phase at the Ketzin Pilot Site. Energy Procedia 2014, 59, 190–197. [Google Scholar] [CrossRef]
  64. Nial, S.; Paul, B.; Adegbenro, O.; van Essen, G.; Guo, R.; Reynolds, M.A.; Friesen, L.; Cano, M.C.; O’Brien, S. Quest CCS facility: Halite damage and injectivity remediation in CO2 injection wells. Int. J. Greenh. Gas Control 2022, 119, 103718. [Google Scholar]
  65. Lee, S.-Y.; Swager, L.; Pekot, L.; Piercey, M.; Will, R.; Zaluski, W. Study of operational dynamic data in Aquistore project. Int. J. Greenh. Gas Control. 2018, 76, 62–77. [Google Scholar] [CrossRef]
  66. Shell Canada Limited. Quest Carbon Capture and Storage Project: Directive 65: Application for a CO2 Acid Gas Storage Scheme; Shell Canada Limited: Calgary, AB, Canada, 2010. [Google Scholar]
  67. Tawiah, P.; Duer, J.; Bryant, S.L.; Larter, S.; O’Brien, S.; Dong, M. CO2 injectivity behaviour under non-isothermal conditions—Field observations and assessments from the Quest CCS operation. Int. J. Greenh. Gas Control 2020, 92, 102843. [Google Scholar] [CrossRef]
  68. Shell Canada Limited. Quest Carbon Capture and Storage Project 2023 Annual Status Report; AER Approval Number: 11837C; Shell Canada Limited: Calgary, AL, Canada, 2024. [Google Scholar]
  69. Nordbotten, J.M.; Celia, M.A.; Bachu, S. Injection and Storage of CO2 in Deep Saline Aquifers: Analytical Solution for CO2 Plume Evolution During Injection. Transp. Porous Media 2005, 58, 339–360. [Google Scholar] [CrossRef]
  70. Peng, D.Y.; Robinson, D.B. New Two-Constant Equation of State. Ind. Eng. Chem. Fundam. 1976, 15, 3069–3078. [Google Scholar] [CrossRef]
  71. Li, H.; Yan, J. Impacts of equations of state (EOS) and impurities on the volume calculation of CO2 mixtures in the applications of CO2 capture and storage (CCS) processes. Appl. Energy 2009, 86, 2760–2770. [Google Scholar] [CrossRef]
  72. Bauer, A.R.; Carney, M.; Finley, J.R. Overview of microseismic response to CO2 injection into the Mt. Simon saline reservoir at the Illinois Basin-Decatur Project. Int. J. Greenh. Gas Control 2016, 54, 378–388. [Google Scholar] [CrossRef]
  73. Finley, R.J.; Frailey, S.M.; Leetaru, H.E.; Senel, O.; Couëslan, M.L.; Scott, M. Early Operational Experience at a One-million Tonne CCS Demonstration Project, Decatur, Illinois, USA. In Proceedings of the International Conference on Greenhouse Gas Control Technologies, Austin, TX, USA, 5–9 October 2014. [Google Scholar]
  74. Ii, R.L.; Larssen, D.; Salden, W.; Patterson, C.; Kirksey, J.; Iranmanesh, A.; Wimmer, B.; Krapac, I. Preinjection Reservoir Fluid Characterization at a CCS Demonstration Site: Illinois Basin—Decatur Project, USA. Energy Procedia 2013, 37, 6424–6433. [Google Scholar] [CrossRef]
  75. URS Corporation; Malone Service Corporation. Injection Well WDW-138 2009 Mechanical Integrity Test & Bottomhole Pressure Survey Report; Sandia Project No. 1168-URS-09; Sandia Technologies, LLC.: Houston, TX, USA, 2009. [Google Scholar]
  76. Finley, J.R.; Frailey, M.S.; Leetaru, E.H.; Senel, O.; Couëslan, M.L.; Scott, M. Early Operational Experience at a One-million Tonne CCS Demonstration Project, Decatur, Illinois, USA. Energy Procedia 2013, 37, 6149–6155. [Google Scholar] [CrossRef]
  77. Greenberg, S.E.; Bauer, R.; Will, R.; Ii, R.L.; Carney, M.; Leetaru, H.; Medler, J. Geologic Carbon Storage at a One Million Tonne Demonstration Project: Lessons Learned from the Illinois Basin–Decatur Project. Energy Procedia 2017, 114, 5529–5539. [Google Scholar] [CrossRef]
  78. Gan, M.; Nguyen, M.C.; Zhang, L.; Wei, N.; Li, J.; Lei, H.; Wang, Y.; Li, X.; Stauffer, P.H. Impact of reservoir parameters and wellbore permeability uncertainties on CO2 and brine leakage potential at the Shenhua CO2 Storage Site, China. Int. J. Greenh. Gas Control 2021, 111, 103443. [Google Scholar] [CrossRef]
  79. Cai, Y.; Lei, H.; Li, X.; Feng, G.; Cui, Y.; Bai, B.; Zheng, C. Phase transition and fluid backflow during the non-injection period in the Ordos CCS project, China. J. Clean. Prod. 2022, 349, 131493. [Google Scholar] [CrossRef]
  80. Zhang, K.; Xie, J.; Li, C.; Hu, L.; Wu, X.; Wang, Y. A full chain CCS demonstration project in northeast Ordos Basin, China: Operational experience and challenges. Int. J. Greenh. Gas Control 2016, 50, 218–230. [Google Scholar] [CrossRef]
  81. Wu, X.Z. Carbon Dioxide Capture and Geological Storage: The First Massive Exploration in China; Science Press: Beijing, China, 2013. [Google Scholar]
  82. Xu, X.Y.; Li, Q.; Tan, Y.S.; Liu, G.; Li, X.Y. Analysis of Monitoring Technologies of Offshore CO2 Geological Storage in Japan’s Tomakomai and Its Enlightenment. Geol. J. Chin. Univ. 2023, 29, 13–24. [Google Scholar]
  83. Japan CCS Co., Ltd. JCCS Tomakomai Monitoring Site. Available online: http://www.jccs-tomakomai-monitoring.com/JCCS/wp-content/uploads/2024/07/202407_ENG.pdf (accessed on 22 November 2019).
  84. Trupp, M.; Frontczak, J.; Torkington, J. The Gorgon CO2 Injection Project—2012 Update. Energy Procedia 2013, 37, 6237–6247. [Google Scholar] [CrossRef]
  85. Chevron Australia Pty Ltd. Gorgon Gas Development Revised and Expanded Proposal: Public Environmental Review (EPBC Referral 2008/478, Assessment No. 1727); Chevron Australia Pty Ltd.: Perth, Australia, 2008; ISBN 978-610-67076-8-2. [Google Scholar]
  86. Wang, Z.J.; Tang, X.; Jing, T.Y.; You, M.X.; Zhang, J.C.; Li, Z.; Zhou, J. Site Selection Strategy for An Annual Million-Ton Scale CO2 Geological Storage in China. Geoscience 2022, 36, 1414–1431. [Google Scholar]
  87. Li, Q.; Li, Y.Z.; Xu, X.Y.; Li, X.C.; Liu, G.Z.; Yu, H.; Tan, Y.S. Current Status and Recommendations of Offshore CO2 Geological Storage Monitoring. Geol. J. Chin. Univ. 2023, 29, 1–12. [Google Scholar]
  88. Mathieson, A.; Midgely, J.; Wright, I.; Saoula, N.; Ringrose, P. In Salah CO2 Storage JIP: CO2 sequestration monitoring and verification technologies applied at Krechba, Algeria. Energy Procedia 2011, 4, 3596–3603. [Google Scholar] [CrossRef]
  89. Verdon, P.J.; Kendall, J.-M.; Stork, L.A.; Chadwick, R.A.; White, D.j.; Bissell, R.C. Comparison of geomechanical deformation induced by megatonne-scale CO2 storage at Sleipner, Weyburn, and In Salah. Proc. Natl. Acad. Sci. USA 2013, 110, E2762–E2771. [Google Scholar] [CrossRef]
  90. Rutqvist, J.; Vasco, W.D.; Myer, L. Coupled reservoir-geomechanical analysis of CO2 injection and ground deformations at In Salah, Algeria. Int. J. Greenh. Gas Control 2009, 4, 225–230. [Google Scholar] [CrossRef]
  91. Oye, V.; Aker, E.; Daley, T.M.; Kühn, D.; Bohloli, B.; Korneev, V. Microseismic Monitoring and Interpretation of Injection Data from the in Salah CO2 Storage Site (Krechba), Algeria. Energy Procedia 2013, 37, 4191–4198. [Google Scholar] [CrossRef]
  92. Smith, J.; Durucan, S.; Korre, A.; Shi, J.-Q. A Methodology to Assess Increased Storage Capacity Provided by Fracture Networks at CO2 Storage Sites: Application to in Salah Storage Site. Energy Procedia 2013, 37, 3711–3718. [Google Scholar] [CrossRef]
  93. De Sant´Anna Pizarro, J.O.; Branco, C.C. Challenges in Implementing an EOR Project in the Pre-Salt Province in Deep Offshore Brasil. In Proceedings of the SPE EOR Conference at Oil and Gas West Asia 2012, Muscat, Oman, 16–18 April 2012. [Google Scholar]
  94. Godoi, J.M.A.; Matai, P.H.L.D. Enhanced oil recovery with carbon dioxide geosequestration: First steps at Pre-salt in Brazil. J. Pet. Explor. Prod. 2021, 11, 1429–1441. [Google Scholar] [CrossRef]
  95. Kiyingi, W.; Xiong, R.; Jin, Y.; Guo, J. Geological Carbon Dioxide Storage and Subsurface Rock Mechanics—Geomechanical Risks, Modelling Practices, and Risk Mitigation Strategies. Simul. Model. Pract. Theory 2025, 144, 103195. [Google Scholar] [CrossRef]
  96. Yuan, J.M.; Peng, C.Z.; Liu, J. Establishment of the Relationship Between CO2 Flooding Performance and Past Water Flooding Performance in Weyburn Oilfield. Foreign Oilfield Eng. 2009, 25, 19–22. [Google Scholar]
  97. Snæbjörnsdóttir, Ó.S.; Gislason, R.S.; Galeczka, M.I.; Oelkers, H.R. Reaction path modelling of in-situ mineralisation of CO2 at the CarbFix site at Hellisheidi, SW—Iceland. Geochim. Cosmochim. Acta 2018, 220, 348–366. [Google Scholar] [CrossRef]
  98. International Energy Agency Greenhouse Gas R&D Programme. Quantification Techniques for CO2 Leakage; Report 2012/02; IEA Environmental Projects Ltd.: Cheltenham, UK, 2012. [Google Scholar]
  99. Riding, J.B.; Rochelle, C.A. Subsurface characterization and geological monitoring of the CO2 injection operation at Weyburn, Saskatchewan, Canada. Geol. Soc. Lond. Spec. Publ. 2009, 313, 227–256. [Google Scholar] [CrossRef]
  100. Yu, H.T.; Zhang, G.; Yan, X. Research Progress on Mechanism of Near-Fault Reactivation Induced by CO2 Geological Storage. J. Huaqiao Univ. (Nat. Sci.) 2024, 45, 136–149. [Google Scholar]
  101. Whitecap Resources Inc. Corporate Presentation: Capital Discipline Driving Sustainable Growth; Whitecap Resources Inc.: 2024-11; White Resources Inc.: Calgary, AB, Canada, 2014. [Google Scholar]
  102. Zhai, K.Q.; Na, J.; Liu, S.Y. Exploring the Effects of Four Important Factors on Oil–CO2 Interfacial Properties and Miscibility in Nanopores. RSC Adv. 2017, 7, 54164–54177. [Google Scholar] [CrossRef]
  103. Lawton, D.; Alshuhail, A.; Coueslan, M.; Chabot, L. Pembina Cardium CO2 Monitoring Project, Alberta, Canada: Timelapse Seismic Analysis—Lessons Learned. Energy Procedia 2009, 1, 2235–2242. [Google Scholar] [CrossRef]
  104. Wiseman, A.C.S. Geologic Framework, Reservoir Characterization and Production Analyses of the Cardium Formation: Unconventionally Developed North West Pembina Field, Alberta, Canada. Master’s Thesis, University of Calgary, Calgary, AB, Canada, April 2014. [Google Scholar]
  105. Bosch, N. Acid Gas Injection—A Decade of Operating History in Western Canada. In Proceedings of the Canadian Gas Processors and Suppliers Association (CGPSA) Conference, Calgary, AB, Canada, 16–17 April 2002. [Google Scholar]
  106. Wang, S.X.; Carroll, J.J.; Tang, L. A wellbore flow model and phase state distribution of acid gas injection. Nat. Gas Ind. 2010, 30, 95–100+137. [Google Scholar]
  107. Sato, K.; Mito, S.; Horie, T.; Ohkuma, H.; Saito, H.; Watanabe, J.; Yoshimura, T. Monitoring and simulation studies for assessing macro- and meso-scale migration of CO2 sequestered in an onshore aquifer: Experiences from the Nagaoka pilot site, Japan. Int. J. Greenh. Gas Control 2011, 5, 125–137. [Google Scholar] [CrossRef]
  108. Zambrano, N.G. Design, Deployment, Performance and Assessment of Downhole and Near Surface Monitoring Technology for Geological CO2 Storage. Ph.D. Dissertation, University of Alberta, Edmonton, AB, Canada, June 2012. [Google Scholar]
  109. Alfredsson, H.A.; Hardarson, B.S.; Franzson, H.; Gislason, S.R. CO2 sequestration in basaltic rock at the Hellisheidi site in SW Iceland: Stratigraphy and chemical composition of the rocks at the injection site. Mineral. Mag. 2008, 72, 1–5. [Google Scholar] [CrossRef]
  110. Snæbjörnsdóttir, Ó.S.; Sigfússon, B.; Marieni, C.; Goldberg, D.; Gislason, R.S.; Oelkers, H.E. Carbon dioxide storage through mineral carbonation. Nat. Rev. Earth Environ. 2020, 1, 90–102. [Google Scholar] [CrossRef]
  111. Zhou, D.; Xia, C.Y.; Li, P.C. CO2 mineral storage in basalt (I): Technology and application conditions. J. Environ. Eng. 2024, 18, 2708–2718. [Google Scholar]
  112. Oelkers, E.H.; Gíslason, S.R. Carbon Capture and Storage: From Global Cycles to Global Solutions. Geochem. Perspect. 2023, 12, 179–180. [Google Scholar] [CrossRef]
  113. Holdsworth, C.; John, C.; Snæbjörnsdóttir, S.; Johnson, G.; Sigfússon, B.; Leslie, R.; Haszeldine, R.; Gilfillan, S. Reconstructing the temperature and origin of CO2 mineralisation in CarbFix calcite using clumped, carbon and oxygen isotopes. Appl. Geochem. 2024, 162, 105925. [Google Scholar] [CrossRef]
  114. Sigfusson, B.; Gislason, S.R.; Matter, J.M.; Stute, M.; Gunnlaugsson, E.; Gunnarsson, I.; Aradottir, E.S.; Sigurdardottir, H.; Mesfin, K.; Alfredsson, H.A.; et al. Solving the carbon-dioxide buoyancy challenge: The design and field testing of a dissolved CO2 injection system. Int. J. Greenh. Gas Control 2015, 37, 213–219. [Google Scholar] [CrossRef]
  115. Śliwiński, M.G.; Kitajima, K.; Kozdon, R.; Spicuzza, M.J.; Denny, A.; Valley, J.W. In situ δ13C and δ18O microanalysis by SIMS: A method for characterizing the carbonate components of natural and engineered CO2 reservoirs. Int. J. Greenh. Gas Control 2017, 57, 116–133. [Google Scholar] [CrossRef]
  116. McGrail, B.; Schaef, H.; Spane, F.; Horner, J.; Owen, A.; Cliff, J.; Qafoku, O.; Thompson, C.; Sullivan, E. Wallula Basalt Pilot Demonstration Project: Post-injection Results and Conclusions. Energy Procedia 2017, 114, 5783–5790. [Google Scholar] [CrossRef]
  117. McGrail, B.P.; Sullivan, E.C.; Thorne, F.O.; Johnson, C.S.; Robinson, S.P.; Kearn, C.; Drexler, S.P.; Haxel, G.; Ginnold, F.B. Topical Report-Preliminary Hydrogeologic Characterization Results from the Wallula Basalt Pilot Study; Cooperative Agreement DE-FC26-08NT43687; Sandia Project No. PNWD-4129; Battelle Pacific Northwest Division: Richland, WA, USA, 2009–2012. [Google Scholar]
  118. McGrail, B.; Spane, F.; Sullivan, E.; Bacon, D.; Hund, G. The Wallula basalt sequestration pilot project. Energy Procedia 2011, 4, 5653–5660. [Google Scholar] [CrossRef]
  119. Zakharova, V.N.; Goldberg, S.D.; Sullivan, C.E.; Herron, M.M.; Grau, A.J. Petrophysical and geochemical properties of Columbia River flood basalt: Implications for carbon sequestration. Geochem. Geophys. Geosyst. 2012, 13, 11. [Google Scholar] [CrossRef]
  120. Ito, T.; Nakajima, T.; Chiyonobu, S.; Xue, Z. Petrophysical properties and their relation to injected CO2 behavior in a reservoir at the Nagaoka pilot site, Japan. Energy Procedia 2014, 63, 2855–2860. [Google Scholar] [CrossRef]
  121. Mito, S.; Xue, Z. Post-Injection monitoring of stored CO2 at the Nagaoka pilot site: 5 years time-lapse well logging results. Energy Procedia 2011, 4, 3284–3289. [Google Scholar] [CrossRef]
  122. Mito, S.; Xue, Z.; Ohsumi, T. Case study of geochemical reactions at the Nagaoka CO2 injection site, Japan. Int. J. Greenh. Gas Control 2008, 2, 309–318. [Google Scholar] [CrossRef]
  123. Saito, H.; Nobuoka, D.; Azuma, H.; Xue, Z.; Tanase, D. Time-lapse crosswell seismic tomography for monitoring injected CO2 in an onshore aquifer, Nagaoka, Japan. Explor. Geophys. 2006, 37, 30–36. [Google Scholar] [CrossRef]
  124. Zhou, B.; Lun, Z.M.; Zhang, J.; Tang, Y.Q.; Qi, Y.B.; Xiao, P.F.; Yin, X. Research status of self-sealing mechanisms of caprocks and fractures during CO2 geological storage. Pet. Explor. Geol. 2025, 47, 1177–1184. [Google Scholar]
  125. Ma, Z.P.; Wang, Y.B.; Zhang, T.; Liu, Y.; Liang, K.Q.; Shen, Z.Z.; Yang, K. Case analysis and suggestions on CO2 leakage monitoring pointdeployment method in CCUS project. China Min. Mag. 2025, 34, 141–148. [Google Scholar]
  126. Zhang, M.; Yu, B.; Shi, B.C.; Zhu, Q.; Liu, K. Optimization and evaluation of corrosion inhibitor for P110S steel in H2S/CO2 coexistence system. Chem. Pet. Eng. 2025, 54, 106–114. [Google Scholar]
  127. Guo, S.K.; Li, J.; Lian, W.; Cao, W. Research Progress and Development Suggestions on Wellbore Integrity for CCUS Geological Storage. Pet. Drill. Technol. 2025, 53, 144–154. [Google Scholar]
  128. Chen, Q.; Fan, J.C.; Zhang, L.B.; Yang, Y.P.; Zhou, Q. Multi-Physical Field Phase Changes After Supercritical CO2 Leakage in Wellbore. Pet. Mach. 2025, 53, 59–67. [Google Scholar]
  129. Liu, B.; Huang, T.T. Numerical Simulation Study on the Mechanical Integrity of Caprock in CO2 Geological Sequestration. J. Petrochem. Univ. 2025, 38, 33–41. [Google Scholar]
  130. Deng, C.G.; Sun, X.L.; Liu, K.Y.; An, S.Y.; Yuan, G.G.; Wang, Y.X. Mechanisms underlying the impacts of reservoir pore structures on near-well salt precipitation in CO2 geological storage. Coal Geol. Explor. 2025, 53, 128–140. [Google Scholar]
  131. Feng, F.P.; You, G.Y.; Zhang, X.C.; Wang, J.Q.; Wang, Q.D.; Cao, J.; Han, X. Corrosion Rate and Service Life Prediction of CO2 Injection Well String. Hot Work. Technol. 2025, 54, 113–118. [Google Scholar]
  132. Chen, X.M.; Qian, Y.H.; Chen, Z.Z.; Chen, Z.F. Exploration and application of 3D CO2 storage leakage monitoring technology: A case study of Zhangjiaduo oilfield in Subei Basin. Reserv. Eval. Dev. 2025, 15, 508–514. [Google Scholar]
  133. Lian, W.; Wang, N.H.; Li, J.; Li, Q.X. Research Progress on CO2 Geological Storage Leakage Mechanism and Wellbore Integrity. J. South China Norm. Univ. (Nat. Sci. Ed.) 2024, 56, 1–15. [Google Scholar]
  134. Lian, W.; Liu, H.; Li, J.; Wu, Y. Site and Formation Selection for CO2 Geological Sequestration: Research Progress and Case Analyses. Appl. Sci. 2025, 15, 11402. [Google Scholar] [CrossRef]
Figure 1. This diagram depicts the relationship between wellsite layout, wellbore design, and injection parameters. These three elements have a close mutual coupling effect, and their coordinated adaptation is essential to ensure the safe and efficient injection and storage of CO2.
Eng 06 00329 g001
Figure 2. This figure shows the bottomhole pressure of Well F2H from April 2008 to May 2010, with its peak close to the formation fracture pressure, which has posed a threat to sequestration safety.
Eng 06 00329 g002
Figure 3. This is the well layout map of the Ketzin Project, including the first three wells constructed, namely one injection well (Ktzi201) and two monitoring wells (Ktzi200 and Ktzi202).
Eng 06 00329 g003
Figure 4. This is the wellbore structure diagram of Well Ktzi201. The casing is made of stainless steel, and CO2 is injected through tubing with a diameter of 89 mm.
Eng 06 00329 g004
Figure 5. As can be seen from the pressure data two years after injection, the reservoir pressure fluctuates within the allowable range and stabilizes over time, indicating that CO2 has been normally injected into the reservoir for storage.
Eng 06 00329 g005
Figure 6. This is the site layout map of the Quest Storage Project, which consists of three injection sites. Each site includes one injection well, one deep monitoring well (~1.7 km deep), and one shallow groundwater monitoring well (<0.2 km deep). The three injection wells are IW-5-35, IW-8-19, and IW-7-11, with each approximately 6 km apart.
Eng 06 00329 g006
Figure 7. This is the wellbore structure diagram of Well IW-7-11. For this injection well, the surface casing, intermediate casing, and the upper section of the production casing are all made of L80 casing, while the lower section of the production casing adopts Cr25-120 casing.
Eng 06 00329 g007
Figure 8. This is the bottomhole pressure variation diagram of Wells IW-7-11 and IW-8-19. Under the condition of a bottomhole temperature of approximately 30 °C, a pressure increase of 1–2 MPa has been observed.
Eng 06 00329 g008
Figure 9. This is the bottomhole temperature variation of Well IW-7-11. It is observed that the dynamic injection rate at low temperatures (e.g., 23 °C) is 2–12% higher than that at high temperatures (e.g., 32 °C), showing a significant negative correlation.
Eng 06 00329 g009
Figure 10. The well site of the Decatur Project includes one injection well and three monitoring wells. Among them, the injection well (CCS1) is approximately 2190 m deep, the monitoring well (GM1) is about 1050 m deep, the first observation well (VM1) is around 2201 m deep, and the second observation well (VM2) is roughly 2202 m deep.
Eng 06 00329 g010
Figure 11. This is the wellbore structure diagram of Well VM1. For effective corrosion protection, the section from 1448 m to the bottom of the well is sealed with a corrosion-resistant cement sheath.
Eng 06 00329 g011
Figure 12. The injection site of the Shenhua CCS Project includes one injection well (INJW) and two monitoring wells (MW1, MW2). MW1 is responsible for monitoring temperature and pressure at different depths, while MW2 is used to monitor CO2 leakage in the vertical direction.
Eng 06 00329 g012
Figure 13. This is the wellbore structure diagram of the injection well and Monitoring Well 1 (Shenhua INJW and MW1). Both Shenhua INJW and MW1 are three-spud wells with stainless steel casings; the third spudding section is completed by liner cementing, and both wells use CO2 corrosion-resistant cement for cementing.
Eng 06 00329 g013
Figure 14. This is the variation in bottomhole pressure in the shallow-layer Well IW-1. The pressure fluctuates drastically, indicating poor reservoir physical properties.
Eng 06 00329 g014
Figure 15. This is the variation in bottomhole pressure in the deep-layer Well IW-2. The bottomhole pressure maintains at approximately 10 MPa, which is lower than the fracture pressure of 12.6 MPa.
Eng 06 00329 g015
Figure 16. This is the well layout map of the In Salah Project. The project injects CO2 into the Krechba formation through three horizontal injection wells (KB501, KB502, KB503), with their horizontal sections ranging from 1500 m to 1800 m.
Eng 06 00329 g016
Figure 17. These are the two injection methods of CO2: the left diagram shows gaseous CO2 dissolved in formation water for injection, and the right diagram shows supercritical CO2 directly injected.
Eng 06 00329 g017
Figure 18. This is the wellbore structure diagram of the Wallula injection well. It adopts three-spud completion, with cement returning to the surface.
Eng 06 00329 g018
Figure 19. The well site of the Nagaoka Project includes one injection well (IW-1) and three observation wells (OB-2, OB-3, OB-4). From the plane where the reservoir is located, Well OB-2 is 40 m in the downdip direction of Injection Well IW-1, while Wells OB-3 and OB-4 are 120 m and 60 m in the updip direction respectively.
Eng 06 00329 g019
Figure 20. This is the injection rate over time diagram. The injection rate was 20 t/d in the first nine months of the project, and was subsequently adjusted to 40 t/d after confirming CO2 injectivity.
Eng 06 00329 g020
Figure 21. Before CO2 injection, the bottomhole pressure of Well IW-1 was 10.7 MPa, and that of Well OB-4 was 10.8 MPa. During the injection process, the pressure of the injection well was higher than that of Well OB-4. Shortly before the injection stopped, the pressure of Well IW-1 reached 12.4 MPa, while that of Well OB-4 was 11.9 MPa. Five days after the injection stopped, the pressure of Well IW-1 dropped to 11.8 MPa, equalizing with that of Well OB-4. Over the following year, the pressure dropped sharply by approximately 1 MPa and then gradually stabilized.
Eng 06 00329 g021
Table 1. This is a summary of basic data of typical projects, which reflects significant geographical differences. Traditional developed countries are in a leading position, and emerging countries also show great potential.
Project NameCarbon SourceSequestration QuantityInjection Start TimeInjection End Time
Norway SleipnerNatural Gas ExtractionOver 20 million metric tonnes1996To date
Norway SnøhvitNatural Gas ExtractionPlanned 23 million metric tonnes2008To date
Iceland CarbfixGeothermal Power PlantOver 100,000 metric tonnes2012To date
Germany KetzinNearby Power Plant67,000 metric tonnes2008.062013.08
Algeria In SalahNatural Gas Extraction4 million metric tonnes2004.042011
Canada QuestOil Sands Bitumen ExtractionOver 7 million metric tonnes2015.08To date
United States DecaturEthanol Plant Capture925,300 metric tonnes2011.112014.09
United States WallulaPaper Mill Capture1000 metric tonnes2013.072013.8
Brazil Pre-SaltOilfield-Associated GasOver 40 million metric tonnes2006To date
Australia GorgonNatural Gas ExtractionEstimated 129 million metric tonnes2016To date
China ShenhuaShenhua Coal Liquefaction Plant200,000 metric tonnes2011.052014.06
China Enping 15-1Offshore Oilfield AssociatedEstimated 1.46 million metric tonnes2023.06To date
Japan NagaokaAmmonia Production By-product10,400 metric tonnes2003.072005.01
Japan TomakomaiHydrogen Production300,000 metric tonnes20162019
Canada WeyburnCoal gasification by-productsEstimated to exceed 30 million metric tonnes2000To date
Canada PembinaIndustrial capture66,000 metric tonnes20052008
Table 2. Summary of Engineering Parameters of Projects Listed in This Paper. In this table, “t” refers to metric tonne.
ProjectNumber of Injection WellsNumber of Monitoring WellsWellhead Temperature (°C)Wellhead Pressure (MPa)Bottomhole Temperature (°C)Bottomhole Pressure (MPa)Injection Rate (t/d)Characteristics
Sleipner1N/A256.2–6.548Pressure increase of less than 0.5 MPa2700CO2 enters the reservoir as dense-phase flow
Snøhvit1N/A47.8–17.49528.5–392000The reservoir is isolated from other formations, and the pressure rises rapidly, approaching the fracture pressure
Ketzin14426.531–357.2–7.683The burial depth is less than 800 m, which does not meet the supercritical conditions for CO2
Carbfix11N/ASlightly higher than 2.5 MPaN/AN/AStage 1: 6.05
Stage 2: 0.864–4.32
CO2 dissolves in water before entering the formation
In Salah3525–5514–184829N/AThe volume of injected CO2 and the volume of produced gas cannot be balanced, leading to an increase in formation pressure
Shenhua12−13.9 ~ 23.74.2–8.4N/AN/A274N/A
Tomakomai23N/AMaximum: 23 MPaShallow layer: 35.9 °C
Deep layer: 87.5 °C
Shallow Layer: 10Shallow Layer: 595
Deep Layer: 2.7
N/A
Nagaoka1332–366.6–7.445–4911.9–12.620–40N/A
Gorgon9254N/A10726.210,900In CO2 injection projects, challenges such as sand production, pressure management failure, and premature condensation of CO2 into water can significantly impact operational safety and efficiency
Quest337–266.322–4822.32880Reservoir temperature and properties significantly affect the physical behavior of CO2, leading to a negative correlation between the CO2 injection rate and the injection temperature.
Decatur13359.327–4212.931000N/A
Wallula12N/AN/AN/AN/A40Injected CO2 mainly accumulates at the top of the reservoir
Pre-Salt (Lula)3N/AN/AN/AN/AN/AN/AWater–Gas Alternating Injection
Weyburn17 CO2 injection wells and 110 WAG wells60 groundwater monitoring wells and 4 shallow monitoring wellsN/A10–11Decrease by 7 °CIncrease by 8 MPa5500The combination of horizontal wells and vertical injection wells, combined with water-alternating-gas (WAG) injection, optimizes the injection-production performance.
Pembina21377.79826.935–100Due to poor reservoir connectivity, the water-alternating-gas (WAG) mode is adopted to enhance sweep efficiency.
Disclaimer/Publisher’s Note: The statements, opinions and data contained in all publications are solely those of the individual author(s) and contributor(s) and not of MDPI and/or the editor(s). MDPI and/or the editor(s) disclaim responsibility for any injury to people or property resulting from any ideas, methods, instructions or products referred to in the content.