Article

Glycerol Dehydration to Acrolein Catalyzed by Silicotungstic Acid: Effect of Mesoporous Support

1
Department of Biosystems Engineering and Soil Science, The University of Tennessee, Knoxville, TN 37996, USA
2
Department of Agricultural and Biological Engineering, Mississippi State University, Mississippi State, MS 39762, USA
3
Center for Renewable Carbon, The University of Tennessee, Knoxville, TN 37996, USA
*
Author to whom correspondence should be addressed.
Eng 2023, 4(1), 206-222; https://doi.org/10.3390/eng4010012
Submission received: 29 October 2022 / Revised: 31 December 2022 / Accepted: 4 January 2023 / Published: 7 January 2023
(This article belongs to the Special Issue Green Engineering for Sustainable Development)

Abstract

:
To facilitate value-added chemical production from renewable glycerol, gas-phase glycerol dehydration to acrolein was conducted using supported silicotungstic acid as solid acid catalysts, focusing on the effects of mesoporous catalyst supports on the catalytic performance. One alumina (Al) support with average mesopore size of 30 nm and two silica supports (Si1254 and Si1252) with mesopore size of 6 nm and 11 nm, respectively, were comparatively evaluated in this study. It was found that the Si1254 silica support with the smallest pore size (6 nm) deactivated the fastest, decreasing both the glycerol conversion and acrolein selectivity along the time-on-stream. The other silica support Si1252 with 11 nm pore size provided an acrolein yield comparable to the Al support over the tested 7.5 h time-on-stream (73.9 mol% for Si1252 vs. 74.1 mol% for Al). However, the mechanisms for achieving the comparable yield are different. Si1252 showed higher acrolein selectivity than Al, but it also deactivated faster than Al due to its quicker coking. On the other hand, Al showed more stable performance in terms of glycerol conversion rate and less coking, but it had lower acrolein selectivity and a higher selectivity to byproducts, especially the undesired byproducts of acetaldehyde and propionaldehyde, which posed difficulties in downstream separation.

1. Introduction

Acrolein, industrially produced from the partial oxidation of propylene, is an important intermediate for many common industrial chemicals. The conjugation of a carbonyl group with a vinyl group provides acrolein a high degree of reactivity, leading to an array of useful end-products, such as acrylic acid and ester, glutaraldehyde, methionine, polyurethane, and polyester resin. Acrolein production via glycerol dehydration has recently attracted much attention due to the overproduction of glycerol from biodiesel industry. This bio-based glycerol route for acrolein production became appealing and started to show its industrial value with the advancement of heterogeneous acid catalysis [1,2,3]. The concern of the increasing propylene price due to the shrinking supply of nonrenewable crude oil makes the acid-catalyzed gas-phase glycerol dehydration to acrolein a prime candidate for research [2,4].
The presence of solid acid sites can greatly improve glycerol conversion and selectivity to acrolein. The possible mechanism (Scheme 1) is that an acid (proton donor or electron accepter) helps the formation of carbocations via the protonation of glycerol’s primary or secondary hydroxyl groups. The acidity and the surface/pore structure of a catalyst have some influence on the final ratio of the two carbocations. Nevertheless, the secondary carbocation (Scheme 1A) would always be predominant, since it is thermodynamically more stable than the primary carbocation (Scheme 1B) and its formation rate is faster [5]. The secondary carbocation is able to attract an electron from the neighboring carbon to form an enol, which can quickly transform into 3-hydroxypropanal. Dehydration could occur once again on 3-hydroxypropanal, leading to acrolein formation (Scheme 1(A1)). Similarly, the primary carbocation could form acetol through a less stable enol compound (Scheme 1(B1)). Concerning the reaction mechanism for the formation of acrolein vs. acetol, it is well accepted that acrolein formation is mainly catalyzed at the Brønsted acid sites while the Lewis acid sites favor the formation of acetol [2,4,6,7,8]. However, different opinions have been provided [9,10], attributing the higher acetol yield to the larger amount of weak acid sites in zeolites desorbed at <300 °C as characterized by temperature programmed desorption of ammonia (NH3-TPD). In addition to intramolecular enol formation, intermolecular condensation to form glycerol oligomers can also occur, which is favored at lower temperatures [11].
Heteropoly acids (HPAs) feature strong Brønsted acidity and flexibility to be modulated. They are also considered economical and environmentally friendly, having well-defined structures and tunable acidity levels [12,13,14]. Consequently, HPAs have attracted more and more attention and have been successfully applied to many acid-catalyzed reactions. Silicotungstic acid (HSiW), one of HPAs, has been previously proven as one of the most effective acid catalysts studied for acrolein production from glycerol [15,16,17]. As water soluble mineral acids, although featuring a strong acidity, HPAs usually have low specific surface areas [18,19]. Consequently, in many applications, HPAs were loaded on certain supporting materials (e.g., [20,21,22]). The strong acidity of HPAs can be retained after being loaded onto the support surface, while larger surface areas can be achieved, as determined by the supporting materials [18,19,23]. The supporting materials intrinsically tune HPAs, imposing new features on the HPAs. With the proper selection of catalyst support, HPAs can be promising in regard to solid acid catalysts for glycerol dehydration to acrolein.
Alumina (Al2O3) and silica (SiO2) are two of the most common supporting materials used in the industry for providing large surface area to accommodate desired chemical reactions. Several research groups [15,16,17] have studied these two supports for glycerol dehydration to acrolein. However, it seems that a consensus has not yet been reached regarding which one is superior. Tsukuda et al. [15] found that a proper mesopore size was important for acrolein production, and that among the three investigated silica supports with different pore sizes, the two with larger pore sizes (6 nm and 10 nm; surface area: 466 m2/g and 310 m2/g, respectively) both provided high glycerol conversion and high acrolein selectivity. Atia et al. [16] claimed that alumina-supported acid showed higher catalytic activity and acrolein selectivity than silica-supported acid, although the reported selectivity did not exceed that reported by Tsukuda et al. [15].
It was therefore useful and informative to conduct a study on commercially available support products for potential industrial applications. We first conducted screening among the commercially available supporting materials based on their physical properties (morphological structure, pore size, particle size, and surface area) and the knowledge obtained from the literature. In this study, both alumina and silica with differing properties as a support for silicotungstic acid were investigated in gas-phase glycerol dehydration to acrolein. The objective was to compare how the differently supported catalysts differ in their characteristics and catalytic performance in glycerol conversion to acrolein.

2. Materials and Methods

2.1. Catalyst Preparation

One mesoporous Al2O3 (Davicat® Al2700) and two types of mesoporous SiO2 (Davicat® Si1252 and Davicat® Si1254) were supplied by Grace-Davison Corp. (Columbia, MD, USA). The specification data provided by the manufacturer are listed in Table 1. Silicotungstic acid (H4SiW12O40·24H2O, hereafter abbreviated as HSiW) was purchased from Sigma Aldrich (St. Louis, MO, USA).
HSiW was loaded onto the catalyst supports using the wet impregnation method. All the supports were first calcined at 300 °C for 2 h before use. HSiW of 10% weight percentage (wt.%) of the support was dissolved in deionized water to make a 0.04 g/mL solution. The calcined support was added to the HSiW solution. Constant stirring was applied to the mixture at room temperature for 24 h to ensure the equilibrium of the adsorption–desorption processes. The resultant mixture was dried first at 55 °C for 24 h with the application of constant stirring. Then the mixture was dried at 105 °C until complete dryness (~6 h). The dried catalyst was calcined at 300 °C before a 2nd impregnation for another 10 wt.% acid loading. The procedure was repeated until the desired amount of loading was achieved; 30 wt.% loading for alumina and 20 wt.% loading for silica were selected based on the optimal loading for the specific support from previous studies [15,16]. Therefore, three catalysts were used in total in this study, and they were Si1254 with 20 wt.% HSiW loading, Si1252 with 20 wt.% HSiW loading, and Al2700 with 30 wt.% loading, denoted hereafter as “HSiW-Si1254”, “HSiW-Si1252”, and “HSiW-Al”, respectively.

2.2. Catalyst Characterization

The characterization of surface area, acid dispersion on the support surface, and acid strength was performed for all the three types of fresh catalysts. Additionally, temperature programmed oxidation (TPO) analysis was conducted for each of the three spent catalysts collected after 7.5 h time-on-stream (TOS) to examine the coke deposition on each catalyst. The characterization methods are described as follows.
The surface area of the catalyst was determined via single-point Brunauer–Emmett–Teller (BET) measurement using a ChemBET Pulsar TPR/TPD Automated Chemisorption Flow Analyzer from Quantachrome Instruments (Boynton Beach, FL, USA). A catalyst (0.100 g) was first degassed at 300 °C in a nitrogen atmosphere. The physisorption started after the sample cell was immersed into a liquid nitrogen bath, and then desorption occurred at room temperature. To quickly bring the temperature of the cell back to room temperature, the cell was immersed into circulating water at room temperature as soon as it was removed from the liquid nitrogen bath to facilitate the heat transfer. Both the adsorption and desorption processes were detected by a thermal conductivity detector (TCD) and recorded on a computer via the TPRWin Software provided with the ChemBET Pulsar TPR/TPD. The detailed protocol is provided in the manual of Pulsar ChemBET TPR/TPD [24]. Nitrogen amount was calibrated by injecting a known volume of pure nitrogen gas (ultra purity) until the peak area of the injected volume was equivalent to that of the desorption peak. In this way, the adsorbed nitrogen volume was known based on the monolayer nitrogen adsorption. The volume of the desorbed nitrogen, together with room temperature and atmosphere pressure, was used to calculate the surface area of a catalyst via the Equation (1) shown below [25].
S A = S A t o t a l w = P V N A c s ( 1 P / P o ) R T w
where SA is the specific surface area, P and Po are the equilibrium pressure and the saturation pressure of the adsorbate at the temperature of adsorption, respectively, V is the total volume of the adsorbed (or desorbed) nitrogen, N is Avogadro’s number (6.023 × 10²³ molecules/mol), Acs is the cross-sectional area of the N2 molecule (0.162 nm2), R is the gas constant, T is the temperature at which the desorption takes place, and w is the weight of the catalyst in the sample cell.
With the knowledge of the specific surface area, the surface coverage of HSiW on Si1252, Si1254, and Al2700 can be calculated via Equation (2) [16]. This parameter provides the information of the coverage of the active acid sites on a given catalyst surface [16,20].
D s u r f a c e = L % ( 1 L % ) M H S i W A B E T
where Dsurface denotes the surface coverage of HSiW on a support, L% is the acid loading weight percentage, MHSiW is the molecular weight of HSiW (3310.66 g/mol) loaded on the support, and ABET is the surface area of the support [20].
The acid strengths of the three solid catalysts were evaluated via the temperature programmed desorption of ammonia (NH3-TPD) using the Pulsar ChemBET TPR/TPD with a protocol detailed in the manual [24]. Specifically, a sample was preheated to 100 °C and remained at 100 °C for 1 h with ultra-pure helium gas flowing through at 70 mL/min. The TCD signal had been stabilized by the end of this one-hour period. Then the inlet gas was changed from helium to anhydrous ammonia gas (NH3), also at 70 mL/min, keeping the NH3 flowing through the sample cell for 30 min at 100 °C to ensure that the catalyst inside the sample cell was saturated with ammonia. Afterwards, the inlet gas was switched back to helium (70 mL/min), and the helium flushed through the cell at 100 °C for 2 h to remove the physisorbed ammonia. The temperature of 100 °C was used during the adsorption process to ensure that it was high enough to remove the physisorbed gaseous particles and low enough not to affect the subsequent chemisorption. The TPD was measured from 100 °C to 800 °C with a temperature elevation rate of 10 °C/min. A TPD profile graph was obtained with temperature as the X-axis and the TCD signal (proportional to the amount of evacuated NH3) as the Y-axis. In principle, NH3 is adsorbed onto the catalyst surface. NH3 adsorbed on stronger acid sites will be more difficult to desorb (remove) from those sites and will only do so when a higher temperature is applied. As the result, as the temperature elevates, the amount of the preferentially evacuated NH3 will provide a measure of the acid strength of the solid catalyst.
Powder X-ray diffraction (XRD) patterns were recorded on a Philips X’Pert PRO PW3050 X-ray diffractometer using Cu radiation (0.154 nm) and a graphite generator. The tube voltage and the current were 45 kV and 40 mA, respectively. The scan rate was 0.5 °/min, and the scan range was 2°–80° with the step size of 0.04°.
Spent catalysts were characterized via temperature programmed oxidation (TPO) technique using the Pulsar ChemBET TPR/TPD [24]. Prior to the TPO measurement, the spent catalyst (0.100 g) was dried at 105 °C in a convective oven for 12 h and preheated at 300 °C under nitrogen flow for 3 h. The cell was cooled down to room temperature, and then the inlet gas was switched to an oxygen-containing gas (5% oxygen in helium) flowing through at 70 mL/min. The TPO was measured from 25 °C to 900 °C at a temperature elevation rate of 10 °C/min. The principle of this technique is the oxidation reaction between oxygen and the carbonaceous species (coke) deposited on the spent catalyst surface. Coke has a distribution of carbonaceous species with different structural complexities, which require different temperatures to activate the oxidation reaction. The “harder” coke species with larger molecular weight and more complex structure would require a higher reaction temperature to be oxidized by oxygen. As the temperature elevates, the oxygen preferentially reacts with the surface coke species, and the consumed amount of oxygen gives a measure of the coke profile regarding the relative amount and hardness of the coke deposited on the surface during the reactions. Some surface coke can be directly oxidized into CO2 and flushed off the catalyst surface, while some surface coke needs several steps before eventually being converted into CO2. Therefore, the effluent gas from a sample includes the inert background gas helium, the remaining oxygen, and generated CO2.

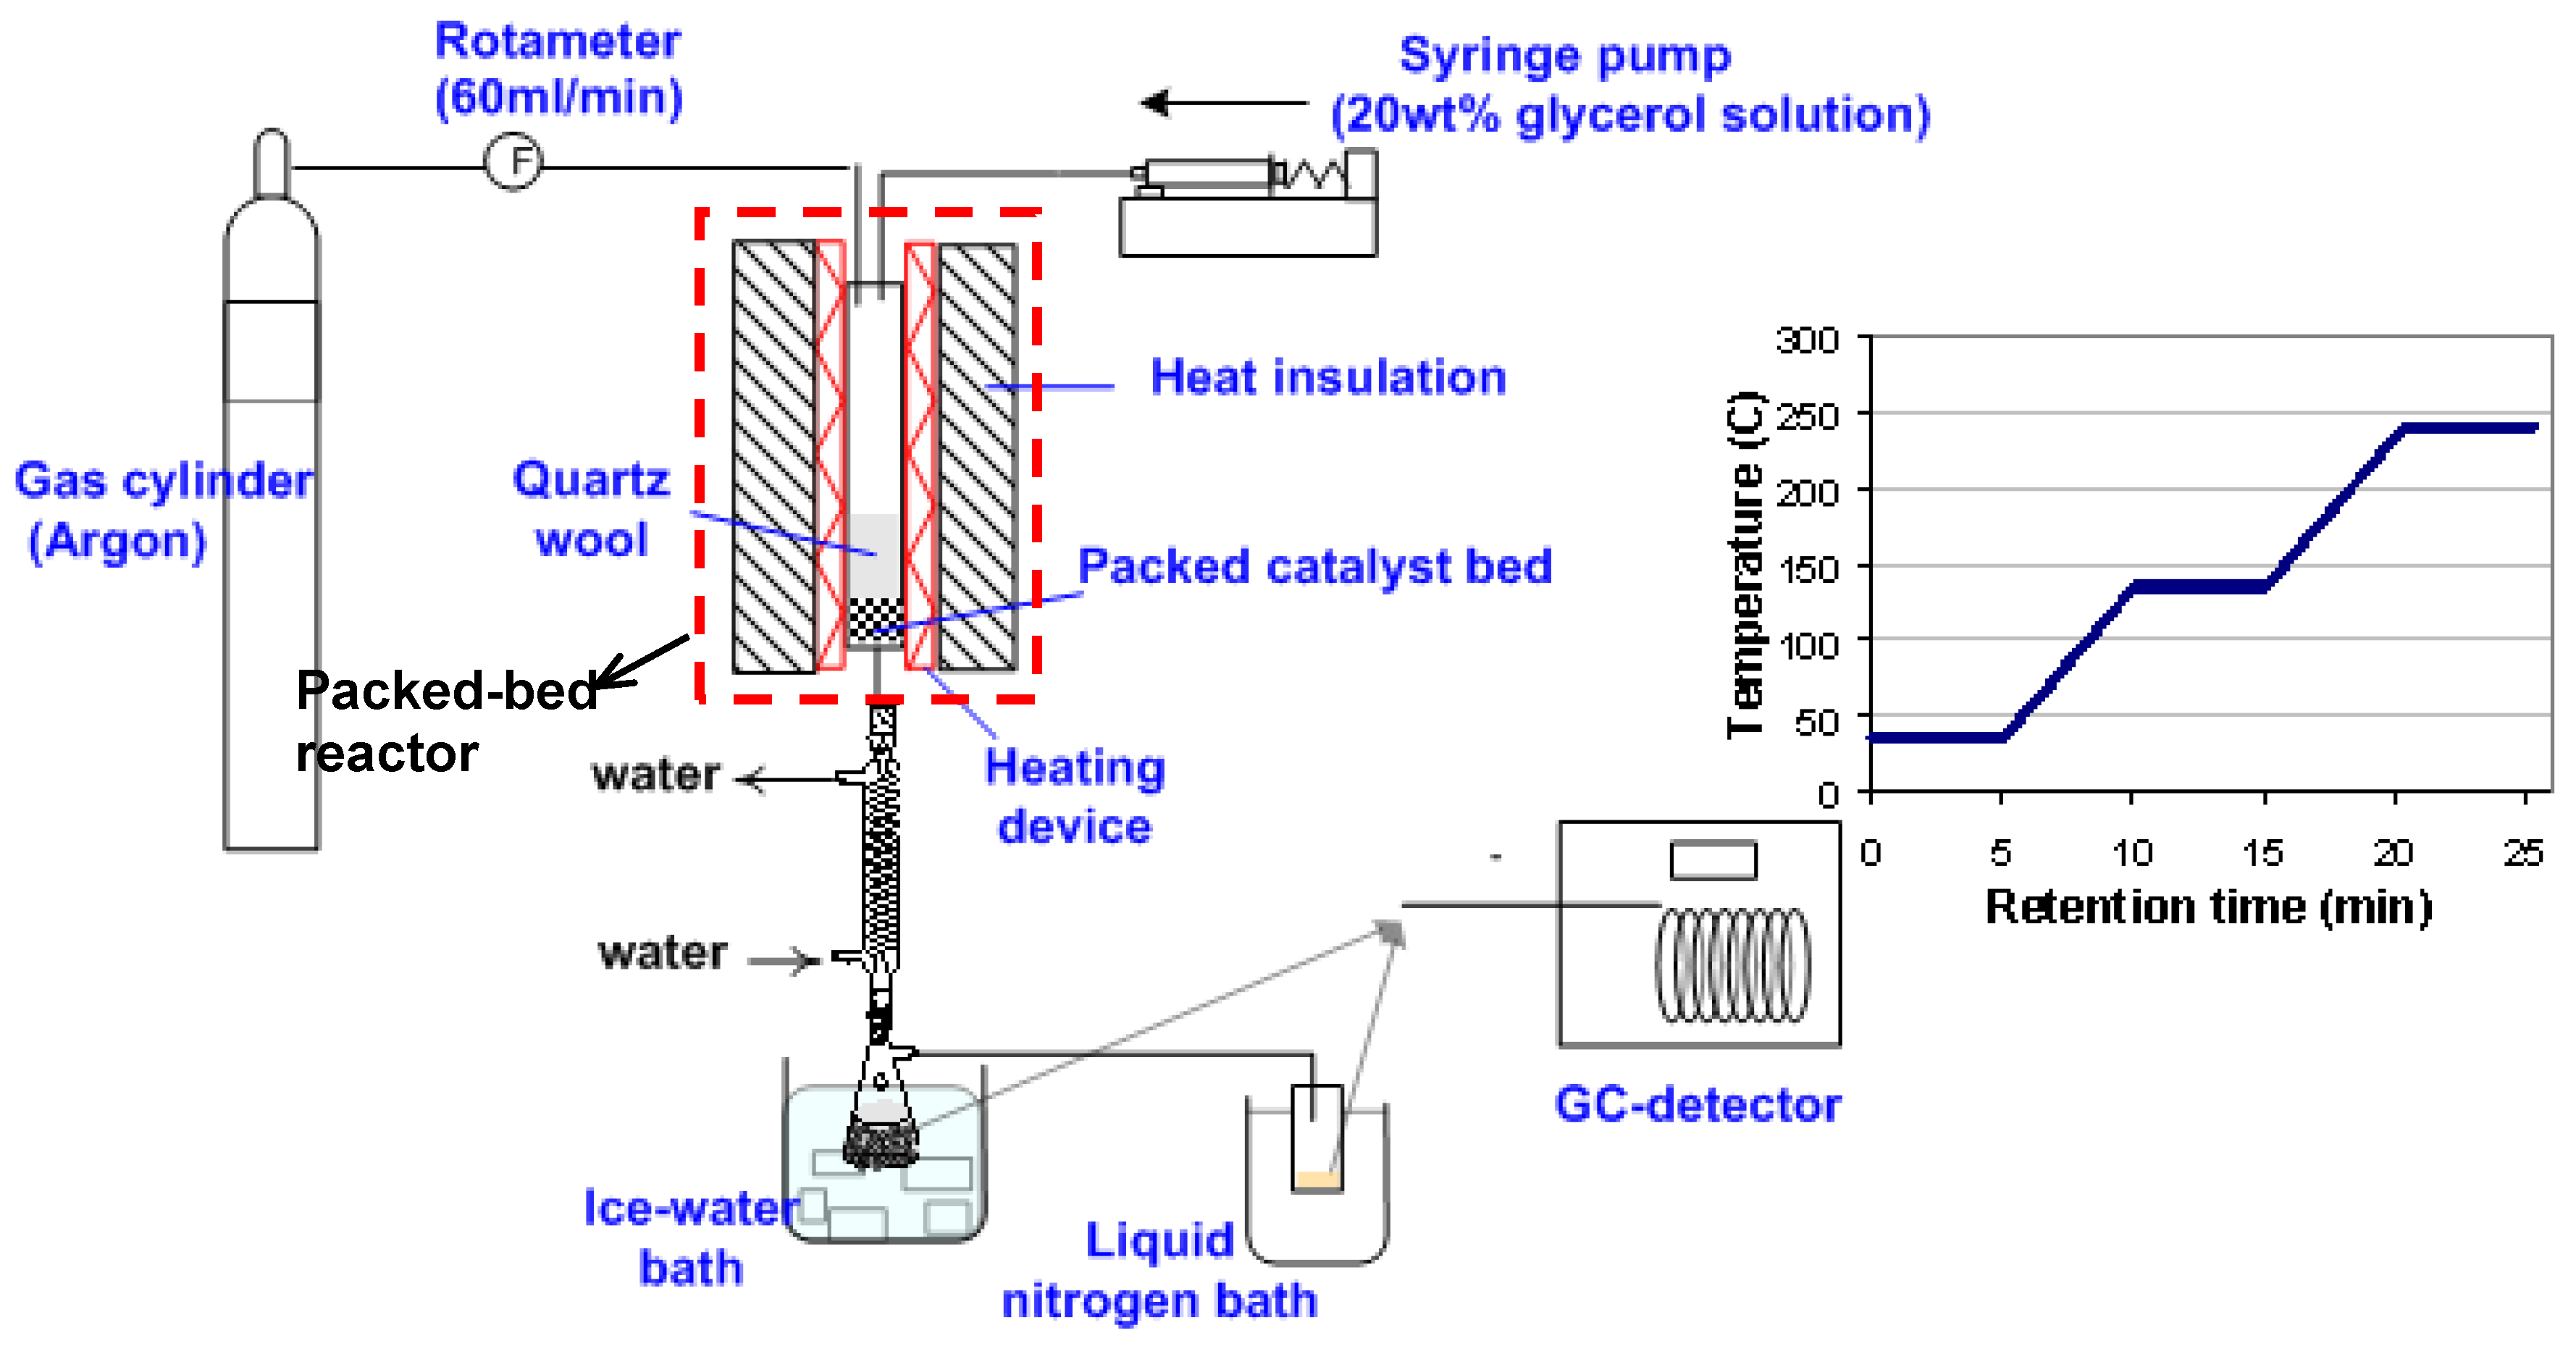
2.3. Glycerol Dehydration

A schematic of the experimental layout is presented in Figure 1. Glycerol dehydration was carried out in a down-flow packed-bed reactor (PBR), which was oriented vertically. The base of the reactor was a quartz tube (length 300 mm, ID 19.35 mm, OD 25.4 mm). A 313 W heating tape (Omega Scientific, USA) was used to heat the PBR; this tape was evenly wrapped around the outside wall of the quartz tube. The heating tape was controlled by a proportional-integral-derivative (PID) temperature controller to maintain the desired temperature of the catalyst bed. The PBR had an external layer of thermal insulation material to minimize the heat loss to the surroundings. A volume of 7 mL of catalyst (~3.7 g for HSiW-Si1254, ~3.2 g for HSiW-Si1252, ~3.6 g for HSiW-Al) was packed at the lower end of the PBR, leaving sufficient travel length for carrier gas and glycerol feed to be preheated to the desired temperature and gas phase before reaching the catalyst bed. Therefore, experiments for the three catalysts were conducted at a consistent gas hourly space velocity (GHSV), as defined in Equation (3). As the result, the catalyst was controlled by volume instead of weight to standardize the comparison among the differently supported catalysts with the same GHSV.
GHSV = uglycerol/Vcatalyst
where GHSV is the gas hourly space velocity (h−1), uglycerol is volumetric flow rate of glycerol in the gas phase, and Vcatalyst is the catalyst bed volume.
Glycerol solution (20 wt.% of glycerol in water) was fed by a syringe pump with 6.02 g/hour feeding rate, which was equivalent to 84.4 h−1 GHSV of glycerol. Argon was used as the carrier gas, and its flow rate was regulated at 60 mL/min. The products after reaction traveled through a condenser with flowing tap water, where the majority of the liquid product was condensed in a 50 mL vial immersed in an ice-water cold bath (1st condensation stage). Any products that were not condensable in the first condensation stage were collected in a 20 mL vial that was immersed in a liquid nitrogen bath (2nd condensation stage).
After each 1.5 h time interval, the vials at the two condensation stages were replaced with a new set of vials. Each of the samples collected from the two condensation stages was individually analyzed using a gas chromatography equipped with a flame ionization detector (GC-FID, HP 6890, Agilent Technologies Inc., Santa Clara, CA, USA) and a VB-WAX capillary column (0.25 mm ID, 25 m length) (Valco Instrument Co. Inc., Houston, TX, USA). The total concentration of a specific chemical was calculated via Equation (4).
C = C 1 W 1 + C 2 W 2 W 1 + W 2
where C is the concentration (g/g) of a quantified chemical, which was then used to calculate the conversion or selectivity, C1 and C2 are the concentrations of that chemical in the sample collected from the 1st and 2nd condensation stage, respectively, and W1 and W2 are the weight of the sample from the 1st and 2nd condensation stage, respectively.
The GC-FID inlet temperature was set at 240 °C, and the developed GC oven temperature program is also shown in Figure 1 and described herein. The oven temperature was initially maintained at 35 °C (the set point) for 5 min, ramped up to 135 °C at a rate of 20 °C/min, maintained at 135 °C for 5 min, ramped up to 240 °C at a rate of 20 °C/min, and maintained at 240 °C for 5 min. All the products were well separated with this temperature program. Figure 2 shows a typical GC chromatogram of the collected samples from the 1st condensation stage (A) and the 2nd condensation stage (B). Standard calibration curves were obtained using external standards for the major product of acrolein, the major byproduct of acetol, the undesirable byproducts of acetaldehyde and propionaldehyde, and residual glycerol. An internal calibration method was also developed using butanol as the internal standard, and the internal calibration was only performed periodically to ensure the performance of the external calibration method.
The following kinetic parameters were used to evaluate the catalytic performance, and the corresponding calculations are shown in Equations (5)−(8).
X g l y c e r o l = n r e a c t e d n f e e d × 100 % = n f e e d n q u a n t i f i e d n f e e d × 100 %
where Xglycerol is glycerol conversion (mol%), nreacted is the moles of glycerol reacted, nfeed is the moles of glycerol in the feed, and nquantified is the remaining glycerol in the collected sample quantified by GC-FID.
Y a c r o l e i n = n a c r o l e i n n f e e d × 100 %
where Yacrolein is the yield of acrolein (mol%), nacrolein is the moles of acrolein in the sample, and nfeed is the moles of glycerol in the feed.
Major product selectivity to acrolein (mol%), or the selectivity to any of the quantified byproducts and residual glycerol, was calculated via Equation (7).
S p r o d u c t = n c p r o d u c t n c g l y r e a c t e d × 100 %
where Sproduct is the selectivity to a specific product (mol%), nc-product is the moles of carbon in the specific product, and nc-gly-reacted is the moles of carbon in the converted glycerol.
Carbon balance (%) was calculated via Equation (8).
C % = 1 n ( C a r b o n u n r e a c t e d _ g l y c e r o l _ i + ( C a r b o n p r o d u c t ) i ) + W c o k e C a r b o n f e e d × 100 %
where n represents the total number of samples that were collected for each 7.5 h time-on-stream (TOS) kinetic run (a sample was collected every 1.5 h TOS); i denotes the ith sample; Carbonunreacted_glycerol_i is the carbon content, in the unit of g, of the unreacted glycerol in the ith sample; Carbonproduct is the carbon content (g) of a specific product (acrolein, acetaldehyde, propionaldehyde, or acetol) in a sample; Wcoke is the carbon content (g) in the coke accumulated over the 7.5 h TOS; and Carbonfeed is the total carbon content (g) injected over the 7.5 h TOS. As mentioned before, coke is a distribution of various carbonaceous species. It is almost impossible to know the exact carbon content of the coke, although carbon certainly accounts for the majority of the coke mass. In this study, the calculation of coke amount assumed that carbon accounted for all the catalyst weight gain.
Two kinetic runs were carried out for each of the three catalysts (HSiW-Si1252, HSiW-Si1254, and HSiW-Al) at 275 °C for 7.5 h TOS. Since no confounding effect between catalyst and reaction temperature has ever been reported, the results from the experiments at 275 °C should be sufficient to make an objective comparison and draw a valid conclusion regarding the effect of the catalyst support. This reaction temperature of 275 °C was selected based on our literature research [2] and calculations to ensure a gas-phase reaction for the two-component glycerol–water system (see Supplementary Materials). During the 7.5 h TOS for each run, samples were collected and analyzed every 1.5 h. The kinetic data presented in the results were the average of the last 6 h, unless specified otherwise. The sample collected at the first 1.5 h TOS for each run was excluded because of the concern that the catalytic reaction was not yet stabilized.

3. Results and Discussion

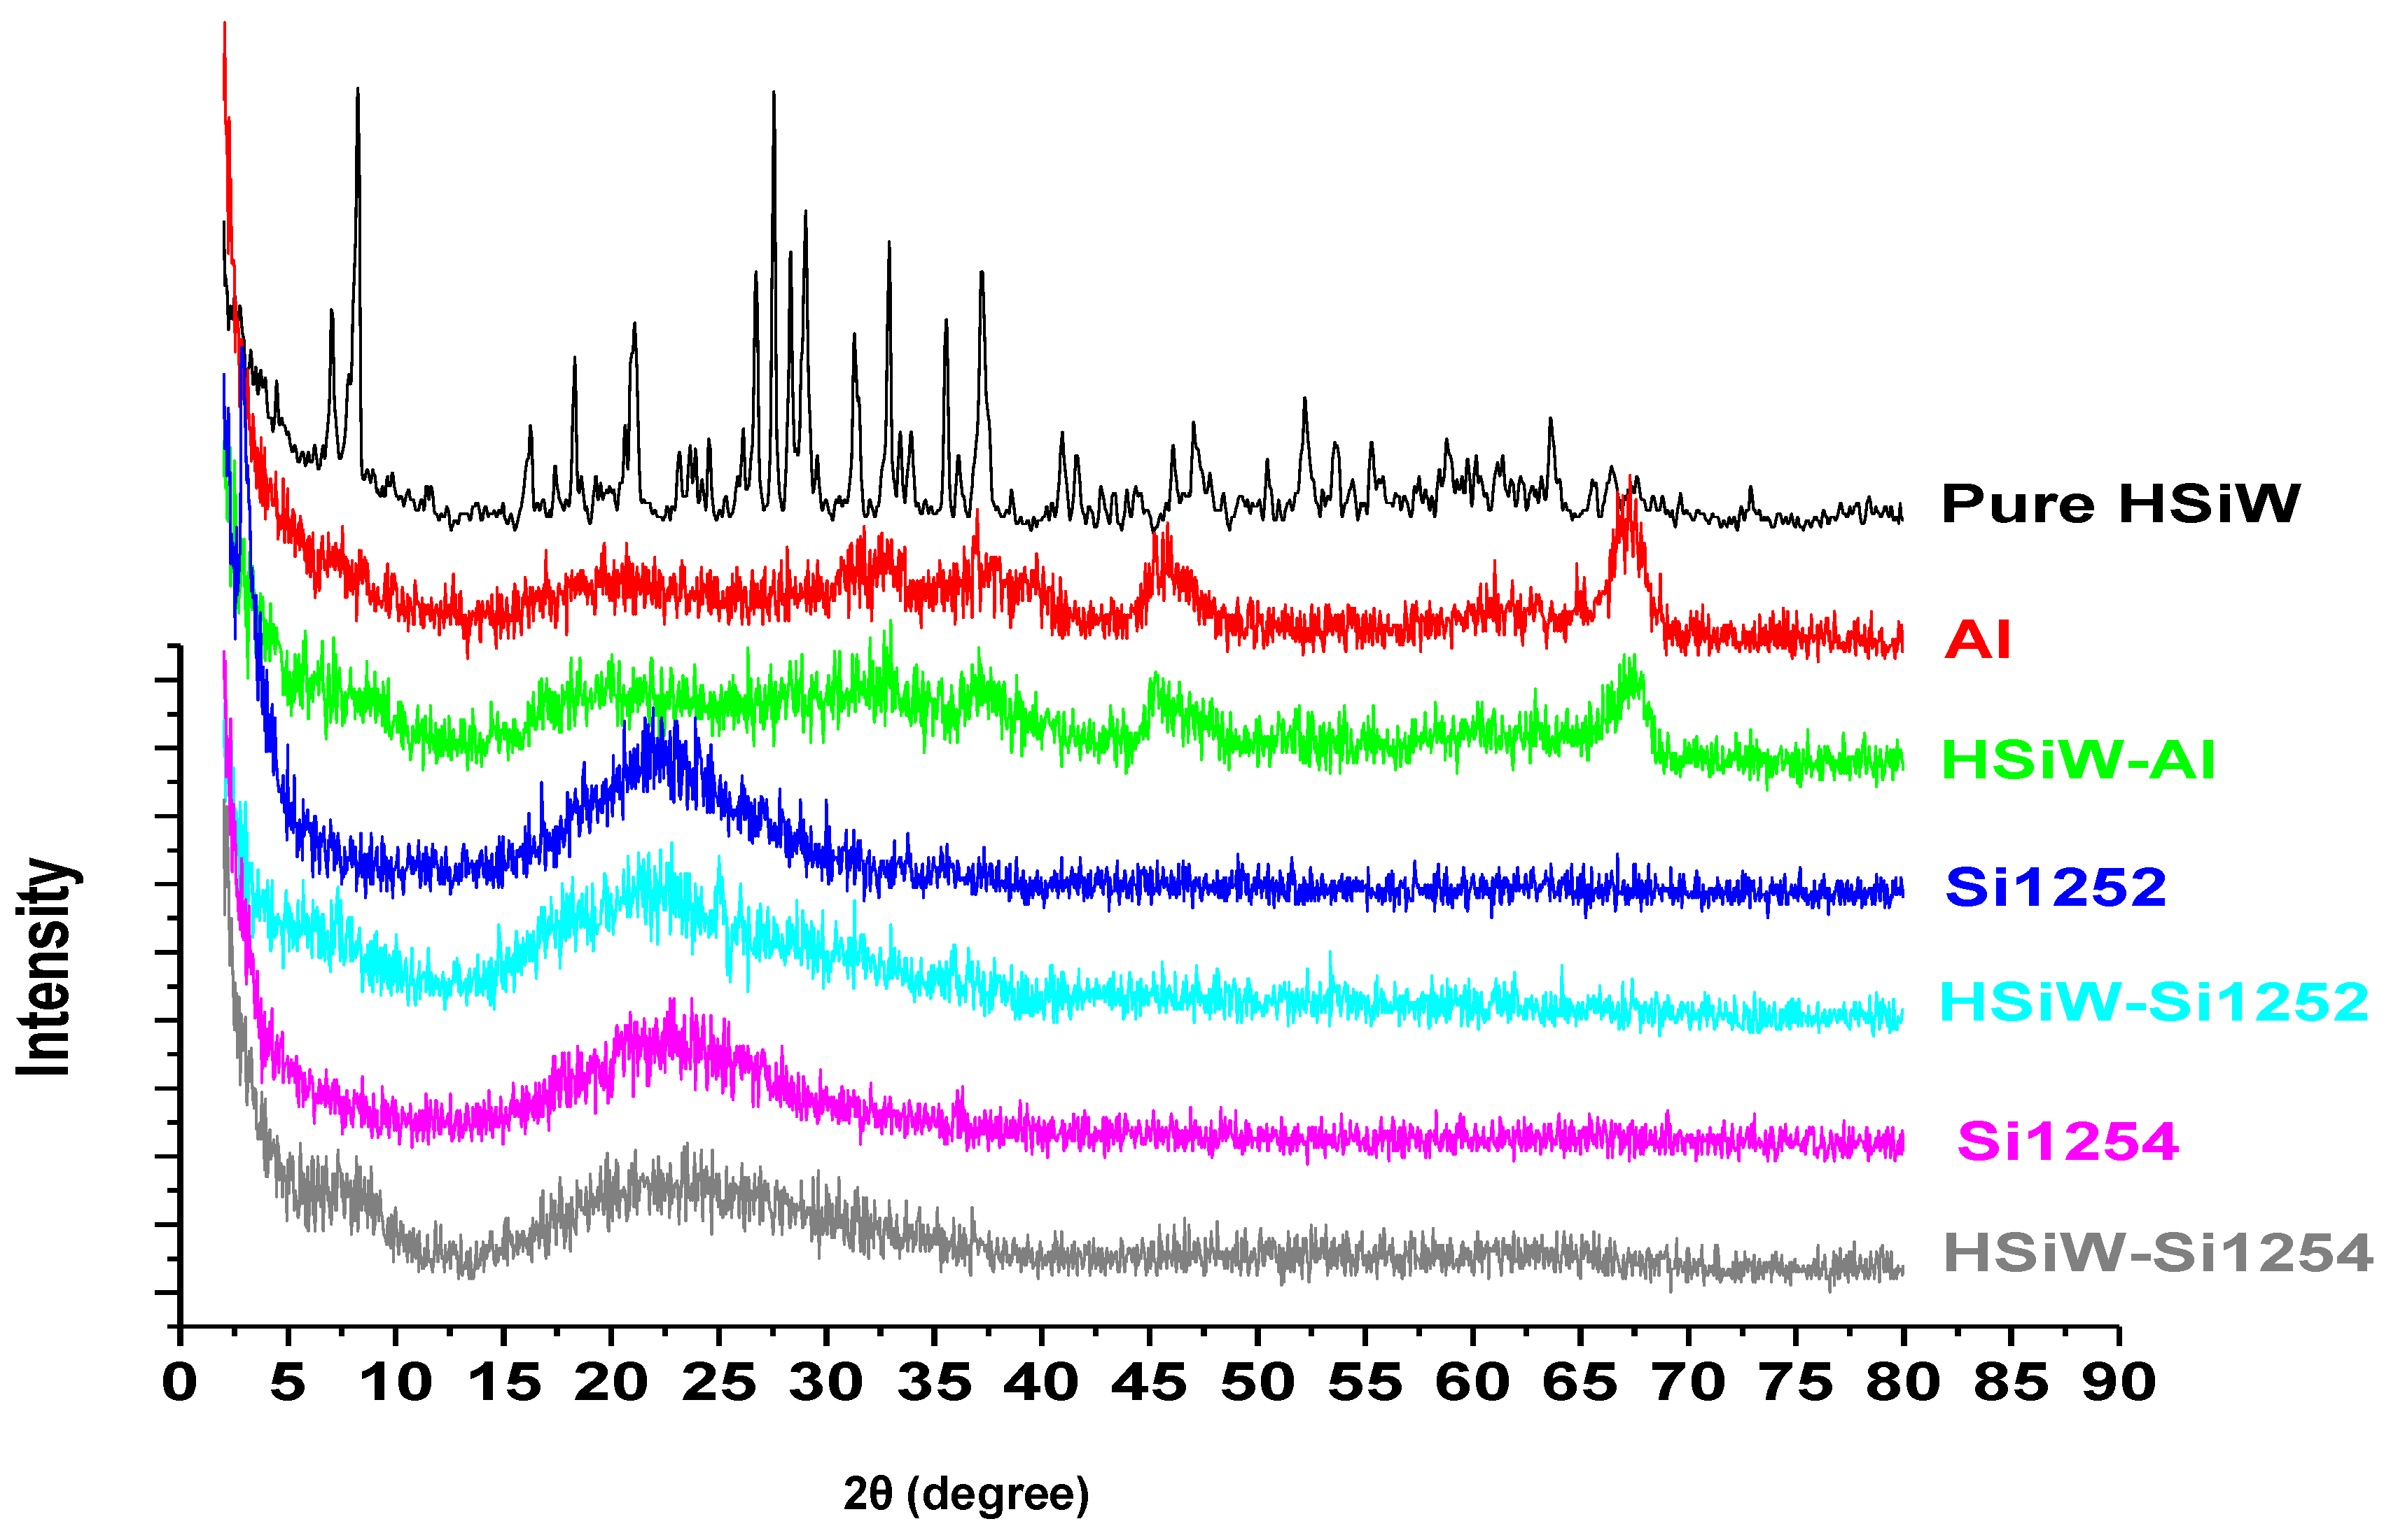
3.1. Characteristics of Fresh Catalysts

The measured BET surface area after HSiW loading was 300 ± 10 m2/g, 395 ± 10 m2/g, and 140 ± 3 m2/g for HSiW-Si1252, HSiW-Si1254, and HSiW-Al, respectively. Compared to the surface area of the corresponding support, the loss of the surface area was 23% for Si1252, 27% for Si1254, and 6.7% for Al2700 after acid loading.
Figure 3 presents the XRD results. Only broad peaks were observed for the alumina support, showing that the alumina is in an amorphous phase. There was a huge decline at low angles (<2°), which was likely due to an intensive signature peak. Unfortunately, because of the instrument limitation, lower angle XRD could not be performed. The peak around 1° is associated with mesoporous structures, which agreed with the fact that the alumina support used in the study was γ alumina [26]. HSiW loading did not introduce additional peaks, indicating that the HSiW was well dispersed on Al. Si1254 and Si1252 have similar XRD patterns except for that within the very small angle region, suggesting that both the silica supports are in an amorphous form with only pore size difference. The XRD patterns of silica supported catalysts were similar to that of the corresponding support, and no distinctive peaks assignable to HSiW was observed, suggesting that the HSiW was well dispersed on the surface of Si1252 and Si1254. The calculated surface coverage of HSiW (Equation (2)) was 0.191, 0.252 and 0.925 μmol/m2 for HSiW-Si1254, HSiW-Si1252, and HSiW-Al, respectively. The results showed that even with a high HSiW surface coverage (i.e., HSiW-Al, 0.925 μmol/m2), no crystalline structure of HSiW could be observed on the alumina-supported catalyst. This could be attributable to the strong interaction between the Al surface and HSiW, which forced the acid molecules to diffuse deeper into pores and localize evenly on the entire surface. Overall, the XRD patterns showed that HSiW was well dispersed on all the three supports.
Figure 4 shows the NH3-TPD profiles for HSiW-Al, HSiW-Si1252, and HSiW-Si1254. On a TPD graph, the Y-axis is the TCD signal intensity, positively correlated to the number of acid sites with certain acid strength, which is indicated by the position at the X-axis. Higher temperatures on the X-axis is associated with stronger acid strength. Therefore, from a TPD profile, one can infer the relative amount of different acid sites. The gaseous base (NH3) molecules adsorbed on a strong acid site are more difficult to desorb than those adsorbed on a weak acid site. As the temperature increases along the program, NH3 previously adsorbed on a stronger site is evacuated, and detected by TCD. Both HSiW-Si1252 and HSiW-Si1254 showed a relatively larger amount of strong acid sites (the region above 550 °C) than HSiW-Al, although the acid loading was 30 wt.% on Al2700 and only 20 wt.% on Si1252 and Si1254. A possible reason is that alumina has some basicity; the strong interaction between Al2700 support and the acid caused partial distortion of HSiW, which in turn resulted in some acidity loss. On the contrary, silica has no surface basicity and very weak acidity [27]; therefore, it did not strongly interact with HSiW and did not cause as much HSiW distortion as alumina [12,16]. HSiW-Al had a relatively larger amount of weaker acid sites (the region between 200 °C−500 °C) than the two silica-supported catalysts.

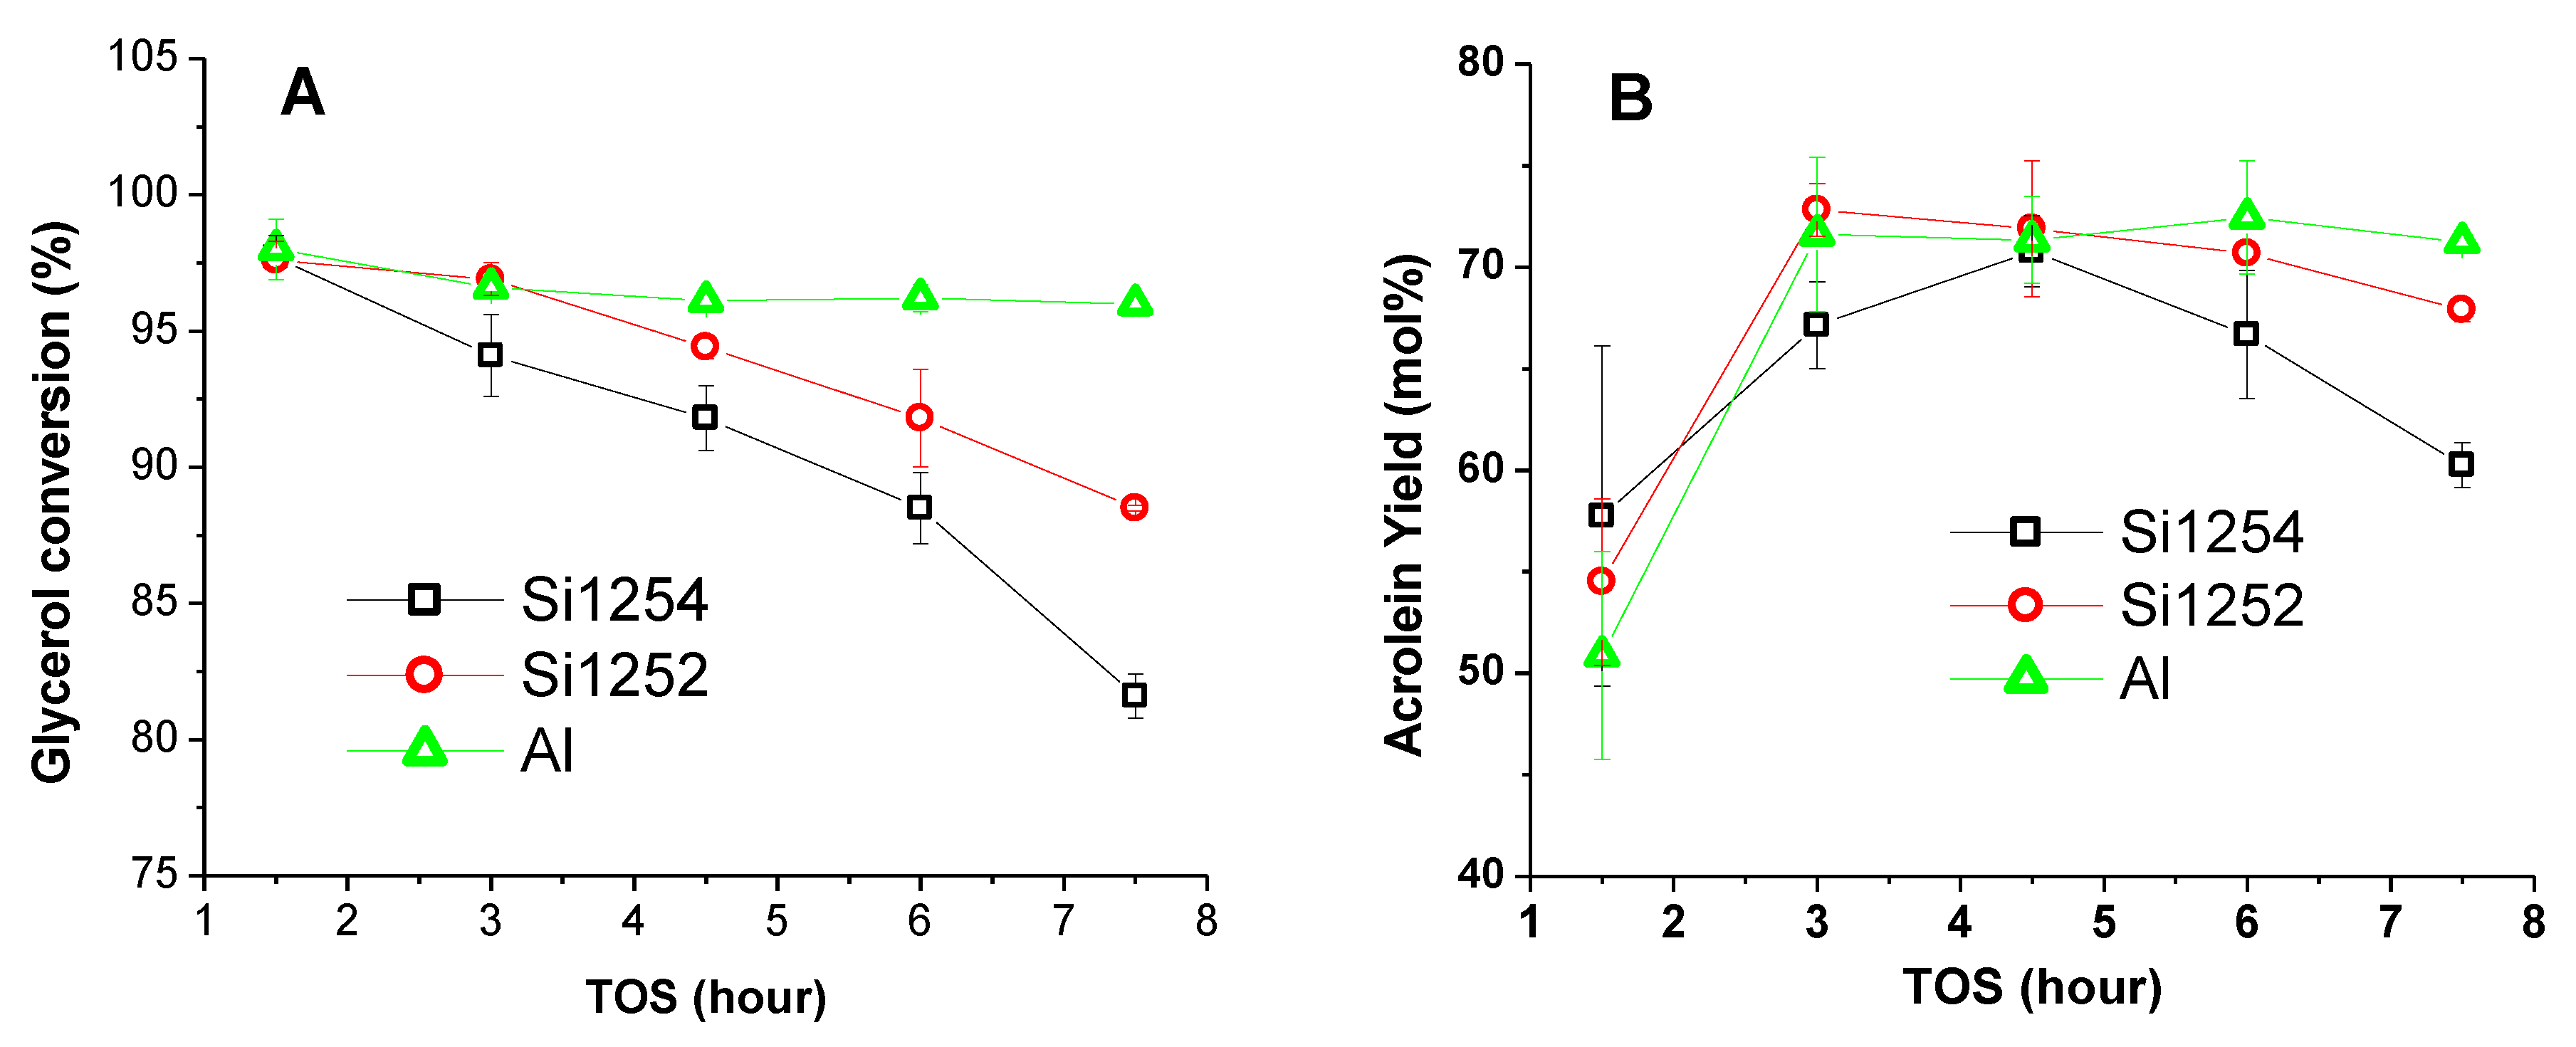
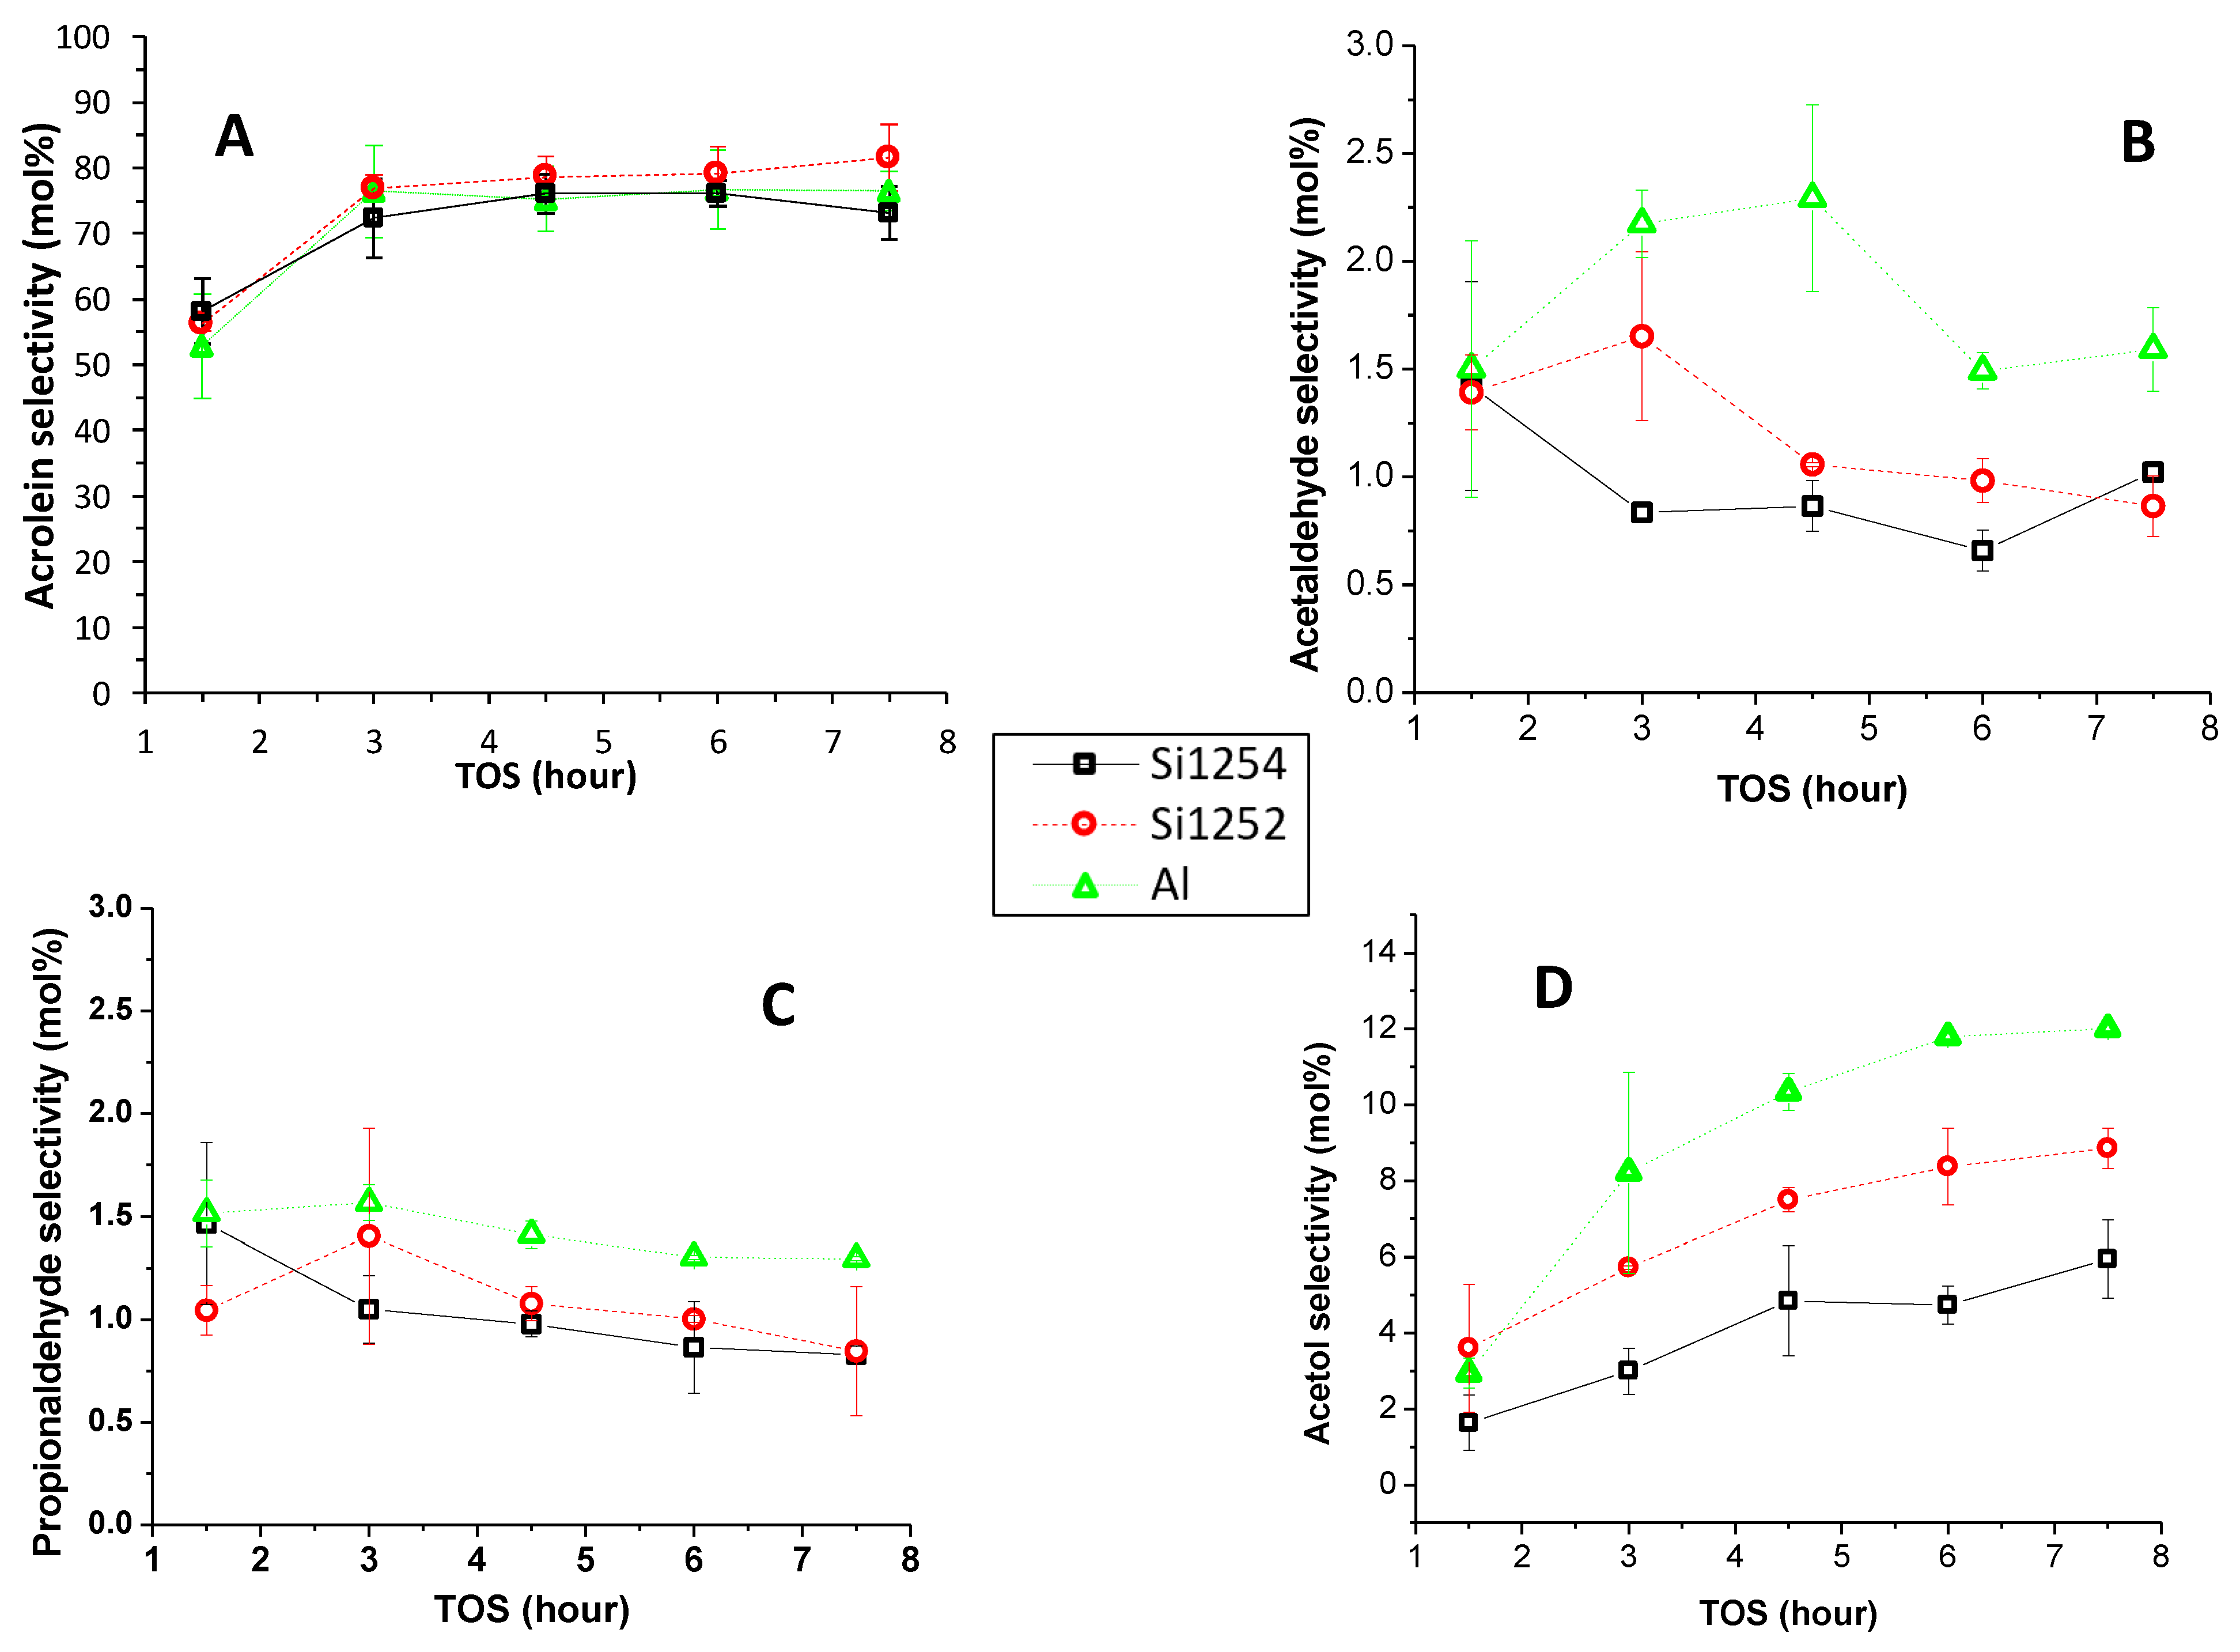
3.2. Comparative Catalyst Performance

Table 2 summarizes the catalytic performance of HSiW loaded onto the alumina and silica supports with different sizes of mesopores. The result shows that initially all the catalysts were able to reach good conversion (≥98 mol%) (the number in parenthesis in Table 2) at 1.5 h time-on-stream (TOS), but the average glycerol conversion descended in the order of HSiW-Al > HSiW-Si1252 > HSiW-Si1254. This decrease in glycerol conversion was caused by the catalyst deactivation, which is positively correlated with the amount of coke formation, as shown in Table 2. HSiW-Si1254 had the most severe coke formation after 7.5 h TOS (19.4 wt.%), which was more than double that of HSiW-Al (8.7 wt.%).
Selectivity to the desired major product of acrolein descended in the order of HSiW-Si1252 > HSiW-Al > HSiW-Si1254. Collectively, HSiW-Al and HSiW-Si1252 provided similar average acrolein yield over the 7.5 h TOS with 74.1 mol% for HSiW-Al and 73.9 mol% for HSiW-Si1252, while HSiW-Si1254 only reached the average acrolein yield of 66.2 mol%. Further, HSiW-Al had the highest selectivity to the byproducts of acetaldehyde, propionaldehyde, and acetol, while HSiW-Si1254 had the least. Acetol was the major byproduct with a selectivity up to 11.6 mol% in the case of HSiW-Al, which could be regarded as a co-product, considering the ease of separation of acetol from acrolein due to the large difference between their boiling points (as is evident in Figure 2, acetol was totally separated in the 1st condensation stage). The selectivity towards acetaldehyde and propionaldehyde (whose boiling point is very close to acrolein) was small in all the cases (<2 mol%); thus, the two could be considered as undesirable byproducts that should be minimized to facilitate downstream separation.
The decreasing trend in glycerol conversion over the TOS was observed for the two silica-supported catalysts, but was not obvious for HSiW-Al (Figure 5). The glycerol conversion of HSiW-Si1254 decreased faster than that of HSiW-Si1252, indicating that HSiW-Si1254 deactivated faster than HSiW-Si1252, obviously because of the smaller mesopores of HSiW-Si1254. For all the three catalysts, acrolein selectivity remained relatively stable after 1.5 h TOS (Figure 6A); as a result, the acrolein yield along the time course had the similar trend as the glycerol conversion as shown in Figure 5. HSiW-Al provided a generally consistent and stable yield after 1.5 h TOS. In comparison, although HSiW-Si1252 afforded a stable and higher selectivity toward acrolein (Figure 6A), a decreasing trend of acrolein yield was observable, which was mainly attributed to the decreasing glycerol conversion along the TOS (Figure 5). The acrolein yield on HSiW-Si1254 was the least satisfactory, because of both the fastest conversion decrease along TOS and lowest acrolein selectivity among the three catalysts. Figure 5B and Figure 6A also justify why the first 1.5 h TOS was excluded in calculating the average kinetic data, because the catalysts had not yet stabilized.
There was no obvious trend in acetaldehyde selectivity as a function of TOS (Figure 6B), and there might be a subtle decreasing trend for the propionaldehyde selectivity (Figure 6C). Acetol selectivity clearly showed an increasing trend along TOS for all the catalysts, although the increase tended to level off at longer TOS (Figure 6D).

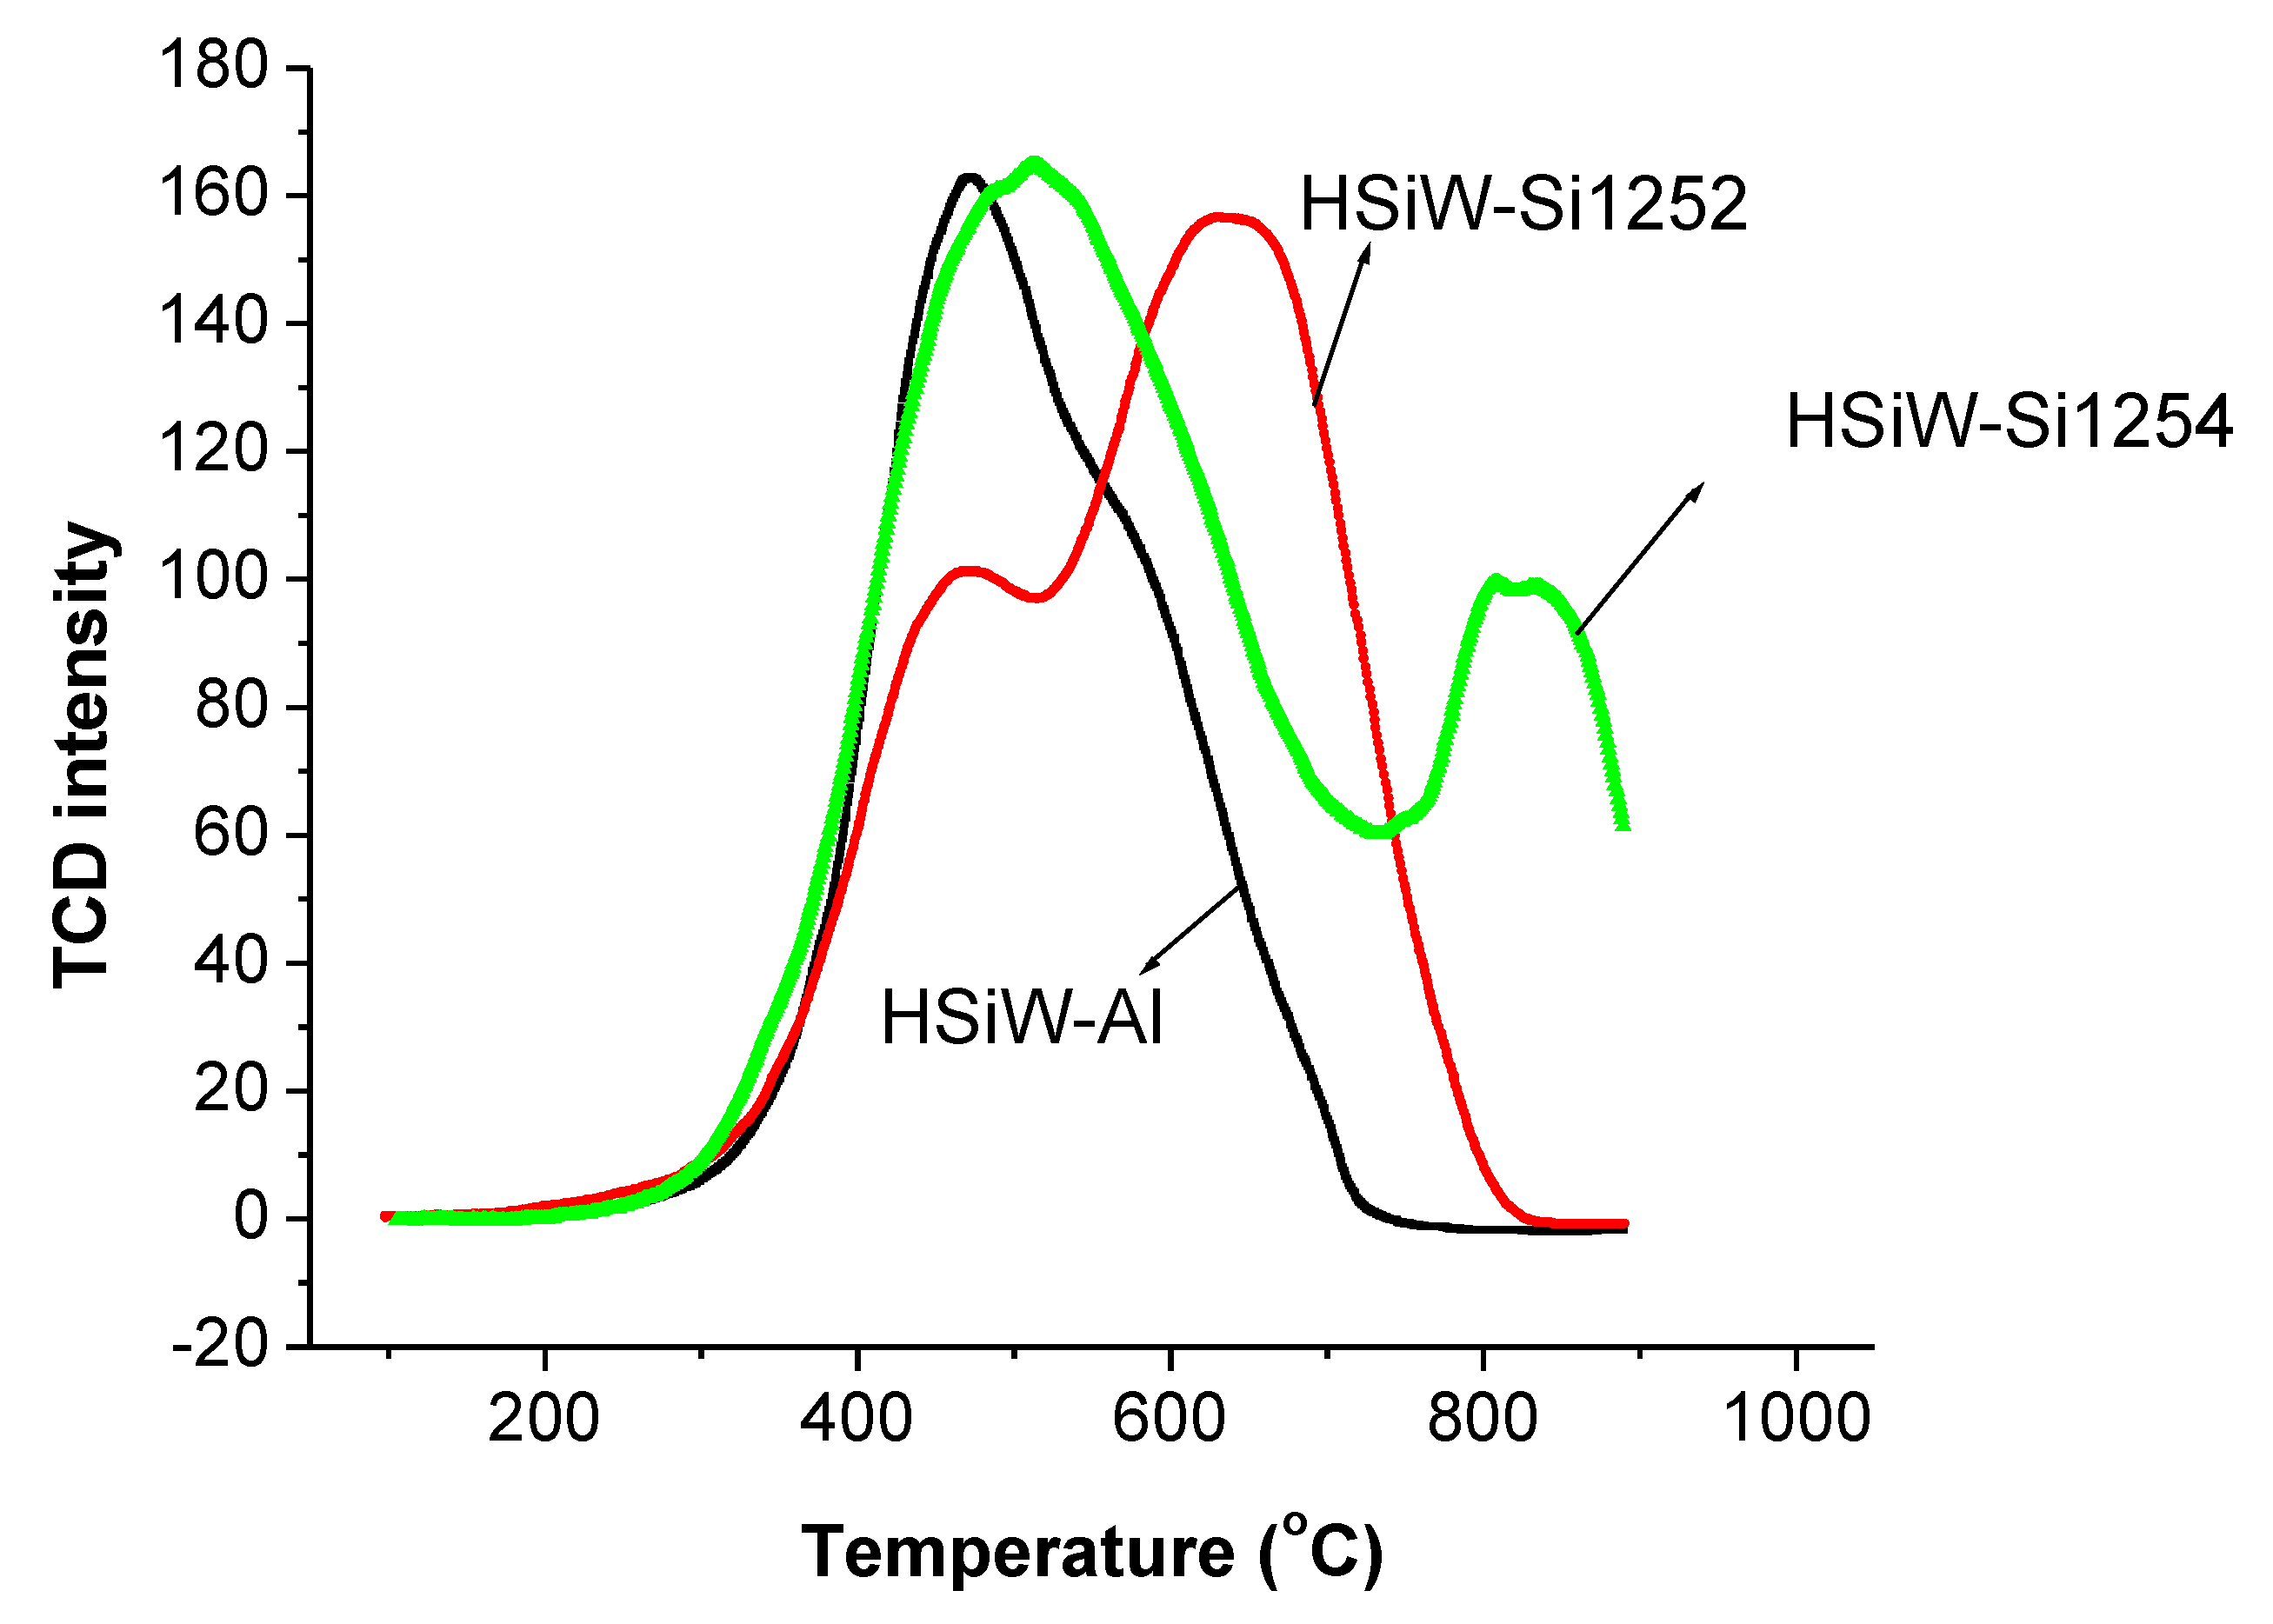
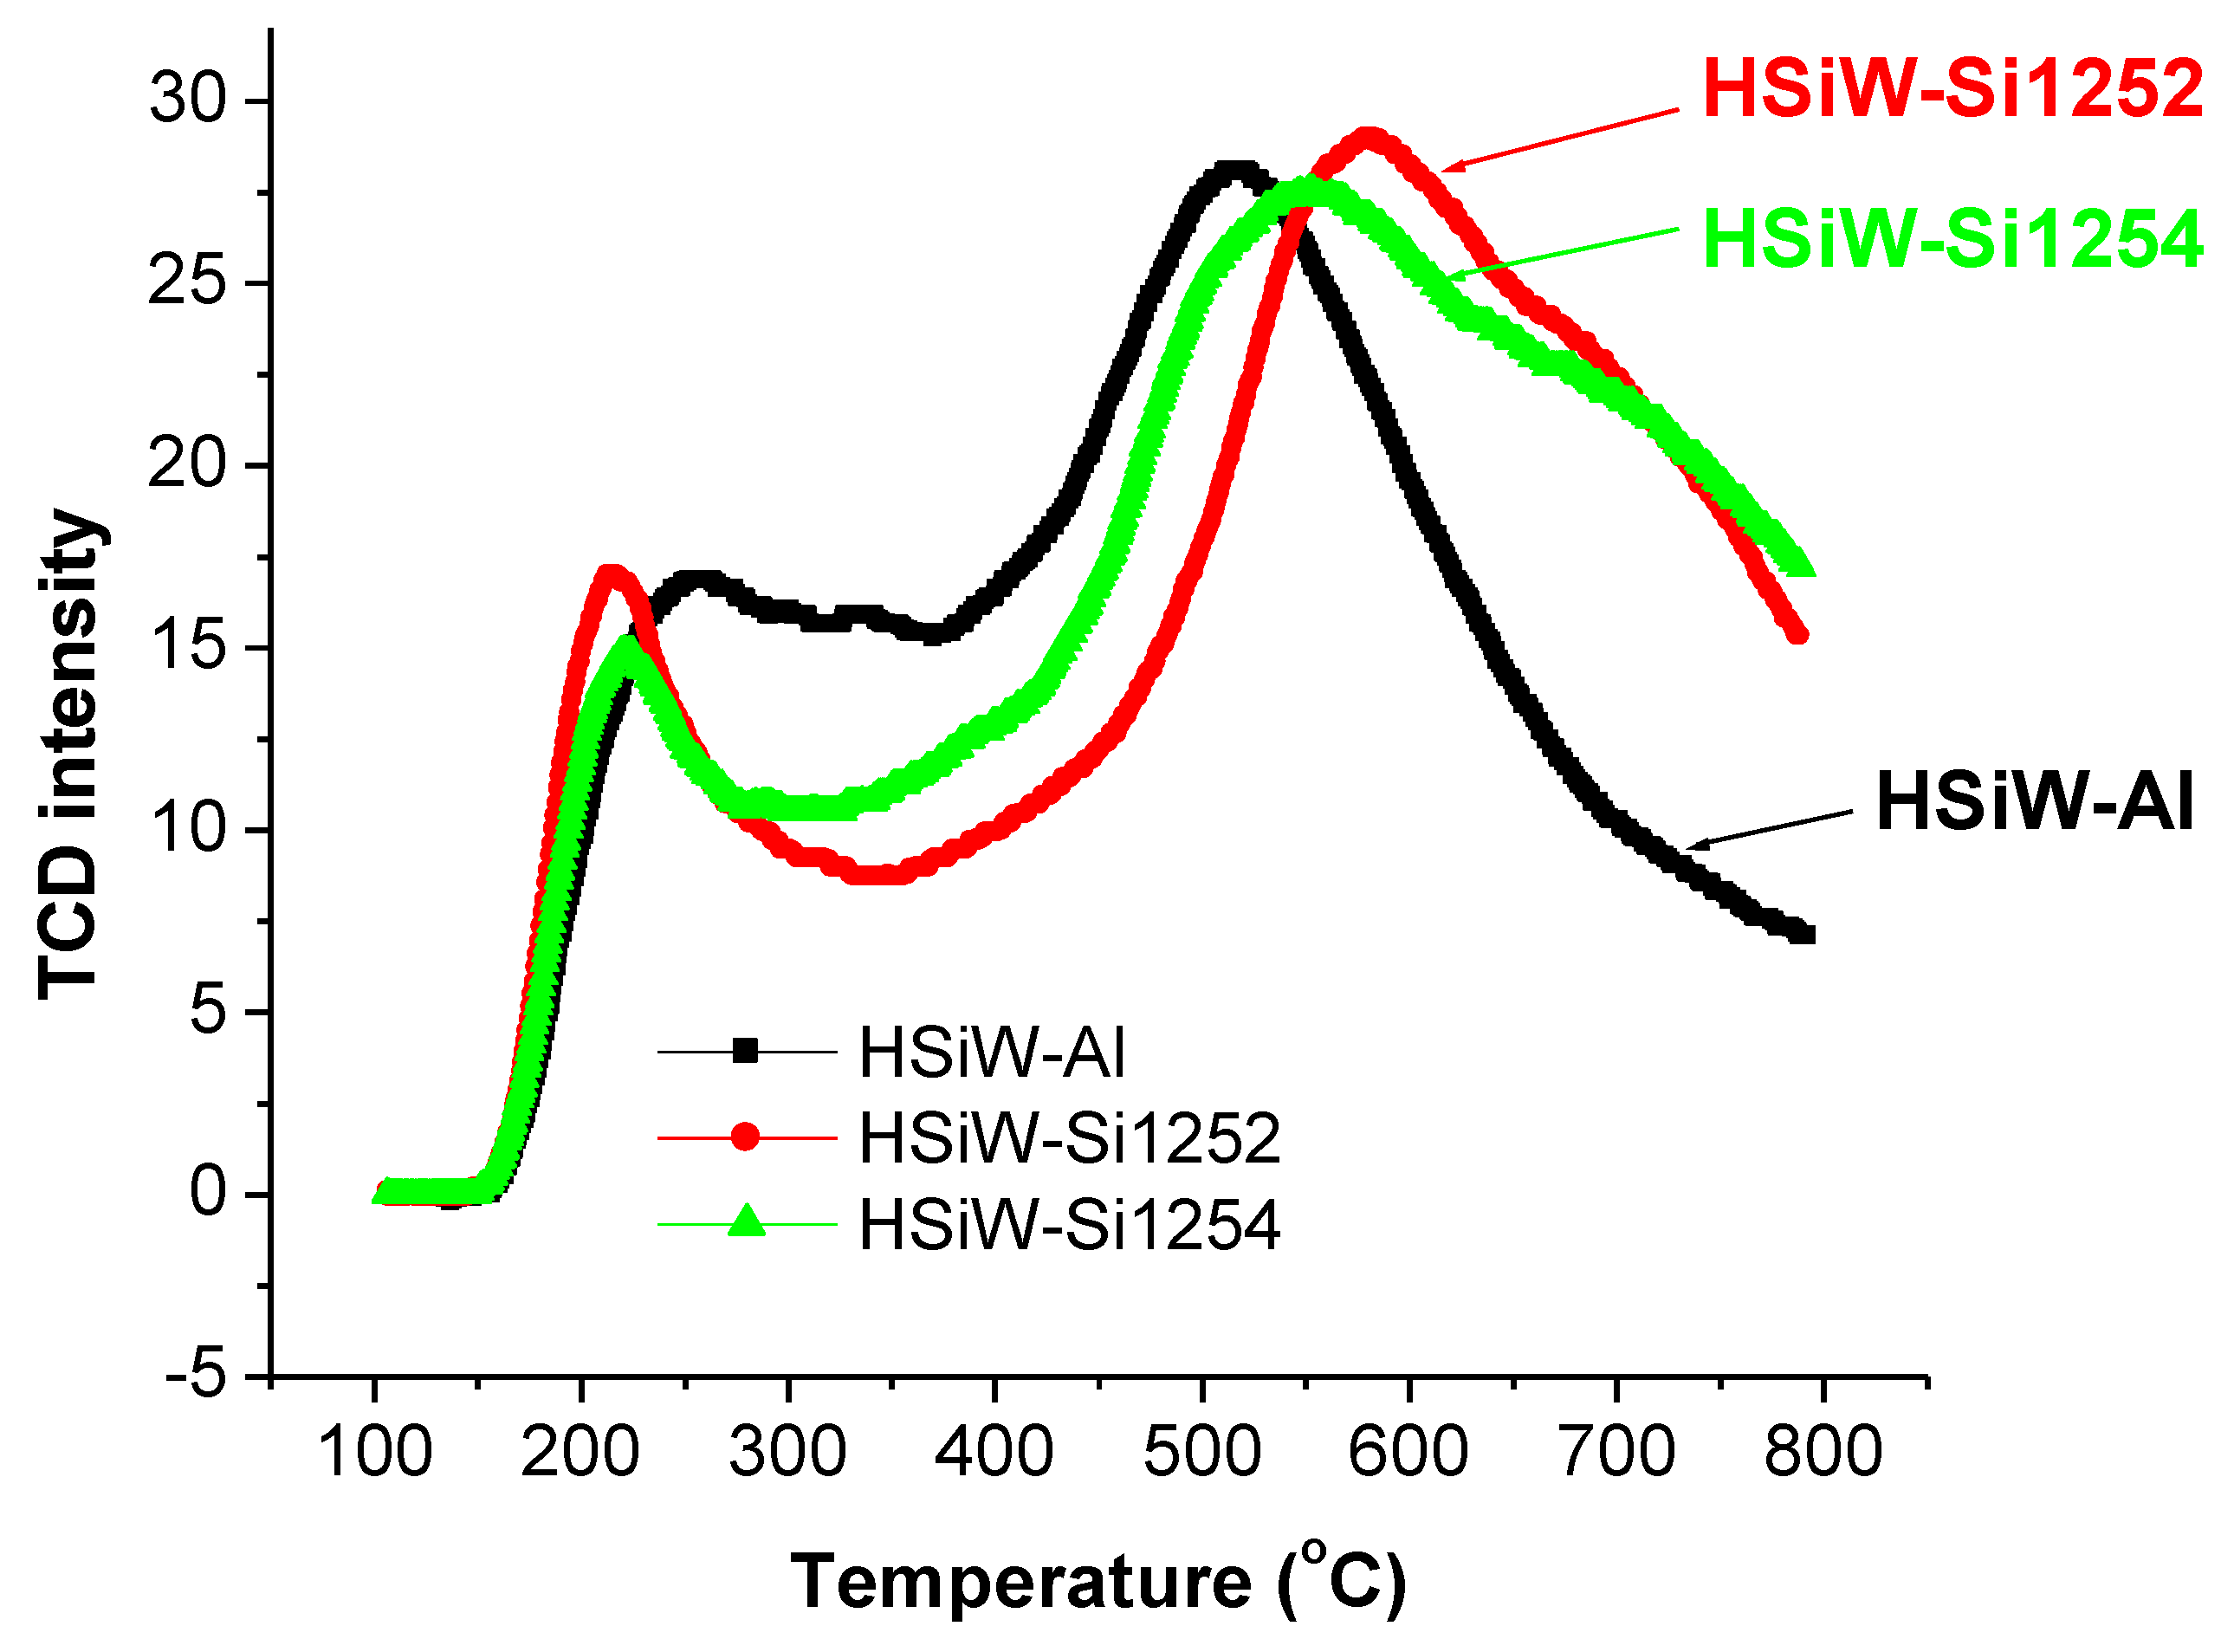
3.3. TPO Evaluation of Spent Catalysts

“Hard” and “soft” are often used to describe deposited carbonaceous species on the catalyst surface in relative terms. “Softer” coke has relatively smaller molecular size (lower degree of polymerization) and less structural complexity, while “harder” coke has larger molecular size and a more complex structure. Figure 7 shows the TPO results of the spent catalysts after 7.5 h TOS. In a TPO graph, the X-axis is heating temperature while the Y-axis is TCD signal that is related to the amount of a certain coke on the catalyst surface. Therefore, a point on a TPO graph indicates a relative amount (position on Y-axis) of the coke with certain degree of hardness (position on X-axis). The signal of harder coke locates at the higher temperature end of a TPO graph and vice versa. HSiW-Al showed only one peak in the lower temperature region (~480 °C); HSiW-Si1252 showed a small peak around 480 °C and a larger peak around 650 °C; HSiW-Si1254 showed a large peak around 520 °C, and a smaller peak around 850 °C. The TPO results well agree with the results of glycerol dehydration shown in Table 2: (1) HSiW-Al had the least coking and the coke was softer comparing to the two silica-supported HSiW; (2) as the worst performer among the three in catalytic glycerol dehydration, HSiW-Si1254 had the highest coking and the coke composition was more distributed toward the hard coke region (e.g., larger degree of polymerization, more complex, cross-linked structure, and higher hydrogen deficiency); (3) comparing with HSiW-Si1254, the larger mesopores in HSiW-Si1252 not only rendered better catalytic performance but also softer coke formation.
The size of glycerol molecule is 0.3−0.5 nm [28,29]. The average pore diameter of Si1254 is 6 nm, the smallest among the three catalyst supports. HSiW-Si1254 would have even smaller pores (the size of a HSiW molecule is 1.1 nm) [30]. Therefore, it is most likely that HSiW-Si1254 provided highest mass-transfer resistance [15]. During reaction, some glycerol molecules might have aggregated at the pore entrance, facilitating intermolecular condensation, forming linear, cyclic, and branched glycerol oligomers [31]. The further polymerization of the glycerol oligomers could be a significant contributor to coke formation [31]. Furthermore, with narrower pores, HSiW-Si1254 might suffer from desorption problem [32]—unreacted glycerol molecules that entered pores and the product molecules (e.g., acrolein) that formed in the pores might be more easily trapped inside smaller pores than larger pores. The trapped chemical compounds, most of which contained unsaturated bonds (such as those in acrolein and acetol), could undergo secondary condensation to form larger compounds, leading to coke after continuous polymerization [31]. The observation that the acrolein selectivity for HSiW-Si1254 consistently remained at a lower level compared to the other two catalysts (Table 2) might be because that undesired consumption of glycerol as well as acrolein for coke formation occurred as soon as the reaction started and continued for the duration of the reaction.
HSiW-Si1254 exhibited a faster drop in glycerol conversion than HSiW-Si1252 and HSiW-Al (Figure 5). A plausible explanation is provided as follows. When coke formed on the catalyst surface, it might deposit near the entrance of the catalyst pores, narrowing or completely blocking the pore entrance [33,34]. The blockage of the pore entrance would make all the active sites inside the pores inaccessible, significantly reducing the total number of the active sites. Consequently, the glycerol conversion suffered a significant decrease. HSiW-Si1254 had the smallest pores among the three catalysts; therefore, the likelihood of the occurrence of such a blockage was higher in HSiW-Si1254 compared to HSiW-Si1252 and HSiW-Al.

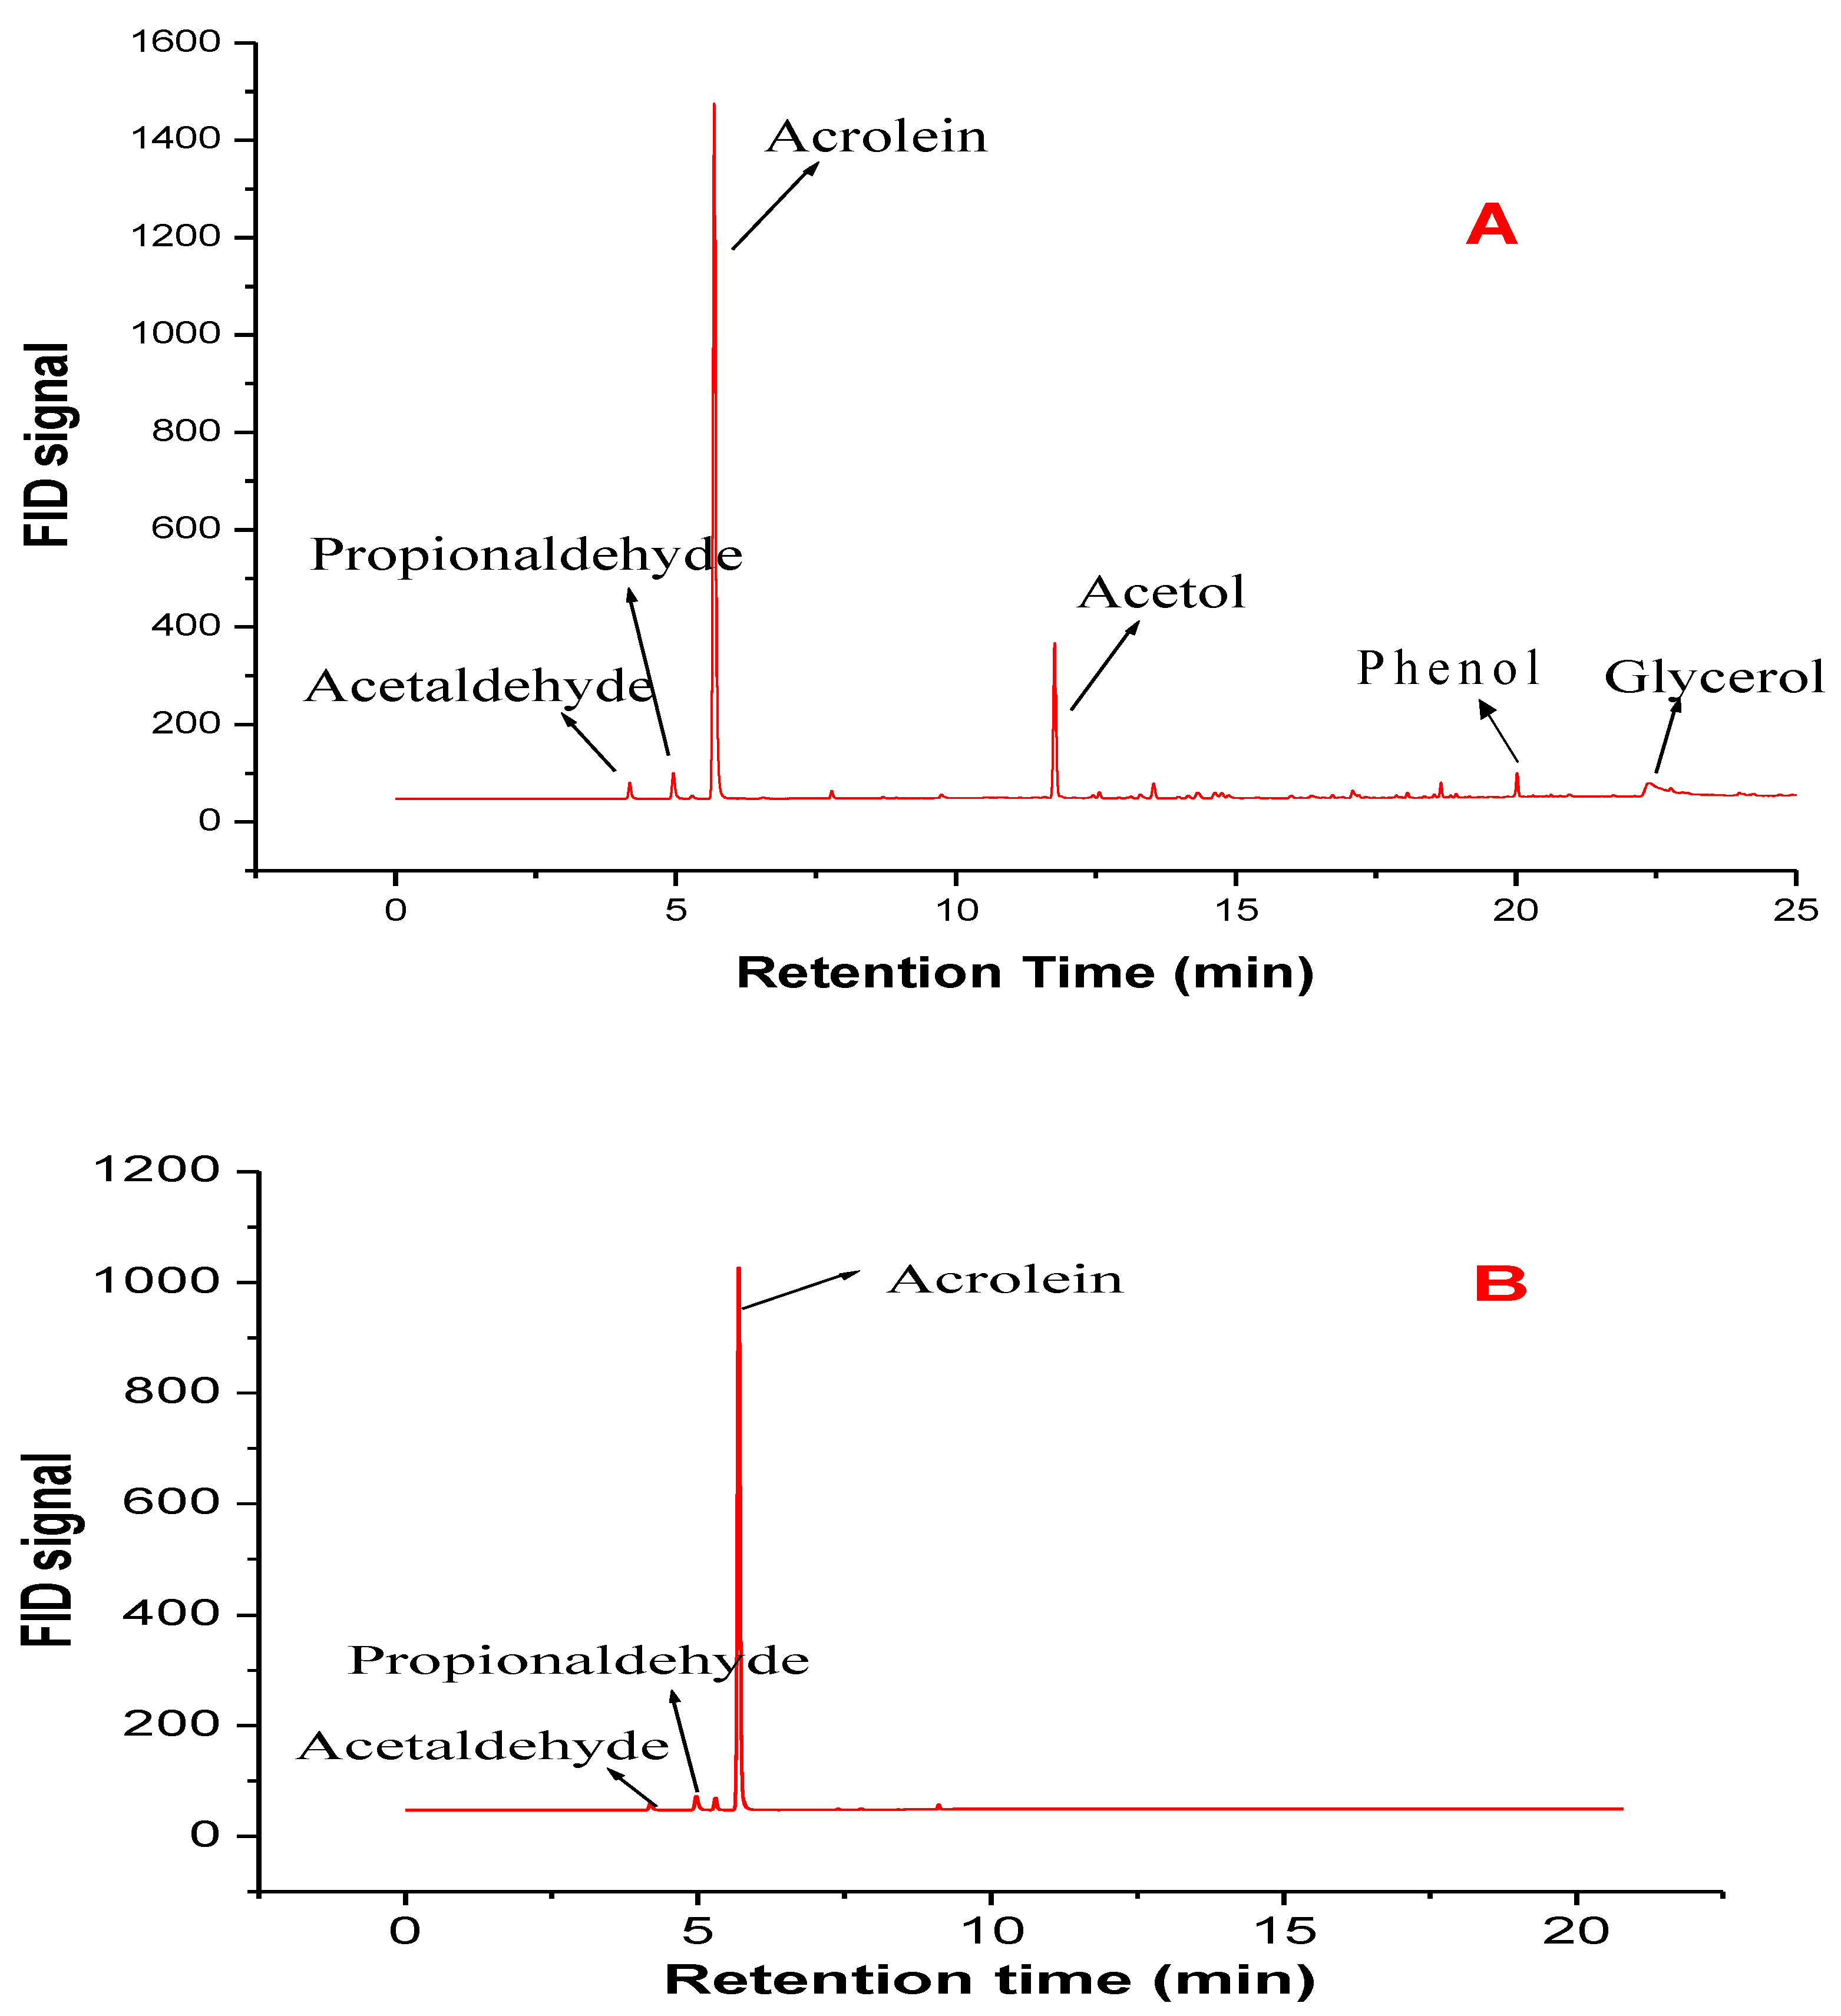
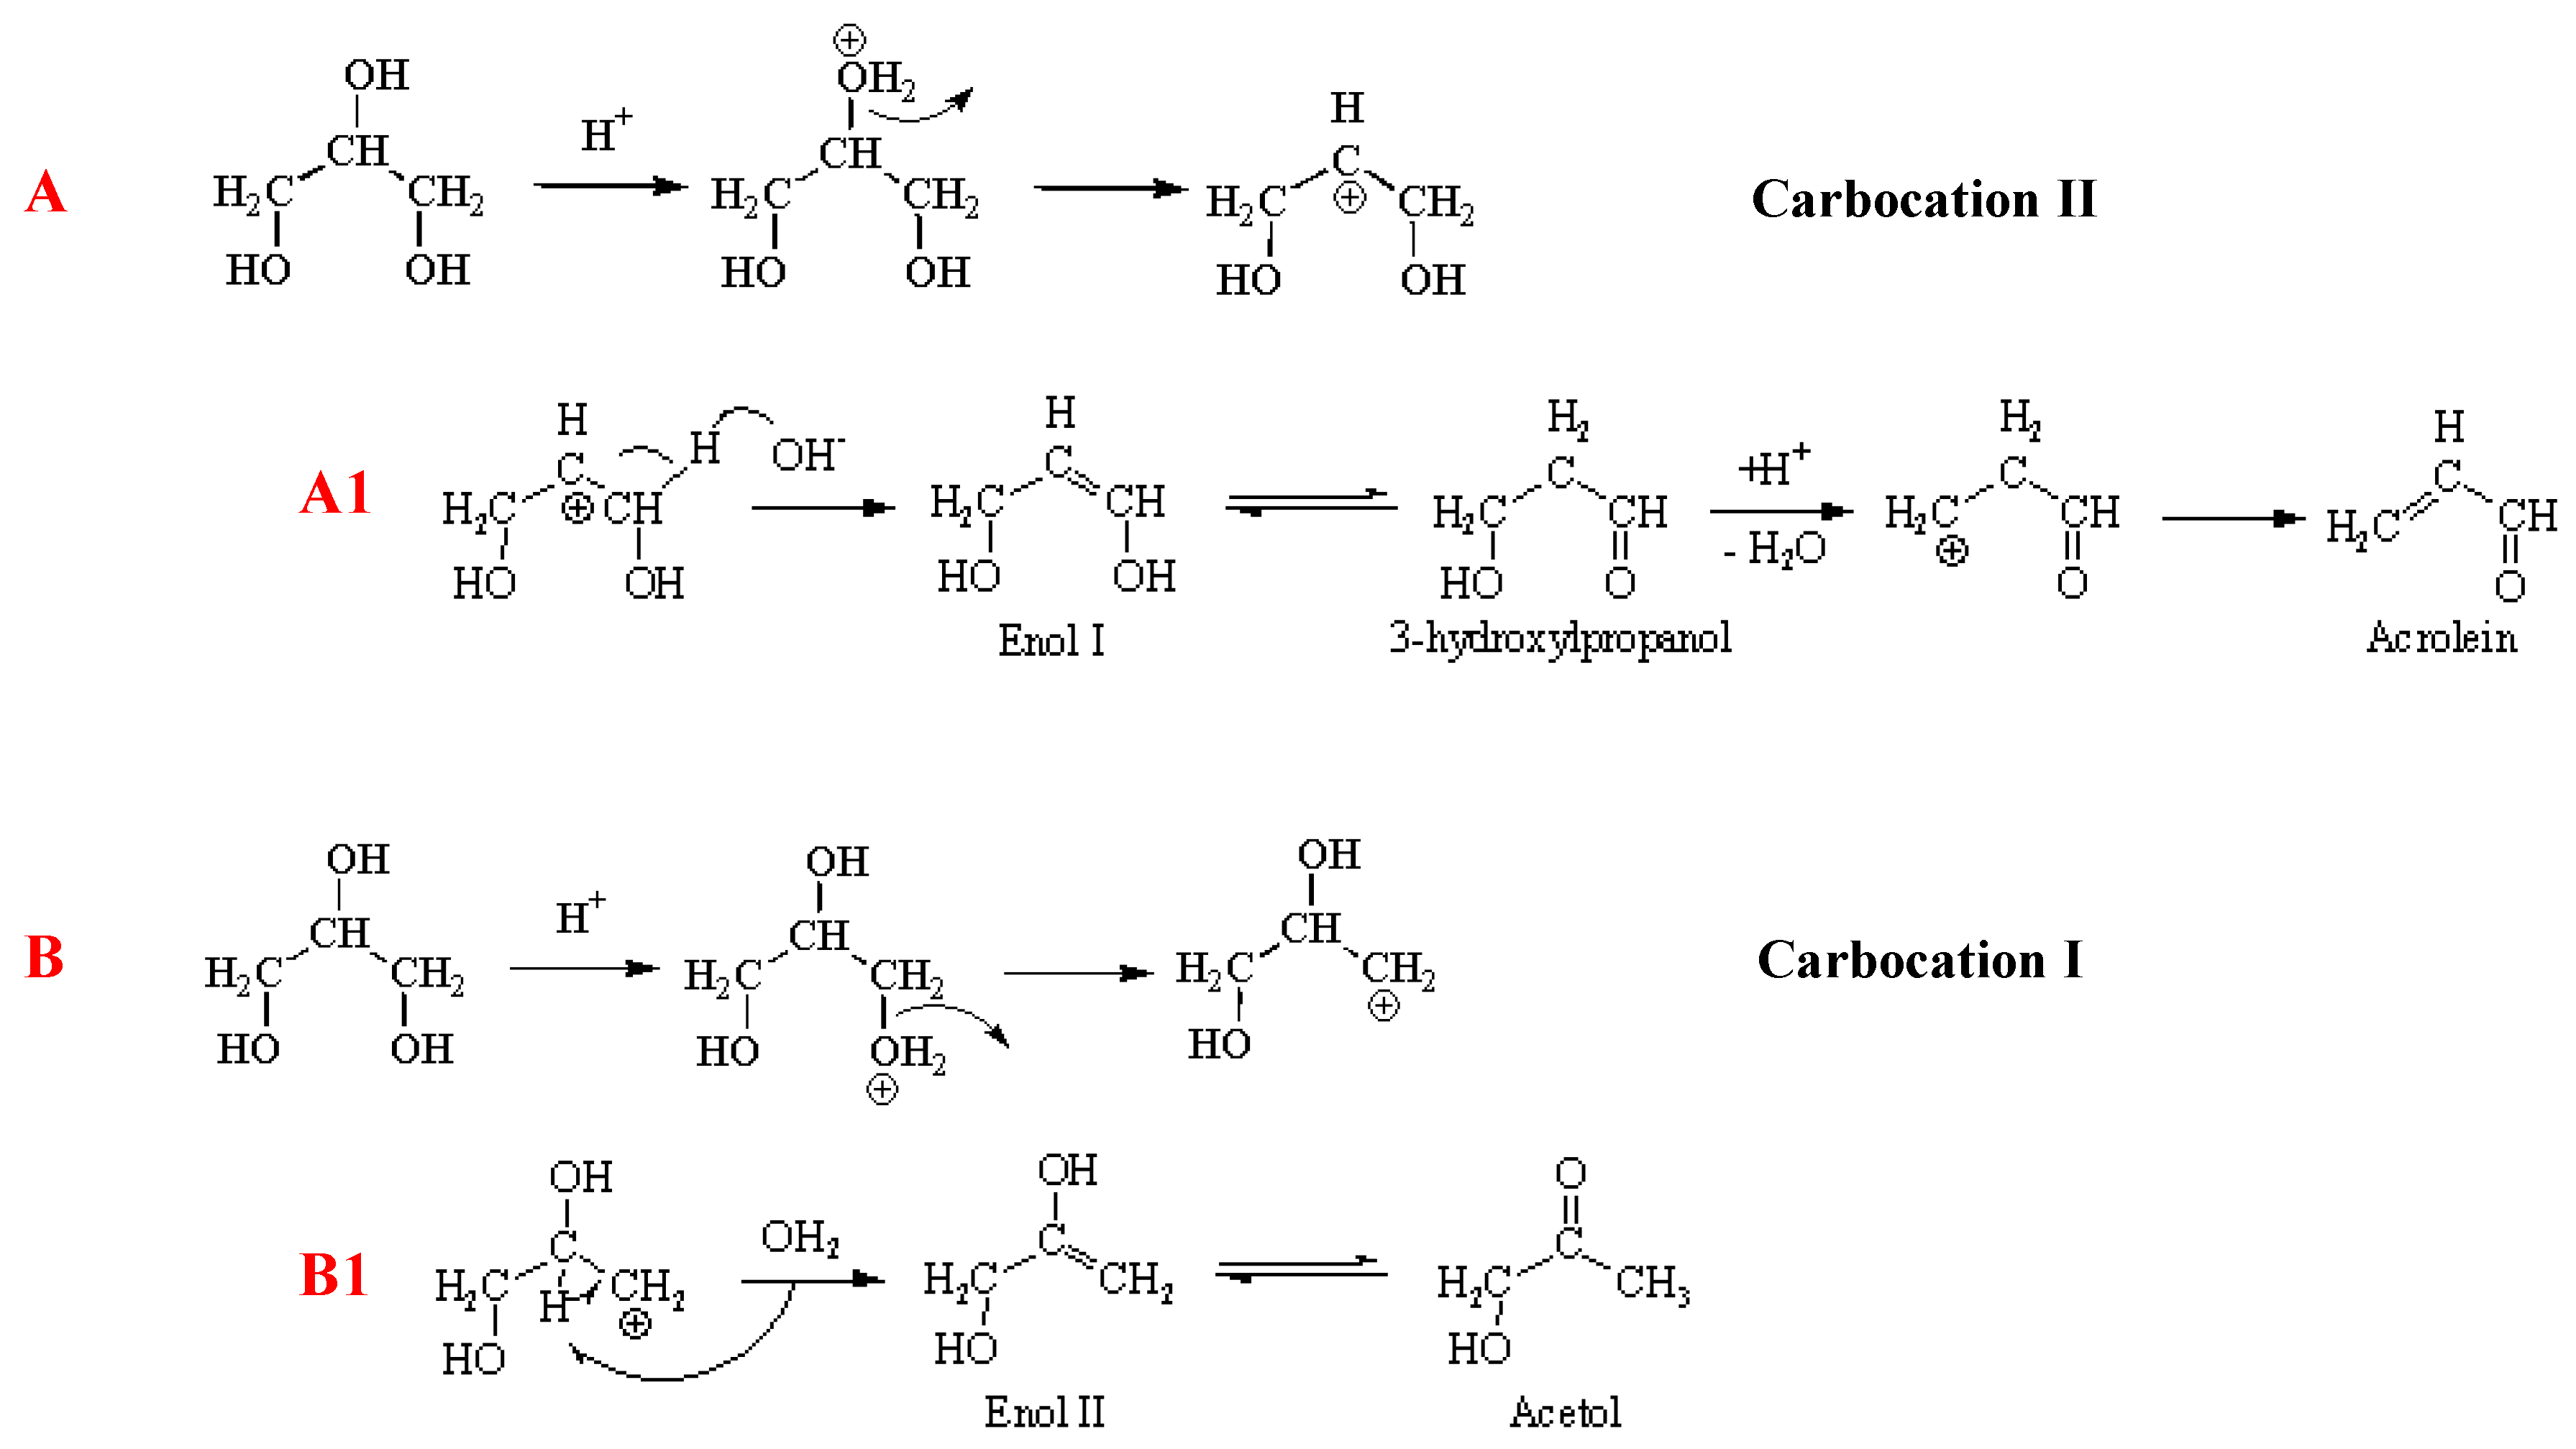
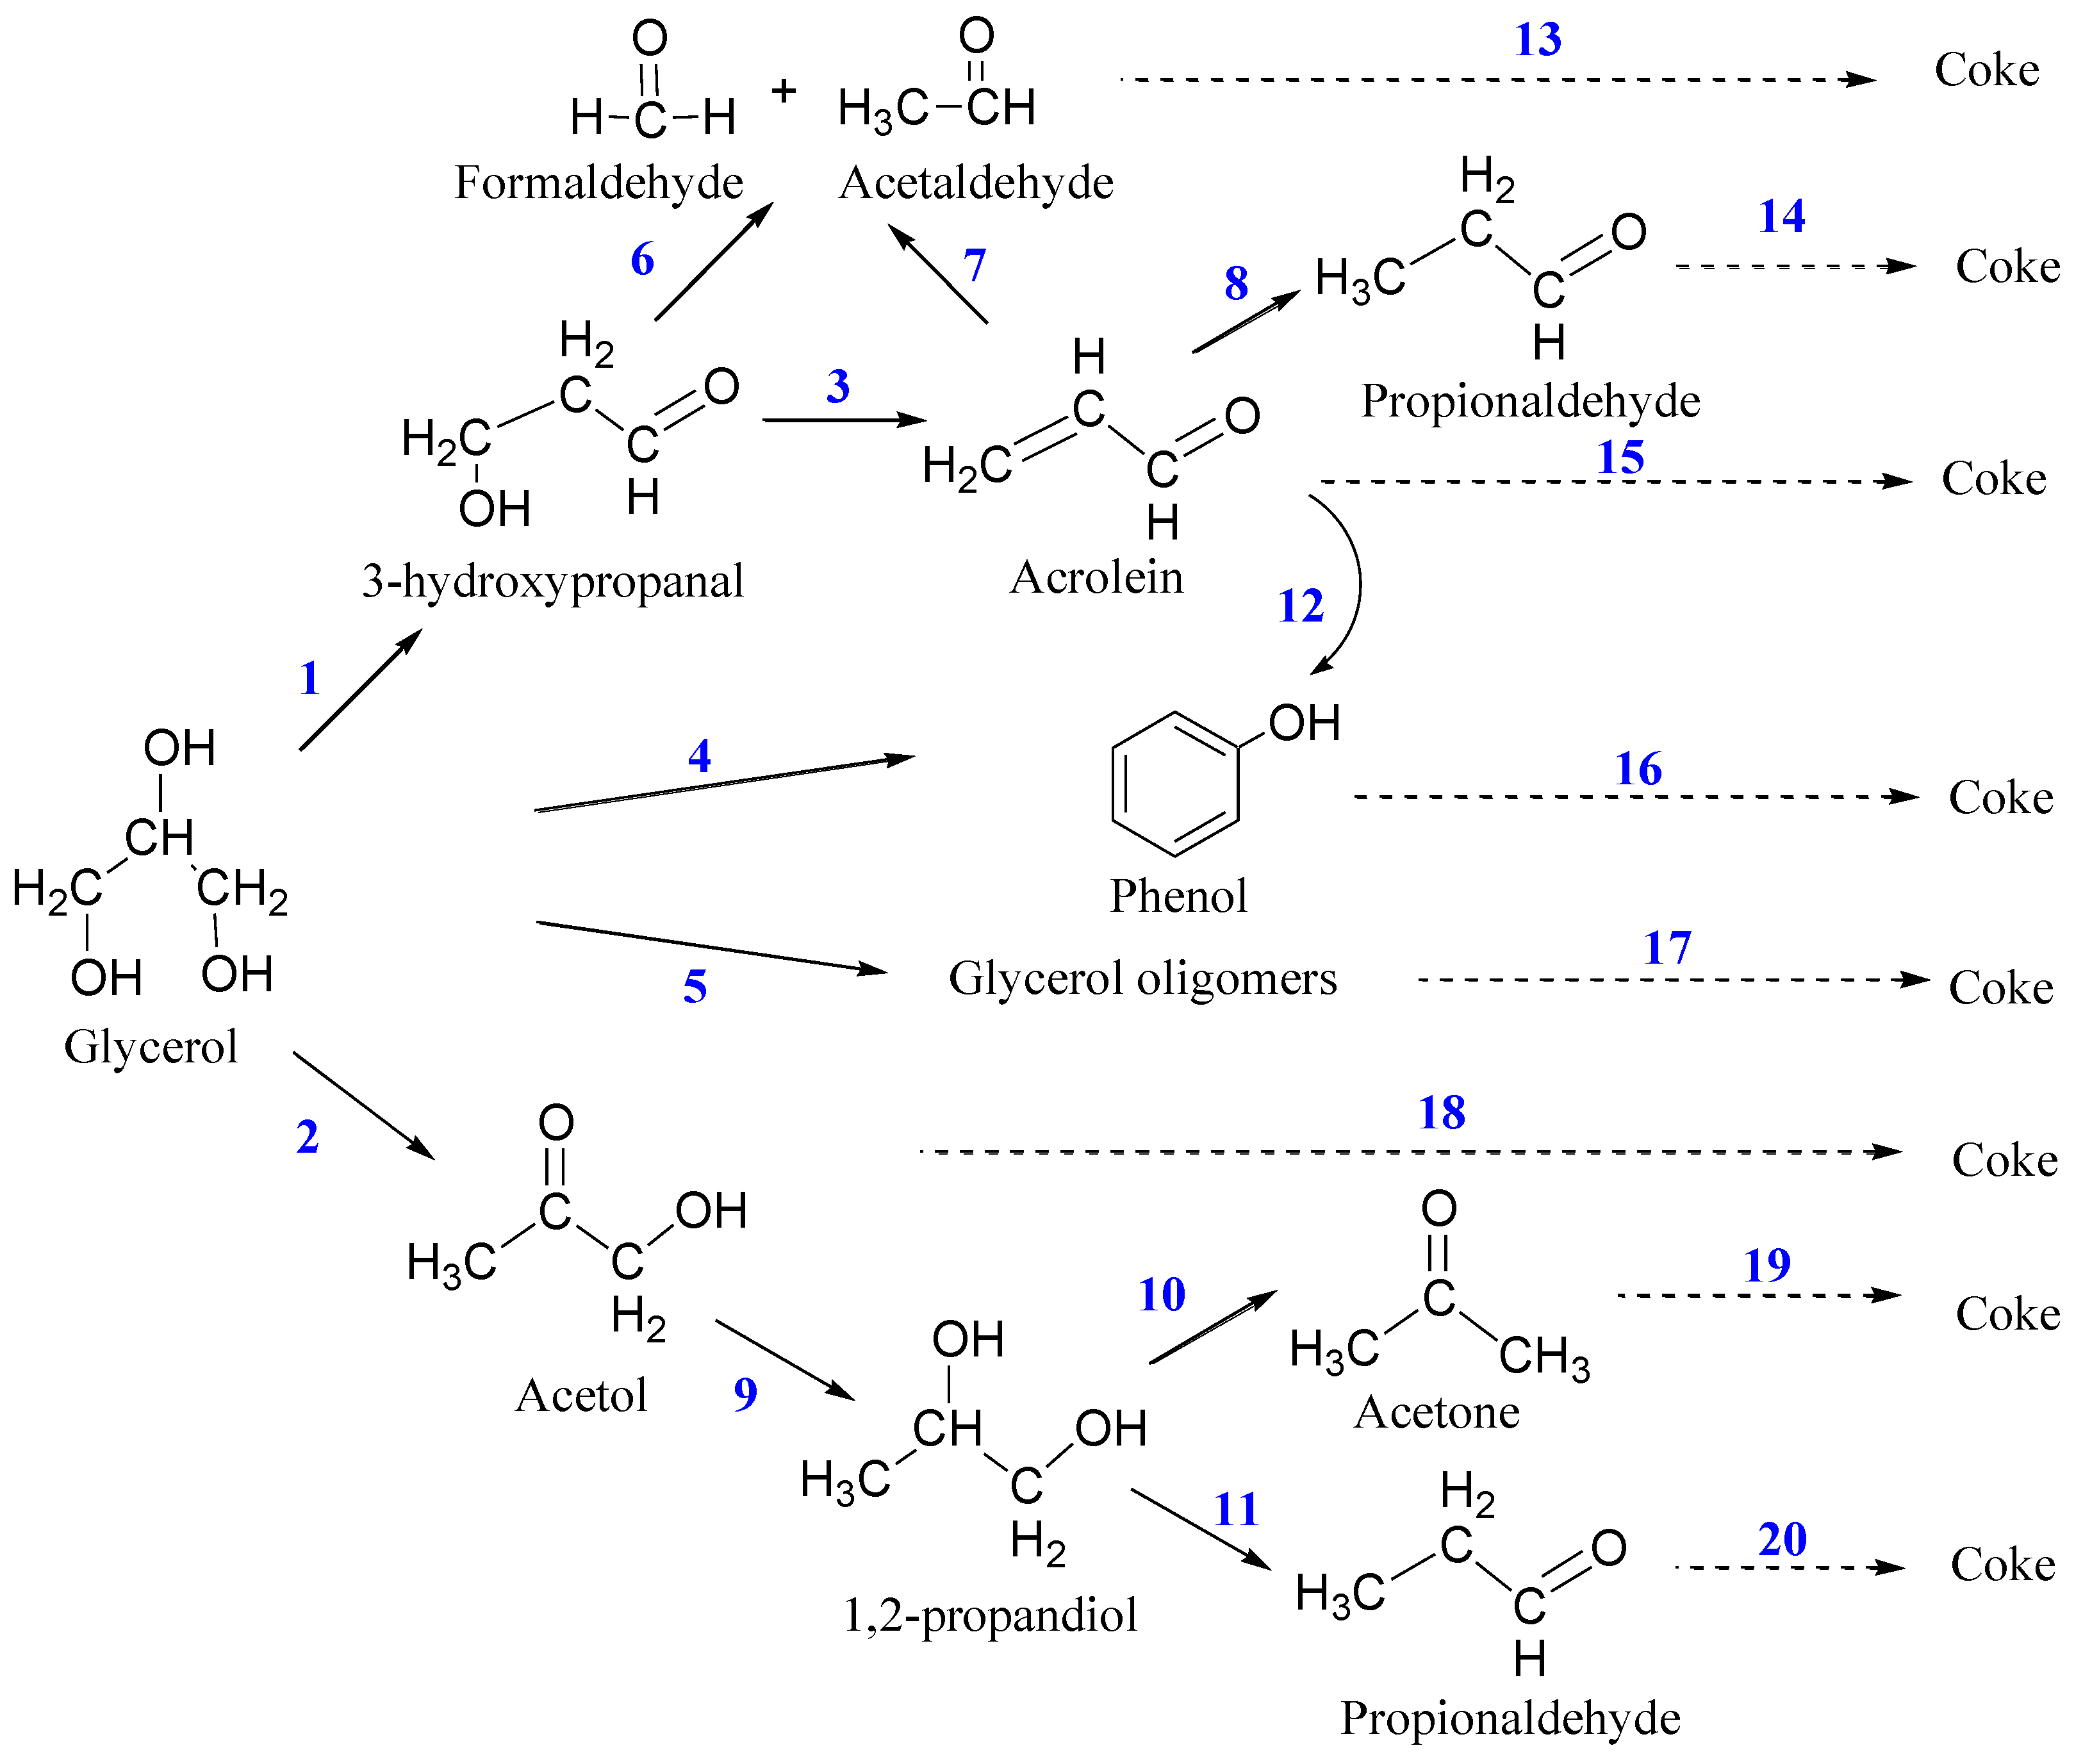
3.4. Proposed Reaction Network

Scheme 2 summarizes major reaction pathways for the gas-phase glycerol dehydration catalyzed by a solid acid. Glycerol is converted to 3-hydroxypropanal (1) and acetol (2), depending on whether the protonation occurred on the primary or the secondary hydroxyl group [8,15]. The highly unstable 3-hydroxypropanal would quickly convert into acrolein (3), and/or into formaldehyde and acetaldehyde via retro Aldol reaction (6) [8,15]. Phenol could be formed from glycerol via dimerization–cyclization followed by dehydration (4), and/or could be formed via catalyzed polymerization of acrolein over acid sites (12) [31]. It is noteworthy that a significant GC-FID peak of phenol was detected in all the cases (Figure 2). However, because phenol is not totally soluble in water that would introduce extra error in the calibration, the quantitative measurement of phenol was not conducted.
Propionaldehyde is possibly formed by the hydrogenation of acrolein followed by isomerization (8), and/or possibly formed from hydrogenation of acetol (9) [8,15] followed by the dehydration of 1,2-propandiol (11) [31,32]. Acetone is another dehydration product of 1,2-propandiol (10) [31,32]. The hydrogen that supplies the hydrogenation is possibly formed from the dehydrogenation of oligomers during coke formation, which occurs from the onset of the glycerol conversion process. Glycerol was able to form linear, cyclic, and branched glycerol oligomers via intermolecular condensation under acidic conditions (5) [16,31]. As shown in Scheme 2, C2 and C3 ketones and aldehydes are subjected to subsequent reactions forming oligomerization (e.g., in (13)–(16) and (18)–(20)); the involved mechanism may include Diels–Alder addition (e.g., acrolein + acrolein), aldol condensation (e.g., propionaldehyde + acetone), dehydration, dehydrogenation, and repetition and/or combination of these [16]. The oligomerization could occur between the same type of compounds or between different types of compounds. Furthermore, these oligomers can be further polymerized, either with themselves or with other groups of oligomers. The continuous addition and hydrogen removal increasingly form hard coke (e.g., in (13)–(20)) [31].

4. Conclusions and Future Research

Our experimental results showed that characteristics and catalytic performance of the supported silicotungstic acid were greatly influenced by the physicochemical properties of the support materials. HSiW-Si1254 with the smallest mesopores (6 nm) among the three tested catalysts provided the lowest glycerol conversion, the lowest acrolein selectivity, and the fastest catalyst deactivation. HSiW-Si1252, the silica support with a larger pore size (11 nm), significantly improved the catalytic performance of the supported HSiW, indicating the important role of the pore size of the support. For all the tested catalysts, the catalyst deactivation affected the acrolein production mainly through decreasing glycerol conversion without much decreasing the selectivity to acrolein.
Although the HSiW-Si1252 achieved an acrolein yield comparable to HSiW-Al over the tested TOS (73.9 mol% for HSiW-Si1252 vs. 74.1 mol% for HSiW-Al), the mechanisms for achieving the comparable yield is different. HSiW-Si1252 provided higher acrolein selectivity than HSiW-Al, but it also deactivated faster than HSiW-Al due to its quicker coking. On the other hand, HSiW-Al showed more stable performance (minimal decrease in glycerol conversion and least coking) over the tested TOS, but it had lower selectivity towards acrolein and higher selectivity towards byproducts, especially undesired byproducts of acetaldehyde and propionaldehyde, which would pose difficulties in downstream separation.
Acetol could be a valuable co-product with significant yield that is easily separable from acrolein. Our observation of increasing selectivity to acetol with increasing TOS for all the three tested catalysts (Figure 6D) deserves further attention which may lead to more insight into the mechanisms for glycerol dehydration. With the progress of catalyst deactivation induced by coking, fewer acid sites overall would be available for glycerol dehydration, including those that lead to acetol formation, which is initiated through the primary protonation of glycerol. A hypothesis is proposed here that warrants further research. The strong Brønsted acid sites, which are favorable to glycerol dehydration to acrolein initiated via secondary protonation, also effectively catalyze reactions leading to coking; thus, the preferential deactivation of strong Brønsted acid sites thermodynamically pushes toward a higher probability for primary protonation, leading to a higher selectivity towards acetol.

Supplementary Materials

The following supporting information can be downloaded at: https://www.mdpi.com/article/10.3390/eng4010012/s1, Table S1: Antoine coefficients and the temperature range for glycerol and water; Figure S1: Vapor pressure as a function of temperature for water and glycerol calculated via Antoine Equation; Figure S2: T-x-y diagram for the glycerol-water two-component system at 760 mm Hg [36,37,38].

Author Contributions

X.P.Y. conceived the study and directed the experimental work conducted by L.L. Catalyst characterizations were carried out collaboratively by L.L., X.P.Y., F.Y. and S.W. L.L. drafted the manuscript. All authors participated in the revision and approved the manuscript. All authors have read and agreed to the published version of the manuscript.

Funding

This research was partially supported by the United States Department of Agriculture: HATCH project No. TEN00521.

Institutional Review Board Statement

Not applicable.

Informed Consent Statement

Not applicable.

Data Availability Statement

All data are provided in the manuscript and the supplentary file.

Acknowledgments

This research paper is based on a part of the PhD dissertation of Lu Liu [35]. The corresponding author would like to thank the partial financial support by the U.S. Department of Agriculture HATCH project No. TEN00521.

Conflicts of Interest

The authors declare no conflict of interest.

References

  1. Zou, B.; Ren, S.; Ye, X. Glycerol Dehydration to Acrolein Catalyzed by ZSM-5 Zeolite in Supercritical Carbon Dioxide Medium. ChemSusChem 2016, 9, 3268–3271. [Google Scholar] [CrossRef] [PubMed]
  2. Liu, L.; Ye, X.; Bozell, J. A Comparative Review of Petroleum-Based and Bio-Based Acrolein Production. ChemSusChem 2012, 5, 1162–1180. [Google Scholar] [CrossRef] [PubMed]
  3. Ye, X.P.; Ren, S. 3-Value-Added Chemicals from Glycerol, in Soy-Based Chemicals and Materials; Brentin, R., Ed.; American Chemical Society: London, UK, 2014; pp. 43–80. [Google Scholar]
  4. Katryniok, B.; Paul, S.; Capron, M.; Dumeignil, F. Towards the Sustainable Production of Acrolein by Glycerol Dehydration. ChemSusChem 2009, 2, 719–730. [Google Scholar] [CrossRef] [PubMed]
  5. Nimlos, M.R.; Blanksby, S.J.; Qiuan, X.; Himmel, M.E.; Johnson, D.K. Mechanisms of Glycerol Dehydration. J. Phys. Chem. A 2006, 110, 6145–6156. [Google Scholar] [CrossRef]
  6. Alhanash, A.; Kozhevnikova, E.; Kozhevnikov, I. Gas-phase dehydration of glycerol to acrolein catalysed by caesium heteropoly salt. Appl. Catal. A Gen. 2010, 378, 11–18. [Google Scholar] [CrossRef]
  7. Jia, C.J.; Liu, Y.; Schmidt, W.; Lu, A.-H.; Schüth, F. Small-sized HZSM-5 zeolite as highly active catalyst for gas phase dehydration of glycerol to acrolein. J. Catal. 2010, 269, 71–79. [Google Scholar] [CrossRef]
  8. Chai, S.H.; Wang, H.-P.; Liang, Y.; Xu, B.-Q. Sustainable production of acrolein: Investigation of solid acid-base catalysts for gas-phase dehydration of glycerol. Green Chem. 2007, 9, 1130–1136. [Google Scholar] [CrossRef]
  9. Gu, Y.; Cui, N.; Yu, Q.; Li, C.; Cui, Q. Study on the influence of channel structure properties in the dehydration of glycerol to acrolein over H-zeolite catalysts. Appl. Catal. A Gen. 2012, 429, 9–16. [Google Scholar] [CrossRef]
  10. Kim, Y.T.; Jung, K.-D.; Park, E. Gas-phase dehydration of glycerol over ZSM-5 catalysts. Microporous Mesoporous Mater. 2010, 131, 28–36. [Google Scholar] [CrossRef]
  11. Ulgen, A.; Hoelderich, W. Conversion of glycerol to acrolein in the presence of WO3/ZrO2 catalysts. Catal. Lett. 2009, 131, 122–128. [Google Scholar] [CrossRef]
  12. Wu, Y.; Ye, X.; Yang, X.; Wang, X.; Chu, W.; Hu, Y. Heterogenization of heteropolyacids: A general discussion on the preparation of supported acid catalysts. Ind. Eng. Chem. Res. 1996, 35, 2546–2560. [Google Scholar] [CrossRef]
  13. Kozhevnikov, I.V. Sustainable heterogeneous acid catalysis by heteropoly acids. J. Mol. Catal. A-Chem. 2007, 262, 86–92. [Google Scholar] [CrossRef]
  14. Timofeeva, M.N. Acid catalysis by heteropoly acids. Appl. Catal. A Gen. 2003, 256, 19–35. [Google Scholar] [CrossRef]
  15. Tsukuda, E.; Sato, S.; Takahashi, R.; Sodesawa, T. Production of acrolein from glycerol over silica-supported heteropoly acids. Catal. Commun. 2007, 8, 1349–1353. [Google Scholar] [CrossRef]
  16. Atia, H.; Armbruster, U.; Martin, A. Dehydration of glycerol in gas phase using heteropolyacid catalysts as active compounds. J. Catal. 2008, 258, 71–82. [Google Scholar] [CrossRef]
  17. Chai, S.-H.; Wang, H.-P.; Liang, Y.; Xu, B.-Q. Sustainable production of acrolein: Gas-phase dehydration of glycerol over 12-tungstophosphoric acid supported on ZrO2 and SiO2. Green Chem. 2008, 10, 1087–1093. [Google Scholar] [CrossRef]
  18. Kozhevnikov, I.V. Catalysis by heteropoly acids and multicoponent polyoxometalates in liquid-phase reactions. Chem. Rev. 1998, 98, 171–198. [Google Scholar] [CrossRef] [PubMed]
  19. Bardin, B.B.; Davis, R.J. Effect of water on silica-supported phosphotungstic acid catalysts for 1-butene double bond shift and alkane skeletal isomerization. Appl. Catal. A Gen. 2000, 200, 219–231. [Google Scholar] [CrossRef]
  20. Chu, W.; Yang, X.; Shan, Y.; Ye, X.; Wu, Y. Immobilization of the heteropoly acid (HPA) H4SiW12O40 (SiW12) on mesoporous molecular sieves (HMS and MCM-41) and their catalytic behavior. Catal. Lett. 1996, 42, 201–208. [Google Scholar] [CrossRef]
  21. Verhoef, M.J.; Kooyman, P.; Peters, J.; van Bekkum, H. A study on the stability of MCM-41-supported heteropoly acids under liquid- and gas-phase esterification conditions. Microporous Mesoporous Mater. 1999, 27, 365–371. [Google Scholar] [CrossRef]
  22. Izumi, Y.; Hasebe, R.; Urabe, K. Catalysis by heterogeneous supported heteropoly acid. J. Catal. 1983, 84, 402–409. [Google Scholar] [CrossRef]
  23. Nowinska, K.; Field, R.; Adamiec, J. Catalytic activity of supported heteropoly acids for reactions requiring strong acid centres. J. Chem. Soc. Faraday Trans. 1991, 87, 749–753. [Google Scholar] [CrossRef]
  24. Quantachrome. User Manual for ChemBET Pulsar TPR/TPD; Quantachrome Instrument: Boynton Beach, FL, USA, 2008; pp. 94–96. [Google Scholar]
  25. Lowell, S.; Shields, J.E.; Thomas, M.A. Characterization of Porous Solids and Powders: Surface Area, Pore Size and Density Particle Technology Series; Scarlett, B., Ed.; Springer: Dordrecht, The Netherlands, 2004. [Google Scholar]
  26. Yuan, Q.; Yin, A.-X.; Luo, C.; Sun, L.-D.; Zhang, Y.-W.; Duan, W.-T.; Liu, H.-C.; Yan, C.-H. Facile Synthesis for Ordered Mesoporous γ-Aluminas with High Thermal Stability. J. Am. Chem. Soc. 2008, 130, 3465–3472. [Google Scholar] [CrossRef]
  27. Tsyganenko, A.; Storozheva, E.; Manoilova, O.; Lesage, T.; Daturi, M.; LaValley, J.-C. Brønsted acidity of silica silanol groups induced by adsorption of acids. Catal. Lett. 2000, 70, 159–163. [Google Scholar] [CrossRef]
  28. Levchenko, A.A.; Jain, P.; Trofymluk, O.; Yu, P.; Navrotsky, A.; Sen, S. Nature of molecular rotation in supercooled glycerol under nanoconfinement. J. Phys. Chem. 2010, 114, 3070–3074. [Google Scholar] [CrossRef]
  29. Tomin, V.I.; Hubis, K. Instantaneous emission spectra and molecular rotation of n-dimethylaminobenzonitrile fluorescing in the long-wavelength spectral range. Opt. Spectrosc. 2005, 100, 65–74. [Google Scholar]
  30. Hao, L.; Leaist, D.G. Large soret effect for silicotungstic acid in a supporting electrolyte: 9% Change in concentration per degree. J. Phys. Chem. 1994, 98, 13741–13744. [Google Scholar] [CrossRef]
  31. Suprun, W.; Lutecki, M.; Haber, T.; Papp, H. Acidic catalysts for the dehydration of glycerol: Activity and deactivation. J. Mol. Catal. A Chem. 2009, 309, 71–78. [Google Scholar] [CrossRef]
  32. Corma, A.; Huber, G.W.; Sauvanaud, L.; O’Connor, P. Biomass to chemicals: Catalytic conversion of glycerol/water mixtures into acrolein, reaction network. J. Catal. 2008, 257, 163–171. [Google Scholar] [CrossRef]
  33. Wolf, E.E.; Petersen, E.E. Catalysts deactivation by coking. Catal. Rev. Sci. Eng. 2007, 24, 329–371. [Google Scholar] [CrossRef]
  34. Tanabe, K. Solid Acids and Bases: Their Catalytic Properties. Studies in Surface Sciences and Catalysis; Elsevier: Tokyo, Japan, 1989. [Google Scholar]
  35. Liu, L. Roles of Non-thermal Plasma in Gas-phase Glycerol Dehydration Catalyzed by Supported Silicotungstic Acid. Ph.D. Thesis, The University of Tennessee, Knoxville, TN, USA, 2011. [Google Scholar]
  36. NIH. National Library of Medicine, Material Data Sheet. Available online: https://pubchem.ncbi.nlm.nih.gov/compound/Glycerol (accessed on 31 December 2022).
  37. Yaws, C.L.; Narasimhan, P.; Gabbula, C. Yaws’ Handbook of Antoine Coefficients for Vapor Pressure, 2nd ed.; Knovel: New York, NY, USA, 2009. [Google Scholar]
  38. The Dortmund Data Bank. Available online: http://www.ddbst.com/en/online/Online_Calc_vap_Form.php?component=Water (accessed on 31 December 2022).
Scheme 1. Ionic pathways of acid catalyzed glycerol dehydration; (A) to acrolein and (B) to acetol.
Eng 04 00012 sch001
Figure 1. Experimental layout for glycerol dehydration experiments.
Eng 04 00012 g001
Figure 2. Typical GC chromatograph of the sample collected in the 1st condensation stage (A) and the 2nd condensation stage (B).
Eng 04 00012 g002
Figure 3. XRD patterns of silicotungstic acid (HSiW), Al and HSiW-Al, Si1252 and HSiW-Si1252, and Si1254 and HSiW-Si1254.
Eng 04 00012 g003
Figure 4. NH3-TPD profile of HSiW-Si1252, HSiW-Si1254, and HSiW-Al catalysts.
Eng 04 00012 g004
Figure 5. Glycerol conversion (A) and acrolein yield (B) as function of time-on-stream.
Eng 04 00012 g005
Figure 6. Selectivity to acrolein (A), acetaldehyde (B), propionaldehyde (C), and acetol (D) as function of time-on-stream.
Eng 04 00012 g006
Figure 7. Results of temperature programmed oxidation of spent catalysts after 7.5 h time-on-stream.
Eng 04 00012 g007
Scheme 2. Possible reaction network of gas-phase glycerol dehydration catalyzed by a solid acid [15,16,31,32,35].
Eng 04 00012 sch002
Table 1. Manufacturer data of material properties of the catalyst supports.
Mesoporous SupportSi1252Si1254Al2700
Shapegranulesgranulesbeads
Particle size (mm)1–31–31.2–2.4
Average pore diameter (nm)11630
Pore volume (cc/g)1.020.811.10
Surface area (m2/g)390540150
Density (g/cm3)0.430.380.40
Table 2. Results of glycerol dehydration catalyzed by HSiW on three different mesoporous supports.
Glycerol Conversion (mol%)Selectivity (mol%)Coke
(wt.%) 4
Acrolein Yield
(mol%)
AcroleinAcetaldehydePropion-aldehydeAcetol
HSiW-Si125292.9 1 ± 0.6 2 (98.7 ± 0.7) 379.5 ± 0.21.1± 0.21.1± 0.07.6 ± 0.314.3 ± 0.573.9
HSiW-Si125489.0± 1.2 (98.0 ± 0.8)74.4 ± 0.70.8± 0.10.9± 0.14.2 ± 0.919.4 ± 0.966.2
HSiW-Al96.2± 0.3
(98.0 ± 1.1)
77.0 ± 0.91.9± 0.11.4± 0.111.6 ± 0.98.7 ± 0.974.1
1 Mean of average conversion (or selectivity) over 1.5−7.5 h TOS of two kinetic repetitions; 2 standard error; 3 initial conversion values shown in parenthesis calculated at 1.5 h TOS; 4 calculated by catalyst weight gain after 7.5 h TOS divided by the fresh catalyst weight.
Disclaimer/Publisher’s Note: The statements, opinions and data contained in all publications are solely those of the individual author(s) and contributor(s) and not of MDPI and/or the editor(s). MDPI and/or the editor(s) disclaim responsibility for any injury to people or property resulting from any ideas, methods, instructions or products referred to in the content.

