1. Introduction
MEMS oscillators are widely used in our technological world and are found in a variety of applications [
1,
2,
3,
4,
5]. Based on their operating principle, the oscillators can be divided into two classes: electrostatic excitation and piezoelectric excitation. The advantages of electrostatic excitation include a high-quality factor
Q and good frequency stability, especially for frequency timing applications [
6]. However, disadvantages are a high operating voltage, occurring nonlinearities, and difficult processing due to the narrow gaps that are required between the two capacitor plates. Piezoelectric oscillators, on the other hand, are characterized by low operating voltage, high electromechanical coupling, and simple CMOS-compatible batch processing since there is no requirement for a gap. However, a disadvantage compared to electrostatic excitation is the lower
Q factor and the associated impact on oscillator performance, such as resolution and frequency stability. For this reason, an important area of research is to increase the quality factor of piezoelectric oscillators [
7]. This includes an enhancement of the material-related intrinsic quality factor, as well as the reduction of extrinsic damping effects, being related to environmental ambient pressure and geometrical boundaries [
8,
9]. In many applications, MEMS oscillators are operated under various ambient conditions, e.g., in a liquid, in a gas atmosphere, or encapsulated under vacuum conditions. Furthermore, the distance of the micro-oscillator to a mounting or to a package is an important factor [
10,
11,
12]. Therefore, we investigate the influence of an encapsulation package under various ambient pressure conditions and experimentally correlate them with the damping effects.
The overall quality factor of a micro-oscillator is determined by four different damping mechanisms. Therefore, in the first step, the main loss factor must be determined, which subsequently has to be minimized to increase the overall quality factor of the MEMS oscillator. At low pressure (
p = 0.01 mbar), the intrinsic damping losses are dominant and the extrinsic losses due to the gas atmosphere can be neglected. The extrinsic damping mechanisms are subdivided further, corresponding to the Knudsen number, which is defined by the ambient pressure and the gap width. In the low-pressure range, with a respectively high Knudsen number (
Kn > 1), molecular flow damping dominates, whereas in the high-pressure range up to atmospheric pressure and beyond viscous flow damping is defined (
Kn < 0.01) [
13]. In between, the transitional flow regime is encountered, where the damping is described by thermal wave resonance effects [
14]. Within this paper, we examine a generalized damping model for various oscillator structure shapes with different coverage sizes of the piezoelectric thin film layer. The oscillators are characterized over a large pressure range and over a varying gap width. The generalized damping model shows good agreement with the experimental data, covering six orders of magnitude for the Knudsen number. Additionally, numerical simulations are performed to model the pressure and temperature distribution supporting the found damping fundamentals. With the help of the results, design rules for an optimization of the quality factor on the dependence of the gap width to the package are derived, based only on the resonance frequency.
2. Generalized Damping Model
2.1. MEMS-Oscillator
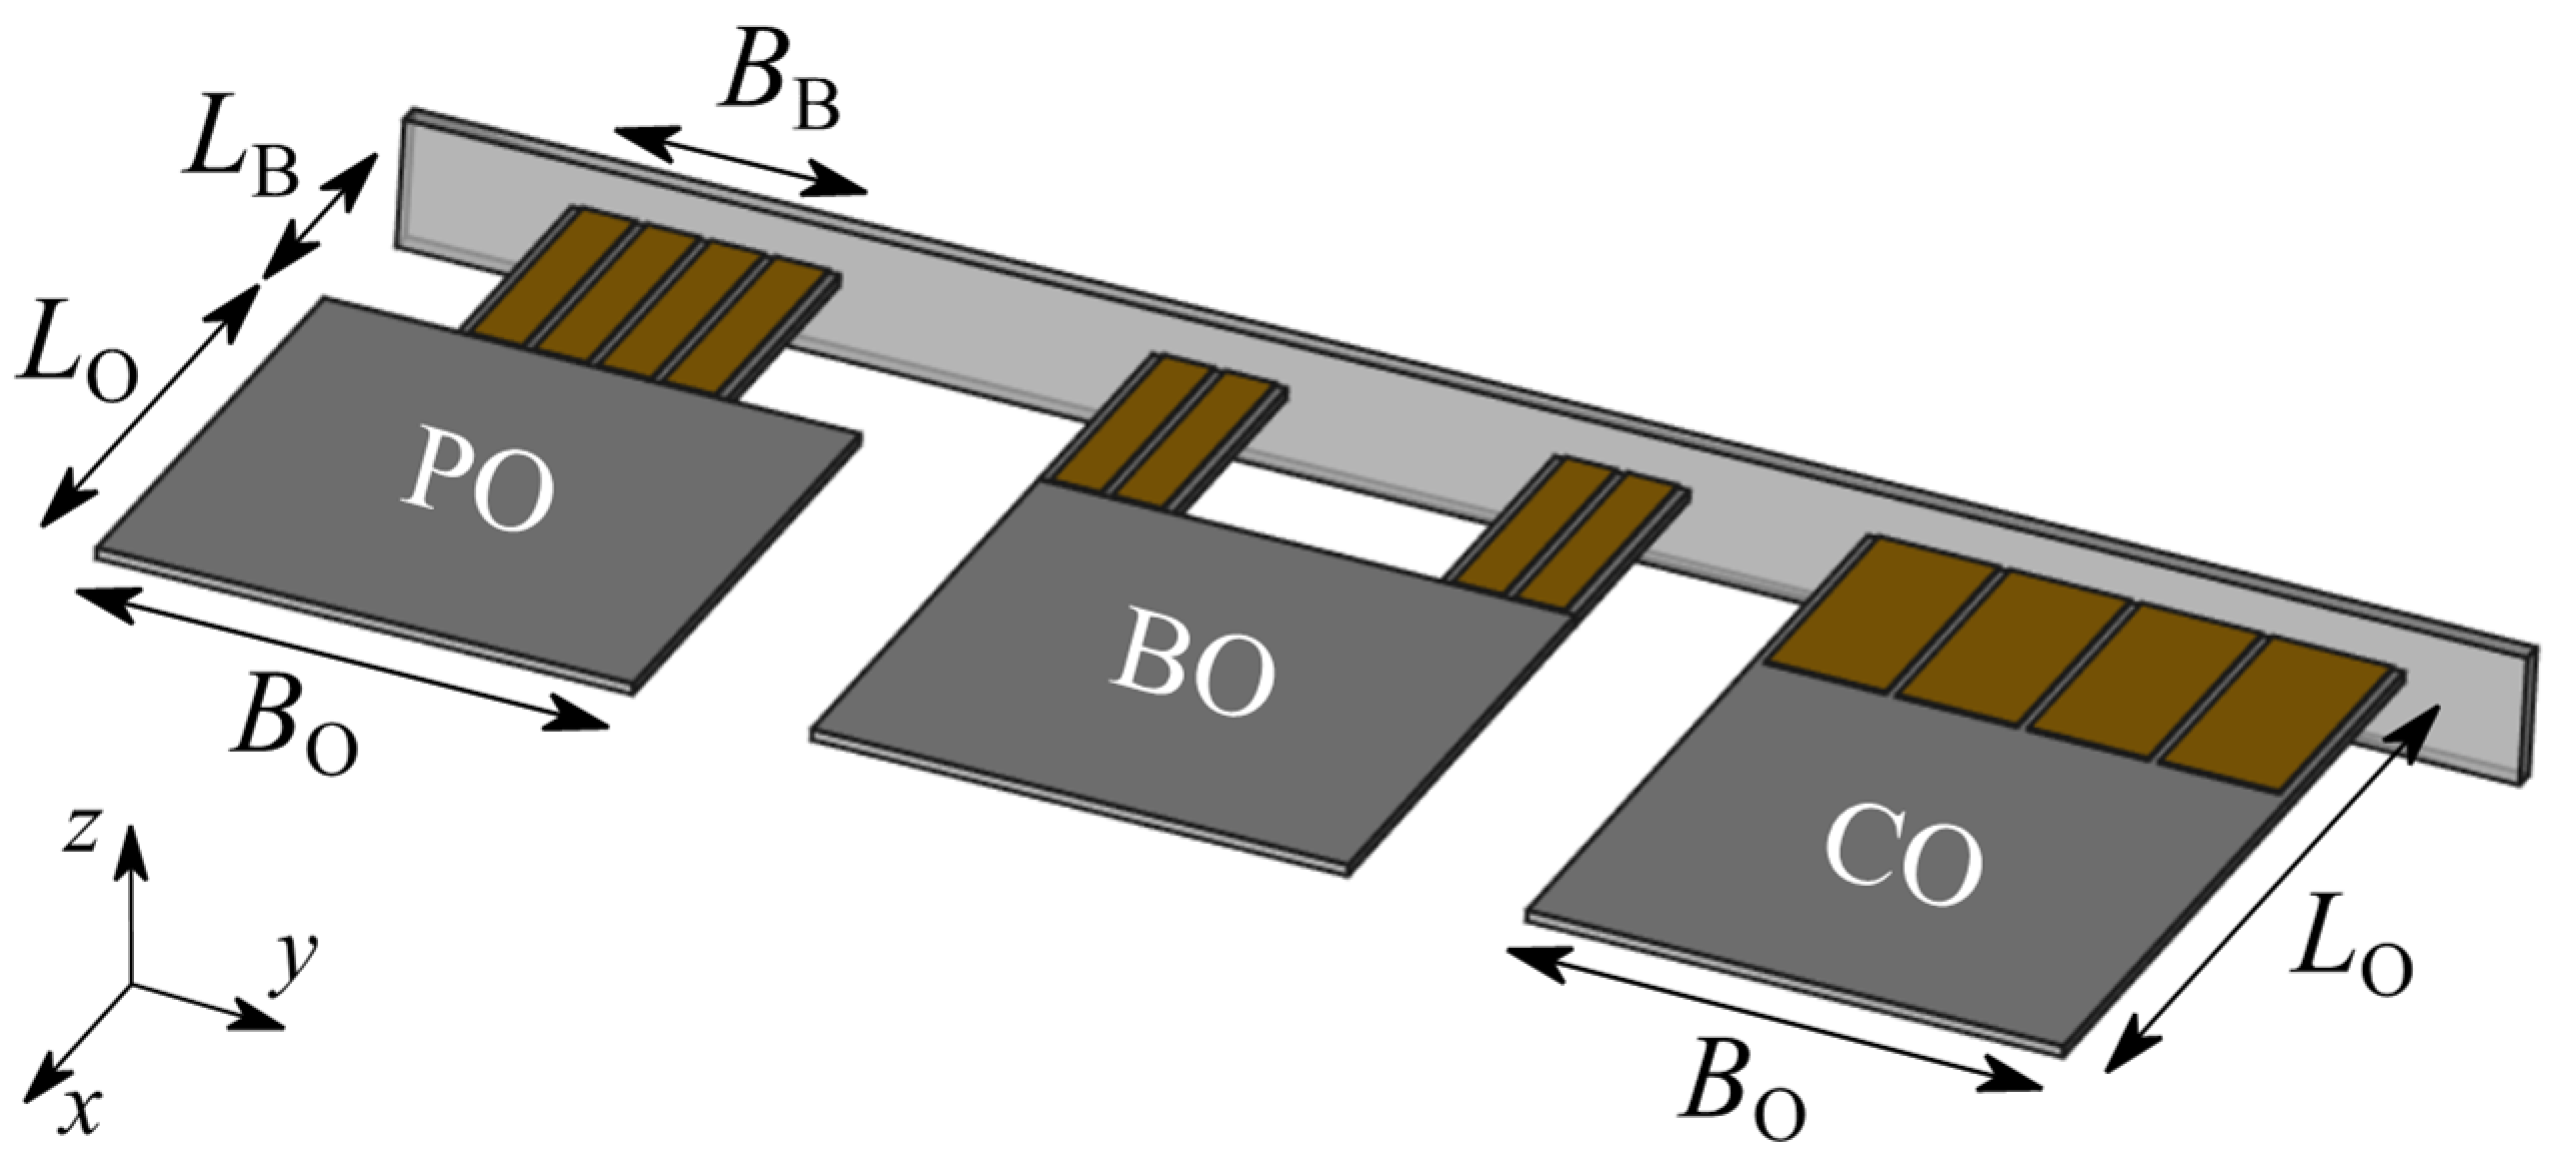
The investigated MEMS oscillator structures are shown in
Figure 1 and are subdivided into three classes regarding their shape: paddle oscillator (PO), bending oscillator (BO), and cantilever oscillator (CO). The resonance frequency of such MEMS oscillators can be derived by the theory of an externally driven damped harmonic oscillator [
15]. This results in the fundamental resonance frequency
fr:
where
k and
m denote the spring constant, and the mass of the MEMS oscillator, respectively.
The mass of the MEMS oscillator can be calculated easily by the density–volume product, and the spring constant is given by solid mechanics [
16]:
with Young’s modulus
ESi of the MEMS oscillator, as well as the moment of inertia
I, the length
LB, the width
BB and the thickness
T of the beam.
For the PO and BO structures, we assume two parallel-connected beam spring constants (k = kB‖kB = 2kB) with the length L = LB + LO, and width B = BB. For the CO structures, the length L and the width B are directly given by the oscillator dimension LO and BO.
Moreover, we scale the mass
m of the MEMS oscillator by a factor
α attributing the effect that not the entire structure is vibrating [
17]. Therefore, the effective mass
meff =
α·
m is used in the following calculations.
Taking everything into account, this leads to the resonance frequency of the MEMS oscillator as a function of its geometry and material properties:
This calculation is valid for the resonance frequency of the first fundamental bending mode (BM) of the MEMS oscillator. The resonance frequency of the higher bending modes
fn with mode number
n can be calculated as a multiple of the squared eigenvalue
λn [
18]:
The eigenvalue
λn is given by 1.88; 4.69; 7.86; 11.00 for the first four bending modes [
17]. This analytical approach will be discussed in the experimental section, regarding the accuracy of the description as well as the influence of the different geometric shapes on the scale factor
α, which is experimentally investigated.
2.2. Quality Factor Q
The second characteristic value besides the resonance frequency of a MEMS oscillator is the quality factor
Q. This is a measure for the damping and is defined by the ratio of the total energy of an oscillator
E to the energy dissipation per cycle Δ
E. Its value can be measured from a resonance curve plot using the 3dB bandwidth Δ
f3dB [
19]:
The experimentally measured quality factor always represents a combination of several individual damping mechanisms, which can be combined via the superposition principle. The damping phenomena can be divided into two classes, the material related intrinsic ones, and the extrinsic ones from the surrounding gas atmosphere:
The intrinsic damping losses are independent of the external pressure and are determined by anchor losses [
20], by the residual stress of the piezoelectric layer [
21], and by thermoelastic damping effects [
22]. Which of the three types of damping is dominant depends on the resonance frequency and on the bending mode.
The extrinsic damping influences can be further subdivided according to several flow regimes with respect to the Knudsen number Kn. The Knudsen number is given by the ratio of the mean free path lmfp to a representative length scale l*. In the context of the investigations, the Knudsen number is changed on the one hand by the pressure which influences the mean free path, and on the other hand by the representative length scale which can be adjusted by a variable gap width h.
For the different individual flow regimes, descriptions of the damping behavior in the literature are available which are summarized in a more generalized damping model. In the molecular flow regime (
Kn > 1), the quality factor can be described by a reciprocal dependency on the external pressure which was expanded by Bao et al. with a linear gap width
h dependency [
23,
24] (valid for small gap widths [
25]):
The other dependencies on the geometric shape, the size of the oscillator, the gas atmosphere, and the ambient temperature are summarized in the fit parameter ξmol [bar].
For low Knudsen numbers (
Kn < 0.01), the quality factor can be calculated for the viscous flow regime based on the Navier–Stokes equations under some simplifications (assumption of the MEMS oscillator as a chain of spheres/discs [
26,
27]). The result of these theories is a viscous quality factor exhibiting a dependency to the reciprocal square root of the external pressure:
The fit parameter ξvis [bar0.5] combines the influence of the geometry, the gas atmosphere, and temperature on the viscous quality factor. Dependence of the quality factor on the gap width is not covered by any of these works, except for the squeeze film regime, and is therefore specifically investigated in our work.
The transitional flow regime in-between the two previously presented flow regimes can be described by the resonance effect of thermal waves. The quality factor is described by a parabola-shaped function with a vertex located at the thermal wave resonance point where the mechanical resonance frequency
fn, matches with the thermal frequency of the gas locked within the gap width
fth. Here, the thermal frequency of the gas depends on its thermal diffusivity, which is changed by the external pressure, as well as on the adjusted gap width. The mathematical description of the quality factor plot of the transitional flow regime is as follows:
Further elaboration on this theory including the fit parameters
ξtrans [
1] and
Btrans [Hz·mbar
0.5] can be found in [
14]. In previous works [
14,
25] and in
Appendix B, the process steps of the sensor fabrication and the experimental procedure of recording resonance curves for the extraction of the quality factor and resonance frequency are described.
3. FEM Simulations
In addition to the analytical description and the experimental investigation of the MEMS oscillators, finite element (FEM) simulations were performed for modeling the temperature and pressure distribution within the gap caused by the oscillator movement and also for determining the thickness of the oscillator.
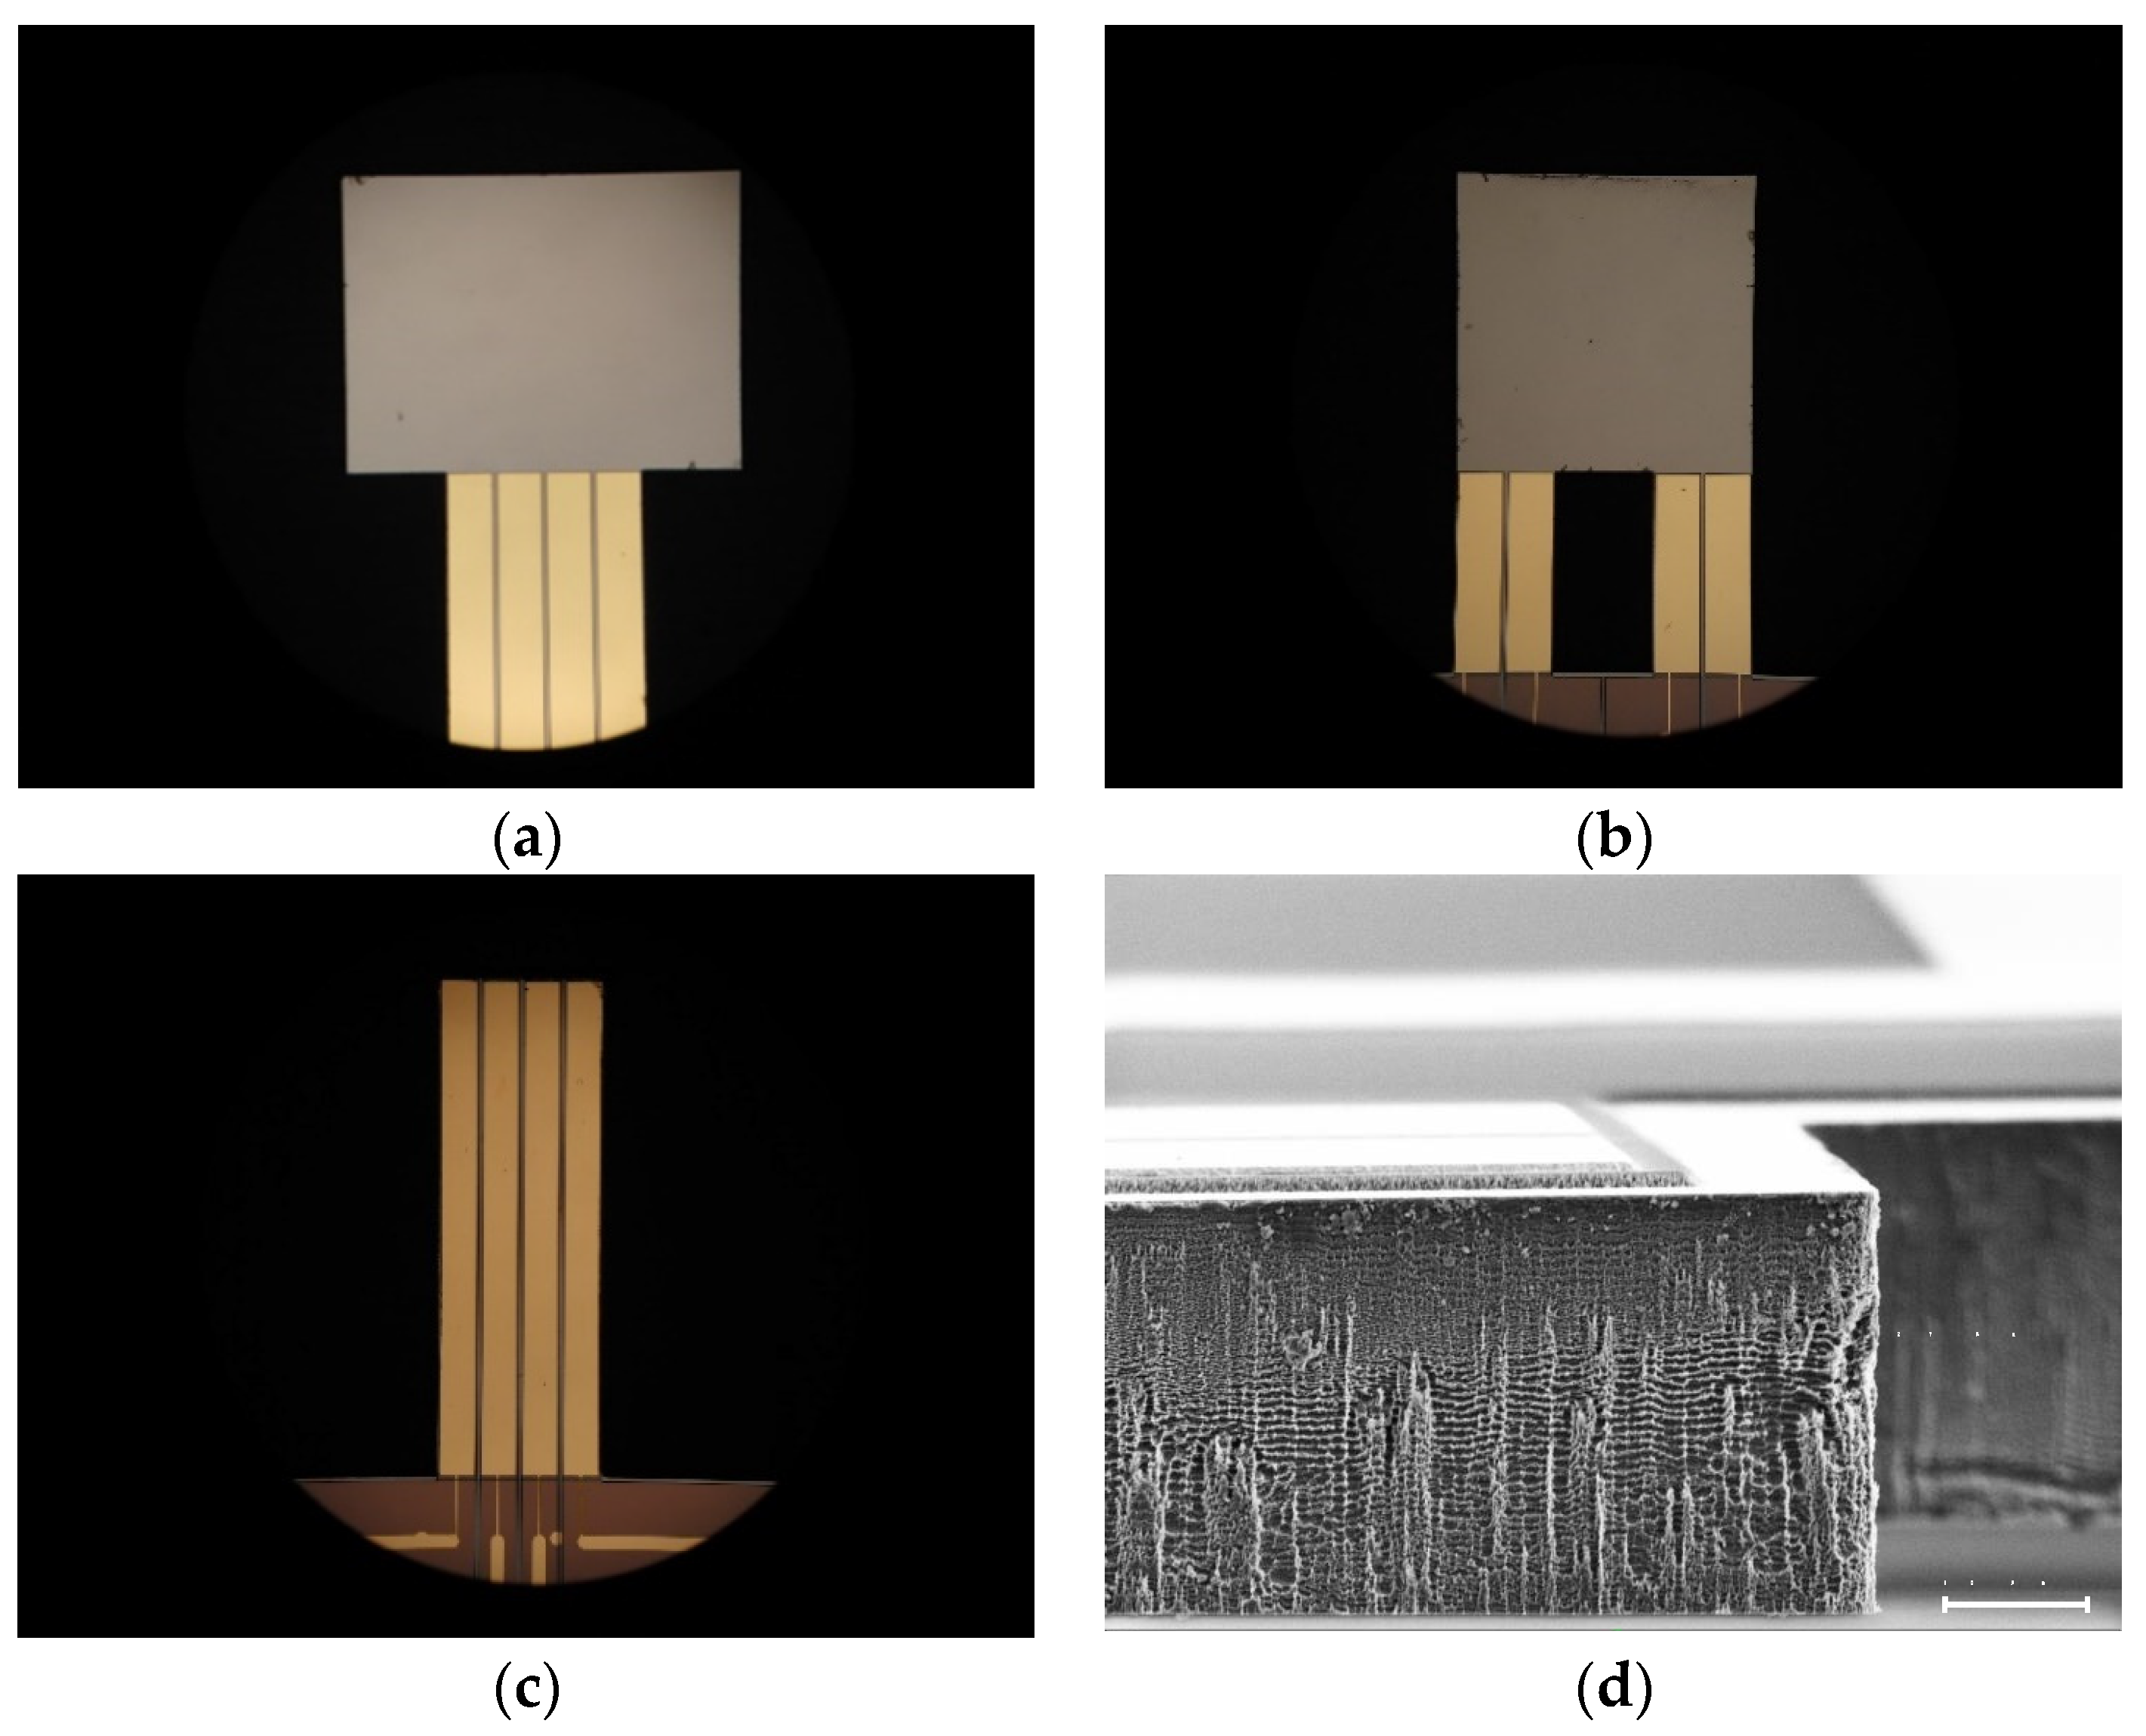
In the oscillator manufacturing process, the thickness of the oscillators is determined by a time-controlled wet chemical etching process in a KOH solution. This process is affected by variations on the order of ±3 µm in the targeted oscillator thickness. For this reason, the thickness is determined numerically in COMSOL Multiphysics 5.4 with the solid mechanics’ module using an eigenfrequency study of the MEMS oscillator [
28]. The exact thickness of one micro-oscillator structure was measured by scanning electron microscopy (SEM). For this method of investigation, however, a thin Au layer is necessary for the conduction of the electrons, after which the oscillator is no longer suitable for further measurements. As an example, an SEM image is attached in
Appendix A (see
Figure A1d) and confirms the range of thickness of the micro-oscillators.
The pressure and temperature distribution within the gap are modeled by coupling the oscillator movement with the surrounding fluid using an adiabatic and no-slip boundary condition. The geometrical boundary at the top is a fixed plate placed in a defined spacing from the micro-oscillator. It possesses a nearly infinite heat capacity (relative to the amount of heat produced by the micro-oscillator movement) and is therefore modeled by an isothermal wall. Towards the bottom, the micro-oscillator is not confined, which is represented by the spherical wave radiation boundary condition. The behavior of the fluid is described by a linearized Navier–Stokes equation, which is valid for the continuum regime (
Kn < 0.1). Furthermore, we use the continuity equation and the energy equation for fluids. The complete set of equations can be found in [
14].
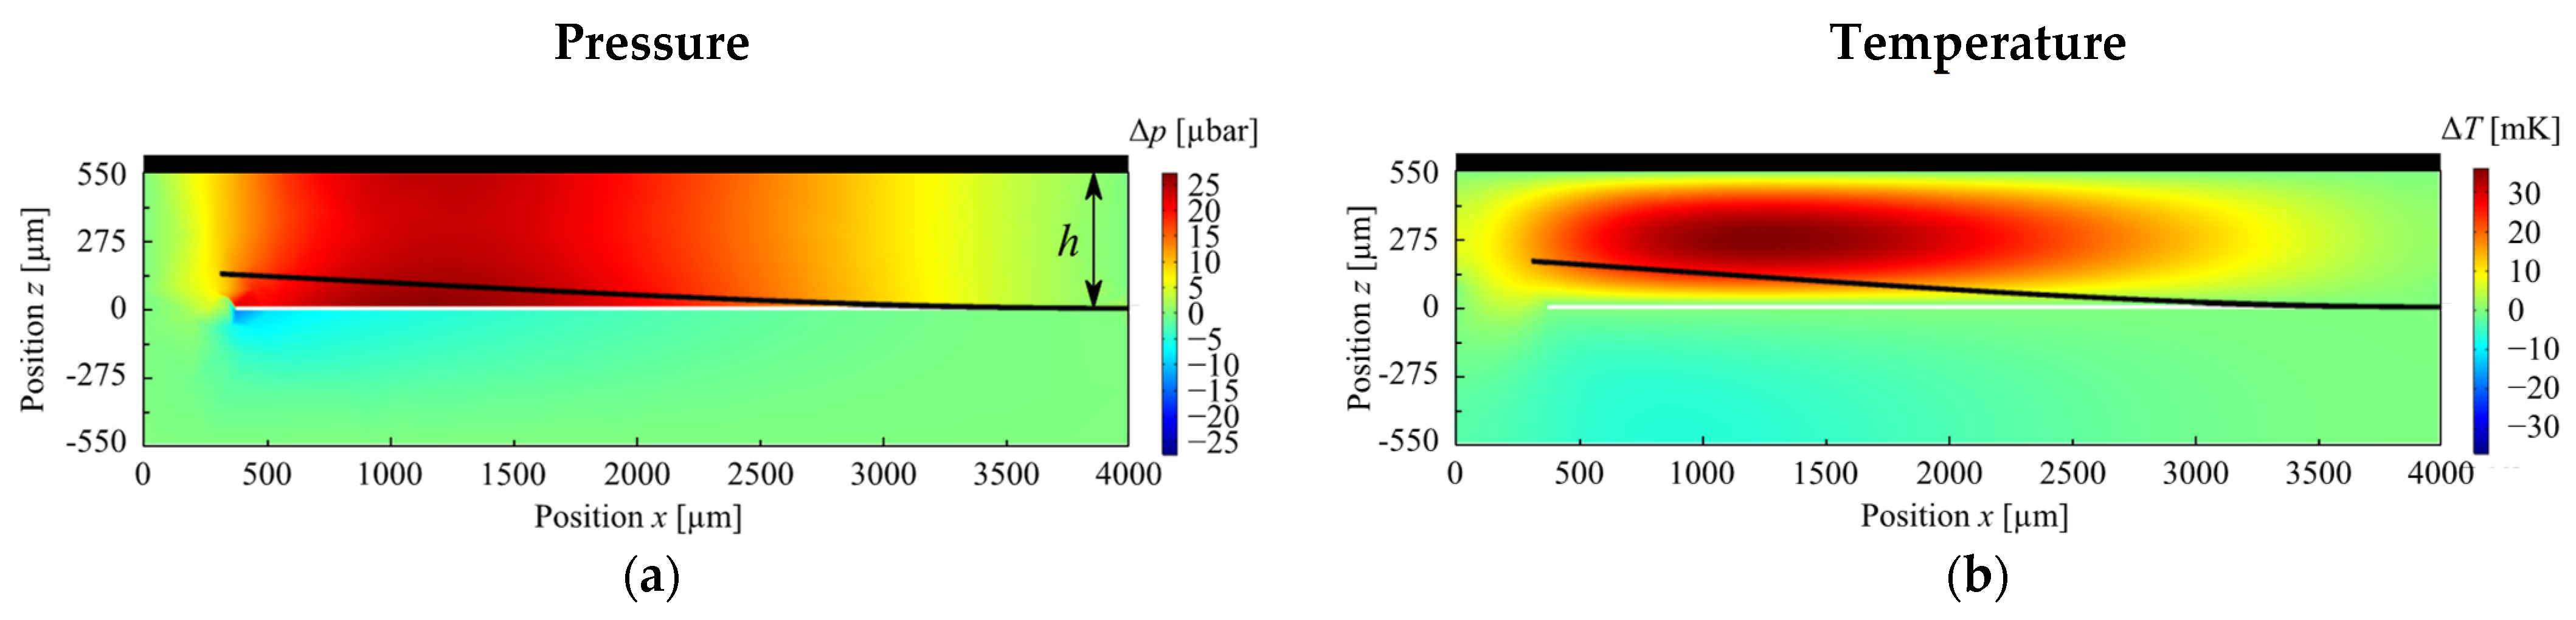
As a result, we obtain the pressure distribution and temperature distribution within the gap for the individual bending modes and geometric shapes. No significant difference between the distributions of the individual geometric shapes PO, BO, and CO is observed. Therefore, we only illustrate the distributions of a CO structure for the first three bending modes.
Figure 2a indicates a pressure increase Δ
p as well as the resulting temperature rise Δ
T within the gap due to the compression by the MEMS oscillator. Correspondingly, the same behavior in the opposite direction (expansion leading to pressure and temperature drop) can be observed on the bottom side. Furthermore, an asymmetry between the upper and the lower side is significant due to the spatial limitation of the gap towards the top. This asymmetry in the distributions decreases with increasing mode number and disappears almost completely up to the 3rd BM. From this, it can be concluded that the range of an interaction of the oscillator with a spatial boundary decreases with the mode number, respectively, with the resonance frequency.
4. Experimental Results
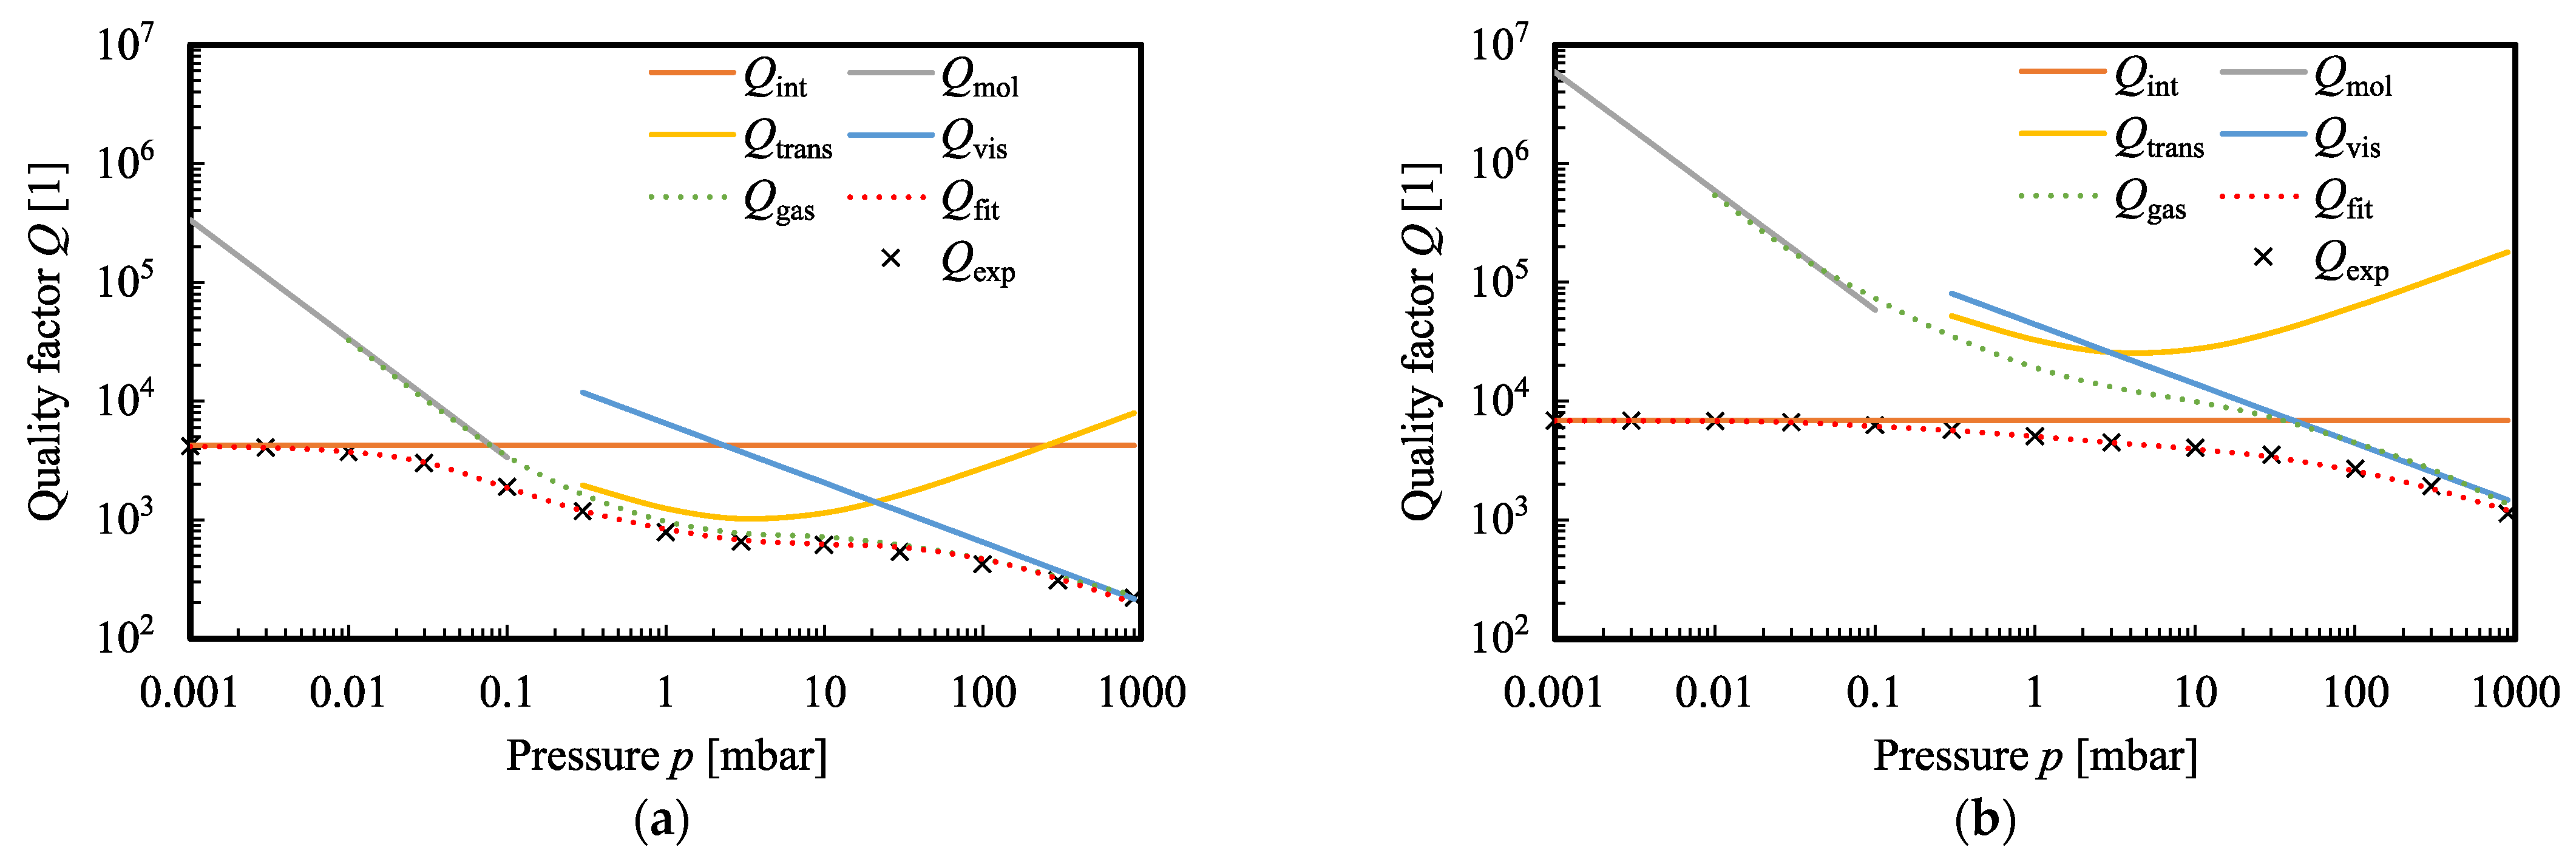
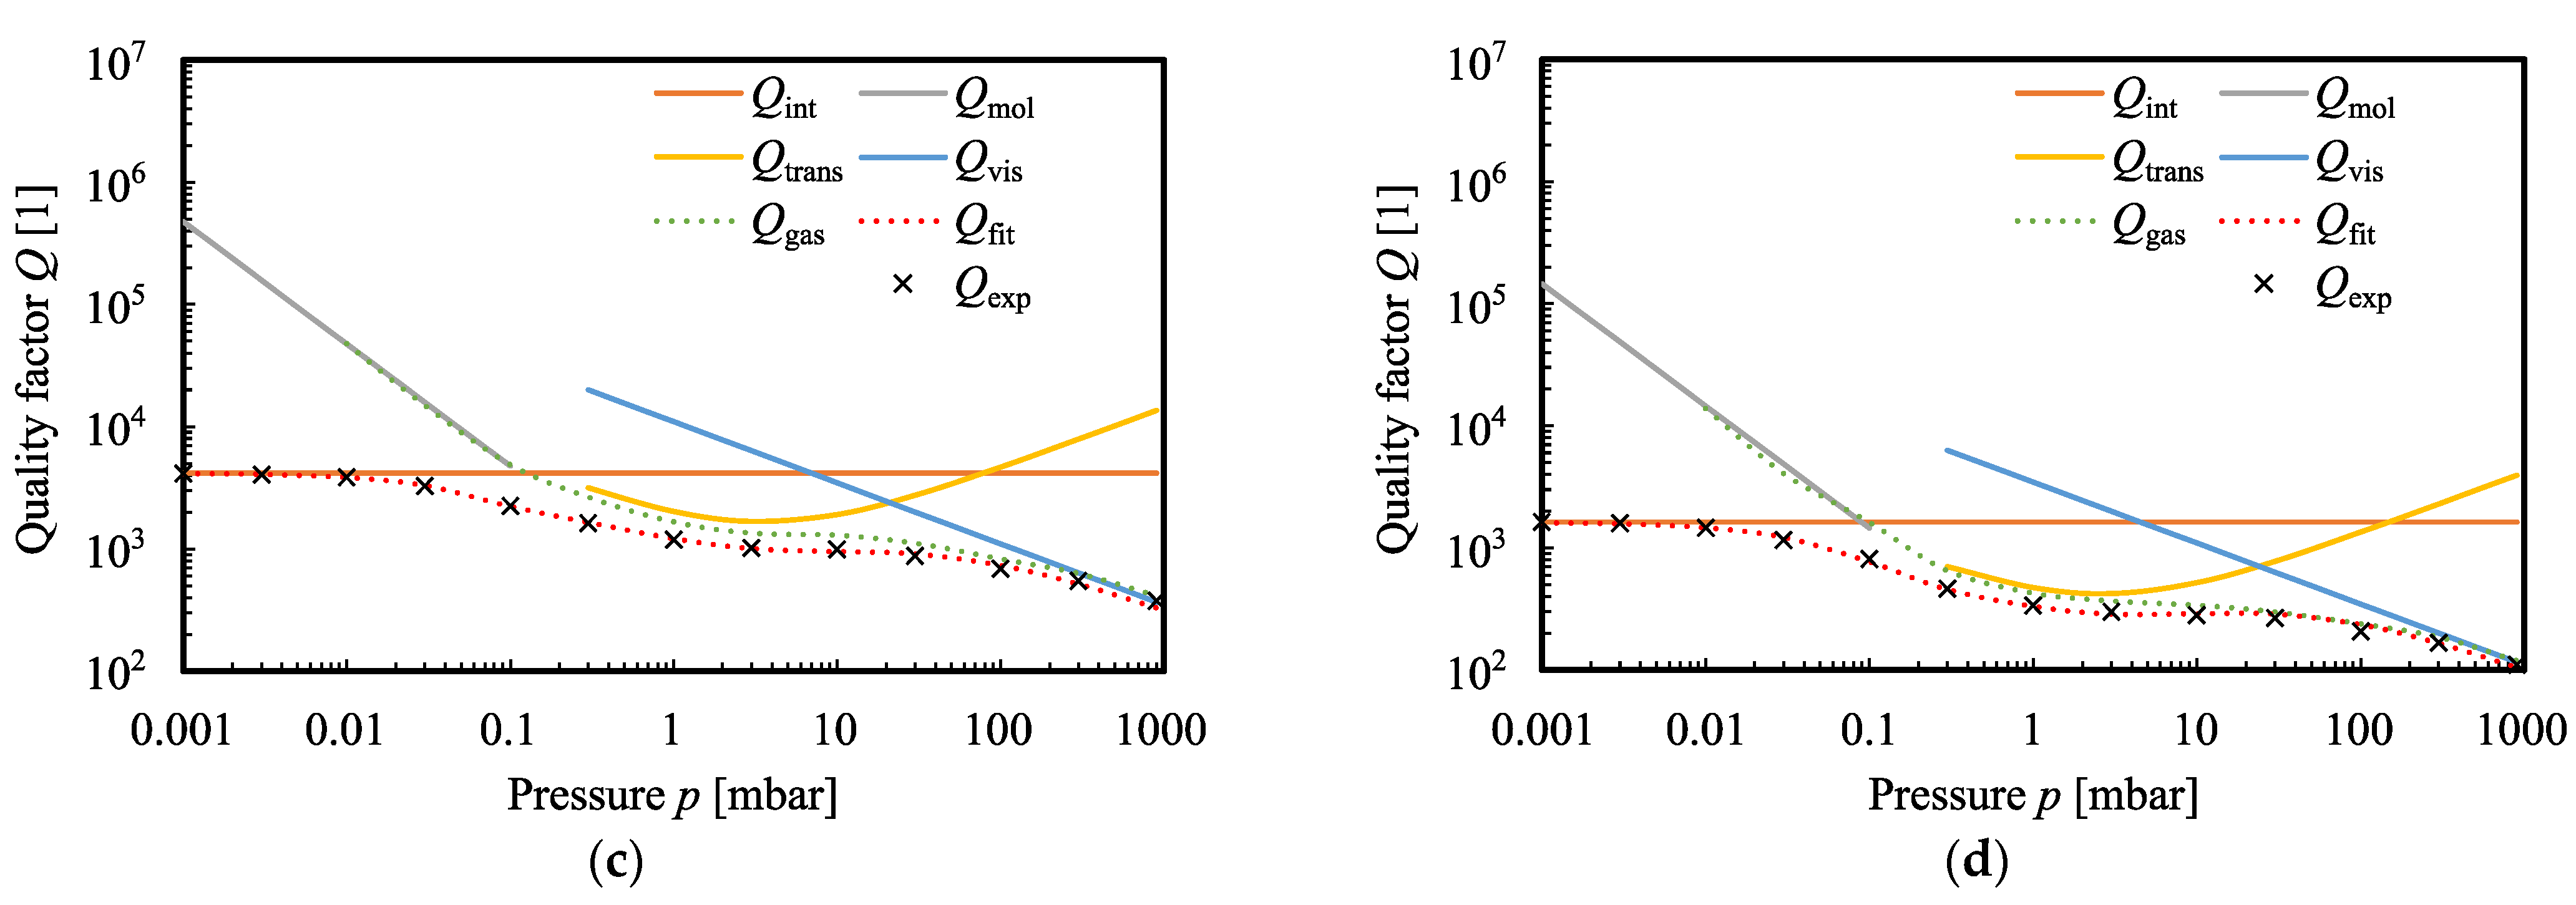
Figure 3 shows a composition of the experimentally-measured quality factor
Qexp consisting of the individual damping components, according to the theory section. The data show the quality factor plots for the 1st BM of the three different geometries and the 3rd BM of sensor BO for a gap width of 550 µm in a nitrogen atmosphere.
The fitting of the composition of the four different damping mechanisms was performed by a LabView nonlinear fitting tool. The quality of the fitting procedure was ensured by the coefficient of determination R2 which was exceeding the value of 0.99 for all cases (R2 = 1 is representing a perfect match between the experimental data and the theoretical fit.) The relative deviation of the fit model to the experimental data is in the range of 5%. Consequently, a very good agreement between the fitted quality factor Qfit and the experimental data over the entire pressure range can be achieved. The extrinsic gas part of the quality factor Qgas is calculated by subtracting the intrinsic damping and then is inserted additionally. Subsequently, for each gap width and mode, a set of parameters is obtained.
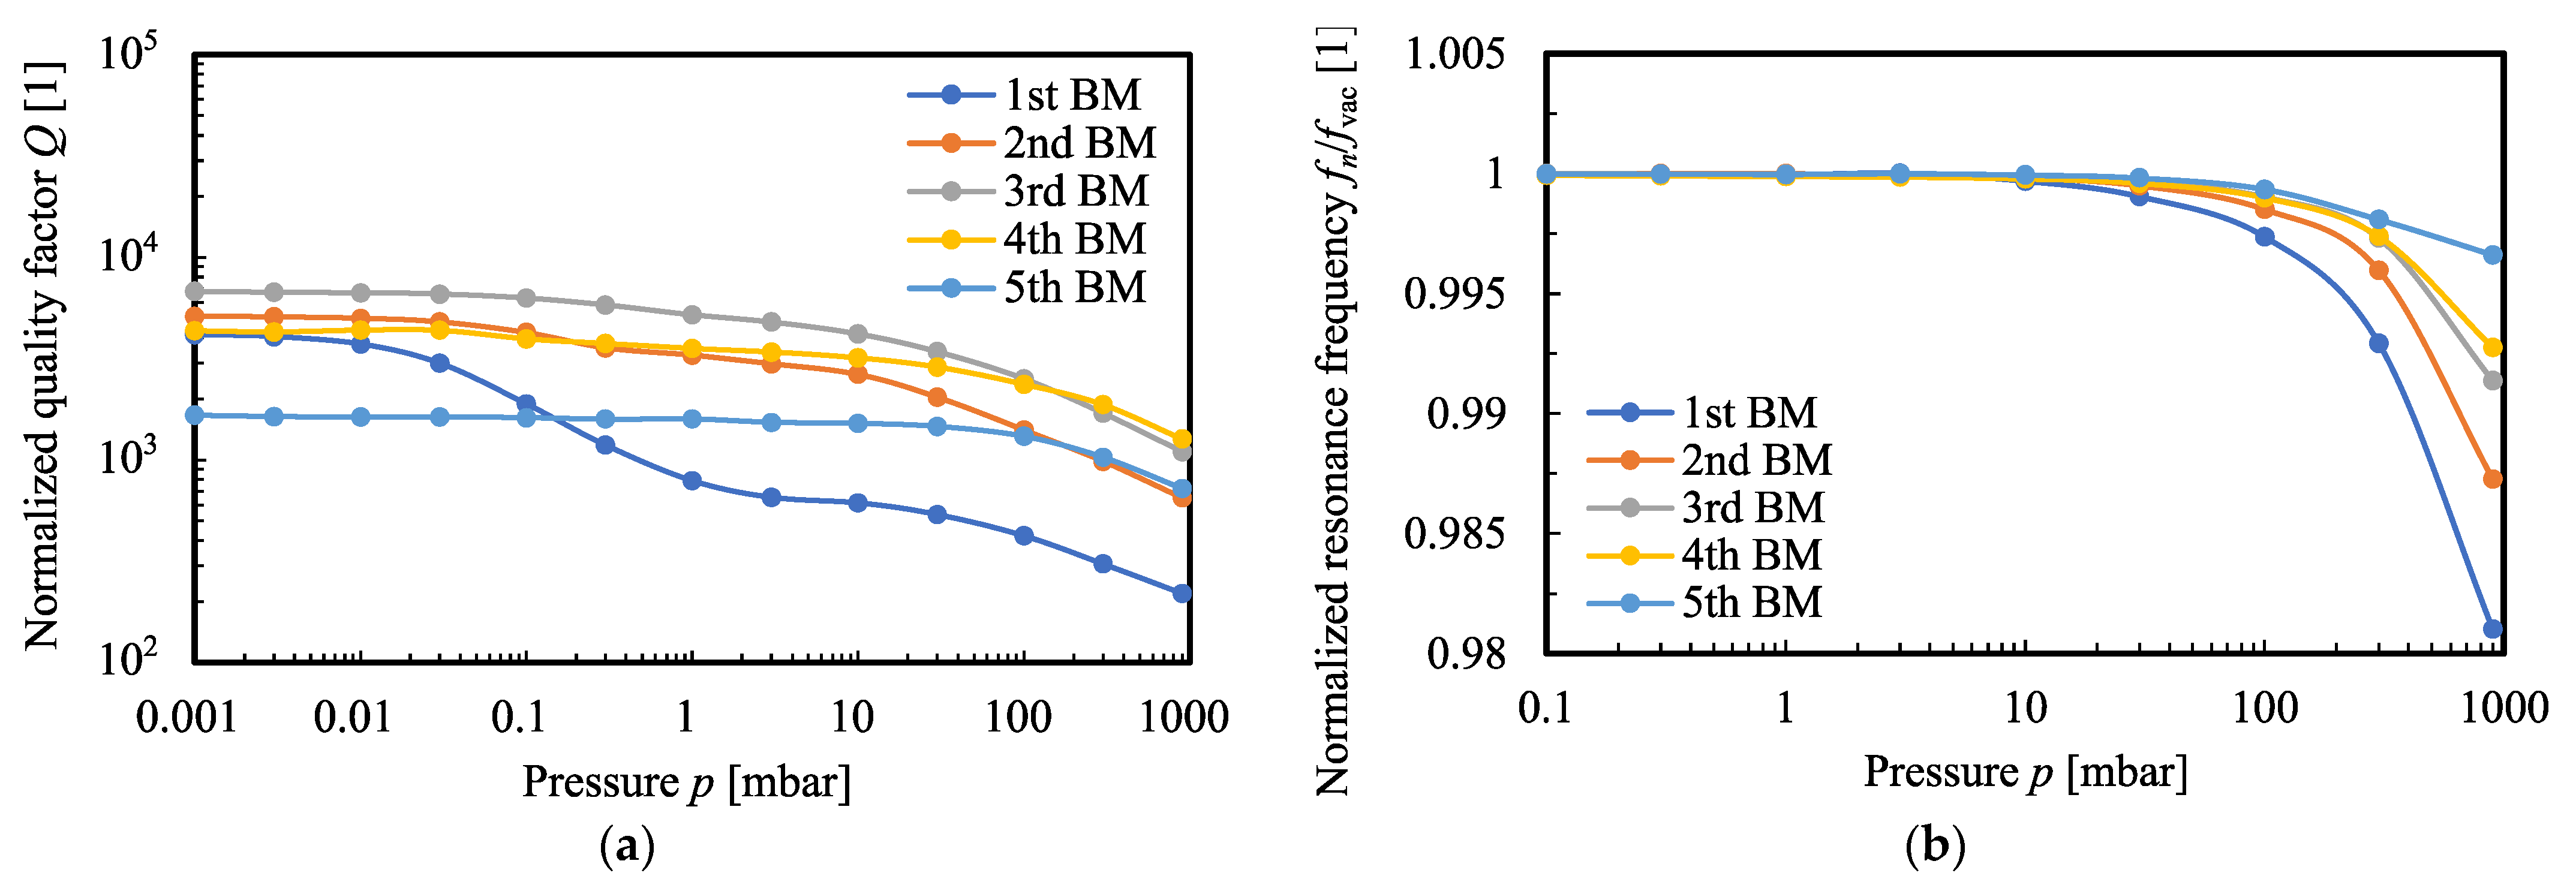
In
Figure 4a, the quality factor plot of micro-oscillator BO3 is depicted for the fundamental BM and the next higher bending modes up to a mode number of
n = 5. The strong decrease in the quality factor of the first BM in the medium pressure range is particularly noticeable. This is due to the stronger damping in the molecular flow regime (up to
p = 0.1 mbar) and due to the high thermal losses in the transitional flow regime caused by standing thermal waves [
14]. The first bending mode also has the largest oscillation amplitude, which results in a stronger interaction with the surrounding gas atmosphere and, accordingly, to larger damping losses. The strength of the damping decreases with the mode number and is mainly visible in the viscous flow regime. For mode 5, the intrinsic damping is very pronounced, which leads to a masking of the extrinsic damping losses.
For all bending modes, the strong damping in the viscous flow regime is common, which leads to a decrease in the quality factor as well as to a reduction of the resonance frequency (see
Figure 4b). The highest shift of the resonance frequency due to the strongest damping can also be seen in the 1st BM. The other modes are sorted according to the mode number.
In addition to the quality factor, the resonance frequency of the fundamental mode, as well as the higher bending modes of the MEMS oscillators, are investigated. The frequencies are measured in the vacuum range at 0.001 mbar and then associated with the bending modes using a laser Doppler vibrometer. Besides the bending modes there are other modes, such as torsional oscillations or more complex roof-tile-shaped modes, which are not considered in this work. All electrically-measured bending modes are summarized in
Appendix C. Based on the fundamental mode, the thickness of the MEMS oscillator is derived by means of FEM simulation. The results are shown in
Table 1. The MEMS oscillators BO1, BO2, BO3, PO1, and PO2 were fabricated on a wafer with a target thickness of 20 µm and the CO structures on a second wafer with a target thickness of 10 µm. These thickness values could be found numerically and are in the range of the variations of the etching process.
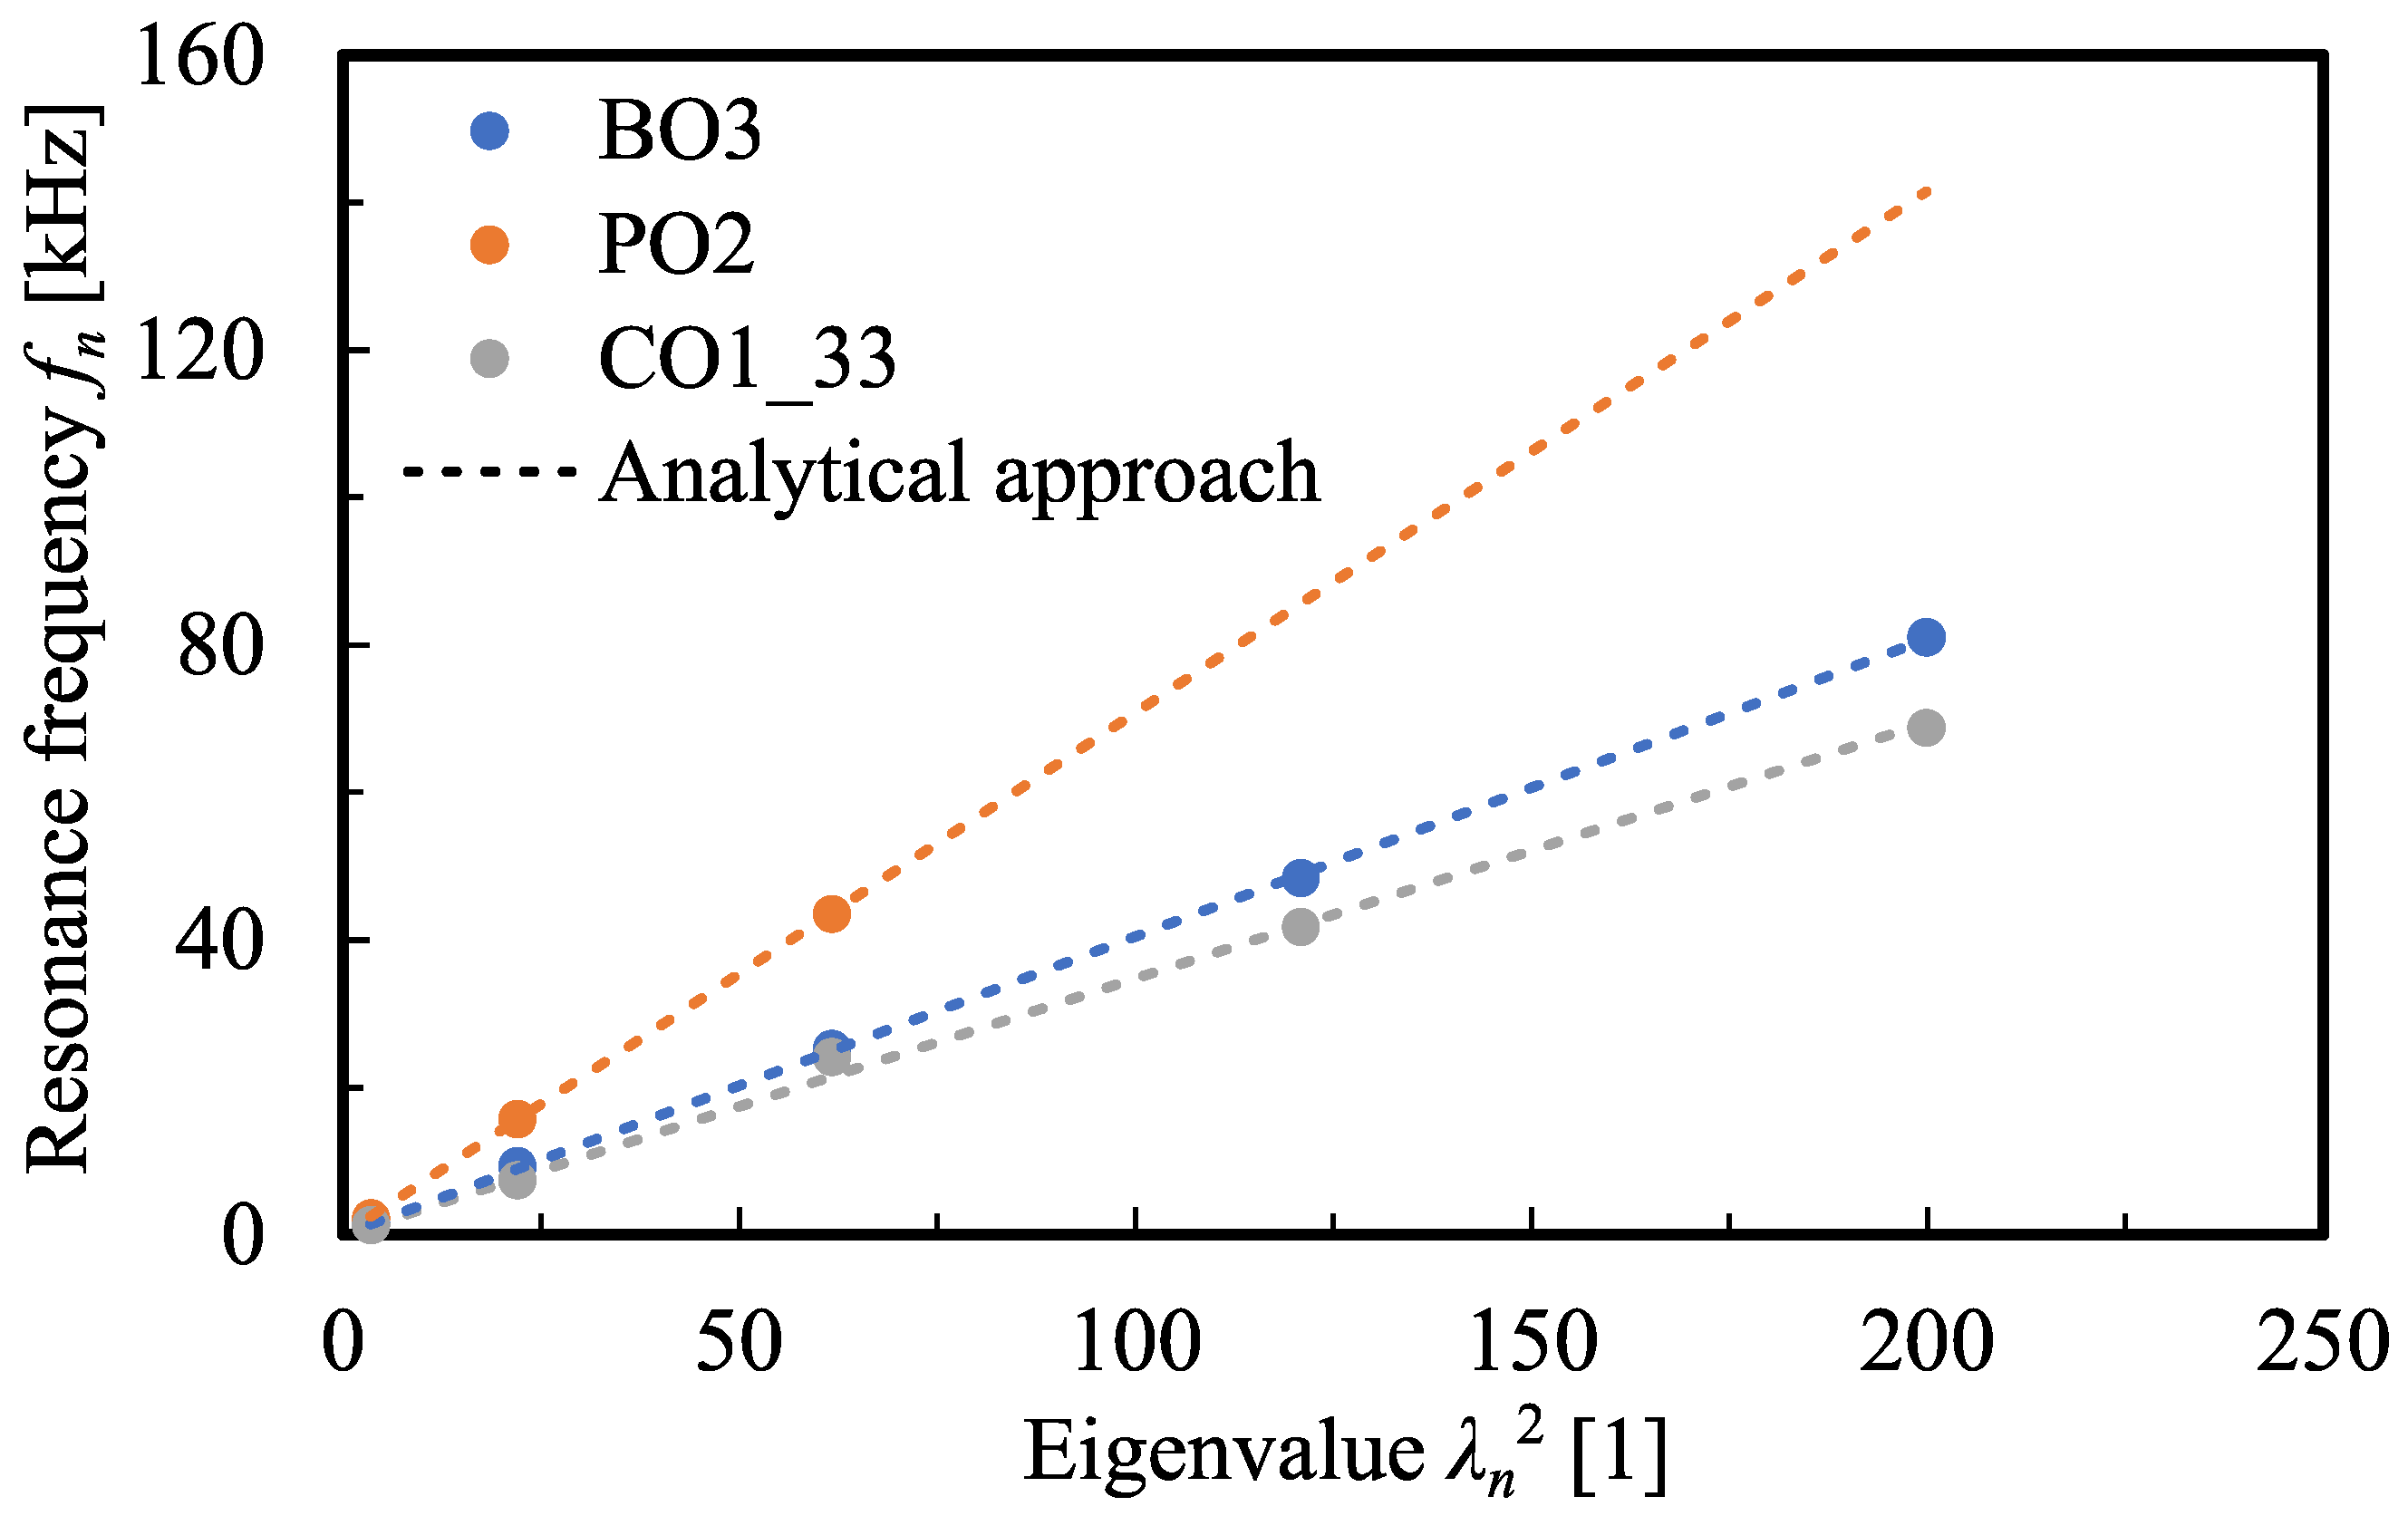
In the following, the resonance frequencies of the fundamental mode and the higher bending modes are plotted against the squared eigenvalue
λn. By means of the scaling factor
α, Equation (3) is fitted to the measurement points using the best fit method.
Figure 5 shows this exemplarily for a MEMS oscillator of each geometric shape and indicates a very good agreement with the analytical approach. The determined scaling values are listed in
Table 1. It is noticeable that the CO structures have the largest values. This is since the oscillator and the bending beam are congruent to each other. The dependence can also be observed on the coverage size. A larger actuator area counteracts the oscillation because the stress of the piezoelectric layer has an additional restoring effect. The smallest possible actuator area thus represents the ideal case of a fully oscillating structure.
For the BO and PO structures, on the other hand, the oscillating mass is mainly given by the oscillator plate dimension itself which is actuated via the beam structure. The larger the beam structure, the smaller the fraction of oscillating mass, after which the scale factor α decreases. Regarding the size of the coverage of the oscillator with the actuator surface, the same observation can be seen for the CO structures. The completely covered structures PO1_100 and PO2_100 show a lower scaling factor α than the regular structures PO1 and PO2.
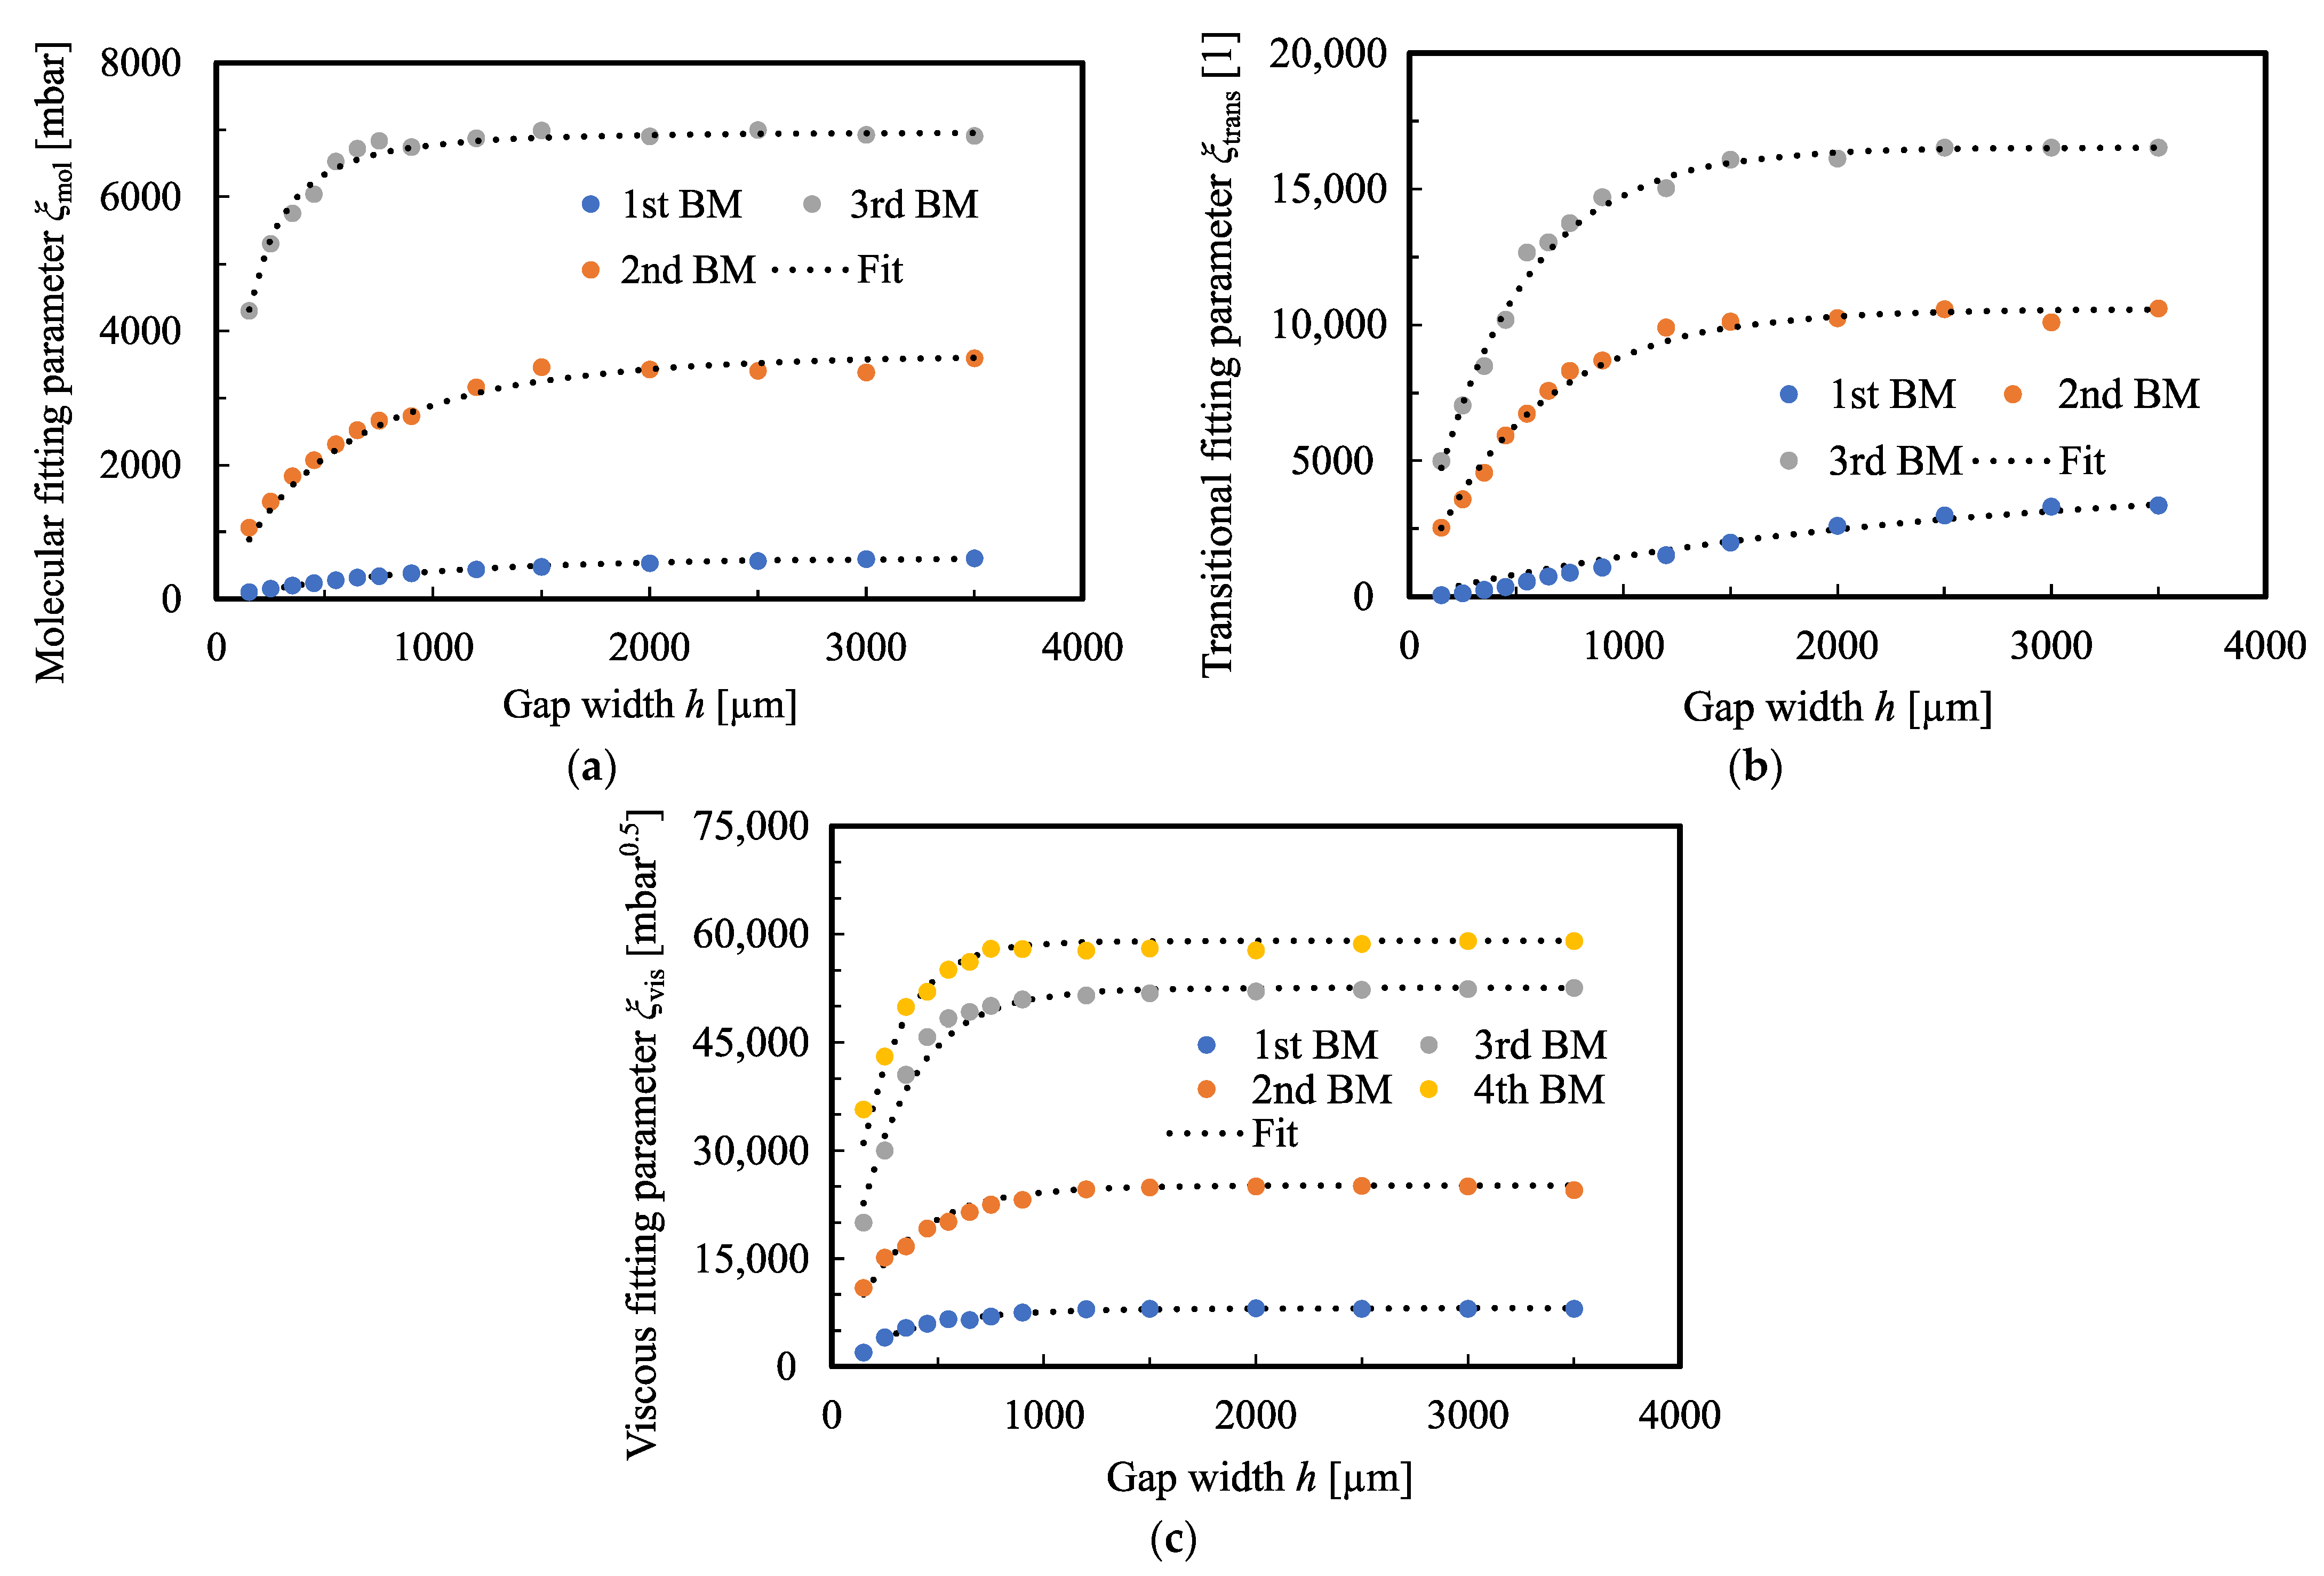
In the following section, the determined parameters obtained by the fitting procedure shown in
Figure 3 will be discussed. In
Figure 6, the fitting parameters are depicted as a function of the gap width. The parameters of the individual damping mechanisms show an increase with the gap width which leads to saturation for larger values of the gap width. The molecular fit parameter
has already been discussed in a previous paper [
25] and is excluded in the following. The parameters of the transitional flow regime (
) and the viscous flow regime (
) are fitted with the following function which describes an upward limited growth function:
The course is determined by the saturation value , which represents the horizontal asymptote of the function and by the characteristic length l*, which describes the speed of the increase of the gap width.
5. Discussion
By applying the generalized fit model, the quality factor plots of three different geometric shapes with different dimensions were fitted from the molecular to the viscous flow range and simultaneously for gap widths to a geometric boundary varying from 150 µm up to 3500 µm. As shown in the previous section, fit parameters were obtained that exhibit a gap width dependence, which can be described according to Equation (10). The determined quantities, the saturation value, and the characteristic length are analyzed in more detail in the following.
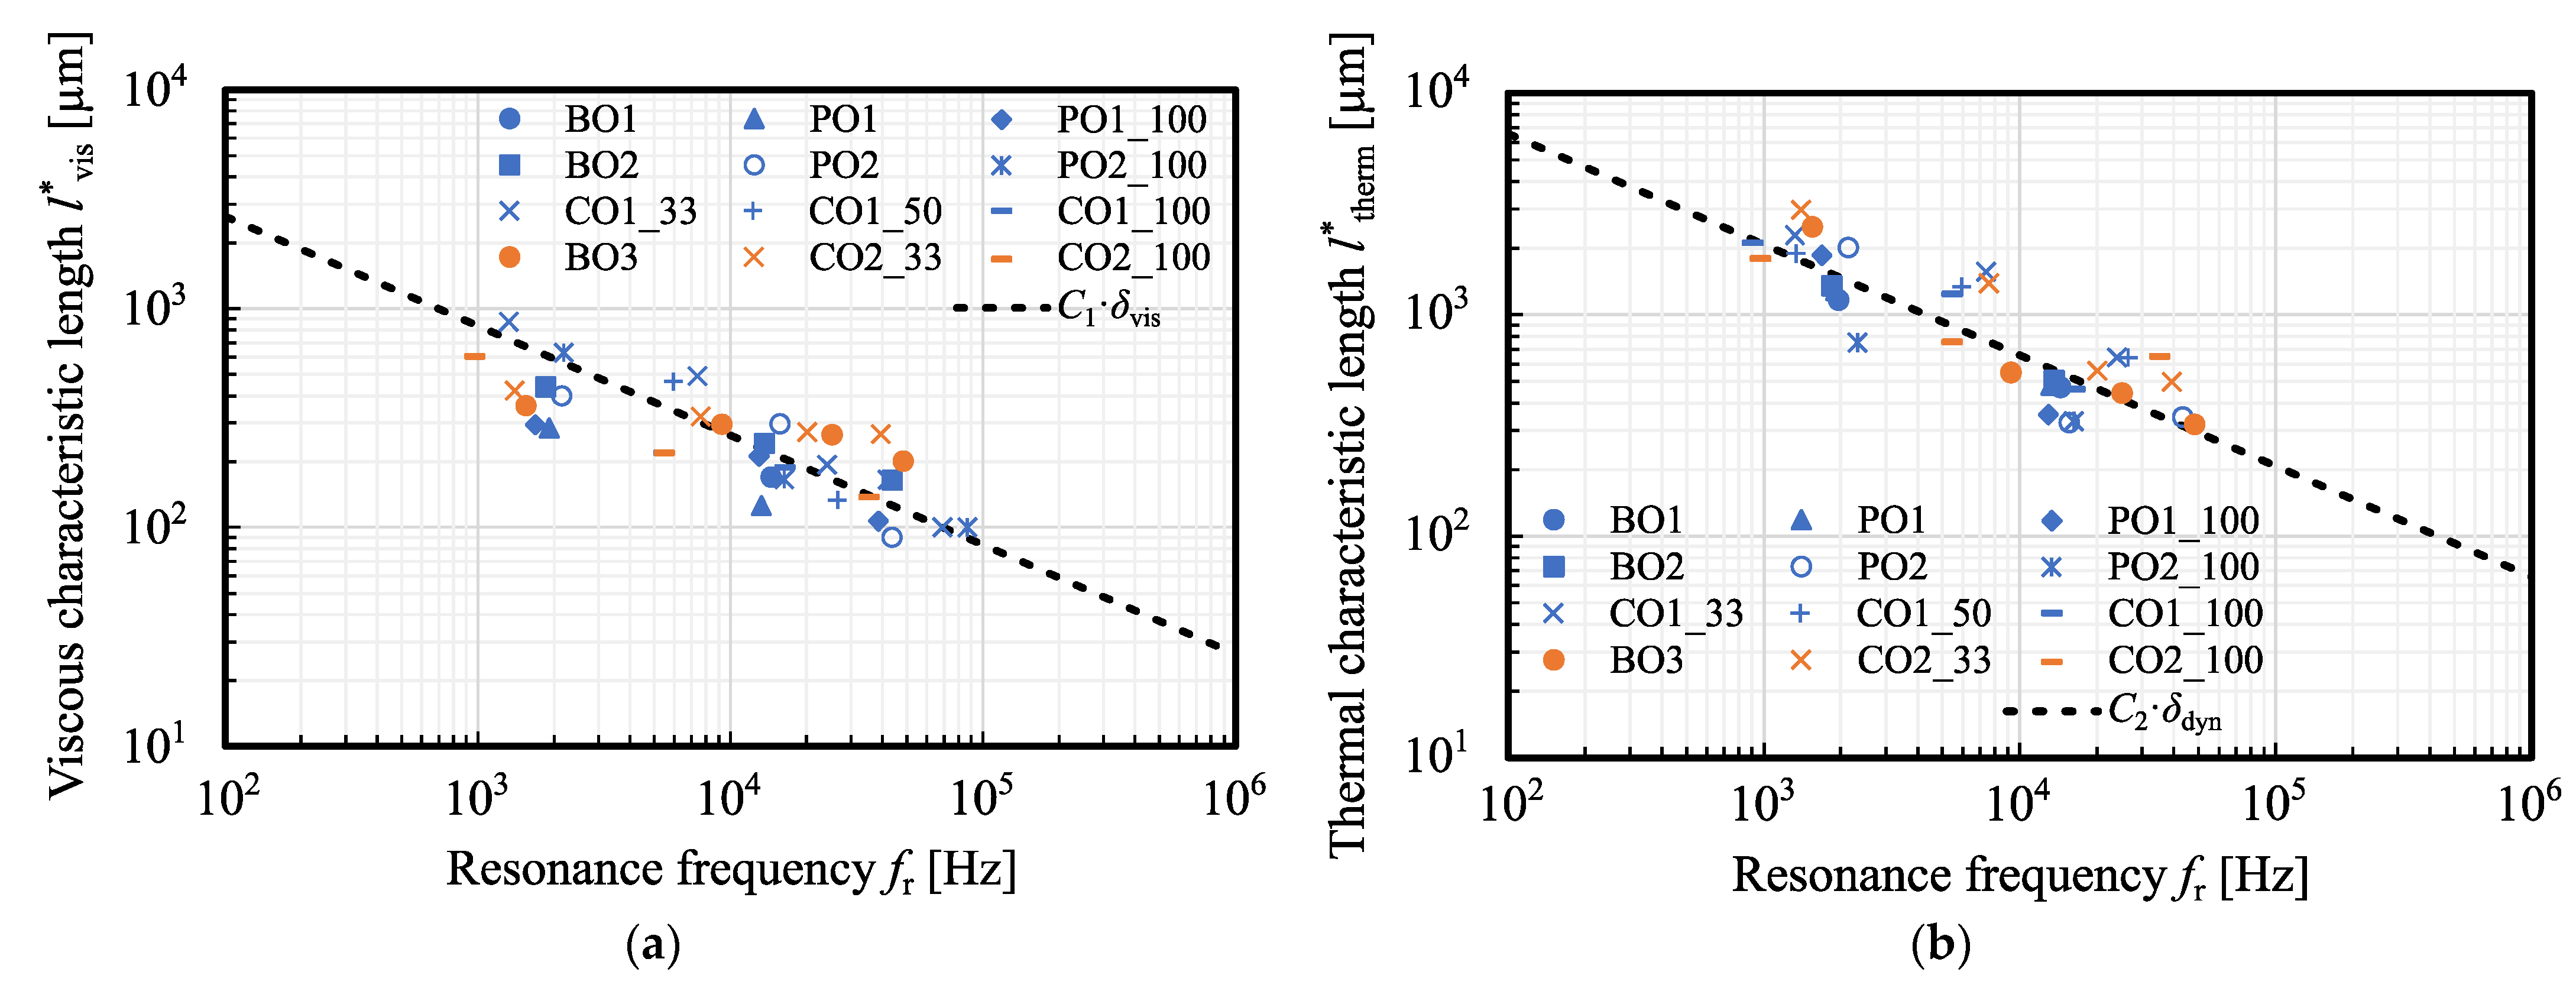
In
Figure 7, the characteristic lengths for the viscous and thermal damping are depicted. These characteristic lengths represent the range of the interaction with the geometrical boundary. A gap width in the range of the characteristic length thereby means an increase in the quality factor by 63% (=1 −
e−1) of the saturation value of a freely oscillating structure.
At a distance larger than three times the characteristic length, the damping has dropped to 5% of the original value. Thus, knowledge of the ratio of the distance characteristic can be taken as a measure of the strength of the damping.
In
Figure 7, a multiple of the viscous
δvis and the thermal
δdyn boundary layer thickness is inserted, which are given as a function of the frequency
f by the following equations [
31]:
with
μ,
ρ,
k,
Cp the dynamic viscosity, the density, the thermal conductivity, and the heat capacity at constant pressure, respectively. The gas properties for the fitting of the boundary layer thicknesses were taken from NIST [
32].
For the viscous damping, we find a characteristic length
l*
vis in the order of
C1 = 8–15 times the viscous boundary layer thickness depending on the MEMS oscillator and a mean value of 12. A similar consideration of the damping of the thermal resonance effects in the transitional flow regime yields to a thermal characteristic length
l*
therm in the range of
C2 = 20–30 times the thermal boundary layer thickness also depending on the exact oscillator geometry with a mean value of about 25. Thus, the thermal effects are generally more long-range than the viscous losses. Furthermore, the decrease in the characteristic length with frequency is observed which agrees with the FEM simulations (
cf. Figure 2). A higher mode or frequency interacts more short-range with a geometric boundary than the fundamental mode at a lower frequency.
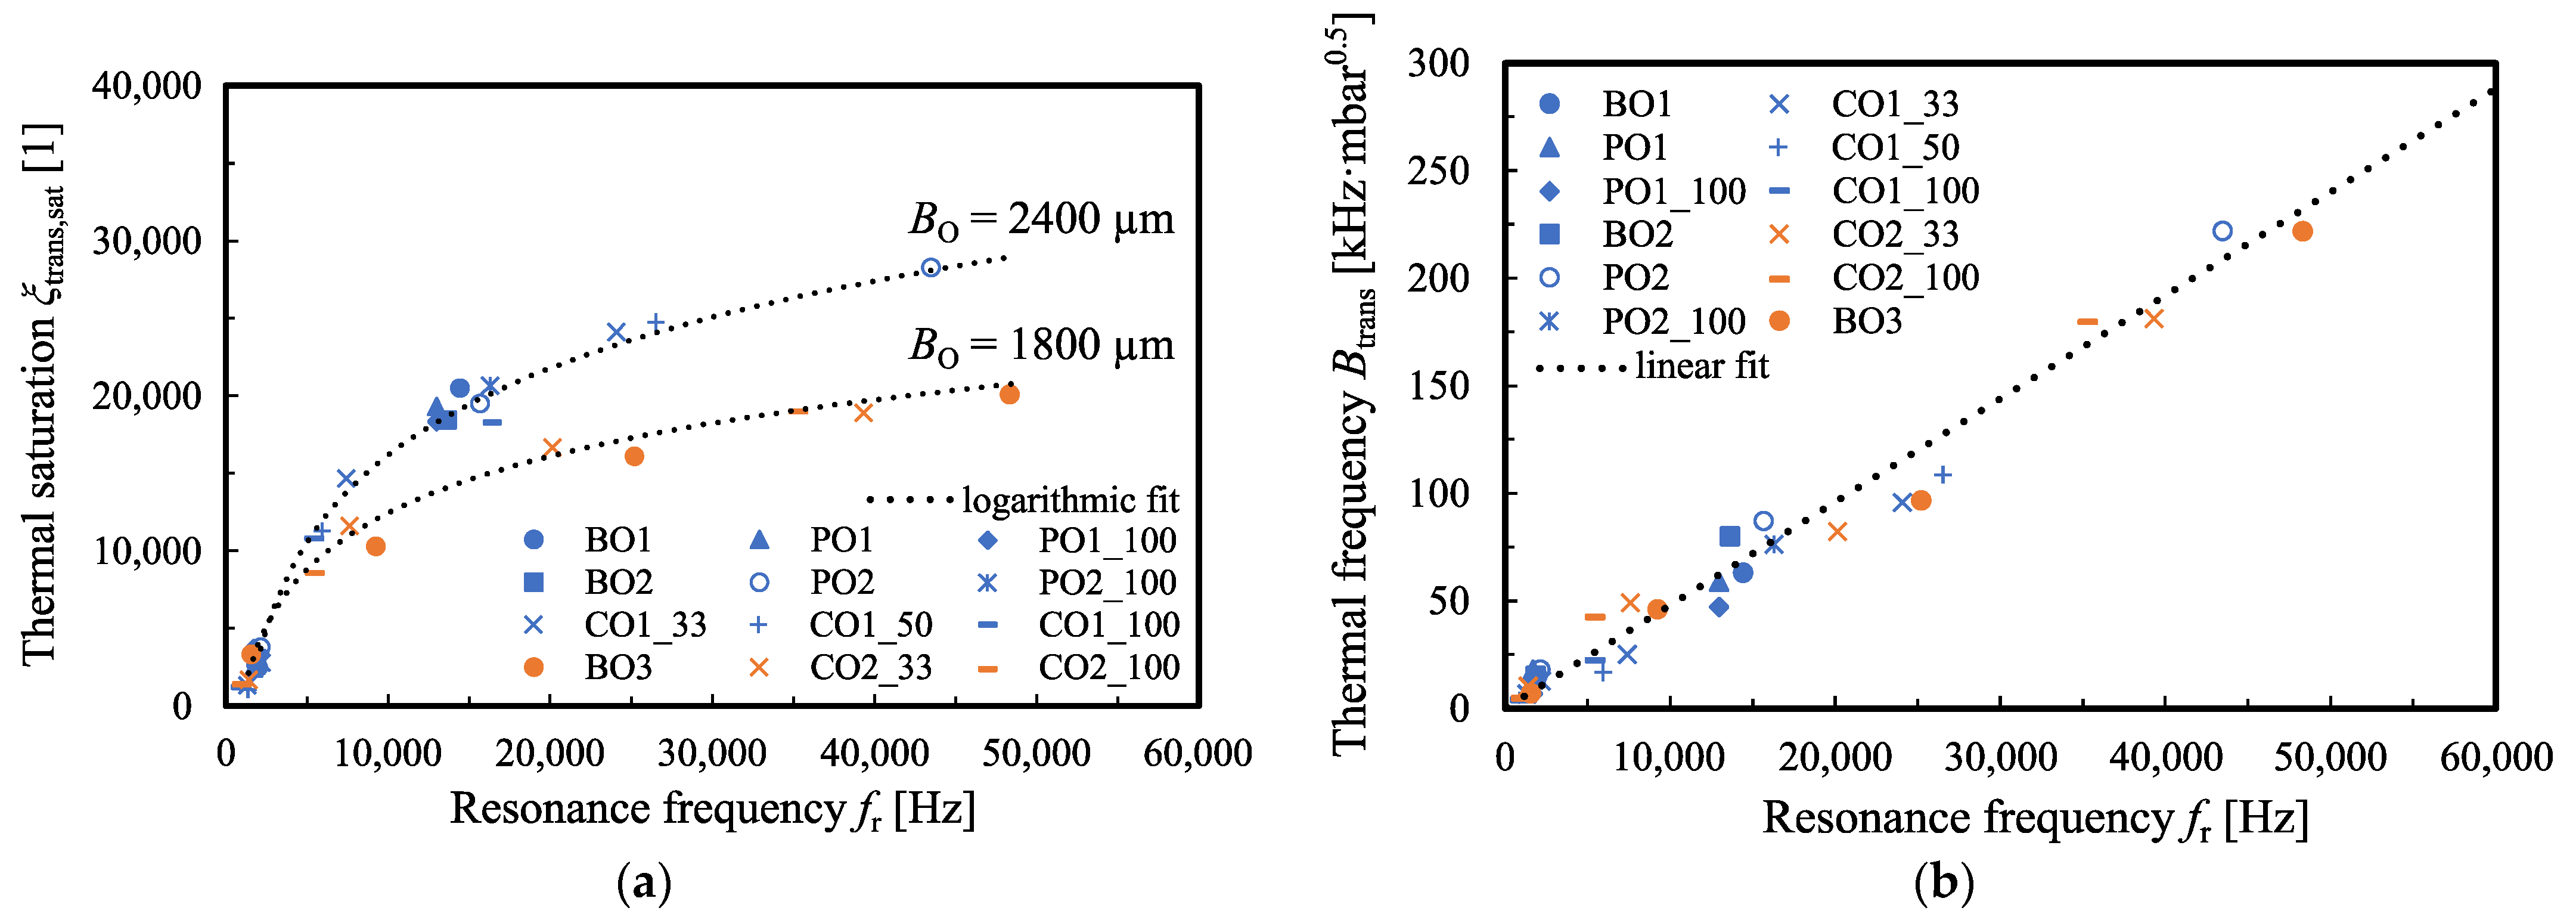
At large distances, a saturation value is obtained, which represents the ideal case of free oscillatory movement without the influence of spatial constraints. In
Figure 8, the saturation value for the thermal damping is illustrated. The measurement values clearly distinguish a difference between the MEMS oscillators regarding their width (Blue
BO = 2400 µm; Orange
BO = 1800 µm). The overall trend can be described by a logarithmic function which correlates with a strong decrease in the thermal damping with the frequency. Thermal resonance effects are therefore particularly pronounced at low frequencies or in the fundamental mode.
The pressure-dependent factor of the thermal resonance frequency shows a linear dependence on the mechanical resonance frequency (see
Figure 8b). This derives from the fact that the thermal and mechanical resonance frequencies match at a specific pressure, which we define as the thermal resonance pressure.
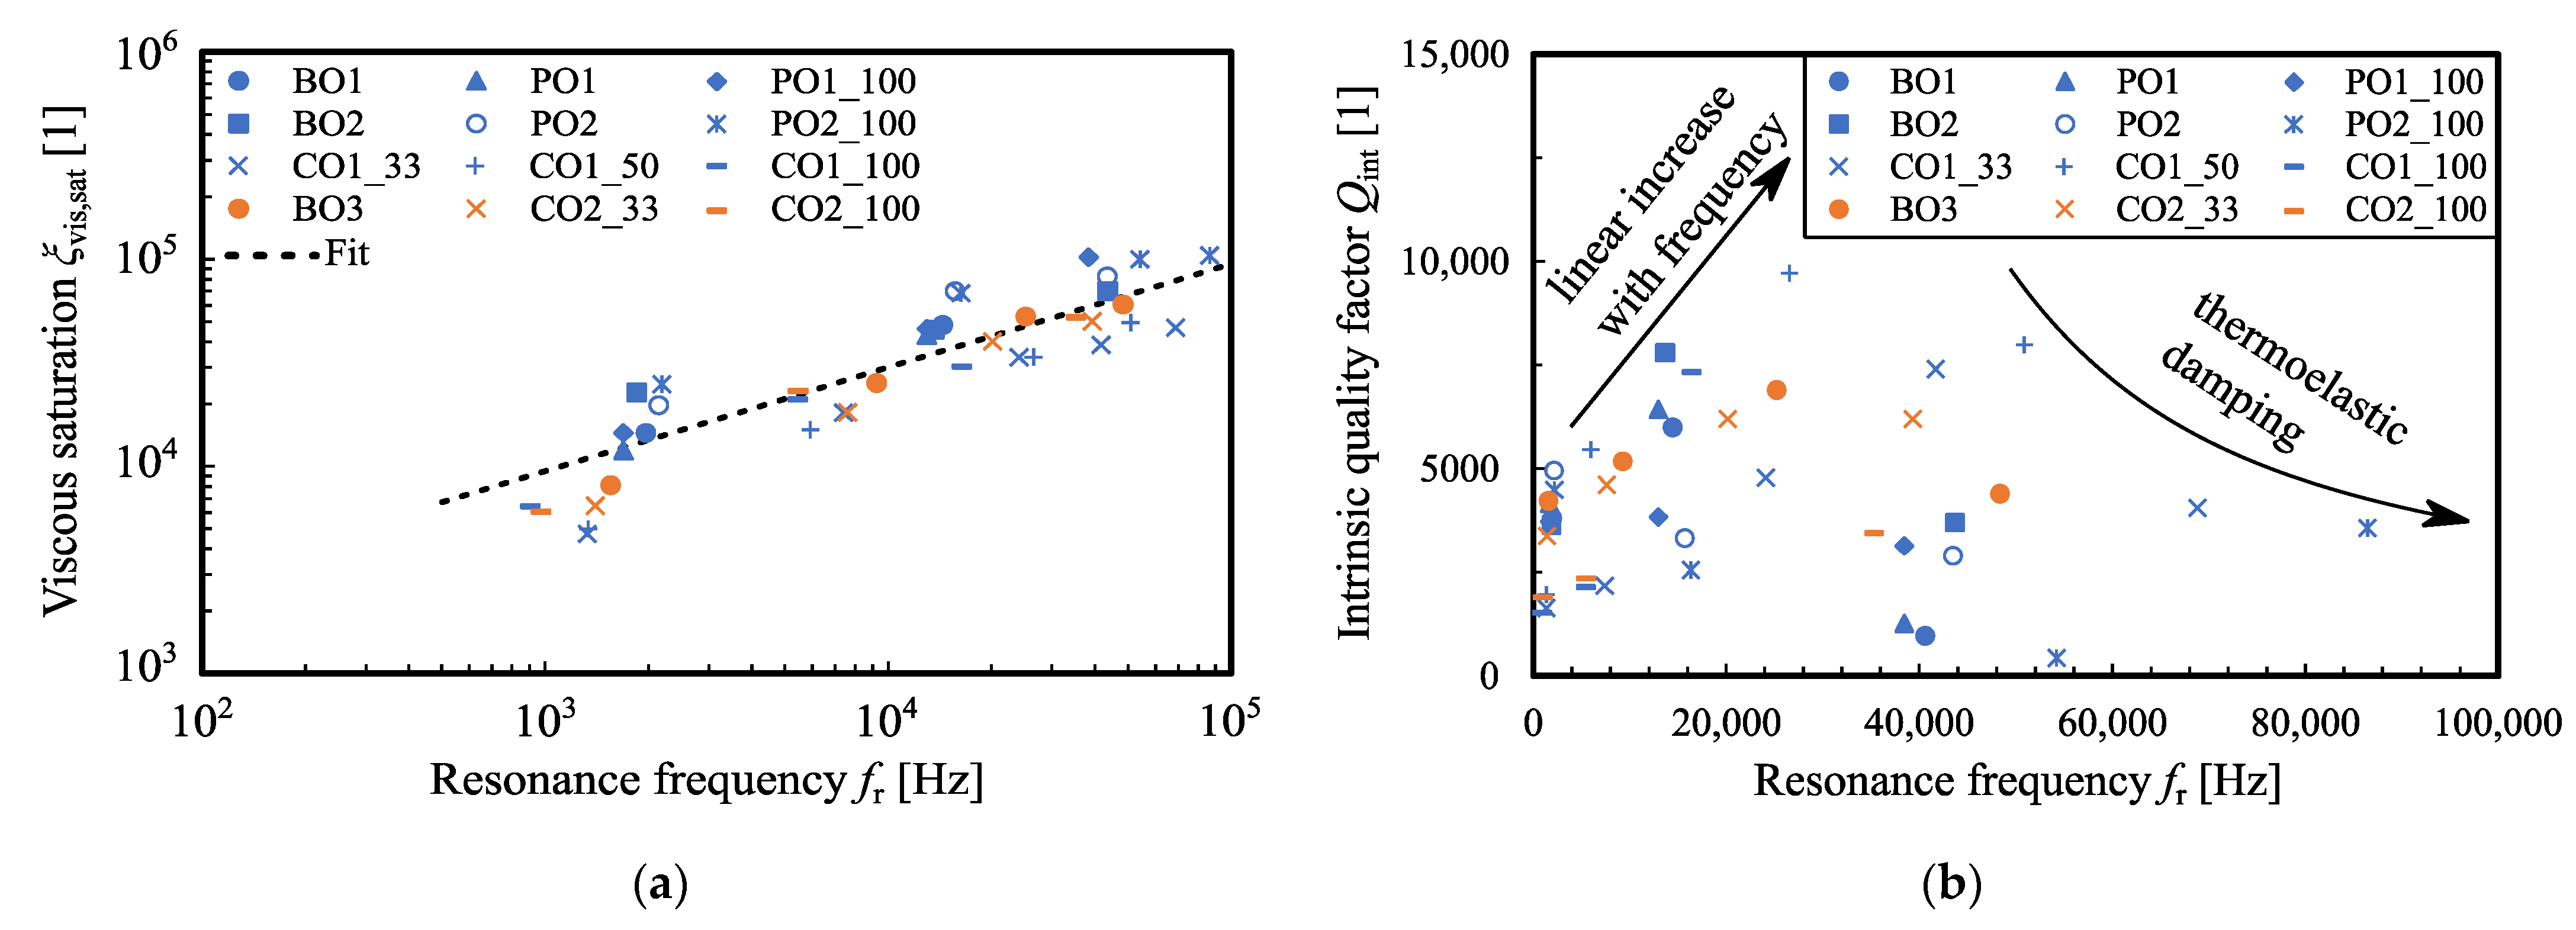
The viscous saturation value is predicted by various theories of a freely vibrating structure in a viscous medium. The resulting dependence of the viscous quality on the reciprocal root of the resonant frequency is plotted in
Figure 9 and reflects the general trend of the measurements. The individual MEMS oscillators differed in strength from each other due to the different geometries. It is noticeable that the cantilever structures have the highest damping. The further sorting is carried out according to the size of the surface of the MEMS oscillators after which only the absolute area of interaction with the viscous medium is decisive. This is different from damping in liquids where the perimeter of the edges and thus additional slits and edges are counterproductive. According to Basak et al., additional edges lead to turbulence effects which decrease the quality factor [
33].
The last point to be investigated is the intrinsic quality factor. All data are summarized in
Appendix C and plotted in
Figure 9b as a function of the resonance frequency. Several points are noticeable as a result. First, a larger beam structure leads to higher losses via the anchor. For this reason, the cantilever structures have the lowest intrinsic values. The BO and PO structures are sorted by their beam width. On the other hand, larger piezoelectric actuator films also have a negative effect on intrinsic quality. Up to a frequency of about 30 kHz, the quality factor increases approximately linearly with resonance frequency for all structures. At higher frequencies, the thermoelastic damping mechanism is dominant, which leads to a decrease in the intrinsic Q-factor [
34]. In general, it can be concluded that the intrinsic quality factor can be improved with the smallest possible actuator area and minimal anchor structures.
6. Conclusions
A generalized damping model based on the literature results for individual damping mechanisms was presented. First, an analytical description of the resonance frequency was presented, which is in good agreement with the experimental results for all considered geometries and allows numerical determination of the thickness T. The quality factor could be reproduced by superposition of four components for the three different oscillator geometries (BO, PO, CO) over six orders of magnitude of the Knudsen number Kn. The results of the fitting procedure were further analyzed and interpreted using FEM simulations. From these results, the pressure and temperature distributions within the gap caused by the micro-oscillator movement were obtained. The thermal and viscous interaction with the boundary was visualized and a decrease in the range of the effects with the resonance frequency and the mode number was observed. The decrease in the influence of the damping phenomena was also found experimentally and described with a saturation behavior, from which a characteristic length was obtained, which was used for the estimation of the range of the effects. From these results, indications for reducing the damping were found, thus giving opportunities for increasing the quality factor. Furthermore, the influence of a geometrical boundary due to the package or the mounting can be predicted. The results are briefly summarized below:
The range of viscous damping is about 8–15 times the viscous boundary layer thickness.
The measure of the strength is the surface which interacts with the viscous fluid and decreases with the resonance frequency.
The range of thermal effects in the transitional flow regime is about 20–30 times the thermal boundary layer thickness.
Exponential decreasing of thermal damping effects occurs with an increase in resonance frequency.
The thermal resonance frequency of the gas depends linearly on the mechanical resonance frequency of the micro-oscillator.
The intrinsic quality factor of the fundamental mode is limited by anchor losses and residual stress of the piezoelectric thin film. Therefore, the minimization of an anchor structure and the actuator area are recommended to maximize the intrinsic quality factor.
At higher modes, thermoelastic damping is crucial, which leads to a lowering of the intrinsic quality of higher modes.
With this model, we give an approach to describing the resonance frequency and quality factor of various MEMS oscillators as well as optimization possibilities to improve the performance of piezoelectric-actuated oscillators.


