Article

Integrating LCA with Process Modeling for the Energetic and Environmental Assessment of a CHP Biomass Gasification Plant: A Case Study in Thessaly, Greece

by
Ioannis Voultsos
,
Dimitrios Katsourinis
*,
Dimitrios Giannopoulos
and
Maria Founti
Lab of Heterogeneous Mixtures and Combustion Systems, School of Mechanical Engineering, National Technical University of Athens, Heroon Polytechniou 9, 15780 Zografou, Greece
*
Author to whom correspondence should be addressed.
Eng 2020, 1(1), 2-30; https://doi.org/10.3390/eng1010002
Submission received: 5 August 2020 / Revised: 15 September 2020 / Accepted: 17 September 2020 / Published: 21 September 2020

Abstract

:
The energetic and environmental performance of a cogeneration biomass gasification plant, situated in Thessaly, Greece is evaluated via a methodology combining process simulation and Life Cycle Assessment (LCA). Initially, the gasification process of the most common agricultural residues found in the Thessaly region is simulated to establish the effect of technical parameters such as gasification temperature, equivalence ratio and raw biomass moisture content. It is shown that a maximum gasification efficiency of approximately 70% can be reached for all feedstock types. Lower efficiency values are associated with increased raw biomass moisture content. Next, the gasifier model is up-scaled, achieving the operation of a 1 MWel and 2.25 MWth cogeneration plant. The Life Cycle Assessment of the operation of the cogeneration unit is conducted using as input the performance data from the process simulation. Global Warming Potential and the Cumulative Demand of Non-Renewable Fossil Energy results suggest that the component which had the major share in both impact categories is the self-consumption of electricity of the plant. Finally, the key conclusion of the present study is the quantification of carbon dioxide mitigation and non-renewable energy savings by comparing the biomass cogeneration unit operation with conventional reference cases.

1. Introduction

The key priority of the European Union (EU) Climate Policy is to prevent climate change by substantially reducing greenhouse gas emissions, while encouraging other nations to contribute to this goal. The main target set by the EU for 2050 is to achieve carbon neutrality by a 60% emission reduction, realized through a 53% and 24% share of renewable energy sources and hydrogen to the final electricity demand, respectively, as well as an energy import reduction from 55% to 20% [1,2,3]. Solid biomass is abundant in the EU countries and accounts for more than 60% of the current renewable energy production in the EU-28 [4]. The allocation of biomass share in final energy consumption is dominated by heat (75%), followed by electricity (13%) and transport fuels (12%). CO2 emissions from biomass usage are considered carbon neutral because the CO2 emitted is thought to have been absorbed by the plant via a continuous natural balance of CO2 during its life cycle (CO2 intake for biomass growth and CO2 emission during decay).
Although there are several types of biomass (forest residues, energy crops, etc.), this paper focuses only on agricultural residues, because the Thessaly region is a vital agricultural area of Greece, producing several waste byproducts, which originate from various agricultural practices. This unexploited renewable energy potential can contribute to Greece’s efforts in cutting down in-house CO2 emissions. Additionally, the ash produced by the biomass usage contains high amounts of inorganic material like calcium and nitrogen compounds, and can therefore be used as a fertilizer [5,6,7].
The thermochemical conversion of biomass to energy can be done with direct combustion, pyrolysis and gasification [8]. Biomass gasification is a process in which solid biomass is transformed into a gaseous product via a complex series of chemical reactions and mass and energy balances. This transformation requires a gasification medium (air, oxygen or steam) by which, the hydrogen-to-carbon ratio of the final product can be higher than that of the original biomass source. Gasification is extensively used because its gaseous product, the synthesis gas (or syngas) can be burned at higher temperatures, raising the overall efficiency of the energy conversion process [8,9,10].
The gasification of solid fuels is not a modern invention. It was introduced for street lighting gas supply in industrialized countries in the early 19th century, as well as for liquid fuel production during World War II [11,12]. However, due to the environmental problems caused by fossil fuel consumption, biomass gasification has emerged as an energy production alternative, leading to local energy self-sufficiency and offering communities various economic and environmental benefits [8].
Experimental data about biomass gasification is readily available in the literature [13,14]. On the other hand, the complex and multi-parametric gasification process has been approached through extensive mathematical modeling efforts. Non-experimental sensitivity analysis under various operating conditions is quite commonly applied, providing a deep insight into the process at minimum cost, while also facilitating design optimization. Detailed Computational Fluid Dynamics (CFD) calculations have been thoroughly used for the modeling of biomass gasification reactors [15,16]. Given that the goal of the model is to predict the overall process efficiency and the general behavior of the gasifier operation, simple 0-D global models are preferred. Those may include reaction kinetics or adopt a thermodynamic equilibrium between the produced gases and solids [17].
The Aspen Plus process simulator is a simple and commonly used software in which 0-D models can be simulated. Lan et al. (2018) developed an integrated system model for a biomass gasification-gas turbine operation for power generation using Aspen Plus [18]. Han et al. (2017) modeled the operation of a fixed bed, downdraft gasifier, which used hardwood chips [19]. The model was validated against the experimental results from Wei et al. (2009) [20], and a sensitivity analysis was performed in order to investigate the effects of equivalence ratio, gasification temperature and moisture content on the operating conditions. Damartzis et al. (2012) modeled the operation of a bubbling fluidized bed biomass gasification unit coupled with an internal combustion engine in Aspen Plus, by using reaction kinetics instead of equilibrium models [17]. The model was validated with data from previous studies and was used to perform a sensitivity analysis to predict the system’s behavior under variable gasification temperature and equivalence ratio. Marcantonio et al. (2020) [21] developed a quasi-homogeneous model in Aspen Plus to simulate biomass gasification in a fluidized–bed reactor. The model was validated for hazelnut shell gasification with various oxidizing agents, and predicted syngas compositions showed a good agreement with the experimental data.
When approaching the problem of assessing the environmental profile of energy conversion systems, it becomes evident that indirect (off-site) emissions (caused by the generation of electric consumptions or alongside the supply chain of fuels and raw materials) should be incorporated in the analysis. Therefore, a broader energetic and environmental evaluation of the gasification and energy production processes should be sought [22]. Life Cycle Assessment (LCA) is widely used to assess the environmental aspects and potential impacts of a process by using an inventory of system inputs and outputs and by interpreting the results of the inventory analysis according to the objectives of the study [23,24].
Studies on the Life Cycle Assessment (LCA) of energy production by biomass gasification and other biomass utilization techniques are widespread in the literature. Adams and McManus (2014) assessed the net energy production and the potential environmental effects of wood waste gasification in a 230 kWel and 500 kWth Combined Heat and Power (CHP) plant powered by an entrained flow gasifier, using SimaPro 7.3 [25]. Kimming et al. (2011) conducted the LCA for a 100 kWel CHP plant, situated in the village of Vastra Gotaland, in Sweden, in which a downdraft gasifier, fueled with willow chips, supplied synthetic gas into an internal combustion engine [26]. Yang et al. (2018) studied the Green House Gas (GHG) emissions by the major operational components of the pioneer Jiangsu Lisen 20 MW CHP plant, which is powered by four fluidized bed gasifiers and four exhaust heat recovery boilers and is situated in the city of Yancheng, China [27]. Tagliaferri et al. (2018) carried out the LCA of a 2 MWel and 8 MWth Organic Rankine Cycle (ORC) CHP plant, supplied by forest biomass, which powers the Heathrow terminals 2 and 5, in order to assess the energy conversion process which positively contributes the most to the environmental impact of the plant [28]. Nguyen and Hermansen (2014) conducted an LCA study of all processing steps (cultivation, collection and pre-process and thermochemical conversion to electricity) of miscanthus gasification for electricity and heat production [29]. Guerra et al. (2017) identified the thermodynamic and environmental effects of scaling up existing cogeneration units in order to use sugarcane biomass as fuel via a plant LCA [30].
Most LCA studies on energy production via biomass gasification use fixed data from previous simulations and do not benefit from the advantages of detailed process modeling. As a consequence, results are not case-specific and are not adapted to the plant configuration and the feedstocks involved. Furthermore, the use of literature data does not promote comprehensiveness, since the influence of the variation of key operational parameters (equivalence ratio, gasification temperature and raw biomass moisture content) to the biomass gasification process are not considered. Overall, there are only few reports coupling process simulations together with LCA, and most of them are not directly linked to biomass gasification [22,31,32]. However, Hamedani et al. (2018) [33] performed an LCA study to evaluate the environmental profile of a real, small-scale, biomass-based hydrogen and electricity production system. They specifically focused on the effect various aspects and alternative scenarios of the gasification process have on the examined impact categories. Furthermore, Hamedani et al. (2019) [34] combined data envelopment analysis (DEA) and LCA in order to assess the sustainability of bioelectricity production by vineyard waste biomass gasification. The primary objective of this work is to introduce a comprehensive and integrated model based on the coupling of Aspen Plus and SimaPro, with the ability to assess the energetic and environmental performance of a prospective 1 MWel and 2.25 MWth cogeneration biomass gasification plant in Thessaly, Greece. The developed model provides the necessary flexibility to simulate all types of gasification layouts and operating conditions (different cases of biomass quality, equivalence ratio, gasification temperature, electric and thermal output of the cogeneration plant). The advantages of the approach are showcased via a sensitivity analysis that establishes the effect of gasification temperature, equivalence ratio and raw biomass moisture content over the gasification efficiency and the quality of the produced syngas. The obtained data are coupled with local biomass availability scenarios and are used as inputs to the Life Cycle Assessment of the cogeneration unit, so as to highlight its environmental benefits.

2. Materials and Methods

2.1. Case Study Description

The prospective CHP power plant is considered to power a village of 1500 residents located in Thessaly, Greece, which is the leading area of Greek large-scale farming and farming-related industry (fertilizers, agricultural tooling and machinery production, dairy and cereal production). Therefore, biomass in the form of agricultural residues is abundant and can potentially be used for the production of electricity and heat for local villages and industries. Given that the plant installed capacity depends on biomass availability and on costs associated with plant construction and operation, biomass collection, storage and transport, the biomass gasification the CHP plant is proposed to have an electricity output of 1 MWel, in order to provide local self-sufficiency at a reasonable cost [35,36].
Certain assumptions had to be made regarding the specific CHP technologies considered in the integrated process and Life Cycle Assessment modeling. The power-to-heat ratio as well as the electrical and thermal efficiency of the investigated plant were taken from data available in the literature on an actual CHP plant, situated in Güssing, Austria. The Güssing plant is a 2 MWel state-of-the-art and well optimized unit, operating since 2002 [37]. Its basic operational parameters (power-to-heat ratio, electrical, thermal and total efficiency) are considered in the 1 MWel Greek prospective plant. The assumed operational parameters in the prospective Thessaly plant are summarized in Table 1.
Wheat straw, corn stover, cotton stalk, olive branches and almond prunings are identified as the most common agricultural residues in Thessaly, Greece [38]. Their most significant characteristics are described in the works or Rentizelas et al. (2009), Voivontas et al. (2001) and Papadopoulos and Katsigiannis (2002) [38,39,40] and are presented in Table 2. Rentizelas et al. (2009) also suggested that, in order to power a 1 MWel tri-generation plant, based in Thessaly, Greece, 52,849 m3 of agricultural residues of all types are required per year. This amount of biomass is considered to be the total available supply to the prospective CHP biomass gasification plant examined in this study.
However, since the contribution of each biomass type to the total feedstock demand is not available, specific assumptions have been made. The mass residue yield is converted to volume yield by considering a constant density for each residue (Table 2). As a result, the individual percentage of each feedstock to the total biomass volume is calculated by dividing its volume residue yield to the total residue demand. Consequently, the emerging annual volume of each feedstock can be converted back to mass units, using the constant residue density. The results of this analysis are presented in Table 3 and Table 4 and provide a feedstock availability scenario for the simulated CHP biomass gasification plant. They are used as an input in the LCA study.
As data for the Greek agricultural residues examined in this work were not available, the Phyllis2 database of the Energy Research of the Netherlands (ECN) was used, which contains information about the composition of different biomass feedstocks used for biogas, biochar and torrefied biomass production. The proximate and ultimate analyses of the five biomass types considered, as well as their Phyllis2 database IDs, are presented in Table 5 and Table 6 [41].

2.2. Gasification Modelling

Process modelling provides an essential tool for the simulation of the biomass gasification unit powering the CHP plant. By developing simple, yet accurate mathematical modeling tools, further design and optimization studies can be achieved [17]. In the present study, a computational model has been developed in Aspen Plus in order to simulate a standard case of a fixed bed downdraft gasifier and to accurately predict the produced syngas composition as well as the overall gasification process efficiency at various operating conditions. This type of gasifier is considered to be more suitable for small-scale (up to 10 MWth) and decentralized applications. Furthermore, due to the high temperatures identified in the oxidation zone, tar cracking reactions are promoted and the produced syngas has a low tar content [43,44,45].
The gasification process takes place in four stages; (a) Drying (less than 150 °C), (b) Pyrolysis (150–700 °C), (c) Oxidation (700–1500 °C) and (d) Reduction (800–1100 °C) [10]. In the drying stage, raw biomass is stripped out of a high portion of its moisture content, which is transformed into steam [10]. In the pyrolysis stage, the volatile content of biomass is vaporized into a mixture of various substances like H2, CO, CO2 and CH4. Furthermore, high molecular mass hydrocarbons are produced. They are considered as tars and char, a solid residue, which is considered mainly as carbon [13,14]. In the oxidation stage, oxygen of the gasification medium reacts with the combustible products of pyrolysis, resulting in the formation of CO2 and H2O [10]. In the reduction stage, which is mainly endothermic, gaseous products react via a series of reactions like (i) the Water-Gas Shift Reaction, (ii) the Boudouard Reaction and (iii) methanation [15]. Also, they come into contact with the solid char, and thus a series of solid-gas reactions occur. Due to the endothermic nature of the reduction stage, its temperature is significantly lowered. The final product of the gasification process is the synthesis gas (or syngas), which is a mixture of CO, CO2, H2 and CH4 [14]. The main reactions taking place in the gasifier are presented in Table 7. The reaction enthalpies for the single and multi-phase reactions are taken from the literature [10].
The simplification of the process modeling and conformity with Aspen Plus simulation software required several assumptions. First of all, due to the 0-D nature of the aforementioned software, the fluid mechanics equations that characterize the process were not taken into account, and a uniform distribution of gases was considered inside the gasifier. The target was to provide a simple biomass gasification model with the ability to evaluate the influence of the basic parameters affecting the process, without taking into account the gasifier’s configuration and dimensions. Towards this aim, an equilibrium approach has been implemented. The process was examined considering steady-state and isothermal conditions, and the gasification medium was air at 1 atm and 25 °C. The products of biomass devolatilization were H2, CO, CO2, CH4 and H2O. Tars produced during the pyrolysis stage were not taken into account. This is considered to be a reasonable assumption for downdraft gasification [46]. Furthermore, sulfur and nitrogen reactions are not considered in this study [46]. Char is modeled as the sum of fixed carbon and ash which are both reported in the respective biomass proximate analyses [46]. Thus, the percentage of carbon in volatiles was calculated by subtracting the fixed carbon percentage from the percentage of the total carbon in the biomass (included in the ultimate analysis of the dried biomass) [17].
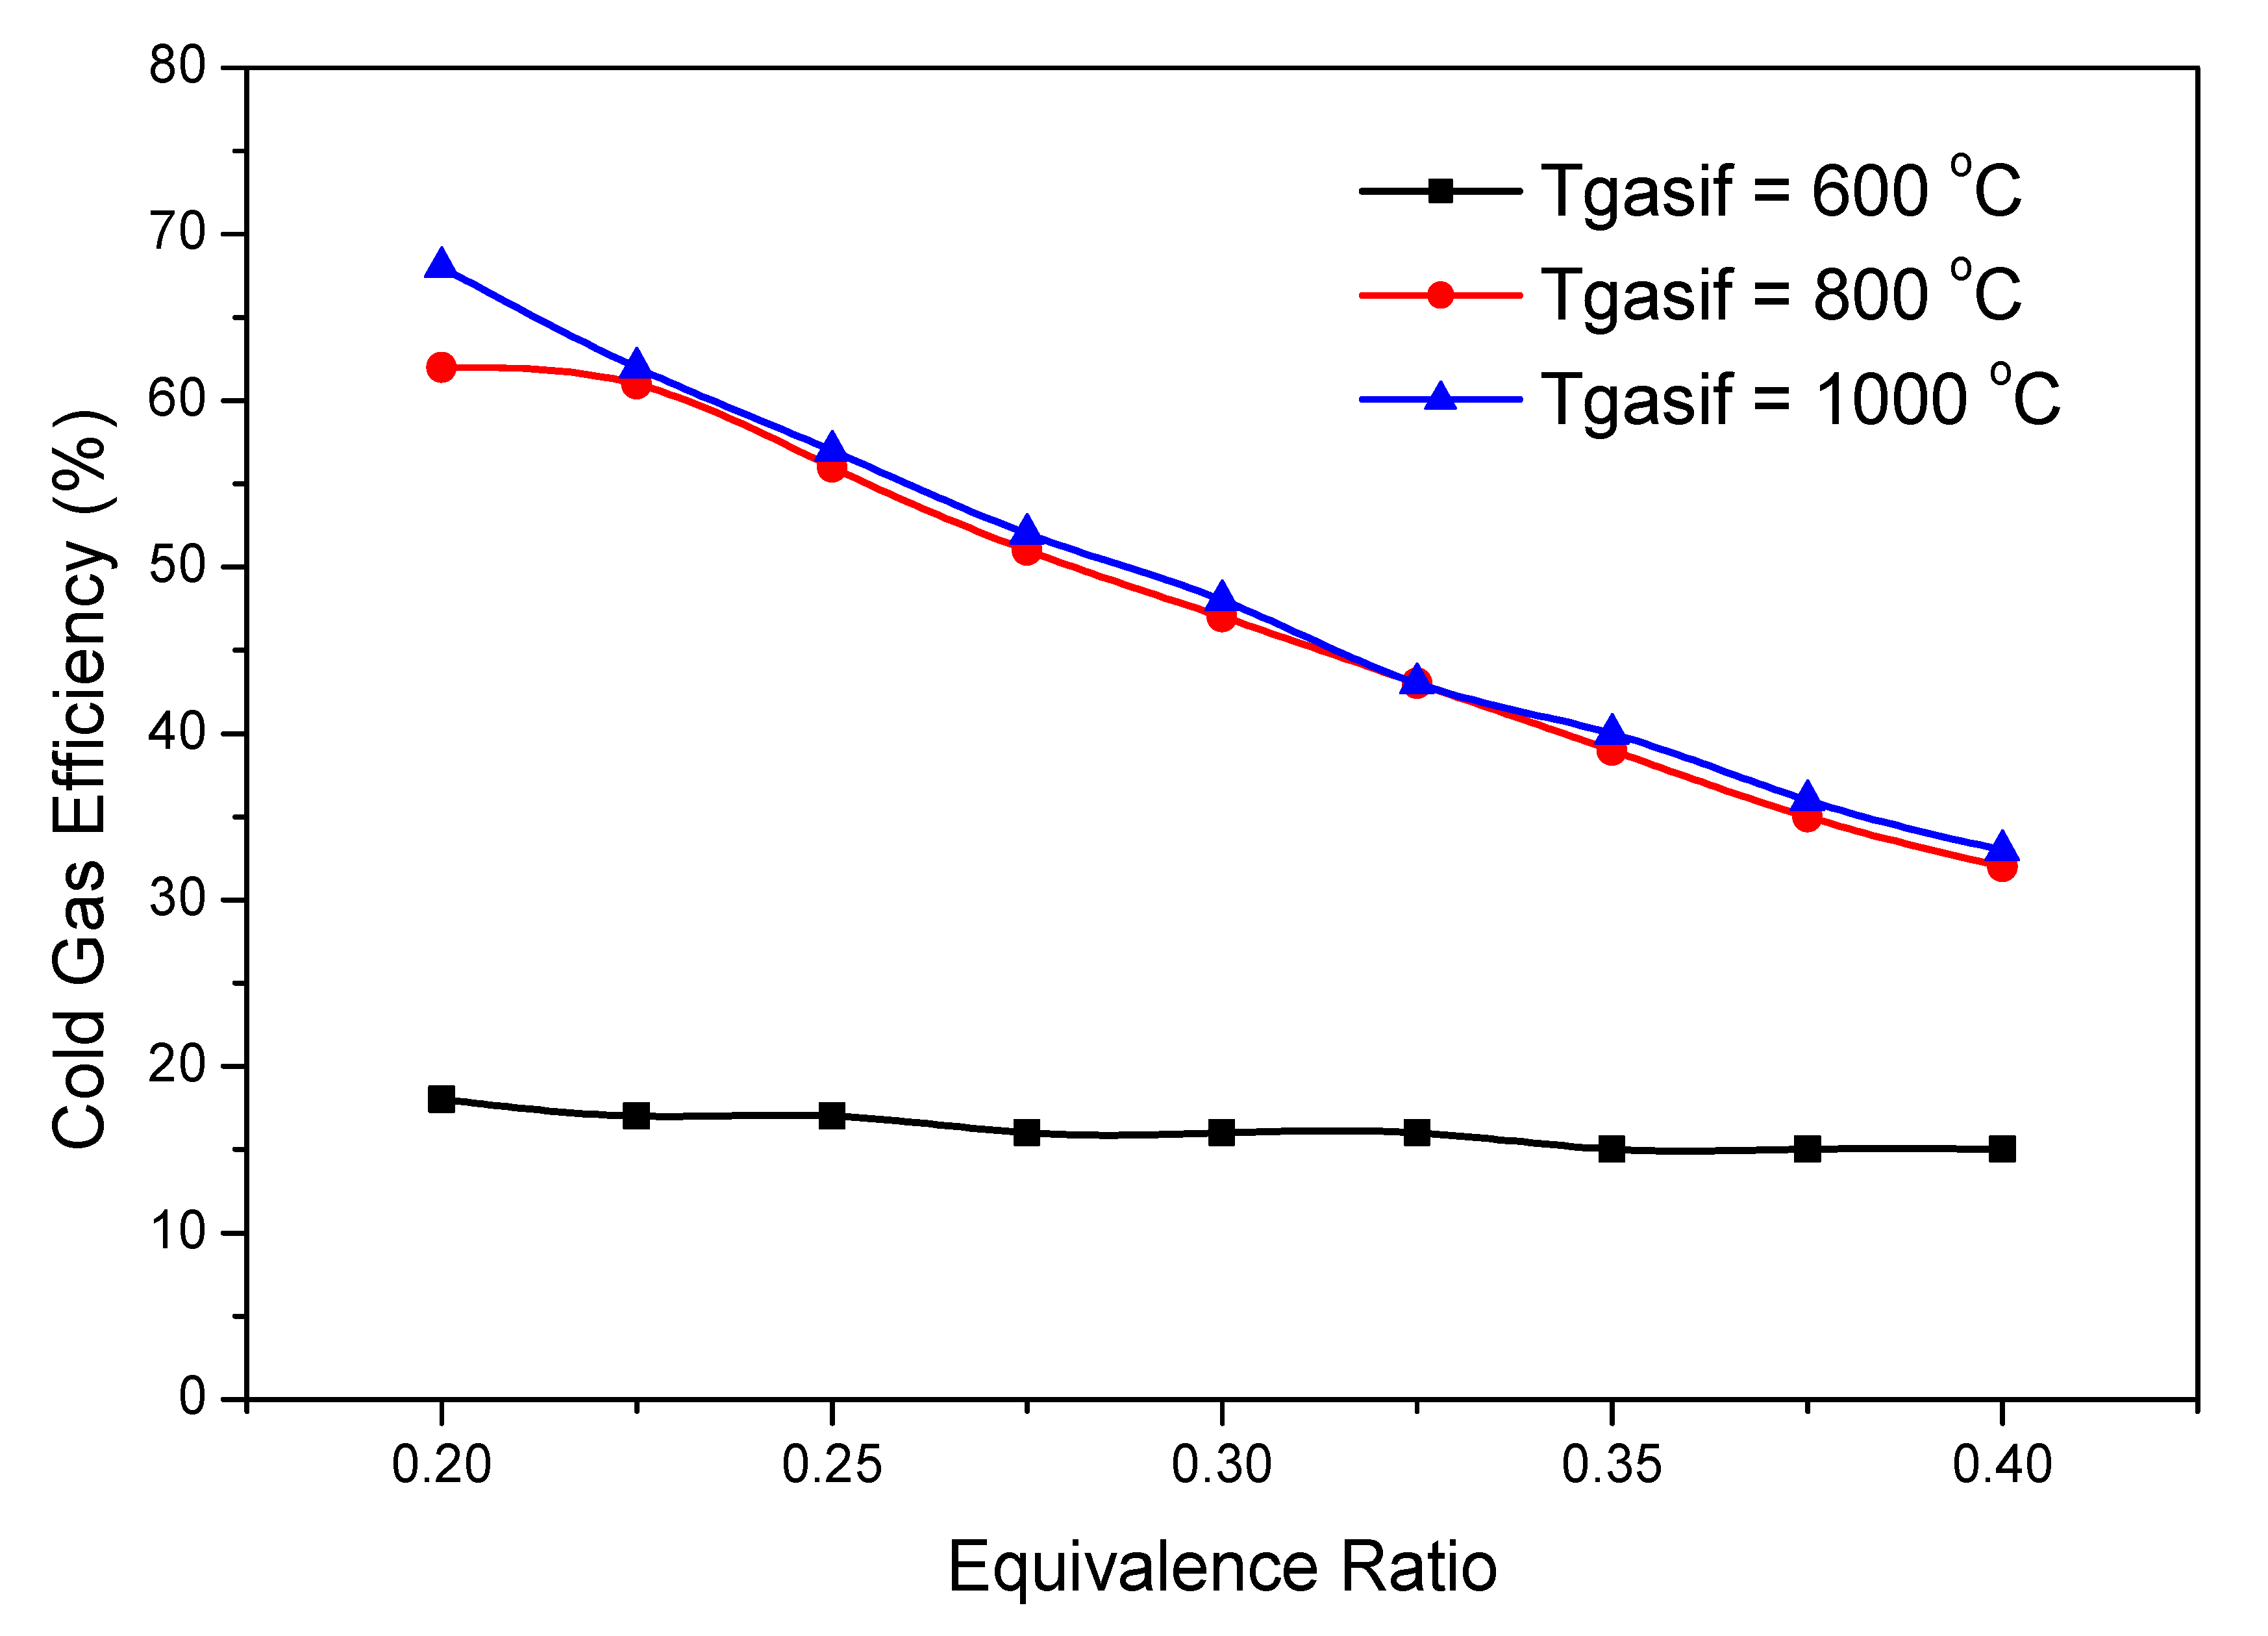
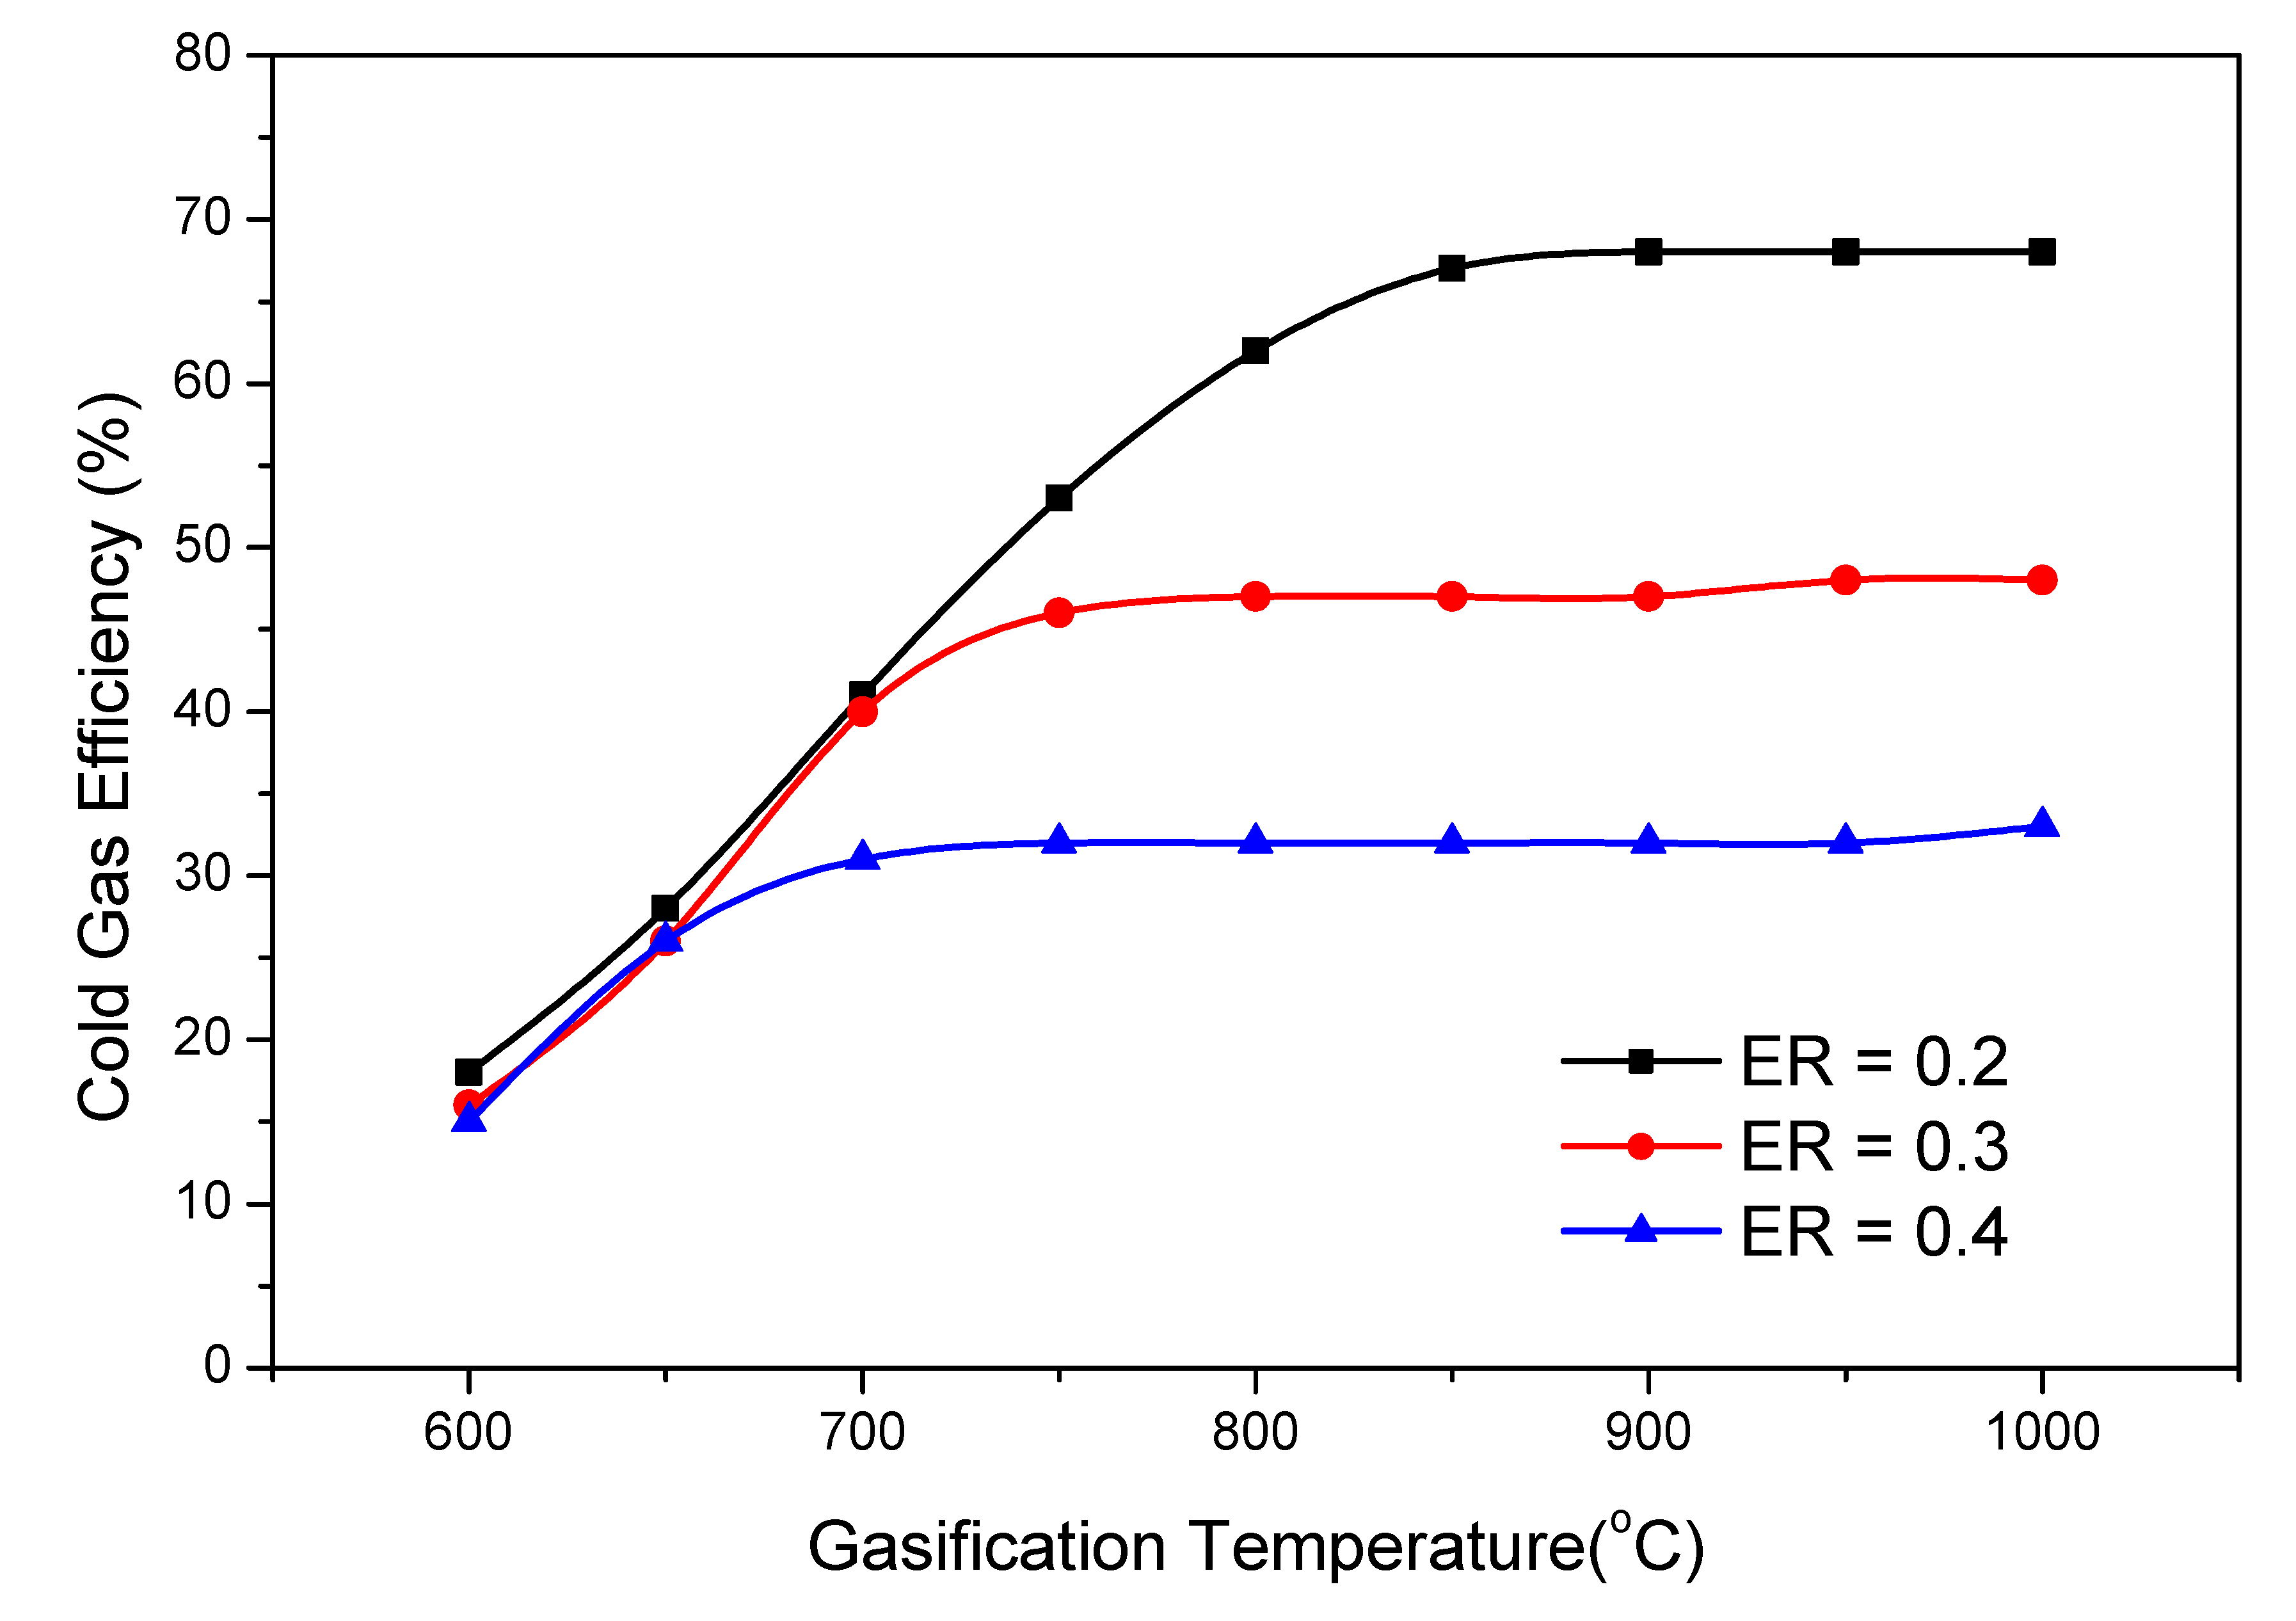
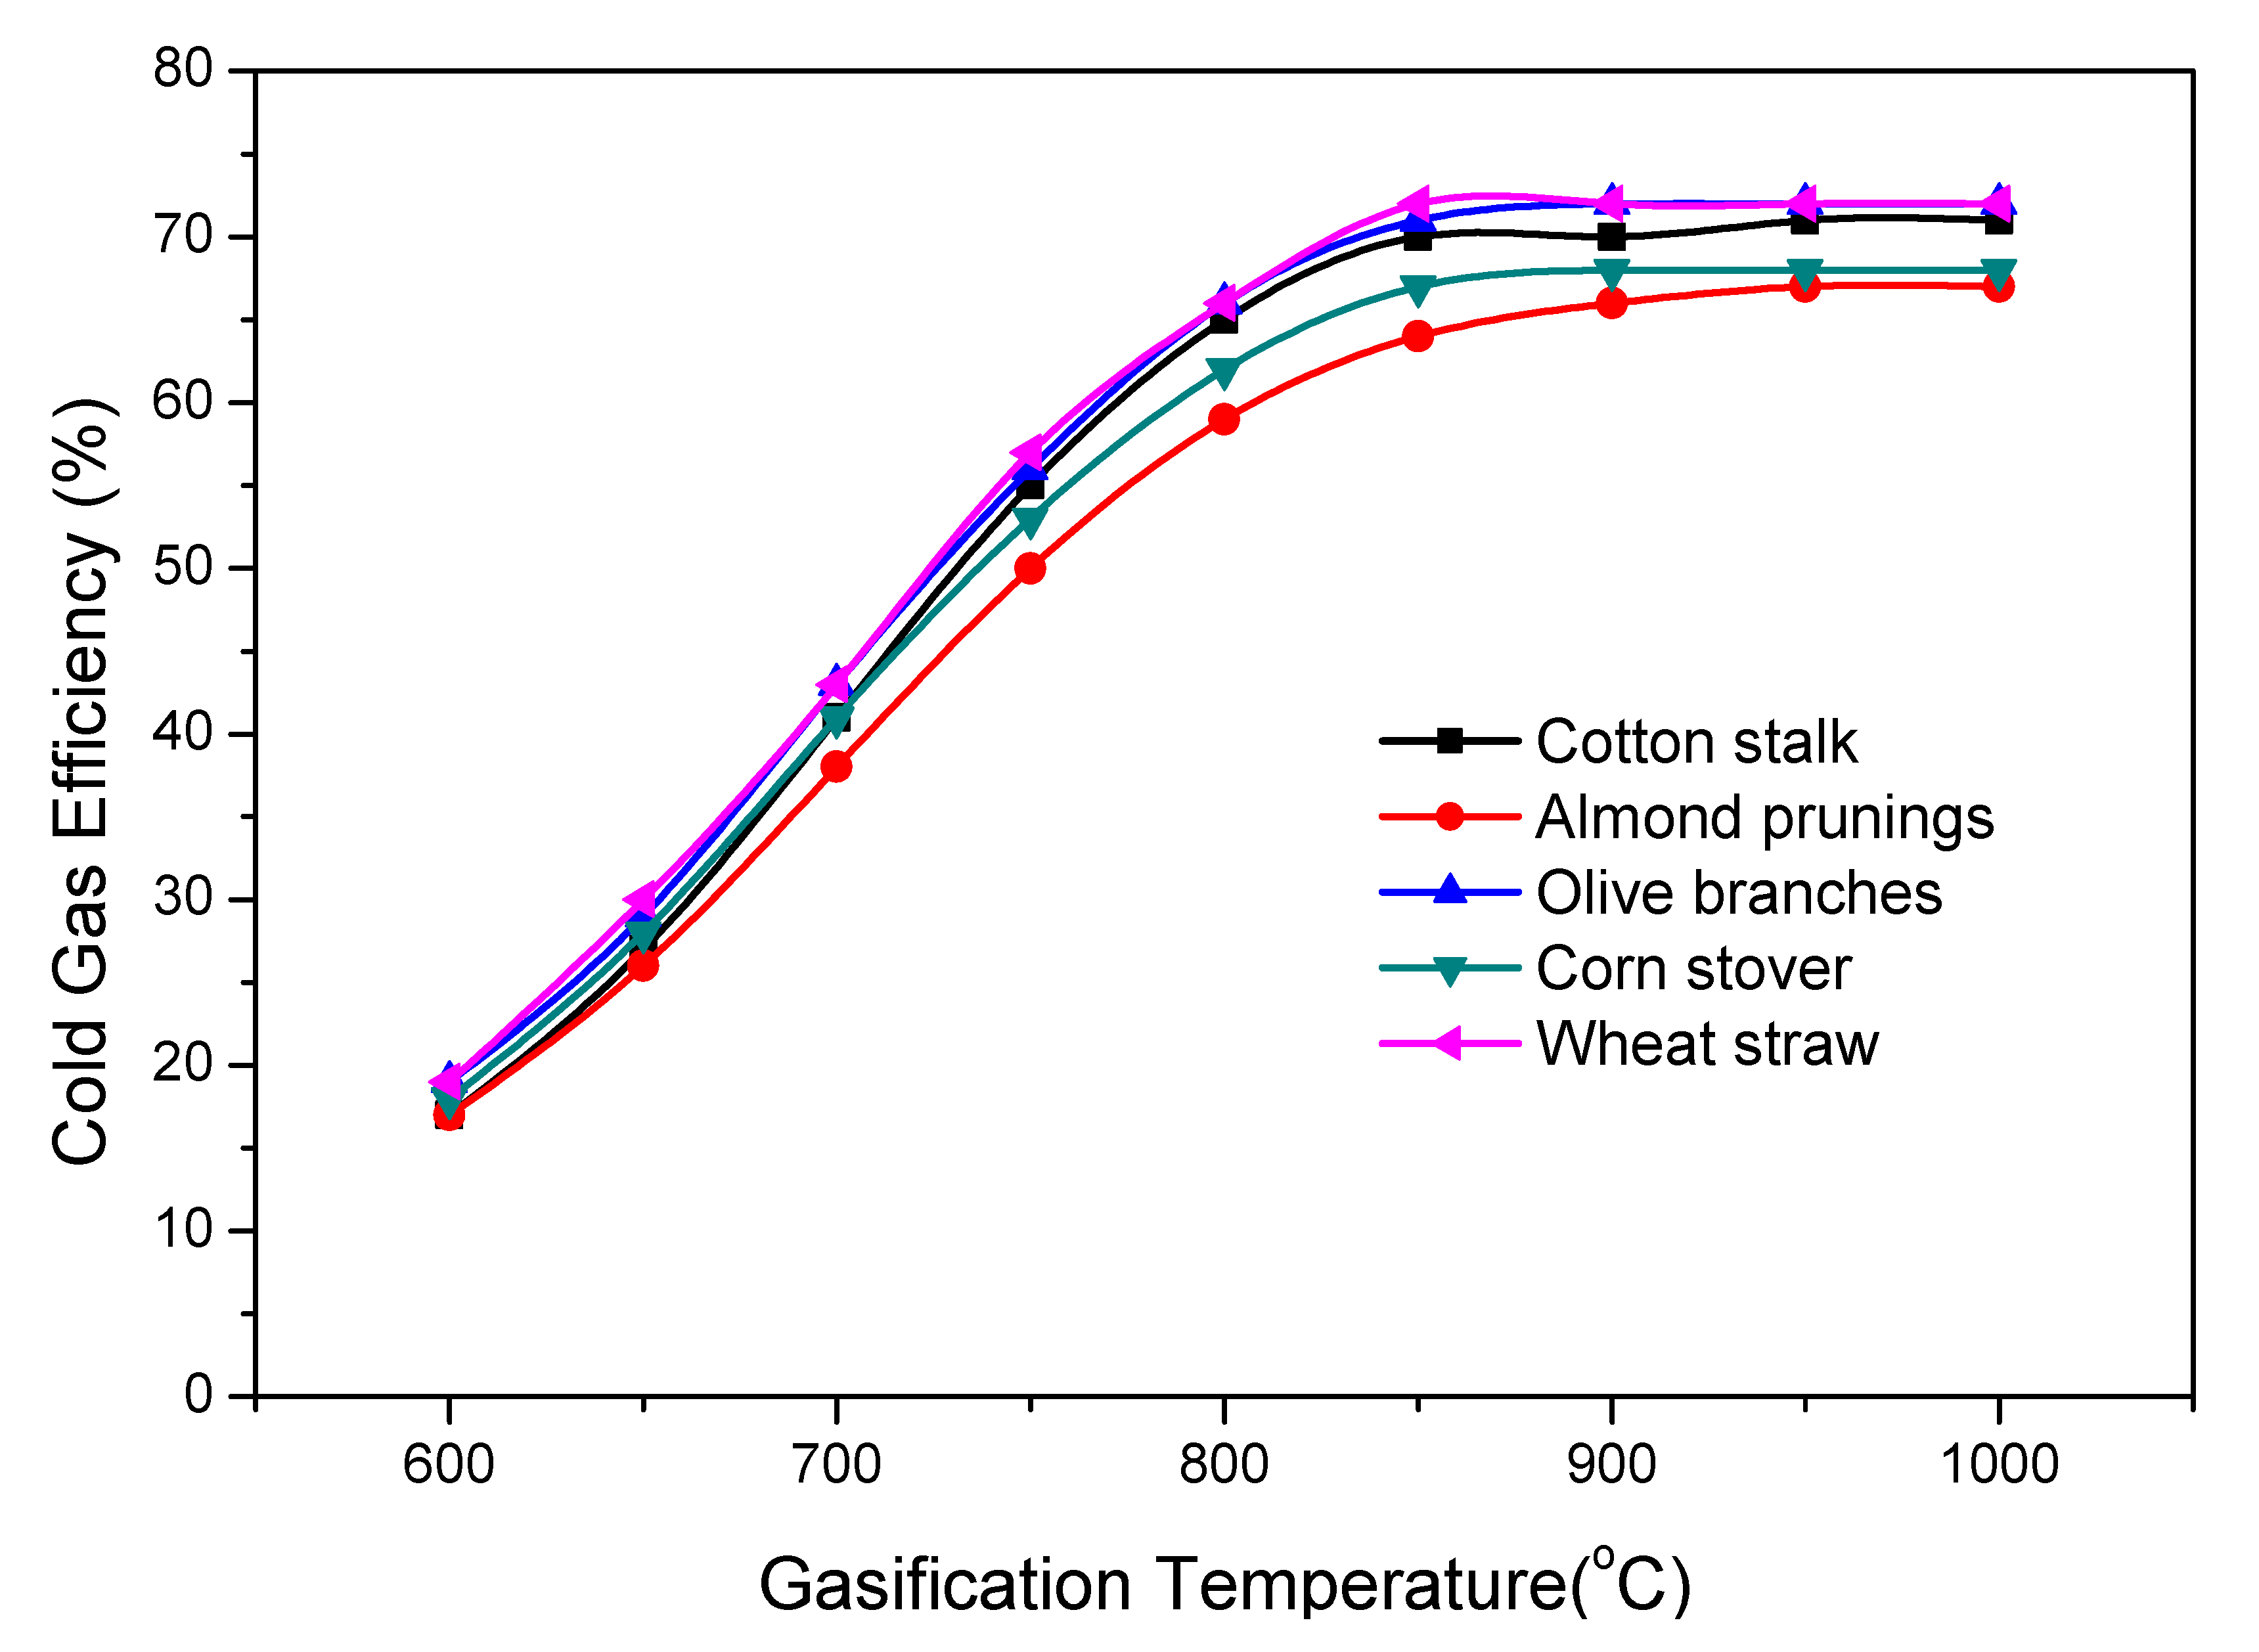
In order to assess the energetic performance of the considered gasification process, the influence of the air equivalence ratio on the quality of the produced syngas must be evaluated. Furthermore, the lower heating value of the produced syngas and the efficiency of the gasification process must be determined. It should be noted that the air equivalence ratio plays a major role in the quantity and the quality of the produced synthesis gas. Previous studies concluded that an optimum operation and quality of produced syngas can be expected for an equivalence ratio ranging between 0.2 and 0.4 [12,47]. Equivalence ratios lower than 0.2 promote pyrolysis conditions, whereas values higher than 0.4 promote oxidation conditions. The equivalence ratio is calculated by the following equation:
ER = (air feed (kg)/biomass feed (kg))/(A/F)stoic,
where (A/F)stoic is the stoichiometric air to biomass ratio, which is calculated by Equation (2) (γi are the mass fractions of C, H, S and O elements in the dried biomass) [48]:
(A/F)stoic = 11.48γC + 34.194γH + 4.3γS − 4.308γO.
The lower heating value of the synthesis gas is calculated for standard conditions (0 °C, 1 atm) using Equation (3) [49]:
LHVsyngas = (30XCO + 25.7XH2 + 85.4XCH4) ∙ 4.2/1000 (MJ/Nm3)
where Xi are the volume fractions of CO, H2 and CH4 in the synthesis gas. Then, it is converted to actual gasification conditions (25 °C, 1 atm). Evidently, the gasification’s main target is to produce syngas with high LHV. Thus, increased values of the aforementioned species volume fractions are anticipated.
The gasification efficiency corresponds to the chemical efficiency: the greater part, that takes into account only the chemical energy and the enthalpy that is associated with the thermal energy. Chemical efficiency is named cold gas efficiency and represents the chemical energy content of the synthesis gas. It is calculated via Equation (4):
nCG = [Vsyngas (m3∙h−1) ∙ LHVsyngas (MJ∙m−3)]/[mbiomass (kg∙h−1) ∙ LHVbiomass (MJ∙kg−1)],
where Vsyngas and mbiomass were the volume flow of the produced syngas and the biomass mass feed respectively.
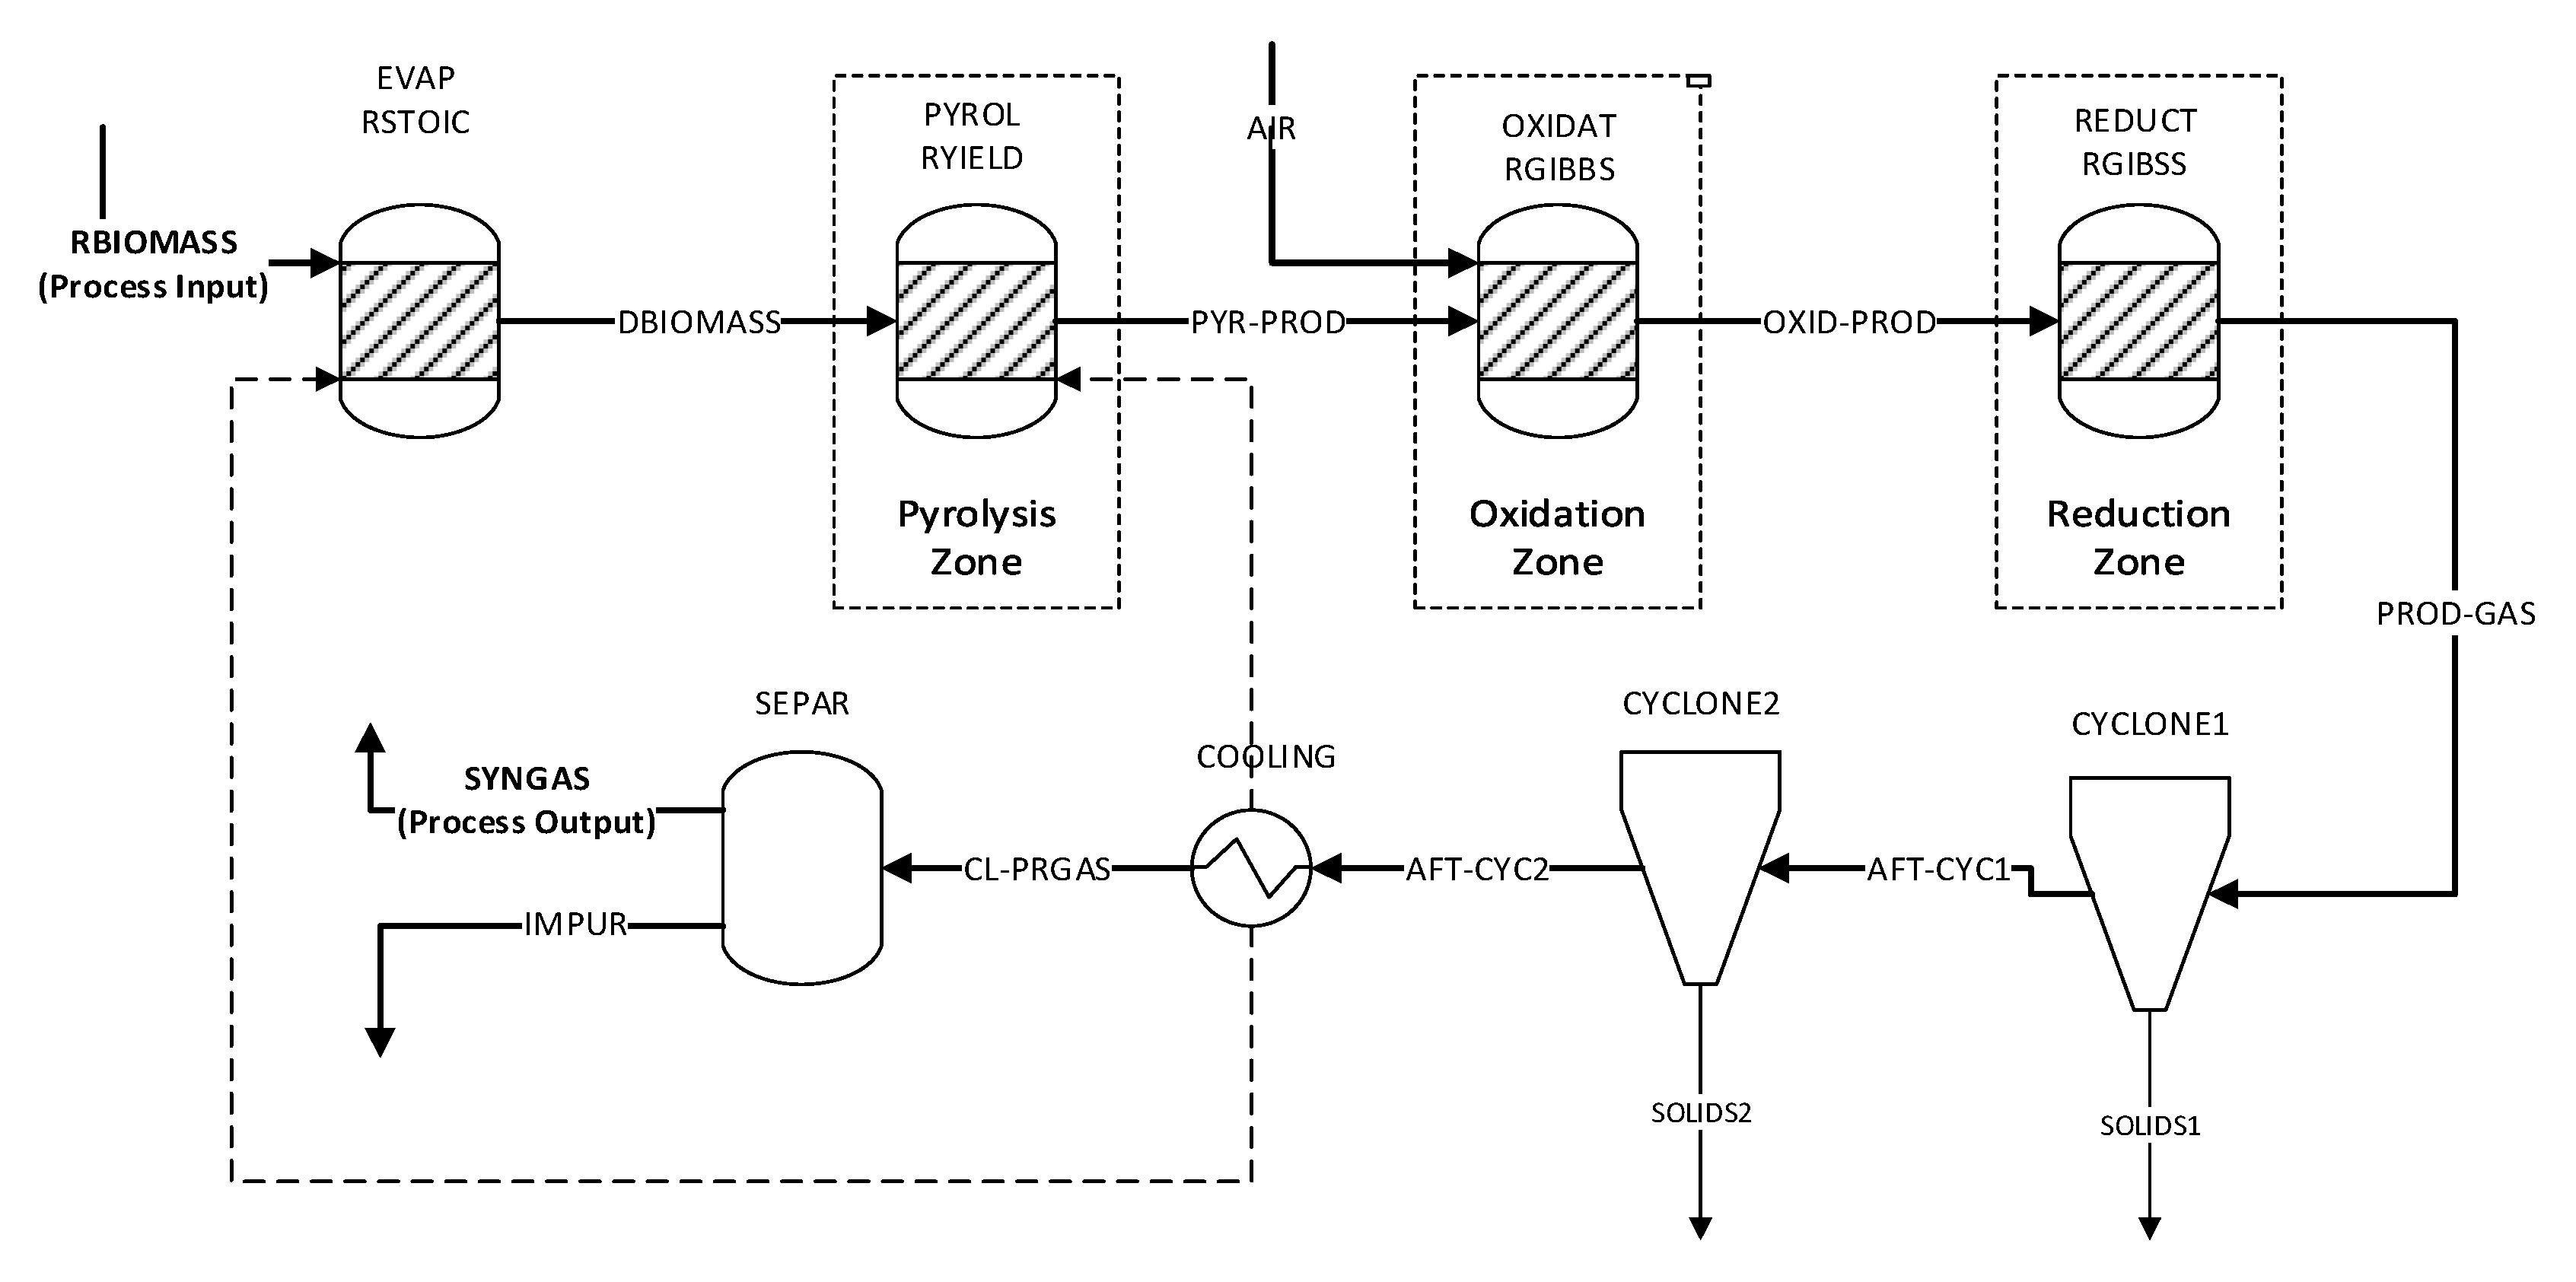
The development of the gasification model is based on using different modules of the Aspen Plus software in order to simulate the gasifier operation, followed by an after-treatment of the produced gas, which consists of (a) cleaning the synthesis gas using cyclones and (b) cooling it with the use of heat exchangers. The gasifier is modeled via a combination of different blocks, each corresponding to a specific gasification step (i.e., drying, pyrolysis, oxidation, reduction). The simulation flowchart of the process is presented in Figure 1. Input data used for the simulation are summarized in Table 8. For the modeling of the behavior of gases, the Peng–Robinson equation of state was used.
The biomass drying step is simulated via the stoichiometric reactor RSTOIC. The drying process achieved a total drying of the biomass feed at a temperature of 150 °C.
After being stripped from the moisture, dried biomass enters an RYIELD block in order to be decomposed into its constituent, conventional components (carbon, hydrogen, oxygen, nitrogen, sulfur, ash). Decomposition calculations are based on the ultimate and proximate analyses of the five biomass types considering a 100% conversion. A temperature of 500 °C was selected. The RYIELD block practically corresponds to a simplified pyrolysis step.
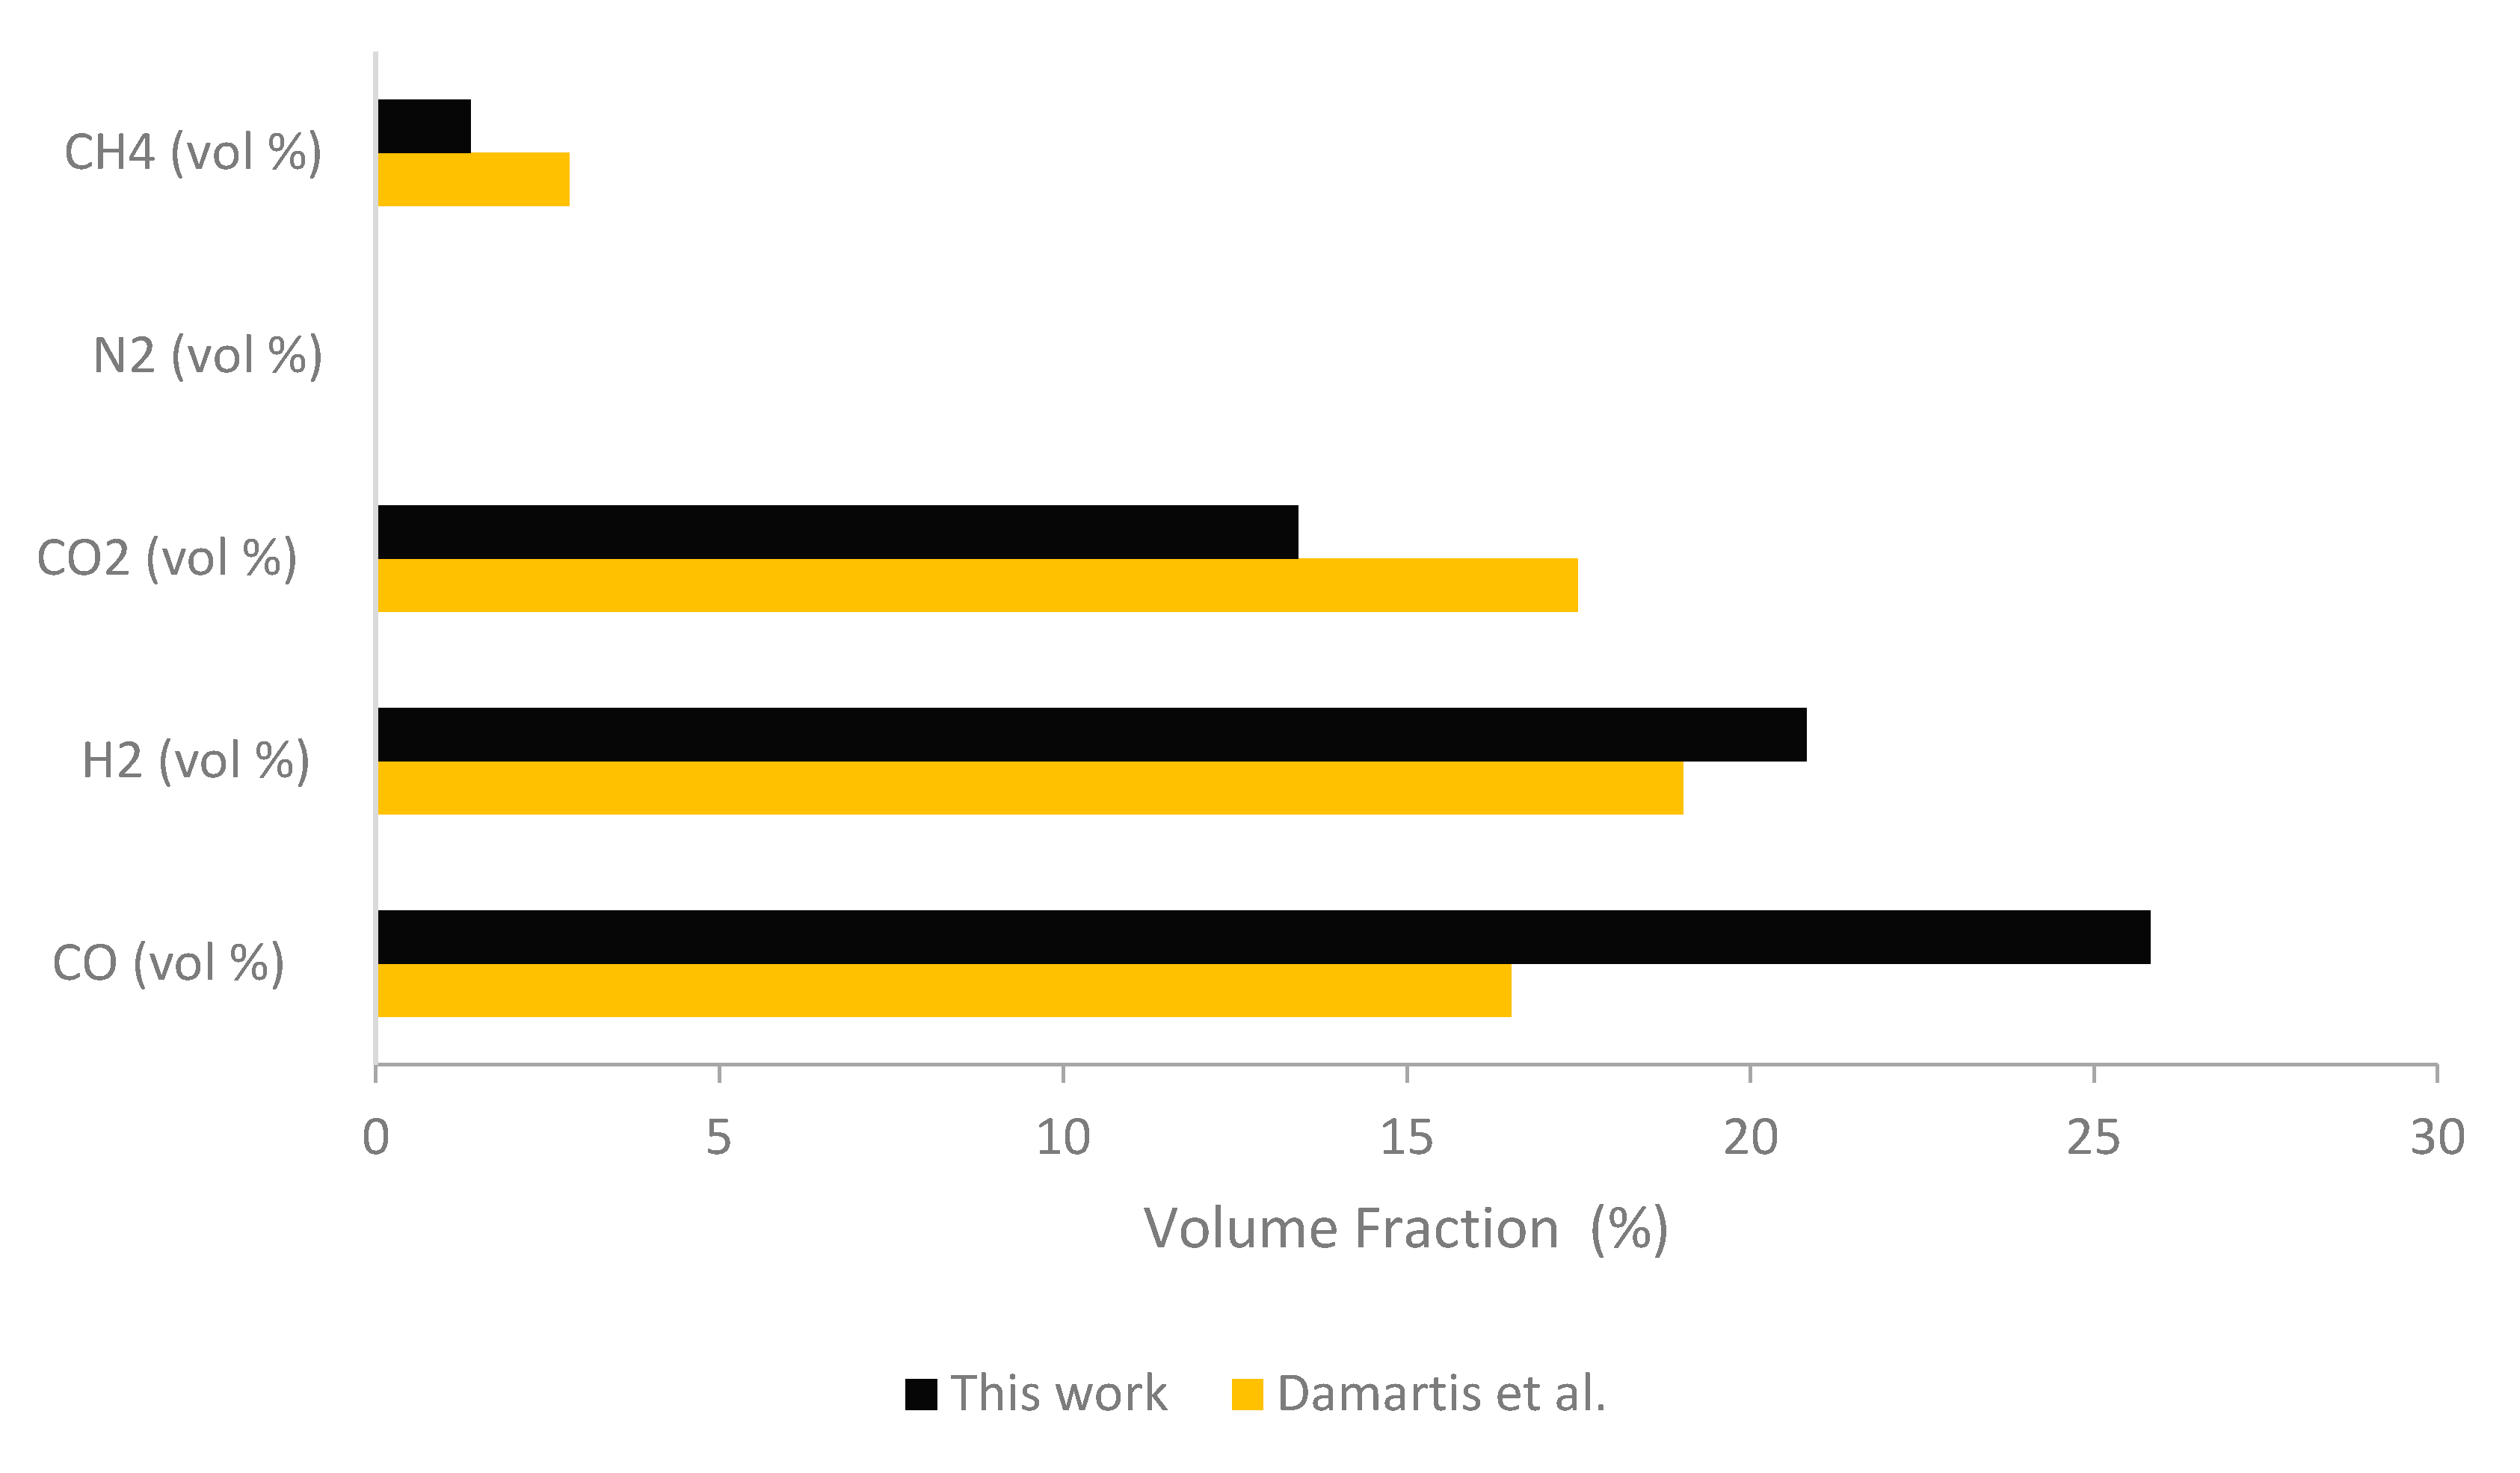
Two RGIBBS reactors have been implemented for the modeling of the oxidation and reduction zones, respectively. Thus, it is assumed that, in both stages, all compounds involved have reached chemical equilibrium. The first reactor is fed with air to simulate the oxidation zone, and the second one simulates the reduction zone at a lower temperature than that of the oxidation zone. According to various literature sources, equilibrium models, implementing RGIBBS reactors, tend to overestimate CO and H2 and underestimate CH4 and CO2 volume fractions [50,51]. Various solutions have been proposed. In order to tune the syngas composition to more realistic figures, Fernandez-Lopez et al. (2017) specifically defined the chemical equilibrium of reactions 5 and 6 to occur at a different temperature than the overall temperature of the reduction zone block [
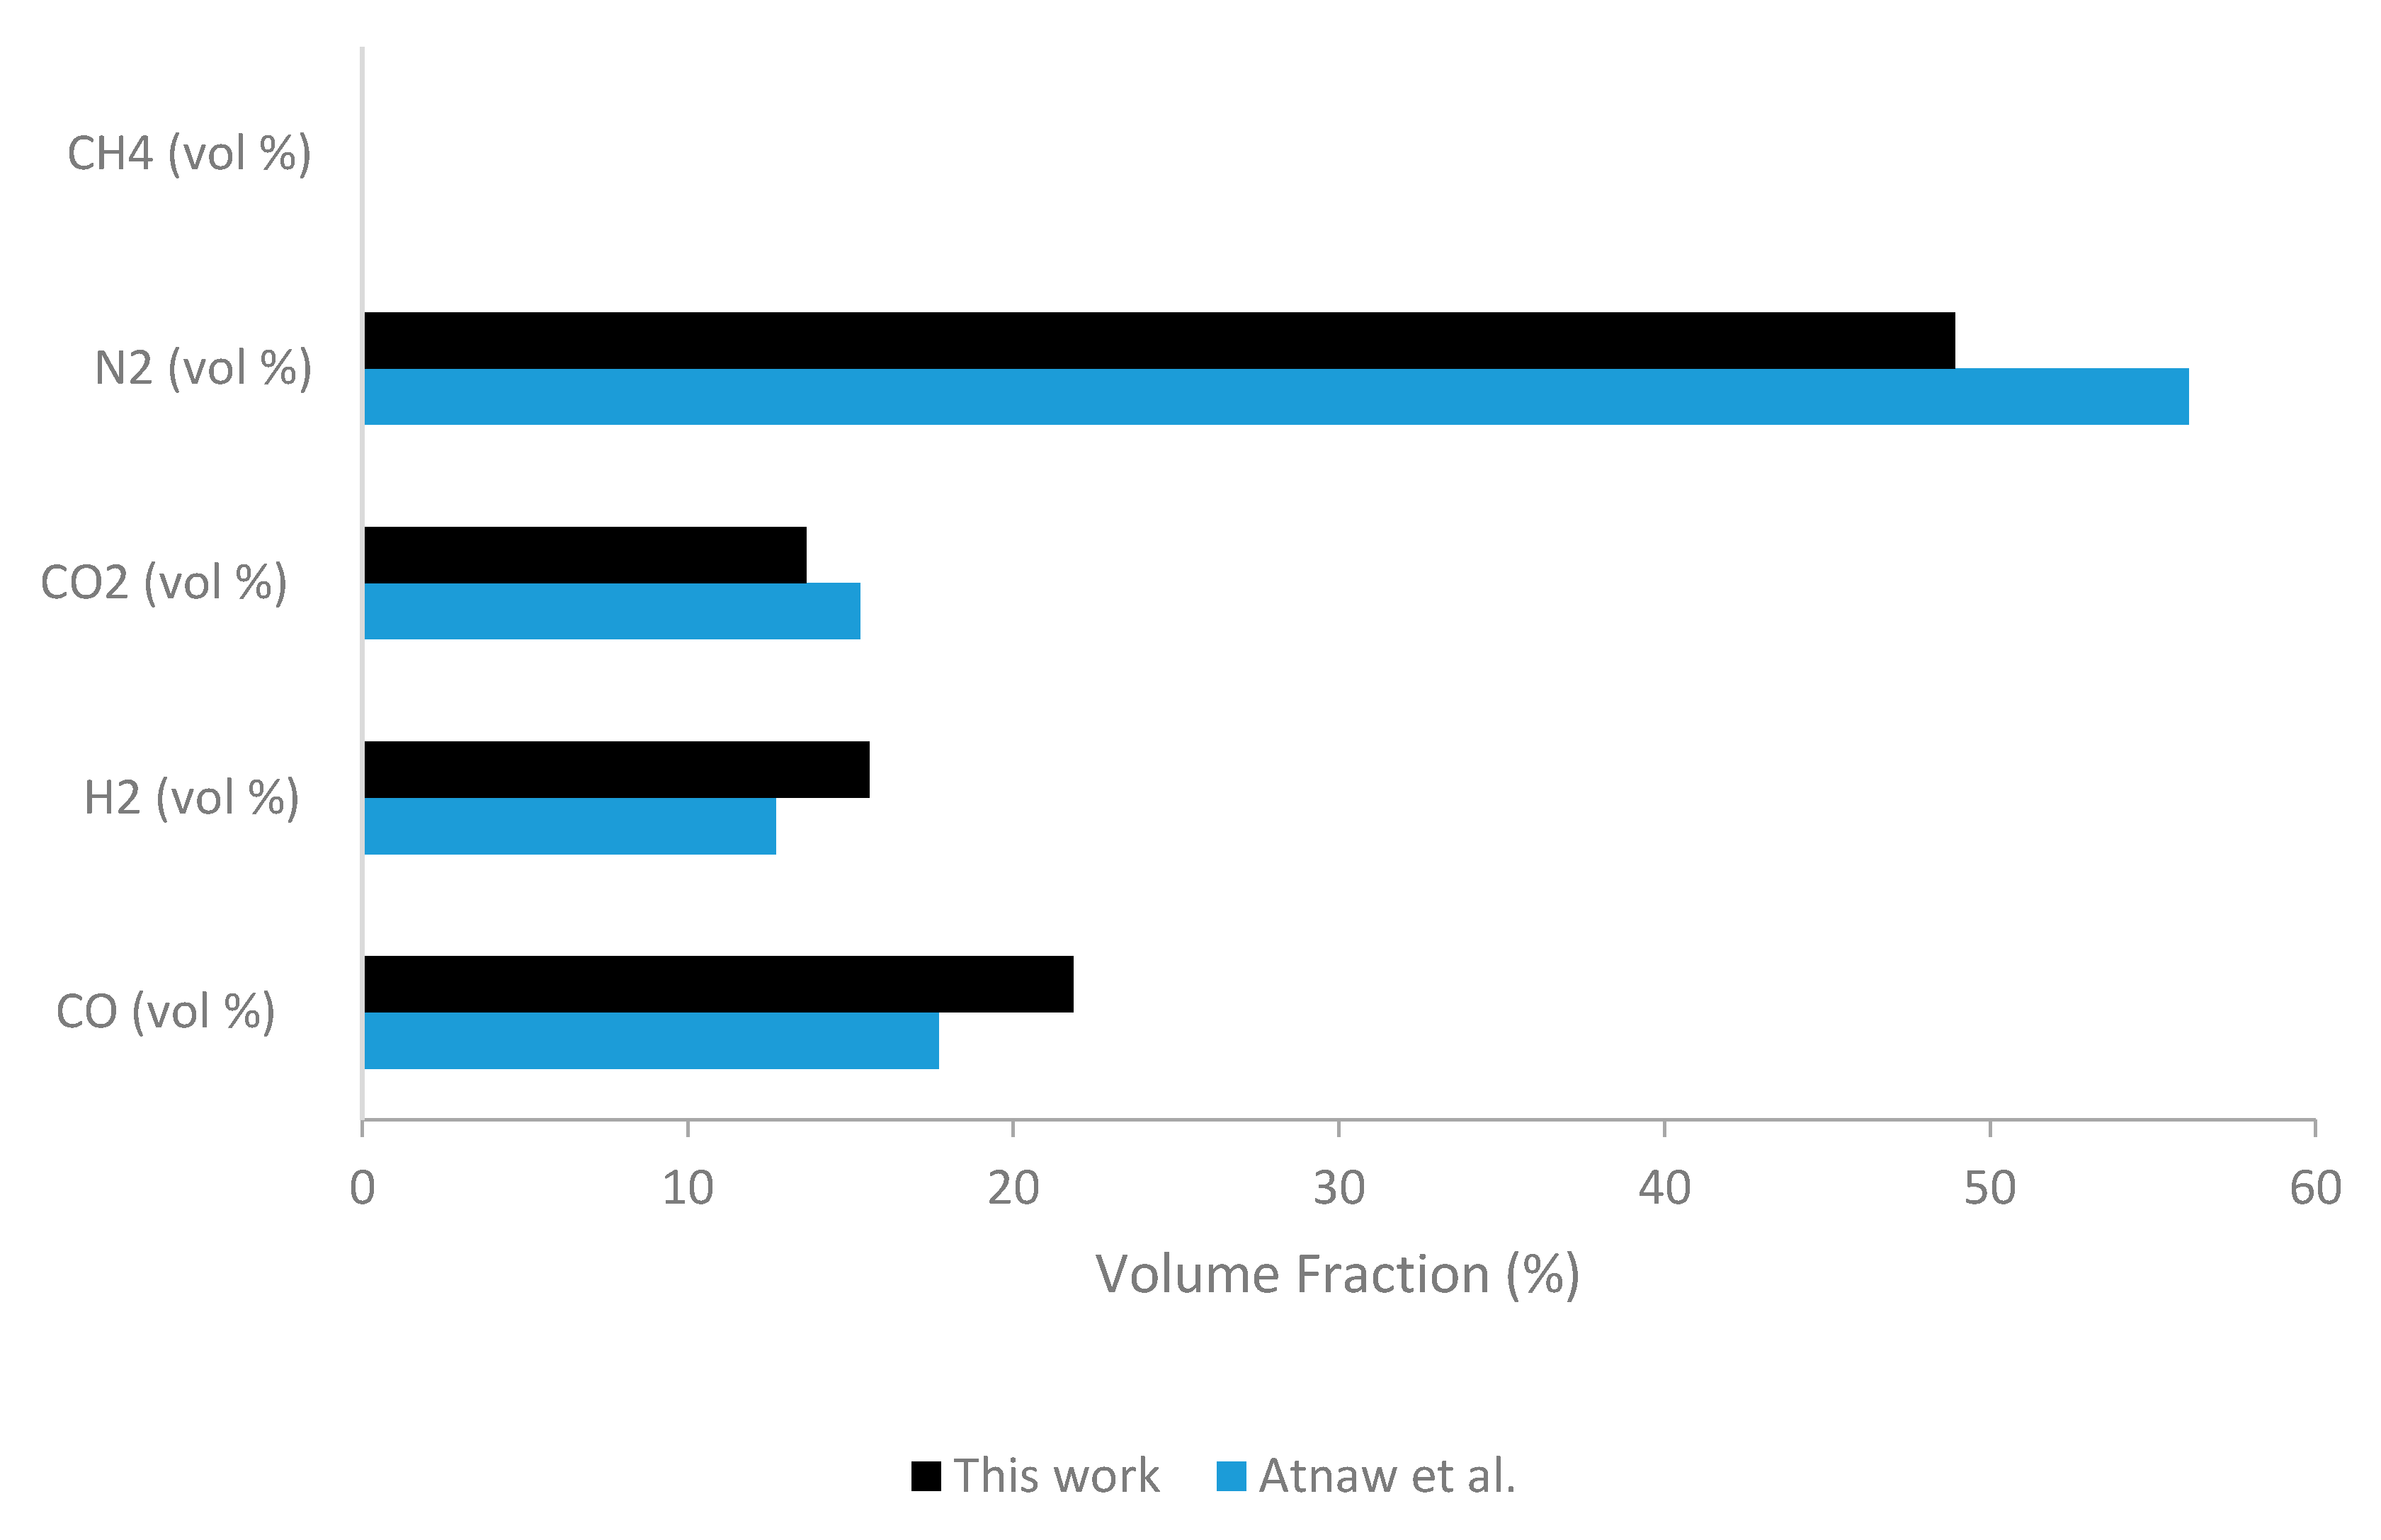
52]. This solution, although it produces more accurate results, has limited applicability, since it is compliant only with the experimental data used for the tuning. Atnaw et al. (2018) suggested that, in a downdraft gasifier, the chemical equilibrium of the reduction zone reactions (presented in Table 7), which are highly endothermal and therefore lower the gasification temperature, should be set at a temperature 200 °C lower than that of the oxidation zone reactions [53]. This approach is expected to produce reasonable results for fixed bed as well as for fluidized bed gasifiers under various operating conditions and for different biomass feeds. Therefore, it has been implemented in the developed model.
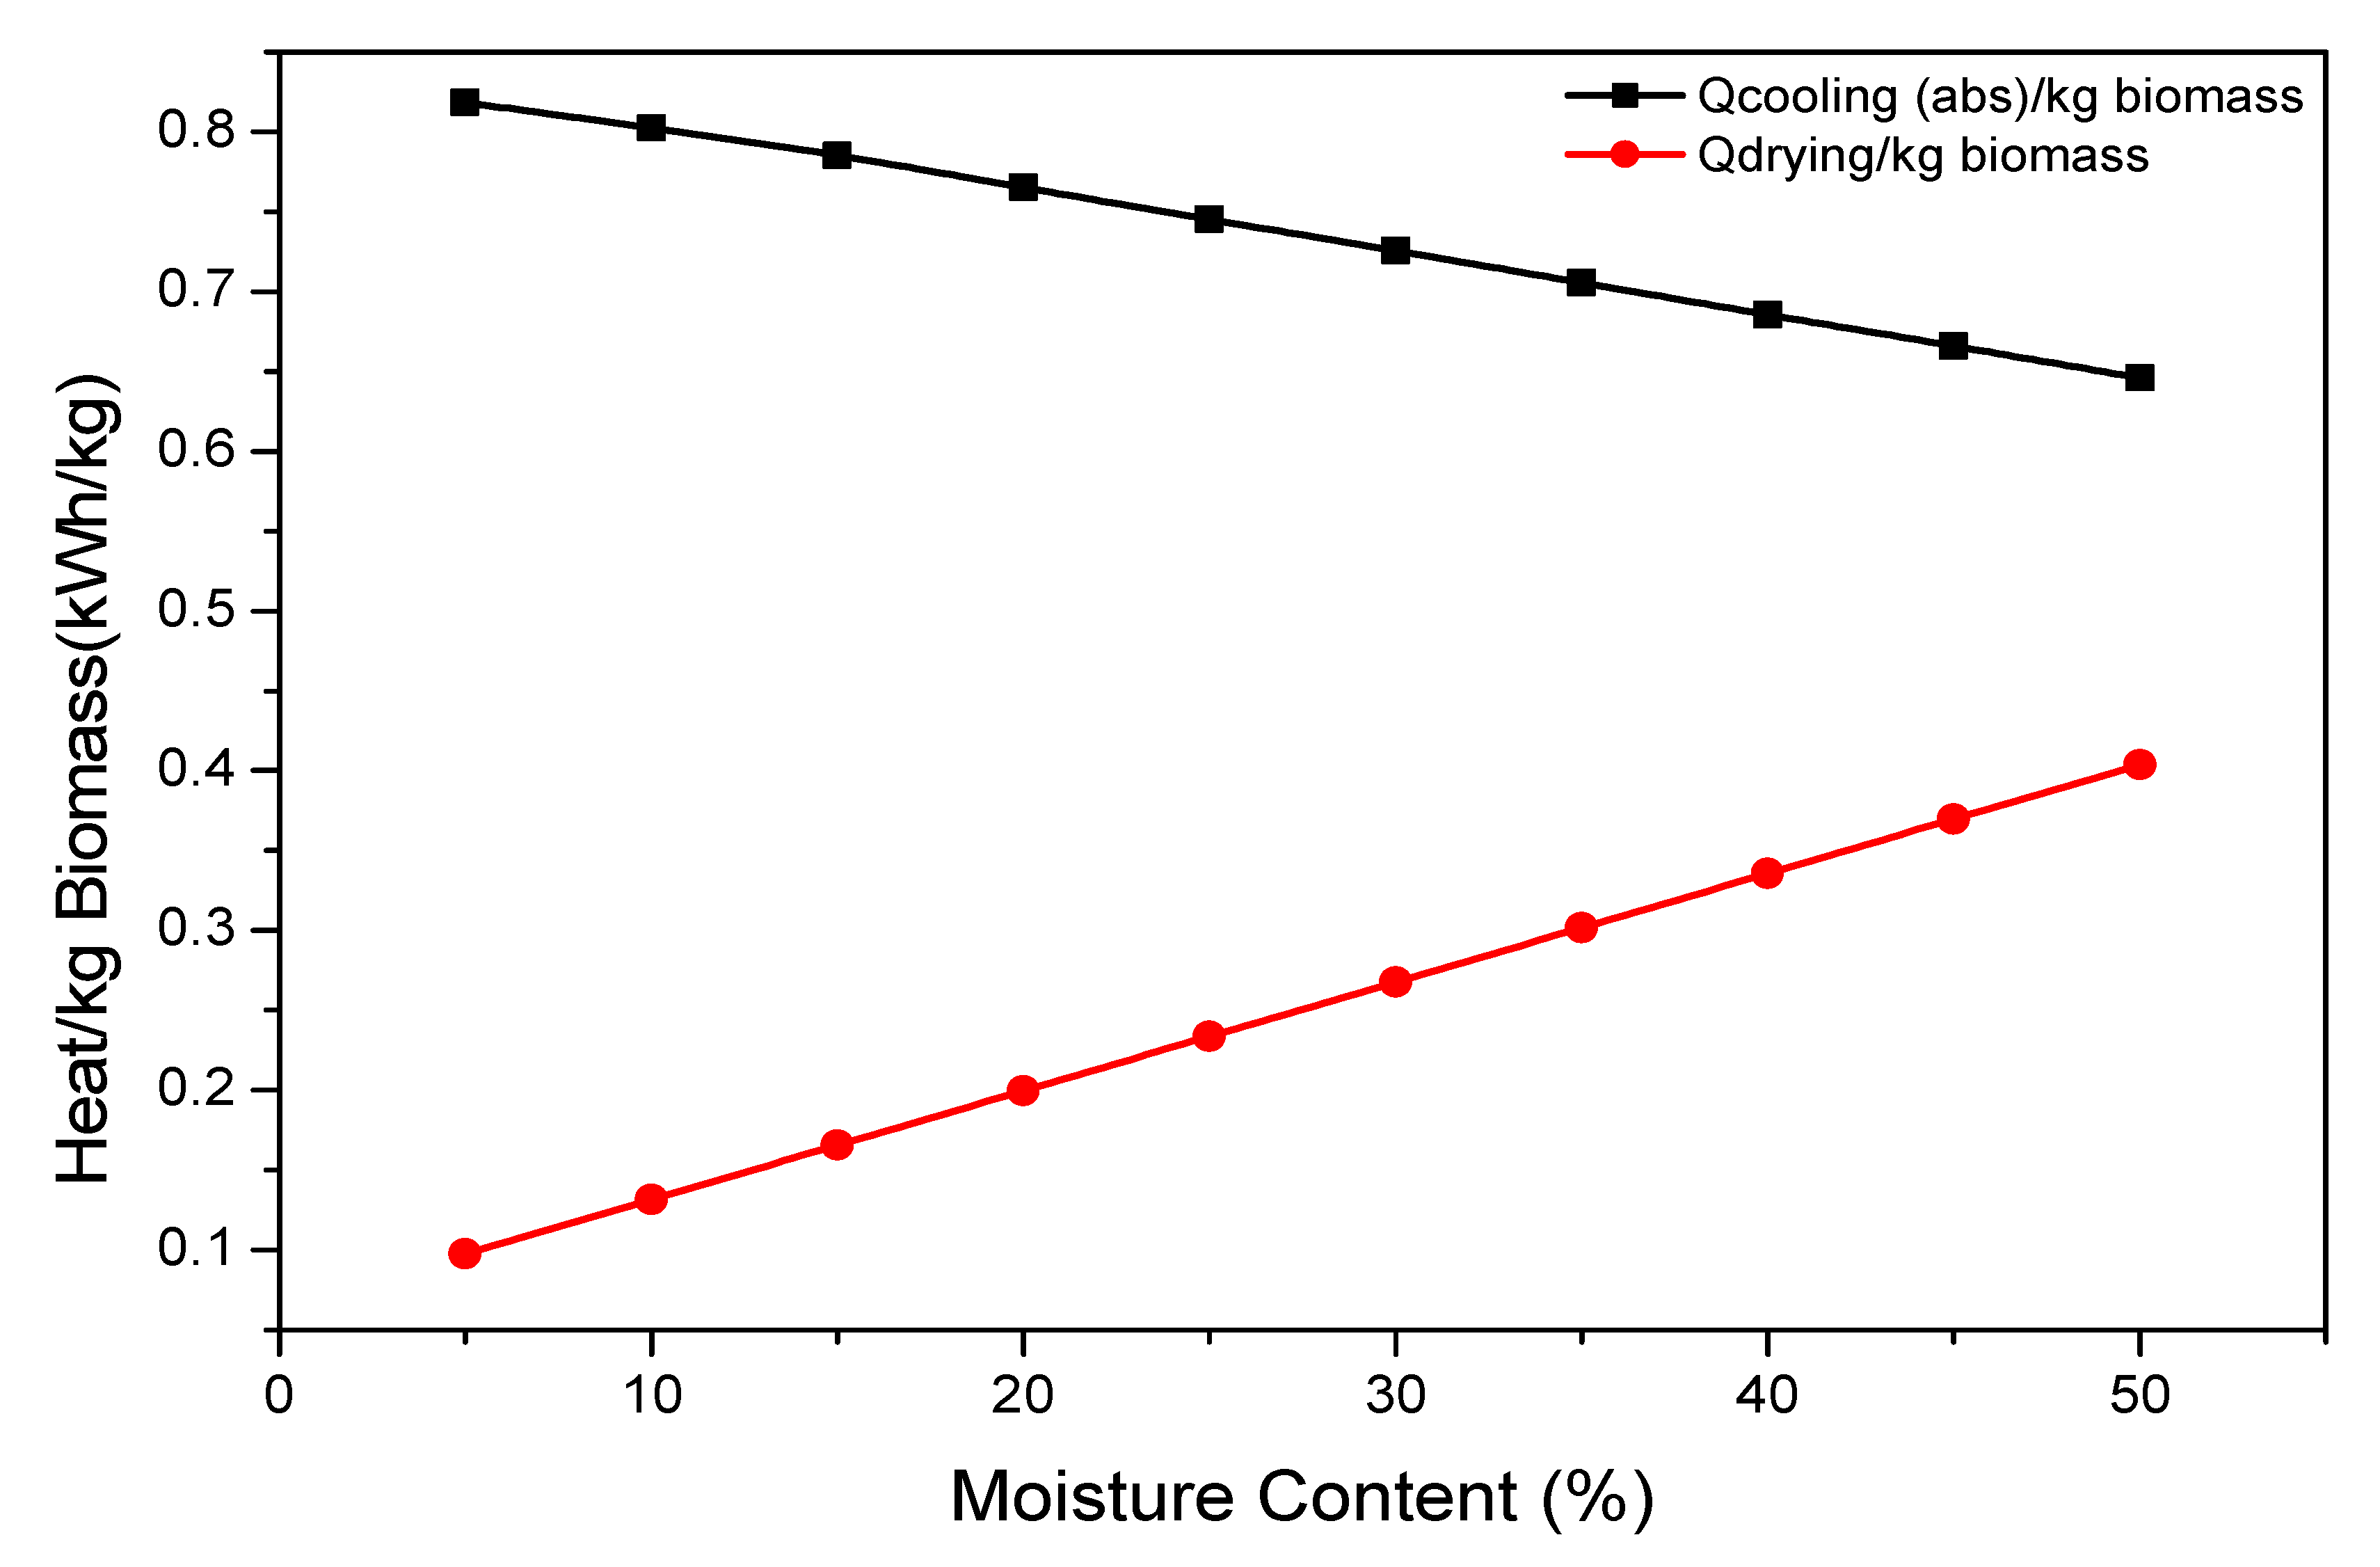
The next step of the gasification modelling is the refinement process of the product gas. At first, it enters two CYCLONE blocks that simulate the separation of the solid impurities (ash, occasional char residues) from the gas phase. Then, the gas stream enters a COOLING block, which simulates the operation of a heat exchanger. The synthesis gas is cooled to a final temperature of 30 °C, with respect to being potentially used as a fuel in an internal combustion engine implemented in the prospective CHP plant. The generated heat can be used for the drying process [54]. Finally, N2, which is contained in the air feed and considered to be unreactive, is removed via the use of a SEPARATOR block, which simulates syngas cleaning via a one-step simplified process. From the above processes, the purified syngas produced is ready to power internal combustion engines or boilers in power plants.

2.3. LCA Modelling

2.3.1. LCA Framework

Life Cycle Assessment is one of the most developed and widely used methods for the quantification of the amount of materials and energy used for a process, as well as its emissions, by considering the complete supply chain of the goods and services involved [55]. It also contributes to the detection and the refinement of specific system activities, which have the most severe environmental impact. The whole LCA process follows the ISO 14040 and 14044 protocols.

2.3.2. Goal and Scope Definition–Functional Unit-System Boundaries

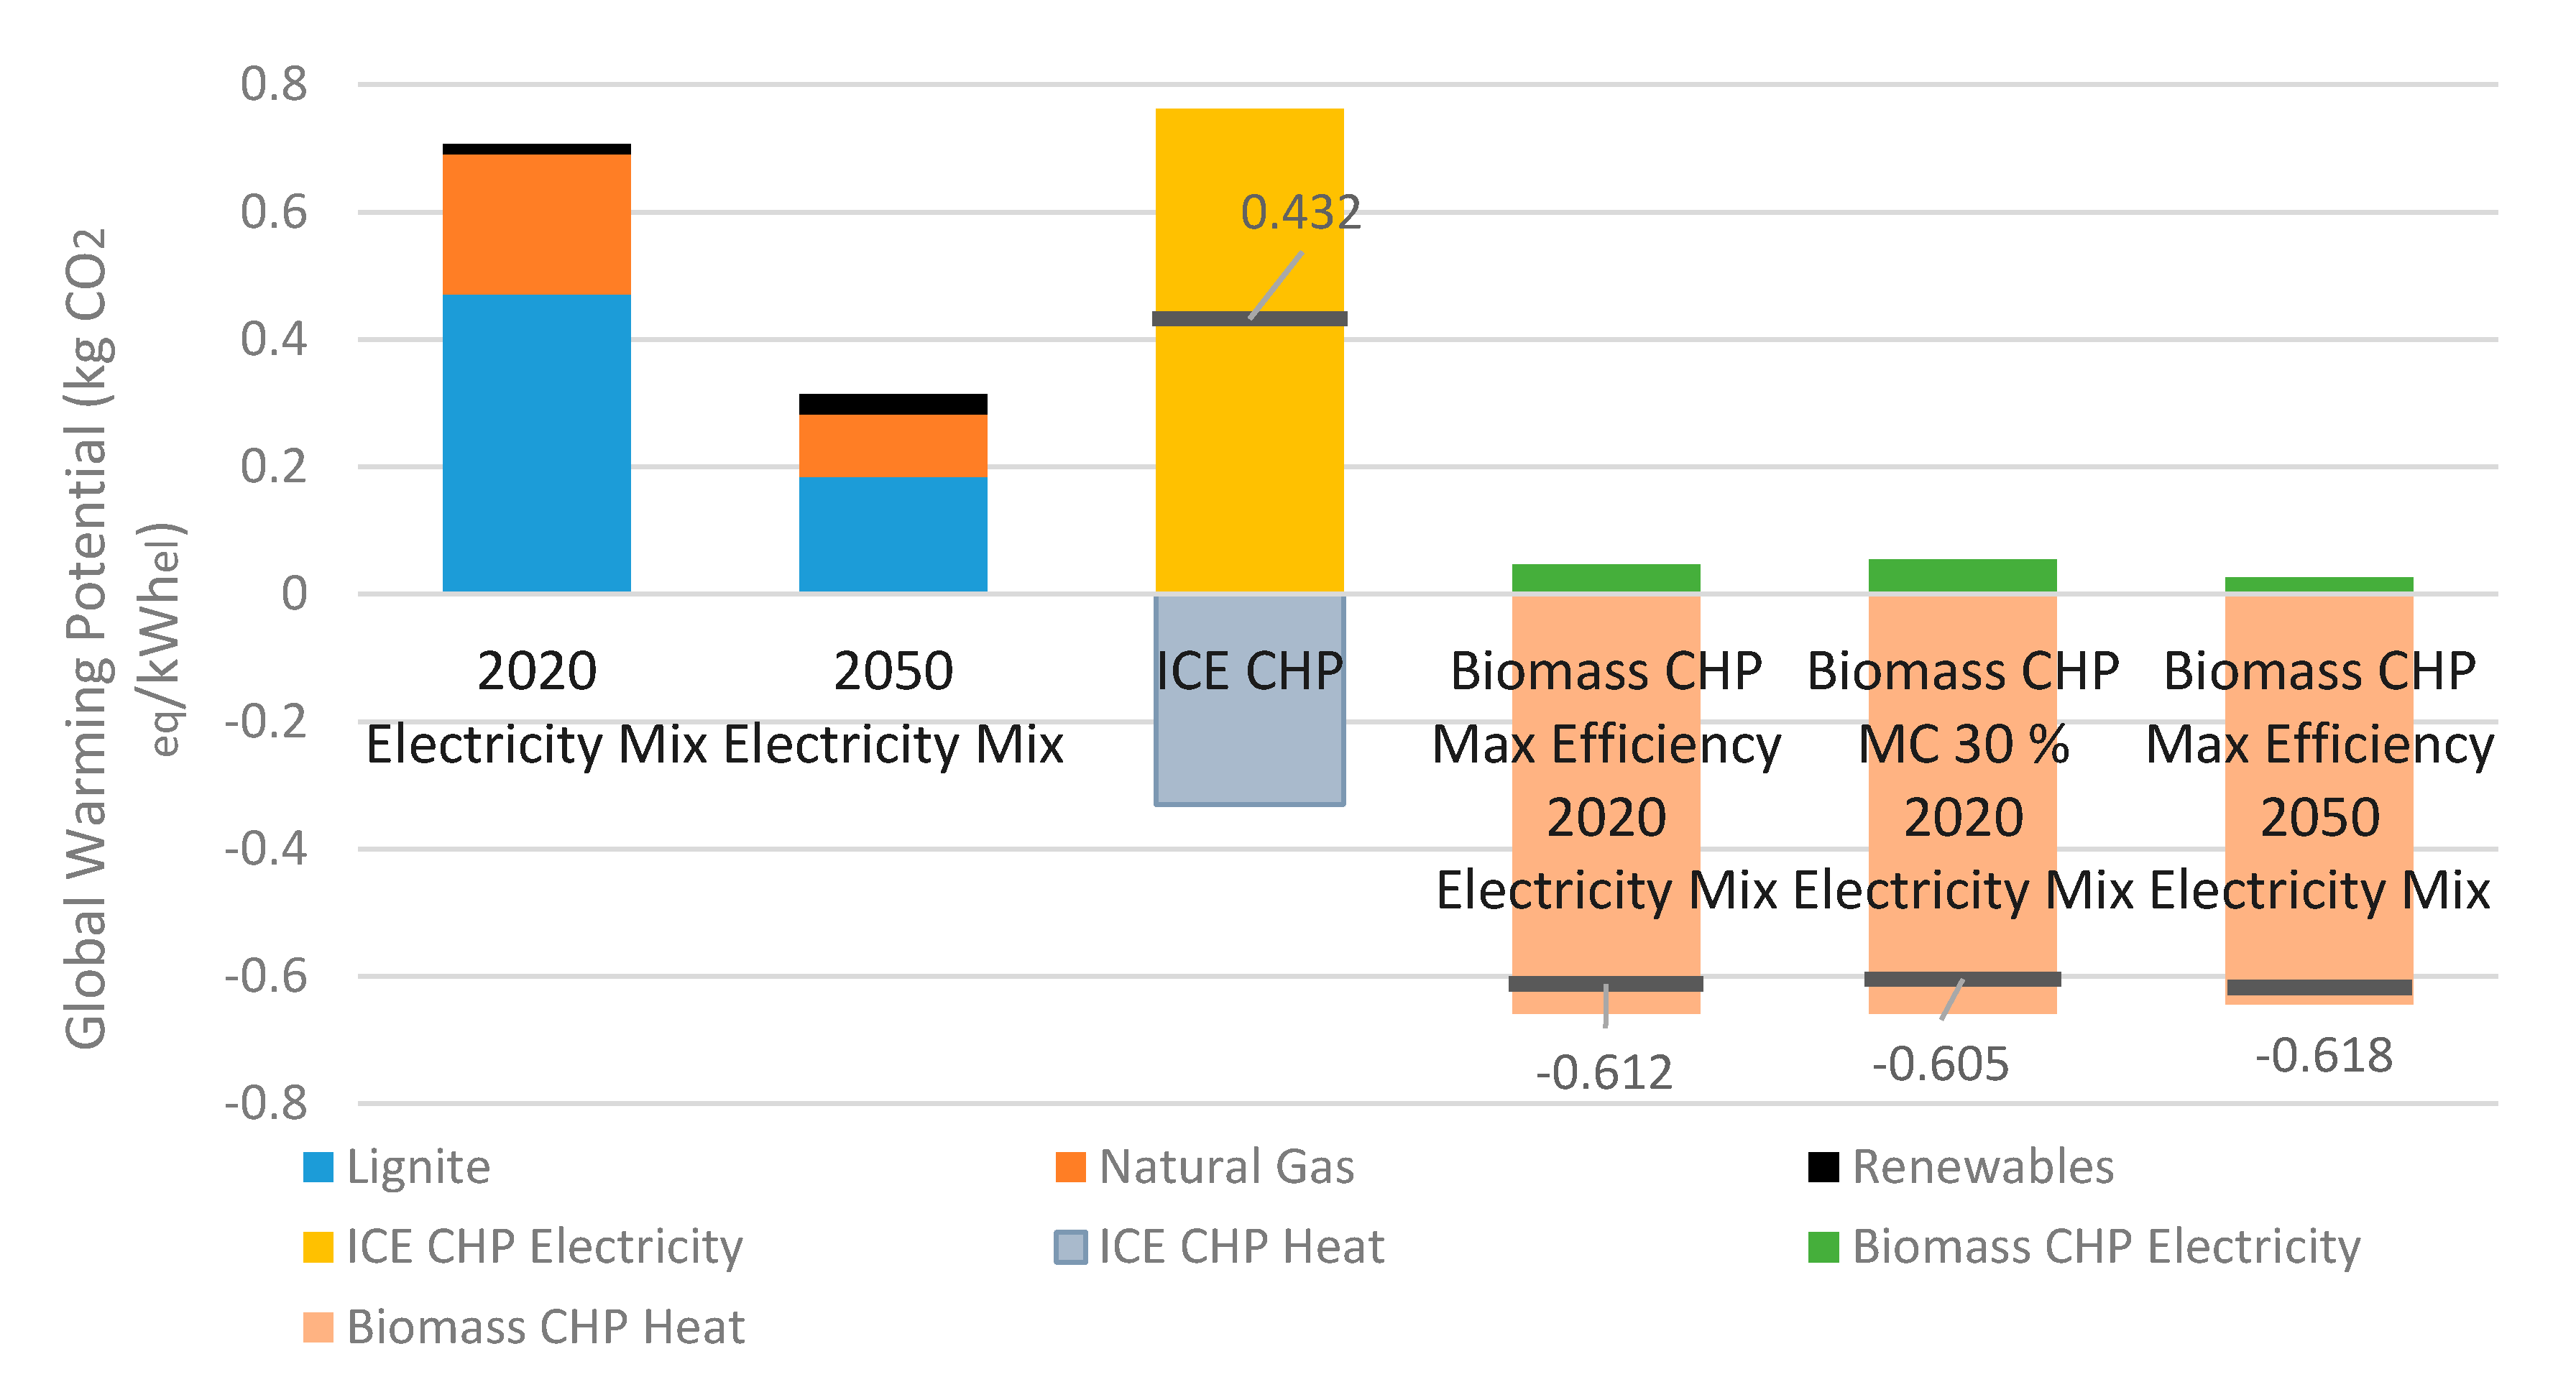
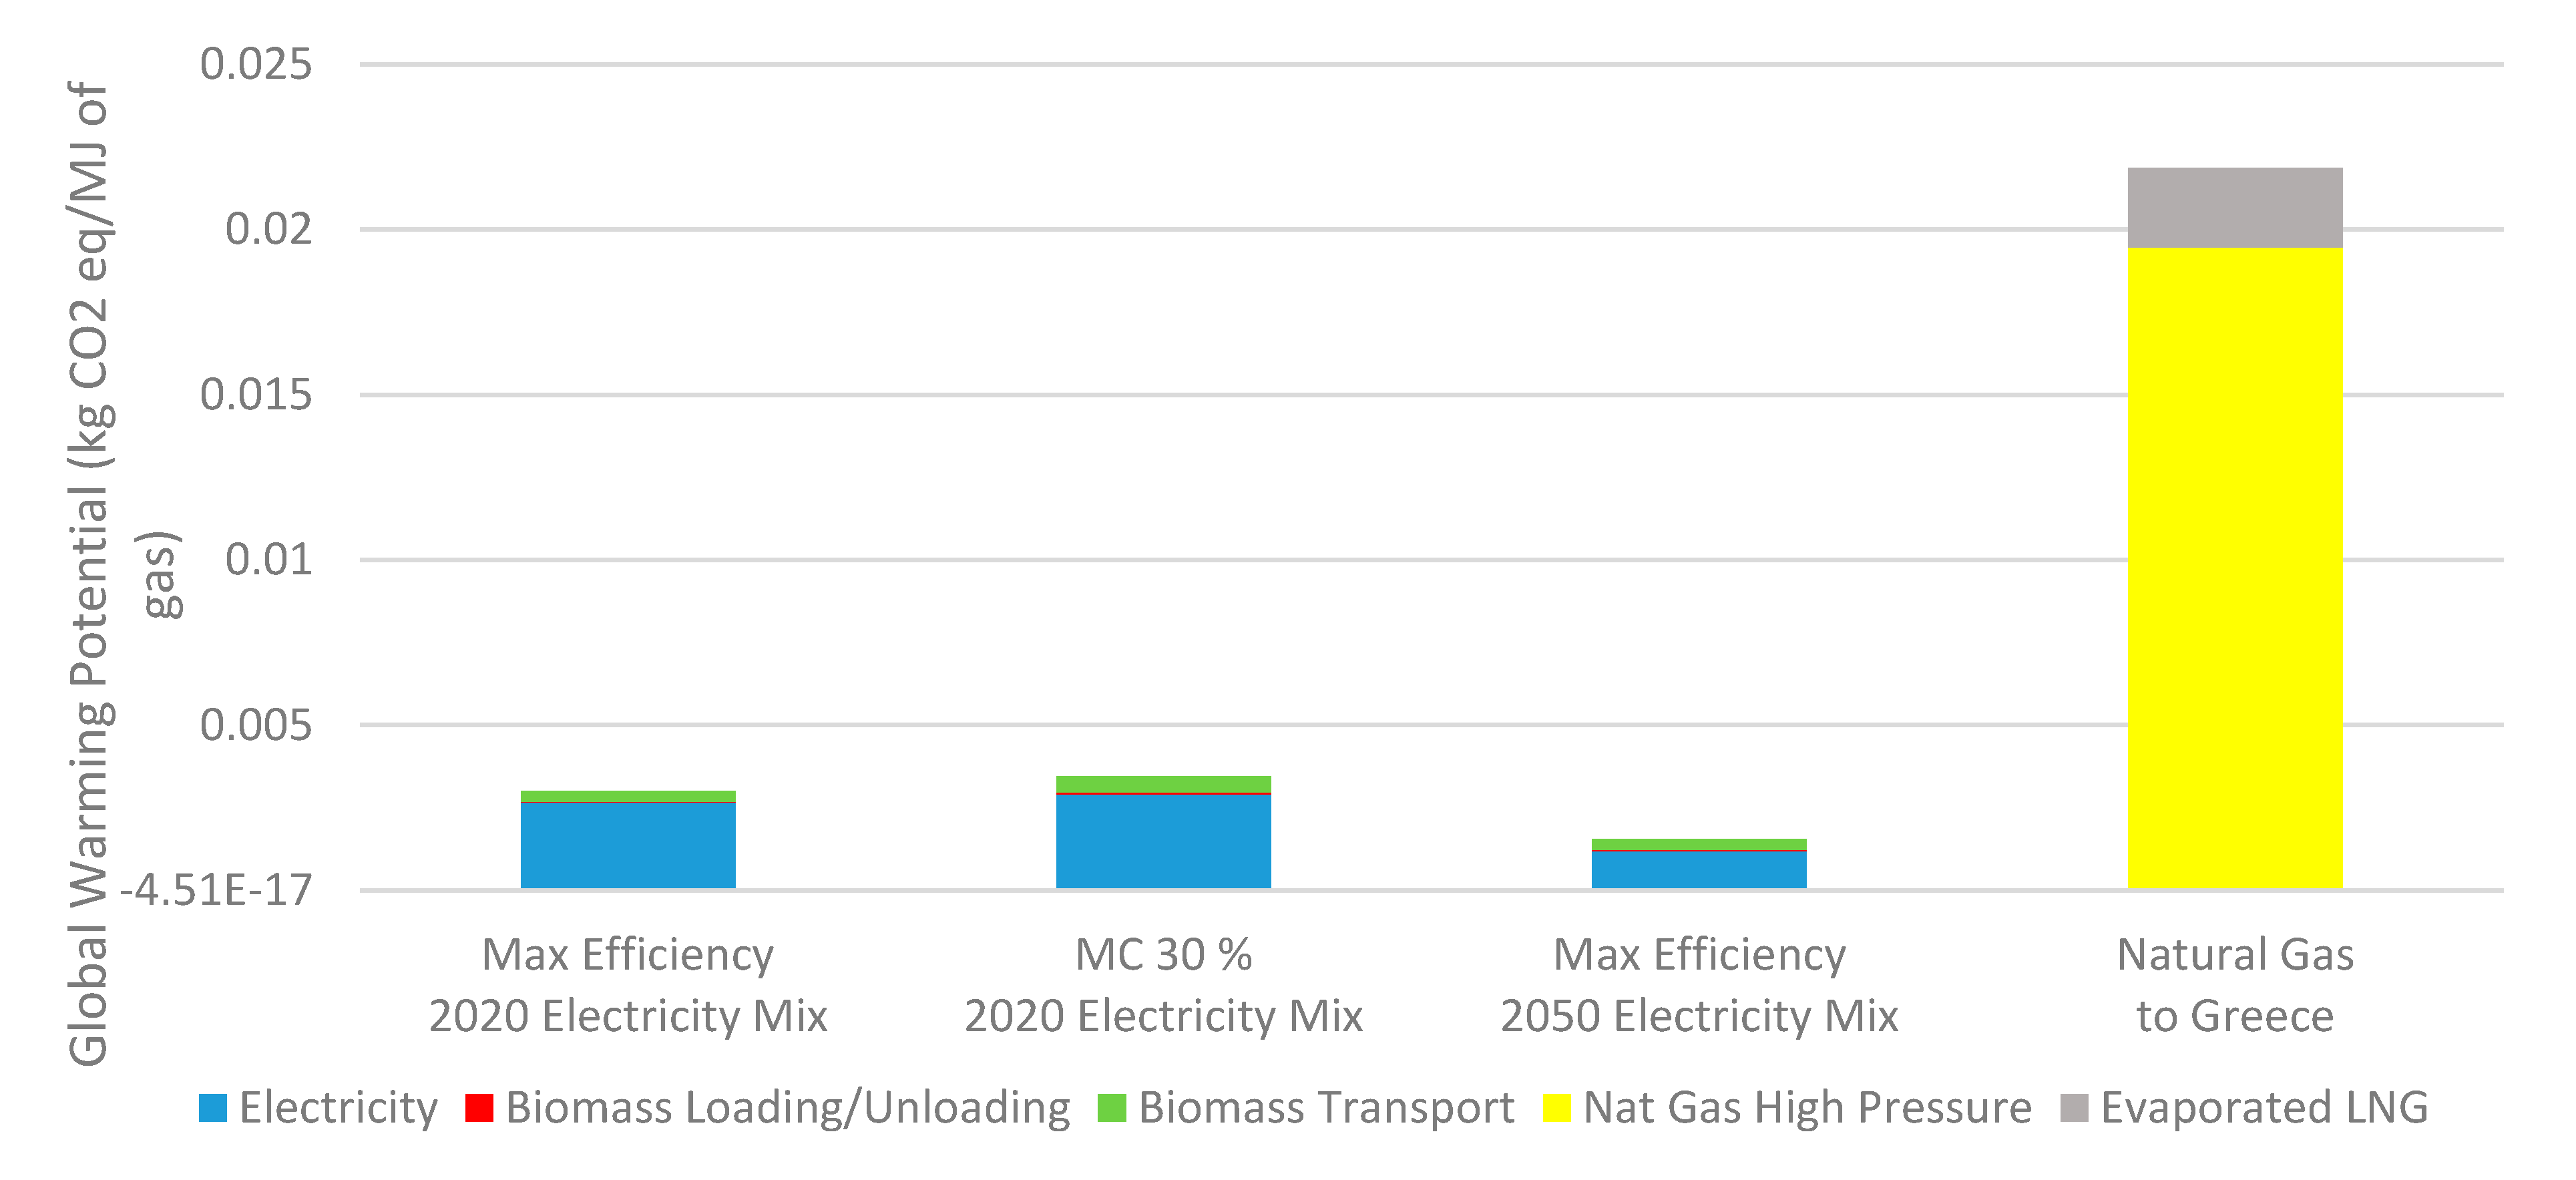
The aim of the study is to assess the environmental impacts associated with the operation of a combined heat and power biomass gasification power plant, powered with the most dominant agricultural residues of the Thessaly region, Greece, to identify the environmental “hotspots” of the whole energy production process and to compare the environmental burdens of syngas produced by the plant versus those of the Greek natural gas supply chain. The environmental footprint of the considered biomass gasification CHP plant was compared with conventional energy production alternatives, namely:
  • Electricity from the grid of mainland Greece according to the current energy mix.
  • Electricity from the grid of mainland Greece according to the current 2050 policy projections.
  • Electricity from a natural gas internal combustion engine on CHP mode.
The functional unit of the study was 1 kWh of electrical output. The thermal energy produced by the plant, as it is described in ISO 14040, was treated as an avoided product of a conventional condensing boiler, fired by natural gas. An additional functional unit of 1 MJ energy content was considered in the case of comparing the syngas production versus natural gas supply. The software used for the Life Cycle assessment was Simapro 7.2, which was equipped with Ecoinvent 2.0 database.
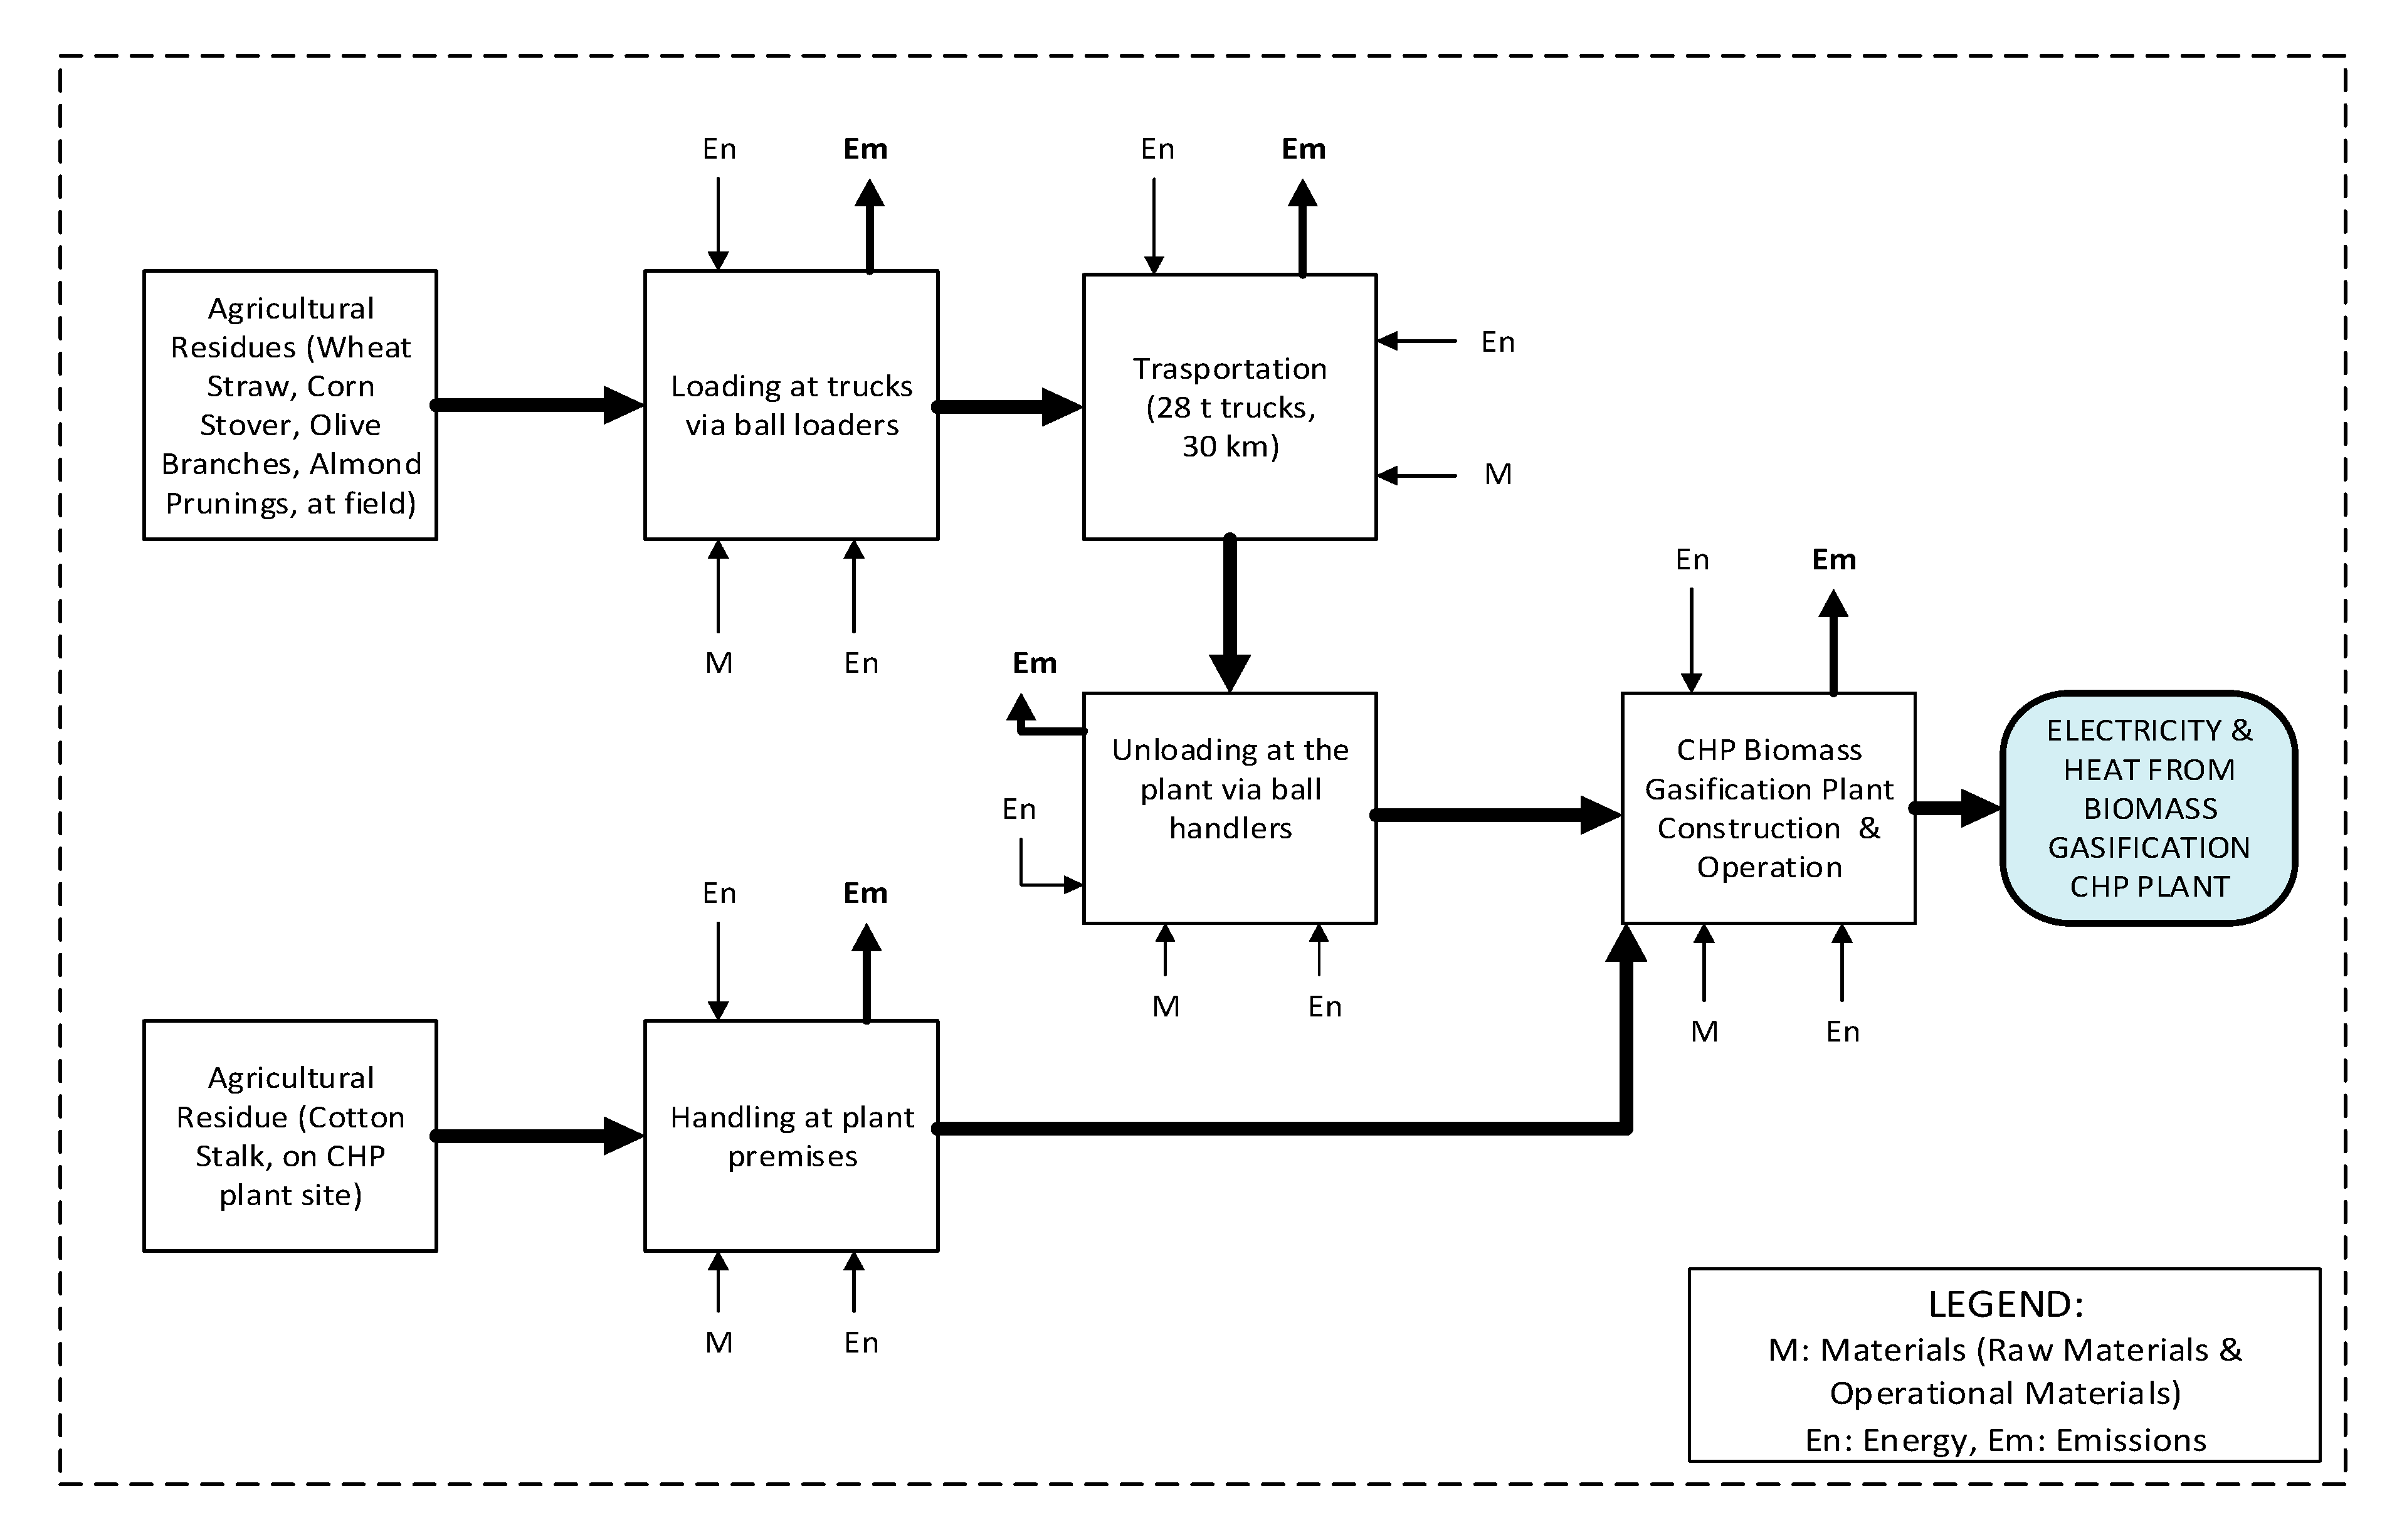
In this study, a “Cradle to Gate” Life Cycle Assessment was performed. Cotton stalk was determined to be the main biomass type used, so the plant is thought to be installed in the cotton stalk production area. It was assumed that all other biomass types were transported to the plant for an average distance of 30 km via 28 t trucks. The trucks were loaded in the biomass production site and unloaded in the CHP plant via loading machines. Cotton stalk was handled inside the plant premises via proper handling equipment. The main operations of the evaluated CHP biomass gasification plant that were considered in the LCA study are (i.) Loading of agricultural residues to trucks, (ii.) Transportation to the plant, (iii.) Unloading at the plant, (iv.) Plant construction and operation and (v.) Biomass handling. The system boundaries are presented in Figure 2.
The cultivation of biomass was not included in this study, because agricultural residues are wastes of farming activities, and thus their cultivation does not contribute to the environmental burdens of the system examined. The life span of the plant was determined to be 20 years, while plant decommissioning and ash treatment were not taken into account. The electricity required for the operation of the gasification plant is thought to be obtained directly from the mainland Greek electricity grid.

2.3.3. Life Cycle Inventory Analysis

The energy production via biomass gasification includes various subprocesses which involve energy and material exchange between the CHP plant, the technosphere and the environment. As a result, mass and energy flows between all operations which characterize the CHP biomass gasification plant (shown in Figure 2) should be modeled and eventually quantified. The main inventory data used in the LCA study of this work are summarized in Table 9.
Since the aim of this study is to provide an insight into the environmental impact of the simulated CHP biomass gasification plant, life cycle inventory data were obtained from the Ecoinvent 2.0 database, which was modified in order to include case-specific data such as the performance of the simulated biomass gasification plant and all information associated with the local biomass supply chain [56].
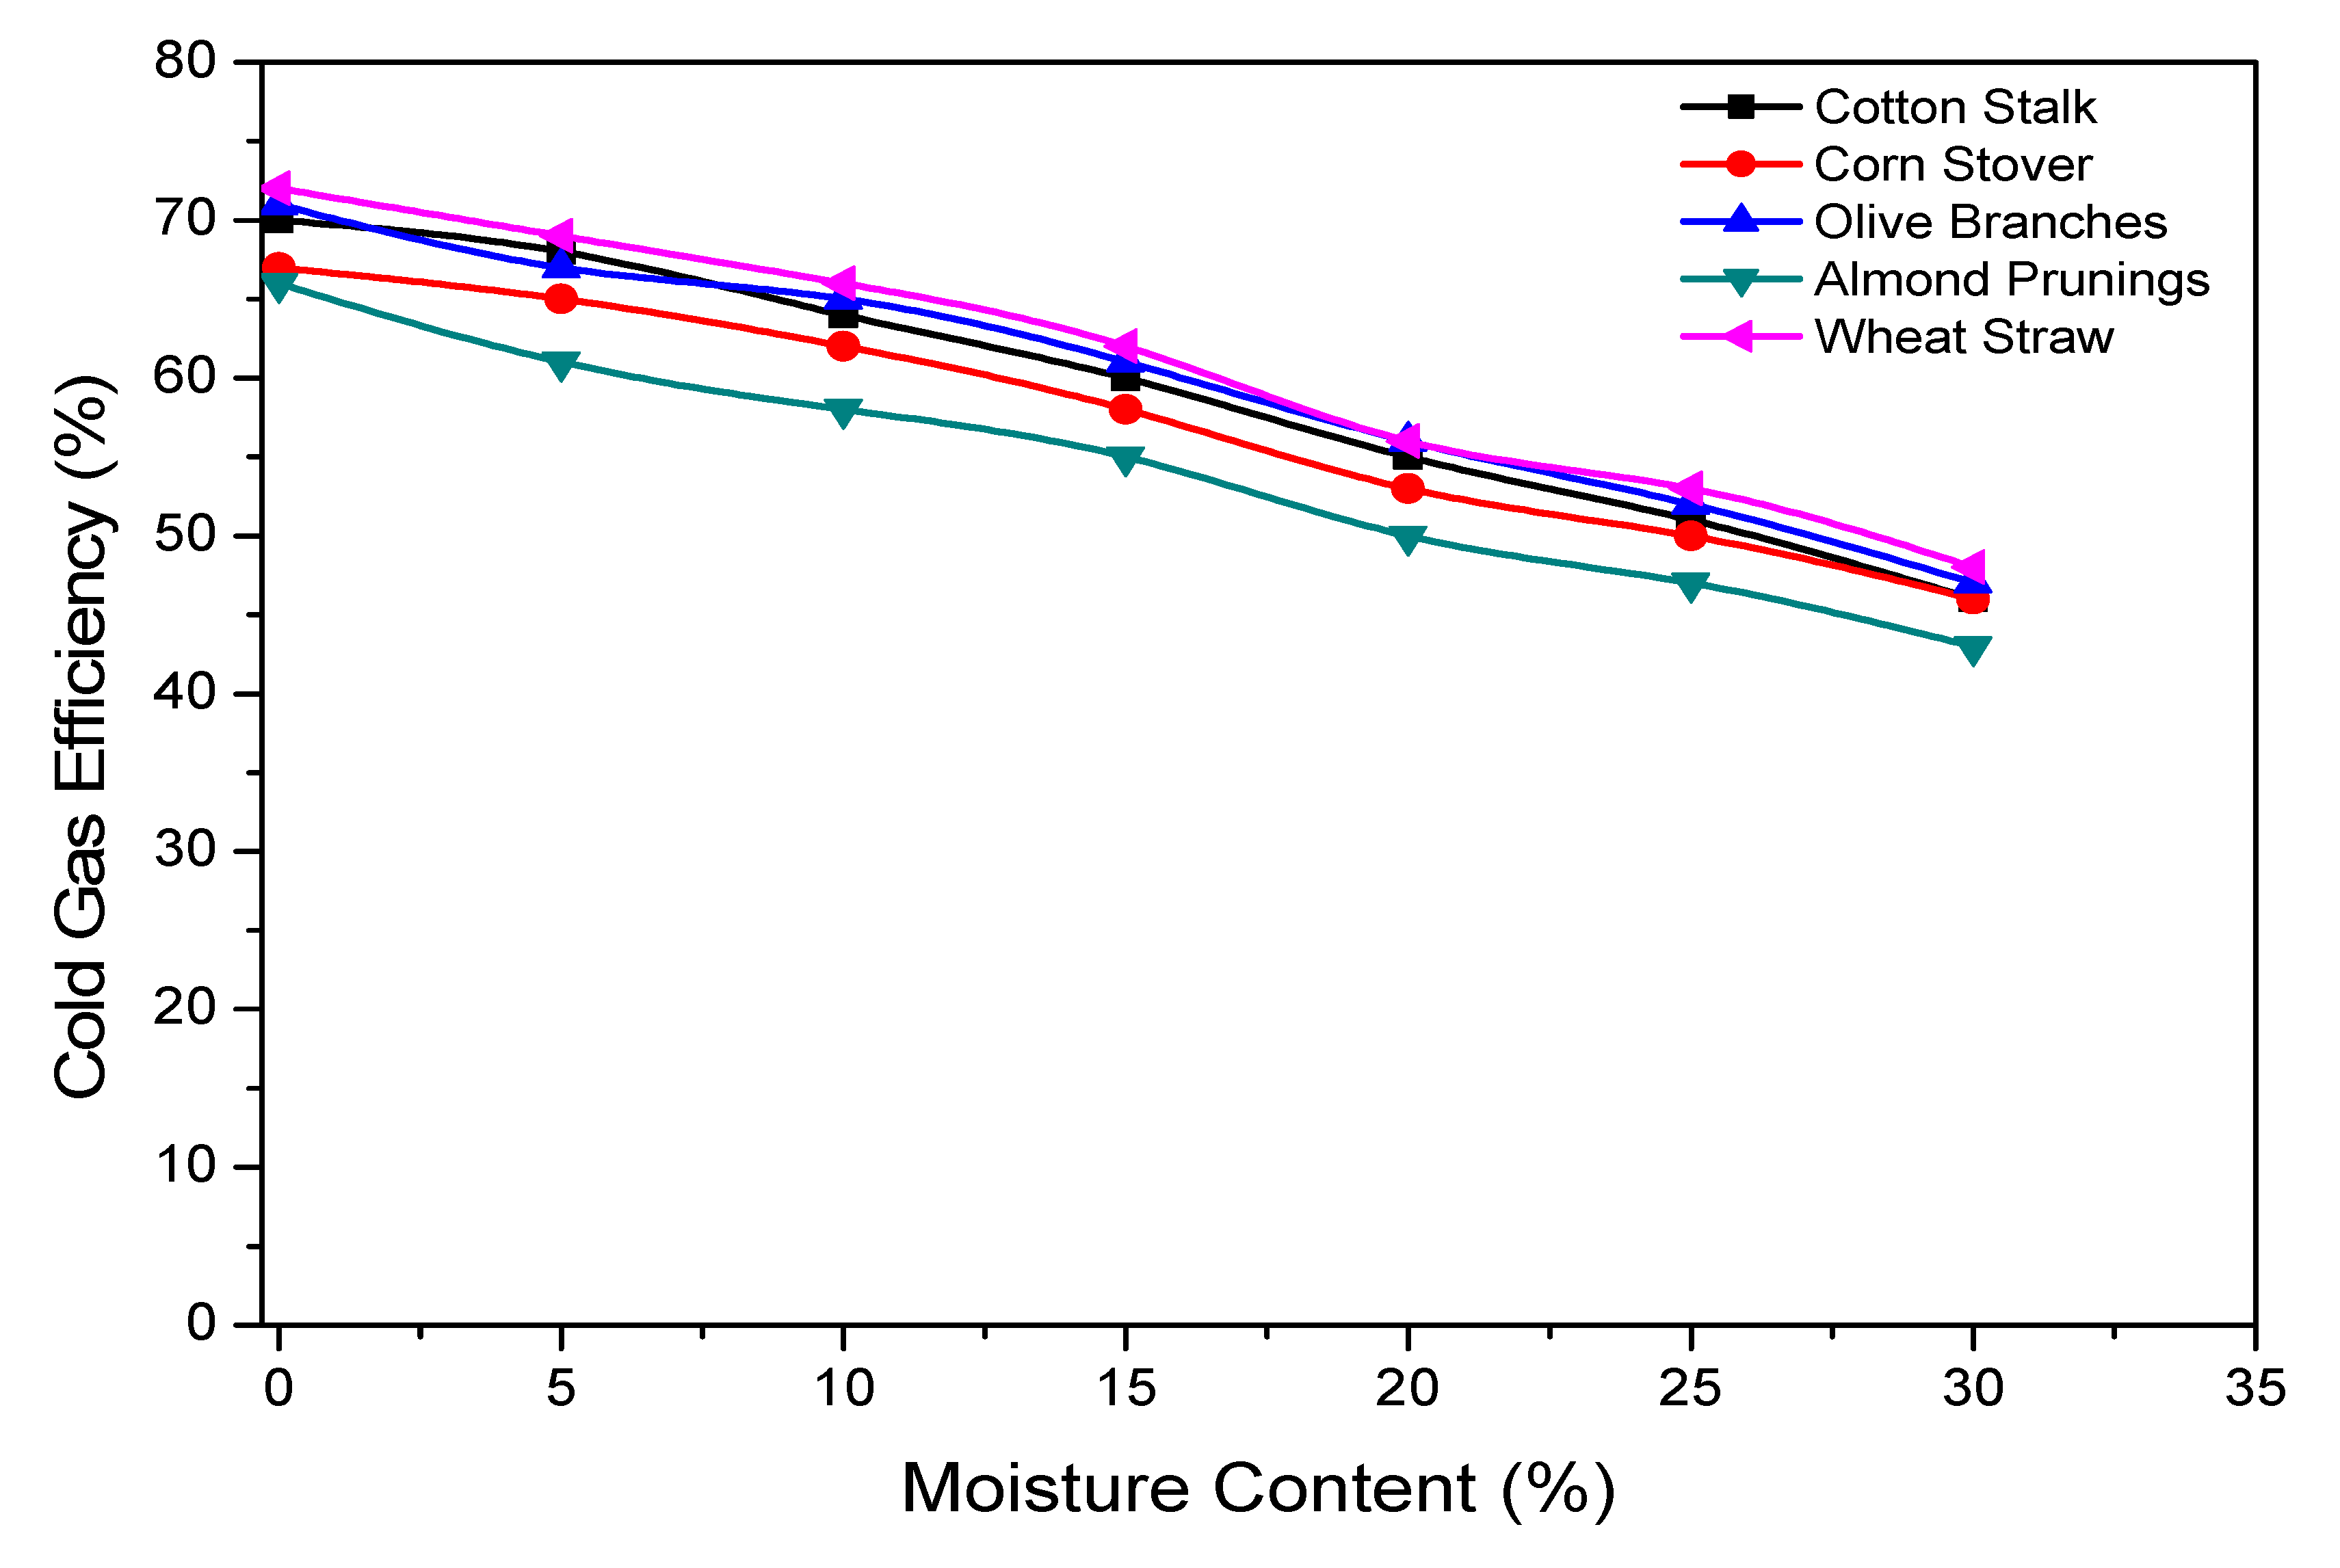
As already described, the simulated CHP plant has an output power of 1 MWel and 2.25 MWth and is supplied with syngas, which is the output of the gasification process simulated in Aspen Plus V8.8. In this study, the plant was considered to run only at full load, whereas partial load scenarios were not examined. In order to couple the operation of the CHP plant with the operation of the gasifier, the major data input requirements were the characteristics (cold gas efficiency, syngas and raw biomass LHV) of the optimal operating points in terms of maximum gasification efficiency as well as the variation of the aforementioned parameters with respect to raw biomass moisture content variation. Thus, the designed load of the CHP plant (3.25 MW) determines not only the amount of the required syngas volume flow from the gasification process but also the biomass feed which is supplied into the reactor for every raw biomass moisture content scenario. For simplicity reasons, all feedstocks examined in different moisture content scenarios have the same initial moisture content, which varies from 0% (optimal operating point) to 30% (most unfavorable scenario).
The equipment used for loading biomass into trucks and unloading it onto the plant site was considered to be a bale loader. The same equipment is used to handle in-house cotton stalk residues inside the CHP plant. It was modeled via “Baling” and “Loading Bales” processes, which were modified in order to calculate all flows per mass unit and to include both loading and unloading processes.
The CHP plant was assumed to be situated in the location of production of cotton stalk, because it was considered as the main biomass type in this study. All other residues were transferred with fleet average, 28 ton trucks, from distances lower than, or equal to, 30 km, in order to minimize transfer costs [38]. For simplicity, the transfer distance was considered to be constant and no intermediate distances were examined. Thus, the ton-kilometer value used in the LCA study was 0.03. Trucks return empty to the loading site, so a loading factor of 50% was considered.
The operation of the biomass gasification plant was modeled via the datasheet “Synthetic gas, from wood, at fixed bed gasifier”, assuming that only the gasification plant operation contributed to the total environmental burdens of the plant. This could also be justified by the fact that all CO2 emissions were considered to be carbon-neutral, and other byproducts and byprocesses of the CHP plant, such as the disposal of bottom ash, were not considered in this study. The datasheet was modified to account for the current and 2050 projection electricity mixture and relates the biomass quantity required in order to produce 1 m3 of syngas. Furthermore, the volume and energy content of syngas were associated using custom datasheets via the syngas LHV, for every feedstock, moisture content and electricity grid mixture examined.
However, an assumption should be made regarding the fact that the energy from syngas produced from each feedstock was taken into account in the production of electricity and heat from the CHP biomass gasification plant. For this reason, it was assumed that the energy released by syngas burn could be allocated to the five feedstocks which were simulated in this work. Allocation to each feedstock was done by calculating the normalized working hours of the plant for each feedstock examined, using as input their annual available mass (presented in Table 4). More specifically, by calculating the required feed rate (kg/h) of each feedstock in order to reach the designed power output of the plant and by dividing it by the annual supply of its type, the plant’s annual working hours for each feedstock could be determined. The normalized working hours for each feedstock could be calculated as a fraction of each feedstock working hours to the total plant working hours for the two operational scenarios examined. The calculation of syngas energy allocation to different feedstocks examined in this study is summarized in Table 10.
Finally, the energy conversion in the CHP plant was simulated in a custom datasheet, in which electricity from the CHP plant was associated with the required energy from the syngas energetic mixture via the plant’s electrical efficiency (presented in Table 1). The thermal energy produced in the CHP plant was included in the aforementioned datasheet as the heat produced by a conventional condensing boiler, fired by natural gas, which is treated as an avoided product.
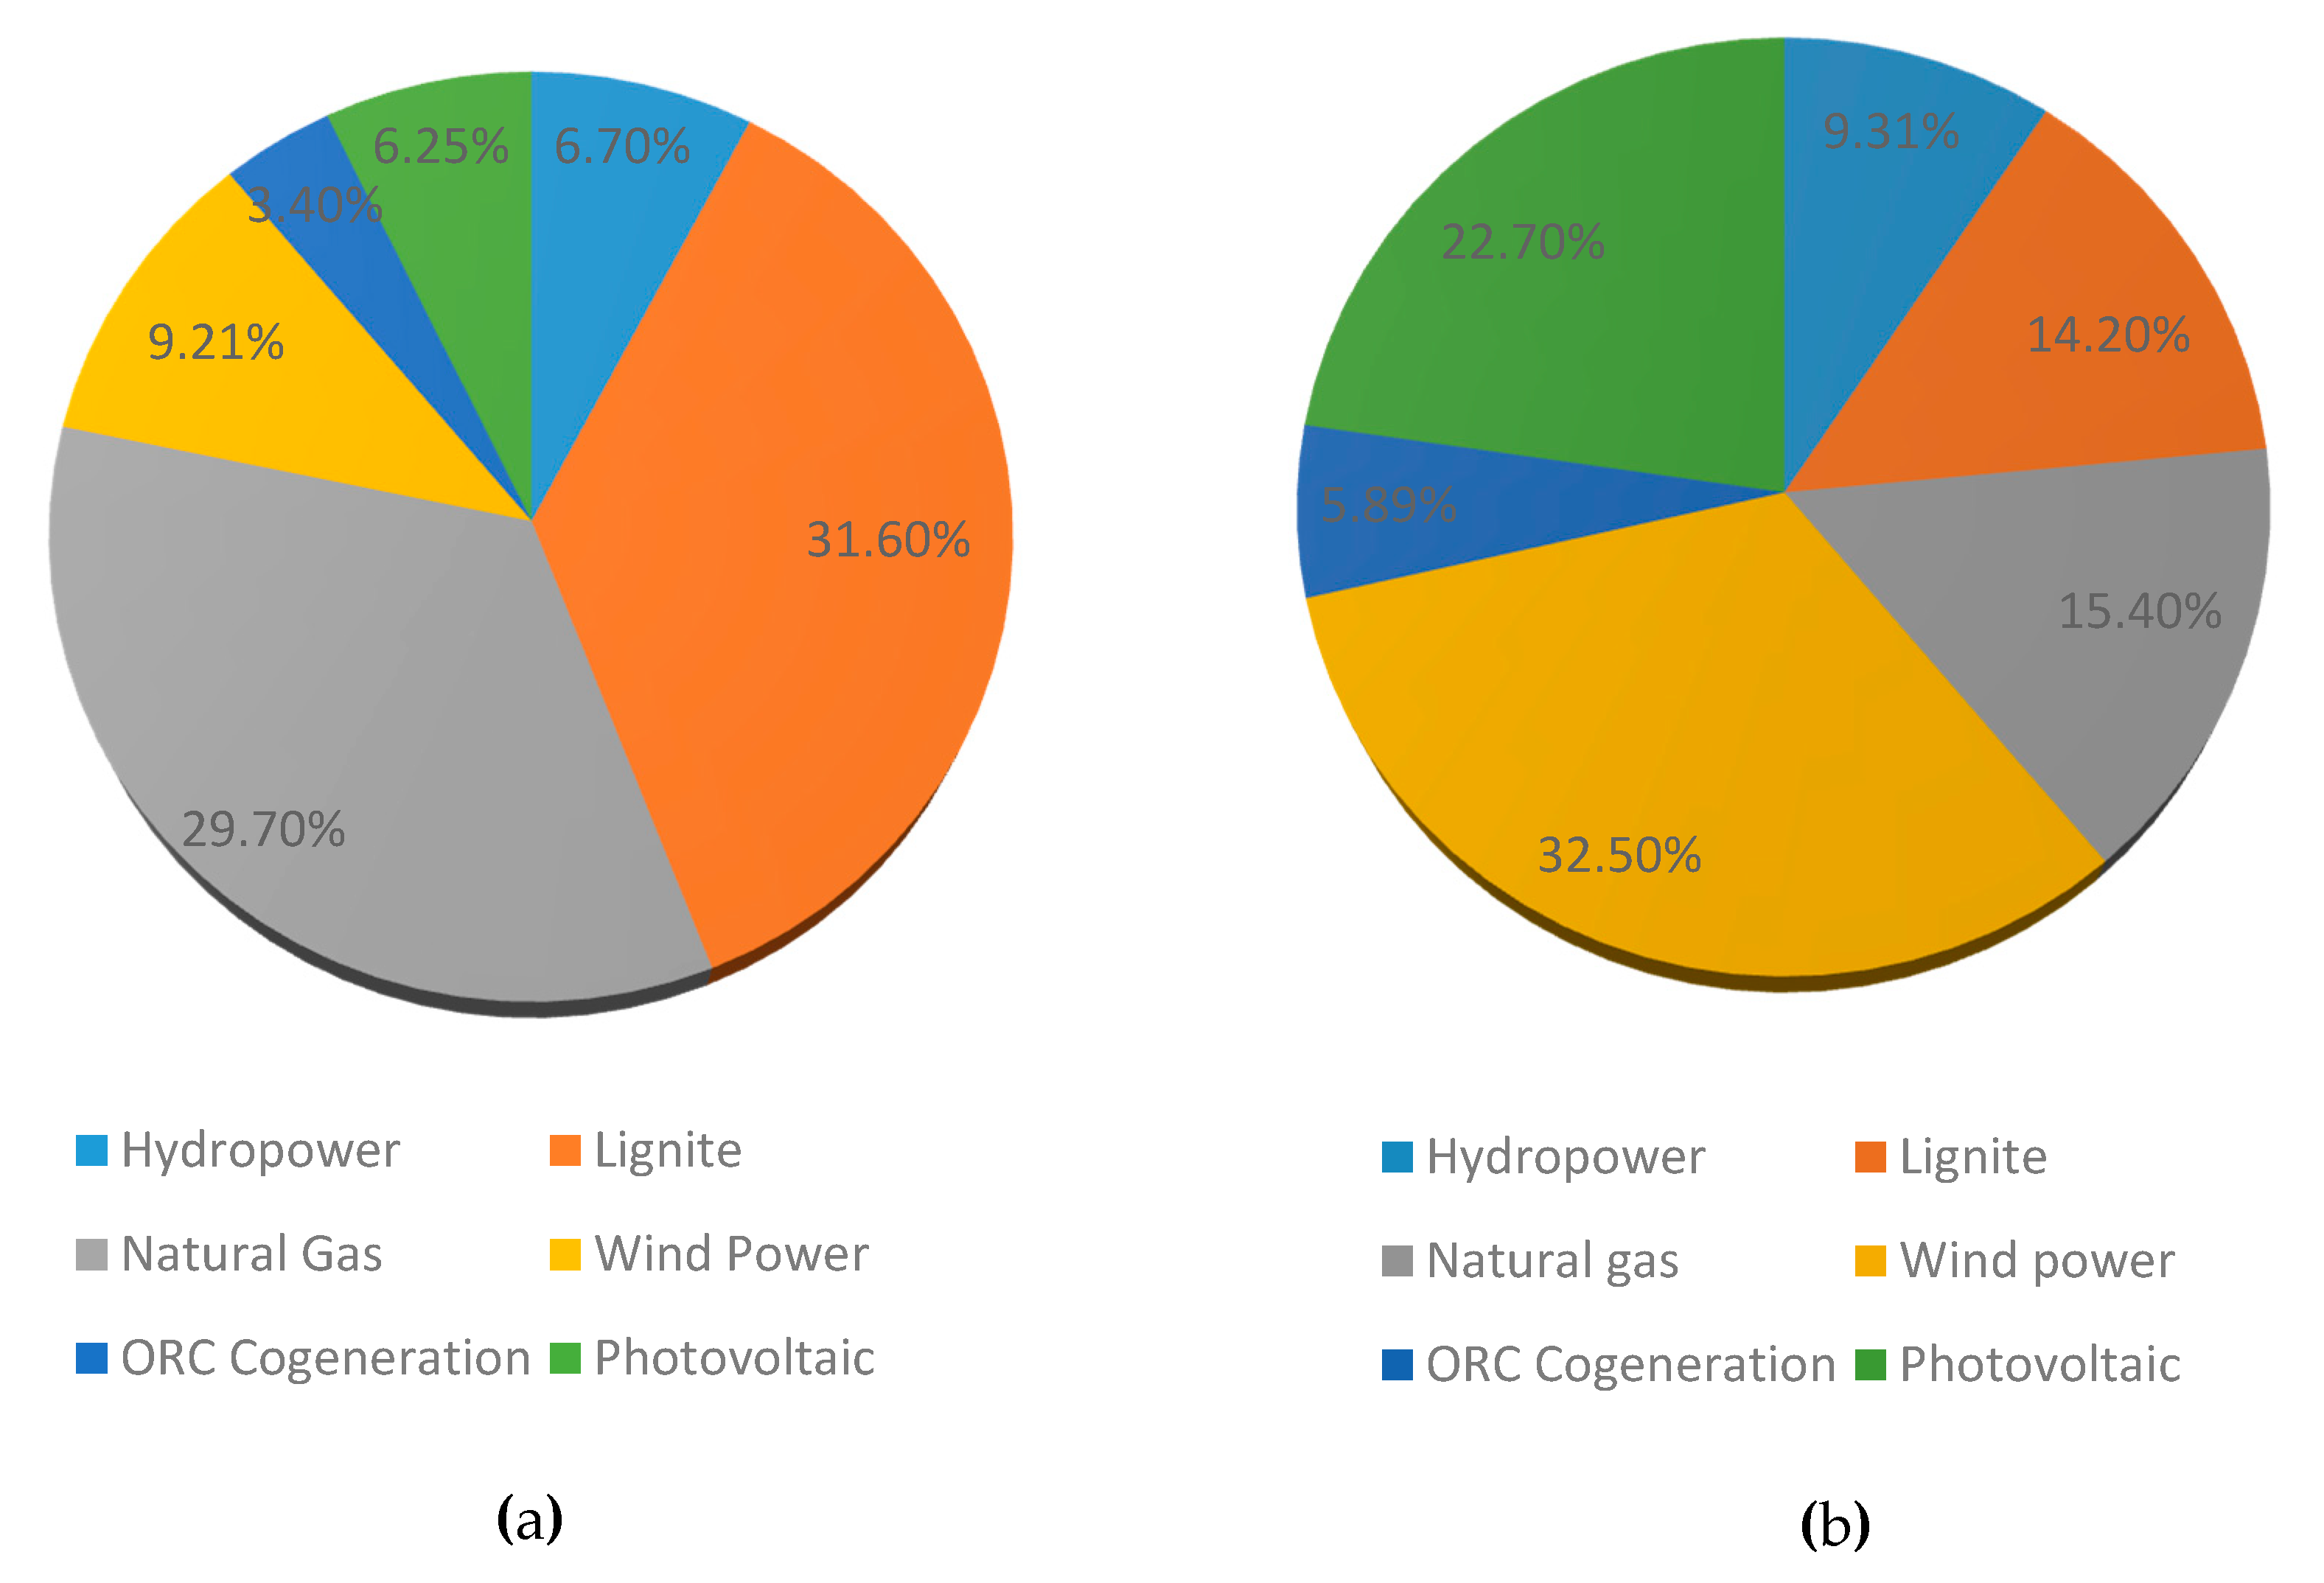
The electricity production from the CHP biomass gasification plant was compared with the electricity from the grid of mainland Greece. The operation of the gasification plant was assumed to require electricity from the grid. The present energy mixture of Greece, as well as the 2050 projection under current energy policies, were obtained from the DAS Monthly Reports of the Greek Operator of Electricity Market and are presented in Figure 3a,b [Source: http://www.lagie.gr]. The two electricity mixtures examined were inserted in the Greek Electricity mix datasheet.
Furthermore, for the conventional alternative of the natural gas internal combustion engine, which is used for electricity and heat production, a Deutz TBG 620K genset was considered. Technical specifications for the aforementioned engine were obtained from the official site of the manufacturer and are presented in Table 11. The engine was modeled in a custom datasheet, which connected the electrical output of the engine with the natural gas energy required via the existing “Natural Gas, burned in Cogen 1MWel lean burn” datasheet and the electrical efficiency of the engine. It should be mentioned that the thermal power produced by the engine is included in the study as an avoided product. It should be noted that the datasheet, which modeled the natural gas burn, included combustion, plant operation and natural gas supply chain emissions.
Finally, the use of natural gas in the grid electricity mixture and the CHP internal combustion engine required a modeling of the Greek natural gas supply chain. According to the Greek Public Gas Corporation (DEPA), high-pressure natural gas is transferred via pipelines (83%) and LNG is transferred via ships (17%) [https://www.depa.gr/natural-gas-commerce]. In this work, for the sake of simplicity, the allocation of natural gas originating from different sources into the total mixture was determined by its energy and not by its quantity, assuming that the pipeline natural gas and the LNG have the same lower heating value.

2.3.4. Life Cycle Impact Assessment Method

The impact categories assessed in this study are:
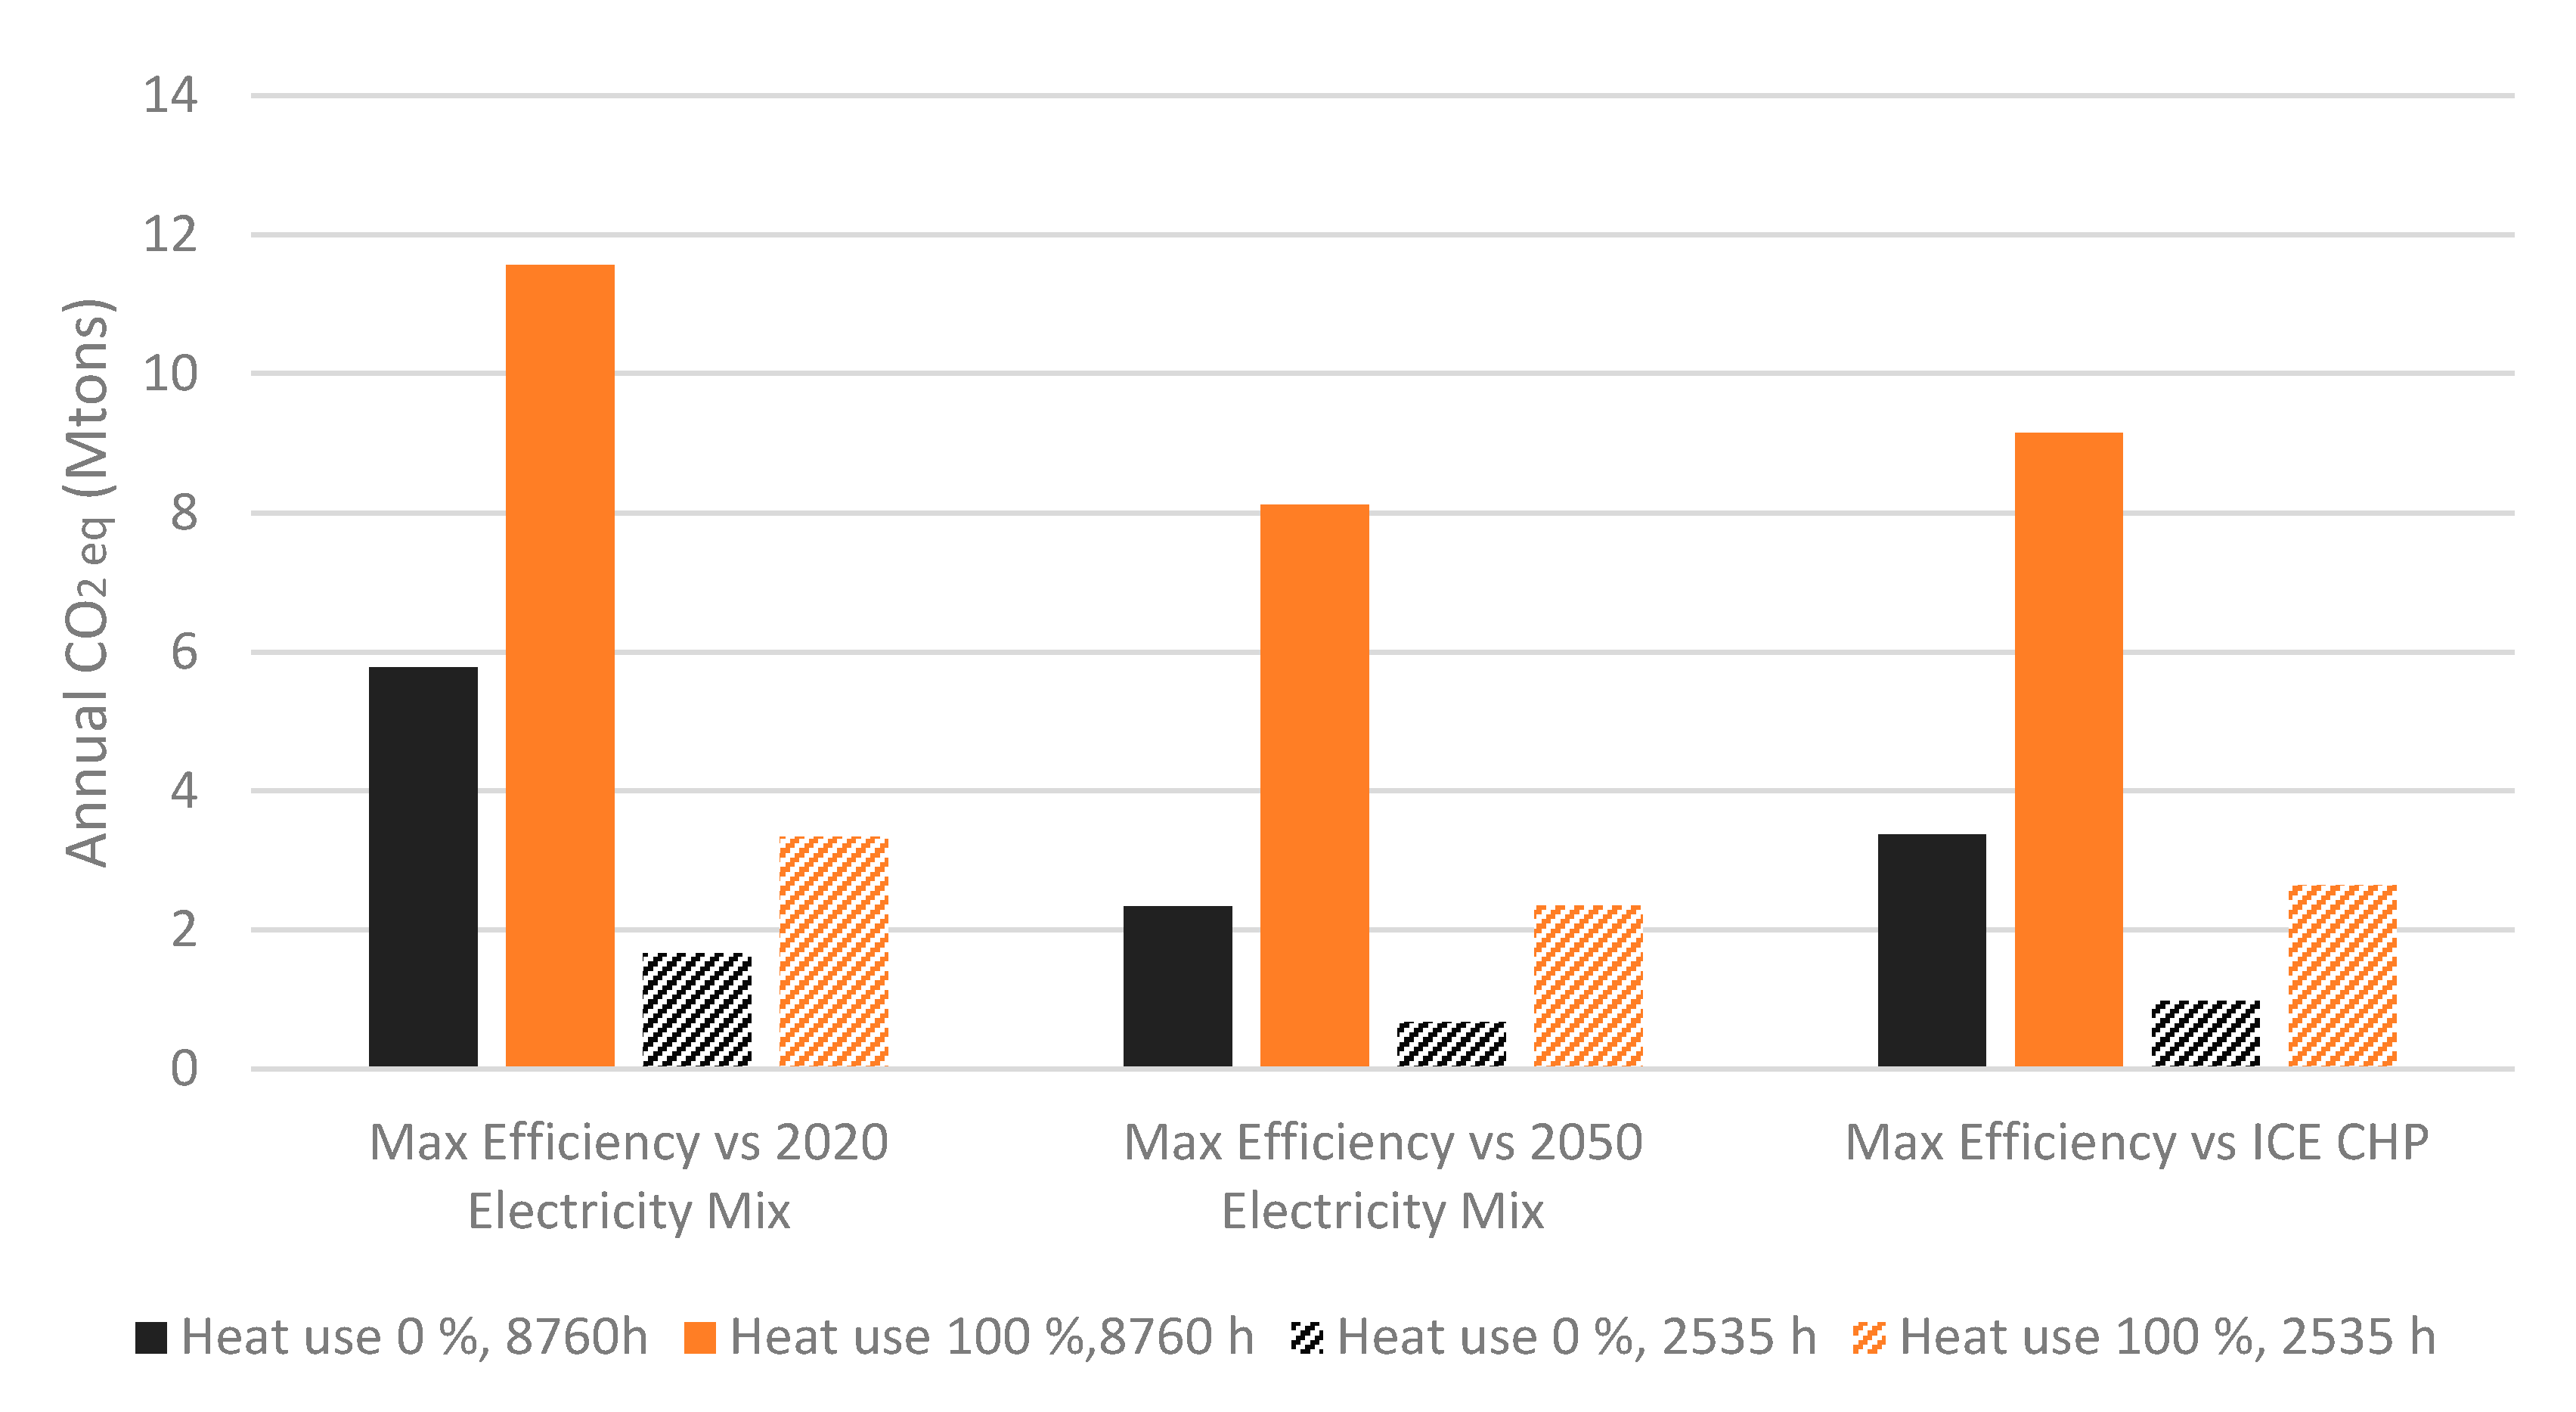
  • Global Warming Potential (GWP) (units: kg CO2eq/ kWhel) It was assessed via the IPCC GWP 100a method [57].
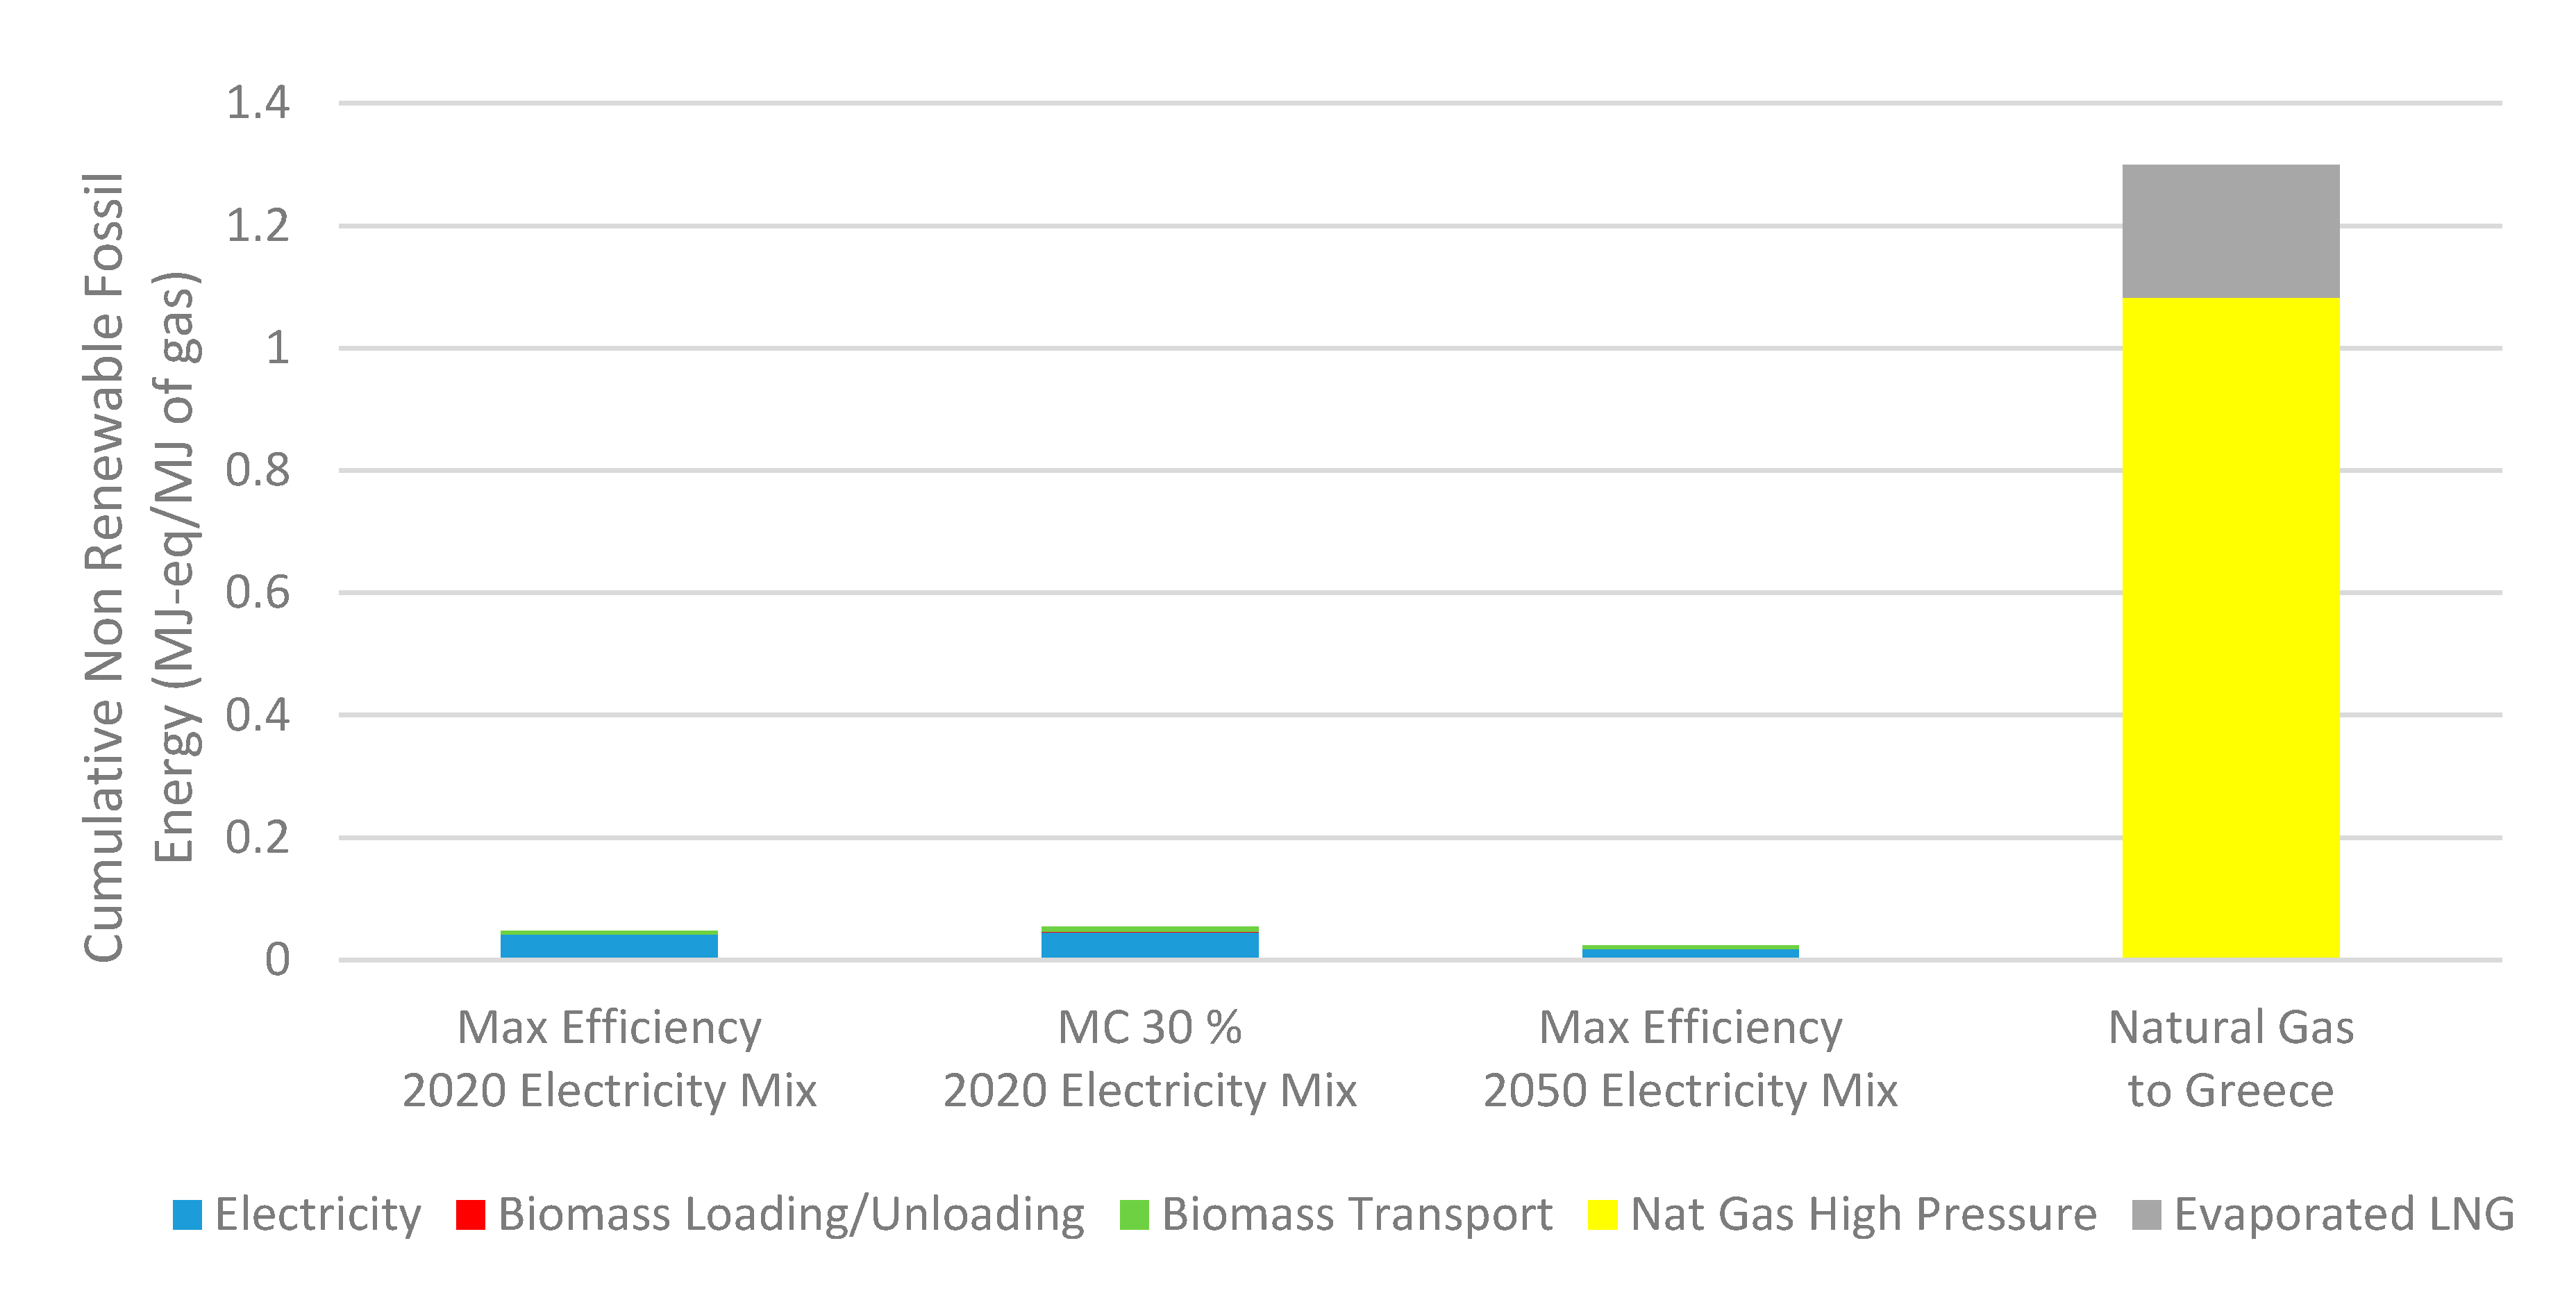
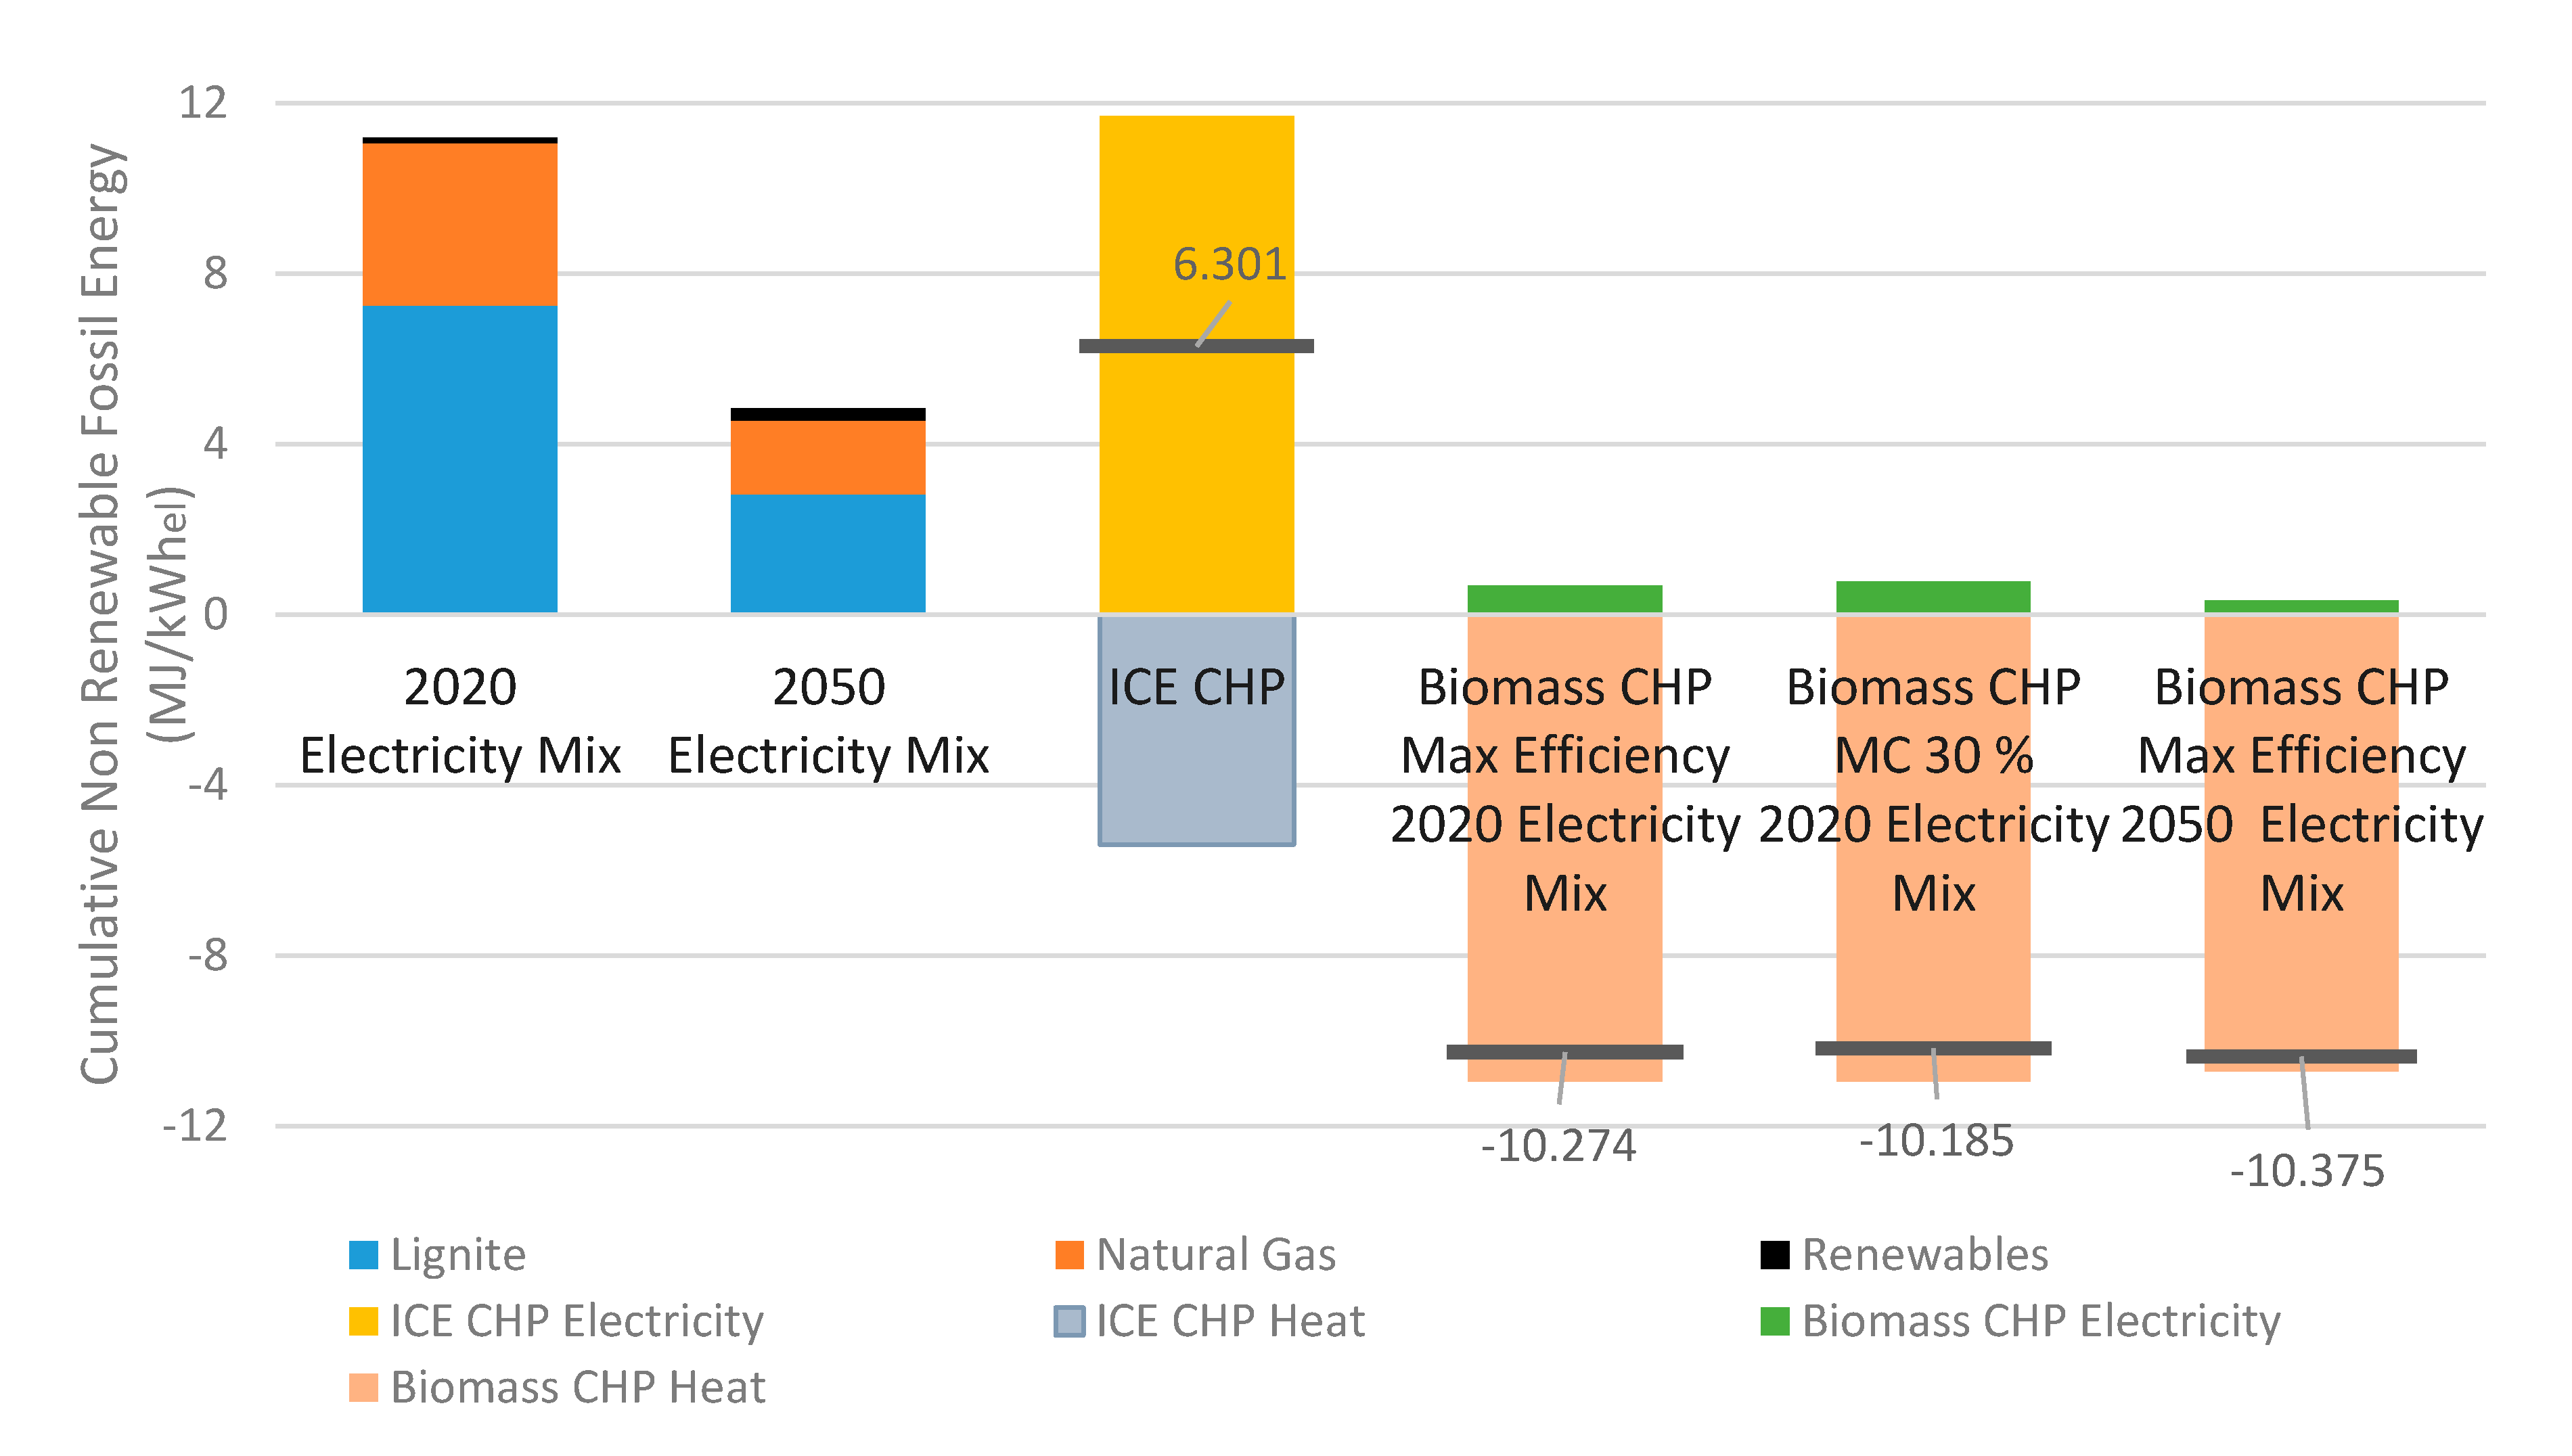
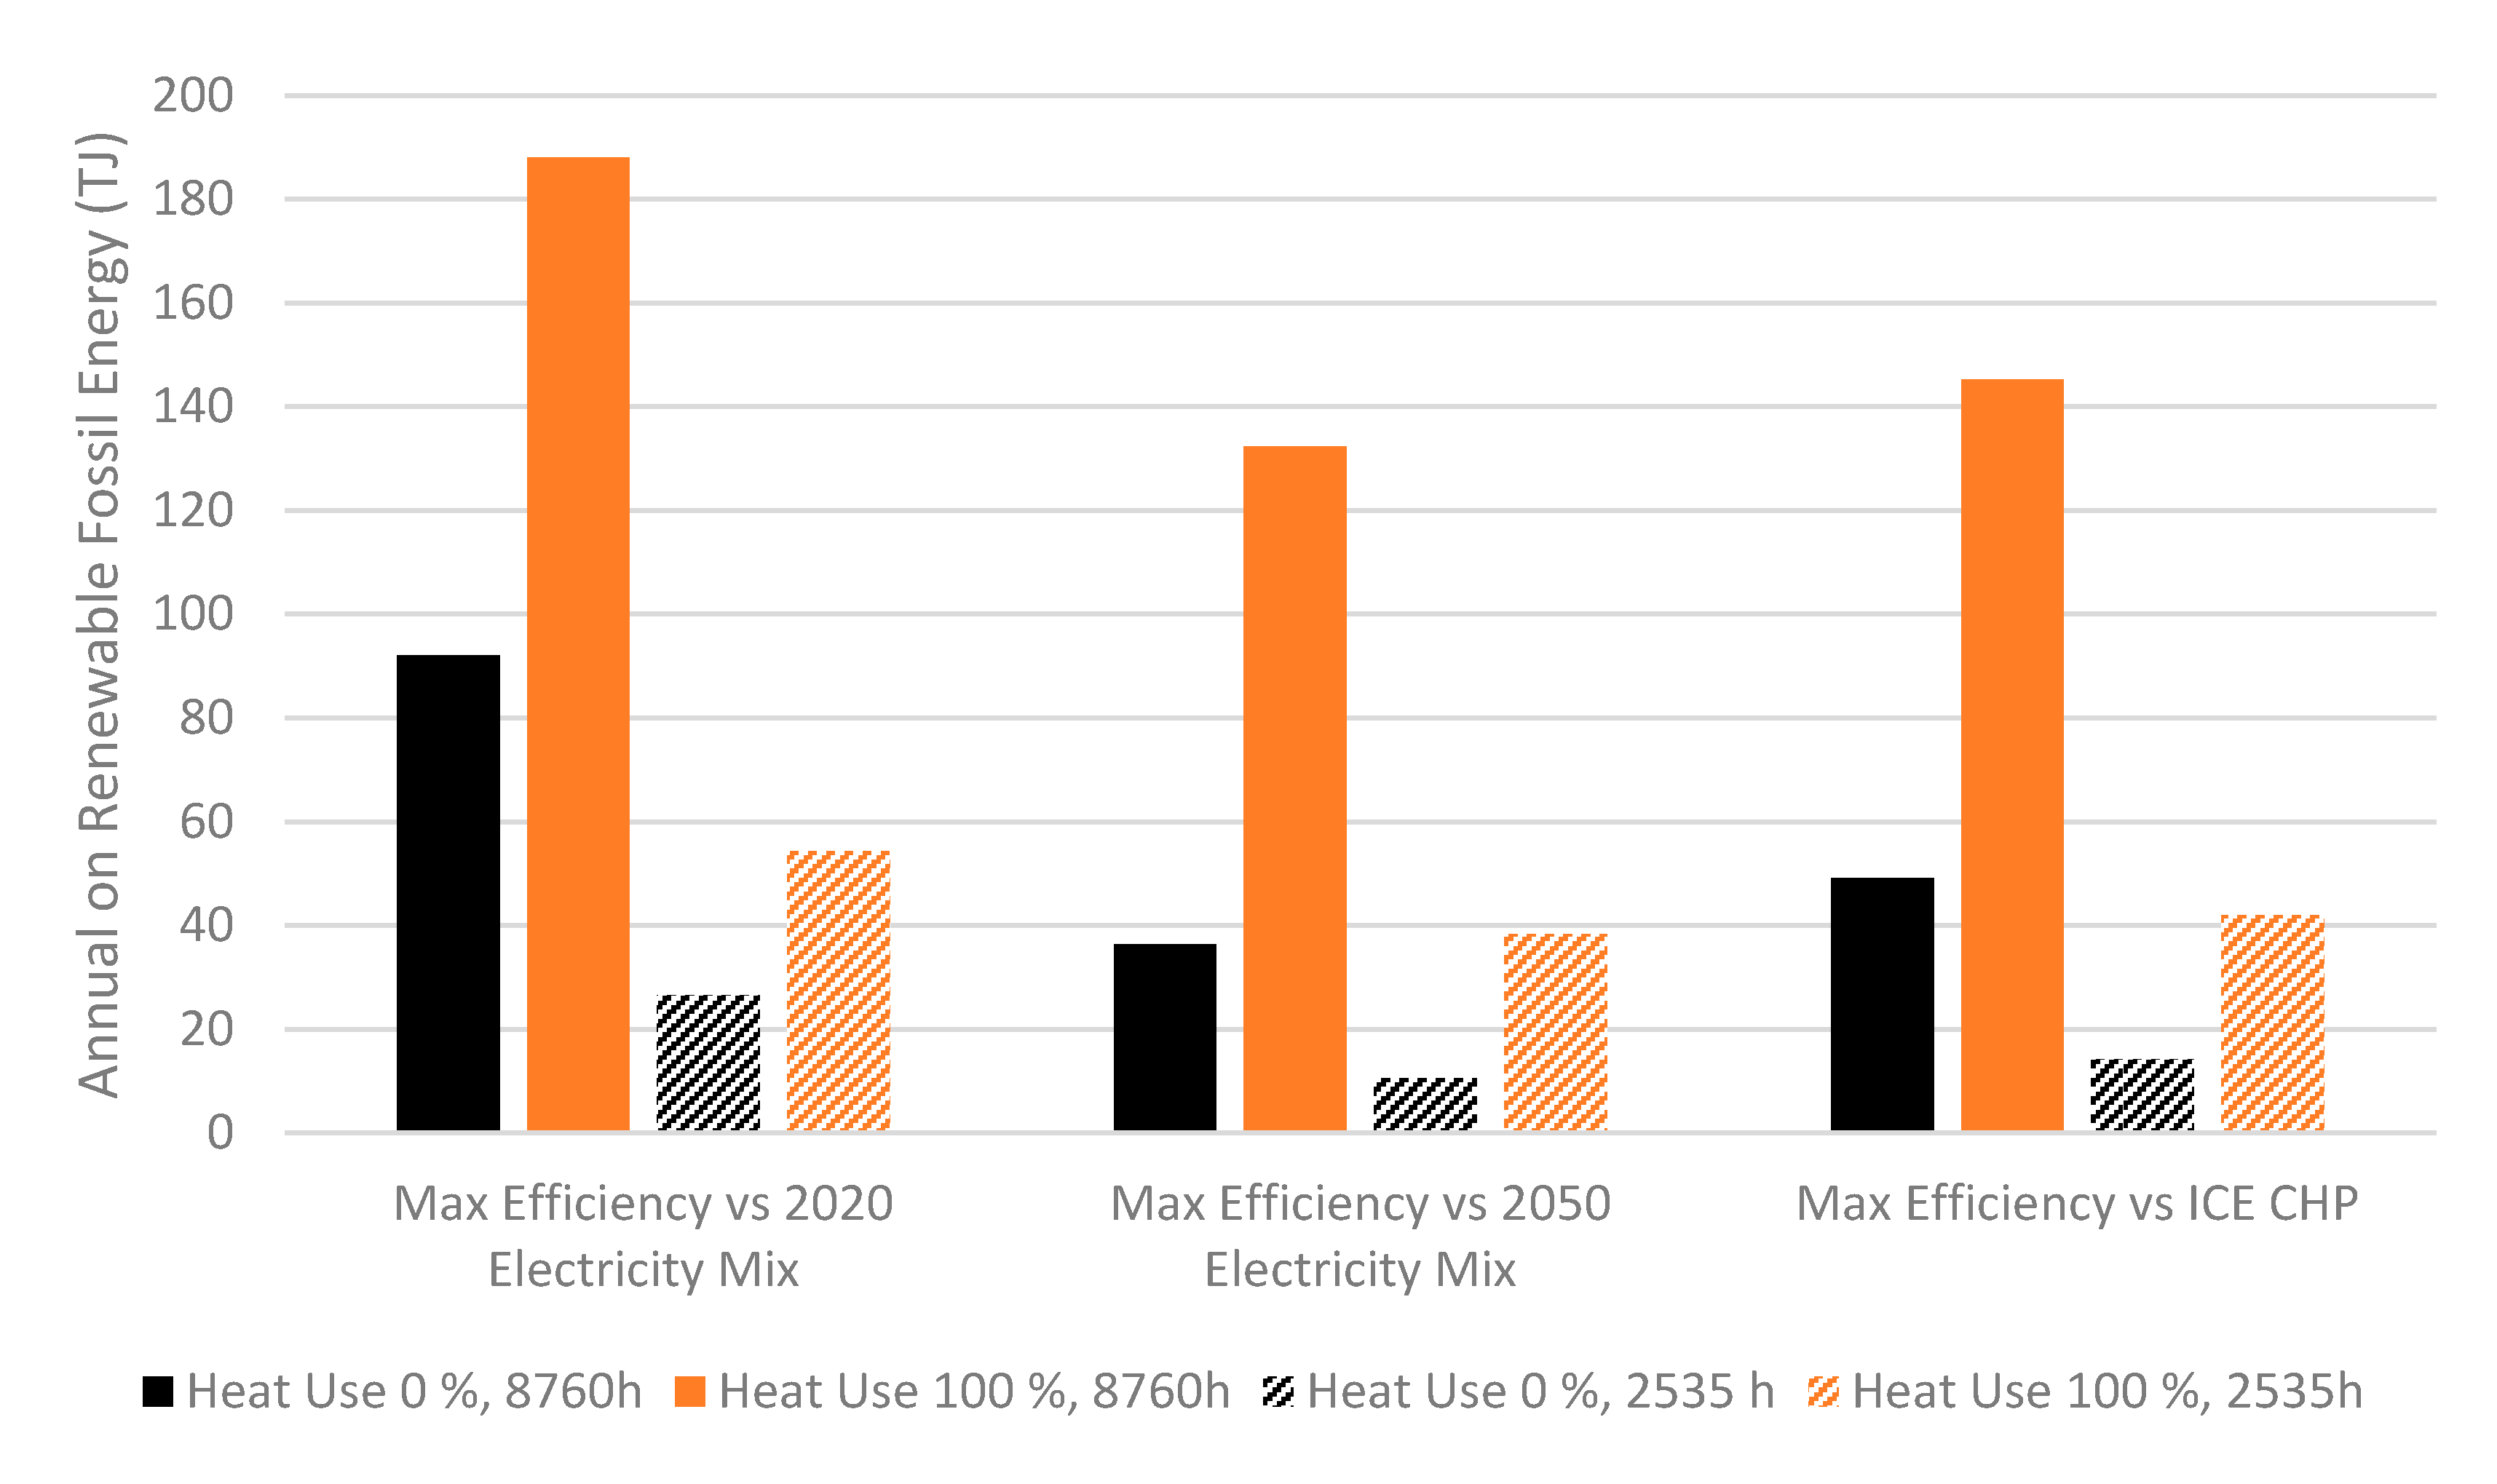
  • Cumulative Energy Demand of Non-Renewable Fossil Energy (units: MJ of fossil energy/kWh). It was assessed using the Cumulative Energy Demand V1.07 method [58]

3. Results and Discussion

3.1. Gasification Modeling Results

3.1.1. Model Validation

The results of the modeled biomass gasification process modeling via Aspen Plus were used as an input for the Life Cycle Assessment of the prospective CHP plant. The influence of various operating parameters such as gasification temperature, equivalence ratio and raw biomass moisture content to the gasification cold gas efficiency was examined. At first, the performance of the developed model was assessed by comparing computational results to available experimental data. Given that the cold gas efficiency of the gasification process is defined through the syngas LHV, the developed modeling approach (as presented in the previous section) was evaluated by comparing the predicted syngas LHV against measured values from Atnaw et al. (2018) and Damartzis et al. (2012) [17,53].
Table 12 presents a summary of the layout and experimental conditions of the aforementioned studies. Proximate and ultimate analyses of the considered feedstocks are shown in Table 13. Simulations have been performed at different equivalence ratios for each case: 0.35 for Atnaw et al. and 0.2 for Damartzis et al. The comparison between the experimental syngas LHV and computational results is depicted in Table 14. As can be seen, predicted LHVs are in good agreement with the respective experimental values. Discrepancies are in the range of 10–15%, which is reasonable when equilibrium models are used for gasification modeling [21,59]. Furthermore, a comparison between syngas component yields as provided by the aforementioned studies and those produced by the developed model at a temperature of 850 °C is shown in Figure 4 and Figure 5.
The accuracy of the simulation predictions was quantified using the root mean square deviation. According to this method, Root Sum Square (RSS) quantity is computed using the formula:
RSS = ⅀ ((yi,l − yi,p)/yi,l)2,
where yi,l is the literature value of the volume fraction of a specific syngas component and yi,p the predicted value of the proposed Aspen Plus model at the same conditions. Then, using the total number of data (N), the mean root sum square quantity is calculated via the equation:
MRSS = RSS/N.
The mean error is defined by the equation:
Mean Error = (MRSS)1/2.
The mean errors between the proposed Aspen Plus simulation layout and the literature results are shown in Table 15. A maximum error up to 30–35% was calculated for the CO as well as for the H2 yield. For the other syngas components, errors were in the range of 10–30%. Such relatively high errors are anticipated when equilibrium models are implemented [50,51]. Overall, it is shown that the developed model can reliably predict the lower heating value of the produced syngas and the cold gas efficiency of the process which would subsequently be used as input for the LCA approach.

3.1.2. Impact of Gasification Temperature and ER to the Cold Gas Efficiency

After the validation of the Aspen Plus model, a sensitivity analysis was carried out to investigate the effects of gasification temperature and equivalence ratio to the cold gas efficiency of the system. It involved the prediction of syngas component yields, the calculation of the lower heating value of the produced syngas and the estimation of the process cold gas efficiency for all examined feedstocks. Indicative results for the gasification of corn stover are presented in Figure 6 and Figure 7. Similar trends were observed for all other feedstocks. It should be noted that gasification temperature corresponds to the reduction zone temperature, since the composition and the lower heating value of the produced syngas are mainly affected by reactions occurring at this stage of the gasification process [60].
In Figure 6, it is shown that the gasification temperature has a major impact on the predicted cold gas efficiency under a specified equivalence ratio. Specifically, as temperature rises, the cold gas efficiency sharply increases (up to temperatures of approximately 750–800 °C) and then levels out at a maximum value, which differs according to the constant equivalence ratio (for example 68% in the case of ER = 0.2). This behavior can be explained by the nature of the reduction zone reactions. In particular, the equilibrium of the endothermic reactions R-6, R-7 and R-9 and the exothermic R-5 and R-8 moves towards the production of CO and H2. As a result, the produced syngas has a higher volume fraction of CO and H2 and consequently a higher LHV (due to Equation (3)) and a higher yield of combustibles. Thus, the gasification efficiency increases.
Figure 7 presents the effect of the equivalence ratio on the cold gas efficiency of the gasification of corn stover at a specific gasification temperature. As an overall trend, the cold gas efficiency decreases as equivalence ratio shifts towards higher values. This can be associated with the promotion of complete oxidation conditions, and thus the decrease of the CO and H2 yield in the produced syngas, as well as the increase of N2 yield. As a consequence, the lower heating value and the volume flow of syngas decreases, lowering the gasification cold gas efficiency. Furthermore, for a gasification temperature of 600 °C, the cold gas efficiency is nearly constant at a minimum value of 16%, because, due to the low system temperature, the equilibria of reactions R5–R9 result to low and nearly constant CO and H2 values. On the contrary, in case of a gasification temperature of 800 °C and 1000 °C, the respective equilibrium is significantly shifted towards high CO and H2 values. It should be noted that the cold gas efficiency has not been calculated for equivalence ratios lower than 0.2, since a further reduction of the system’s efficiency would be expected due to the promotion of complete pyrolysis conditions, which lower the overall heat transfer rate and thus decrease the volatile compounds that take part into gasification reactions [61,62].
In addition, according to Figure 6, the maximization of the cold gas efficiency of the gasification process occurs for an equivalence ratio value of 0.2. As a result, ER = 0.2 is considered the optimal gasification equivalence ratio for all feedstocks involved in this study. Figure 8 describes the effect of gasification temperature on the cold gas efficiency for the five feedstocks examined in this study, at ER = 0.2. As it is observed, efficiencies approximating or marginally surpassing 70% were predicted for the five feedstocks. Differences between predicted efficiencies of individual feedstocks are associated with the specific characteristics of their proximate and ultimate analyses.
The optimal operating points (i.e., those in which the cold gas efficiency is maximized) of the proposed gasification layout for each feedstock involved in this study are given in Table 16. The maximum cold gas efficiency for each feedstock was used as input for the LCA study, describing the optimal conditions, in which the gasifier provides the required thermal power for the needs of the proposed 1 MWel and 2.25 MWth CHP plant.
The calculated optimal cold gas efficiencies do not significantly deviate from the respective values reported for the Güssing CHP plant (ranging between 60 and 70%, according to [37]. Given that the Güssing power plant utilizes a steam blown fluidized bed gasifier instead of the fixed bed gasifier considered in this work, this relative agreement of cold gas efficiency values enabled us to adopt the Güssing CHP plant data as input in the LCA calculations without anticipating notable discrepancies.

3.1.3. Impact of Initial Biomass Moisture Content on Cold Gas Efficiency

The effect of the initial moisture content of each feedstock on the cold gas efficiency was investigated using the developed Aspen Plus model and was used as input for the LCA study. Simulations were performed at an equivalence ratio of 0.2 and for raw biomass moisture content ranging from 0 to 30%. The drying process was assumed to be complete, so the final biomass moisture content was 0%. Figure 9 shows the relationship between cold gas efficiency and initial moisture content for each feedstock examined in this study. As initial moisture content rises, more heat is required for the drying process, which lowers the gasification temperature and affects the reduction zone reactions, resulting in lower CO and H2 yields. Consequently, the syngas LHV decreases and the cold gas efficiency shows a relative decrease of approximately 35% for all feedstocks examined.
A crucial factor for the LCA study was the investigation of whether the gasification process was energetically self-sufficient. As described before, the drying process consumes a lot of thermal energy, which not only lowers the gasification efficiency but may require extra heat by, e.g., fossil fuel combustion. It should be made clear whether additional heat is required or not, in order to adapt the LCA model. Towards clarifying this issue, it was initially assumed that biomass drying is done by a heat exchanger which used the rejected heat from the syngas cooler. As stated by Rentizelas et al. (2008), corn stover has the maximum initial moisture content, which is 50%. Using the Aspen Plus simulation modules, the heat required for biomass drying and the heat released from syngas cooling were calculated per kg of biomass feed for an initial biomass moisture content of up to 50%. The results of this investigation are presented in Figure 10. It is clear not only that the heat derived from syngas cooling is sufficient for biomass drying, even in the unfavorable scenario examined, but also that extra heat can be used for other purposes, for example in the boiler which produces thermal power in the CHP plant.

3.2. Life Cycle Assessment Results

3.2.1. CHP Plant Environmental Hotspots and Comparison with the Greek Natural Gas Supply Chain

One of the scopes of this work is to highlight the operational parameters of the CHP biomass gasification plant which has the major share in the examined impact categories. In this analysis, only feedstocks that are transported to the plant were examined, since transportation enlarges the environmental burdens of the total process. Moreover, by assuming the same transport distance for all feedstocks involved in this study, the environmental hotspot results were expected to follow the same trend for all biomass types. So, results for only one random feedstock (almond prunings) are presented in this section. Figure 11 and Figure 12 show the impact assessment results for the system environmental hotspot as well as the comparison of the syngas and natural gas supply chains. It should be noted that both impact categories were assessed per MJ of gas energy because syngas and natural gas lower heating values are significantly different.
In terms of the Global Warming Potential and Cumulative Energy Demand of Non-Renewable Fossil Energy impact categories, the parasitic load of the plant was determined to be the system environmental hotspot, contributing to approximately 90% of the total environmental burdens of the plant in all moisture content and electricity mixture scenarios examined. This is explained by the fact that the CHP plant uses electricity directly from the grid. More specifically, in the current Greek electricity mixture as well as the projection for 2050 under current policies, energy production from fossil fuels is included, which enlarges the environmental burdens of the plant. However, the total environmental burdens decrease about 50% when 2050 electricity mixture is supplied, due to the higher share of renewables in the mix.
Furthermore, the comparison of the aforementioned impact categories for the production of 1 MJ of energy via syngas and natural gas burn quantifies the environmental benefits of the use of syngas instead of natural gas. In detail, syngas exploitation, instead of natural gas consumption, contributed to a large reduction in both impact categories assessed, even if the plant operated at adversary conditions (30% initial biomass moisture content). GHG emissions and fossil fuel use become even lower when the 2050 current policy electricity mixture is concerned. These results are explained by the fact that the Greek natural gas supply is responsible for considerable emissions during extraction and pipeline transportation, which enlarge the corresponding environmental burdens.

3.2.2. CHP Plant Comparison with Conventional Reference Cases

In order to highlight the environmental benefits of the CHP biomass gasification plant simulated in this work, its environmental footprint should be compared with conventional energy production alternatives. The analysis involved the plant operation at optimal (max efficiency) and most unfavorable (30% initial feedstock moisture content) condition, as well as operation under the 2020 and the 2050 electricity generation mixtures. Figure 13 and Figure 14 summarize the Life Cycle Assessment results for the production of 1 kWh of electricity by the CHP biomass gasification plant and the reference cases examined. It should be noted that the negative columns represent the co-generated heat of the CHP plants, which, based on the ISO 14040 standard, was included in the study as an avoided product (i.e., the corresponding operation of a typical industrial gas boiler is avoided). Plant emissions and fossil energy demand were calculated as the sum of the positive and the negative columns and are given upon the bars. Negative sum values of the indicators considered in this study mean that the operation of the plant leads to GHG mitigation and fossil energy savings.
The LCA results presented in Figure 13 and Figure 14 show that the operation of the CHP biomass gasification plant, under all conditions examined, leads to GHG mitigation (approximately 0.6 kg CO2eq per kWhel) and non-renewable energy savings (approximately 10 MJ per kWhel). This finding is justified by the assumption of a) assigning zero burden to the biomass growth stage (agricultural waste) and b) zero contribution to climate change from biogenic CO2 emissions. A quite significant outcome of the LCA study was that the CHP biomass plant operation, under all operating conditions, can lead to CO2 mitigation and fossil energy savings which are nearly equal to the emissions and the fossil fuel use for production of the same amount of electricity from the 2020 Greek energy scheme. Furthermore, the considered power plant can be environmentally beneficial, even when compared to the kWh generated by the envisaged 2050 Greek electricity mixture, which includes a larger share of renewables. Finally, the biomass gasification plant had clearly less impact on climate change than the natural gas internal combustion engine on CHP mode, due to the emissions and the energy use associated with natural gas supply and use.
The results presented in Figure 13 and Figure 14 show a vast environmental advantage of the kWh generated from syngas, but there are two critical parameters whose influence must be evaluated: (a) the percentage of biomass CHP heat utilization and (b) the annual variation of biomass availability. Regarding the first parameter, the results calculated so far assume that all the co-generated heat will be used (replacing the heat from fossil fuel combustion), but this assumption can be considered as over-optimistic. Therefore, a “zero-credit from CHP heat utilization” case was be examined (0% heat use), in order to facilitate a realistic situation where a partial utilization takes place. Feedstock availability can fluctuate considerably, according to climatic or market influences. The variable biomass input has a straightforward effect on the annual working hours of the CHP biomass gasification plant. Using the feedstock availability figures, which were presented on Table 4, multi and single feedstock operations were < considered. In the multi feedstock operation, biomass quantities were sufficient for full year operation (8760 h) and 8.76 GWhel were annually produced. In the single feedstock operation, the power plant was able to use only in-house cotton stalk as fuel. Thus, the annual working hours were drastically reduced to 2535, which corresponded to 2.535 GWh of electricity per year.
The results showing the influence of the aforementioned parameters are presented in Figure 15 and Figure 16, where the CHP biomass gasification plant is compared to conventional energy production alternatives in terms of GHG mitigation and fossil energy savings per year. The annual emissions and energy use of operation of the CHP biomass gasification plant are compared with those from the production of electricity from the 2020 and the 2050 Greek electricity mixture, as well as from the natural gas internal combustion engine at CHP mode.
On the bright side, all parametric cases resulted in a better biomass CHP performance, both in terms of emissions and non-renewable energy demand. However, the advantage of biomass CHP was drastically reduced. If the negative effect of both parameters is considered, the annual CO2 mitigation (Figure 15) and non-renewable energy savings (Figure 16) were reduced by a factor of 6 to 9, depending on the comparison. The biomass CHP advantages were reduced by a factor of 2 to 4 if only the zero heat utilization credit case is calculated. The corresponding reducing factor of low biomass availability lay between 3 and 4. Therefore, maximizing both the CHP heat utilization and the plant annual operation should be targeted.

4. Conclusions

This study aims at assessing the energetic and environmental performance of a prospective cogeneration biomass gasification plant situated in Thessaly, Greece, via a combined process simulation and the Life Cycle Assessment method. Initially, the basic operational parameters of the prospective 1 MWel CHP biomass gasification plant were obtained from the literature. The most common agricultural residues in Thessaly, Greece, were identified, and the contribution of each biomass type to the total annual feedstock demand was determined.
The developed equilibrium process model quantified the effect of gasification temperature, equivalence ratio and raw biomass moisture content on the gasification of the examined feedstock types. The modeling approach was validated by comparing the predicted syngas LHV and syngas species yields against measured values from the literature, with maximum deviations in the predicted LHV in the range of 10–15%. Simulations of the biomass gasification process revealed a maximum gasification efficiency of approximately 70% for all examined feedstock types at ER = 0.2, while lower efficiency values were observed when the raw biomass moisture content increased.
After upscaling the gasification model to a 1 MWel and 2.25 MWth CHP plant, a “Cradle to Gate” Life Cycle Assessment was conducted and examined the Global Warming Potential and the Cumulative Demand of Non-Renewable Fossil Energy of the prospective plant. Provided that zero burden is to be assigned to the biomass growth stage (being agricultural waste) and that zero contribution is to be considered for climate change from biogenic CO2 emissions, results identify the plant electricity consumption as the main plant environmental hotspot. The results suggest that plant operation in all examined conditions leads to GHG mitigation and non-renewable energy savings of approximately 0.6 kg CO2eq/kWhel and 10 MJ/kWhel, respectively. Nevertheless, the advantage of biomass CHP is considerably affected by the negative effects of the percentage of biomass CHP heat utilization and the annual variation of biomass availability. Within a context of zero CHP heat utilization and minimum feedstock availability, the annual CO2 mitigation and non-renewable energy savings are reduced by a factor of 6 to 9, depending on the comparison.

Author Contributions

Conceptualization, D.K., D.G. and M.F.; methodology, I.V., D.K and D.G.; software, I.V.; validation, D.K. and D.G.; formal analysis, I.V.; investigation, all authors; resources, M.F.; writing—original draft preparation, I.V.; writing—review and editing, D.K., D.G. and M.F.; visualization, I.V.; supervision, M.F.; project administration, D.K., D.G. and M.F.; funding acquisition, M.F. All authors have read and agreed to the published version of the manuscript.

Funding

This research has been co-financed by the European Union and Greek national funds through the Operational Program Competitiveness, Entrepreneurship and Innovation, under the call RESEARCH–CREATE–INNOVATE (project code: T1EDK-05563, project title: Three stage gasifier for power production from biomass).

Conflicts of Interest

The authors declare no conflict of interest.

References

  1. European Union. Directive (EU) 2018/2001 of the European Parliament and of the Council on the promotion of the use of energy from renewable sources. Off. J. Eur. Union 2018, 2018, 1–128. Available online: https://eur-lex.europa.eu/eli/dir/2018/2001/oj (accessed on 31 July 2020).
  2. European Commission. A Clean Planet for all—A European Strategic Long-Term Vision for a Prosperous Modern, Competitive and Climate Neutral Economy COM/2018/773 Final. Available online: https://eur-lex.europa.eu/legal-content/EN/TXT/?uri=CELEX:52018DC0773 (accessed on 18 September 2020).
  3. Fuel Cells and Hydrogen Joint Undertaking (FCH). Hydrogen Roadmap Europe: A Sustainable Pathway for the European Energy Transition; FCH: Brussels, Belgium, 2019. [Google Scholar]
  4. PricewaterhouseCoopers et al. Sustainable and Optimal Use of Biomass for Energy in the EU beyond 2020. VITO, Utrecht University, TU Vienna, INFRO, Rütter Soceco & PwC. 2017. Available online: https://ec.europa.eu/energy/sites/ener/files/documents/biosustain_annexes_final.pdf%0Ahttps://ec.europa.eu/energy/en/studies/sustainable-and-optimal-use-biomass-energy-eu-beyond-2020 (accessed on 31 July 2020).
  5. van Eijk, R.J. Options for Increased Utilization of Ash from Biomass Combustion and Co-Firing. IEA Bioenergy Task 32 (Biomass Combustion) Deliverable D4. 2012, pp. 1–40. Available online: http://task32.ieabioenergy.com/wp-content/uploads/2017/03/Ash_Utilization_KEMA.pdf (accessed on 31 July 2020).
  6. Livingston, W.R. Biomass Ash Characteristics and Behaviour in Combustion, Gasification and Pyrolysis Systems. Doosan Babcock Energy. 2007, p. 69. Available online: https://antioligarch.files.wordpress.com/2014/12/biomass-fly-ash-characteristics-behaviour-in-combustion.pdf (accessed on 31 July 2020).
  7. van Alkemade, M.M.C.; Loo, S.; Sulilatu, W.F. Exploratory investigation into the possibilities of processing ash produced in the combustion of reject wood. Netherl. Organ. Appl. Sci. Res. Apeldoorn 1999, 1–45. Available online: http://task32.ieabioenergy.com/wp-content/uploads/2017/03/R99357.pdf (accessed on 31 July 2020).
  8. Baruah, D.; Baruah, D.C. Modeling of biomass gasification: A review. Renew. Sustain. Energy Rev. 2014, 39, 806–815. [Google Scholar] [CrossRef]
  9. Gambarotta, A.; Morini, M.; Zubani, A. A non-stoichiometric equilibrium model for the simulation of the biomass gasification process. Appl. Energy 2018, 227, 119–127. [Google Scholar] [CrossRef]
  10. Basu, P. Biomass Gasification and Pyrolysis Practical Design; Academic Press: London, UK, 2010. [Google Scholar]
  11. Breault, R.W. Gasification processes old and new: A basic review of the major technologies. Energies 2010, 3, 216–240. [Google Scholar] [CrossRef] [Green Version]
  12. Kaupp, A.; Goss, J.R. State of The Art Report for Small Scale (To 50 Kw) Gas Producer-Engine Systems; PB-85-102002/XAD; Department of Agricultural Engineering, California University: Davis, CA, USA, 1981. [Google Scholar]
  13. Martínez, L.V.; Rubiano, J.E.; Figueredo, M.; Gómez, M.F. Experimental study on the performance of gasification of corncobs in a downdraft fixed bed gasifier at various conditions. Renew. Energy 2020, 148, 1216–1226. [Google Scholar] [CrossRef]
  14. Hai, I.U.; Sher, F.; Yaqoob, A.; Liu, H. Assessment of biomass energy potential for SRC willow woodchips in a pilot scale bubbling fluidized bed gasifier. Fuel 2019, 258, 116143. [Google Scholar] [CrossRef]
  15. Yan, W.C.; Shen, Y.; You, S.; Sim, S.H.; Luo, Z.H.; Tong, Y.W.; Wang, C.-H. Model-based downdraft biomass gasifier operation and design for synthetic gas production. J. Clean. Prod. 2018, 178, 476–493. [Google Scholar] [CrossRef] [Green Version]
  16. González, W.A.; Pérez, J.F.; Chapela, S.; Porteiro, J. Numerical analysis of wood biomass packing factor in a fixed-bed gasification process. Renew. Energy 2018, 121, 579–589. [Google Scholar] [CrossRef]
  17. Damartzis, T.; Michailos, S.; Zabaniotou, A. Energetic assessment of a combined heat and power integrated biomass gasification-internal combustion engine system by using Aspen Plus®. Fuel Process. Technol. 2012, 95, 37–44. [Google Scholar] [CrossRef]
  18. Lan, W.; Chen, G.; Zhu, X.; Wang, X.; Liu, C.; Xu, B. Biomass gasification-gas turbine combustion for power generation system model based on ASPEN PLUS. Sci. Total Environ. 2018, 628–629, 1278–1286. [Google Scholar] [CrossRef] [PubMed]
  19. Han, J.; Liang, Y.; Hu, J.; Qin, L.; Street, J.; Lu, Y.; Yu, F. Modeling downdraft biomass gasification process by restricting chemical reaction equilibrium with Aspen Plus. Energy Convers. Manag. 2017, 153, 641–648. [Google Scholar] [CrossRef]
  20. Wei, L.; Thomasson, J.A.; Bricka, R.M.; Sui, R.; Wooten, J.R.; Columbus, E.P. Syn-Gas Quality Evaluation for Biomass Gasification with a Downdraft Gasifier. Trans. ASABE 2009, 52, 21–37. [Google Scholar] [CrossRef]
  21. Marcantonio, V.; Bocci, E.; Monarca, D. Development of a chemical quasi-equilibrium model of biomass waste gasification in a fluidized-bed reactor by using Aspen plus. Energies 2019, 13, 53. [Google Scholar] [CrossRef] [Green Version]
  22. Navas-Anguita, Z.; Cruz, P.L.; Martín-Gamboa, M.; Iribarren, D.; Dufour, J. Simulation and life cycle assessment of synthetic fuels produced via biogas dry reforming and Fischer-Tropsch synthesis. Fuel 2019, 235, 1492–1500. [Google Scholar] [CrossRef]
  23. The International Standards Organisation (ISO). ISO 14040:2006 Environmental Management—Life Cycle Assessment—Principles and Framework, 2nd ed.; ISO: Geneva, Switzerland, 2006. [Google Scholar]
  24. The International Standards Organisation (ISO). International Standard Assessment—Requirements and guilelines. Int. J. Life Cycle Assess 2006, 652–668. [Google Scholar] [CrossRef]
  25. Adams, P.W.R.; McManus, M.C. Small-scale biomass gasification CHP utilisation in industry: Energy and environmental evaluation. Sustain. Energy Technol. Assess. 2014, 6, 129–140. [Google Scholar] [CrossRef] [Green Version]
  26. Kimminga, M.; Sundberga, C.; Nordberg, Å.; Baky, A.; Bernessona, S.; Norénb, O.; Hanssona, P.-A. Biomass from agriculture in small-scale combined heat and power plants—A comparative life cycle assessment. Biomass Bioenergy 2011, 35, 1572–1581. [Google Scholar] [CrossRef]
  27. Yang, Q.; Zhou, H.; Zhang, X.; Nielsen, C.P.; Lia, J.; Lu, X.; Yanga, H.; Chen, H. Hybrid life-cycle assessment for energy consumption and greenhouse gas emissions of a typical biomass gasification power plant in China. J. Clean. Prod. 2018, 205, 661–671. [Google Scholar] [CrossRef]
  28. Tagliaferri, C.; Evangelisti, S.; Clift, R.; Lettieri, P. Life cycle assessment of a biomass CHP plant in UK: The Heathrow energy centre case. Chem. Eng. Res. Des. 2018, 133, 210–221. [Google Scholar] [CrossRef]
  29. Nguyen, T.L.T.; Hermansen, J.E. Life cycle environmental performance of miscanthus gasification versus other technologies for electricity production. Sustain. Energy Technol. Assess. 2015, 9, 81–94. [Google Scholar] [CrossRef]
  30. Guerra, J.P.; Cardoso, F.H.; Nogueira, A.; Kulay, L. Thermodynamic and environmental analysis of scaling up cogeneration units driven by sugarcane biomass to enhance power exports. Energies 2018, 11, 73. [Google Scholar] [CrossRef] [Green Version]
  31. García, C.A.; Morales, M.; Quintero, J.; Aroca, G.; Cardona, C.A. Environmental assessment of hydrogen production based on Pinus patula plantations in Colombia. Energy 2017, 139, 606–616. [Google Scholar] [CrossRef]
  32. Suwatthikul, A.; Limprachaya, S.; Kittisupakorn, P.; Mujtaba, I.M. Simulation of steam gasification in a fluidized bed reactor with energy self-sufficient condition. Energies 2017, 10, 314. [Google Scholar] [CrossRef]
  33. Hamedani, S.R.; Villarini, M.; Colantoni, A.; Moretti, M.; Bocci, E. Life cycle performance of hydrogen production via agro-industrial residue gasification-a small scale power plant study. Energies 2018, 11, 675. [Google Scholar] [CrossRef] [Green Version]
  34. Hamedani, S.R.; del Zotto, L.; Bocci, E.; Colantoni, A.; Villarini, M. Eco-efficiency assessment of bioelectricity production from Iranian vineyard biomass gasification. Biomass Bioenergy 2019, 127, 105271. [Google Scholar] [CrossRef]
  35. Bisht, A.S.; Thakur, N.S. Small scale biomass gasification plants for electricity generation in India: Resources, installation, technical aspects, sustainability criteria & policy. Renew. Energy Focus 2019, 28, 112–126. [Google Scholar] [CrossRef]
  36. Cambero, C.; Sowlati, T. Assessment and optimization of forest biomass supply chains from economic, social and environmental perspectives—A review of literature. Renew. Sustain. Energy Rev. 2014, 36, 62–73. [Google Scholar] [CrossRef]
  37. Rauch, R.; Hofbauer, H.; Bosch, K.; Siefert, I.; Aichernig, C.; Tremmel, H.; Voigtlaender, K.; Koch, R.; Lehner, R. Steam Gasification of Biomass at CHP Plant Guessing–Status of the Demonstration Plant. In Proceedings of the 2nd World Conference on Biomass for Energy, Industry and Climate Protection, Rome, Italy, 10–14 May 2004; pp. 1687–1690. [Google Scholar]
  38. Rentizelas, A.A.; Tatsiopoulos, I.P.; Tolis, A. An optimization model for multi-biomass tri-generation energy supply. Biomass Bioenergy 2009, 33, 223–233. [Google Scholar] [CrossRef] [Green Version]
  39. Voivontas, D.; Assimacopoulos, D.; Koukios, E.G. Assessment of Biomass Potential for Power Production: A GIS Based Method. Biomass and Bioenergy 2001, 20, 101–112. [Google Scholar] [CrossRef]
  40. Papadopoulos, D.P.; Katsigiannis, P.A. Biomass energy surveying and techno-economic assessment of suitable CHP system installations. Biomass Bioenergy 2002, 22, 105–124. [Google Scholar] [CrossRef]
  41. Phyllis2—Database for the Physico-Chemical Composition of (Treated) Lignocellulosic Biomass, Micro- and Macroalgae, Various Feedstocks for Biogas Production and Biochar. Available online: https://phyllis.nl/ (accessed on 8 December 2019).
  42. Pütün, A.E.; Özbay, N.; Önal, E.P.; Pütün, E. Fixed-bed pyrolysis of cotton stalk for liquid and solid products. Fuel Process Technol. 2005, 86, 1207–1219. [Google Scholar] [CrossRef]
  43. Klimantos, P.; Koukouzas, N.; Katsiadakis, A.; Kakaras, E. Air-blown biomass gasification combined cycles (BGCC): System analysis and economic assessment. Energy 2009, 34, 708–714. [Google Scholar] [CrossRef]
  44. Di Blasi, C.; Branca, C. Modeling a stratified downdraft wood gasifier with primary and secondary air entry. Fuel 2013, 104, 847–860. [Google Scholar] [CrossRef]
  45. Bhattacharya, S.C.; Hla, S.S.; Pham, H. A study on a multi-stage hybrid gasiÿer-engine system. Biomass Bioenergy 2001, 21, 445–460. [Google Scholar] [CrossRef]
  46. Tavares, R.; Monteiro, E.; Tabet, F.; Rouboa, A. Numerical investigation of optimum operating conditions for syngas and hydrogen production from biomass gasification using Aspen Plus. Renew. Energy 2020, 146, 1309–1314. [Google Scholar] [CrossRef]
  47. Olgun, H.; Ozdogan, S.; Yinesor, G. Results with a bench scale downdraft biomass gasifier for agricultural and forestry residues. Biomass Bioenergy 2011, 35, 572–580. [Google Scholar] [CrossRef]
  48. Kakaras, E.; Karellas, S. Pollution Abatement Technology for Thermal Plants. Tsotras 2013. Available online: https://www.researchgate.net/publication/321914527_Pollution_Abatement_Technology_for_thermal_plants (accessed on 31 July 2020). (In Greek).
  49. Lv, P.M.; Xiong, Z.H.; Chang, J.; Wu, C.Z.; Chen, Y.; Zhu, J.X. An experimental study on biomass air-steam gasification in a fluidized bed. Bioresour. Technol. 2004, 95, 95–101. [Google Scholar] [CrossRef]
  50. Formica, M.; Frigo, S.; Gabbrielli, R. Development of a new steady state zero-dimensional simulation model for woody biomass gasification in a full scale plant. Energy Convers. Manag. 2016, 120, 358–369. [Google Scholar] [CrossRef]
  51. Gagliano, A.; Nocera, F.; Bruno, M.; Cardillo, G. Development of an Equilibrium-based Model of Gasification of Biomass by Aspen Plus. Energy Procedia 2017, 111, 1010–1019. [Google Scholar] [CrossRef]
  52. Fernandez-Lopez, M.; Pedroche, J.; Valverde, J.L.; Sanchez-Silva, L. Simulation of the gasification of animal wastes in a dual gasifier using Aspen Plus®. Energy Convers. Manag. 2017, 140, 211–217. [Google Scholar] [CrossRef]
  53. Atnaw, S.M.; Sulaiman, S.A.; Singh, L.; Wahid, Z.A.; Yahya, C.K.M.F.B.C.K. Modeling and parametric study for maximizing heating value of gasification syngas. BioResources 2017, 12, 2548–2564. [Google Scholar] [CrossRef]
  54. Asadullah, M. Barriers of commercial power generation using biomass gasification gas: A review. Renew. Sustain. Energy Rev. 2014, 29, 201–215. [Google Scholar] [CrossRef]
  55. Baumann, H.; Tillman, A.-M. The Hitch Hiker’s Guide to LCA; Studentlitteratur AB: Lund, Sweden, 2004. [Google Scholar]
  56. Ecoinvent-Version-2 @ www.ecoinvent.org. Available online: https://www.ecoinvent.org/database/older-versions/ecoinvent-version-2/ecoinvent-version-2.html (accessed on 31 July 2020).
  57. Lindzen, R.S. Climate change, the IPCC Scientific Assessment. Edited by J. T. Houghton, G. J. Jenkins and J. J. Ephraums. Cambridge University Press. Pp. 365 + pp. 34 summary. Hardback £40.00, paperback £15.00. Q. J. R. Meteorol. Soc. 1991, 117, 651–652. [Google Scholar] [CrossRef]
  58. Althaus, H.; Bauer, C.; Doka, G.; Dones, R.; Frischknecht, R.; Hellweg, S.; Humbert, S.; Jungbluth, N.; Köllner, T.; Loerincik, Y.; et al. Implementation of Life Cycle Impact Assessment Methods Data v2.2 (2010); Hischier, R., Weidema, B., Eds.; Swiss Centre for Life Cycle Inventories: Dübendorf, Switzerland, 2010; Ecoinvent Report No. 3; Available online: https://www.ecoinvent.org/files/201007_hischier_weidema_implementation_of_lcia_methods.pdf (accessed on 31 July 2020).
  59. Villarini, M.; Marcantonio, V.; Colantoni, A.; Bocci, E. Sensitivity analysis of different parameters on the performance of a CHP internal combustion engine system fed by a biomass waste gasifier. Energies 2019, 12, 688. [Google Scholar] [CrossRef] [Green Version]
  60. Susastriawan, A.A.P.; Saptoadi, H. Purnomo Small-scale downdraft gasifiers for biomass gasification: A review. Renew. Sustain. Energy Rev. 2017, 76, 989–1003. [Google Scholar] [CrossRef]
  61. Li, X.T.; Grace, J.R.; Lim, C.J.; Watkinson, A.P.; Chen, H.P.; Kim, J.R. Biomass gasification in a circulating fluidized bed. Biomass Bioenergy 2004, 26, 171–193. [Google Scholar] [CrossRef]
  62. Reed, T.B.; Walt, R.; Ellis, S.; Das, A.; Deutch, S. Superficial Velocity—The Key to Downdraft Gasification. In Proceedings of the 4th Biomass Conference of the Americas, Oakland, CA, USA, 29 August–2 September 1999. [Google Scholar]
Figure 1. Biomass gasification simulation flowchart (solid lines: mass flows, dashed lines: energy flows).
Eng 01 00002 g001
Figure 2. LCA approach: system boundaries.
Eng 01 00002 g002
Figure 3. (a) Current Electricity mixture of mainland Greece [Source: DAS Monthly Reports, http://www.lagie.gr/en/market/market-analysis/das-monthly-reports/]; (b) Projection for the 2050 Electricity mixture of mainland Greece, under the current policy scenario [Source: http://www.lagie.gr].
Eng 01 00002 g003
Figure 4. Syngas component yields predicted by this work’s model (black line) versus the experimental work of Atnaw et al. (blue line).
Eng 01 00002 g004
Figure 5. Syngas component yields predicted by this work’s model (black line) versus the experimental work of Damartzis et al. (yellow line).
Eng 01 00002 g005
Figure 6. Effect of gasification temperature on the cold gas efficiency for the gasification of corn stover under the specified equivalence ratio (black line: ER = 0.2, red line: ER = 0.3, blue line: ER = 0.4).
Eng 01 00002 g006
Figure 7. Effect of equivalence ratio to the cold gas efficiency for the gasification of corn stover under the specified gasification temperature values (black line: Tgasif = 600 °C, red line: Tgasif = 800 °C, blue line: Tgasif = 1000 °C).
Eng 01 00002 g007
Figure 8. Effect of gasification temperature on the cold gas efficiency of the gasification process for every feedstock examined for ER = 0.2 (black line: cotton stalk, red line: almond prunings, blue line: olive branches, green line: corn stover, purple line: wheat straw).
Eng 01 00002 g008
Figure 9. Effect of Moisture Content of the biomass types examined on the Cold Gas Efficiency of the gasification process (black line: cotton stalk, red line: almond prunings, blue line: olive branches, green line: corn stover, purple line: wheat straw).
Eng 01 00002 g009
Figure 10. Heat required for biomass drying and heat rejected by the syngas cooling per kg of biomass feed in the case of corn stover.
Eng 01 00002 g010
Figure 11. CHP plant environmental hotspot analysis and comparison of syngas and natural gas supply chain regarding the Global Warming Potential impact category (units: kgCO2 eq/MJ of gas).
Eng 01 00002 g011
Figure 12. CHP plant environmental hotspot analysis and comparison of syngas and natural gas supply chain regarding the Cumulative Energy Demand of Non-Renewable Fossil Energy impact category (units: MJ of fossil energy/MJ of gas).
Eng 01 00002 g012
Figure 13. Global Warming Potential impact category results for the simulated CHP biomass gasification plant at different operating conditions, and the conventional energy production alternatives (electricity from the 2020 and 2050 grid, natural gas internal combustion engine on CHP mode). Units: kg CO2eq/ kWhel.
Eng 01 00002 g013
Figure 14. Cumulative demand of non-renewable fossil energy impact category results for the simulated CHP biomass gasification plant at different operating conditions, and the conventional energy production alternatives (electricity from the 2020 and 2050 grid, natural gas internal combustion engine on CHP mode). Units: MJ/ kWhel.
Eng 01 00002 g014
Figure 15. Annual GHG mitigation from the CHP biomass gasification plant considered in this study when compared with electricity production from the Greek 2020 and 2050 mix and with a natural gas internal combustion engine on CHP mode (Units: Annual Mtons of CO2eq).
Eng 01 00002 g015
Figure 16. Annual fossil energy savings from the CHP biomass gasification plant considered in this study when compared with electricity production from the Greek 2020 and 2050 mix and with a natural gas internal combustion engine on CHP mode (Units: TJ of fossil energy).
Eng 01 00002 g016
Table 1. Operational parameters assumed in the prospective Thessaly plant [37].
Operational ParameterValue
Electrical Power (MWel)1
Power-to-heat ratio2.25
Electrical Efficiency (%)25
Thermal Efficiency (%)56.3
Total Efficiency (%)81.3
Table 2. Characteristics of the most common agricultural residues in Thessaly, Greece [38,39,40].
CharacteristicWheat StrawCorn StoverCotton StalkOlive BranchesAlmond Prunings
Residue yield (t/ha)2.977.175.472.826.21
Residue availability factor (%)1530709090
Exploitable residue (t/ha)0.452.153.832.545.59
Moisture (%)2050303540
Residue density (kg/m3)140200200250300
Availability July–Aug.Nov.–Dec.Oct.–Nov.Nov.–Feb.Dec.–Feb.
Table 3. Individual contribution of common Thessaly feedstocks to the total annual volume of supplied biomass.
Biomass TypeExploitable Residue Mass Yield (kg/ha)Exploitable Residue Volume Yield (m3/ha)Feedstock Contribution to Total Volume
Cotton stalk3.8319.1530.9
Corn stover2.1510.7517.4
Olive branches2.5410.1616.4
Almond prunings5.5918.6330.1
Wheat straw0.453.215.2
Total14.5661.9100
Table 4. Annual available volume and mass of common Thessaly feedstocks.
Biomass TypeFeedstock Annual Volume (m3)Feedstock Annual Mass (kg)
Cotton stalk16,3303266
Corn stover91961839
Olive branches86672167
Almond prunings15,9084772
Wheat straw2748385
Total52,84912,429
Table 5. Proximate analysis (% wt, dry basis) of common Thessaly feedstocks.
Proximate AnalysisWheat Straw Corn StoverCotton Stalk Olive BranchesAlmond Prunings
Moisture Content9.1957.3713.8311.40
Volatile Matter 75.5478.175.6981.3779.01
Fixed Carbon 16.2214.5519.2616.419.11
Ash 8.247.355.052.231.88
LHV (MJ/kg, dry)16.4417.7315.9617.6319.47
Phyllis2 ID703889None/[42]33473343
Table 6. Ultimate analysis (% wt, dry basis) of common Thessaly feedstocks.
Ultimate AnalysisWheat StrawCorn StoverCotton StalkOlive BranchesAlmond Prunings
C45.0246.546.4247.6849.17
H5.665.814.955.855.92
N0.910.561.130.580.62
O39.7239.6742.4543.5642.41
Ash8.247.355.052.231.88
Table 7. Single-phase and multi-phase gasification reactions [10].
ReactionΔH (kJ/mol)Reaction NumberReaction Name
Oxidation Stage
C(s) + O2 ↔ CO2−393R-1Char Oxidation
C(s) + ½ O2 ↔ CO−112R-2Char Partial Oxidation
CO + ½ O2 ↔ CO2−283R-3CO Oxidation
H2 + ½ O2 ↔ H2O−242R-4H2 Oxidation
Reduction Stage
CO + H2O ↔ CO2 + H2−41R-5Water Gas Shift
CH4 + H2O ↔ CO + 3 H2+206R-6Methane Steam Reforming
C(s) + CO2 ↔ 2 CO+173R-7Boudouard
C(s) + 2 H2 ↔ CH4−75R-8Methanation
C(s) + H2O ↔ CO + H2+131R-9Char Water Gas
Table 8. Gasification process simulation input data.
Simulation Input DataValue
Gasification Air Pressure1 atm
Gasification Air Temperature25 °C
Biomass Feed Temperature25 °C
Feed Moisture ContentAs described on Table 5
Final Moisture Content0 %
Drying Temperature150 °C
Drying Pressure1 atm
Pyrolysis Temperature500 °C
Pyrolysis Pressure1 atm
Equivalence Ratio (0.025 increment)0.2–0.4
Oxidation Temperature (50 °C increment)800–1200 °C
Reduction Temperature (50 °C increment)600–1000 °C
Syngas Cooling Temperature25 °C
Table 9. Life Cycle Inventory data for the production of electricity and heat from the CHP biomass gasification plant considered in this work for plant optimal operation (Moisture content—MC = 0%) and for the most unfavorable scenario examined (30% MC for initial feedstock).
ComponentsOptimal Plant Operation
(MC = 0% for All Feedstocks)
Most Unfavorable Scenario (MC = 30% for All Feedstocks)
Inputs
Materials
Cotton stalk (kg)0.3740.471
Almond prunings (kg)0.3210.687
Olive branches (kg)0.2480.313
Corn stover (kg)0.2090.265
Wheat straw (kg)0.04370.0547
Loading/Unloading diesel fuel (kg)0.00750.0114
Energy
Electricity (MJ)0.05590.0559
Transport (tkm)0.030.03
Syngas Energy Allocation according to feedstock
Cotton stalk (MJ)4.163.46
Almond prunings (MJ)4.125.76
Olive branches (MJ)3.122.59
Corn stover (MJ)2.492.16
Wheat straw (MJ)0.5180.432
Output
Electricity(kWh)11
Heat for final use (MJ)8.18.1
Emissions
CO (g)0.2260.479
NOx (g)3.465.43
Avoided Products
Electricity-Greek mixture (kWh)11
Heat from natural Gas (MJ)8.18.1
Table 10. Allocation of syngas energy per feedstock, according to the annual biomass availability figures and required biomass feed for the designed energy output.
FeedstockAllocation of Syngas Energy Per Feedstock (%)
Optimal Plant Operation (MC = 0%)Most Unfavorable Scenario (MC = 30% for All Feedstocks)
Cotton stalk28.924
Almond prunings28.640
Olive branches21.518
Corn stover17.315
Wheat straw3.63
Table 11. Technical specifications of Deutz TBG 620K natural gas internal combustion engine, which is simulated in this work [Source: http://www.deutz.com/].
Technical SpecificationValue
Electrical Power (kW)1022
Power to Heat Ratio0.887
Electrical Efficiency (%)40.2
Thermal Efficiency (%)45.3
Total Efficiency (%)85.5
Table 12. Layout and experimental conditions of Atnaw et al. [53] and Damartzis et al. [17].
Experimental
Conditions
Atnaw et al. (2018) [53]Damartzis et al. (2012) [17]
Gasifier TypeFixed bed DowndraftBubbling Fluidized Bed
FeedstockOil Palm FrondOlive kernel
Thermal Power (kWth)505
Gasification MediumAirAir
Equivalence Ratio0.350.2
Gasification Temperature500–1200750–850
Table 13. Proximate and ultimate analysis of feedstocks used by Atnaw et al. and Damartzis et al. [17,53].
Proximate Analysis (% wt, Dry Basis)Ultimate Analysis (% wt, Dry Basis)
Literature Data TitleAtnaw et al. (2018)Damartzis et al. (2012) Atnaw et al. (2018)Damartzis et al. (2012)
Moisture Content 84.59C 44.5848.59
Volatile Matter 83.575.56H 4.535.73
Fixed Carbon15.216.39N0.791.57
Ash 1.33.46O 48.844.06
LHV (MJ/kgdry)15.5918Ash 1.33.46
Table 14. Syngas lower heating value comparison between experimental data ([17,53]) and computational results.
Literature Data TitleExperimental LHV (MJ/m3)Predicted LHV by Model (MJ/m3)Difference (%)
Atnaw et al. (2018)54.4311.4
Damartzis et al. (2012)5.145.91−15
Table 15. Mean error of simulation results, when compared to the experimental work of Atnaw et al. and Damartzis et al., computed by Εquation (7).
SpeciesAtnaw et al. (2018)
(Experimental) [53]
Damartzis et al. (2012)
(Numerical) [17]
CO3035
H22929
CO22115
N29N/A
CH4N/A31
Table 16. Optimal operating points of the proposed gasification layout for each feedstock examined.
FeedstockGasification Temperature (°C)Equivalence RatioSyngas LHV
(MJ/m3)
CGE (%)
Cotton stalk8500.27.3870
Corn stover8500.27.3367
Olive branches8500.27.5871
Almond prunings9000.27.5366
Wheat straw8500.27.4472

