Article

Behavioral Rigidity vs. Strategic Flexibility: Family Firms in a Global Crisis

by
Viviana Fernandez
Business School, Universidad Adolfo Ibañez, Peñalolen, Santiago 7910000, Chile
World 2026, 7(5), 87; https://doi.org/10.3390/world7050087
Submission received: 13 March 2026 / Revised: 28 April 2026 / Accepted: 19 May 2026 / Published: 21 May 2026
(This article belongs to the Special Issue Strategic Sustainability: Managing Small Business Volatility)

Abstract

Global crises often force a pivotal choice between protecting human legacy and ensuring financial survival, yet the psychological drivers behind these trade-offs remain poorly understood. While family firms are traditionally viewed as inherently resilient, the unique emotional attachments of their owners may constrain their ability to adapt to unprecedented shocks. This study examines the behavioral underpinnings of crisis management across 11 European nations during the COVID-19 pandemic, challenging the traditional stewardship paradigm. Findings reveal a significant tension between preserving socioemotional wealth and economic survival. While family-managed firms prioritized personnel retention and financial autonomy, thus avoiding the psychological stigma of government aid, these non-financial priorities often proved detrimental to liquidity and business survival. This suggests that high emotional endowment can induce behavioral rigidity and an escalation of commitment, hindering strategic pivots. Furthermore, the results highlight a trend toward mimetic isomorphism, where extreme uncertainty forced a convergence of crisis responses across diverse organizational structures. Overall, the contribution of this study is to challenge the resilience myth, illustrating that acute shocks often override the distinctive behavioral archetype of family firms, forcing a shift toward institutional conformity and standardized mandates.

1. Introduction

In the contemporary landscape of organizational theory, the question of how entities navigate existential shocks has shifted toward a debate between internal resilience and institutional conformity. At a broad level, crisis management in family firms has garnered significant academic attention due to the unique dynamics inherent in these businesses [1,2,3,4,5]. Traditionally, the literature has emphasized the stewardship model, where internal solidarity—fueled by values such as loyalty, trust, and altruism—forms a bedrock of resilience [4]. This cohesion, paired with a long-term orientation and the ability to leverage personal resources, has often been credited for superior performance during periods of instability [6,7]. Indeed, some empirical studies, such as those by [8,9], suggest that publicly listed family firms outperformed their non-family counterparts during the COVID-19 pandemic.
However, moving from these general advantages to a more nuanced organizational view reveals that family firms are deeply heterogeneous entities [10]. Their specific survival likelihood is dictated by granular factors, including the degree of family involvement in management, generational stage, and regional community embeddedness [11,12]. Despite this diversity, the isomorphic perspective suggests that during acute crises, these idiosyncratic differences often dissolve. Under extreme uncertainty, organizations tend to imitate the strategies of their peers rather than relying on pre-existing strategic advantages [13,14,15,16,17]. This drive for conformity explains findings where listed family firms failed to demonstrate superior market performance or lower volatility, as isomorphic pressures effectively neutralized the benefits of their distinct resources [18].
Specifically, for private family firms, these external pressures intersect with a critical internal vulnerability: limited transparency. Unlike public entities, the lack of external scrutiny in private firms can facilitate strategic flexibility but may also mask entrenched inefficiencies or conflicts of interest [19,20,21]. In environments characterized by institutional voids, this secrecy can even catalyze unethical responses or corruption under the guise of survival [7]. Consequently, the most specific challenge for these firms is not just the crisis itself, but how the combination of low transparency and intense isomorphic pressure leads them toward efficiency-focused exploitative strategies that ultimately hinder long-term innovation and post-crisis recovery [11].
The objective of this study is to examine the behavioral underpinnings of crisis management within family firms across 11 European nations during the COVID-19 pandemic. Specifically, it challenges the traditional stewardship paradigm by exploring the psychological and institutional trade-offs faced by family owners between the preservation of human legacy and financial survival. By analyzing a robust sample of predominantly private family-controlled and managed entities, this research highlights the critical tension between behavioral rigidity—a tendency to persist in established family routines despite environmental shifts—and the pursuit of strategic flexibility, which enables these firms to pivot through innovative adaptations [2,11,14]. Utilizing binary logistic and multinomial logistic regressions, alongside an endogenous treatment effect model, this study evaluates key metrics, such as employment stability, sales dynamics, liquidity, and the utilization of government assistance to provide a comprehensive view of crisis performance.
The research offers three primary contributions that challenge the traditional stewardship paradigm. First, empirical findings dismantle the resilience myth, revealing that family firms did not outperform their non-family counterparts; in fact, family control had a negative impact on temporary closure rates, liquidity, and overall survival. This suggests that inherent family advantages were neutralized by isomorphic pressures, which forced a convergence of crisis responses across all firm types. Second, while family management successfully prioritized personnel retention and reduced reliance on state aid, these prosocial behaviors failed to translate into superior economic performance, indicating that a preference for self-reliance may not yield a competitive edge during widespread volatility. Third, the observation that assistance-seeking behaviors among family firms closely mirrored those of non-family firms reinforces the isomorphic view, proving that external environmental prompts for conformity effectively override internal organizational structures in times of extreme uncertainty.
The remainder of the article is structured as follows. Section 2 establishes the conceptual framework and develops the research questions, while Section 3 details the dataset and methodological approach. The empirical results are analyzed in Section 4 and discussed in Section 5. Finally, Section 6 concludes with a summary of key findings, an exploration of policy implications, and a discussion of the study’s limitations and avenues for future research.

2. Conceptual Frameworks and Hypotheses Development

2.1. Crisis Management in Family Firms

Ref. [22] defined institutional isomorphism as a constraining process that forces one unit in a population to resemble other units that face the same set of environmental conditions. Institutional isomorphism operates through three specific channels: coercive, mimetic, and normative. Coercive isomorphism stems from formal and informal pressures exerted on organizations by other organizations upon which they are dependent, and by cultural expectations in society. This often includes government mandates, regulations, or pressures from powerful stakeholders. Mimetic isomorphism arises in response to uncertainty. Organizations may model themselves after other organizations that they perceive to be legitimate or successful. Normative isomorphism involves the spread of norms and standards through professional networks, education, and the credentialing of individuals.
While these forces apply broadly, family firms exhibit a nuanced form of isomorphic behavior in their crisis management. Rather than mimicking the immediate actions of competitors, these firms often conform to deeply embedded, institutionally driven patterns rooted in the unique intertwining of family and business identities [17,22,23]. This specific manifestation of isomorphism arises from a pursuit of legitimacy within an organizational field defined more by family-centric values and socioemotional goals than by purely economic rationality. Consequently, the drive for conformity in family firms often prioritizes the preservation of the family’s institutional standing, even when such alignment contradicts traditional profit-maximizing strategies.
Indeed, emotional attachment, long-term orientation, and prioritization of socioemotional wealth (e.g., family control, identity, legacy) act as powerful normative forces. Family firms conform to these internal norms, influencing decisions like protective strategies aimed at transgenerational preservation [1,6]. This pursuit of socioemotional wealth, even at the expense of short-term financial performance, represents a form of isomorphic behavior where the firm aligns with the prevailing best practices of maintaining family-centric values within its own unique context [24,25].
While not explicitly stated as direct imitation, the conservative decision-making and risk aversion prevalent in family firms [26,27] can be seen as a form of mimetic isomorphism. In uncertain crisis environments, family firms may implicitly adopt a cautious approach that has proven successful or is perceived as safe for similar family-controlled entities. This can lead to a slower reaction to rapid crises, reflecting an internalized, widely accepted model for navigating risk.
On the other hand, the informality and lack of structure often cited in family firms [28], particularly the reliance on informal communication and governance, can lead to a form of internal coercive isomorphism. Indeed, the strong influence of family dynamics and the absence of formal frameworks coerce decisions towards solutions that maintain family cohesion, even if suboptimal for the business. This is evident when pre-existing family conflicts are exacerbated by crises, potentially leading to detrimental decision-making [6].
Nevertheless, family firms often demonstrate isomorphic convergence around practices that promote a long-term orientation (“continuity”), adaptability and innovation (“command”), strong employee relationships (“community”), and robust stakeholder connections (“connection”) [7]. Their tendency to adopt conservative financial practices (e.g., lower debt levels) and prioritize employees and communities [29] reflects an adherence to a template of responsible and sustainable business, allowing them to take a measured approach to crises, focusing on long-term recovery and survival. This alignment with a broader, often unstated, institutionalized ideal of family business longevity contributes to their distinctive and often more resilient crisis response [7].

2.2. Family Firms in Times of the COVID-19 Pandemic

The pandemic spurred significant product innovation within numerous family firms [30,31]. For instance, companies in industries like textiles and chemicals swiftly retooled their production lines to meet the sudden demand for health-related products, such as masks and sanitizers [7]. This highlights a key strength: many family firms navigated the pandemic successfully through a unique blend of flexibility, long-term commitment, innovation, and strong social and emotional ties. While family firms certainly faced universal business challenges, their emphasis on stewardship, employee care, and adaptability often proved to be a decisive factor in their success [7,9,12]. The pandemic also acted as a catalyst for lasting changes in leadership dynamics, digital transformation, and risk management practices within family businesses [32].
However, it is also important to note that not all family firms outperformed their non-family counterparts during the pandemic [11,18]. This mixed performance could be attributed to various factors, including isomorphic pressures that lead organizations to imitate actions and strategies [13], or simply the heterogeneous nature of family firms themselves [11]. Some family firms, for example, may have prioritized the short-term benefits for current family members over the long-term prospects of the business or the well-being of non-family stakeholders [7].
Indeed, research by [11] suggests that the approach taken by family firms—whether exploitative or explorative—had a significant impact on their recovery trajectory. Ultimately, those family firms that successfully recovered were the ones that embraced exploration, innovation, and risk-taking to find effective solutions in unprecedented circumstances [33,34].

2.3. Research Hypotheses

This study explores whether family firms’ crisis responses are driven by institutional pressures to conform to industry norms—specifically through mimetic, normative, and coercive isomorphism—and how these forces dictate the balance between behavioral rigidity and strategic flexibility.
While a surge in online activity and the strategic pursuit of government assistance often reflect mimetic isomorphism, these actions also represent a firm’s attempt to maintain strategic flexibility by imitating the successful digital pivots of their peers. However, such imitation can sometimes mask an underlying behavioral rigidity if it merely replicates industry templates rather than fostering genuine, firm-specific innovation [11]. In contrast, superior employee retention and the ethical deployment of aid point toward normative isomorphism, fueled by inherent values of stewardship. While these values provide a social buffer, they can also induce a form of rigidity that complicates the structural adaptations necessary for long-term survival [7]. Finally, temporary business closures highlight the role of coercive isomorphism, where behavior is dictated by the non-negotiable pressure of government mandates, effectively overriding internal management preferences [35].
Given this theoretical landscape and the conflicting evidence regarding family firm resilience, the first inquiry explores whether these organizations succumbed to external pressures or maintained their idiosyncratic identity. Specifically, this study investigates whether family firms exhibited performance patterns like those of their non-family counterparts—suggesting that mimetic or normative pressures compelled them to adopt standardized crisis strategies—or if their unique prioritization of socioemotional wealth allowed them to chart a distinct, non-isomorphic trajectory:
RQ1: 
To what extent did the economic performance of family firms converge with or diverge from that of non-family firms, reflecting isomorphic pressures?
Building on this, the second research question examines the behavioral drivers behind assistance-seeking strategies. It is asked if family firms’ decisions regarding government support were shaped by a drive for normative conformity—reflecting a perceived legitimate path to survival—or if internal institutional pressures, such as a desire for autonomy and deep community ties, led them to pursue alternative forms of assistance:
RQ2: 
To what extent did the institutional environment normatively shape family firms’ propensity to seek alternative forms of assistance compared to non-family firms?

3. Data and Methodology

3.1. Data

Data comes from the World Bank Enterprise Survey (WBES), which provides information on the business environment of firms in most developing countries and some developed ones. The questionnaire, which is applied to firms from the non-agricultural private economy, covers ownership structure, gender of senior managers, loan applications and associated outcomes, and establishment characteristics. Small firms and medium-sized firms are defined as those with 5–19 employees and 20–99 employees, respectively. Further information can be found at https://www.enterprisesurveys.org/en/enterprisesurveys (Accessed on 31 July 2024).
This study focuses on firms from 11 European countries for which information on the COVID-19 pandemic and family involvement in business ownership and/or management was available. As Table 1 shows, the sample covered about 9500 firms, which were sampled during 2019–2022. The countries with the highest representation in the sample were Denmark, France, Germany, and Spain. Family firms―that is, those where a single family had control of the business [36,37]―were most represented in Ireland (81%), Belgium (74%), and France (71%). In turn, family-controlled firms―that is, those where the percentage of family members in key management positions exceeded 50%―predominated in Belgium (58%), Austria (56%), and Ireland (52%).

3.2. Variables

Table A1 of the Appendix A presents the study variables categorized as firm-related and COVID-19-related. Firm-related variables are further partitioned into independent (family control and family management) and control variables. Following established literature [36,37,38,39,40], control variables are gender of the senior manager, business age, business size, labor productivity, competition from unregistered or informal firms, stock market listing, internationalization, retail sector, innovation, financial constraints, foreign ownership, and location in a large city.
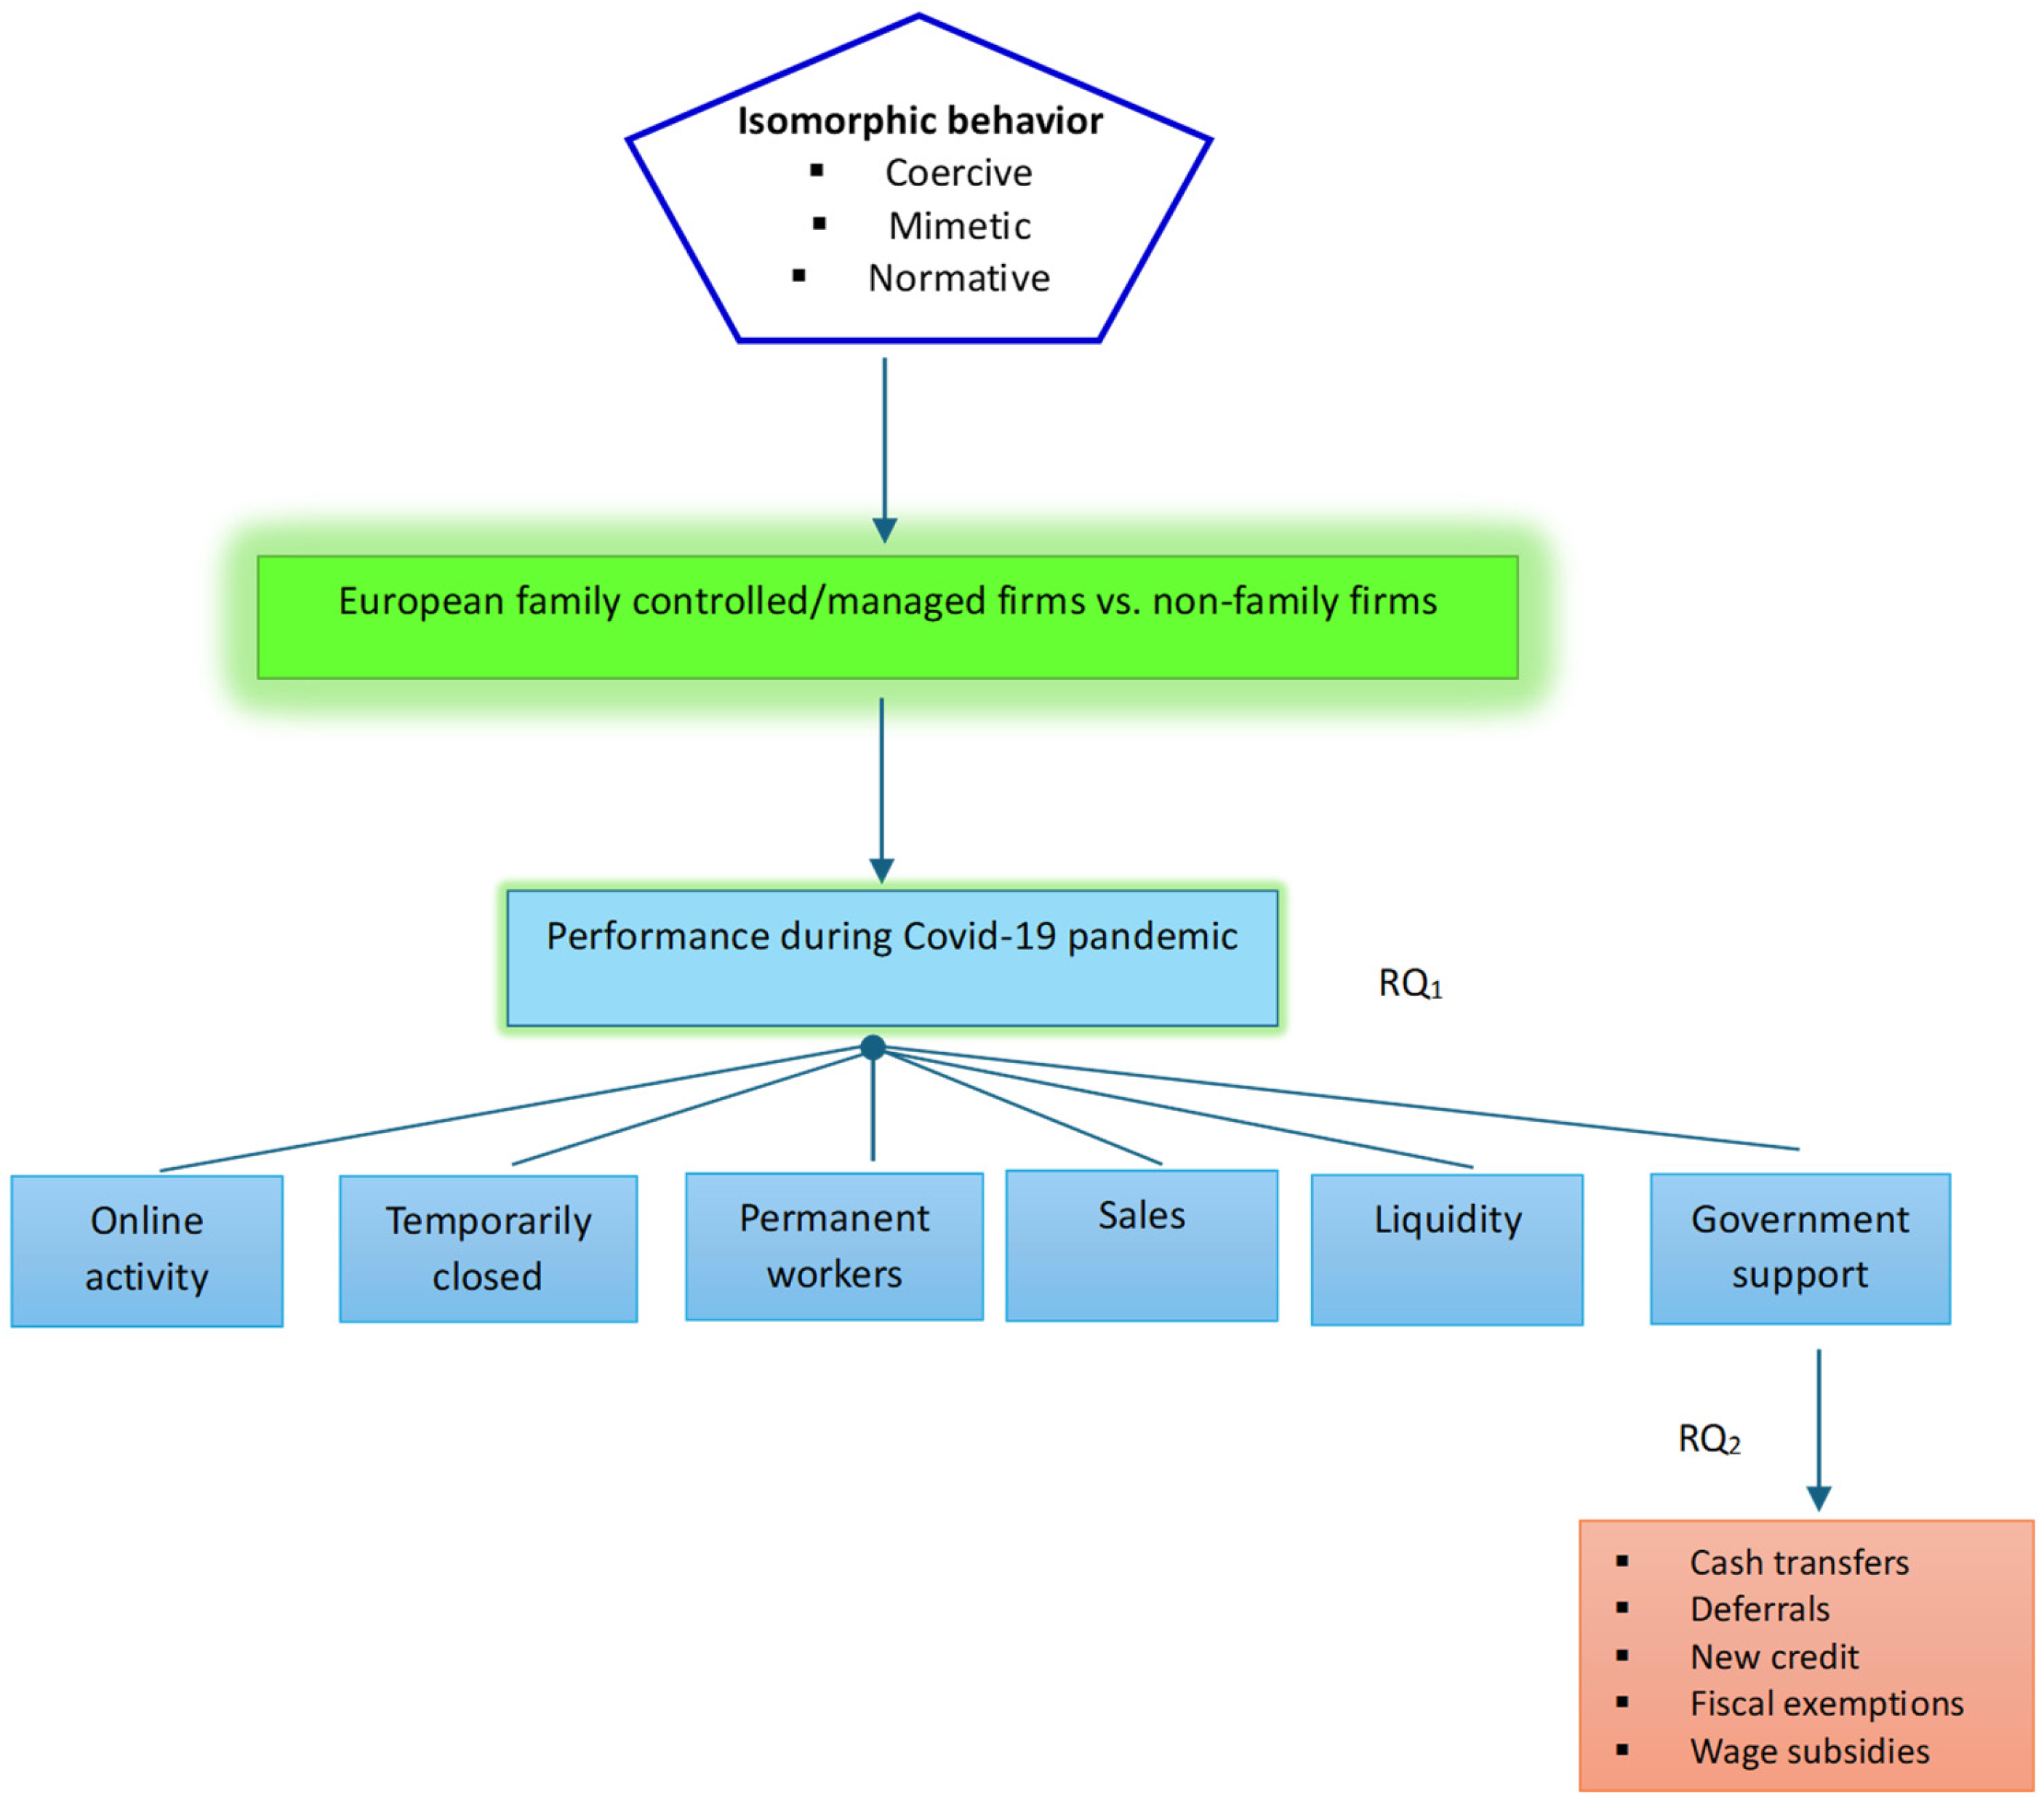
Building on these variables, Figure 1 presents a conceptual framework addressing the two research questions outlined in Section 2.2. Specifically, the overarching research focus is the comparison of European family-controlled/managed firms and non-family firms. The framework explores both firm-level performance (RQ1) and their reliance on external support (RQ2). Performance is operationalized through several key metrics, encompassing digital adaptability via online operations, temporary closures, workforce retention, sales dynamics, financial liquidity, and the utilization of government assistance. For the latter, the figure identifies specific tools or mechanisms utilized during the pandemic, such as cash transfers and wage subsidies.
To contextualize the analysis, Table 2 provides descriptive statistics for all study variables. The sample averages reveal that family firms were significantly smaller than non-family firms (46 versus 123 employees). Notable differences also emerge in governance and market positioning: family firms featured a higher proportion of women in management (14% vs. 9%), faced greater pressure from informal competitors (19% vs. 13%), and were less likely to be publicly traded (6% vs. 12%) or foreign-owned (6% vs. 22%).
Furthermore, family firms faced more financial constraints (11% vs. 9%) and a lower export propensity (20% vs. 46%). During the pandemic, family firms exhibited more vulnerability, with a greater likelihood of temporary closure (32% vs. 23%) and shorter survival horizons in the absence of sales (15.4 vs. 17.8 weeks). All reported differences are statistically significant according to Student’s T-tests for mean comparisons.

3.3. Statistical Methodology

3.3.1. Binary and Multinomial Logistic Regressions

Since most COVID-related questions recorded by the WBES are binary, a logistic regression model is used to evaluate the impact of family control/management:
Pr(COVID question = 1|Family firm, W) = f(Zi)
Zi = α0 + α1 Family firmi + ΣkβkXk,i + Country FF + Year FF + ui
where Pr(COVID question = 1) is given by the logistic distribution function conditional on Zi, which includes family ownership/management, a vector of control variables W (business characteristics, including industry fixed effects (X), and country and year fixed effects), and an error term, ui.
In addition, the impact of family control/management on the choice of alternative forms of government support is explored through a multinomial logistic regression model [41].

3.3.2. Endogenous Treatment Model

In family firms, the decision to have family members in control or management roles is not always random [39,40,42]. The intersection of family wealth, human capital, and individual preferences plays a pivotal role in determining family involvement and its ultimate impact on business performance. This interplay introduces a correlation between family involvement and firm outcomes, which obscures the true causal effect of family control/management. To account for this endogeneity, this study employs an endogenous treatment model [43,44], where treatment represents family control/management:
yi0 = E(yi0|xi) + εi0
yi1 = E(yi1|xi) + εi1
τi = E(τi|zi) + υi
yi = τiyi1 + (1 − τi)yi0
E(εij|xi, zi) = E(εij|zi) = E(εij|xi) = 0 for j = 0, 1
E(εiji) ≠ 0             for j = 0, 1
where subscript i denotes firm-level observations, yi1 is the potential outcome of receiving treatment, yi0 is the potential outcome when not receiving treatment, τi is the observed binary treatment, and yi is the observed outcome.
Equation (8) highlights a crucial point: unobservable factors within the potential-outcome equations are linked to the treatment status. In simpler terms, if family control or management is the treatment, then unseen elements like socioemotional wealth or managerial skills that influence a company’s performance might also be connected to its ownership or managerial structure. On the other hand, the correlation between τi and εij must be equivalent to that between εij and υi: ρj. That is, E(εiji) = E(εiji) = ρjυi.
If the outcome variable is binary, E(yij|xi, υi, τi = j) = Φ(xiβj + ρjυi), j = 0, 1, where Φ(.) is the cumulative distribution function of a normal standard. Parameters estimates are obtained through the generalized methods of moments (GMM).

4. Results

Section 4.1 and Section 4.2 focus, respectively, on family firms’ business performance (RQ1) and their dependence on government support (RQ2) during the pandemic. In addition to analyzing the full sample of countries, Section 4.1 also presents evidence from three European countries that had stricter COVID-19 measures in place at the end of December 2020: Austria, Ireland, and Germany. Section 4.3, in turn, presents some robustness checks that address the potential endogeneity of family control/management when modeling business performance and government assistance requests.

4.1. Impact of Family Control and Management on Performance

4.1.1. Family Control: Full Sample of Countries

Table 3 presents logistic regressions for the likelihood that several establishment-related factors were impacted by the COVID-19 pandemic. Specifically, the dependent variables under consideration are whether the establishment started/increased online activity or not (column (1)), whether the establishment was temporarily closed or not (column (2)), whether the number of permanent workers increased/remained constant or decreased (column (3)), whether sales increased/remained constant or decreased (column (4)), whether liquidity increased/remained constant or decreased (column (5)), and whether the establishment received any support from the local or national government (column (6)). The independent variable of interest is family control. Parameter estimates are expressed as odds ratios so that a given predictor variable is positively (negatively) associated with the dependent variable if its odds ratio is greater (less) than 1.
As shown in Table 3, family control is statistically significant only in columns (2) and (3). Specifically, column (2) shows that the odds for a family-controlled firm of closing temporarily were 16% higher, while their odds of increasing or maintaining the number of permanent workers during the pandemic were 10% lower. In turn, the marginal effects provided at the end of Table 3 show that family control increased the likelihood of temporary closure by 2.4 percentage points, whereas it decreased the likelihood of maintaining or increasing personnel by 1.7 percentage points. The remaining marginal effects are statistically insignificant, in line with the findings from odds ratios.
As for control variables, the estimation results suggest, for example, that larger establishments had higher odds of increasing their online activity and of increasing or maintaining sales and liquidity, while they had lower odds of receiving government support. Moreover, establishments with higher labor productivity had lower odds of remaining temporarily closed and higher odds of increasing or maintaining their personnel, sales, and liquidity. Exactly the opposite held true for financially constrained establishments. Interestingly, female top management increased the odds for an establishment of closing temporarily and decreased the odds of increasing/maintaining personnel and sales.
Another COVID-related question addressed by the WBES concerns the number of weeks that an establishment would have remained open if its sales had ceased as of today. 8379 (out of 9454) establishments reported this variable, of which 79 reported zero weeks. Since these businesses represented only 0.94% of the total, they were discarded. Table 4 reports a linear regression model where the dependent variable is the natural logarithm of the number of weeks of survival. As before, the independent variable of interest is family control. Control variables are analogous to those of Table 3.
As shown, family control decreased the number of weeks of survival by 7%. As for control variables, female top management and informal competitors decreased the number of weeks by 14% and 6%, respectively. The greatest negative impact on business survival was due to financial constraints: 44%. In contrast, labor productivity and international clientele proved beneficial, at 7.2% and 17%, corresponding increments in the number of weeks of operation.

4.1.2. Family Control: Countries with the Strictest Measures Against COVID

As reported in Table A2 of the Appendix A, the stringency of COVID-19 measures varied by country, according to an index available at Our World in Data. This stringency index was based on nine metrics: school closures, workplace closures, cancellation of public events, restrictions on public gatherings, closures of public transport, stay-at-home requirements, public information campaigns, restrictions on internal movements, and international travel controls [45]. The three countries in the sample with the highest stringency index values at the end of December 2020 were Austria, Ireland, and Germany (82.4, 84.3, and 82.4, respectively). The regression models of Table 3 and Table 4 are therefore re-estimated for these three countries in isolation.
As shown in Table 5, there is evidence that the odds of starting/increasing online activity at family-controlled firms from these three countries increased by 30% (column (1)). However, these family firms also experienced 17% lower odds of increasing or maintaining liquidity (column (5)). Notably, across the full sample of countries, family control was not statistically relevant to either online activity or liquidity. Moreover, for these three countries family control did not impact the remaining dependent variables. This is consistent with the statistical significance of the marginal effects reported at the end of Table 5: 5 percentage points on online activity and −3.9 percentage points on liquidity.
As for control variables, in line with the findings from Table 3, higher labor productivity was beneficial to business performance during the pandemic, while the opposite held true for financial constraints. Furthermore, in these three countries retail establishments performed better than those from the full sample, as they significantly increased their odds of online activity and hirings, and decreased their odds of receiving government support.
An unreported logistic regression shows that there was no evidence for the three countries that family control had an impact on the number of weeks an establishment could have remained open in the absence of sales. As for control variables, in line with Table 4, labor productivity and international sales prolonged business survival (8.9% and 20.5%, respectively), while financial constraints shortened it (45.2%).
Table A4, Table A5 and Table A6 of the Appendix A present an alternative specification based on the full sample of countries, incorporating a dummy variable for government stringency both as a standalone regressor and as an interaction term with family control/management. As indicated at the bottom of Table A4, the overall marginal effect of family control was positive regarding online activity (2.4 percentage points) but negative for temporary closures (−1.8 percentage points). Similarly, Table A5 demonstrates that family management exerted a negative overall marginal effect on the acquisition of government support (−3.0 percentage points). Finally, Table A6—number of weeks a business remained open without sales—reveals that the interactions between family control/management and stringency are statistically insignificant. This suggests that government stringency did not possess a moderating effect on the impact of family governance on business survival.

4.1.3. Family Management

Table 6 presents logistic regressions for the entire sample along the same lines as those in Table 3, replacing family control with family management (in family-controlled firms). As shown, family management was statistically significant only in column (6), suggesting that it reduced the likelihood of relying on any type of local or national government assistance. Indeed, as the marginal effect at the end of Table 6 shows, the likelihood of family-managed firms seeking government support was 3.0 percentage points lower. (This is consistent with the marginal effects of Table A5).
Unreported results for the full sample show that family management had no perceptible impact on firm survival in the absence of sales. For Austria, Germany, and Ireland, unreported results for family management are analogous to those for family control in Table 5, in that family management only affected online activity and liquidity. (This contrasts with the marginal effects of Table A5, where family management only impacted the acquisition of government support.)
Considering the empirical evidence, the resolution to RQ1 indicates that family control influenced only specific dimensions of performance, with the overall impact being detrimental. These findings suggest that while family firms were subject to intense coercive pressures—driven by regulatory mandates and tightening financial constraints—they were less effective at mimetic learning due to their inherent conservatism and prioritized focus on socioemotional wealth. Furthermore, a comparative lag in adopting normative professional management practices likely prevented these firms from developing the strategic buffers necessary to cushion the crisis effectively.
Regarding family management within these firms, its primary effect was to reduce reliance on government support, but it showed no overall impact on business performance across the entire sample. That is, while family-managed firms’ normative values might have led them to eschew government aid, these same values do not appear to have conferred a universal performance advantage or disadvantage. This implies that family-managed firms’ overall business acumen, market position, or adaptability to other aspects of the crisis might have been like those of other firms.

4.2. Government Support

In the previous section, logistic regression models were presented for the likelihood of receiving national or local government support in response to the COVID-19 pandemic. It was concluded that family control did not affect this likelihood, while family management in family businesses negatively impacted it (Table 3, Table 5 and Table 6). This section focuses on the type of support received by those firms that sought government assistance. The WBES considered the following measures: (a) cash transfers for businesses; (b) deferral of credit payments, rent or mortgage, suspension of interest payments, or rollover of debt; (c) access to new credit; (d) fiscal exemptions or reductions; and (e) wage subsidies.
For statistical modeling, measures (a), (b), and (c) are grouped as cash & deferral while measures (d) and (e) are grouped as fiscal & wage. Based on this classification, three mutually exclusive alternatives are computed: cash & deferral only, fiscal & wage only, or both. Thus, a multinomial regression model is based on four categories: (1) Receiving no government support (baseline), (2) receiving cash, deferrals, or new credit only, (3) receiving fiscal exemptions or wage subsidies only, or (4) both (2) and (3). Empirically, categories (1) to (4) have 3827 (43.30%), 1036 (11.72%), 1566 (17.72%), and 2409 (27.26%) observations, respectively, for a total of 8,838 observations. Firms that received any type of support other than (a)–(e) were excluded from the analysis (287 observations).
Results are presented in Table 7. As before, the independent variables of interest are family control and family management. Various controls are considered according to Section 4.1. As can be seen, family control did not affect the probability of receiving support in any of the forms considered (columns (1)–(3)). In contrast, family management was inversely associated with the likelihood of receiving support in the form of fiscal exemptions or wage subsidies. However, family management did not affect the likelihood of receiving other forms of support.
The above evidence is complemented by binary logistic regressions for each form of support for the subsample of firms that applied for government assistance. As shown in Table A3(a,b), family-controlled and family-controlled-managed firms were more likely to rely on new credit. However, it should be noted that, unlike multinomial regressions, binary logistic regressions do not consider the interdependence between different options and between the subsamples of firms that did and did not apply for assistance.
Synthesizing these findings, the resolution to RQ2 indicates that the assistance-seeking strategies of family-controlled and managed firms were largely indistinguishable from those of their non-family counterparts. This finding suggests that while family firms might exhibit a general preference for self-reliance or caution regarding government intervention, when they decided to engage with government aid, the specific choices they made were largely shaped by the same powerful coercive forces of limited options and economic necessity, the mimetic influence of what others were doing in a highly uncertain environment, and the normative guidance from professional advisors that affected all types of businesses during a widespread crisis [46]. The immediate, existential threat of the pandemic likely amplified these isomorphic pressures, often overriding any distinct family preferences regarding the type of aid sought once the decision to seek aid was made.

4.3. Robustness Check

This section uses an endogenous treatment model to estimate average treatment effects (ATEs) of family control/management on the performance measures considered in Table 3 and Table 6. As noted in Section 3.3.2, this approach addresses potential endogeneity issues regarding family control and management, as unobservable factors influencing these structures may correlate with those impacting firm performance [47]. While the explanatory variables in the outcome model remain consistent with those in Table 3 and Table 6, the treatment model (family control/management) incorporates distinct instruments. These include the top manager’s previous experience in a multinational firm as a measure of human capital, and dual leadership—where the top manager and owner are the same person. Controls include female ownership, business age and size (logged), listing status, foreign property, location in a large city, and year and country fixed effects.
The inclusion of these instruments is supported by existing literature. For instance, family firms often face human capital constraints because highly skilled non-family professionals may perceive a glass ceiling, fearing that top-tier positions like CEO are reserved for family members [48]. Furthermore, dual leadership is common in family firms to align ownership interests with managerial decisions, thus fostering a long-term commitment to survival. Nevertheless, dual leadership is not without risks, as it can lead to managerial entrenchment and resistance to professionalization [49,50].
Table 8 presents the estimation results for the full sample of countries. Panel (a) shows that family control’s ATE was statistically significant for only two areas: online activity (9.5 percentage points) and temporary closure (18.5 percentage points). Panel (b) reveals that family management affected only temporary closure (17.3 percentage points), personnel (9.4 percentage points), and government support (−9.4 percentage points).
While this statistical approach differs from logistic regression, these ATEs can be compared to the marginal effects found in Table 3 and Table 6. Specifically, Table 3 indicated that family control was relevant only for temporary closure and personnel, with marginal effects of 2.4 and −1.7 percentage points, respectively. Table 6, in turn, showed that family management was only relevant for the likelihood of seeking government support, with a marginal effect of −3.0 percentage points. Overall, the ATEs are larger in absolute terms than the marginal effects in the cases of family control/temporary closure and family management/government support.
It is worth noting that a Wald test for uncorrelated unobservable factors of the treatment and outcome equations—where the null hypothesis (H0) assumes no correlation—provides evidence of endogeneity (H1) in only four of the twelve models of Table 8 (see its notes). Consequently, there is only modest evidence that family ownership and management are endogenous. Specifically, H0 is rejected in panel (a) for the Closed (p = 0.00) and Liquidity (p = 0.05) models, and in panel (b) for the Closed (p = 0.00) and No. workers change (p = 0.05) models.
In summary, an endogenous treatment model provides a more nuanced understanding of family firms’ performance. It suggests that family control may have boosted online activity, while family management may have helped to increase or maintain personnel levels. This suggests that during the pandemic, family firms, through these specific actions—online activity and personnel retention—were not immune to isomorphic forces but rather responded in ways that were both aligned with their internal structures and reflective of external coercive, mimetic, and normative pressures.

5. Discussion

The analysis revealed that while family control could have positive impacts in certain areas, such as online activity, this appears to be largely a function of mimetic isomorphism. As the pandemic rapidly accelerated digitalization across industries, family firms, like their non-family counterparts, likely observed and adopted successful online strategies from leading organizations to reduce uncertainty and maintain market relevance. This widespread imitation of effective digital adaptation led to a convergence of behavior, irrespective of the underlying ownership structure [16,18].
However, this study also found that family control had detrimental effects on specific performance indicators, including temporary closure, liquidity, and business survival. These outcomes primarily reflect the pervasive impact of coercive isomorphism. Government-mandated lockdowns and universal public health concerns imposed non-negotiable pressures that severely constrained strategic flexibility. Family firms, despite their unique strengths, were compelled to conform to these external directives and were equally susceptible to the generalized economic downturn. In this context, their familiness offered little buffer against overarching forces [50], often resulting in a forced behavioral rigidity as traditional resilience mechanisms were neutralized by the crisis.
Furthermore, while family management mitigated dependence on government support and contributed to personnel retention, it did not yield an overall significant positive effect on business performance. The decision to limit reliance on aid and prioritize staff can be understood through normative isomorphism, reflecting deeply embedded family values of self-reliance and stewardship. However, the absence of superior performance suggests that these values may inadvertently foster behavioral rigidity. While providing a social buffer, these deeply held norms can create organizational inertia that limits the extent to which a firm can achieve a competitive advantage during a severe crisis [17,22,35].
It is possible that mimetic behavior was exacerbated in privately owned firms due to restricted access to diverse information sources and a heavier reliance on local networks. Indeed, privately owned firms, especially smaller ones, often lack the resources for independent research and strategic planning, which can stifle strategic flexibility [11,14]. This constraint frequently leads them to imitate the strategies of peers perceived as successful. In highly competitive markets, family firms likely felt pressured to conform to the practices of industry leaders to ensure survival and legitimacy during periods of heightened uncertainty.
On the other hand, many privately owned firms rely on less formalized decision-making compared to publicly traded or state-owned entities [26]. While this can theoretically allow for agility, it also makes them more susceptible to mimetic behavior when they lack established frameworks for crisis management. Privately owned firms, particularly those that are family-run, rely heavily on their reputation within local networks to maintain trust among stakeholders [1]. Adopting widely accepted, safe strategies during the pandemic served to maintain this legitimacy, even if it meant sacrificing the firm’s unique competitive potential.
Ultimately, these findings suggest a need to revisit assumptions about the inherent advantages of family firms during global shocks. While such firms possess unique resources, the unprecedented nature of the COVID-19 pandemic somehow neutralized these advantages. Both family and non-family firms should reflect on the value of adaptive and collaborative strategies rather than relying on structural heritage [33,34]. Moving forward, building systems that balance behavioral rigidity with genuine strategic flexibility may be more critical than relying on traditional strengths tied to organizational structure.

6. Conclusions

This study contended that the unique characteristics of family firms are best analyzed through an institutional isomorphic lens. Under the intense and pervasive pressures of a global crisis, these firms do not merely adhere to internal traditions; rather, they are compelled to adopt survival-oriented practices that mirror the broader organizational landscape. Ultimately, while inherent values may offer a degree of initial resilience, the overwhelming external environment drives family firms toward a convergence of behavior.
The empirical evidence presented in this study carries significant applicability for practitioners and policymakers, as it demonstrates that family control can become a strategic liability during systemic shocks. The detrimental effects observed in liquidity, temporary closures, and survival rates suggest that the resilience myth often attributed to family ownership is highly contingent upon external circumstances. For firm owners, these findings are particularly useful in highlighting how the preservation of idiosyncratic identity can lead to behavioral rigidity. Rather than relying on inherent ownership advantages, firms must recognize that their performance under crisis is largely a reflection of environmental constraints, necessitating a shift toward greater strategic flexibility to navigate the same pressures faced by non-family counterparts.
Furthermore, the relevance of this study lies in its validation of the isomorphic perspective within the context of global crises. While family management provided specific social utility, such as maintaining personnel and mitigating government dependence, its negligible impact on overall performance underscores that severe crises demand a convergence of survival strategies. The observation that assistance options and coping mechanisms were largely uniform across firm types indicates that external prompts for conformity effectively override internal management styles. This insight is crucial for understanding organizational behavior in volatile markets, proving that during acute uncertainty, institutional pressures for mimetic and normative isomorphism dictate the broader organizational landscape.
Policymakers should implement conditional support frameworks that incentivize diversification and technological innovation. By framing modernizing activities as new industry standards, authorities can leverage the drive for conformity to help family firms adopt best practices that have proven successful across the broader organizational landscape. This approach is less about dictating internal change and more about providing the templates and professional leadership training that facilitate the adoption of resilient, standardized approaches common among high-performing organizations.
Furthermore, support frameworks should be streamlined and inclusive, acknowledging that all firms—regardless of ownership—face identical environmental constraints and will seek the most accessible survival mechanisms. Policymakers can further exploit peer isomorphism by fostering networks and associations. Such platforms encourage firms to imitate successful crisis-response strategies from their peers, creating a self-reinforcing cycle of effective behavior. This strategic use of institutional pressure shifts the focus from individual firm resilience to a collective, shared approach, ultimately reducing long-term dependence on external government intervention.
Despite the robust sample size and geographic breadth, there is room for improvement. First, the cross-sectional nature of much pandemic-related data limited the ability to observe the long-term evolution of isomorphic effects. Future research should employ longitudinal designs to determine whether the observed convergence in crisis responses is a temporary survival mechanism or a permanent shift that erodes the idiosyncratic identity of family firms over time. Second, while this study identified broad trends across 11 European nations, it does not fully account for the granular institutional diversity within specific regions or industries. The strength of coercive and normative pressures can vary significantly based on national regulatory frameworks or local cultural expectations of stewardship. Future studies could integrate a comparative institutional analysis to explore how different levels of state intervention or cultural values either amplify or mitigate the drive toward mimetic isomorphism. Specifically, examining the stigma associated with government aid in different cultural contexts could clarify why family firms in certain regions prioritize autonomy more fiercely than others. Finally, the focus on firm-level performance metrics leaves room for a more nuanced exploration of micro-foundational drivers, such as the psychological profiles of individual family CEOs. Future research could delve into the cognitive load and decision-making biases of family leaders during systemic shocks, using qualitative or experimental methods. Understanding how individual loss aversion or perceived social responsibility translates into organizational rigidity would provide a more complete picture of the behavioral mechanisms at play. Additionally, exploring the role of digital maturity as a moderator could help explain why some family firms successfully resisted mimetic conformity by leveraging unique, innovative paths to resilience.


Funding

This research was funded by Agencia Nacional de Investigación y Desarrollo (ANID) [FONDECYT Grant 1240098].

Institutional Review Board Statement

Not applicable.

Informed Consent Statement

Not applicable.

Data Availability Statement

Data is freely available at https://www.enterprisesurveys.org/en/enterprisesurveys, Accessed on 31 July 2024.

Conflicts of Interest

The author declares no conflicts of interest.

Appendix A

Table A1. List of variables.
Firm Related
Independent variableDescriptionTypeSource
Family control=1 if % owned by same family > 50.BinaryWBES questionEUb2
Family management=1 if % family members in key mgmt. positions > 50 in family-controlled firms.ContinuousWBES question EUb3
Control variableDescriptionTypeSource
Business ageYears since the establishment began operations.CountWBES question a14y and b5
Business sizeNo. permanent, full-time employees at the end of last fiscal year.CountWBES question l1
Direct exports=1 if ≥25% of sales.BinaryWBES question d3c
Female top manager=1 if top manager is female.BinaryWBES question b7a
Financially constrained=1 if not having a loan/line of credit due to last application rejected; or application procedure for new loans/lines credit is complex; unfavorable credit conditions or unlikely approval, or finance is a major or very severe obstacle.BinaryWBES questions BMk7, k17, and k30
Foreign property=1 if percentage owned by private foreign individuals, companies or organizations ≥ 25BinaryWBES question b2b
Informal=1 if establishment competes against unregistered or informal firms.BinaryWBES question e11
Innovation index=No. activities carried out among the following: acquisition of external knowledge, R&D, and/or offering new products/services to the market.CountWBES questions BMk6, h1, h2, h5, and h9
Labor productivitySales in USD/fulltime employeesContinuousWBES questions d2, l1
Large cityEstablishment located in a city with a population of more than 1 million.BinaryWBES question a3
Listed= 1 if shareholding company with shares traded on the stock market.BinaryWBES question b1
Retail=1 if industry sector is retail.BinaryWBES question a4a
COVID-19 related
VariableDescriptionTypeSource
Closed=1 closed temporarily (suspended services or production) due to COVID.BinaryWBES question COVb1a
Government stringency=1 if Austria, Ireland, or Germany. (Countries with strictest COVID-19 measures by December 2020 end).BinaryOur World in Data
Government support=1 if establishment received any support from local or national government since outbreak of COVID.BinaryWBES question COVf1
Government support measuresCash transfers for businesses. (b) Deferral of credit payments, rent or mortgage, suspension of interest payments, or rollover of debt. (c) Access to new credit (d) Fiscal exemptions or reductions. (e) Wage subsidies BinaryWBES COVf2a, COVf2b, COVf2c, COVf2d, COVf2e
Liquidity=1 liquidity or cash flow increased or remained the same since the outbreak of COVID.BinaryWBES question COVe1a
No. workers change=1 if the number of permanent workers increased or remained the same.BinaryWBES question COVd3a
Online activity=1 if started or increased business activity online due to COVID.BinaryWBES question COVc4a
Sales change=1 sales for last month relative to 2019 increased or remained the same.BinaryWBES question COVb2a
Weeks openedWeeks the establishment would remain open if its sales stopped as of today.CountWBES question COVg2
Table A2. Government stringency index.
Country30 June 202030 December 202030 June 202130 December 202130 June 202230 December 2022
Austria50.0082.4154.2846.4735.1935.19
Belgium51.8560.1950.9333.8911.1111.11
Denmark57.4151.8547.2331.6911.1111.11
France51.8563.8944.9643.7618.8111.11
Germany63.4382.4169.4442.6914.5611.11
Ireland44.4484.2650.0042.855.565.56
Luxembourg27.7867.5941.6745.8119.1211.11
Spain41.2078.7048.6143.4427.585.56
Sweden59.2669.4453.0341.4311.1111.11
Mean49.6971.1951.1341.3417.1312.55
Max63.4384.2669.4446.4735.1935.19
Min27.7851.8541.6731.695.565.56
Source: Our World in Data, https://github.com/owid/covid-19-data/tree/master/public/data, accessed on 18 May 2026.
Table A3. Logistic regressions for different forms of government support.
(a) Family control
(1)(2)(3)(4)(5)
Cash transferDeferralCreditFiscal exemp.Wage subs.
odds ratioodds ratioodds ratioodds ratioodds ratio
Family control1.173 *1.0251.364 ***0.9460.912
(0.098)(0.086)(0.130)(0.073)(0.067)
Controls as in Table 3YesYesYesYesYes
Observations49074911490848884925
Pseudo R20.2220.1250.2940.2050.241
(b) Family management
(1)(2)(3)(4)(5)
Cash transferDeferralCreditFiscal exempWage subs.
odds ratioodds ratioodds ratioodds ratioodds ratio
Family mngmt1.1801.1941.377 ***0.9660.934
(0.130)(0.133)(0.126)(0.096)(0.083)
Controls as in Table 3YesYesYesYesYes
Observations49074911490848884925
Pseudo R20.2230.1260.2950.2050.241
Standard errors clustered at the industry level in parentheses. *** p < 0.01, * p < 0.1.
Table A4. Family control: Moderating effect of government stringency (GS).
(1)(2)(3)(4)(5)(6)
Online Act.ClosedNo. WorkersSales ChangeLiquidityGovt. Support
Independent variableodds ratioodds ratioodds ratioodds ratioodds ratioodds ratio
Family control1.0221.1460.9520.9891.0530.882 ***
(0.086)(0.097)(0.042)(0.046)(0.089)(0.041)
Family control × GS1.284 *1.0520.810 *0.8610.770 **1.293 ***
(0.188)(0.163)(0.102)(0.080)(0.078)(0.129)
Control variableodds ratioodds ratioodds ratioodds ratioodds ratioodds ratio
Female top manager1.548 ***1.212 **0.819 **0.9190.839 ***1.139 **
(0.094)(0.094)(0.077)(0.070)(0.056)(0.065)
Log(business age)0.949 **1.0040.9890.887 ***1.0741.018
(0.023)(0.074)(0.032)(0.041)(0.047)(0.030)
Log(business size)1.105 ***0.9490.833 ***1.056 **1.071 *0.963
(0.024)(0.042)(0.025)(0.029)(0.039)(0.023)
Labor productivity1.0870.581 ***1.381 ***1.300 ***1.514 ***0.734 ***
(0.078)(0.038)(0.059)(0.052)(0.066)(0.043)
Informal1.136 **1.408 ***0.830 ***0.815 ***0.790 ***1.176 *
(0.073)(0.085)(0.045)(0.028)(0.043)(0.109)
Listed0.9020.9241.0790.735 **0.795 ***1.020
(0.124)(0.082)(0.063)(0.111)(0.065)(0.114)
Direct exports0.787 ***0.9360.833 ***0.809 ***0.855 ***1.174 **
(0.072)(0.133)(0.047)(0.055)(0.049)(0.085)
Retail1.0131.496 ***0.9771.296 ***1.210 **0.941
(0.101)(0.228)(0.094)(0.123)(0.090)(0.073)
Innovation index1.409 ***0.902 ***0.9730.9890.9951.075 ***
(0.040)(0.020)(0.021)(0.024)(0.023)(0.017)
Financially constr.0.9981.352 **0.527 ***0.693 ***0.349 ***1.403 ***
(0.065)(0.160)(0.040)(0.059)(0.034)(0.086)
Foreign property0.9471.247 *0.9180.881 ***0.848 **0.791 **
(0.069)(0.144)(0.082)(0.041)(0.064)(0.092)
Large city1.140 **1.118 *0.842 ***0.853 ***0.837 ***1.082 *
(0.059)(0.064)(0.040)(0.035)(0.043)(0.046)
GS0.426 ***1.2220.7421.0441.1190.715
(0.086)(0.533)(0.143)(0.208)(0.185)(0.156)
Country fixed effectsYesYesYesYesYesYes
Year fixed effectsYesYesYesYesYesYes
Observations845583118472839284318471
Pseudo R20.0590.1870.0450.0420.0610.105
Marginal effect of family control
Family control0.025 **−0.018 **−0.010−0.011−0.006−0.009
(0.012)(0.009)(0.006)(0.014)(0.014)(0.009)
Standard errors clustered at the industry level in parentheses. *** p < 0.01, ** p < 0.05, * p < 0.1.
Table A5. Family management: Moderating effect of government stringency (GS).
(1)(2)(3)(4)(5)(6)
Online Act.ClosedNo. WorkersSales ChangeLiquidityGovt. Support
Independent variableodds ratioodds ratioodds ratioodds ratioodds ratioodds ratio
Family mngmt0.8831.0031.116 **1.124 ***1.0360.826 ***
(0.074)(0.097)(0.053)(0.044)(0.068)(0.052)
Family mngmt × GS1.489 ***1.1410.814 **0.719 ***0.841 *1.167
(0.204)(0.151)(0.081)(0.079)(0.083)(0.152)
Control variableodds ratioodds ratioodds ratioodds ratioodds ratioodds ratio
Female top manager1.551 ***1.218 **0.811 **0.9180.839 ***1.150 **
(0.100)(0.098)(0.077)(0.071)(0.056)(0.066)
Log(business age)0.952 **1.0110.9790.886 ***1.0721.023
(0.023)(0.074)(0.031)(0.041)(0.048)(0.029)
Log(business size)1.098 ***0.9460.842 ***1.061 **1.072 *0.951 **
(0.026)(0.042)(0.026)(0.029)(0.038)(0.024)
Labor productivity1.0870.582 ***1.384 ***1.300 ***1.513 ***0.731 ***
(0.079)(0.038)(0.060)(0.052)(0.066)(0.043)
Informal1.143 **1.414 ***0.826 ***0.810 ***0.790 ***1.183 *
(0.075)(0.087)(0.044)(0.028)(0.043)(0.111)
Listed0.8840.9081.100 *0.745 **0.796 ***1.020
(0.125)(0.078)(0.064)(0.110)(0.063)(0.115)
Direct exports0.786 ***0.9350.838 ***0.809 ***0.855 ***1.164 **
(0.071)(0.133)(0.046)(0.053)(0.049)(0.085)
Retail1.0131.494 ***0.9811.290 ***1.219 ***0.935
(0.099)(0.231)(0.095)(0.122)(0.088)(0.073)
Innovation index1.409 ***0.902 ***0.9750.9890.9951.073 ***
(0.039)(0.020)(0.022)(0.025)(0.024)(0.017)
Financially constr.1.0001.355 **0.525 ***0.690 ***0.349 ***1.408 ***
(0.064)(0.160)(0.041)(0.060)(0.034)(0.087)
Foreign property0.9211.2090.9540.902 ***0.848 **0.776 **
(0.063)(0.140)(0.080)(0.034)(0.069)(0.088)
Large city1.136 **1.117 *0.846 ***0.856 ***0.837 ***1.077 *
(0.060)(0.064)(0.039)(0.035)(0.044)(0.047)
GS0.419 ***1.1880.705 *1.1051.0160.792
(0.081)(0.482)(0.132)(0.213)(0.147)(0.174)
Country fixed effectsYesYesYesYesYesYes
Year fixed effectsYesYesYesYesYesYes
Observations8,4558,3118,4728,3928,4318,471
Pseudo R20.0590.1870.0450.0430.0610.106
Marginal effect of family management
Family mngmt−0.0010.0120.0080.004−0.004−0.030 ***
(0.014)(0.007)(0.008)0.000 (0.011)(0.008)
Standard errors clustered at the industry level in parentheses. *** p < 0.01, ** p < 0.05, * p < 0.1.
Table A6. Weeks opened with no sales: Moderating effect of government stringency (GS).
(1)(2)
Independent variableLog(weeks)Log(weeks)
Family control−0.077 **
(0.027)
Family control × GS0.026
(0.050)
Family mngmt −0.032
(0.047)
Family mngmt × GS −0.035
(0.054)
Control variable
Female top manager−0.143 ***−0.142 ***
(0.032)(0.032)
Log(business age)0.050 ***0.048 ***
(0.014)(0.013)
Log(business size)−0.046 **−0.047 **
(0.016)(0.016)
Labor productivity0.072 *0.071 *
(0.033)(0.033)
Informal−0.061 *−0.062 *
(0.032)(0.032)
Listed0.090 *0.101 **
(0.044)(0.044)
Direct exports0.171 ***0.170 ***
(0.040)(0.041)
Retail−0.037−0.039
(0.042)(0.042)
Innovation index0.049 ***0.048 ***
(0.010)(0.010)
Financially constrained−0.446 ***−0.447 ***
(0.042)(0.042)
Foreign property0.0460.055
(0.046)(0.050)
Large city0.0280.028
(0.026)(0.026)
GS−0.274 **−0.241 **
(0.094)(0.089)
Constant2.061 ***2.047 ***
(0.381)(0.363)
Country fixed effectsYesYes
Year fixed effectsYesYes
Observations77847784
R–squared0.0840.084
Standard errors clustered at the industry level in parentheses. *** p < 0.01, ** p < 0.05, * p < 0.1.

References

  1. Calabró, A.; Frank, H.; Minichilli, A.; Suess-Reyes, J. Business families in times of crises: The backbone of family firm resilience and continuity. J. Fam. Bus. Strategy 2021, 12, 100442. [Google Scholar] [CrossRef] [Scilit]
  2. Prasad, G.; Roy, A. Resilience in crisis: A systematic review of family business literature. Manag. Rev. Q. 2024, 76, 91–126. [Google Scholar] [CrossRef] [Scilit]
  3. Thaller, J.; Mayr, S.; Feldbauer-Durstmüller, B. Crisis management in family firms: Do religion and secularization of family decision-makers’ matter? J. Fam. Bus. Manag. 2024, 14, 495–514. [Google Scholar] [CrossRef] [Scilit]
  4. Yilmaz, Y.; Raetze, S.; de Groote, J.; Kammerlander, N. Resilience in family businesses: A systematic literature review. Fam. Bus. Rev. 2024, 37, 60–88. [Google Scholar] [CrossRef] [Scilit]
  5. Galavotti, I.; D’Este, C.; Cerrato, D. A size-based contingency approach to family firms’ performance: The role of family power. J. Manag. Gov. 2025, 30, 155–190. [Google Scholar] [CrossRef] [Scilit]
  6. Miller, D.; Le Bretton-Miller, I. Family firms: A breed of extremes? Entrep. Theory Pract. 2021, 45, 663–681. [Google Scholar] [CrossRef] [Scilit]
  7. Le Bretton-Miller, I.; Miller, D. Family businesses under COVID-19: Inspiring models—Sometimes. J. Fam. Bus. Strategy 2022, 13, 100452. [Google Scholar] [CrossRef] [Scilit]
  8. Miroshnychenko, I.; Vocalelli, G.; De Massis, A.; Grassi, S.; Ravazzolo, F. The COVID-19 pandemic and family business performance. Small Bus. Econ. 2024, 62, 213–241. [Google Scholar] [CrossRef] [Scilit]
  9. Eckey, M.; Memmel, S. Impact of COVID-19 on family business performance: Evidence from listed companies in Germany. J. Fam. Bus. Manag. 2023, 13, 780–797. [Google Scholar] [CrossRef] [Scilit]
  10. Frank, H.; Suess-Reyes, J.; Fuetsch, E.; Kessler, A. Introducing the enterpriseness of business families: A research agenda. In The Palgrave Handbook of Heterogeneity Among Family Firms; Memili, E., Dibrell, C., Eds.; Palgrave Macmillan: Cham, Switzerland, 2019. [Google Scholar] [CrossRef] [Scilit]
  11. Iborra, M.; López-Muñoz, J.F.; Safón, V. Lack of resilience after COVID-19: The role of family firm heterogeneity and behavior. fsQCA versus regression. Eur. J. Manag. Bus. Econ. 2026, 35, 84–106. [Google Scholar] [CrossRef] [Scilit]
  12. Amore, M.D.; Pelucco, V.; Quarato, F. Family ownership during the Covid-19 pandemic. J. Bank. Financ. 2022, 135, 106385. [Google Scholar] [CrossRef] [Scilit]
  13. Sakib, N.H. Institutional Isomorphism. In Global Encyclopedia of Public Administration, Public Policy, and Governance; Farazmand, A., Ed.; Springer: Cham, Switzerland, 2020. [Google Scholar] [CrossRef] [Scilit]
  14. Schaedler, L.; Graf-Vlachy, L.; König, A. Strategic leadership in organizational crises: A review and research agenda. Long Range Plan. 2022, 55, 102156. [Google Scholar] [CrossRef] [Scilit]
  15. Kaftanski, W. Defining collective irrationality of COVID-19: Shared mentality, mimicry, affective contagion, and psychosocial adaptivity. Front. Psychol. 2023, 14, 1192041. [Google Scholar] [CrossRef] [Scilit]
  16. Chen, Y.; Ma, H.; Zhou, T. Learn from whom? An empirical study of enterprise digital mimetic isomorphism under the institutional environment. Economies 2024, 12, 243. [Google Scholar] [CrossRef] [Scilit]
  17. Hernandez Ortiz, T.L.; Appe, S. Coercive and mimetic isomorphic mechanisms for service provision: The creation of nonprofit organizations in Mexico before and during the COVID-19 pandemic. Public Policy Adm. 2025, 40, 126–150. [Google Scholar] [CrossRef] [Scilit]
  18. Patel, P. Rethinking family business resilience: An empirical examination of family firms’ performance amid the COVID-19 pandemic in the US. Appl. Econ. 2024, 57, 4335–4347. [Google Scholar] [CrossRef] [Scilit]
  19. Westhead, P.; Howorth, C. “Types” of private family firms: An exploratory conceptual and empirical analysis. Entrep. Reg. Dev. 2007, 19, 405–431. [Google Scholar] [CrossRef] [Scilit]
  20. Bauweraerts, J.; Arzubiaga, U.; Diaz-Moriana, V. Going greener, performing better? The case of private family firms. Res. Int. Bus. Financ. 2022, 63, 101784. [Google Scholar] [CrossRef] [Scilit]
  21. Doucet, P.; Requejo, I. Financing constraints and growth of private family firms: Evidence from different legal origins. Financ. Res. Lett. 2022, 44, 102034. [Google Scholar] [CrossRef] [Scilit]
  22. DiMaggio, P.J.; Powell, W.W. The iron cage revisited: Institutional isomorphism and collective rationality in organizational fields. Am. Sociol. Rev. 1983, 48, 147–160. [Google Scholar] [CrossRef] [Scilit]
  23. Mizruchi, M.S.; Fein, L.C. The social construction of organizational knowledge: A study of the uses of coercive, mimetic, and normative isomorphism. Adm. Sci. Q. 1999, 44, 653–683. [Google Scholar] [CrossRef] [Scilit]
  24. Berrone, P.; Cruz, C.; Gómez-Mejía, L.R. Socioemotional wealth in family firms. Fam. Bus. Rev. 2012, 25, 258–279. [Google Scholar] [CrossRef] [Scilit]
  25. Gómez-Mejía, L.R.; Herrero, I. Back to square one: The measurement of Socioemotional Wealth (SEW). J. Fam. Bus. Strategy 2022, 13, 100480. [Google Scholar] [CrossRef] [Scilit]
  26. Le Breton-Miller, I.L.; Miller, D. Family firms and practices of sustainability: A contingency view. J. Fam. Bus. Strategy 2016, 7, 26–33. [Google Scholar] [CrossRef] [Scilit]
  27. Ferrari, F. The management of family firms. In Organizational Behavior; Akande, A., Ed.; Political Dynamics in Business and Management; Springer: Cham, Switzerland, 2025. [Google Scholar] [CrossRef] [Scilit]
  28. Tabor, W.; Chrisman, J.J.; Madison, K.; Vardaman, J.M. Nonfamily members in family firms: A review and future research agenda. Fam. Bus. Rev. 2017, 31, 54–79. [Google Scholar] [CrossRef] [Scilit]
  29. Jaufenthaler, P. A safe haven in times of crisis: The appeal of family companies as employers amid the COVID-19 pandemic. J. Fam. Bus. Strategy 2023, 14, 100520. [Google Scholar] [CrossRef] [Scilit]
  30. Leppäaho, T.; Ritala, P. Surviving the coronavirus pandemic and beyond: Unlocking family firms’ innovation potential across crises. J. Fam. Bus. Strategy 2022, 13, 100440. [Google Scholar] [CrossRef] [Scilit]
  31. Soler-Porta, M.; Rodríguez Díaz, B. Family businesses overcoming the COVID-19 crisis with innovation: An exploratory analysis of the jewelry retail sector in Spain. Sustainability 2024, 16, 2259. [Google Scholar] [CrossRef] [Scilit]
  32. Zahra, S. International entrepreneurship by family firms post Covid. J. Fam. Bus. Strategy 2022, 13, 100482. [Google Scholar] [CrossRef] [Scilit]
  33. Al-Omoush, K.S.; Ribeiro-Navarrete, S.; Lassala, C.; Skare, M. Networking and knowledge creation: Social capital and collaborative innovation in responding to the COVID-19 crisis. J. Innov. Knowl. 2022, 7, 100181. [Google Scholar] [CrossRef] [Scilit]
  34. Guercini, S.; La Rocca, A.; Perna, A. The IMP research on business networks: A systematic literature review and research agenda. Ital. J. Mark. 2024, 2024, 149–175. [Google Scholar] [CrossRef] [Scilit]
  35. Klausen, K.K. Crises management as strategic coping. Scand. J. Public Adm. 2024, 28, 25–42. [Google Scholar] [CrossRef] [Scilit]
  36. Bas, T.; Muradoglu, Y.G.; Phylaktis, K. Capital structures of small family firms in developing countries. Rev. Corp. Financ. 2022, 2, 745–790. [Google Scholar] [CrossRef] [Scilit]
  37. Chen, Q.; Hou, W.; Li, W.; Wilson, C.; Wu, Z. Family control, regulatory environment, and the growth of entrepreneurial firms: International evidence. Corp. Gov. Int. Rev. 2014, 22, 132–144. [Google Scholar] [CrossRef] [Scilit]
  38. Fernandez, V. Corporate greenwashing and green management indicators. Environ. Sustain. Indic. 2025, 26, 100599. [Google Scholar] [CrossRef] [Scilit]
  39. Fernandez, V. Governing for Good? Exploring ESG challenges in family-owned, dual-led enterprises. Sustainability 2025, 17, 10692. [Google Scholar] [CrossRef] [Scilit]
  40. Agostino, M.; Ruberto, S. Environment-friendly practices: Family versus non-family firms. J. Clean. Prod. 2021, 329, 129689. [Google Scholar] [CrossRef] [Scilit]
  41. Liu, X. Applied Ordinal Logistic Regression Using Stata; Sage Publications Inc.: Thousand Oaks, CA, USA, 2016. [Google Scholar]
  42. Rehman, A.; Gonenc, H.; Hermes, N. Corporate social performance of family firms and shareholder protection: An international analysis. J. Fam. Bus. Strategy 2023, 14, 100550. [Google Scholar] [CrossRef] [Scilit]
  43. Cerulli, G. Econometric Evaluation of Socio-Economic Programs: Theory and Applications, 2nd ed.; Springer: Berlin/Heidelberg, Germany, 2022. [Google Scholar]
  44. Wooldridge, J. Econometric Analysis of Cross Section and Panel Data, 2nd ed.; The MIT Press: Cambridge, MA, USA, 2010. [Google Scholar]
  45. Roser, M. What Is the COVID-19 Stringency Index? 2021. Available online: https://ourworldindata.org/metrics-explained-covid19-stringency-index (accessed on 31 July 2024).
  46. Kodama, W.; Morgan, P.; Azhgaliyeva, D.; Trinh, L.; Kim, K. Family business during the COVID-19 pandemic in Asia: Role of government financial aid and coping strategies. World Dev. 2024, 182, 106653. [Google Scholar] [CrossRef] [Scilit]
  47. Miroshnychenko, I.; De Massis, A. Sustainability practices of family and nonfamily firms: A worldwide study. Technol. Forecast. Soc. Change 2022, 174, 121079. [Google Scholar] [CrossRef] [Scilit]
  48. Schilpzand, P.; Lagios, C.; Restubog, S.L.D. Family first: An integrative conceptual review of nepotism in organizations. Hum. Resour. Manag. 2025, 64, 157–180. [Google Scholar] [CrossRef] [Scilit]
  49. Songini, L.; Armenia, S.; Morelli, C.; Pompei, A. Managerialization, professionalization and firm performance in family business: A Systems Thinking perspective. Syst. Res. Behav. Sci. 2024, 41, 100–118. [Google Scholar] [CrossRef] [Scilit]
  50. Fernandez, V. Family entrepreneurship around the world. Int. Rev. Financ. Anal. 2023, 89, 102808. [Google Scholar] [CrossRef] [Scilit]
Figure 1. Conceptual framework. Coercive isomorphism stems from formal and informal pressures exerted on organizations by other organizations upon which they are dependent, and by cultural expectations in society. This often includes government mandates, regulations, or pressures from powerful stakeholders. Mimetic isomorphism arises in response to uncertainty. Organizations may model themselves after other organizations that they perceive to be legitimate or successful. Normative Isomorphism involves the spread of norms and standards through professional networks, education, and the credentialing of individuals. RQ1: To what extent did the economic performance of family firms converge with or diverge from that of non-family firms, reflecting isomorphic pressures? RQ2: To what extent did the institutional environment normatively shape family firms’ propensity to seek alternative forms of assistance compared to non-family firms?
World 07 00087 g001
Table 1. Sampled countries: 2019–2022.
CountryObs.Family ControlFamily Control & Mngmt
Austria60066%56%
Belgium61474%58%
Denmark99559%34%
Finland75955%41%
France156671%44%
Germany169468%48%
Ireland60681%52%
Luxembourg17052%28%
Netherlands80867%49%
Spain105170%39%
Sweden59151%23%
Total945466%44%
Table 2. Descriptive statistics: Family-controlled versus non-family-controlled firms.
All FirmsFamily-Controlled FirmsNon-Family-Controlled Firms
Firm-relatedObs.MeanS.DObs.MeanS.DObs.MeanS.D
Business age939935.6830.12624436.7230.4315533.6329.44
Business size943072.06579.16625546.38192.073175122.64959.11
Direct exports94540.240.4362680.200.4031860.310.46
Family control94540.660.47------------
Female top mngr.94380.130.3362600.140.3531780.090.29
Financially constr.94540.100.3062680.110.3131860.090.29
Foreign property93620.120.3262520.060.2431100.220.42
Informal92410.170.3761260.190.3931150.130.34
Innovation index94541.741.3462681.641.3331861.931.35
Large city94540.190.3962680.180.3931860.210.41
Listed94450.080.2762640.060.2331810.120.33
Retail94540.100.3062680.100.3031860.100.30
COVID-relatedObs.MeanS.DObs.MeanS.DObs.MeanS.D
Closed89570.290.4559330.310.4630240.230.42
Govt. support91190.570.5060470.560.5030720.570.5
Liquidity90560.620.4860170.610.4930390.640.48
No. workers chg.91170.790.4160450.790.4130720.790.41
Online activity91090.290.4660400.290.4530690.300.46
Sales change90110.550.5059890.540.5030220.570.50
Weeks opened839716.1728.12562215.4328.07277517.6628.16
Table 3. Logistic regressions for performance versus family control: full sample.
(1)(2)(3)(4)(5)(6)
Online Act.ClosedNo. WorkersSales ChangeLiquidityGovt. Support
Independent variableodds ratioodds ratioodds ratioodds ratioodds ratioodds ratio
Family control1.0951.164 **0.900 **0.9470.9770.955
(0.082)(0.089)(0.045)(0.054)(0.061)(0.041)
Control variableodds ratioodds ratioodds ratioodds ratioodds ratioodds ratio
Female top manager1.552 ***1.213 **0.817 **0.9170.837 ***1.141 **
(0.093)(0.093)(0.077)(0.069)(0.056)(0.065)
Log(business age)0.952 **1.0040.9860.885 ***1.0701.021
(0.023)(0.074)(0.032)(0.041)(0.047)(0.030)
Log(business size)1.103 ***0.9480.834 ***1.057 **1.073 **0.961 *
(0.023)(0.041)(0.025)(0.029)(0.038)(0.023)
Labor productivity1.0850.581 ***1.382 ***1.301 ***1.515 ***0.732 ***
(0.078)(0.037)(0.059)(0.052)(0.065)(0.043)
Informal1.134 **1.408 ***0.831 ***0.815 ***0.791 ***1.174 *
(0.073)(0.085)(0.045)(0.028)(0.043)(0.108)
Listed0.9080.9241.0730.732 **0.790 ***1.024
(0.123)(0.082)(0.063)(0.111)(0.063)(0.115)
Direct exports0.786 ***0.9350.835 ***0.810 ***0.857 ***1.172 **
(0.071)(0.134)(0.047)(0.055)(0.050)(0.085)
Retail0.9991.492 **0.9881.306 ***1.227 ***0.929
(0.094)(0.233)(0.099)(0.127)(0.092)(0.075)
Innovation index1.409 ***0.902 ***0.9730.9880.9951.076 ***
(0.040)(0.020)(0.022)(0.024)(0.023)(0.017)
Financially constr.0.9961.351 **0.528 ***0.694 ***0.350 ***1.399 ***
(0.065)(0.159)(0.040)(0.059)(0.034)(0.085)
Foreign property0.9541.248 *0.9130.878 ***0.842 **0.798 *
(0.070)(0.142)(0.081)(0.041)(0.064)(0.093)
Large city1.140 ***1.118 *0.842 ***0.853 ***0.837 ***1.083 *
(0.058)(0.064)(0.040)(0.035)(0.043)(0.047)
Country fixed effectsYesYesYesYesYesYes
Year fixed effectsYesYesYesYesYesYes
Observations845583118472839284318471
Pseudo R20.0590.1870.0450.0420.0610.105
Marginal effect of family control.
Family control0.0180.024 **−0.017 **−0.013−0.005−0.010
(0.015)(0.012)(0.008)(0.013)(0.013)(0.009)
Standard errors clustered at the industry level in parentheses. *** p < 0.01, ** p < 0.05, * p < 0.1.
Table 4. Linear regression for weeks opened with no sales versus family control: full sample.
Independent VariableLog(weeks)
Family control−0.070 **
(0.024)
Control variable
Female top manager−0.143 ***
(0.032)
Log(business age)0.050 ***
(0.013)
Log(business size)−0.046 **
(0.016)
Labor productivity0.072 *
(0.033)
Informal−0.062 *
(0.032)
Listed0.091 *
(0.043)
Direct exports0.171 ***
(0.040)
Retail−0.038
(0.043)
Innovation index0.049 ***
(0.010)
Financially constrained−0.446 ***
(0.042)
Foreign property0.046
(0.047)
Large city0.028
(0.026)
Constant1.801 ***
(0.419)
Country fixed effectsYes
Year fixed effectsYes
Observations7845
R20.084
Standard errors clustered at the industry level in parentheses *** p < 0.01, ** p < 0.05, * p < 0.1.
Table 5. Logistic regressions for performance versus family control in countries under more stringent health measures: Austria, Germany & Ireland.
(1)(2)(3)(4)(5)(6)
Online Act.ClosedNo. WorkersSales ChangeLiquidityGovt. Support
Independent variableodds ratioodds ratioodds ratioodds ratioodds ratioodds ratio
Family control1.303 **1.1220.8350.9450.834 ***1.087
(0.158)(0.150)(0.093)(0.126)(0.058)(0.094)
Control variableodds ratioodds ratioodds ratioodds ratioodds ratioodds ratio
Female top manager1.410 ***1.389 ***0.723 **0.9160.804 **1.251 *
(0.167)(0.159)(0.095)(0.085)(0.080)(0.160)
Log(business age)0.9570.9660.932 *0.878 **1.0101.052
(0.034)(0.076)(0.039)(0.048)(0.045)(0.044)
Log(business size)1.063 **0.9890.866 ***1.128 **0.9970.988
(0.030)(0.050)(0.039)(0.064)(0.044)(0.051)
Labor productivity1.0280.527 ***1.517 ***1.490 ***1.690 ***0.669 ***
(0.085)(0.064)(0.113)(0.132)(0.141)(0.074)
Informal1.1751.322 **0.9180.806 **0.9670.943
(0.151)(0.184)(0.132)(0.083)(0.095)(0.104)
Listed0.9831.1971.0340.6370.7620.794
(0.234)(0.371)(0.257)(0.189)(0.208)(0.188)
Direct exports0.582 ***0.522 ***1.1091.0961.254 ***0.899
(0.083)(0.095)(0.104)(0.176)(0.099)(0.174)
Retail1.248 ***0.710 *1.958 ***1.899 ***1.372 ***0.706 ***
(0.100)(0.144)(0.179)(0.237)(0.113)(0.061)
Innovation index1.467 ***0.881 ***0.9720.9840.9291.054
(0.084)(0.032)(0.037)(0.045)(0.043)(0.038)
Financially constr.1.1651.264 **0.427 ***0.579 ***0.283 ***1.741 ***
(0.188)(0.131)(0.080)(0.075)(0.029)(0.331)
Foreign property1.0841.476 ***0.583 ***0.8320.8890.890
(0.241)(0.214)(0.076)(0.160)(0.105)(0.191)
Large city1.1581.484 ***0.8940.9421.1631.167
(0.131)(0.184)(0.128)(0.122)(0.172)(0.163)
Country fixed effectsYesYesYesYesYesYes
Year fixed effectsYesYesYesYesYesYes
Observations256425622563255025612565
Pseudo R20.0550.1480.0730.0550.0780.068
Marginal effect of family control
Family control0.050 **0.019−0.027−0.013−0.039 ***0.019
(0.022)(0.022)(0.018)(0.030)(0.015)(0.019)
Standard errors clustered at the industry level in parentheses. *** p < 0.01, ** p < 0.05, * p < 0.1.
Table 6. Logistic regression for performance versus family management: full sample.
(1)(2)(3)(4)(5)(6)
Online Act.ClosedNo. WorkersSales ChangeLiquidityGovt. Support
Independent variableodds ratioodds ratioodds ratioodds ratioodds ratioodds ratio
Family mngmt1.0021.0491.0461.0110.9800.869 ***
(0.079)(0.081)(0.054)(0.033)(0.051)(0.033)
Control variableodds ratioodds ratioodds ratioodds ratioodds ratioodds ratio
Female top manager1.560 ***1.220 **0.808 **0.9130.837 ***1.153 **
(0.099)(0.098)(0.077)(0.069)(0.057)(0.066)
Log(business age)0.958 *1.0130.9760.881 ***1.0691.026
(0.023)(0.073)(0.032)(0.042)(0.048)(0.029)
Log(business size)1.098 ***0.9460.842 ***1.061 **1.072 *0.951 **
(0.025)(0.042)(0.026)(0.029)(0.038)(0.024)
Labor productivity1.0840.582 ***1.386 ***1.302 ***1.514 ***0.730 ***
(0.079)(0.038)(0.060)(0.052)(0.066)(0.043)
Informal1.137 **1.411 ***0.828 ***0.814 ***0.791 ***1.181 *
(0.074)(0.086)(0.044)(0.027)(0.042)(0.110)
Listed0.8950.9121.0930.739 **0.792 ***1.024
(0.123)(0.080)(0.063)(0.110)(0.062)(0.117)
Direct exports0.784 ***0.9330.839 ***0.812 ***0.856 ***1.163 **
(0.069)(0.134)(0.047)(0.055)(0.049)(0.084)
Retail0.9981.486 **0.9891.307 ***1.227 ***0.930
(0.094)(0.233)(0.099)(0.127)(0.092)(0.075)
Innovation index1.408 ***0.902 ***0.9750.9890.9951.073 ***
(0.039)(0.020)(0.022)(0.024)(0.024)(0.017)
Financially constr.0.9961.352 **0.527 ***0.693 ***0.350 ***1.405 ***
(0.064)(0.160)(0.040)(0.059)(0.034)(0.087)
Foreign property0.9321.214 *0.9470.892 ***0.843 **0.780 **
(0.064)(0.140)(0.079)(0.034)(0.069)(0.088)
Large city1.139 **1.117 *0.845 ***0.854 ***0.837 ***1.079 *
(0.059)(0.065)(0.040)(0.035)(0.044)(0.047)
Country fixed effectsYesYesYesYesYesYes
Year fixed effectsYesYesYesYesYesYes
Observations845583118472839284318471
Pseudo R20.0580.1860.0450.0420.0610.106
Marginal effect of family management
Family management0.0000.0080.0070.003−0.004−0.030 ***
(0.015)(0.012)(0.008)(0.008)(0.011)(0.008)
Standard errors clustered at the industry level in parentheses. *** p < 0.01, ** p < 0.05, * p < 0.1.
Table 7. Multinomial logistic model for forms of government support: full sample.
(1)(2)(3)(4)(5)(6)
Cash & DeferralFiscal & WageBothCash & DeferralFiscal & WageBoth
Independent variableodds ratioodds ratioodds ratioodds ratioodds ratioodds ratio
Family control0.9630.8681.028
(0.078)(0.078)(0.070)
Family mngmt 0.9130.779 ***0.936
(0.080)(0.061)(0.052)
Control variableodds ratioodds ratioodds ratioodds ratioodds ratioodds ratio
Female top manager1.0930.9791.274 ***1.1010.9951.284 ***
(0.126)(0.066)(0.085)(0.126)(0.067)(0.088)
Log(business age)0.9431.077 *1.0100.9451.082 *1.016
(0.037)(0.047)(0.045)(0.040)(0.044)(0.044)
Log(business size)0.851 ***1.074 **0.9830.846 ***1.0560.975
(0.025)(0.032)(0.033)(0.026)(0.037)(0.035)
Labor productivity0.770 ***0.844 **0.625 ***0.769 ***0.837 ***0.623 ***
(0.036)(0.057)(0.054)(0.036)(0.057)(0.054)
Informal1.159 *1.0991.337 ***1.164 *1.1041.341 ***
(0.095)(0.123)(0.131)(0.094)(0.125)(0.134)
Listed1.1291.0620.9641.1301.0760.958
(0.256)(0.173)(0.113)(0.255)(0.182)(0.118)
Direct exports1.211 ***1.290 **1.1361.204 ***1.275 **1.129
(0.084)(0.139)(0.119)(0.083)(0.137)(0.120)
Retail1.0510.838 **0.9091.0530.840 **0.909
(0.073)(0.065)(0.091)(0.071)(0.067)(0.092)
Innovation index1.123 ***1.0481.065 **1.121 ***1.0441.064 **
(0.026)(0.039)(0.028)(0.026)(0.038)(0.028)
Financially constr.1.397 ***0.9381.776 ***1.402 ***0.9431.781 ***
(0.153)(0.124)(0.111)(0.154)(0.126)(0.112)
Foreign property0.550 ***1.0130.755 **0.544 ***0.9930.738 **
(0.084)(0.097)(0.105)(0.080)(0.093)(0.097)
Large city1.0120.9451.151 **1.0100.9411.148 **
(0.103)(0.097)(0.066)(0.103)(0.098)(0.066)
Country fixed effectsYesYesYesYesYesYes
Year fixed effectsYesYesYesYesYesYes
Pseudo R20.170.17
Observations82208220
Standard errors clustered at the industry level in parentheses. *** p < 0.01, ** p < 0.05, * p < 0.1. Note: Cash & deferral: cash transfers for businesses; deferral of credit payments, rent or mortgage, suspension of interest payments, or rollover of debt; and access to new credit. Fiscal & wage: fiscal exemptions or reductions; and wage subsidies.
Table 8. Endogenous treatment.
(a) Family control
Online activity
Average treatment effectCoef. Robust s.ezp > |z|95% conf. intervalObs.
Family control (Yes vs. No)0.0950.0481.960.050.0000.1877162
Closed
Average treatment effectCoef.Robust s.ezp > |z|95% conf. intervalObs.
Family control (Yes vs. No)0.1850.0483.870.000.0920.2797024
No. of workers change
Average treatment effectCoef.tRobust s.ezp > |z|95% conf. intervalObs.
Family control (Yes vs. No)0.0410.0560.720.47−0.0590.1517178
Sales change
Average treatment effectCoef.Robust s.ezp > |z|95% conf. intervalObs.
Family control (Yes vs. No)0.0440.061−0.720.47−0.0430.0147106
Liquidity
Average treatment effectCoef.Robust s.ezp > |z|95% conf. intervalObs.
Family control (Yes vs. No)−0.0560.053−1.050.29−0.1590.0487148
Government support
Average treatment effectCoef.Robust s.ezp > |z|95% conf. intervalObs.
Family control (Yes vs. No)0.0320.0670.490.63−0.0980.1637181
(b) Family management
Online activity
Average treatment effectCoef.Robust s.ezp > |z|95% conf. intervalObs.
Family mngmt (Yes vs. No)0.0220.0470.470.64−0.0690.1137162
Closed
Average treatment effectCoef.Robust s.ezp > |z|95% conf. intervalObs.
Family mngmt (Yes vs. No)0.1730.0463.790.000.0840.2627024
No. of workers change
Average treatment effectCoef.Robust s.ezp > |z|95% conf. intervalObs.
Family mngmt (Yes vs. No)0.0940.0362.640.010.0240.1647178
Sales change
Average treatment effectCoef.Robust s.ezp > |z|95% conf. intervalObs.
Family mngmt (Yes vs. No)−0.0010.046−0.010.99−0.0910.0897106
Liquidity
Average treatment effectCoef.tRobust s.ezp > |z|95% conf. intervalObs.
Family mngmt (Yes vs. No)0.0410.0460.910.36−0.0470.1287148
Government support
Average treatment effectCoef.Robust s.ezp > |z|95% conf. intervalObs.
Family mngmt (Yes vs. No)−0.0940.047−2.000.05−0.187−0.0027181
Note: The explanatory variables of the outcome model are the same as those of Table 3 and Table 6. The explanatory variables of the treatment model (family control/management) are the top manager’s previous experience in a multinational firm (i.e., a measure of human capital), dual leadership (i.e., top manager and owner are the same person), female ownership, log(age of the firm), log(size of the firm), listed firm, foreign property, large city, year and country. A Wald test of endogeneity (H0: treatment and outcome unobservable factors are uncorrelated) provides the following p-values (p) in panel (a): Online activity: p = 0.18; Closed: p = 0.00; No. workers change: p = 0.32; Sales change: p = 0.50; Liquidity: p = 0.05; Gov. support: p = 0.60; and, in panel (b): Online activity: p = 0.69; Closed: p = 0.00; No. workers change: p = 0.05; Sales change: p = 0.99; Liquidity: p = 0.27; Gov. support: p = 0.46.
Disclaimer/Publisher’s Note: The statements, opinions and data contained in all publications are solely those of the individual author(s) and contributor(s) and not of MDPI and/or the editor(s). MDPI and/or the editor(s) disclaim responsibility for any injury to people or property resulting from any ideas, methods, instructions or products referred to in the content.