Article

Sustainability and Techno-Economic Analysis of a Power-to-Hydrogen Process Employing Low and High-Temperature Water Electrolysis


Department of Chemical Engineering, College of Engineering, Qatar University, Doha P.O. Box 2713, Qatar
*
Author to whom correspondence should be addressed.
Fuels 2026, 7(3), 64; https://doi.org/10.3390/fuels7030064 (registering DOI)
Submission received: 19 July 2026 / Revised: 3 September 2026 / Accepted: 15 September 2026 / Published: 21 September 2026
(This article belongs to the Special Issue Sustainability Assessment of Renewable Fuels Production)

Abstract

An integrated power-to-low-carbon hydrogen process is proposed in which a natural gas–fired Allam–Fetvedt (AF) supercritical carbon dioxide (CO2) cycle supplies electricity and process water to low- and high-temperature electrolyzers based on proton exchange membrane (PEM), anion exchange membrane (AEM), and solid oxide electrolyzer (SOE) technologies. The novelty of this study is the development of a unified process-level framework that combines Aspen HYSYS simulation, techno-economic analysis, and multidimensional sustainability assessment to compare AF-integrated PEM, AEM, and SOE hydrogen production pathways under the same 437 MW-net power basis. Detailed steady-state simulations were carried out in Aspen HYSYS for an AF cycle producing approximately 795 MW of gross electrical power and 437 MW of net electrical power after internal and auxiliary power consumption. The resulting 437 MW net output was used as the fixed electrical input for the PEM, AEM, and SOE configurations to ensure a consistent comparison among the three electrolysis pathways. The resulting mass and energy balances were coupled with a methodological sustainability assessment framework that aggregates 44 indicators grouped into four dimensions: material, energy, environmental, and economic performance. Techno-economic analysis included capital expenditure (CAPEX), operating expenditure (OPEX), levelized cost of hydrogen (LCOH), and 25-year cash-flow metrics at a 10% discount rate with oxygen (O2) by-product credit. All integrated schemes achieved high material and environmental efficiencies, with normalized scores exceeding 95% and approximately 97%, respectively. The AF–electrolyzer system was internally water self-sufficient, while the O2 by-product supplied approximately 25–30% of the AF cycle oxygen demand. Energy efficiency was moderate but technology-dependent, with AF+SOE outperforming AF+PEM and AF+AEM due to higher electrolysis efficiency and stronger heat-integration potential. The main limitation was economic, as LCOH varied between approximately 4.3 and 7.3 $ kg−1 hydrogen (H2) across optimistic and pessimistic CAPEX/OPEX scenarios. Overall sustainability scores of 81.4%, 80.3%, and 83.0% for AF+PEM, AF+AEM, and AF+SOE, respectively, show that all three pathways are viable low-carbon hydrogen options, while AF+SOE provides the strongest combined energy, environmental, and techno-economic performance.

1. Introduction

The substantial global dependence on fossil fuels for energy generation has led to significant environmental issues. Consequently, the reduction of carbon emissions has emerged as an essential issue [1]. In this context, hydrogen is garnering global attention due to its significant potential as a primary energy carrier and in both mobile and fixed energy applications, offering an alternative solution to this dilemma [2,3]. Significantly reducing the cost of hydrogen generation is essential for its widespread acceptance and the further advancement of the hydrogen economy [4].
Advancing new technologies and improving existing processes in line with sustainability criteria is essential for delivering cleaner and more affordable energy while avoiding additional economic and energetic penalties [5]. Yet, designing genuinely sustainable industrial processes remains a major and ongoing challenge for the chemical sector at the global scale [6]. Embedding sustainability considerations directly into process design helps move toward this goal by preventing or reducing negative impacts, but robustly quantifying sustainability performance and using those results to support sound decision-making is both critical and nontrivial [6,7]. Accordingly, there is a clear need for a structured methodological framework that can capture and abstract complex process behavior and, at the same time, provide transparent analysis and communication through well-chosen sustainability indicators [8].
Hydrogen can be produced through several technological pathways that differ significantly in feedstock, energy source, carbon intensity, maturity, and cost. Conventional thermochemical routes remain dominant in industrial hydrogen production. Steam methane reforming (SMR) and autothermal reforming (ATR) convert methane or other light hydrocarbons into hydrogen-rich gas, but these processes are associated with substantial CO2 emissions unless coupled with carbon capture and storage. Coal gasification and heavy hydrocarbon reforming can also produce hydrogen at large scale, although their environmental footprint is generally higher. Biomass-based thermochemical pathways, including gasification and pyrolysis, offer a potential renewable or waste-derived route to hydrogen, depending on biomass availability, process efficiency, tar management, and life-cycle carbon balance. Methane pyrolysis has also attracted attention because it converts methane into hydrogen and solid carbon instead of directly producing CO2; however, high-temperature heat supply, reactor design, catalyst stability, and carbon handling remain major challenges.
In addition to thermochemical pathways, biological and biochemical hydrogen production routes have been widely investigated. These include dark fermentation, photofermentation, microbial electrolysis cells, biophotolysis, and algae- or bacteria-assisted hydrogen generation. Such routes can operate under mild conditions and may use wastewater, organic residues, or biomass-derived substrates as feedstocks. However, their large-scale implementation is still limited by relatively low hydrogen productivity, sensitivity to operating conditions, downstream gas separation requirements, microbial stability, and scale-up challenges. Hybrid bio-photoelectrochemical systems have also been proposed to enhance hydrogen generation by combining biological activity with light-harvesting materials or electrochemical assistance.
Unlike the thermochemical and biochemical routes, water electrolysis provides a direct electrochemical pathway in which H2O is split into H2 and O2. The main advantage of electrolysis is that hydrogen is generated without direct carbon-containing process emissions at the electrolyzer. However, the overall carbon intensity and hydrogen classification strongly depend on the electricity source. When electrolysis is powered by renewable electricity, the product can be classified as green hydrogen, whereas electrolysis powered by low-carbon fossil-based power with integrated CO2 capture is more appropriately described as low-carbon electrolytic hydrogen. In this context, proton exchange membrane (PEM), anion exchange membrane (AEM), and solid oxide electrolyzer (SOE) technologies are particularly relevant because they represent different low- and high-temperature electrolysis options with distinct efficiency, cost, maturity, and integration characteristics. The present study builds on this broader hydrogen production landscape by evaluating a low-carbon power-to-hydrogen pathway in which a natural gas–fired Allam–Fetvedt (AF) supercritical CO2 power cycle supplies electricity and recovered water to PEM, AEM, and SOE electrolyzers. The objective is not to replace the discussion of conventional hydrogen production routes, but to assess whether an AF-integrated electrolysis system can provide a competitive and sustainability-oriented alternative by combining low-carbon electricity generation, CO2 capture/recycling, internal water utilization, oxygen by-product recovery, techno-economic analysis, and multidimensional sustainability assessment.
Global hydrogen demand approximates 70 million metric tons annually, with nearly all production derived from fossil sources. Approximately 50% is derived from the reforming of natural gas and refinery gas, while around 30% is acquired as a by-product of chemical synthesis. Coal gasification accounts for approximately 18% of global hydrogen production, whereas electrolysis constitutes merely about 4% [9,10]. Economic considerations predominantly influence the selection of production technology: hydrogen derived from natural gas is around $2 per kilogram and generates life-cycle emissions of 11.8 kg CO2-equivalent per kilogram of H2 produced. Conversely, the present cost of hydrogen production using electrolysis is expected to be between $5 and $6 per kilogram [11].
Electrolysis, utilizing clean energy, offers a more environmentally sustainable method for chemical synthesis. The production of green hydrogen using water electrolysis is now commercially viable, with significant projects poised to commence operations. Additionally, modern systems can utilize treated wastewater as a feedstock, reducing freshwater usage and facilitating resource recovery [12]. In contrast to several thermal or catalytic approaches, electrochemical processes function at comparatively low temperatures and pressures, making them ideal for decentralized, modular implementation, where the scale of the plant minimally affects cost and efficiency. They furthermore provide adaptable and dynamic operations. Transitioning from centralized to decentralized arrangements can enhance the sustainability of hydrogen supply and expand its use across several sectors [13].
The AF cycle is an oxy-fuel, supercritical CO2 Brayton power cycle that generates dispatchable energy and concurrently produces a high-purity, pipeline-ready CO2 stream at about 150 bar, thus obviating the necessity for post-combustion capture technology [14,15]. The AF cycle, when fueled by natural gas, generates negligible carbon emissions; when utilizing syngas derived from biomass, municipal solid waste, or renewable natural gas, the resultant power can be categorized as renewable or potentially carbon negative [16,17]. Captured CO2 can be directed to electrochemical CO2 reduction units to produce CO or syngas, thereby establishing a power-to-molecules hub near the plant. The AF cycle produces a nearly pure, dry, pressurized CO2 stream, so substantially diminishing the necessity for upstream gas conditioning in electrochemical CO2 reduction, requiring only pressure adjustment to align with the electrolyzer’s operational range. Furthermore, utilizing the oxygen by-product from water electrolysis to partially fulfill the air-separation oxygen requirements of the AF cycle is a recognized method in oxy-fuel system integrations, improving overall energy efficiency [18,19]. An AF power facility integrated with on-site H2O electrolysis creates a compact system for generating low-carbon or renewable electricity and green hydrogen, with the potential to sequester excess CO2 to attain zero emissions, contingent upon fuel selection and the carbon intensity of the grid.
Although the proposed AF–electrolyzer configuration uses natural gas in the power-generation block, it differs fundamentally from conventional natural gas–based hydrogen production routes such as steam methane reforming, autothermal reforming, or methane pyrolysis. In conventional blue hydrogen production, methane is directly converted into hydrogen-rich gas, and the associated CO2 is subsequently captured. In methane pyrolysis, methane is decomposed into hydrogen and solid carbon, avoiding direct CO2 formation but requiring high-temperature thermal or catalytic operation and reliable carbon handling. In the present AF–electrolyzer system, however, hydrogen is produced from water electrolysis, while natural gas is used indirectly to generate low-carbon electricity through the Allam–Fetvedt cycle with integrated CO2 capture/recycling. Therefore, the proposed process is better described as a low-carbon power-to-hydrogen pathway rather than a conventional natural-gas-to-hydrogen pathway.
The novelty of this study does not arise from the individual application of the Allam–Fetvedt cycle or PEM, AEM, and SOE electrolysis technologies, which have previously been investigated separately. Instead, the contribution of this work is the development of a unified process-level framework in which three electrolysis technologies with substantially different operating temperatures, efficiencies, maturity levels, and cost structures are integrated with the same 437 MW-net natural gas–fired Allam–Fetvedt power cycle and evaluated under an identical system boundary. Unlike studies focusing primarily on standalone electrolysis, renewable-powered electrolysis, or conventional natural gas–based hydrogen production, the present work simultaneously integrates Aspen HYSYS-based mass and energy balances, electrolyzer-specific hydrogen and oxygen production, internal water recovery, oxygen recycling to the AF cycle, CAPEX and OPEX estimation, levelized cost of hydrogen, 25-year cash-flow analysis, and a 44-indicator sustainability framework covering material, energy, environmental, and economic dimensions. An additional methodological contribution of this study is the use of sustainability assessment as a systematic decision-support framework rather than as a descriptive post-processing step. The sustainability methodology provides a structured way to translate complex process-simulation and economic results into a common set of normalized indicators, thereby enabling the alternative configurations to be compared consistently across multiple dimensions that cannot be captured by a single performance metric. This is particularly important because a process option that performs well in terms of hydrogen productivity or economics may not necessarily provide the strongest material, energy, or environmental performance. By evaluating the three configurations simultaneously through material, energy, environmental, and economic indicators, the proposed framework makes the trade-offs among competing design objectives explicit and provides a more comprehensive basis for technology screening and process selection. Maintaining the same AF power basis, system boundary, and methodological assumptions for all three configurations further enables the influence of electrolyzer technology itself to be distinguished from differences resulting from plant capacity, power source, or assessment methodology. Therefore, the proposed framework not only identifies the most promising AF-integrated electrolysis pathway, but also systematically reveals the technical, energetic, environmental, material, and economic factors governing its overall performance. In this way, the study demonstrates the importance of integrating process simulation, techno-economic analysis, and multidimensional sustainability assessment within a single consistent methodology for early-stage design and comparison of low-carbon hydrogen production systems.
The main objective of this study is to assess the techno-economic feasibility and multidimensional sustainability performance of an integrated power-to-hydrogen system based on a 437 MW-net natural gas–fired Allam–Fetvedt supercritical CO2 cycle coupled with low- and high-temperature water electrolysis technologies, including PEM, AEM, and SOE. This work emphasizes the systematic evaluation of the proposed AF–electrolyzer pathways in terms of techno-economic feasibility and integrated sustainability performance across material, energy, environmental, and economic dimensions. Specifically, the study aims: (i) to generate consistent mass and energy balance data for each AF–electrolyzer configuration using Aspen HYSYS simulations as the technical basis for assessment; (ii) to quantify and compare the economic viability of each pathway through CAPEX and OPEX estimation, levelized cost of hydrogen, cumulative and discounted cash-flow analysis, NPV, and payback period over a 25-year plant lifetime; and (iii) to conduct a comprehensive sustainability assessment using a harmonized indicator framework covering material, energy, environmental, and economic dimensions. By integrating technical, economic, and sustainability indicators, the study provides a comparative feasibility assessment of PEM-, AEM-, and SOE-based configurations and identifies the most promising pathway for sustainable hydrogen production.

2. Integrated Proposed Process Description

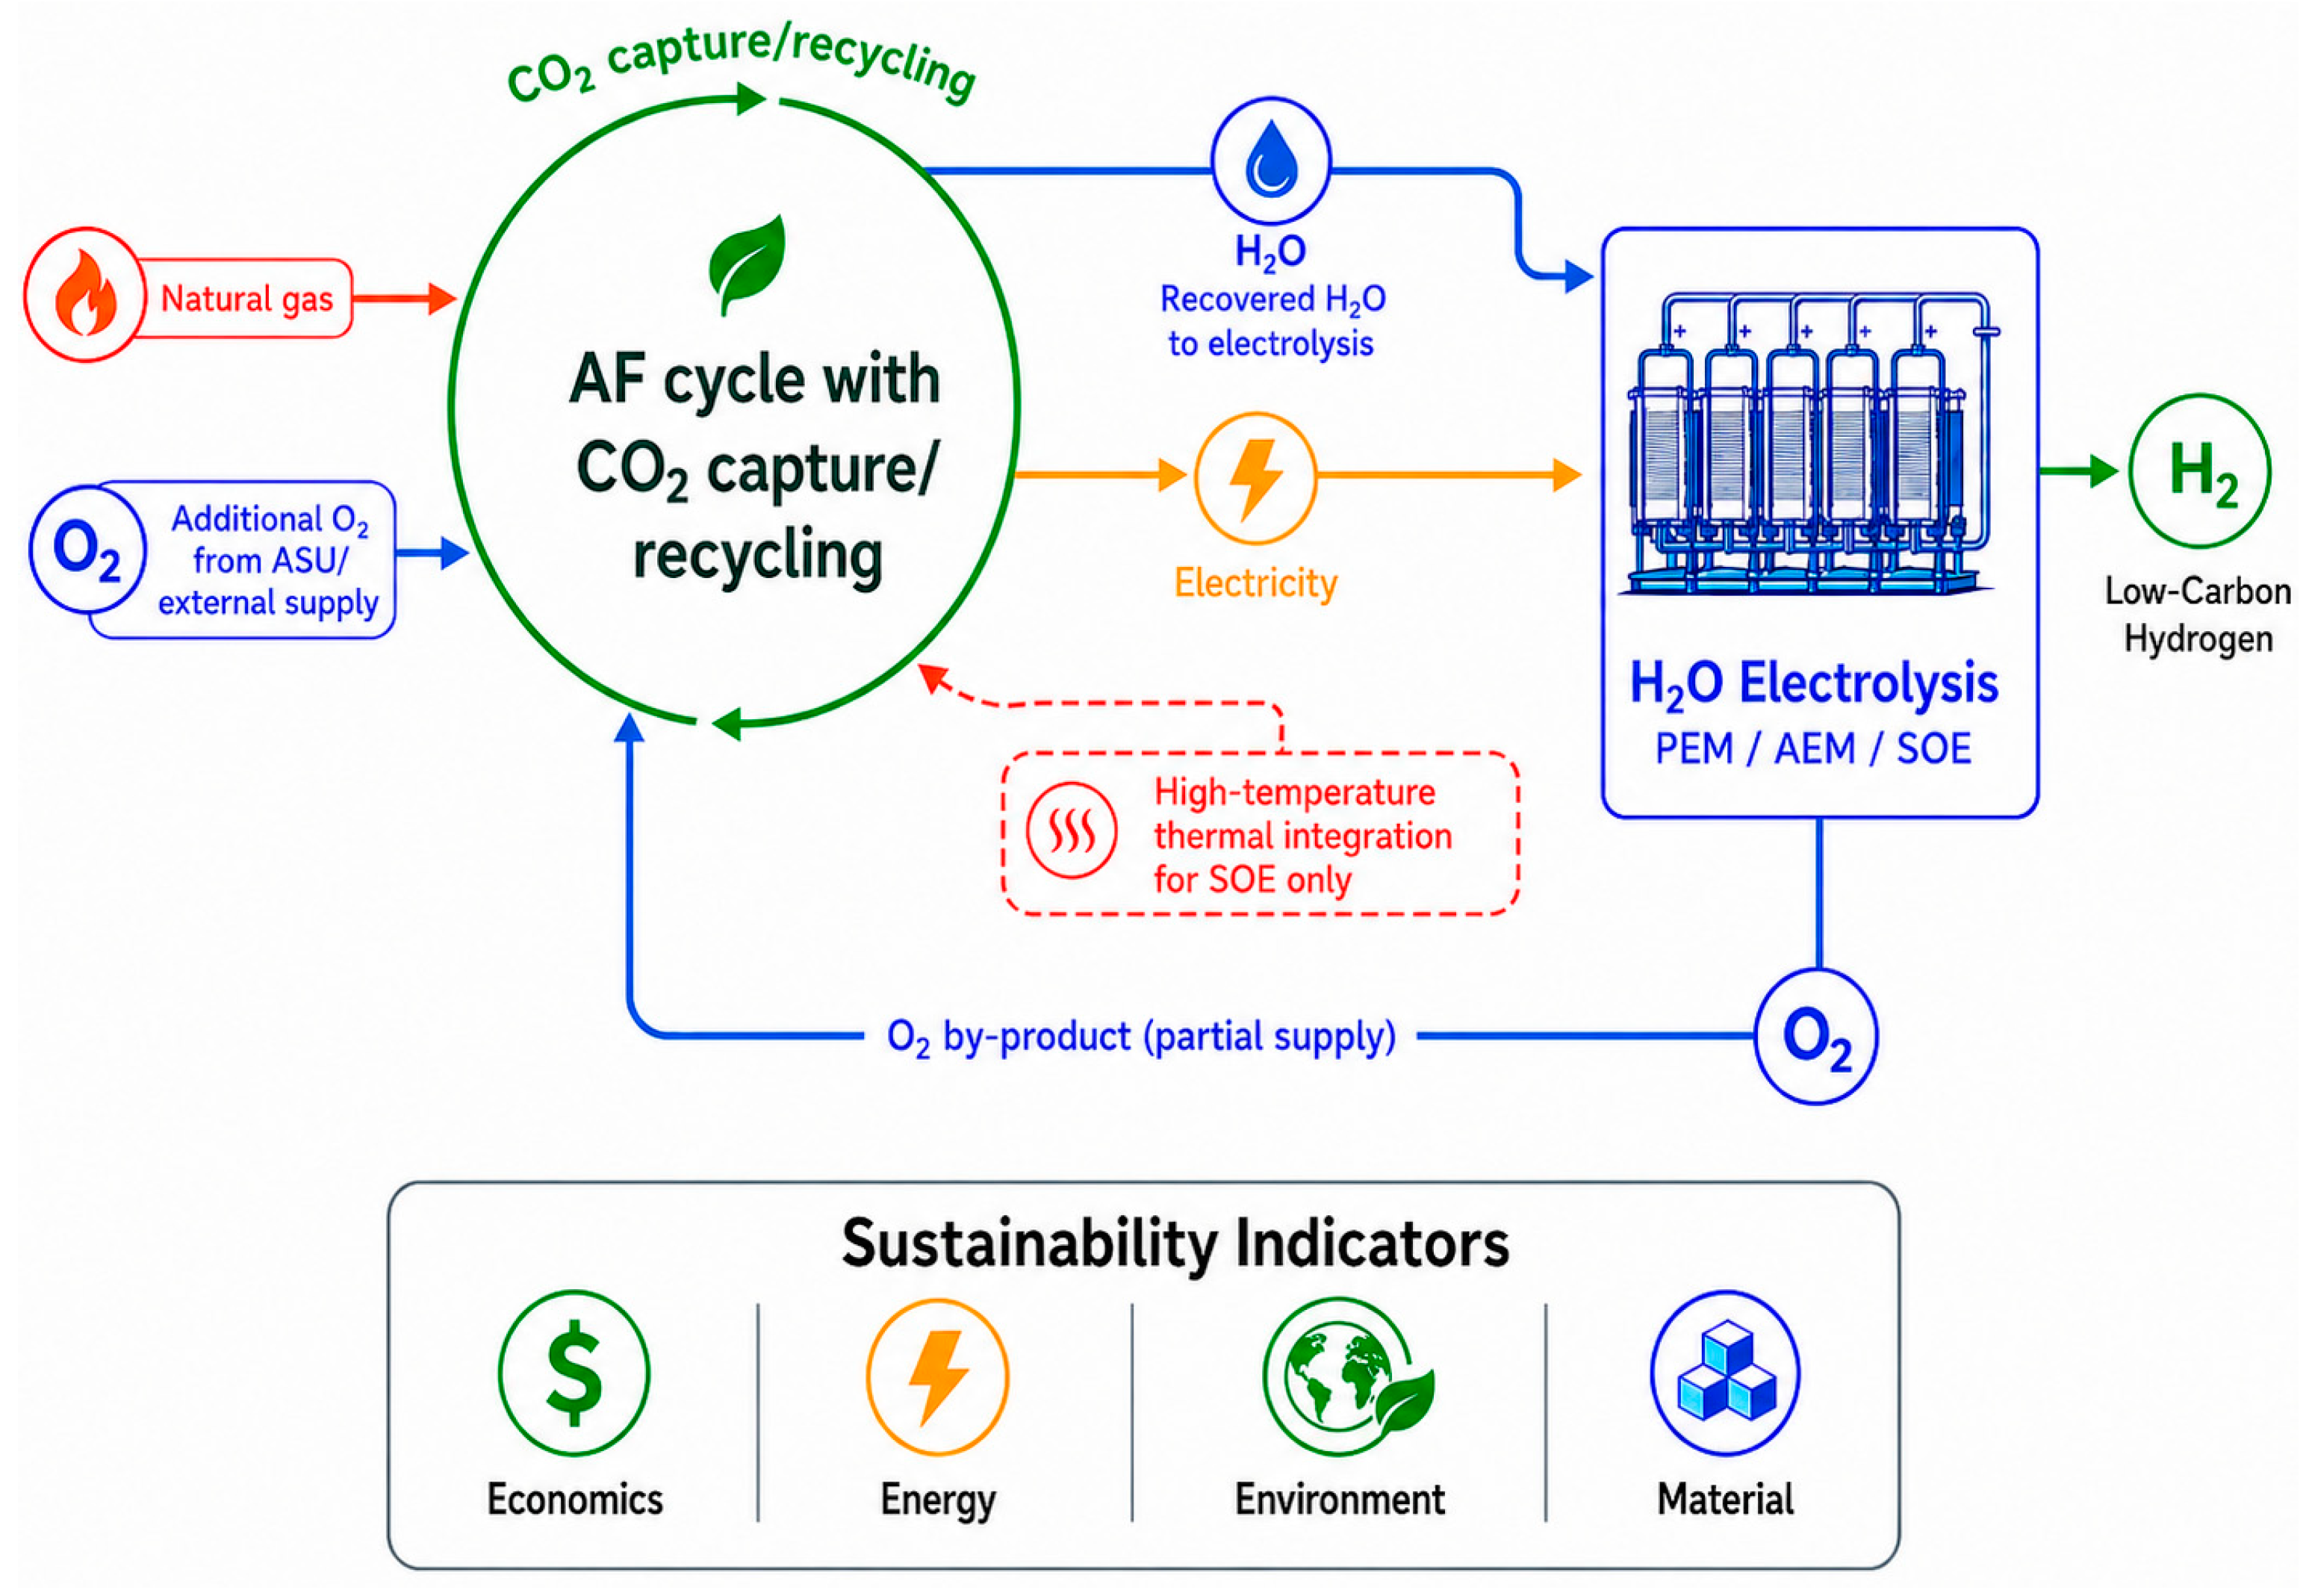
Figure 1 shows the proposed integrated configuration, in which a natural gas–fired Allam cycle (additional details are provided in the Supplementary Material) is coupled to a low/high-temperature water electrolysis section based on PEM, SOE, and AEM technologies. Natural gas enters the Allam combustor together with a high-purity oxygen stream, and combustion occurs in a CO2-rich, high-pressure environment. The resulting hot CO2/H2O mixture is expanded through a turbine to generate electricity. Downstream of the turbine, the working fluid is cooled; most of the CO2 is recycled to maintain the supercritical CO2 loop, while a controlled portion of the CO2 and H2O is withdrawn.
The H2O stream is supplied to an electrolyzer powered by the electricity generated in the Allam cycle. Inside this unit, water is electrochemically split at the cathode to form H2, while high-purity O2 is produced at the anode. Hydrogen is withdrawn as a valuable intermediate for direct use or for downstream fuel and chemical synthesis, whereas the oxygen is routed back to the Allam combustor. Taken together, Figure 1 illustrates a closely integrated, low-carbon configuration in which the Allam cycle provides both electrical energy and a CO2/H2O process stream, and the electrolysis section converts these combustion products into H2 while simultaneously supplying the oxygen required for oxy-fuel combustion. This arrangement improves resource utilization, keeps CO2 circulating in a closed loop, and allows flexible co-production of power and hydrogen from natural gas.
Hence, the overarching aim of the proposed system is to drive direct CO2 emissions close to zero by retaining all CO2 in a closed internal loop rather than releasing it to the atmosphere, while the integrated configuration generates all of the electricity required for electrolysis so that the plant operates as a largely self-sufficient, fully electrified process with minimal dependence on external power. At the same time, the concept is designed to move toward a truly sustainable process by improving energy efficiency, promoting material circularity, ensuring economic competitiveness, and reducing the overall environmental footprint.

Water Electrolysis

In this part of the proposed process, the electrolyzer units provide the key function of converting H2O into hydrogen and oxygen by using electrical power generated by the Allam–Fetvedt power cycle. Throughout the evolution of water electrolysis, four major technology classes have emerged. These are typically distinguished by the type of electrolyte employed, the temperature at which they operate, and the primary charge-carrying ion (OH, H+, or O2−): (i) alkaline electrolyzers, (ii) AEM electrolyzers, (iii) PEM electrolyzers, and (iv) solid oxide (SO) electrolyzers. Although they differ in cell architecture, materials, and operating conditions, all of these technologies rely on the same fundamental electrochemical mechanisms. In practical applications, the selection of a specific electrolyzer type is guided by factors such as the targeted temperature and pressure range, investment and running costs, scalability, compatibility with intermittent renewable electricity, and the required hydrogen quality. Among the currently available options, PEM, AEM, and SO systems are considered the most pertinent for advanced and next-generation applications [20,21,22].
PEM, AEM, and SOE electrolyzers were selected for comparison because they represent three relevant low- and high-temperature electrolysis pathways with different levels of technological maturity, operating conditions, efficiency, and cost structure. PEM electrolyzer cells employ a solid proton-conducting polymer membrane and usually operate in the range of 50–80 °C, at pressures from atmospheric up to elevated levels when pressurized hydrogen is desired. In industrial and pilot-scale installations, typical current densities are 0.5–2.0 A cm−2 with individual cell voltages on the order of 1.7–2.2 V, depending on factors such as catalyst loading and stack architecture [23]. AEM electrolyzers are commonly run at 25–60 °C and near-ambient pressure, with reported current densities of roughly 0.1 to about 1 A cm−2 and cell voltages generally in the 2.5–3.5 V range, subject to the specific catalyst–membrane combination employed [24]. SOEs are typically operated at 650–850 °C and near-atmospheric pressure, with reported current densities on the order of 0.3–1.5 A cm−2 and cell voltages generally in the 1.1–1.5 V range, depending on the electrode materials, microstructure, and gas composition [25]. The practical overall efficiencies of SOE, PEM, and AEM electrolyzers generally lie on the order of 70–85%, 60–75%, and 55–70%, respectively [26]. Electrolyzers are assembled as stacks comprising many single cells connected in series and/or in parallel to achieve the desired hydrogen production rate. The required cell count per stack is set by the available electrical power, the targeted output capacity, and the constraints of the overall plant design. Commercial and industrial modules therefore contain from several hundred up to many thousands of cells, and large stacks routinely incorporate a few hundred to well beyond a thousand individual cells. The present work is a conceptual process-design, techno-economic, and sustainability assessment rather than a site-specific feasibility study. Accordingly, the proposed AF–electrolyzer configurations are not assigned to a particular country or geographical location. Country-dependent parameters such as local natural gas prices, electricity tariffs, labor costs, taxation, carbon-pricing mechanisms, subsidies, financing incentives, and hydrogen-transport infrastructure are therefore excluded from the base-case comparison. Instead, PEM-, AEM-, and SOE-based configurations are evaluated using the same process boundary, the same 437 MW-net electrical basis, and consistent literature-derived technical and economic assumptions. This approach is intentionally adopted to isolate the effect of electrolyzer technology on the comparative performance of the integrated system. Consequently, the calculated LCOH, NPV, payback period, and sustainability scores should be interpreted as comparative process-level estimates and not as predictions for a specific national hydrogen market. For the temporal boundary of the techno-economic assessment, all equipment and technology costs are expressed on a common cost basis. Cost data reported in earlier literature sources are adjusted to this reference year using the adopted cost-index methodology. The techno-economic assessment adopts 2026 as the common economic reference year, while project cash flows are evaluated over a 25-year plant lifetime using a 10% discount rate. Technology efficiencies and CAPEX/OPEX ranges represent the literature values adopted for the reference conditions considered in this study. Future application of the framework to a specific country would require replacement of the generic economic assumptions with location-specific fuel prices, labor costs, financing conditions, carbon policies, incentives, and infrastructure costs.

3. Methodology

3.1. Process Simulation

The process simulations of the Allam–Fetvedt power cycle and the associated electrolyzer configurations were carried out in Aspen HYSYS V13. The simulated Allam–Fetvedt power block produces a net electrical output of approximately 437 MW under the operating conditions adopted in this study. This value represents the electrical power remaining after accounting for the internal power requirements of the AF process and associated auxiliary operations. The 437 MW net output was therefore adopted as the common fixed electrical-power basis for the subsequent PEM, AEM, and SOE calculations. Maintaining the same available power for all three electrolyzer technologies ensures that differences in hydrogen production, oxygen production, energy performance, and economic indicators arise primarily from the characteristics and efficiencies of the electrolyzer technologies rather than from differences in plant scale. The simulation framework includes the full mass and energy balance, key operating conditions, and stream specifications used to integrate the power cycle with the electrolysis section. For transparency and reproducibility, the detailed modeling assumptions, property methods, unit-operation settings, and additional simulation outputs are provided in Supplementary Material.

3.2. Electrolyzer Performance Calculations

For each electrolyzer technology (SOE, PEM, or AEM) operated in water electrolysis mode, the total number requirement of cells is
N c e l l = P e l , t o t     η e l P c e l l
where
P e l , t o t = total electrical power supplied to the electrolyzer system, kW
N c e l l = total number of electrolyzer cells, dimensionless
P c e l l = theoretical or simulated single-cell power demand at the selected operating point, kW cell−1
η e l = overall electrolyzer electrical efficiency, dimensionless
The main technical and economic outputs of the integrated AF–electrolyzer system are directly governed by a limited number of key input parameters. The fixed net electrical input of 437 MW establishes the common process scale for all three electrolyzer configurations. For this fixed power input, the assumed electrolyzer efficiency directly determines the hydrogen and oxygen production rates; therefore, higher efficiency leads to greater H2 production per unit of electricity and lower specific energy consumption. This relationship explains the higher H2 productivity and energy sustainability performance of AF+SOE, which is evaluated at an efficiency of 85%, compared with AF+PEM at 75% and AF+AEM at 70%. The economic results are similarly linked to the major techno-economic parameters. Electrolyzer CAPEX and OPEX directly influence the annualized production cost and therefore the calculated LCOH, while the discount rate and plant lifetime determine the capital-recovery factor and discounted project economics. The oxygen by-product credit reduces the effective operating cost because the O2 generated during electrolysis can partially replace the oxygen otherwise supplied to the AF cycle. In addition, the availability of internally recovered AF-cycle water eliminates external freshwater demand under the assumed steady-state boundary, thereby improving the material- and environmental-sustainability indicators. Consequently, the main results reported in this study are not independent outputs, but are directly controlled by the selected process, efficiency, and economic parameters.

3.3. Sustainability Assessment and Sustainability Indicators

Methodological sustainability assessment is a versatile and robust framework that can be applied at any process scale, providing the designer with a holistic view of system performance. In the context of systematic sustainability analysis, numerous studies [27,28,29,30,31,32] have proposed sets of criteria and indicators that define acceptable sustainability levels. In general, economic viability, energy efficiency, environmental impact, and material efficiency are recognized as the four core dimensions used to quantify and compare sustainability performance [29]. To capture these dimensions in a consistent way, a variety of methodologies have been developed in the works cited above [6,7,8,27,28,29,30]. These approaches are sufficiently flexible to be implemented at different levels of detail—ranging from individual equipment and unit operations to entire process flowsheets, thereby enabling direct comparison of alternative designs that deliver the same product via different process routes. Importantly, such methodologies are also user-friendly from a design perspective: they can be readily employed by engineers and researchers to reassess sustainability performance after any process modification, retrofit, or intensification step [6,7,8].
Assessing sustainability performance and making informed design choices are both critical and inherently complex tasks. Therefore, there is a clear need for a systematic methodology that can both capture and abstract the complexity of process operations and, at the same time, provide a transparent way to analyze and communicate results using well-defined sustainability indicators. In line with this need, the present study introduces the conceptual framework as a versatile tool that can be applied at any process scale, helping designers obtain a comprehensive and comparable evaluation of process performance. The methodology is designed to be flexible enough to operate at the levels of individual equipment, process units, or full process flowsheets, thereby enabling direct comparison of alternative process concepts that produce the same product but are based on different designs. Moreover, it is straightforward for designers and researchers to apply the methodology repeatedly to re-evaluate sustainability performance after process modifications or intensification steps. In this work, methodological sustainability assessment is structured into seven phases: (Phase 1) problem/process/system definition and data collection; (Phase 2) selection of technologies and options; (Phase 3) generation of flowsheet alternatives; (Phase 4) selection and/or development of models and simulations; (Phase 5) selection and/or development of sustainability indicators; (Phase 6) screening process alternatives using sustainability indicators; and (Phase 7) identification of promising, feasible process option(s).
(Phase 5) Selection and/or development of sustainability indicators: In this key step, a suitable set of sustainability indicators is selected or constructed. Indicators can be taken directly from literature or adapted to the specific context of the study, but their careful selection is essential because they provide the quantitative basis for measuring sustainability performance and underpin all subsequent decisions. In this work, the indicators are organized into four main dimensions, which are economic, energy, environmental, and material efficiency, so that alternative process designs can be evaluated in a structured and comparable way. The choice of weighting scheme determines the relative importance of each indicator in the aggregated result and can therefore have a strong influence on the final ranking or selection of options. A wide range of approaches are available to derive indicator weights, spanning both subjective and more data-oriented techniques [33,34,35]. Commonly used methods include: (1) expert judgement, where domain experts assign weights based on their experience; (2) stakeholder-based approaches, which elicit preferences from multiple stakeholder groups to reflect broader societal priorities; (3) the analytical hierarchy process (AHP), which uses pairwise comparisons in a structured framework; (4) equal weighting, in which all indicators are given the same weight to minimize subjective bias; (5) data-driven or statistical methods, such as principal component analysis or regression-based schemes that infer weights from observed variability; and (6) broader multi-criteria decision analysis (MCDA) frameworks, which often combine weighting, aggregation and sensitivity analysis in an integrated way.
Equal weighting was adopted in this study as a transparent and neutral baseline strategy for aggregating the sustainability indicators. The main purpose of the assessment was to compare the three AF–electrolyzer configurations under a common process boundary without imposing a predefined preference toward material, energy, environmental, or economic performance. Compared with subjective weighting approaches such as AHP or stakeholder-based weighting, equal weighting avoids introducing preference bias that may depend on the decision-maker’s priorities. This is particularly important in early-stage process design, where the objective is to evaluate the overall sustainability profile of alternative configurations rather than to optimize the ranking for a specific stakeholder group. Equal weighting also offers an advantage over purely data-driven approaches such as entropy weighting for the present case. Entropy weighting assigns higher importance to indicators with larger numerical dispersion and lower importance to indicators with smaller variation. While this can be useful for large datasets, it may be less appropriate when only a limited number of process alternatives are compared and when some indicators are scientifically important even though their values are close. In this study, the material and environmental indicators of AF+PEM, AF+AEM, and AF+SOE are very similar because all three configurations share the same AF power block and water-electrolysis basis. Therefore, entropy weighting could underrepresent these important sustainability dimensions simply because the alternatives perform similarly in those categories. For this reason, equal weighting was considered more suitable for maintaining a balanced interpretation of all sustainability dimensions. The equal-weighting approach further improves reproducibility and interpretability. Since each indicator contributes in the same manner after normalization, the aggregated sustainability score can be directly traced to the material, energy, environmental, and economic performance of each configuration. This allows the reader to clearly identify that the main differences among the three pathways arise from the energy and economic dimensions, whereas the material and environmental dimensions remain consistently strong. Therefore, equal weighting was retained as the primary aggregation method in this study. Nevertheless, future studies may extend the framework by applying entropy weighting, AHP, TOPSIS, or other MCDA methods when a larger number of alternatives, detailed scenario data, and stakeholder-specific priorities are available.
In practice, completely eliminating bias in the weighting stage is difficult. Limitations in data quality, differences in stakeholder interests, and methodological choices can all introduce subtle preferences, and there is always a trade-off between keeping the procedure simple and capturing the full complexity of the system. For this reason, many sustainability studies adopt equal weighting as a transparent first approximation, sometimes complemented by sensitivity analysis to test how robust the conclusions are to alternative weighting schemes [34,35,36]. In our analysis, this neutral strategy was followed, and equal weighting was applied to all selected indicators. The crucial step, therefore, is not tuning the numerical weights, but rather carefully identifying those indicators that are most strongly affected by the dominant process variables and design choices. By focusing on a concise set of economically, energetically, environmentally, and materially relevant indicators and then weighting them equally, we seek to capture the overall sustainability performance of the proposed alternatives in a way that is methodologically simple, reproducible, and as unbiased as possible, while still allowing meaningful comparison among competing process designs.
The following sustainability scale transforms any indicator score to a dimensionless form and is used for each indicator:
S i , j = X i , j X i , m i n X i , m a x X i , m i n × 100
where
S i , j = normalized sustainability score of indicator i for alternative j , %
X i , j = calculated value of indicator i for alternative j
X i , m i n = reference worst-case value of indicator i
X i , m a x = reference best-case value of indicator i
i = sustainability indicator index
j = process-alternative index
For indicators for which a lower value represents better sustainability performance, the normalization direction was reversed so that a score of 100% consistently represents the best sustainability performance and 0% represents the worst performance.

3.4. Techno-Economic Analysis

Capital expenditure (CAPEX) refers to the initial investment required for the design, acquisition, and installation of all physical assets associated with a project or facility. It encompasses significant expenses including process equipment, balance-of-plant systems, structures, utility connections, installation, engineering, and construction. Operating expenditure (OPEX) denotes the ongoing costs associated with the daily operation of the facility and is typically categorized into variable and fixed components. Variable OPEX correlates with production rate and operational hours; it encompasses power for electrolyzers, compressors, and pumps, as well as raw materials and utilities (water, steam, cooling), and consumables such as chemicals, filters, or sorbents. Fixed operating expenses are predominantly unaffected by production levels and must be incurred even during partial load; they encompass labor (operators and technicians), routine maintenance and spare parts, insurance, administration and overhead costs, land rental, and, in certain instances, scheduled stack or catalyst replacement. Variable and fixed operating expenses collectively establish the annual running cost and significantly influence the ultimate unit production cost (e.g., USD per kilogram of hydrogen).
For the techno-economic assessment of the Allam–Fetvedt cycle, this study employed a bottom-up equipment factoring methodology. Initially, the primary equipment list and sizing parameters from Aspen HYSYS were acquired, and the equipment was categorized by mechanical type, ensuring that each item is priced according to its principal sizing determinant (power for rotating equipment, flow rate for pumps/mixers, area for heat exchangers, and geometry/pressure for vessels/columns). The costs of purchased equipment were approximated using cost correlations, employing one correlation method when constants are accessible and an alternate reference-cost scaling method when only a base cost is provided. To align literature costs with the design and study year, this work utilized (i) the six-tenths rule/power-law size scaling and (ii) the cost-index approach to adjust historical expenditures to a common 2026 cost basis. Accordingly, all monetary values used in the techno-economic assessment are expressed in 2026 USD. Cost data reported for earlier years were escalated to the 2026 reference year using the adopted cost-index methodology. Therefore, the reported CAPEX, OPEX, LCOH, and cash-flow results are presented on a consistent 2026 economic basis.
The techno-economic assessment of the 437 MW-net AF cycle was performed using established preliminary process-design and equipment-factorial costing methodologies. The purchased equipment costs obtained from Aspen HYSYS sizing data and equipment-specific cost correlations were converted to plant-level capital costs using a Lang factor of 4.7 for a fluid-processing plant, consistent with conventional chemical-process economic estimation procedures described by Peters et al. [37], Towler and Sinnott [38], and Turton et al. [36]. Additional capital-cost components, including inside battery limits (ISBL), outside battery limits (OSBL), engineering, contingency, and working capital, were estimated using percentage-based factors commonly employed in conceptual and preliminary process design [37,38,39]. In particular, working capital values on the order of 10–20% of fixed capital investment are commonly used for preliminary estimates, supporting the 15% assumption adopted in the present study [38]. All monetary values were expressed on a common 2026 USD basis, with historical cost data escalated to the 2026 reference year using the adopted cost-index methodology. Fixed operating costs included maintenance, insurance, royalties, local taxes, and operating expenses, whereas variable operating costs were primarily associated with natural gas and oxygen requirements. A natural gas price of 2.93 USD per MMBtu was adopted as the base-case fuel-price assumption used in the present techno-economic analysis, while an oxygen value of 0.10 USD per kg was adopted to quantify the oxygen requirement and the economic benefit associated with its partial replacement by electrolyzer-generated O2. Because natural gas and oxygen prices are location- and time-dependent, these values are treated as economic assumptions for the comparative assessment rather than as universally representative market prices.
For the techno-economic assessment of AEM, PEM, and SOE electrolyzer systems, literature-based CAPEX and fixed OPEX ranges were adopted for the three electrolyzer technologies to reflect differences in technology maturity, materials of construction, operating conditions, and balance-of-plant complexity. Table 1 illustrates the correlation between variations in technology maturity and design complexity with respect to both capital expenditures (CAPEX) and fixed operational expenditures (OPEX) for the three electrolyzer technologies. The CAPEX intervals specifically reflect the present development level and construction materials. PEM electrolyzers (1500–2500 $ kW−1) are positioned in a mid-to-upper cost range due to their dependence on expensive proton-conducting polymer membranes, noble-metal catalysts, and their typical design for high current densities, necessitating compact, durable stacks and a meticulously engineered balance of plant. AEM units (500–1000 $ kW−1) represent the most cost-effective CAPEX option, due to their capacity to utilize more affordable membranes and non-precious catalysts. Solid oxide electrolyzers (SOE, 2000–4500 $ kW−1) demonstrate the highest capital expenditures, attributable to their high-temperature operation (≈700–850 °C), utilization of ceramic cells and specialized interconnects, stringent sealing requirements, and a more complex high-temperature balance-of-plant. Additionally, limited manufacturing scale contributes to the elevated specific investment cost at the upper end of the spectrum. The fixed OPEX varies from 3% to 5% of CAPEX per kW, classified as moderate, moderate to high, and high, respectively.
The cost of hydrogen production is usually expressed as a levelized cost of hydrogen (LCOH) in $ per kg or $ per Nm3. It represents the average cost to produce 1 kg (or 1 Nm3) of hydrogen over the whole lifetime of the plant (Equation (4)), combining annualized CAPEX, fixed OPEX, and variable OPEX.
L C O H = C A P E X × C R F + O P E X f i x e d + O P E X v a r i a b l e C O 2 M H 2 , a n n u a l
where
L C O H = levelized cost of hydrogen, USD/kg H2
C A P E X = total capital investment, USD
O P E X f i x e d = annual fixed operating expenditure, USD/year
O P E X v a r i a b l e = annual variable operating expenditure, USD/year
C O 2 = annual economic credit associated with useful electrolyzer-generated oxygen, USD/year
M H 2 , a n n u a l = annual hydrogen production, kg/year
The LCOH calculated in the present study represents the cost of hydrogen at the defined plant boundary and should therefore be interpreted as a plant-gate production cost rather than a delivered hydrogen price. Downstream hydrogen conditioning and supply-chain operations, including final purification, compression, storage, transportation, and distribution infrastructure, are outside the present economic boundary. Inclusion of these elements would increase the cost of hydrogen delivered to the end user, with the magnitude depending on delivery pressure, storage configuration, transport distance, and distribution mode.
For an interest rate i and plant lifetime t   (years):
C R F   c a p i t a l   r e c o v e r y   f a c t o r = i ( 1 + i ) t ( 1 + i ) t 1
This converts the one-time CAPEX into an equivalent annual cost. In this study, i is 10% and t is 25 years.
Cumulative cash flow (CCF(t)) is the running total of nominal cash flow over time. It ignores the time value of money and shows how the project’s cash balance evolves and:
C C F   t = k = 0 t C F   ( t )
Discounted cash flow (DCF) for a single period is the present value (PV) of that period’s cash flow, using the discount rate i:
D F C   t = C F   ( t ) ( 1 + i ) t
Cumulative discounted cash flow (CDCF) is the running total of the discounted cash flows up to year t. When CDCF(t) first becomes ≥ 0, that gives the discounted payback period. At the final year, CDCF(N) = NPV (net present value).
C D C F   t = k = 0 t C F C F   ( t ) ( 1 + i ) t   ( t )

4. Results and Discussion

4.1. Material Sustainability

In this study, the overall mass and energy balances are built upon Aspen HYSYS simulations of the integrated plant. The Allam–Fetvedt (see Supplementary Material) power block is modeled in HYSYS, and its key performance metrics such as net electrical output, thermal efficiency, and major stream conditions are taken directly from the simulation results. This section details how the required number of electrolyzer cells is determined and examines the associated material flows (H2O, H2, and O2) for each case. Based on the Aspen HYSYS simulation, the Allam–Fetvedt cycle provides approximately 437 MW of net electrical power after internal process and auxiliary power requirements. This net output is used as the fixed available electrical input for all PEM, AEM, and SOE cases, thereby providing a common basis for direct comparison. An illustrative example for PEM is given as follows:
It is assumed that the overall efficiency of the PEM unit is 75%. In the single-cell PEM electrolyzer configuration, the feed is set to 3.6 kmol h−1 of H2O to the PEM cell. Under these conditions, the cells electrochemically produce 3.6 kmol/h of H2 and 1.8 kmol h−1 of O2. The corresponding electrical power requirement for this combined single-cell system from the Aspen HYSYS simulation is 242.50 kW; when a 75% efficiency is applied, the total electrical input becomes 323.33 kW. Using Equation (2), this setup yields a hydrogen production rate of 4854.44 kmol h−1 (9786.56 kg h−1) and an O2 production rate of 2247.43 kmol h−1.
Table 2 summarizes the selected material-efficiency indicators and their calculated values for the PEM, AEM, and SOE electrolyzers. In this context, the material efficiency of a process or unit operation is reflected in the amount of materials and services required to deliver a given product or perform a specific function. Because mass transfer operations strongly influence energy consumption, equipment size, capital and operating costs, raw material use, and emissions, efficiency-based indicators provide a powerful basis for early-stage sustainability screening. They help to pinpoint improvement opportunities during the conceptual design phase and thereby shape all dimensions of process sustainability.
The assumptions used in Table 2 are based on the Aspen HYSYS steady-state simulation results, the stoichiometry of water electrolysis, literature-based electrolyzer performance values, and the methodological sustainability assessment framework used in this study. The H2 and O2 production rates were calculated from the fixed 437 MW electrical input supplied by the AF cycle and the assumed process-level efficiencies of the electrolyzer technologies, namely 75% for PEM, 70% for AEM, and 85% for SOE. These values are within the typical efficiency ranges reported for the selected technologies and were used to provide a consistent comparison among the three AF-integrated configurations. The assumption of no fresh water consumption is based on the simulated internal water balance of the AF cycle. The AF cycle produces approximately 163,571 kg h−1 of water, whereas the electrolysis section requires approximately 81,623–97,116 kg h−1 of water depending on the electrolyzer technology. Therefore, the recovered AF-cycle water is sufficient to meet the stoichiometric water demand of the electrolyzer under steady-state conditions. However, this should be interpreted as a theoretical process-level water self-sufficiency assumption; in practical operation, water condensation, purification, polishing, storage, and possible make-up water would be required. The best-target and worst-case values used for the material indicators were adopted from the methodological sustainability assessment approach, where each indicator is normalized into a dimensionless sustainability score between 0 and 100%. For indicators such as reaction yield, atom economy, reaction mass efficiency, mass productivity, recycled material fraction, and water consumption, the best target represents the most desirable material-efficient condition, while the worst case represents the least desirable reference condition. This normalization enables indicators with different units to be compared consistently within the same sustainability framework. The assumed H2 selling price of 10 $ kg−1 was used only for value-based indicators and for consistency with the economic assessment.
For a fixed electrical input from the Allam–Fetvedt cycle, the trend is monotonic: as system efficiency increases, the amount of H2 produced per MW of electricity also increases. Physically, a higher efficiency means that a smaller fraction of the electrical power is lost as heat and internal losses, so more of the input energy is available to drive the water-splitting reaction, yielding more H2 per unit of power. Comparing technologies, the SOE design delivers the highest H2 production per MW, followed by PEM, while AEM gives the lowest values. This ordering reflects the underlying thermodynamics and operating conditions: solid oxide cells operate at high temperature, where part of the water-splitting enthalpy is supplied as heat, and the electrochemical potential (cell voltage) is reduced, lowering the electrical energy needed per kilogram of H2. PEM cells, running at moderate temperatures, have somewhat higher specific electricity consumption, and AEM cells typically have the highest voltage and losses among the three, giving the lowest H2 yield per MW. The ranges shown in Table 1 thus quantify both the technological uncertainty in achievable efficiency and its direct impact on hydrogen productivity. Normalized to the common 437 MW electrical input, the AF+PEM, AF+AEM, and AF+SOE configurations produce 22.39, 20.90, and 24.87 kg H2 MWh−1, respectively; the corresponding oxygen productivities are 177.74, 165.89, and 197.38 kg O2 MWh−1.
When this range is extrapolated to the full 437 MW system, the resulting water consumption lies between 81,623 and 97,116 kg h−1, in agreement with the simulation results. Given that the Allam–Fetvedt cycle produces approximately 163,571 kg h−1 of water, the Power-to-hydrogen subsystem would utilize about 49.9–59.4% of this internally generated stream. Consequently, the integrated plant is water self-sufficient and does not require any additional external water supply. When the system is scaled to 437 MW, the proposed configurations yield between 72,493 and 86,252 kg O2 h−1, while the AF cycle itself requires 288,000 kg O2 h−1 for oxy-combustion. Thus, the integrated scheme can cover roughly 25.17–30% of the total oxygen demand, effectively decreasing the duty of the Air Separation Unit (ASU) by up to about one-quarter. This partial oxygen self-sufficiency cuts the ASU’s power consumption, enhances the overall energy efficiency of the plant, and delivers ultra-high-purity O2 that can be used directly or blended for combustion.
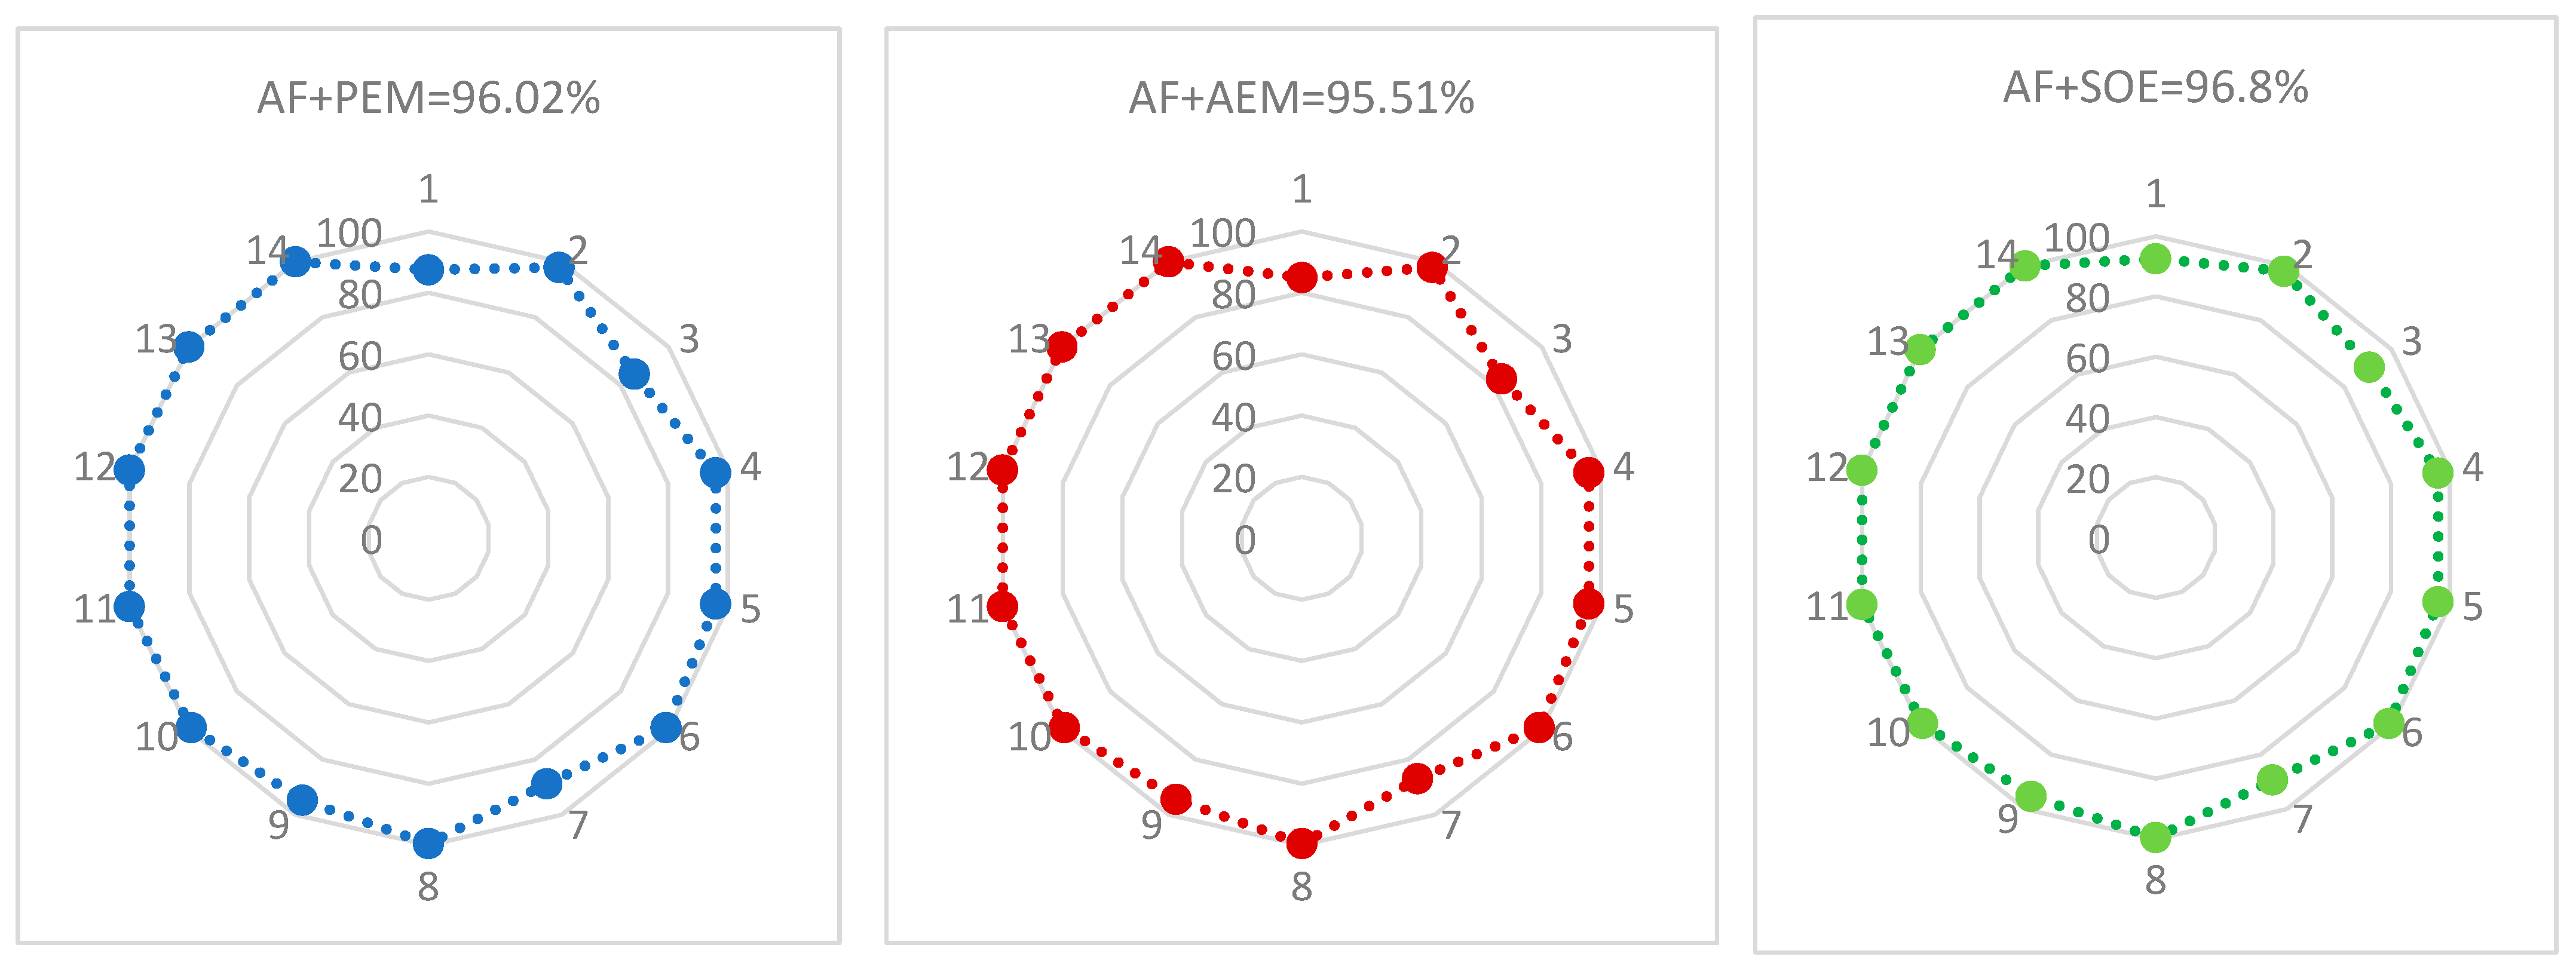
Figure 2 compares the normalized material-efficiency indicators for the three integrated pathways AF+PEM, AF+AEM, and AF+SOE. All three configurations exhibit very high overall material performance, confirming that coupling the Allam–Fetvedt cycle with any of the electrolyzer options leads to effective utilization of feedstocks and limited generation of waste and auxiliary streams. Among them, AF+SOE attains the highest aggregate score (96.8%), followed closely by AF+PEM (96.02%), whereas AF+AEM is slightly lower (95.51%). The radar plots show that the three options have very similar shapes, indicating that their material efficiencies are consistently high across all 14 indicators. Overall, the differences between the pathways are relatively small, implying that material efficiency alone would not be a decisive criterion for technology selection.
The base-case water balance represents stoichiometric process-water self-sufficiency, since the recovered AF-cycle water exceeds the electrolyzer water demand under steady-state conditions. However, this does not imply zero total industrial water consumption. In practical operation, additional water would be required for deionization and polishing, condensate purification, stack conditioning, periodic system make-up, cleaning, and compensation for wastewater-treatment and handling losses. Therefore, a supplementary sensitivity case was considered by introducing a small external make-up water requirement relative to the electrolyzer process-water demand. Under this condition, the water-related sustainability indicators, including total water consumption, fractional water consumption, and water intensity, decrease from their idealized base-case values, while the remaining material indicators remain largely unchanged because the hydrogen-production stoichiometry and principal material flows are unaffected. Consequently, the overall material sustainability score decreases only moderately for small external-water fractions. The integrated process should therefore be described as process-water self-sufficient under the adopted steady-state boundary, rather than as requiring absolutely no external water in practical operation.

4.2. Energy Sustainability

Energy demand plays a decisive role in the sustainability performance of any chemical process or unit, influencing overall product cost, consumption of energy-related goods and services, and associated heat emissions. Similar to other sustainability metrics, energy indicators must be scientifically sound, straightforward to calculate, and internally consistent, since evaluating thermodynamic properties depends on numerous data and reference states that need to be readily available, especially for emerging or innovative chemical processes. Table 3 summarizes the selected energy-efficiency indicators and their calculated values for the PEM, AEM, and SOE electrolyzers.
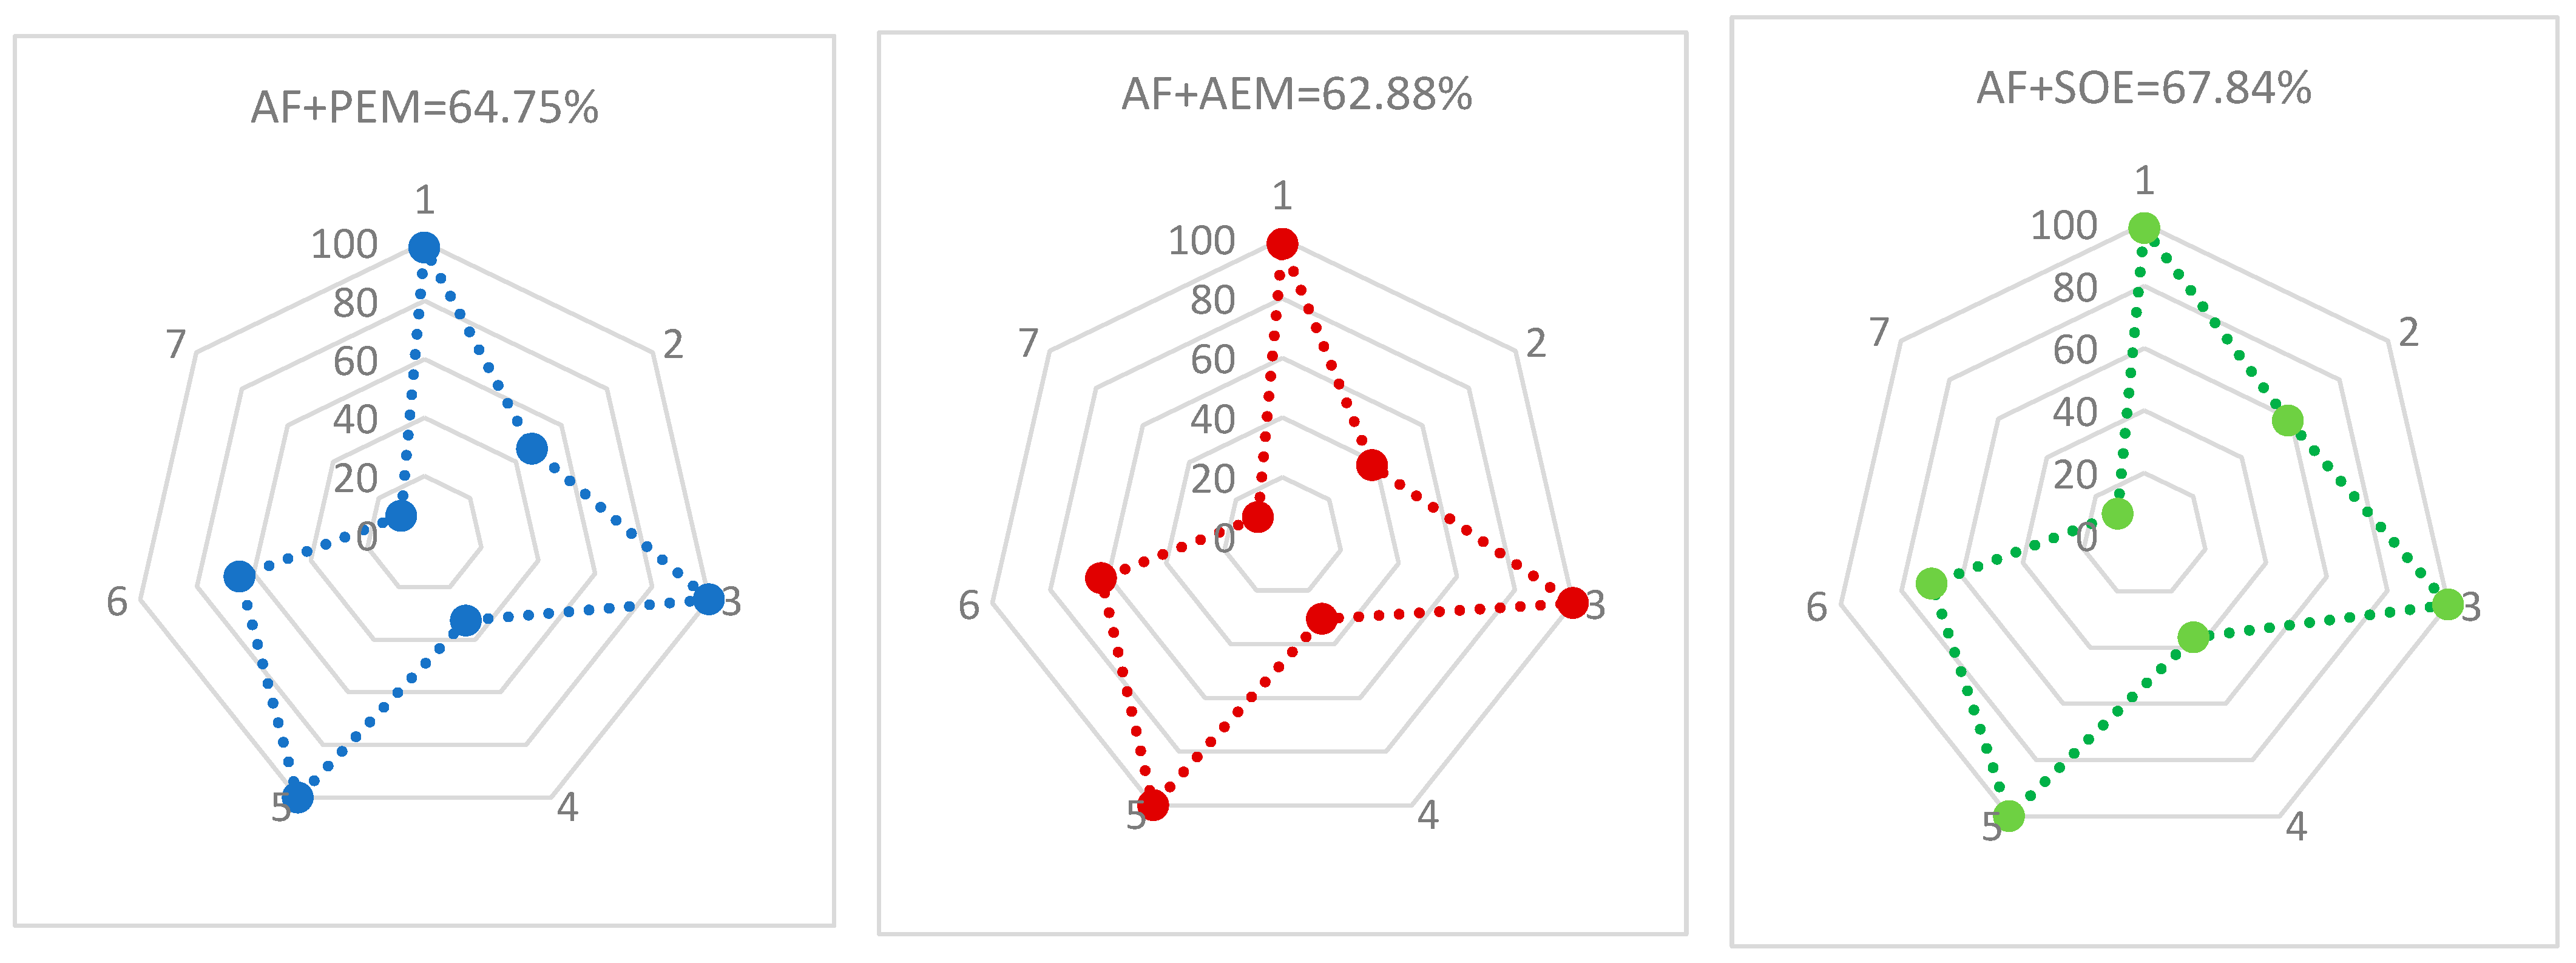
Figure 3 compares the normalized energy-efficiency indicators of the three AF–electrolyzer pathways. The overall scores (AF+PEM = 64.75%, AF+AEM = 62.88%, AF+SOE = 67.84%) show that all configurations convert primary energy into useful products with moderate but not outstanding energy efficiency, noticeably lower than the very high material efficiencies in Figure 2. This immediately indicates that, in the integrated process concept, energy rather than materials is the main limiting factor.
When the three routes are compared, AF+SOE exhibits the highest aggregate energy-efficiency score (67.84%), slightly outperforming AF+PEM and AF+AEM. This advantage is consistent with the ability of solid-oxide electrolysis to exploit high-temperature heat from the AF cycle, thereby reducing the specific electrical energy demand of water splitting and improving the indicators associated with thermal integration. The superior energy sustainability score of AF+SOE can be explained by the contribution of several individual energy indicators rather than by a single parameter. First, SOE achieves the most favorable specific energy intensity because, under the same fixed 437 MW electrical input from the AF cycle, it produces the highest amount of hydrogen among the three electrolyzer technologies. This is directly related to the higher assumed SOE efficiency of 85%, compared with 75% for PEM and 70% for AEM. As a result, a larger fraction of the supplied energy is converted into chemical energy stored in H2, while a smaller fraction is lost through electrochemical inefficiencies and auxiliary demands. Second, the resource energy efficiency indicator is higher for AF+SOE because high-temperature electrolysis reduces the required electrical work for water splitting. In SOE operation, part of the water-splitting energy demand can be supplied as heat rather than electricity. This feature is particularly advantageous in the proposed integrated system because the AF cycle is a high-temperature power cycle and therefore provides opportunities for thermal coupling. Consequently, the SOE-based configuration is more compatible with heat recovery and process integration than the low-temperature PEM and AEM configurations. Third, the process integration degree is improved in AF+SOE because the high operating temperature of SOE allows better utilization of available thermal energy within the integrated plant. This reduces the dependence on purely electrical input and improves the overall energy balance of the power-to-hydrogen pathway. In contrast, PEM and AEM electrolyzers operate at lower temperatures and therefore have less opportunity to benefit from high-temperature heat integration with the AF cycle. Finally, the EROI indicator is slightly higher for AF+SOE because the system generates more useful hydrogen energy output per unit of energy invested. Therefore, the highest overall energy sustainability score of AF+SOE results from the combined effects of higher hydrogen productivity, lower specific electrical energy demand, stronger thermal compatibility with the AF cycle, improved process integration, and better resource energy utilization. These results indicate that SOE integration is the most favorable option from an energy sustainability perspective, although further development is still required to address SOE durability, high-temperature materials, and capital-cost challenges.
AF+PEM remains competitive (64.75%) and shows a very similar radar shape, while AF+AEM is marginally less favorable (62.88%), reflecting its somewhat higher specific electricity consumption and/or additional conditioning requirements in the present design assumptions. Overall, Figure 3 suggests that while all three AF-based pathways are energetically viable, SOE integration provides the most favorable energy-efficiency profile, and further improvements should target the auxiliary and conditioning steps highlighted by the low-performing indicators rather than the main electrochemical conversion itself.

4.3. Environmental Sustainability

The central importance of this study lies in proposing an integrated approach that reduces negative environmental impacts, particularly global warming. Achieving such impact-reduction targets should begin at the process input stage by carefully selecting both the type of raw materials and the energy sources used. Table 4 summarizes the selected environmental-efficiency indicators and their calculated values for the PEM, AEM, and SOE electrolyzers.
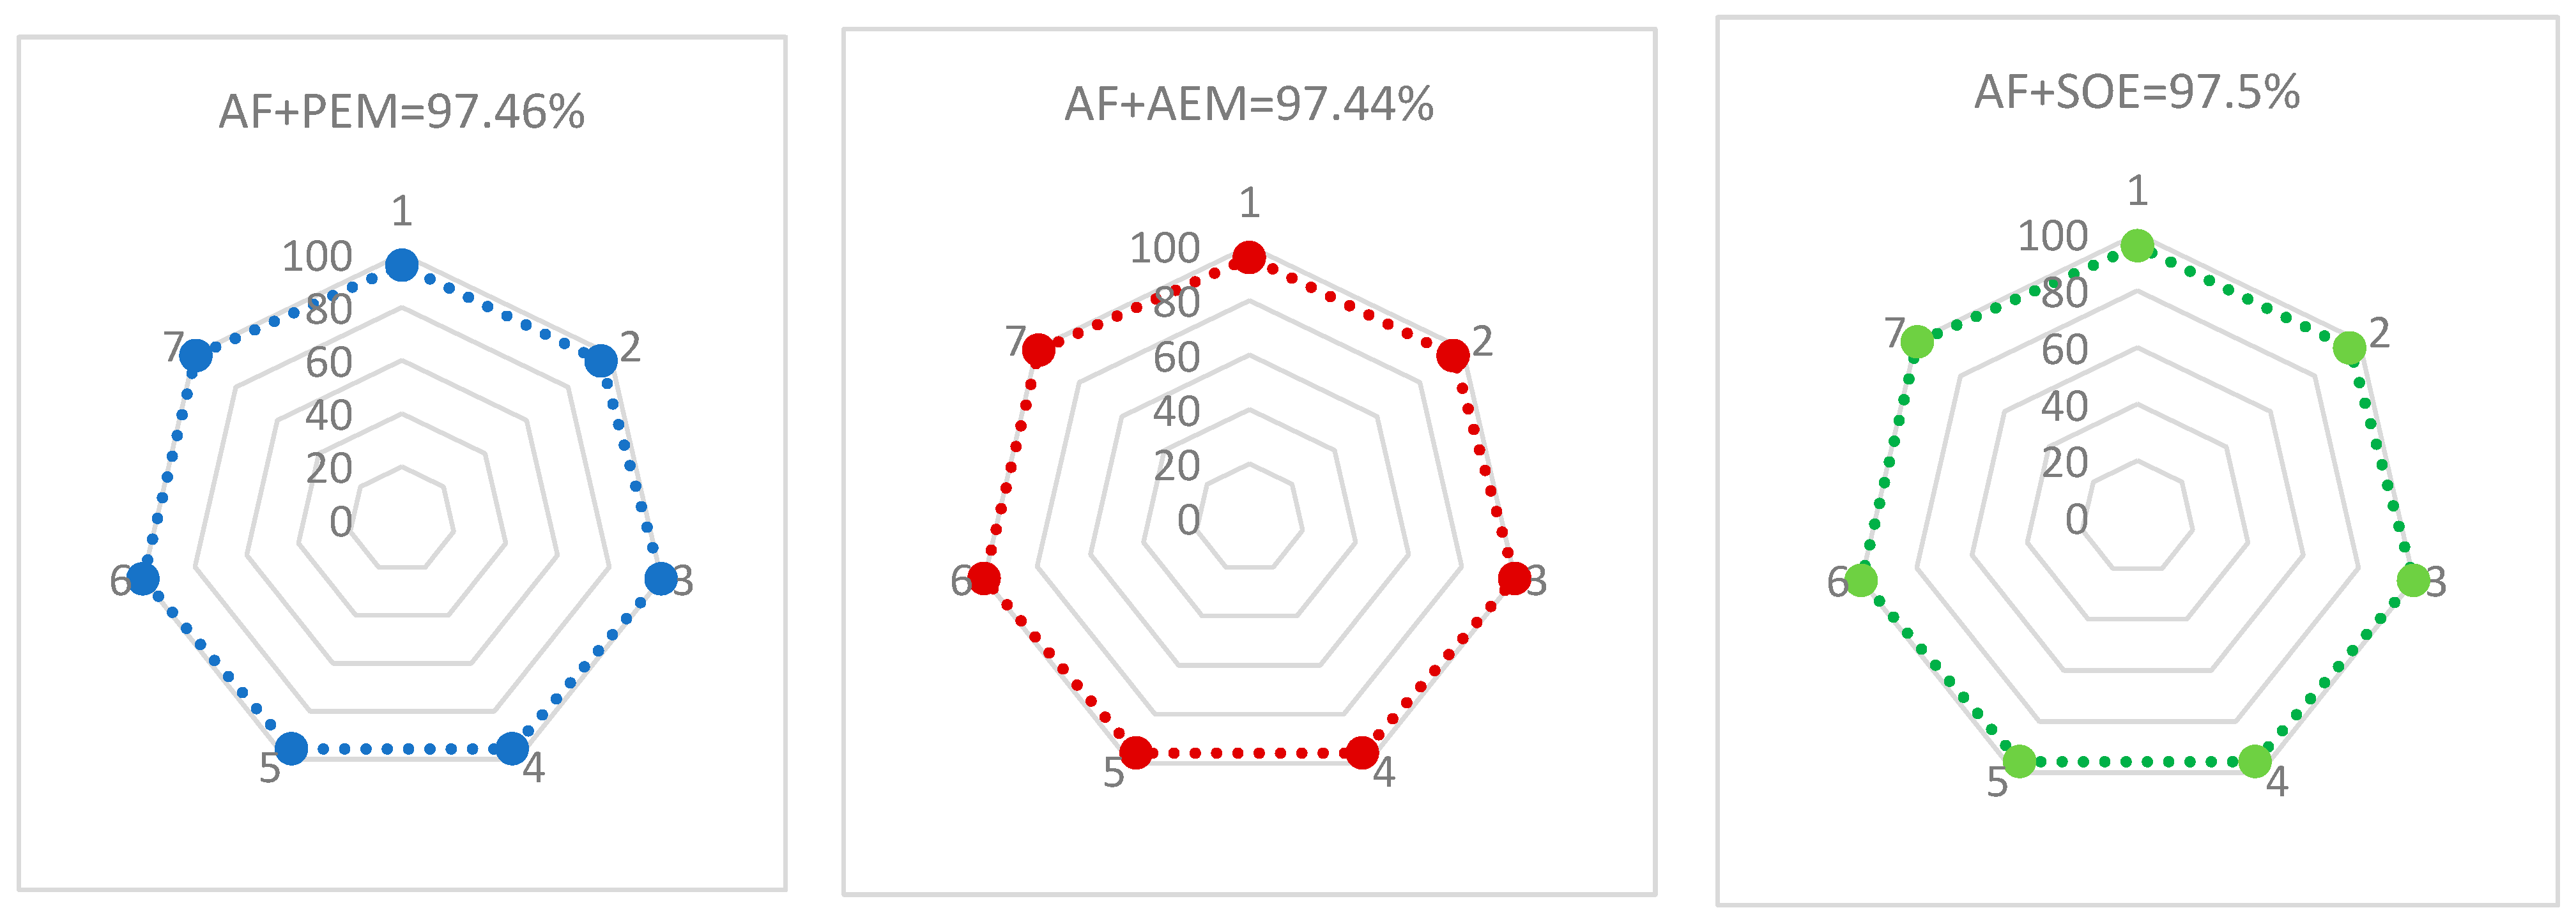
Figure 4 shows that all three integrated systems exhibit very high and very similar environmental efficiencies, with total scores of 97.46% for AF+PEM, 97.44% for AF+AEM, and 97.5% for AF+SOE. The almost perfectly circular radar plots indicate that each configuration performs consistently well across all eight selected environmental indicators, without any pronounced “weak dimension” in the assessment.
Although the three AF-integrated configurations exhibit nearly identical process-level environmental sustainability scores, these results should not be interpreted as evidence that PEM, AEM, and SOE have equivalent environmental burdens over their complete life cycles. The present indicators primarily represent environmental performance within the operational process boundary and do not explicitly account for raw-material extraction, electrolyzer manufacturing, stack replacement, recycling, or end-of-life treatment. From a life-cycle perspective, PEM electrolyzers may carry comparatively important material-related burdens because of their reliance on proton-conducting polymer membranes and platinum-group-metal catalysts, particularly Pt- and Ir-containing components, for which mining, refining, catalyst manufacture, and recovery can contribute to resource depletion and upstream environmental impacts. AEM electrolyzers have the potential to reduce the dependence on scarce noble metals through the use of non-precious-metal catalysts; however, membrane degradation, component replacement, polymeric waste treatment, and the still-developing durability of AEM stacks remain relevant environmental considerations. SOE systems present a different burden profile because they employ ceramic electrolytes and electrodes, metallic interconnects, sealing materials, and high-temperature balance-of-plant components. Their manufacture can involve energy-intensive ceramic processing, while high-temperature degradation, thermal cycling, stack replacement, and end-of-life treatment of ceramic and metallic materials can create additional environmental impacts. Therefore, the very similar environmental scores obtained in the present study mainly reflect the shared AF process boundary and similar direct operational emissions, whereas the complete life-cycle environmental ranking of PEM, AEM, and SOE may differ once material production, stack manufacturing, replacement, recycling, and disposal are included. A dedicated cradle-to-gate or cradle-to-grave life-cycle assessment is therefore required to establish these differences quantitatively.
Taken together, Figure 4 confirms that integrating water electrolysis with a natural gas–fired Allam–Fetvedt cycle enables an environmentally robust “power-to-X” platform. Direct CO2 emissions are almost completely eliminated at the stack level, and the remaining life-cycle impacts are dominated by upstream fuel supply and electrolyzer manufacturing rather than by the integrated operation itself. Within the present operational process boundary, the choice between PEM, AEM, and SOE is more strongly differentiated by techno-economic and energy-performance considerations than by the calculated environmental indicators. However, their relative environmental ranking may change when upstream material production, stack manufacturing and replacement, recycling, and end-of-life treatment are incorporated through a full life-cycle assessment.

4.4. Economic Sustainability

Table 5 summarizes the resulting CAPEX and OPEX estimates for the AF power block. Upon aggregating all acquired equipment to determine the total equipment cost (TEC), this was translated into plant-level CAPEX utilizing the factorial (Lang factor) method, with the Lang factor set at 4.7 for fluid-processing plants, thereby implicitly encompassing installation, piping, instrumentation, and ancillary facilities. The study subsequently organized CAPEX into ISBL and OSBL employing the conventional battery-limits methodology: ISBL encompasses the process units and land, represented as a fraction of the adjusted equipment cost, whereas OSBL, engineering, and contingency are incorporated as standard percentages of ISBL, following order-of-magnitude or preliminary estimation practices. The sum of fixed capital and working capital (expressed as a percentage of fixed capital) is the total capital investment. The total operating costs were recorded as the aggregate of recurring cost categories (maintenance, utilities, labor/overheads, insurance, royalties, taxes, etc.). For project economics, the study employed a standard construction-period CAPEX phasing, age-dependent maintenance percentages, and an assumption regarding end-of-life salvage value.
The techno-economic analysis of the 437 MW-net Allam–Fetvedt power plant, as presented in Table 5, indicates a total capital investment of $681.6 million, resulting in a particular CAPEX of about $1560 per kW. The fixed OPEX of 57.8 M$ year−1 constitutes approximately 8–9% of the initial investment, positioning it at the upper range of standard power-plant metrics. This figure indicates the anticipated maintenance demands of high-temperature, high-pressure apparatus, specialized materials, and related utilities and compression systems. The variable OPEX is significantly more impactful, as it predominates the life-cycle cost; the variable operating expense ranges from 362.2 to 400.6 million dollars, contingent upon the method of oxygen supply to the power block. This range reflects the economic cost associated with reliance on externally sourced high-purity O2 for oxy-combustion. When a significant portion of oxygen is sourced outside of battery constraints, O2 acquisition substantially impacts the levelized cost of energy and hydrogen. Conversely, systems that partially internalize oxygen production or recovery (e.g., via electrolyzer units that co-generate O2 or by maximizing ASU capacity and O2 usage) shift the system toward the lower range of the variable OPEX spectrum. The results indicate that, for an Allam–Fetvedt plant of this magnitude, oxygen management constitutes both a process-integration challenge and a crucial economic factor, with long-term sustainability and competitiveness dependent on the effective reduction of external O2 purchases through integrated design and OSBL optimization.
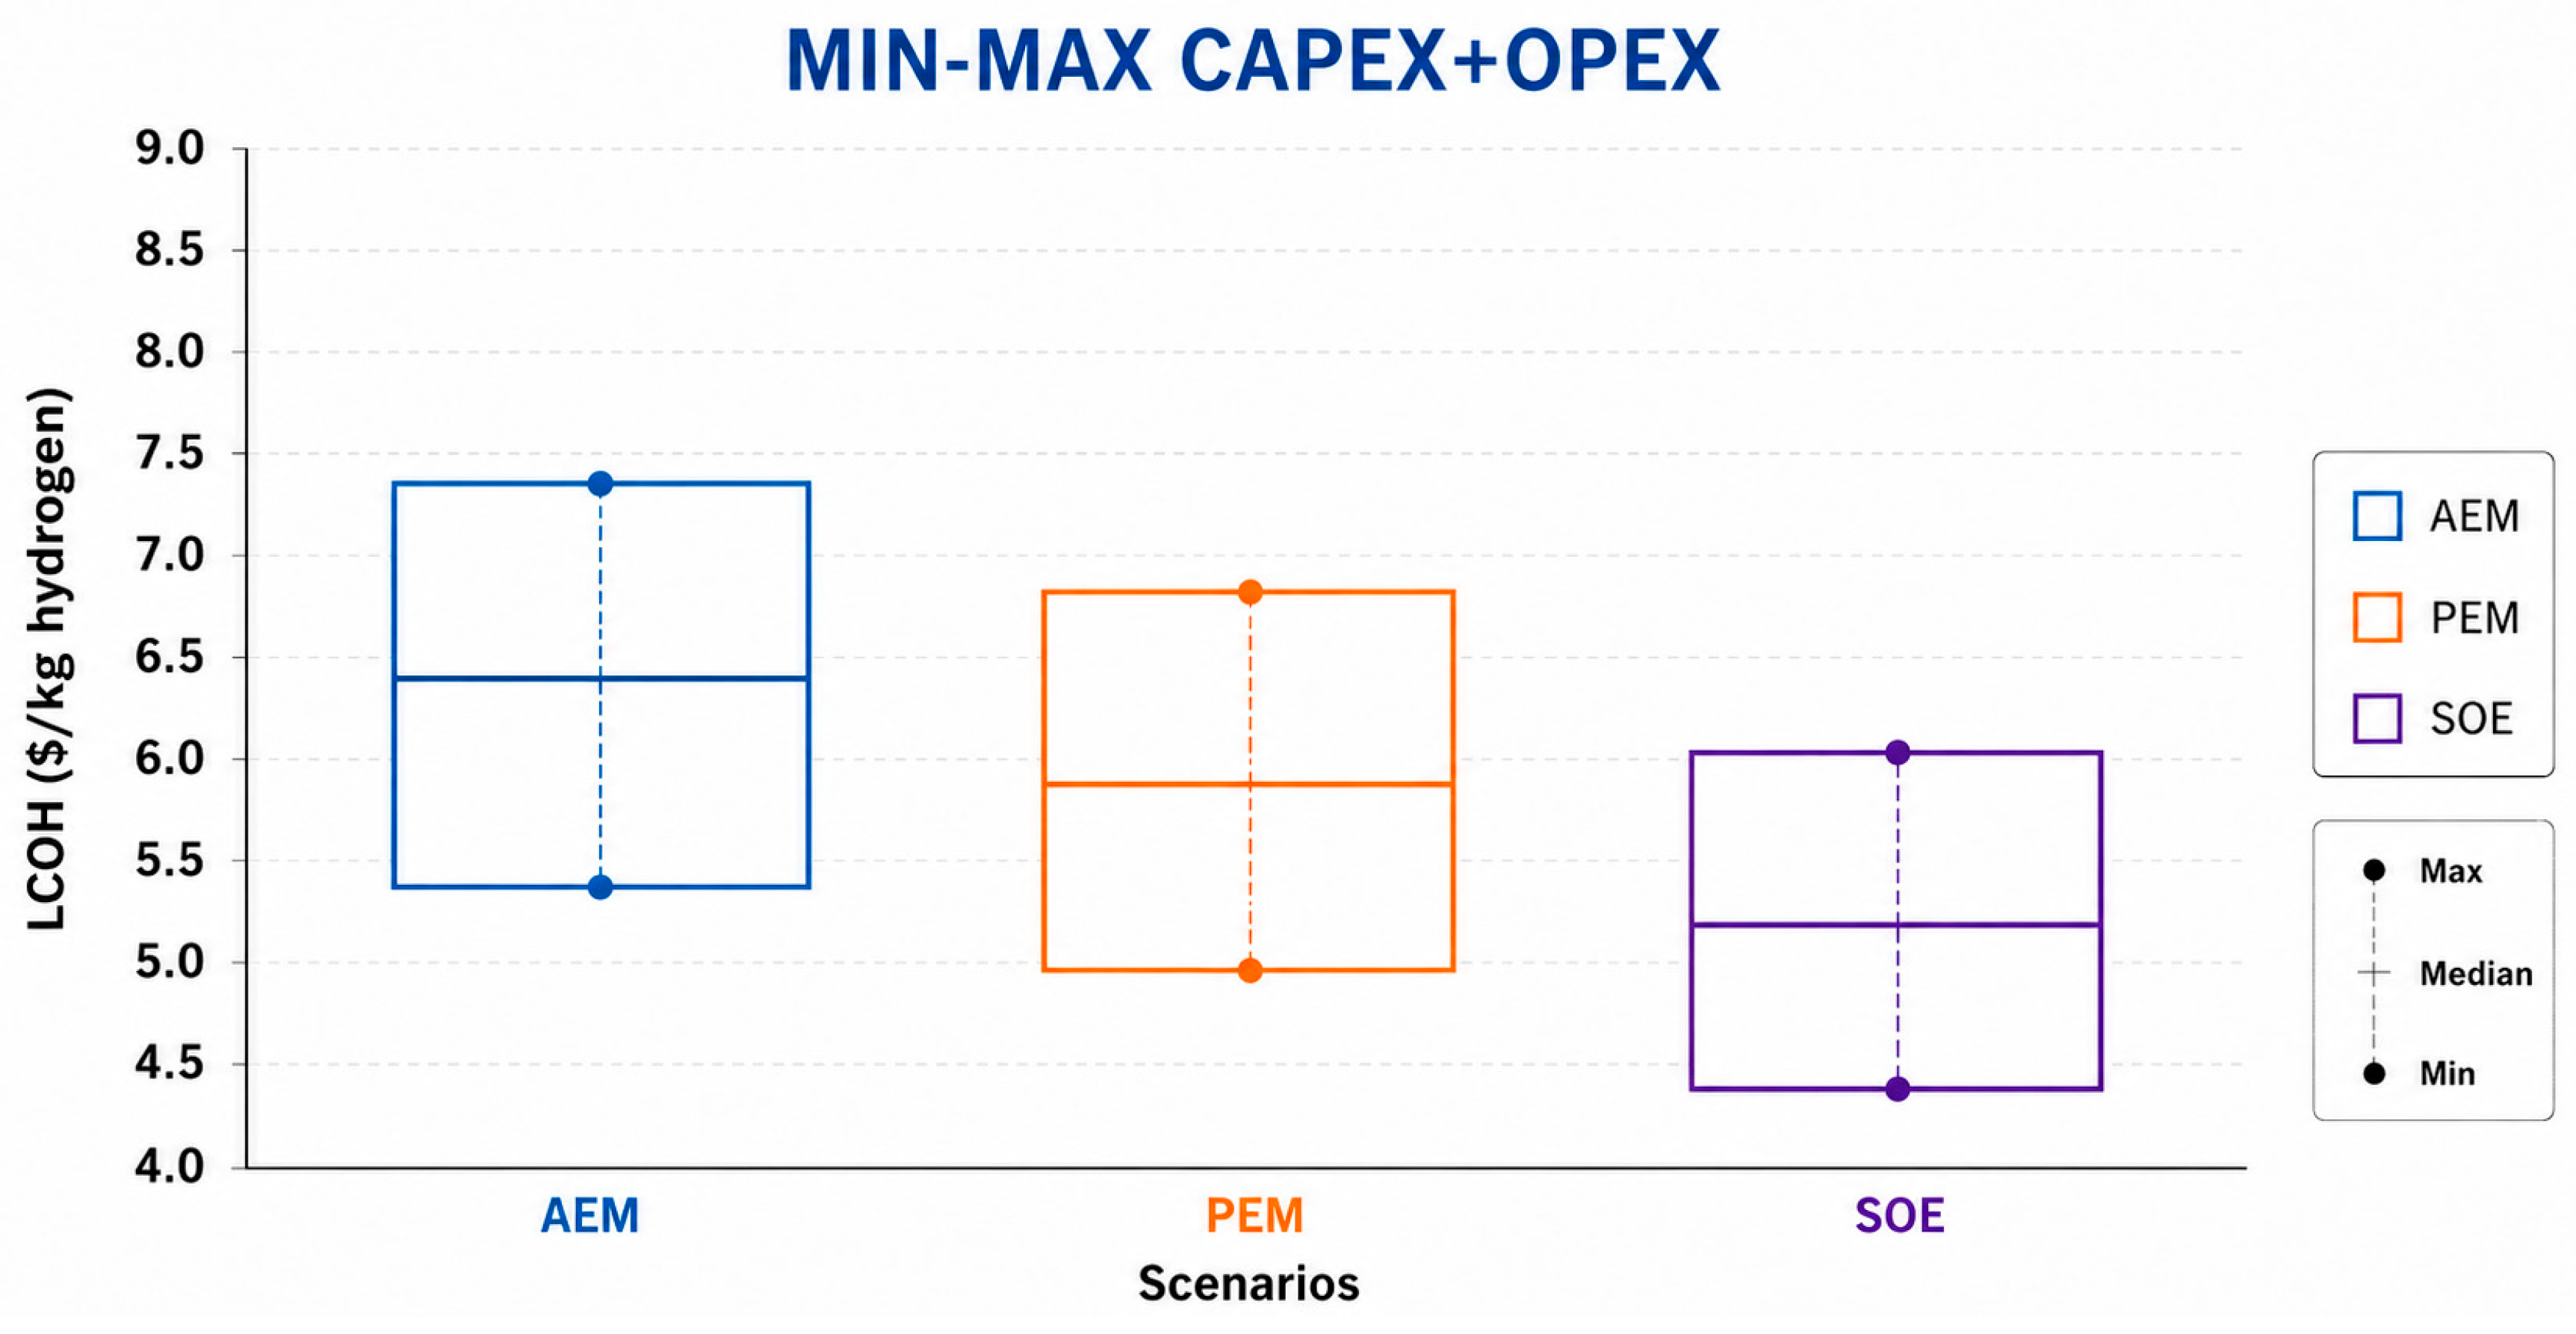
Figure 5 compares the levelized cost of hydrogen (LCOH) for the three AF-integrated designs (AF+AEM, AF+PEM, AF+SOE) when CAPEX and OPEX are varied between pessimistic (high) and optimistic (low) values. Figure 5 shows that AEM gives the highest LCOH, with a span of roughly ~5.5–7.3 $ kg−1. This reflects the combination of lower technology maturity, higher stack replacement costs, and somewhat lower electrical efficiency. PEM improves the economics with a range of about ~5.0–6.8 $ kg−1, indicating better efficiency and a more mature cost structure. SOE exhibits the lowest LCOH, with a range of roughly ~4.3–6.0 $ kg−1. The lower cost is consistent with the high-temperature electrolyzer’s superior thermodynamic efficiency and its ability to recover heat from the Allam–Fetvedt cycle, which reduces electricity consumption and therefore both variable OPEX and the required installed electrolyzer capacity.
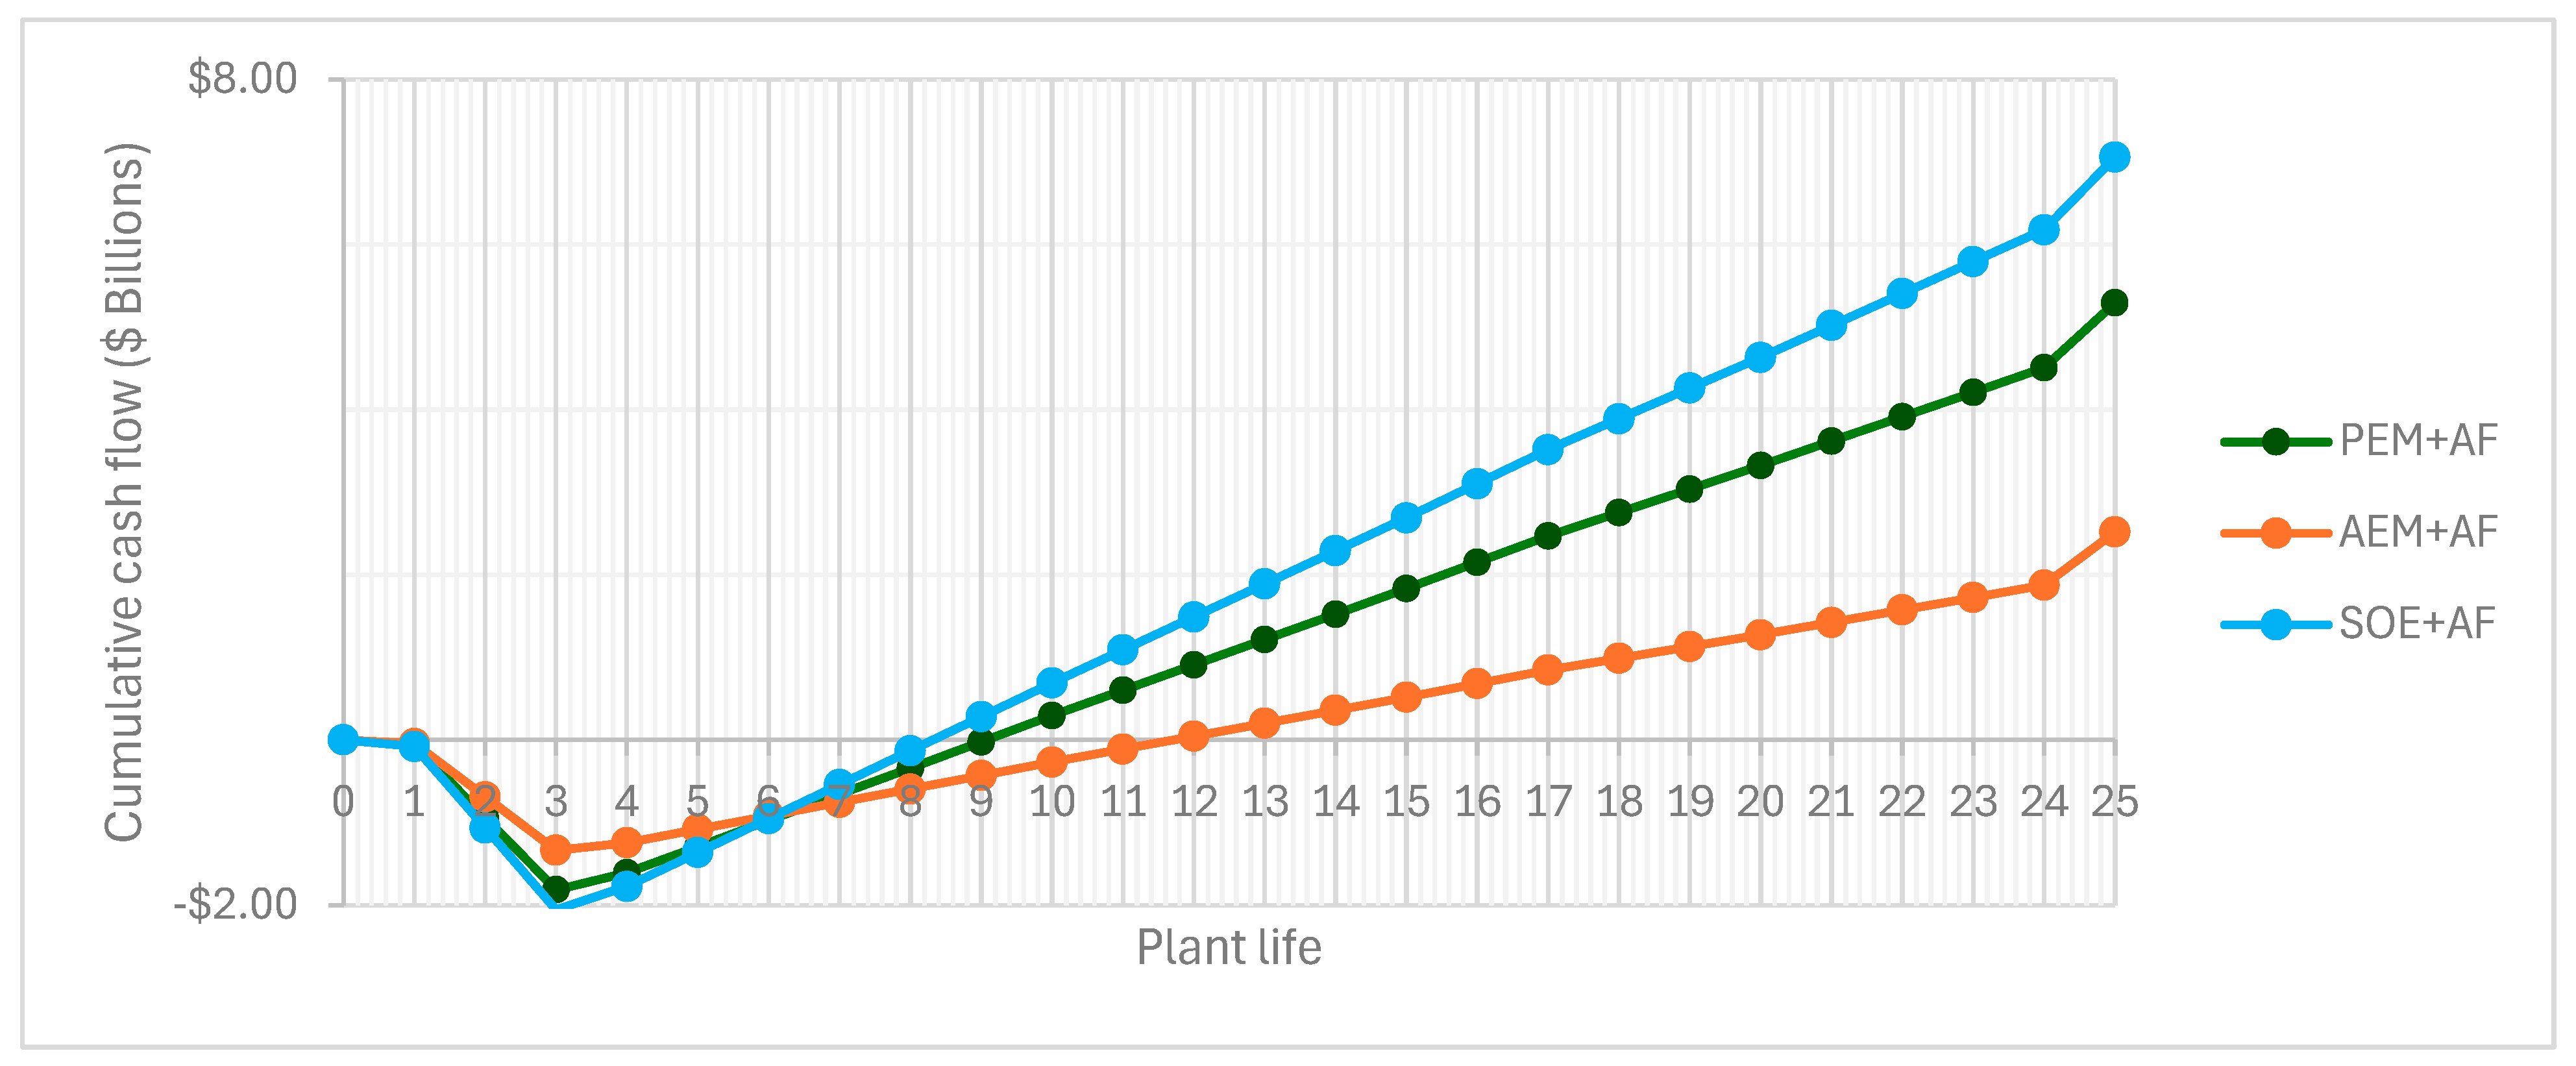
Figure 6 shows the evolution of CCF(t) for the three AF-integrated electrolyzer options under the low CAPEX/OPEX scenario. CCF(t) tracks how the project’s cash balance develops over the 25-year lifetime without discounting. The year when CCF(t) first becomes ≥ 0 gives the simple payback period. The SOE+AF configuration recovers its initial investment fastest, with payback occurring roughly at 6 years (considering that the facility does not run for the first three years). The PEM+AF option follows, achieving payback around year 7, while the AEM+AF system requires the longest time (about 9.5 years) to reach a positive cumulative cash position.
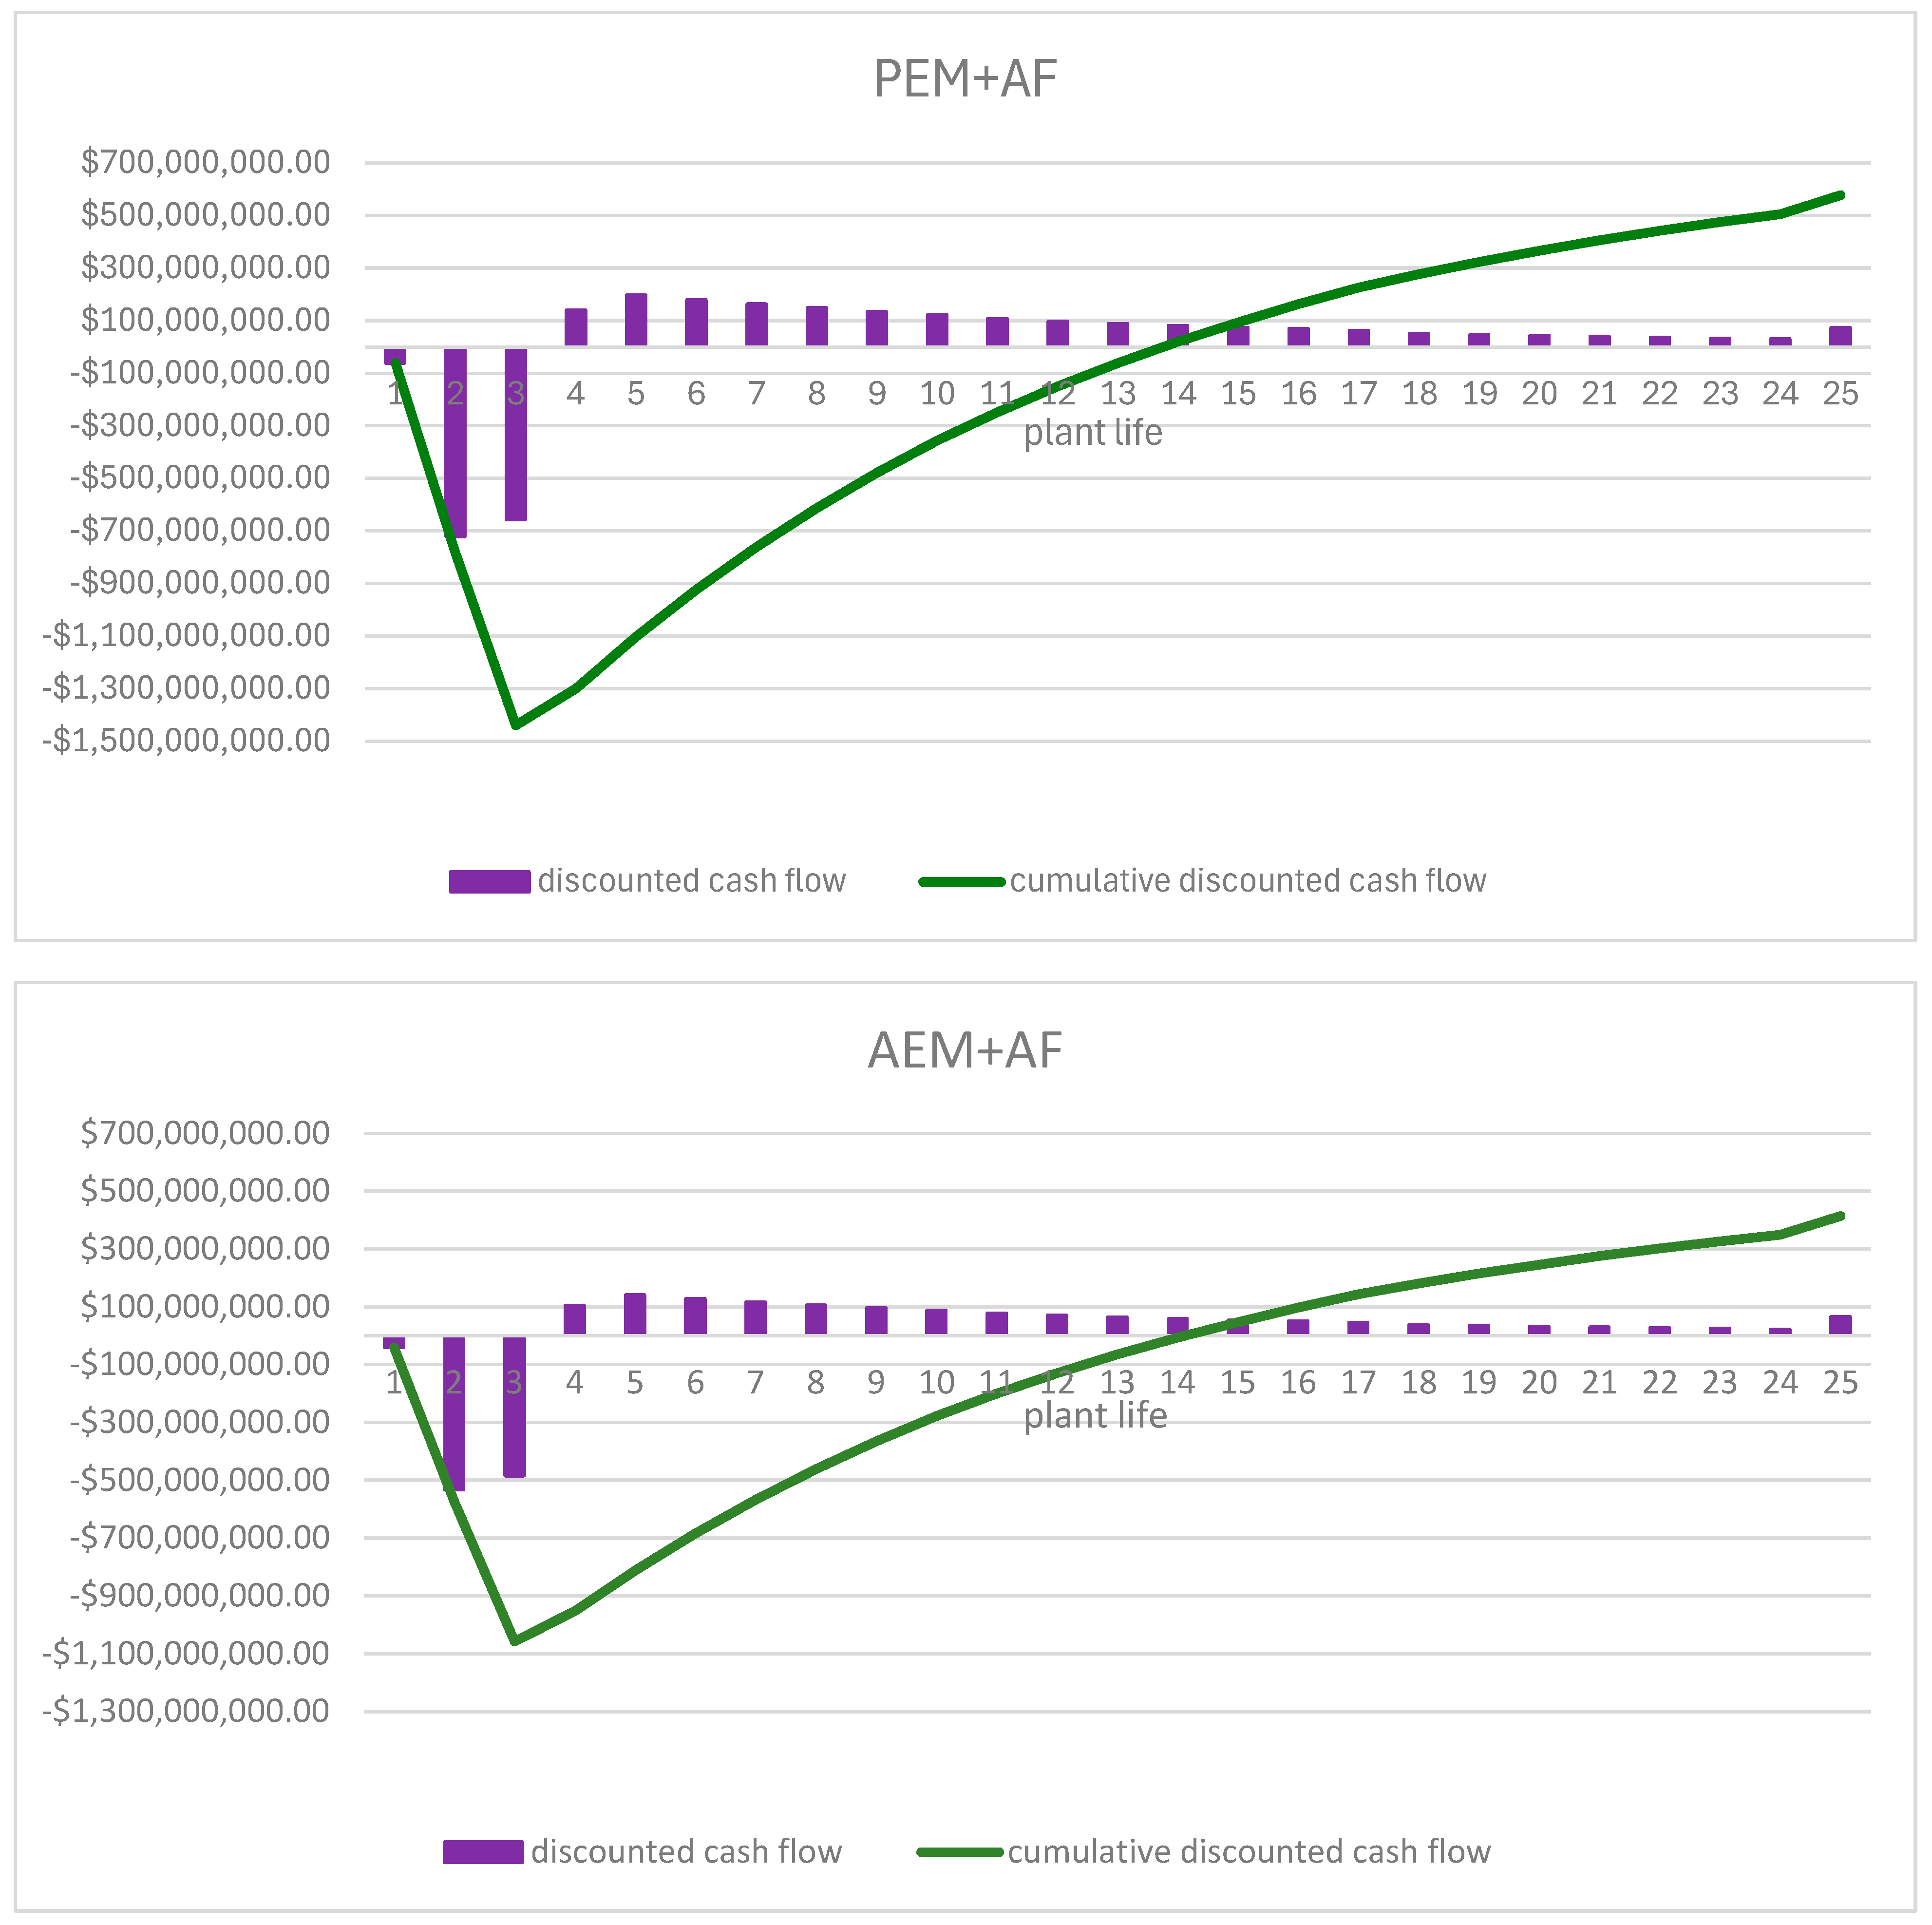
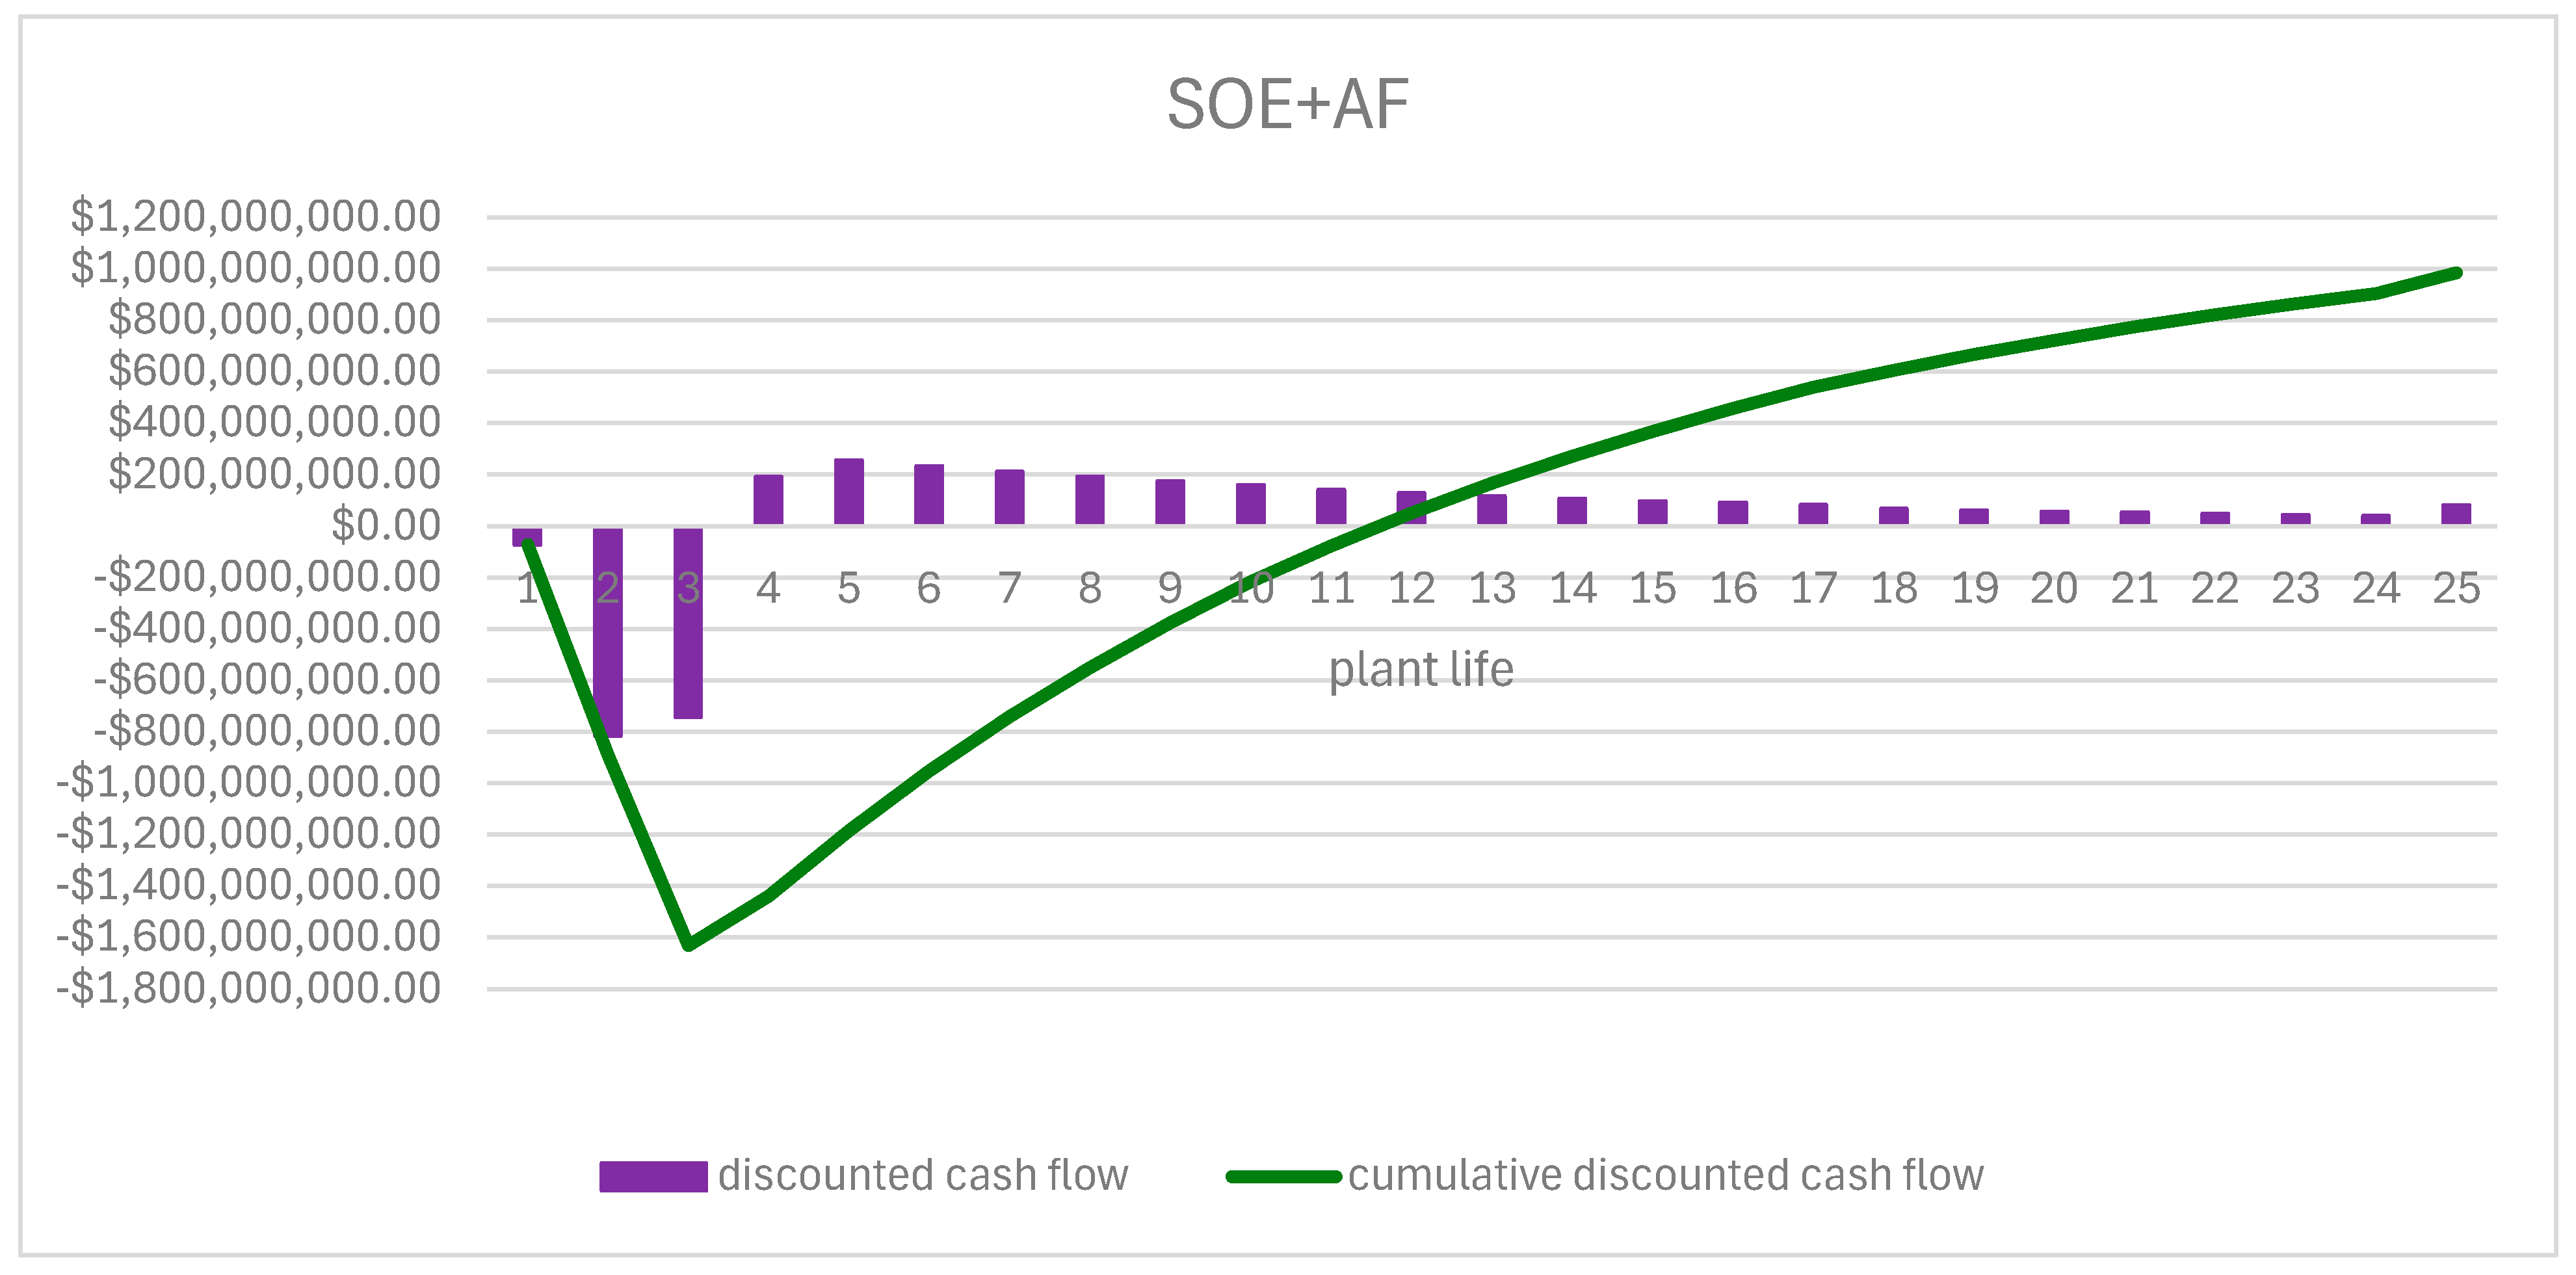
Figure 7 evaluates the three AF-integrated options using discounted cash flow (DCF) and cumulative discounted cash flow (CDCF). Overall, Figure 7 demonstrates that when discounting is applied, late-life cash flows contribute much less to project value, and the ranking PEM+AF < SOE+AF in Figure 6 becomes even more pronounced in NPV terms. The analysis highlights that for long-lived, capital-intensive hydrogen systems, early, high-magnitude positive cash flows and high thermodynamic efficiency (as in SOE+AF) are critical for achieving attractive discounted returns, whereas designs with lower efficiency or higher OPEX (AEM+AF) struggle to generate sufficient NPV even if they are nominally cash-positive over 25 years. The rate of return on investment (ROI) values were calculated as 15% (AF+PEM), 11% (AF+AEM), and 17% (AF+SOE).
Table 6 summarizes the selected economic-efficiency indicators and their calculated values for the PEM, AEM, and SOE electrolyzers. For indicator 4, values are generated for both pessimistic (high) and optimistic (low) values, but the optimistic score is used in the remainder of the calculations.
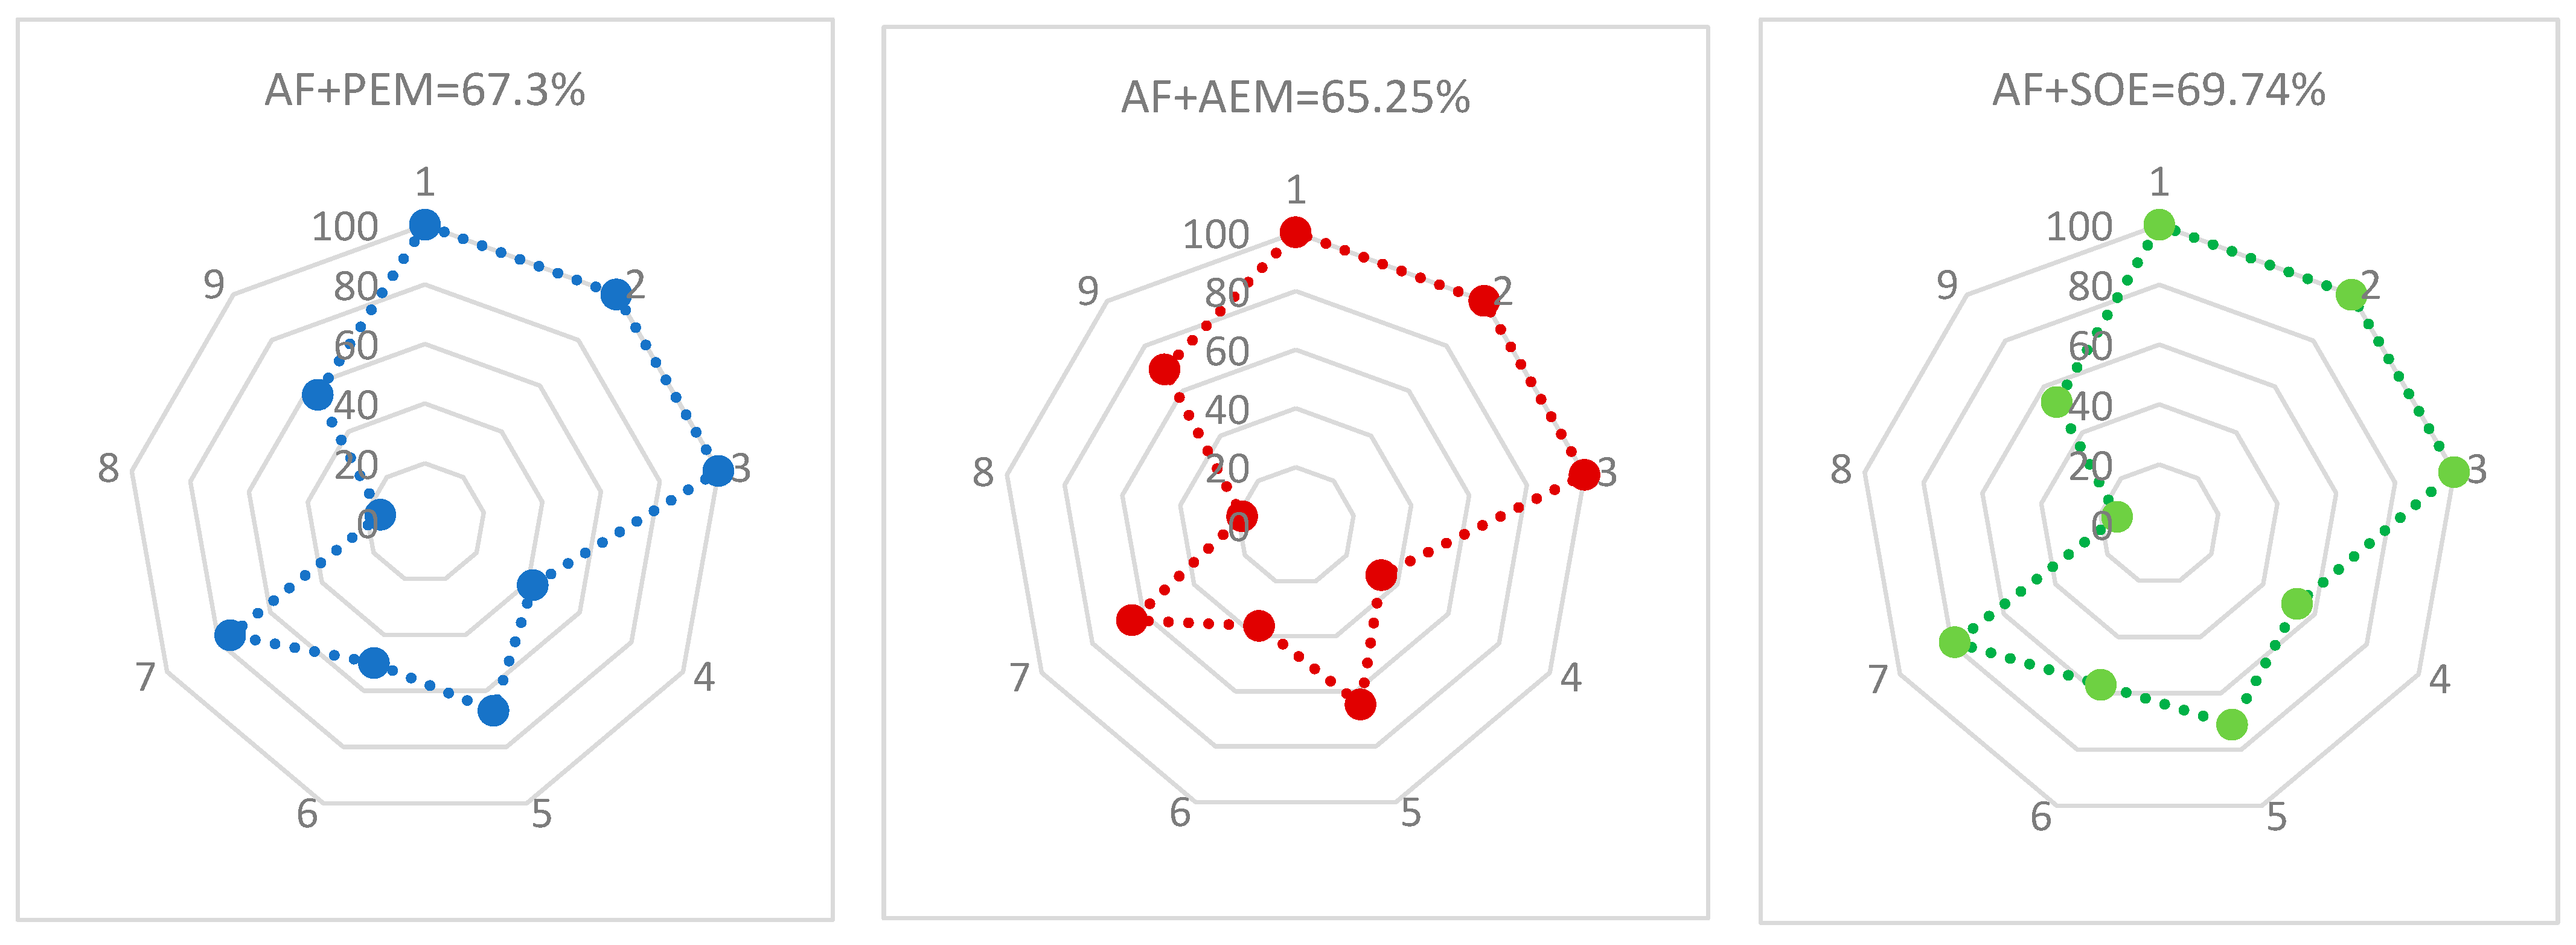
The main drawback of the proposed integrated process remains its economics, since hydrogen produced by electrolysis still carries a high manufacturing cost, currently estimated at about 4.3–7.3 $ kg−1. Figure 8 compares the economic efficiency of the three integrated configurations using nine normalized economic indicators (1–9), aggregated into overall scores of 67.3% (AF+PEM), 65.25% (AF+AEM) and 69.74% (AF+SOE). Overall, Figure 8 reinforces that, under the assumed economic conditions, SOE+AF is the most economically attractive configuration, PEM+AF is viable but less competitive, and AEM+AF is currently the weakest option in purely economic terms, even though all three provide strong environmental performance.
Nevertheless, the most challenging aspect of the proposed integrated AF–electrolyzer process remains the economic factor, mainly because hydrogen production through water electrolysis is still associated with relatively high production costs. In the present study, the calculated LCOH values range from approximately 4.3 to 7.3 $ kg−1 H2, depending on the electrolyzer technology and CAPEX/OPEX assumptions. These values are broadly consistent with the current cost range reported for electrolysis-based hydrogen production, which is commonly estimated at about 5–6 $ kg−1 H2 under many present-day conditions [22]. However, they are still higher than conventional natural gas–based hydrogen production routes such as steam methane reforming (SMR), particularly when CO2 pricing or strict emission penalties are not considered. Therefore, achieving economic competitiveness with SMR requires a substantial reduction in the cost of electrolytic hydrogen production. Previous techno-economic comparisons suggest that cost parity with SMR would require the electrolysis-based hydrogen production cost to decrease to approximately 2.08–2.27 $ kg−1 H2, depending on plant capacity, electricity cost, electrolyzer performance, and system boundary assumptions [22].
This comparison indicates that the proposed AF–electrolyzer system is not yet the lowest-cost hydrogen production pathway under current economic assumptions. However, its economic performance can be improved through several process-integration and technology-development strategies. In particular, the oxygen generated as a by-product from water electrolysis has direct value in the proposed configuration because it can partially satisfy the oxy-combustion oxygen demand of the AF cycle, thereby reducing the load and operating cost of the air separation unit. In addition, the use of internally generated water from the AF cycle reduces the need for external freshwater supply, while heat integration, especially in the SOE-based configuration, can decrease the electrical energy requirement for hydrogen production. Therefore, a more detailed profitability analysis should be conducted in future work by considering different plant scales, electrolyzer replacement schedules, oxygen credit, infrastructure cost, hydrogen conditioning, compression, storage, transportation, and potential carbon-management incentives.
From the sustainability perspective, the economic dimension is the weakest component of the proposed integrated process compared with the material and environmental dimensions. In the present analysis, the economic sustainability scores are 67.3%, 65.25%, and 69.74% for AF+PEM, AF+AEM, and AF+SOE, respectively, with an average economic sustainability score of approximately 67.43%. These values confirm that the process is promising but still economically constrained. If the hydrogen production cost could be reduced toward the SMR-competitive range of approximately 2.08–2.27 $ kg−1 H2, the economic sustainability score would increase significantly because the total product cost indicator is one of the most influential economic indicators in the assessment framework. Therefore, future reductions in electrolyzer CAPEX, electricity-related costs, stack replacement cost, and balance-of-plant expenses are essential for improving the economic sustainability of AF-based power-to-hydrogen systems and advancing them toward practical large-scale deployment.
The overall average sustainability scores of 81.4, 80.3, and 83.0 for PEM+AF, AEM+AF, and SOE+AF, respectively, indicate that all three integrated systems operate in a high-sustainability regime, with only modest differences (a spread of ≈3 percentage points). This confirms that coupling the Allam–Fetvedt cycle with any of the three electrolyzer technologies yields a configuration that is simultaneously strong in sustainability (especially material and environmental perspectives) when assessed over the full plant life.
Although the proposed AF–electrolyzer configurations show promising material, environmental, and techno-economic performance, several limitations should be acknowledged. First, the analysis is based on steady-state Aspen HYSYS simulations; therefore, transient behavior, start-up/shut-down operation, part-load performance, and dynamic coupling between the AF cycle and electrolyzer units were not considered. Future work should include dynamic process modeling and control analysis to evaluate operational flexibility and system stability under variable load conditions. Second, the techno-economic analysis relies on literature-based CAPEX/OPEX ranges and fixed assumptions for plant lifetime, discount rate, oxygen credit, and electrolyzer efficiency. Since electrolyzer cost, stack lifetime, replacement frequency, electricity cost, and oxygen value can vary significantly, future studies should include detailed uncertainty and sensitivity analyses to quantify their influence on LCOH, NPV, payback period, and economic sustainability.
Third, the current work focuses on process-level direct integration and does not include a full life-cycle assessment of upstream natural gas supply, methane leakage, equipment manufacturing, electrolyzer materials, CO2 transport/storage, or end-of-life impacts. Therefore, future work should combine the proposed sustainability framework with cradle-to-gate or cradle-to-grave life-cycle assessment to quantify the complete carbon intensity of the produced hydrogen. Fourth, the present model considers hydrogen production at the plant boundary but does not fully account for downstream hydrogen compression, purification, storage, distribution, or final-use infrastructure. These elements should be incorporated in future techno-economic evaluations to obtain a more complete delivered hydrogen cost.
Finally, while the AF+SOE configuration provides the strongest overall performance in this study, SOE technology still faces practical challenges related to high-temperature materials, sealing, thermal cycling, degradation, and long-term durability. Future research should therefore focus on improving SOE stack lifetime, reducing replacement cost, optimizing heat integration between the AF cycle and SOE system, and validating the integrated concept using pilot-scale or experimental data. Addressing these limitations will provide a more comprehensive basis for assessing the practical deployment potential of AF-based low-carbon power-to-hydrogen systems.
The comparative results reported in this study are based on steady-state, full-load simulations and should therefore be interpreted within this operating boundary. Dynamic effects such as load-following, start-up and shut-down operation, thermal cycling, time-dependent degradation, and variable heat matching between the AF power block and the electrolyzer systems were not explicitly simulated. These factors may influence both the technical and economic ranking of the three configurations. In particular, a reduction in capacity factor decreases annual hydrogen production while leaving a substantial portion of annualized capital costs unchanged, thereby increasing LCOH. The effect may be more significant for SOE because frequent thermal cycling and variable high-temperature heat availability can increase degradation, reduce effective thermal-integration benefits, and potentially shorten stack lifetime. PEM and AEM systems, which operate at lower temperatures, may therefore become comparatively more favorable under highly flexible or strongly transient operating regimes. Consequently, the superior performance of AF+SOE identified in this work should be understood as a steady-state full-load result rather than a universal ranking under all operating conditions.
Future uncertainty and scenario analyses should therefore investigate the sensitivity of LCOH, energy sustainability score, and overall technology ranking to capacity factor, electrolyzer efficiency, stack degradation rate, stack replacement interval, available heat-recovery fraction, CAPEX, fixed and variable OPEX, oxygen credit, and discount rate. Such an analysis would provide a quantitative measure of ranking robustness under realistic operating variability.
The environmental assessment is likewise limited to the defined process boundary and does not represent a complete cradle-to-gate life-cycle assessment. Upstream emissions associated with natural gas extraction, processing, and transport, particularly methane leakage, as well as emissions associated with mining and processing electrolyzer raw materials, stack and balance-of-plant manufacturing, CO2 transport and storage, and end-of-life management were not included. Therefore, the high environmental sustainability scores reported in the present study describe process-level environmental performance and should not be interpreted as a complete life-cycle verification of low-carbon hydrogen. A cradle-to-gate LCA integrating upstream fuel-supply emissions, equipment manufacturing burdens, material criticality, and carbon-management infrastructure is required in future work to determine the full greenhouse-gas intensity of the produced hydrogen and to compare it rigorously with gray, blue, and renewable-electrolysis pathways.

5. Conclusions

This study presented a comparative sustainability and techno-economic assessment of an integrated power-to-hydrogen process in which a 437 MW-net natural gas–fired Allam–Fetvedt supercritical CO2 cycle is coupled with PEM, AEM, and SOE water electrolyzer systems. The assessment combined Aspen HYSYS-based process simulation, CAPEX/OPEX estimation, levelized cost of hydrogen analysis, cash-flow evaluation, and a multidimensional sustainability framework covering material, energy, environmental, and economic indicators. This integrated evaluation allowed the three AF–electrolyzer pathways to be compared not only in terms of hydrogen production performance, but also in terms of their broader sustainability and economic feasibility.
The sustainability assessment showed that all three integrated configurations achieved very strong material and environmental performance. Material efficiency scores were 96.02%, 95.51%, and 96.8% for AF+PEM, AF+AEM, and AF+SOE, respectively, indicating efficient utilization of feedstocks, limited material losses, and strong internal resource circulation. The process was also found to be water self-sufficient because the water required for electrolysis can be supplied internally from the AF cycle. In addition, the oxygen generated as an electrolysis by-product can supply approximately 25–30% of the oxygen required by the AF combustor, reducing the dependence on external oxygen production and improving overall process integration.
Environmental sustainability was the strongest dimension for all three designs. The environmental scores were 97.46%, 97.44%, and 97.5% for AF+PEM, AF+AEM, and AF+SOE, respectively, showing that the environmental performance of the three alternatives is almost equivalent. These high scores confirm the advantage of integrating water electrolysis with the AF cycle, particularly because CO2 is largely retained within the process loop and no additional freshwater demand is required. Therefore, from an environmental perspective, the choice of electrolyzer technology is not the main differentiating factor; instead, all three pathways operate in a highly favorable environmental sustainability regime.
In contrast, the energy sustainability results revealed clearer technology-dependent differences. The energy-efficiency scores were 64.75%, 62.88%, and 67.84% for AF+PEM, AF+AEM, and AF+SOE, respectively. These values show that energy performance is the main sustainability limitation of the integrated process. Among the three configurations, AF+SOE achieved the best energy score due to the higher thermodynamic efficiency of solid oxide electrolysis and its ability to benefit from high-temperature heat integration with the AF cycle. AF+PEM showed intermediate performance, while AF+AEM had the lowest energy score under the assumptions used in this study. Thus, improving energy efficiency, heat integration, and auxiliary energy demand should be a priority for future optimization.
The economic evaluation identified cost as the most critical barrier to large-scale implementation. The calculated levelized cost of hydrogen ranged from approximately 4.3 to 7.3 $ kg−1 H2 across the optimistic and pessimistic CAPEX/OPEX scenarios. Among the evaluated options, AF+SOE consistently delivered the lowest LCOH, followed by AF+PEM and AF+AEM. The economic sustainability scores were 67.3%, 65.25%, and 69.74% for AF+PEM, AF+AEM, and AF+SOE, respectively, confirming that AF+SOE is the most economically attractive pathway, while AF+AEM remains the least favorable under the current cost and performance assumptions. The cash-flow analysis further supported this ranking, with ROI values of 15%, 11%, and 17% for AF+PEM, AF+AEM, and AF+SOE, respectively.
When the four sustainability dimensions were aggregated, the overall sustainability scores were 81.4%, 80.3%, and 83.0% for AF+PEM, AF+AEM, and AF+SOE, respectively. These results indicate that all three systems are promising from a sustainability perspective, but AF+SOE provides the most balanced overall performance. Its advantage is mainly associated with superior energy efficiency, lower hydrogen production cost, stronger economic indicators, and similarly high material and environmental sustainability compared with PEM and AEM. Therefore, under the steady-state, full-load assumptions, defined process boundary, and adopted stack-efficiency, lifetime, and replacement-cost conditions, AF+SOE provides the most favorable overall performance and achieves the highest sustainability score among the three evaluated configurations. However, this ranking should not be interpreted as universally valid for industrial operation. The practical advantage of AF+SOE is particularly sensitive to high-temperature stack durability, since degradation of ceramic electrochemical components, deterioration of seals and interconnects, and repeated thermal cycling can reduce SOE efficiency and hydrogen productivity while increasing replacement frequency and lifetime cost. These effects would increase LCOH and decrease both the economic and overall sustainability scores, potentially narrowing the performance gap between AF+SOE and the lower-temperature PEM and AEM alternatives. In addition, the relative ranking should be reassessed under dynamic operating conditions and within a cradle-to-gate life-cycle boundary before definitive conclusions are drawn regarding practical deployment. Consequently, long-term SOE durability, thermal-cycling resistance, sealing reliability, stack-replacement cost, dynamic heat-integration performance, and full life-cycle environmental impacts constitute the principal technological and sustainability bottlenecks that must be addressed before the superior steady-state performance identified in this study can be translated into industrial implementation.
The results of this study also reveal several important research gaps that must be addressed before AF-integrated low-carbon hydrogen systems can be practically implemented. First, while the present steady-state analysis provides a consistent comparison of PEM, AEM, and SOE integration, the dynamic interaction between the AF power cycle and electrolyzer units remains insufficiently understood. Future studies should therefore investigate transient operation, part-load performance, start-up/shut-down behavior, and control strategies for maintaining stable operation under variable hydrogen demand or flexible power-generation conditions. Second, the economic results indicate that the proposed process is still constrained by the high cost of electrolysis-based hydrogen production. Therefore, a major research gap is the lack of reliable large-scale cost data for integrated AF–electrolyzer systems, especially considering electrolyzer CAPEX reduction, stack lifetime, degradation, replacement cost, oxygen credit, and high-temperature balance-of-plant cost. Future techno-economic studies should include uncertainty analysis, scale-up effects, and sensitivity analysis for these parameters.
Third, although the environmental sustainability scores are high at the process level, a complete life-cycle assessment is required to quantify the full carbon intensity of the produced hydrogen. Future work should include upstream natural gas supply, methane leakage, equipment manufacturing, electrolyzer materials, CO2 transport/storage, and end-of-life impacts. This is particularly important for correctly classifying the produced hydrogen as low-carbon and for comparing it with conventional gray, blue, and renewable electrolysis-based hydrogen pathways. Finally, the study identifies AF+SOE as the most promising configuration among the evaluated alternatives, but SOE technology still requires further development in terms of durability, thermal cycling resistance, sealing, high-temperature materials, and long-term stack stability. Therefore, experimental validation, pilot-scale testing, and integrated dynamic simulation are needed to confirm the practical feasibility of AF+SOE systems. Addressing these research gaps will allow future studies to move beyond conceptual sustainability assessment toward optimized, validated, and deployable AF-based power-to-hydrogen systems.
Overall, the proposed AF–electrolyzer platform demonstrates strong potential as a low-carbon and sustainability-oriented hydrogen production route. The analysis shows that the process performs particularly well in material and environmental dimensions, while the main limitations are energy efficiency and economic competitiveness. Future development should therefore focus on reducing electrolyzer CAPEX, extending stack lifetime, improving SOE durability, lowering replacement costs, optimizing oxygen and heat integration, and conducting sensitivity and uncertainty analyses for major economic assumptions. These improvements are essential for reducing LCOH and advancing AF-based power-to-hydrogen systems toward practical large-scale deployment. The conclusions of this study are specifically applicable to the defined process boundary and the 437 MW-net rated, steady-state, continuous full-load operating condition adopted for the AF–electrolyzer simulations. The analysis does not include transient load variation, start-up/shut-down operation, part-load performance, dynamic heat matching, or downstream hydrogen compression, storage, transportation, and delivery infrastructure. Consequently, the reported LCOH, economic performance, sustainability scores, and relative ranking of AF+PEM, AF+AEM, and AF+SOE should not be interpreted as universally applicable to flexible or intermittent industrial operation. The comparative ranking should therefore be reassessed when dynamic operating behavior, different capacity factors, downstream hydrogen handling requirements, and broader life-cycle system boundaries are considered.
Future research should move from steady-state conceptual assessment toward experimentally and dynamically validated AF–electrolyzer systems. In particular, pilot-scale AF–SOE co-generation studies are needed to verify the practical feasibility of simultaneous electricity generation, high-temperature steam/heat utilization, hydrogen production, and oxygen recovery. Dynamic models should be developed to examine start-up, shut-down, part-load operation, thermal cycling, and time-dependent heat matching between AF hot streams and SOE heat demand. Multi-objective optimization should then be applied to determine operating conditions that simultaneously minimize LCOH, maximize energy efficiency and heat-recovery utilization, and limit SOE thermal degradation. Additional work should quantify stack degradation and replacement under cycling conditions, evaluate CAPEX/OPEX and discount-rate uncertainty, and extend the environmental assessment to a cradle-to-gate life-cycle boundary including natural gas supply, methane leakage, electrolyzer material production, equipment manufacturing, recycling, and end-of-life treatment.

Supplementary Materials

The following supporting information can be downloaded at: https://www.mdpi.com/article/10.3390/fuels7030064/s1, Figure S1: Simplified flowsheet of the Allam–Fetvedt cycle [5]; Figure S2: Aspen HYSYS Allam–Fetvedt cycle simulation; Table S1: Allam–Fetvedt cycle unit’s main inlet and outlet streams; Figure S3: AEM Simulation on Aspen HYSYS; Table S2: AEM electrolyzers’ unit main inlet and outlet streams; Figure S4: PEM Simulation on Aspen HYSYS; Table S3: PEM electrolyzer unit main inlet and outlet streams; Figure S5: SOE Simulation on Aspen HYSYS; Table S4: SOE electrolyzers’ unit main inlet and outlet streams.

Author Contributions

Conceptualization, S.K.; methodology, S.K. and A.A.; software, A.A.; validation, S.K. and A.A.; formal analysis, S.K. and A.A.; investigation, S.K. and A.A.; resources, S.K.; data curation, S.K. and A.A.; writing—original draft preparation, S.K. and A.A.; writing—review and editing, S.K.; visualization, S.K. and A.A.; supervision, S.K. All authors have read and agreed to the published version of the manuscript.

Funding

This research received no external funding.

Data Availability Statement

The data supporting the findings of this study are included in the original manuscript and the Supplementary Material. Additional data, including detailed calculations, simulation outputs, and supporting analysis files, are available from the corresponding author upon reasonable request.

Acknowledgments

During the preparation of this manuscript, AI was used only for language editing, grammar correction, sentence restructuring, and improvement of readability and academic clarity. The tool was not used to generate original scientific content, perform data analysis, create results, interpret findings, or make conclusions. All technical content, calculations, simulations, sustainability assessment results, techno-economic analysis, interpretations, and final conclusions were developed, checked, and approved by the authors. The authors take full responsibility for the accuracy, integrity, and originality of the manuscript.

Conflicts of Interest

The authors declare no conflicts of interest.

Abbreviations

The following abbreviations and nomenclature are used in this manuscript:
Abbreviations
AbbreviationDefinitionUnit/Description
AAEActual Atom EconomyDimensionless or kg/kg
AEAtom EconomyDimensionless or kg/kg
AEMAnion Exchange MembraneElectrolyzer technology
AFAllam–FetvedtSupercritical CO2 power cycle
AHPAnalytical Hierarchy ProcessMulti-criteria weighting method
ASUAir Separation Unit
ATRAutothermal Reforming
CAPEXCapital ExpenditureUSD or USD/kW
CCFCumulative Cash FlowUSD
CCPCumulative Cash PositionUSD
CCSCarbon Capture and Storage
CCUCarbon Capture and Utilization
CDCFCumulative Discounted Cash FlowUSD
CEPCIChemical Engineering Plant Cost IndexCost-escalation index
CO2Carbon Dioxide
COMCost of ManufacturingUSD or USD/kg product
CRFCapital Recovery FactorDimensionless
DCFDiscounted Cash FlowUSD
DMEDimethyl Ether
EPEconomic PotentialUSD/kg product
EROIEnergy Return on InvestmentkJ/kJ
FCIFixed Capital InvestmentUSD
GEGeneral ExpensesUSD
GWPGlobal Warming Potentialkg CO2-eq./kg product, where applicable
H2Hydrogen
H2OWater
ISBLInside Battery LimitsCapital-cost component
LCALife-Cycle Assessment
LCOHLevelized Cost of HydrogenUSD/kg H2
MCDAMulti-Criteria Decision Analysis
MIMass Intensitykg/kg product
MLIMass Loss Indexkg/kg
MPMass Productivitykg/kg
NPVNet Present ValueUSD
O2Oxygen
OPEXOperating ExpenditureUSD/year or USD/kW
OSBLOutside Battery LimitsCapital-cost component
PEMProton Exchange MembraneElectrolyzer technology
PIDProcess Integration DegreekJ/kJ
PVPresent ValueUSD
REEResource Energy EfficiencykJ/kJ
RMEReaction Mass Efficiencykg/kg
ROIReturn on Investment%/year
RYReaction Yieldkg/kg or dimensionless
SMRSteam Methane Reforming
SOESolid Oxide ElectrolyzerHigh-temperature electrolyzer
TCITotal Capital InvestmentUSD
TECTotal Equipment CostUSD
TMCTotal Material Consumptionkg
TPCTotal Product CostUSD/kg
WFPWater Footprintm3
Symbols
SymbolDefinitionUnit/Description
C C A P E X Capital expenditureUSD
C C F t Cumulative cash flow up to year t USD
C D C F t Cumulative discounted cash flow up to year t USD
C E , t o t Total energy costUSD
C f i x e d Fixed operating costUSD/year
C F t Cash flow in year t USD/year
C N G Natural gas costUSD/year
C O 2 Oxygen cost or oxygen creditUSD/year
C O P E X Operating expenditureUSD/year
C v a r i a b l e Variable operating costUSD/year
C w a t e r , t o t Total water costUSD
D C F t Discounted cash flow in year t USD
E i n t e n s i t y Energy intensitykJ/USD
E s p e c i f i c Specific energy intensitykJ/kg
E w a s t e Energy required for waste treatmentkJ/kg
i Discount/interest rateFraction or %
m H 2 Hydrogen mass flow ratekg/h
m H 2 O Water mass flow ratekg/h
m O 2 Oxygen mass flow ratekg/h
N Plant/project lifetimeyear
N c e l l Number of electrolyzer cellsDimensionless
n ˙ H 2 Hydrogen molar flow ratekmol/h
n ˙ H 2 O Water molar flow ratekmol/h
n ˙ O 2 Oxygen molar flow ratekmol/h
P a u x Internal/auxiliary power consumptionMW
P c e l l Electrical power consumption of a single electrolyzer cell at the selected operating pointkW/cell
P e l Total electrical power supplied to the electrolyzer systemkW or MW
P g r o s s Gross electrical power output of the AF cycleMW
P n e t Net electrical power output of the AF cycleMW
p H 2 Hydrogen selling priceUSD/kg H2
p N G Natural gas unit priceUSD/MMBtu
p O 2 Oxygen unit priceUSD/kg
Q H 2 Annual hydrogen productionkg/year
t Time or project yearyear
η e l Electrolyzer electrical efficiencyFraction or %

References

  1. Pichardo, P.A.; Karagöz, S.; Manousiouthakis, V.I.; Tsotsis, T.; Ciora, R. Techno-economic analysis of an intensified integrated gasification combined cycle (IGCC) power plant featuring a combined membrane reactor-adsorptive reactor (MR-AR) system. Ind. Eng. Chem. Res. 2019, 59, 2430–2440. [Google Scholar] [CrossRef] [Scilit]
  2. Karagöz, S.; da Cruz, F.E.; Tsotsis, T.T.; Manousiouthakis, V.I. Multi-scale membrane reactor (MR) modeling and simulation for the water gas shift reaction. Chem. Eng. Process. Process Intensif. 2018, 133, 245–262. [Google Scholar] [CrossRef] [Scilit]
  3. Karagöz, S.; Tsotsis, T.T.; Manousiouthakis, V.I. Multi-scale modeling and simulation of a novel membrane reactor (MR)/adsorptive reactor (AR) process. Chem. Eng. Process. Process Intensif. 2019, 137, 148–158. [Google Scholar] [CrossRef] [Scilit]
  4. Karagöz, S. Multi-Scale Modeling and Simulation of Intensified Reactive-Separation Processes for Hydrogen Production and CO2 Capture via the Water-Gas Shift Reaction (WGSR). Ph.D. Thesis, University of California, Los Angeles, CA, USA, 2018. [Google Scholar]
  5. Karagöz, S. A methodological sustainability assessment to process intensification (MSAtoPI) by reactive-separation systems. Fuel 2023, 348, 128562. [Google Scholar] [CrossRef] [Scilit]
  6. Ruiz-Mercado, G.J.; Smith, R.L.; Gonzalez, M.A. Sustainability indicators for chemical processes: I. Taxonomy. Ind. Eng. Chem. Res. 2012, 51, 2309–2328. [Google Scholar] [CrossRef] [Scilit]
  7. Ruiz-Mercado, G.J.; Smith, R.L.; Gonzalez, M.A. Sustainability indicators for chemical processes: II. Data needs. Ind. Eng. Chem. Res. 2012, 51, 2329–2353. [Google Scholar] [CrossRef] [Scilit]
  8. Ruiz-Mercado, G.J.; Gonzalez, M.A.; Smith, R.L. Sustainability indicators for chemical processes: III. Biodiesel case study. Ind. Eng. Chem. Res. 2013, 52, 6747–6760. [Google Scholar] [CrossRef] [Scilit]
  9. Guerra, O.J.; Eichman, J.; Kurtz, J.; Hodge, B.M. Cost competitiveness of electrolytic hydrogen. Joule 2019, 3, 2425–2443. [Google Scholar] [CrossRef] [Scilit]
  10. Kumar, S.S.; Lim, H. An overview of water electrolysis technologies for green hydrogen production. Energy Rep. 2022, 8, 13793–13813. [Google Scholar] [CrossRef] [Scilit]
  11. Ginsberg, M.; Zhang, Z.; Atia, A.A.; Venkatraman, M.; Esposito, D.V.; Fthenakis, V.M. Integrating solar energy, desalination, and electrolysis. Sol. RRL 2022, 6, 2100732. [Google Scholar] [CrossRef] [Scilit]
  12. Raya-Imbernón, A.; Samu, A.A.; Barwe, S.; Cusati, G.; Fődi, T.; Hepp, B.M.; Janáky, C. Renewable syngas generation via low-temperature electrolysis: Opportunities and challenges. ACS Energy Lett. 2023, 9, 288–297. [Google Scholar] [CrossRef] [Scilit] [PubMed]
  13. Samu, A.A.; Kormányos, A.; Kecsenovity, E.; Szilágyi, N.; Endrodi, B.; Janaky, C. Intermittent operation of CO2 electrolyzers at industrially relevant current densities. ACS Energy Lett. 2022, 7, 1859–1861. [Google Scholar] [CrossRef] [Scilit] [PubMed]
  14. Abousalmia, A.; Karagoz, S. Design and Simulation of an Integrated Process for the Co-Production of Power, Hydrogen, and DME by Using an Electrolyzer’s System. Energies 2025, 18, 2446. [Google Scholar] [CrossRef] [Scilit]
  15. Abousalmia, A.; Al-Remaihi, L.; Al-Kaabi, S.; Jassim, F.; Karagoz, S. Simulation and Environmental Sustainability Assessment of an Integrated LNG-Power Cycle-Electrolyzer-Methanol Process for Clean Energy Generation. Processes 2025, 13, 1476. [Google Scholar] [CrossRef] [Scilit]
  16. Chan, W.; Morosuk, T.; Li, X.; Li, H. Allam cycle: Review of research and development. Energy Convers. Manag. 2023, 294, 117607. [Google Scholar] [CrossRef] [Scilit]
  17. Barba, F.C.; Sanchez, G.M.D.; Segui, B.S.; Darabkhani, H.G.; Anthony, E.J. A technical evaluation, performance analysis and risk assessment of multiple novel oxy-turbine power cycles with complete CO2 capture. J. Clean. Prod. 2016, 133, 971–985. [Google Scholar] [CrossRef] [Scilit]
  18. Sifat, N.S.; Haseli, Y. A critical review of CO2 capture technologies and prospects for clean power generation. Energies 2019, 12, 4143. [Google Scholar] [CrossRef] [Scilit]
  19. Rogalev, A.; Rogalev, N.; Kindra, V.; Komarov, I.; Zlyvko, O. Research and development of the oxy-fuel combustion power cycles with CO2 recirculation. Energies 2021, 14, 2927. [Google Scholar] [CrossRef] [Scilit]
  20. Hassan, N.S.; Jalil, A.A.; Rajendran, S.; Khusnun, N.F.; Bahari, M.B.; Johari, A.; Kamaruddin, M.; Ismail, M. Recent review and evaluation of green hydrogen production via water electrolysis for a sustainable and clean energy society. Int. J. Hydrogen Energy 2024, 52, 420–441. [Google Scholar] [CrossRef] [Scilit]
  21. Wang, J.; Wen, J.; Wang, J.; Yang, B.; Jiang, L. Water electrolyzer operation scheduling for green hydrogen production: A review. Renew. Sustain. Energy Rev. 2024, 203, 114779. [Google Scholar] [CrossRef] [Scilit]
  22. Karagoz, S.; Badruzzaman, A.; Eljack, F. Sustainable-green Hydrogen Production through Integrating Electrolysis, Water Treatment and Solar Energy. Front. Chem. Eng. 2025, 7, 1526331. [Google Scholar] [CrossRef] [Scilit]
  23. Carmo, M.; Keeley, G.P.; Holtz, D.; Grube, T.; Robinius, M.; Müller, M.; Stolten, D. PEM water electrolysis: Innovative approaches towards catalyst separation, recovery and recycling. Int. J. Hydrogen Energy 2019, 44, 3450–3455. [Google Scholar] [CrossRef] [Scilit]
  24. Varcoe, J.R.; Atanassov, P.; Dekel, D.R.; Herring, A.M.; Hickner, M.A.; Kohl, P.A.; Zhuang, L. Anion-exchange membranes in electrochemical energy systems. Energy Environ. Sci. 2014, 7, 3135–3191. [Google Scholar] [CrossRef] [Scilit]
  25. Ni, M.; Leung, M.K.; Leung, D.Y. Technological development of hydrogen production by solid oxide electrolyzer cell (SOEC). Int. J. Hydrogen Energy 2008, 33, 2337–2354. [Google Scholar] [CrossRef] [Scilit]
  26. Graves, C.; Ebbesen, S.D.; Mogensen, M.; Lackner, K.S. Sustainable hydrocarbon fuels by recycling CO2 and H2O with renewable or nuclear energy. Renew. Sustain. Energy Rev. 2011, 15, 1–23. [Google Scholar] [CrossRef] [Scilit]
  27. Krajnc, D.; Glavič, P. Indicators of sustainable production. Clean Technol. Environ. Policy 2003, 5, 279–288. [Google Scholar] [CrossRef] [Scilit]
  28. Azapagic, A.; Perdan, S. Indicators of sustainable development for industry: A general framework. Process Saf. Environ. Prot. 2000, 78, 243–261. [Google Scholar]
  29. Gonzalez, M.A.; Smith, R.L. A methodology to evaluate process sustainability. Environ. Prog. 2003, 22, 269–276. [Google Scholar] [CrossRef] [Scilit]
  30. IChemE. The Sustainability Metrics: Sustainable Development Progress Metrics Recommended for Use in the Process Industry; IChemE: Rugby, UK, 2002. [Google Scholar]
  31. Schwarz, J.; Beloff, B.; Beaver, E. Use sustainability metrics to guide decision-making. Chem. Eng. Prog. 2002, 98, 58–63. [Google Scholar]
  32. Global Reporting Initiative (GRI). Sustainability Reporting Guidelines. October 2021. Available online: http://www.globalreporting.org/Home (accessed on 13 March 2026).
  33. Gan, X.; Fernandez, I.C.; Guo, J.; Wilson, M.; Zhao, Y.; Zhou, B.; Wu, J. When to use what: Methods for weighting and aggregating sustainability indicators. Ecol. Indic. 2017, 81, 491–502. [Google Scholar] [CrossRef] [Scilit]
  34. Waas, T.; Hugé, J.; Block, T.; Wright, T.; Benitez-Capistros, F.; Verbruggen, A. Sustainability assessment and indicators: Tools in a decision-making strategy for sustainable development. Sustainability 2014, 6, 5512–5534. [Google Scholar] [CrossRef] [Scilit]
  35. Singh, R.K.; Murty, H.R.; Gupta, S.K.; Dikshit, A.K. An overview of sustainability assessment methodologies. Ecol. Indic. 2012, 15, 281–299. [Google Scholar] [CrossRef] [Scilit]
  36. Wulf, C.; Haase, M.; Baumann, M.; Zapp, P. Weighting factor elicitation for sustainability assessment of energy technologies. Sustain. Energy Fuels 2023, 7, 832–847. [Google Scholar] [CrossRef] [Scilit]
  37. Timmerhaus, K.D.; West, R.E. Plant Design and Economics for Chemical Engineers; McGraw-Hill: New York, NY, USA, 2004. [Google Scholar]
  38. Towler, G.; Sinnott, R.; Ray, S. Chemical Engineering Design; Butterworth-Heinemann: Oxford, UK, 2009. [Google Scholar]
  39. Turton, R.; Bailie, R.C.; Whiting, W.B.; Shaeiwitz, J.A. Analysis, Synthesis and Design of Chemical Processes; Pearson Education: London, UK, 2008. [Google Scholar]
  40. Park, S.; Choi, K.; Lee, C.; Kim, S.; Yoo, Y.; Chang, D. Techno-economic analysis of adiabatic four-stage CO2 methanation process for optimization and evaluation of power-to-gas technology. Int. J. Hydrogen Energy 2021, 46, 21303–21317. [Google Scholar] [CrossRef] [Scilit]
  41. Greiml, M.; Fritz, F.; Kienberger, T. Increasing installable photovoltaic power by implementing power-to-gas as electricity grid relief-A techno-economic assessment. Energy 2021, 235, 121307. [Google Scholar] [CrossRef] [Scilit]
  42. Pandey, A.K.; Kumar, R.R.; Kalidasan, B.; Laghari, I.A.; Samykano, M.; Kothari, R.; Tyagi, V.V. Utilization of solar energy for wastewater treatment: Challenges and progressive research trends. J. Environ. Manag. 2021, 297, 113300. [Google Scholar] [CrossRef] [Scilit] [PubMed]
  43. Chen, X.; Pang, Z.; Zhang, M.; Jiang, S.; Feng, J.; Shen, B. Techno-economic study of a 100-MW-class multi-energy vehicle charging/refueling station: Using 100% renewable, liquid hydrogen, and superconductor technologies. Energy Convers. Manag. 2023, 276, 116463. [Google Scholar] [CrossRef] [Scilit]
  44. U.S. Department of Energy. Clean Hydrogen Production Cost Scenarios with PEM Electrolyzer Technology; DOE Hydrogen Program Record 24005; Hydrogen and Fuel Cell Technologies Office: Washington, DC, USA, 2024.
  45. Gómez, J.; Castro, R. Green hydrogen energy systems: A review on their contribution to a renewable energy system. Energies 2024, 17, 3110. [Google Scholar] [CrossRef] [Scilit]
  46. Khalil, Y.F. Scoring and Ranking Methods for Evaluating the Techno-Economic Competitiveness of Hydrogen Production Technologies. Sustainability 2025, 17, 5770. [Google Scholar] [CrossRef] [Scilit]
Figure 1. Integrated proposed process description and sustainability assessment framework.
Fuels 07 00064 g001
Figure 2. Normalized material sustainability indicators for the AF+PEM, AF+AEM, and AF+SOE configurations. The radial axes correspond to the following material sustainability indicators: 1. reaction yield; 2. atom economy; 3. actual atom economy; 4. reaction mass efficiency; 5. total material consumption; 6. mass intensity; 7. value mass intensity; 8. mass productivity; 9. mass loss index; 10. recycled material fraction; 11. mass fraction of product from recyclable materials; 12. total water consumption; 13. fractional water consumption; and 14. water intensity.
Fuels 07 00064 g002
Figure 3. The energy efficiency indicators for AF+PEM, AF+AEM, and AF+SOE.
Fuels 07 00064 g003
Figure 4. The environmental efficiency indicators for AF+PEM, AF+AEM, and AF+SOE.
Fuels 07 00064 g004
Figure 5. Variation of LCOH ($ kg_hydrogen−1) for three process designs operating at high-low values of CAPEX/OPEX. (i = 10%, k = 25 years, O2 = 0.1 $ kg−1).
Fuels 07 00064 g005
Figure 6. Cumulative cash flow vs. plant life for three process designs operating at low values of CAPEX/OPEX. (i = 10%, k = 25 years, O2 = 0.1 $ kg−1).
Fuels 07 00064 g006
Figure 7. Cumulative discounted cash flow and discounted cash flow vs. plant life for three process designs operating at low values of CAPEX/OPEX. (i = 10%, k = 25 years, O2 = 0.1 $ kg−1).
Fuels 07 00064 g007aFuels 07 00064 g007b
Figure 8. The economic efficiency indicators for AF+PEM, AF+AEM, and AF+SOE.
Fuels 07 00064 g008
Table 1. CAPEX and OPEX values for PEM, AEM, and SOE electrolyzers reported in the literature.
Electrolyzer TypeCAPEX
(USD kW−1)
Fixed OPEX
(USD kW−1)
Replacement Cost over the 25-Year Plant Life
(USD kW−1)
References
PEM1500–250075–125 a825–1375 d[40,41,42,43,44]
AEM500–100015–30 b275–550 d[44,45,46]
SOE2000–450080–180 c1100–2475 d[44,45,46]
a Fixed OPEX is assumed to equal 5% of CAPEX. b Fixed OPEX is assumed to equal 3% of CAPEX. c Fixed OPEX is assumed to equal 4% of CAPEX. d Replacement cost is assumed to equal 11% of CAPEX every five years over the 25-year plant life.
Table 2. The material efficiency indicators. (PEM efficiency is 75%, AEM efficiency is 70%, and SOE efficiency is 85%).
Sustainability ValueScore
IndicatorFormulaMetricBest Target (100%)Worst Case (0%)AF+PEM
(%)
AF+AEM
(%)
AF+SOE
(%)
1Reaction yield R Y = M a s s   o f   p r o d u c t T h e o r e t i c a l   m a s s   o f   p r o d u c t kg/kg1087.58592.5
2Atom economy A E ,   d e s i r e d   p r o d u c t = M o l e c u l a r   w e i g h t   ×   s t o i c h i o m e t r i c   c o e f f i c i e n t , d e s i r e d   p r o d u c t 1 r e a g e n t s M o l e c u l a r   w e i g h t   ×   s t o i c h i o m e t r i c   c o e f f i c i e n t r e a g e n t kg kmol−1/
kg kmol−1
10989898
3Actual atom economyAAE = AE × RYkg kmol−1/
kg kmol−1
1085.7583.390.65
4Reaction mass efficiency S F = M a s s   o f   p r o d u c t T o t a l   m a s s   o f   r e a g e n t s kg/kg10969696
5Total material consumption M , T O T = T o t a l   m a s s   i n p u t kgMass of product40 times mass
of product
969696
6Mass intensity M I = T o t a l   m a s s   i n p u t M a s s   o f   p r o d u c t kg/kg140999999
7Value mass intensity M I V = T o t a l   m a s s   i n p u t S a l e s   r e v e n u e   o r   v a l u e   a d d e d kg/USD05288.88789.25
8Mass productivity M P = M a s s   o f   p r o d u c t T o t a l   m a s s   i n p u t   t o   p r o c e s s   o r   p r o c e s s   s t e p kg/kg1099.599.599.5
9Mass loss index M L I = T o t a l   n o n p r o d u c t   m a s s   o u t   o f   p r o c e s s   o r   p r o c e s s   s t e p M a s s   o f   p r o d u c t kg/kg010094.8294.4595.33
10Recycled material fraction w , r e c y m a t = R e c y c l e d   m a s s   i n p u t T o t a l   m a s s   i n p u t kg/kg10999999
11Mass fraction of product from recyclable materials w , r e c y p r o = M a s s   o f   p r o d u c t   f r o m   r e c y c l a b l e   m a t e r i a l s M a s s   o f   P r o d u c t kg/kg10100100100
12Total water consumption V = V o l u m e   o f   f r e s h   w a t e r   c o n s u m e d   i n   t h e   p r o c e s s   o r   p r o c e s s   u n i t m3/h0All water fresh100100100
13Fractional water consumption F W C = V o l u m e   o f   f r e s h   w a t e r   c o n s u m e d M a s s   o f   P r o d u c t m3/kg02.95100100100
14Water intensity W I = V o l u m e   o f   f r e s h   w a t e r   c o n s u m e d S a l e s   r e v e n u e   o r   v a l u e   a d d e d m3/USD01.55100100100
Assumptions and Key Data from the Process
  • H2 selling price is assumed to be $10 per kg.
  • Mass of product H2 for the fixed power of 437 MW was calculated for the PEM, AEM, and SOE as normalized hydrogen productivities of 22.39, 20.90, and 24.87 kg H2 MWh−1, respectively.
  • Mass of product O2 for the fixed power of 437 MW was calculated for the PEM, AEM, and SOE as normalized oxygen productivities are 177.74, 165.89, and 197.38 kg O2 MWh−1, respectively.
  • Total non-desired product CO2 mass out is 202,891.73 kg h−1.
  • No fresh water is utilized.
  • All produced H2 is produced from the recycled water.
Table 3. The energy indicators. (PEM efficiency is 75%, AEM efficiency is 70%, and SOE efficiency is 85%).
Sustainability ValueScore
IndicatorFormulaMetricBest Target (100%)Worst Case (0%)AF+PEM
(%)
AF+AEM
(%)
AF+SOE
(%)
1Specific energy intensity R , S E I = N e t   e n e r g y   u s e d   a s   p r i m a r y   f u e l   e q u i v a l e n t M a s s   o f   p r o d u c t kJ/kg01.949 × 10698.398.298.5
2Energy intensity R , E I = N e t   e n e r g y   u s e d   a s   p r i m a r y   f u e l   e q u i v a l e n t S a l e s   r e v e n u e   o r   v a l u e   a d d e d kJ/USD03.73 × 10447.1384159
3Waste treatment energy W T E = W a s t e   t r e a t m e n t   e n e r g y   r e q u i r e m e n t s M a s s   o f   p r o d u c t kJ/kg0Max Ewaste treats per kg100100100
4Resource energy efficiency µ = E n e r g y   c o n t e n t   o f   t h e   p r o d u c t T o t a l   m a t e r i a l i n p u t   e n e r g y kJ/kJ0132.7630.636.4
5Renewability energy index R I , E = N e t   e n e r g y   s u p p l i e d   f r o m   r e n e w a b l e   r e s o u r c e s N e t   e n e r g y   s u p p l i e d   t o   t h e   p r o c e s s kJ/kJ10100100100
6Combined Energy Efficiency Index (CEEI) C E E I = η A F + η e l 2 kJ/kJ106562.570
7Energy Return on Investment (EROI) E R O I = E n e r g y   o u t p u t E n e r g y   i n p u t kJ/kJ10010.210.511
Assumptions and Key Data from the Process
  • H2 selling price is assumed to be $10 per kg.
  • In Allam–Fetvedt, the total power output is 795 MW (2.862 × 10⁹ kJ h−1).
  • We consider the AF cycle a renewable source because “the Allam cycle is not inherently renewable, but it is complementary to renewables because it provides flexible, firm power with near-zero emissions.”
Table 4. The environmental indicators. (PEM efficiency is 75%, AEM efficiency is 70,% and SOE efficiency is 85%).
Sustainability ValueScore
IndicatorFormulaMetricBest Target (100%)Worst Case (0%)AF+PEM
(%)
AF+AEM
(%)
AF+SOE
(%)
1Specific toxic release T R s = T o t a l   m a s s   o f   t o x i c s   r e l e a s e d M a s s   o f   p r o d u c t kg/kg0All95.8295.8395.83
2Toxic release intensity T R = T o t a l   m a s s   o f   t o x i c s   r e l e a s e d S a l e s   r e v e n u e   o r   v a l u e   a d d e d kg/USD0All95.8395.8295.84
3Environmental quotient E Q = T o t a l   m a s s   o f   w a s t e M a s s   o f   p r o d u c t ×   U n f r i e n d l i n e s s   q u o t i e n t kg/kg0All95.8295.8395.83
4Environmental hazard, air hazard E H . a i r = V o l u m e   o f   l i m i t   c o n c e n t r a t i o n   a i r   e m i s s i o n   e q u i v a l e n t s M a s s   o f   p r o d u c t m3/kg01E7100100100
5Global warming potential G W P = T o t a l   m a s s   o f   C O 2   e q u i v a l e n t s M a s s   o f   p r o d u c t kg/kg0- No GWP gas releasesAll GWP gas releases95.7595.7595.75
6Global warming intensity G W I = T o t a l   m a s s   o f   C O 2   e q u i v a l e n t s S a l e s   r e v e n u e   o r   v a l u e   a d d e d kg/USD0- No GWP gas releasesAll GWP gas releases95.7595.7595.75
7Water Footprint (WFP) W F P = T o t a l   f r e s h   w a t e r   u s e d M a s s   o f   p r o d u c t m30All water fresh100100100
8Wastewater Generation Rate V i , s p e c = V o l u m e   o f   w a s t e w a t e r   g e n e r a t e d M a s s   o f   p r o d u c t m3/kg010099.1298.9999.31
Table 5. CAPEX and OPEX values for the Allam–Fetvedt cycle (437 MW system) as reported in this study.
Total Capital Investment ($)
ItemValue
Total equipment cost$76,134,196.45
Lang factor, fluid processing plant4.7
Corrected equipment cost$357,830,723.30
Land cost$3,578,307.23
Inside Battery Limit (ISBL)$361,409,030.50
Outside Battery Limit (OSBL) range40.00%
Outside Battery Limit (OSBL)$144,563,612.20
Engineering Cost range10.00%
Engineering Cost$50,597,264.28
Contingency Cost range10.00%
Contingency Cost$36,140,903.06
Fixed Capital$592,710,810.13
Working Cost range15.00%
Working Cost$88,906,621.52
Total Capital Investment$681,617,431.60
Total Fixed Operating Cost ($/yr)
ItemValue
Insurance$5,927,108.10
Royalties$5,927,108.10
Local taxes$11,854,216.20
Operating Cost$23,708,432.40
Fixed maintenance cost$34,080,871.50
Total Fixed Operating Cost$57,789,303.90
Total Variable Operating Cost ($/yr)
Raw material
Raw materialkg/hrkg/year$/MMBTU (2025)$/kgTotal required fuel $/year
Natural gas for AFC76,422.51669,461,192.12.930.145$97,065,880.65
Oxygen for AFC + PEM210,328.871,842,480,8890.1$184,248,088.87
Oxygen for AFC + AEM215,506.941,887,840,8290.1$188,784,082.94
Oxygen for AFC + SOE201,747.061,767,304,2790.1$176,730,427.92
Table 6. The economic indicators. (PEM efficiency is 75%, AEM efficiency is 70%, and SOE efficiency is 85%).
Sustainability ValueScore
IndicatorFormulaMetricBest Target (100%)Worst Case (0%)AF+PEM
(%)
AF+AEM
(%)
AF+SOE
(%)
1Total water costCwater tot. = Absolute cost of water used in
the process or process unit
USD0All water required is provided by
fresh water
100100100
2Total energy costCE, tot. = Absolute cost of energy usedUSD$1.72 × 10⁻⁶/kJ$1.68 × 10−5/kJ100100100
3Specific energy costs E C , s p e c = T o t a l   e n e r g y   c o s t T o t a l   p r o d u c t i o n   c o s t USD/USD0≥0.2100100100
4Total product costTPC = Manufacturing cost (COM) + General
expenses (GE)
USD/kg2Product sales price4.3–41.80–33.719.4–53.2
5Economic potentialEP = Revenue − Raw material costs − Utility costsUSD/kg product10067.1864.871.2
6Rate of return on investment R O I = A v e r a g e   a n n u a l   n e t   p r o f i t F i x e d   c a p i t a l   i n v e s t m e n t %/yr30050.0636.357
7Payback period P B P = F i x e d   c a p i t a l   i n v e s t m e n t A v e r a g e   a n n u a l   c a s h   f l o w yr1Plant life cycle75.4164.3778.83
8Turnover ratio T R = G r o s s   a n n u a l   s a l e s F i x e d   c a p i t a l   i n v e s t m e n t USD/USD4015.218.514.25
9Cumulative cash positionCCP = The worth of the project at the end of its lifeUSDFixed capital investment05669.5653.2
Disclaimer/Publisher’s Note: The statements, opinions and data contained in all publications are solely those of the individual author(s) and contributor(s) and not of MDPI and/or the editor(s). MDPI and/or the editor(s) disclaim responsibility for any injury to people or property resulting from any ideas, methods, instructions or products referred to in the content.