Article

Impact of Cu-Site Dopants on Thermoelectric Power Factor for Famatinite (Cu3SbS4) Nanomaterials

1
Department of Chemistry, Furman University, Greenville, SC 29613, USA
2
Department of Physics and Astronomy, Clemson Nanomaterials Institute, Clemson University, Clemson, SC 29634, USA
*
Author to whom correspondence should be addressed.
Electron. Mater. 2025, 6(3), 10; https://doi.org/10.3390/electronicmat6030010
Submission received: 29 April 2025 / Revised: 16 June 2025 / Accepted: 31 July 2025 / Published: 6 August 2025
(This article belongs to the Special Issue Feature Papers of Electronic Materials—Third Edition)

Abstract

Famatinite (Cu3SbS4) is an earth-abundant, nontoxic material with potential for thermoelectric energy generation applications. Herein, rapid, energy-efficient, and facile one-pot modified polyol synthesis was utilized to produce gram-scale quantities of phase-pure famatinite (Cu2.7M0.3SbS4, M = Cu, Zn, Mn) nanoparticles (diameter 20–30 nm) with controllable and stoichiometric incorporation of transition metal dopants on the Cu-site. To produce pellets for thermoelectric characterization, the densification process by spark plasma sintering was optimized for individual samples based on thermal stability determined using differential scanning calorimetry and thermogravimetric analysis. Electronic transport properties of undoped and doped famatinite nanoparticles were studied from 225–575 K, and the thermoelectric power factor was calculated. This is the first time electronic transport properties of famatinite doped with Zn or Mn have been studied. All famatinite samples had similar resistivities (>0.8 mΩ·m) in the measured temperature range. However, the Mn-doped famatinite nanomaterials exhibited a thermoelectric power factor of 10.3 mW·m−1·K−1 at 575 K, which represented a significant increase relative to the undoped nanomaterials and Zn-doped nanomaterials engendered by an elevated Seebeck coefficient of ~220 µV·K−1 at 575 K. Future investigations into optimizing the thermoelectric properties of Mn-doped famatinite nanomaterials are promising avenues of research for producing low-cost, environmentally friendly, high-performing thermoelectric materials.

1. Introduction

As global energy demands increase year-over-year (with projected energy consumption expected to rise to ~5900 TWh by 2050), there is a growing urgency in identifying and developing alternative sources of energy production to minimize carbon footprints [1,2,3]. Thermoelectrics (TEs) are semiconducting materials that convert heat into electricity via the Seebeck effect, which describes the electrical current generated by a thermoelectric material exposed to a temperature gradient [4,5,6,7,8,9,10,11,12]. Thermoelectric generators are attractive for green, emission-free energy generation and can be utilized to recycle waste heat from other processes [8,9]. The temperature-dependent power factor (PF), expresses the relative electrical output of a given thermoelectric material as a function of temperature, and is given by the expression S 2 · T / ρ , where S is the Seebeck coefficient, T is the absolute temperature, and ρ is the electrical resistivity [4,5,6,7,10,11,12]. Therefore, a high Seebeck coefficient and low resistivity are desirable to maximize the power factor. However, as the Seebeck coefficient increases, so does resistivity, complicating optimization. Incorporating the total thermal conductivity ( κ t o t ) to the denominator of the power factor equation yields the thermoelectric figure of merit ZT ( S 2 · T / ρ · κ t o t ) , which describes the overall performance of a thermoelectric material operating at a certain temperature [4,5,6,7,10,11,12]. Contemporary TE research focuses on improving the PF of bulk state-of-the art TE materials, especially via nanostructuring, where increased phonon scattering optimizes S through energy filtering of charge carriers [13] and/or via preferential scattering of interfacial charged defects [14]. The incorporation of defects via the intentional incorporation of impurities, known as dopants, is another strategy that results in an increase in phonon scattering. In addition, doping remains a principal method of band gap engineering, with fundamental band characteristics serving as a critical factor for thermoelectric, photovoltaic, and photoelectrochemical applications [15].
State-of-the-art thermoelectric materials are primarily narrow band gap semiconductors such as the metal chalcogenides Bi2Te3, PbTe, SnSe, and their various alloys [4,7,16,17,18]. However, expansive application of the aforementioned materials remains limited because of restrictive material costs, questions about the long-term supply of Te, and concerns about the toxicity of constituent elements [7,16]. Copper sulfide materials are composed of earth-abundant and nontoxic constituents and display ideal material properties for widespread use in energy applications, including thermoelectric power generation [16,17,18,19]. One such example is the Cu-Sb-S family, which include chalcostibite (CuSbS2), skinnerite (Cu3SbS3), famatinite (Cu3SbS4), and tetrahedrite (Cu12Sb4S13) [17,18,19,20,21,22]. Studies have evaluated the structural, optical, and electronic properties of all four Cu-Sb-S species [20,21], but the vast majority of research has concentrated on the thermoelectric properties of tetrahedrite (Cu12Sb4S13) [23,24]. Theoretical studies predict that due to the combination of an intrinsically high Seebeck coefficient (~200 µV·K−1) and low thermal conductivity (<3 W·K−1·m−1), famatinite (Cu3SbS4) materials may also be a good candidate for thermoelectric applications [25,26]. However, relative to tetrahedrite, significantly less experimental work has been published that focuses on the thermoelectric properties of bulk or nanoscale famatinite, particularly regarding famatinite doped on the Cu-site.
Famatinite (Cu3SbS4) crystallizes in a 16-atom tetragonal chalcopyrite unit cell (space group I42m) reminiscent of the body-centered zincblende lattice structure as shown in Figure 1 [27,28,29,30]. Within the unit cell, there are two nonequivalent copper positions, Cu-1 (red) and Cu-2 (orange) [28,29,30]. Both copper positions are tetrahedrally coordinated to sulfur atoms, but the Cu-1 position has four antimony atoms in plane as close neighbors, while sulfur atoms completely surround Cu-2. Taking into account these non-equivalent copper positions, the chemical formula of famatinite is (Cu-1)(Cu-2)2SbS4 [28]. The antimony and sulfur positions are also both tetrahedrally coordinated, with the antimony atoms being coordinated to four sulfur atoms, while the sulfur atoms are coordinated to three copper atoms and one antimony atom [28,29,30]. Famatinite has primarily been investigated for photovoltaic applications, being classified as a “super absorber” and possessing a narrow band gap of 0.8–1.2 eV [20,21,28,29,31]. As a non-cubic chalcopyrite, famatinite is also notable for superior electronic transport properties, which are desirable for thermoelectric applications [30,32]. Famatinite benefits from the highly degenerate band edges and large density of states typical of pseudo-cubic structures as well as the random arrangement of corner CuS4 tetrahedron constructions, which can allow the material to retain a high Seebeck coefficient even as electrical conductivity increases [30,32,33]. It also possesses a relatively low thermal conductivity (~1–4 W·K−1·m−1 at 623 K) for a thermoelectric material despite its simple crystal structure, which can be further reduced by nanostructuring [30,33].
Doping is an effective strategy to improve thermoelectric properties as it has the two-fold effect of increasing the Seebeck coefficient through Fermi level tuning and reducing the thermal conductivity by introducing point defects to the lattice, which increases phonon scattering [4,6,11,34]. To improve upon the performance of undoped famatinite [33,35], the primary approach has been to incorporate heavy metal or metalloid dopants onto the Sb-site. Some studies focused on maximizing the PF, with one study investigating Cu3Sb0.85Ge0.15S4 [36] and another examining 1.5 wt% Sn-doped famatinite [37]. Other studies primarily focus on thermal conductivity reduction, shown by another group who also synthesized Ge- and Sn-doped famatinites, (Cu3Sb0.92Ge0.08S4) [38] and (Cu3Sb0.92Sn0.08S4) [39]. Samples with co-doping of two species on the Sb-site, Cu3Sb0.75Ge0.1P0.15S4 [30] and Cu3Sb0.89Bi0.06Sn0.05S4 [40], have increased the thermoelectric PF and reduced thermal conductivity. Only one study has investigated doping the Cu-site of famatinite, showing a threefold improvement in the PF of a Ni-doped famatinite (Cu2.25Ni0.75SbS4) compared to undoped famatinite (Cu3SbS4) produced by the same method [41]. Additionally, these famatinite samples were nanostructured, with grain sizes ranging from 20–30 nm, which can lower thermal conductivity and improve performance. Further motivation for investigating Cu-site doped famatinite is that incorporation of transition metal dopants such as Zn, Fe, Ni, Mn, and Co on the Cu-site of tetrahedrite, a closely related material, has been shown to improve the PF, thermal conductivity, and overall ZT for both bulk and nanostructured tetrahedrite [24,42,43,44,45]. As a result, investigating the thermoelectric properties of famatinite doped with transition metals on the Cu-site is a promising avenue of research.
Conventional synthetic methods for famatinite include solid-state mechanical alloying or melting processes combined with either hot press or spark plasma sintering (SPS) processes to synthesize the famatinite pellets [22,30,33,35,36,37,38,39,40]. However, such solid-state synthesis methods are energy-intensive, more prone to producing major impurities upon the addition of dopants, and often possess large microscale grains. Famatinite has also been synthesized by colloidal solution-phase methods like hot-injection [20,21,29,41] or solvothermal [46,47] processes, which produce nanostructured famatinite. These solution-phase syntheses often produce nanoparticles coated with ligands and/or surfactants, which have been shown to reduce the transport properties of chalcogenide nanoparticles [41,46,48]. Recently, an energy-efficient, surfactant-free, and relatively quick one-pot modified polyol method was utilized to synthesize famatinite nanoparticles that are 20–50 nm in size [31]. Other nanomaterials synthesized with the polyol method, such as Bi0.5Sb1.5Te3 and Cu12-xMxSb4S13 (M = Zn, Fe; x = 0, 0.5, 1, 2), displayed comparable or improved transport and thermoelectric properties relative to materials synthesized by solid-state methods [44,45,48]. Polyol synthesis involves dispersing stoichiometric amounts of metal acetate salts and sulfur in tetraethylene glycol, a long-chain polyalcohol solvent. A modified polyol method involves the addition of sodium borohydride to assist with reduction. Relative to other solution-phase syntheses, a key advantage of this technique is that it can be scaled to produce more than 2 g of product in one batch [31,44,45,48]. The modified polyol method also allows for dependable stoichiometric and facile incorporation of dopants on the Cu-, Sb-, and S- sites of famatinite. A previous study by Jensen et al. derived the growth mechanism of famatinite nanomaterials and used thermogravimetric analysis, differential scanning calorimetry, and optical spectroscopy methods to evaluate the high-temperature thermal stability and optical band gap of Cu-site doped famatinite (Cu2.7M0.3SbS4, M = Cu, Zn, Fe, Ni, Mn, and Co) [31]. However, the aforementioned study did not assess the thermoelectric properties of the Cu-site doped famatinite nanomaterials.
Herein, the thermoelectric properties of nanoscale famatinite synthesized by the modified polyol method are presented for the first time. Additionally, this is the first investigation of the thermoelectric properties of famatinite doped with Zn or Mn on the Cu-site (Cu2.7M0.3SbS4, M = Cu, Zn, Mn). Zn and Mn dopants were previously demonstrated to significantly enhance the thermal stability of famatinite nanoparticles, which is an important consideration for thermoelectric materials [31]. Prior to transport property measurements, famatinite nanoparticles were characterized by X-ray diffraction to determine phase purity and unit cell structure, scanning electron microscopy to investigate surface morphology, and energy-dispersive X-ray spectroscopy to obtain compositional data. After confirming phase purity and composition, nanoparticles were formed into pellets by spark plasma sintering, and the transport properties of the pellets were analyzed. Using these values, the power factor was calculated. These findings were then analyzed to determine the impact of transition metal doping on the magnitude of the P F in famatinite nanoparticles. This research aims to evaluate the potential of Cu-site doped nanostructured famatinite as a thermoelectric material, leading to the development of cost-effective and safe green energy technologies.

2. Materials and Methods

2.1. Materials

The following reagents were used as received from Sigma-Aldrich Chemical Co. (Saint Louis, MO, USA) for the multi-gram scale synthesis of famatinite nanoparticles: copper(II) acetate monohydrate (Cu(C2H3O2)2·H2O, ≥98%); antimony(III) acetate (Sb(C2H3O2)3, >99.99%); sulfur powder (99.98%); zinc(II) acetate (Zn(C2H3O2)2, 99.99%); manganese(II) acetate (Mn(C2H3O2)2, 98%). Metal salts were dissolved in tetraethylene glycol (99%) from Thermo Fischer Scientific (Waltham, MA, USA), and sodium borohydride (NaBH4, ≥98.0%) from Sigma-Aldrich was added as the reducing agent. Products were isolated using absolute anhydrous ethanol (200 proof, USP grade) from Pharmco-Aaper (Brookfield, CT, USA).

2.2. Synthesis of Famatinite Nanoparticles

Famatinite nanoparticles are synthesized according to the modified polyol procedure published previously [31]. This work has scaled up the procedure to yield ~2.5 g of nanoparticle powder per synthesis. For the synthesis of undoped famatinite nanoparticles, approximately 20 mmol (4.0 g) of Cu(C2H3O2)2·H2O, 6.6 mmol (2.0 g) of Sb(C2H3O2)3, and 29 mmol (0.93 g) of sulfur (added in 10% molar excess) were weighed out, added to a 1 L round bottom flask, and dissolved in 200 mL tetraethylene glycol. For the synthesis of Zn-doped famatinite nanoparticles, a 30% molar excess of sulfur was utilized instead of a 10% molar excess: 2.0 mmol (0.36 g) of Zn(C2H3O2)2 was added to the round bottom flask in addition to 18 mmol (3.6 g) of Cu(C2H3O2)2·H2O, 6.6 mmol (2.0 g) of Sb(C2H3O2)3, and 34 mmol (1.1 g) of sulfur powder. For the synthesis of Mn-doped famatinite nanoparticles, 2.0 mmol (0.34 g) of Mn(C2H3O2)2 is added alongside 18 mmol (3.6 g) of Cu(C2H3O2)2·H2O, 6.6 mmol (2.0 g) of Sb(C2H3O2)3, and 29 mmol (0.93 g) of sulfur (added in 10% molar excess).
The precursor solution was stirred magnetically in all syntheses for ten minutes with N2 gas sparging. In a separate beaker, 100 mmol (3.8 g) of NaBH4 was dispersed in 100 mL tetraethylene glycol with the assistance of sonication. The precursor solution was transferred to a reflux setup under a positive N2 atmosphere and stirred constantly. The NaBH4 dispersion was added to the precursor solution via a slow pouring method, immediately causing a color change to dark brown, indicative of reduction. The dark brown solution was heated to 175 °C, held for 1 h, then allowed to cool to room temperature. The resulting black product was transferred to 50 mL centrifuge tubes and centrifuged at 4000 rpm for 10 min. The supernatant was discarded, and anhydrous ethanol was used to wash and dissolve the pellet. Centrifugation and washing were repeated thrice, and products were dried overnight in a vacuum chamber. Famatinite nanoparticle powders were matte black in color.

2.3. Densification

The obtained nanoparticle powders were inserted into a 12.7 mm graphite die and enveloped on both sides with two layers of graphite foil. Densification utilized the pulsed electric current sintering process with the Dr. Sinter Lab Spark Plasma Sintering (SPS) System SPS-515S, with sintering performed under a dynamic vacuum. The undoped famatinite sample was sintered at 598 K for fifteen minutes, while the Zn-doped and Mn-doped nanoparticles were sintered with a two-step process, where the sample was heated to 473 K and held for five minutes, followed by a ten-minute hold at 598 K. All SPS proceeded under 5 kN of pressure, with a DC pulse of 12:2 ON:OFF ratio. After sintering, densified pellets with a thickness of ~2 mm were extracted from the die, and the graphite foil was removed. Various grits of sandpaper were employed to eliminate any excess graphite foil and smoothen the pellet surface. Subsequently, the room temperature density of the pellets was measured using the Archimedes method, resulting in densities of 90%, 91%, and 94% of the theoretical density for the undoped, Zn-doped, and Mn-doped famatinite samples, respectively [49].

2.4. Characterization Methods

The phase purity, morphology, and elemental composition of famatinite nanoparticle powders were analyzed using XRD, SEM, and EDS methods. XRD was again utilized after densification to ensure pellets remained pure. Transport properties of the famatinite nanoparticles were characterized using the commercial LZT-Meter (Linesis, Selb, Germany). XRD was once again used to analyzed the SPS-processed pellets to ascertain purity and SEM to confirm nanostructuring.
Powder XRD patterns were collected using a Rigaku Miniflex II benchtop diffractometer. 30 kV and 15 mA Cu Kα radiation was used to collect experimental patterns with a scan speed of 1° min−1 and scan width of 0.03° over a 2θ range of 10° to 70°. The PDXL2 software package (version 2.8.4.0) was employed to analyze patterns and perform Rietveld refinement calculations to obtain lattice parameters and grain sizes of famatinite nanoparticles. The PDF Card #01-071-0555 was used to match the famatinite phase [27].
Morphological and compositional analysis was executed using a JEOL JSM IT-200LA scanning electron microscope equipped with a JEOL JED-2300 Dry SDD EDS detector. SEM images were acquired with an accelerating voltage of 25 kV, while EDS data was collected with an accelerating voltage of 15 kV. Elemental ratios obtained by EDS are the averages of three or more EDS maps taken at different locations throughout the sample and include standard deviations.
The four-probe resistivity and Seebeck coefficient measurements were performed simultaneously on the SPS-processed pellets (diameter of ~12 mm and thickness of ~2 mm) [50,51]. Data was collected as a function of temperature from 223 K to 573 K, under a He atmosphere, using the LZT-Meter mentioned above. For high temperature measurements, helium’s inert nature prevents oxidation of the sample, which is important for accurately estimating the temperature dependent physical properties of the samples. The relative error is estimated to be within 5–7% for each measurement.

3. Results and Discussion

Herein, the undoped famatinite (Cu3SbS4), Zn-doped famatinite (Cu2.7Zn0.3SbS4), and Mn-doped famatinite (Cu2.7Mn0.3SbS4) nanoparticles were synthesized by a modified polyol process on the gram scale (~2.5 g per synthesis). The as-synthesized nanomaterials were characterized by XRD, TEM, SEM, and EDS methods to ascertain phase purity, nanoparticle morphology, and elemental composition. Rietveld refinements were performed to calculate lattice parameters and grain sizes of individual famatinite crystallites. Nanoparticle powders were processed into pellets using SPS with holding temperature determined from DSC and TGA data. Temperature-dependent transport property measurements were conducted with subsequent characterization by XRD and SEM to identify any changes in structure or composition.

3.1. Structural, Morphological, and Compositional Analysis of As-Synthesized Nanomaterials

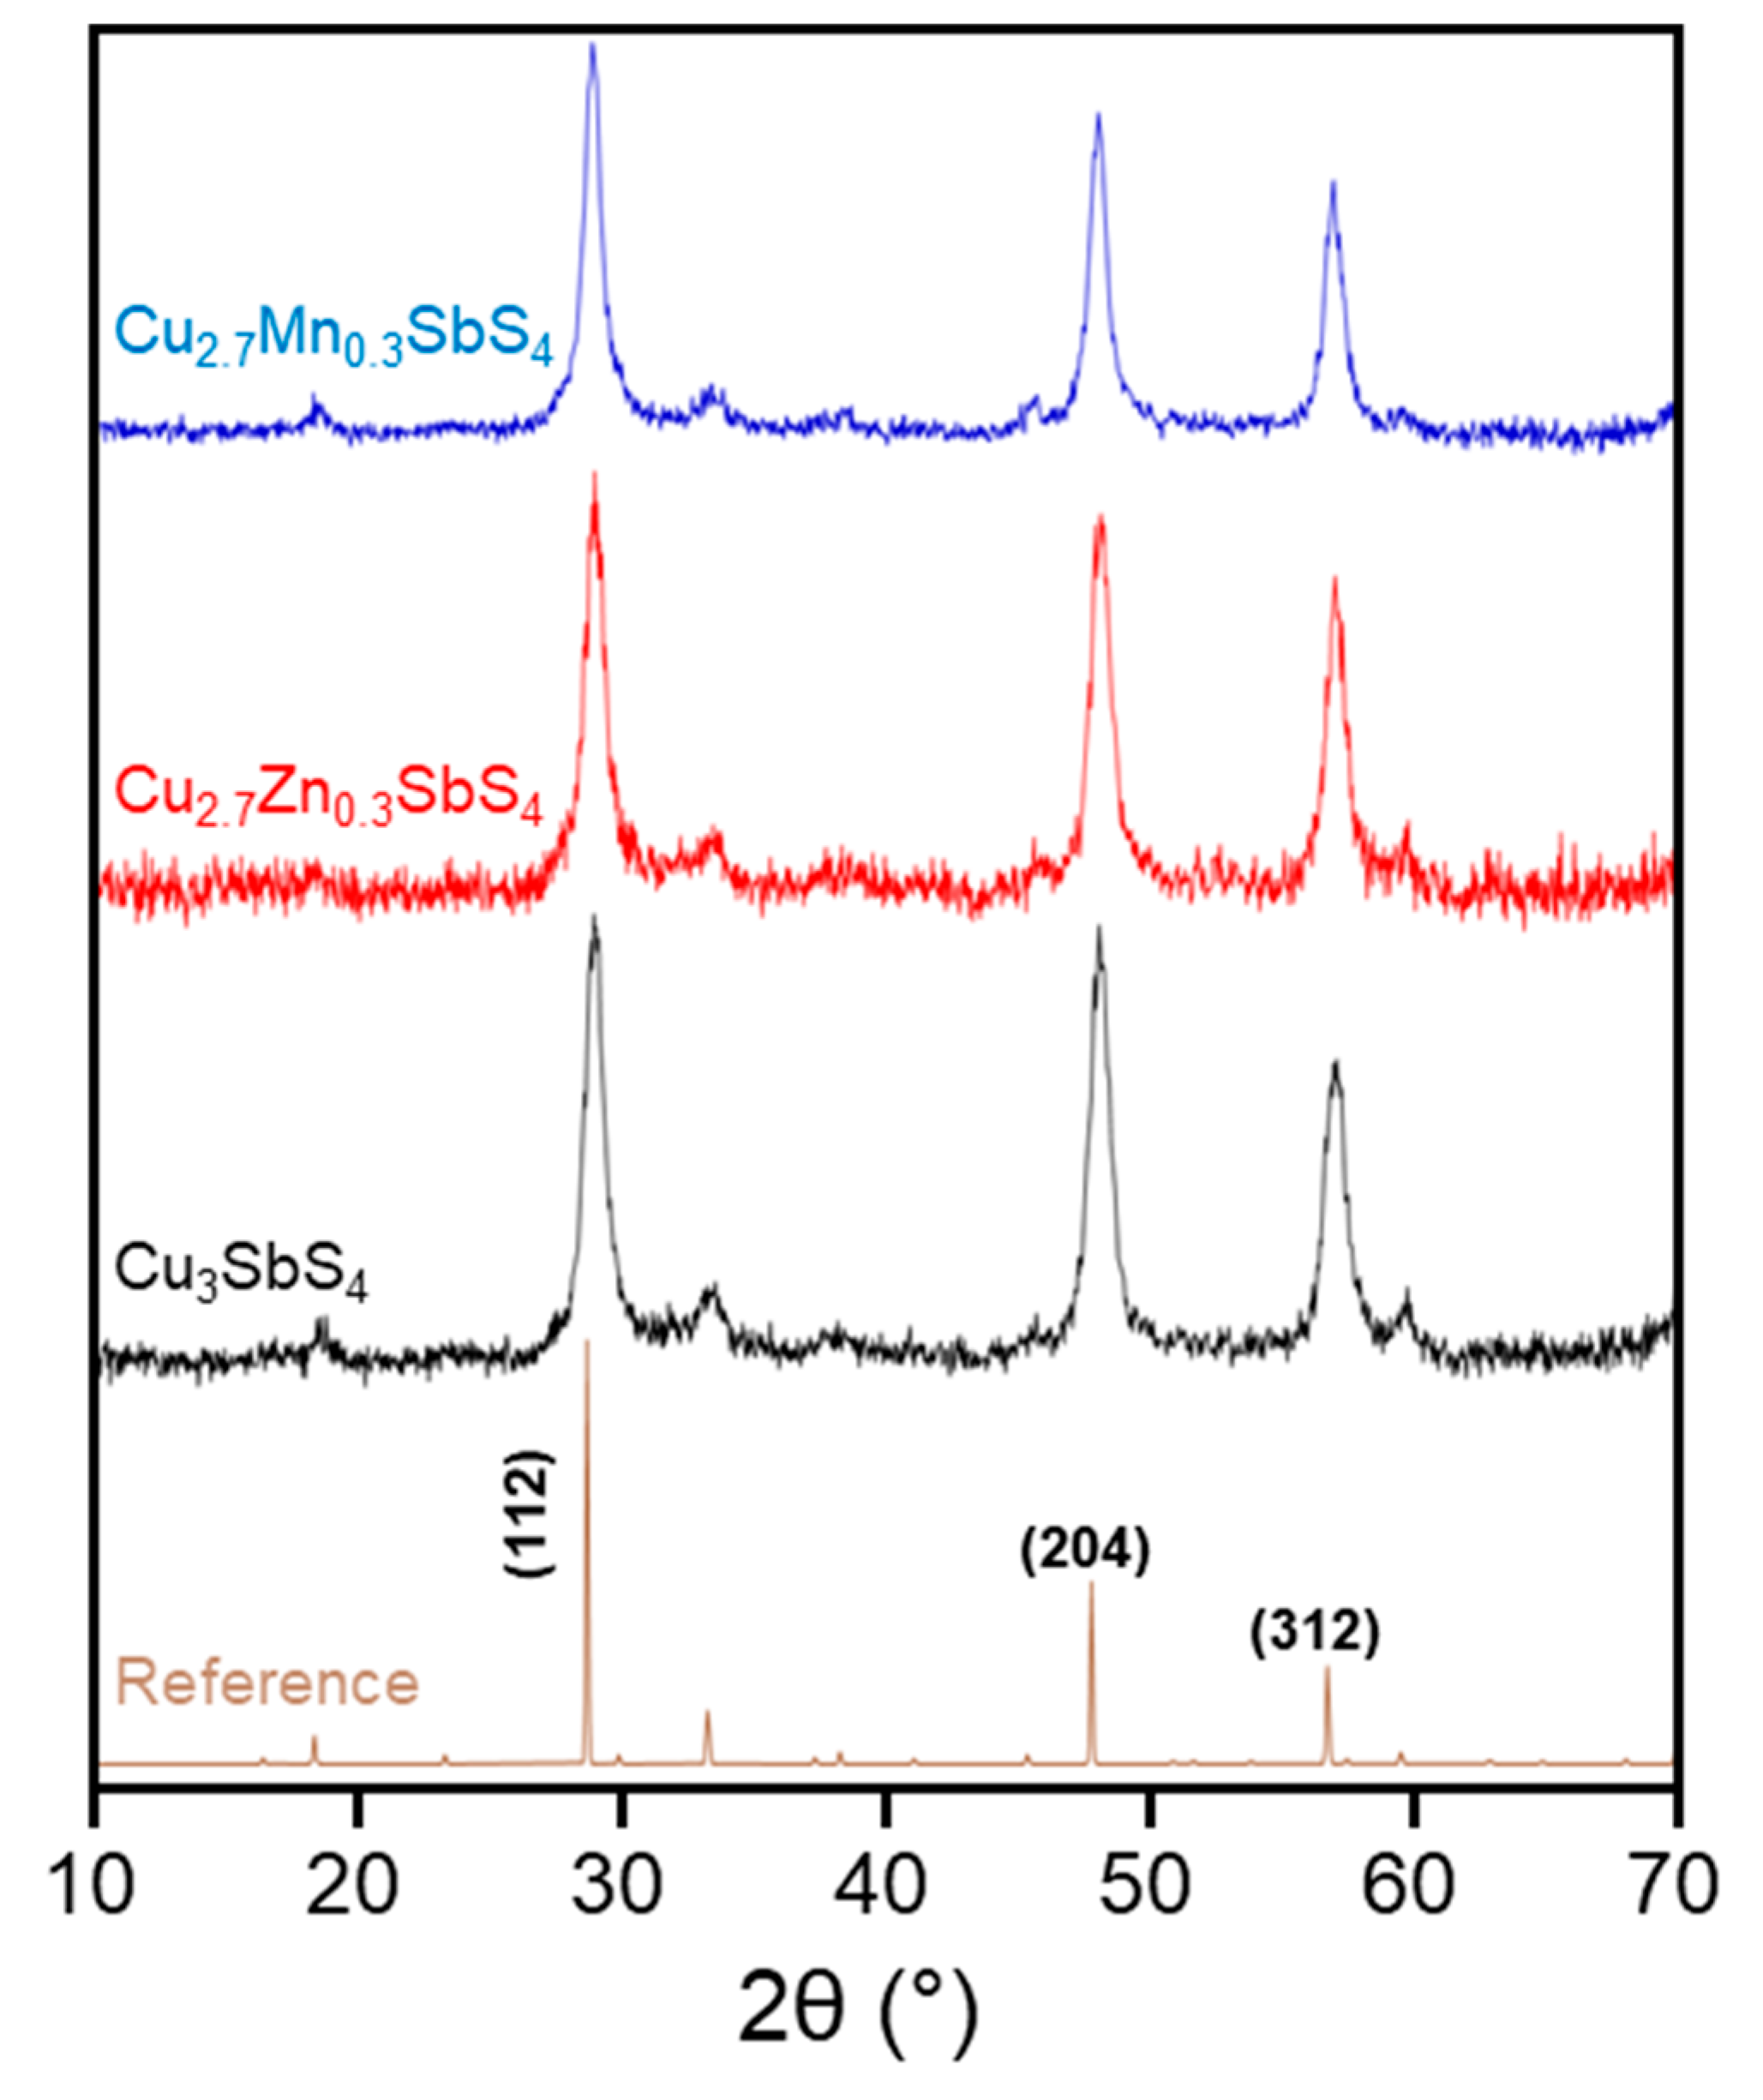
The crystal structure and phase purity of the as-synthesized undoped (Cu3SbS4), Zn-doped (Cu2.7Zn0.3SbS4), and Mn-doped (Cu2.7Mn0.3SbS4) famatinite nanoparticles were confirmed via XRD analysis, as shown in Figure 2. Analysis using Rietveld refinement indicated a tetragonal structure with a space group of 121: I-42m (PDF Card #01-071-0555) [27]. Peaks are well-resolved and match the peak position and relative intensity of the provided reference with no extraneous peaks, indicating that the as-synthesized famatinite nanoparticles were crystalline and single-phased. Experimental patterns contain broadened peaks, indicating that famatinite products were nanostructured. Rietveld refinement calculations for famatinite nanoparticles were performed to obtain the lattice parameters a and c for the famatinite unit cell, as seen in Table 1. The average grain size was 68 ± 8 Å (Table 1), which is approximately one-fourth the average diameter of the polycrystalline famatinite nanoparticles as observed by TEM (Figure 3).
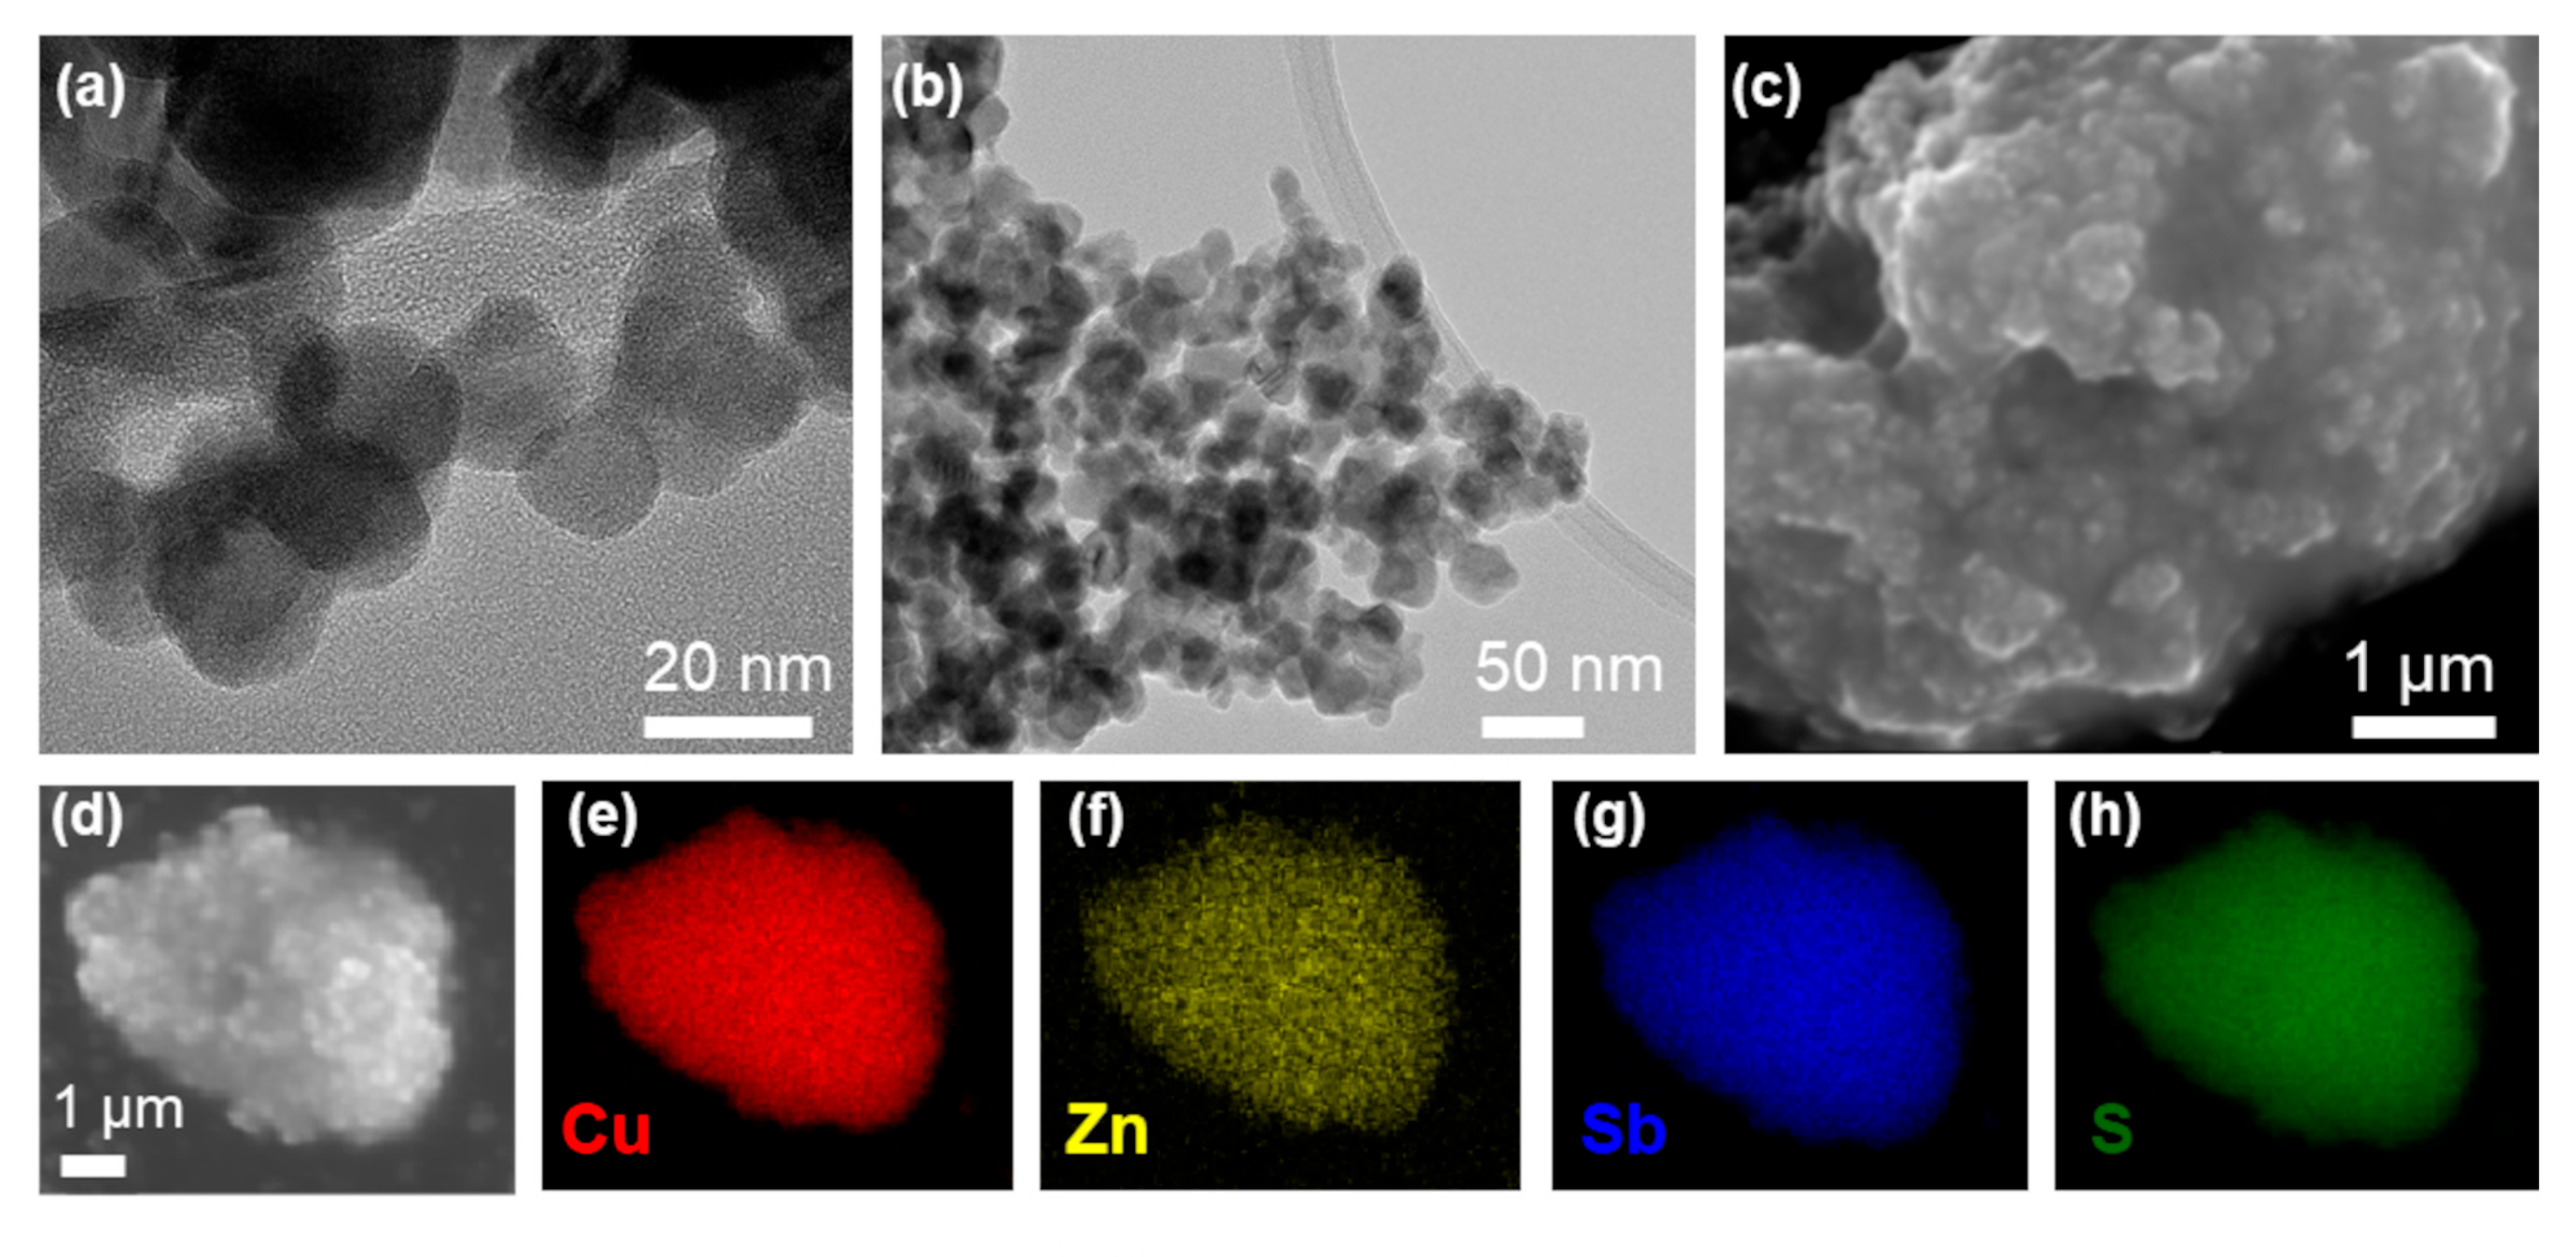
All polyol-synthesized famatinite nanomaterials were synthesized with elemental ratios close to the target (Cu3−xMxSbS4, M = Cu, Zn, Mn; x = 0.3). Representative electron microscopy images of the as-synthesized Zn-doped famatinite sample are displayed in Figure 3a,b (TEM) and Figure 3c,d (SEM-EDS), which indicate that famatinite nanoparticles were polycrystalline and approximately 20 nm in diameter. EDS maps (Figure 3e–h) overlayed on the SEM image in Figure 3d reveal elements were homogenously distributed throughout the famatinite nanomaterials. The elemental compositions of the famatinite nanoparticles were obtained using EDS methods and are presented in Table 2. Atomic ratios were calculated by averaging the composition at three or more spots throughout the samples and are displayed alongside standard deviations. The undoped famatinite sample was approximately 8% copper enriched (Cu = 3.23 ± 0.05) relative to the target ratio (Cu = 3). This tendency for copper enrichment has been previously observed in undoped, polyol-synthesized famatinite and the closely related material tetrahedrite [31,44]. However, the undoped sample herein was synthesized with a 10% molar excess of sulfur, which helps to mitigate this enrichment. Both doped samples possess dopant ratios (Zn = 0.284 and Mn = 0.28) slightly under target (Zn or Mn = 0.3) but within error, indicating that tailorable, stoichiometric dopant incorporation was achieved. Uniquely, the Zn-doped sample was antimony-poor (12%, Sb = 0.875 ± 0.008) relative to the target (Sb = 1). This antimony deficiency may impact the electronic transport properties of the material and adds a caveat when comparing the Zn-doped samples with the other famatinite samples. In general, low standard deviations across all famatinite samples confirm that constituent and dopant elements were distributed homogenously, confirming that polyol-synthesized famatinite nanoparticles were successfully produced with elemental compositions close to target.

3.2. Densification Process and Pellet Analysis

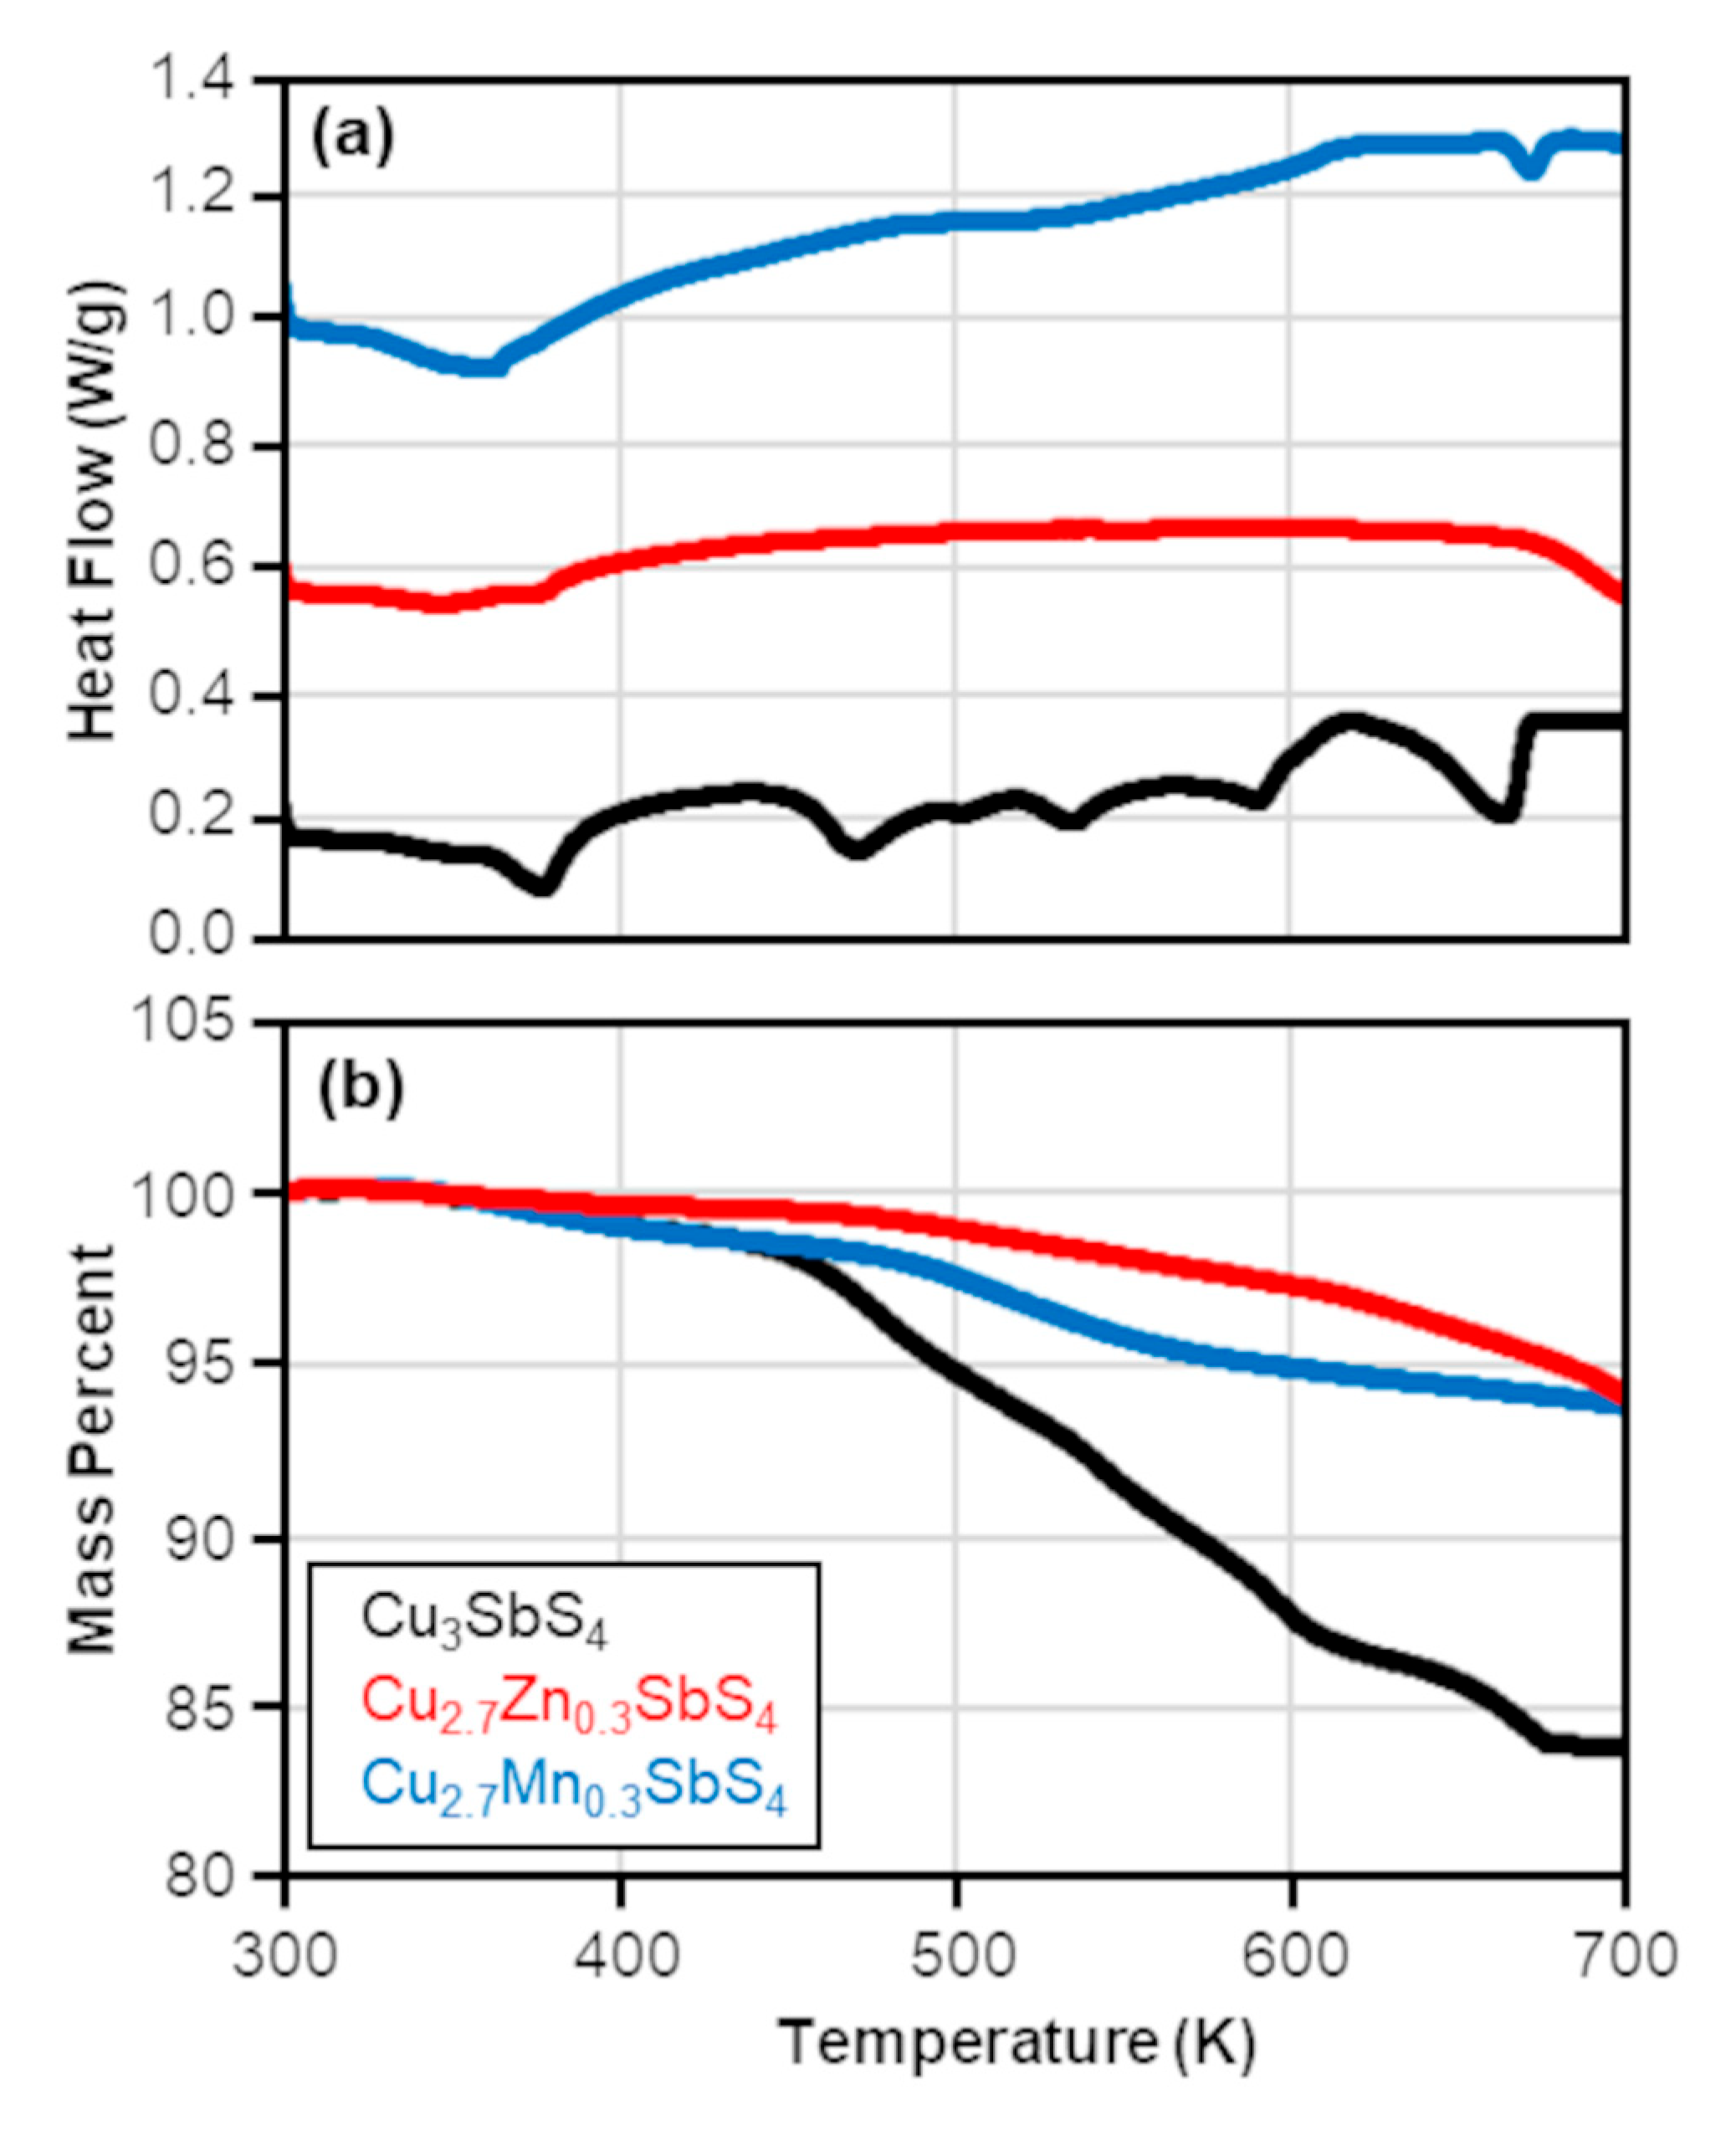
SPS was utilized to densify the nanoparticle powders into the characteristic pellets for thermoelectric analysis. To aid in identifying optimal pellet processing conditions, TGA and DSC analysis of as-synthesized nanoparticles was conducted. DSC studies found that all famatinite samples experienced an exothermic transition at temperatures between 600 K and 700 K, as shown in Figure 4a. The DSC data illustrates that the Zn- and Mn-doped famatinite nanomaterials are more thermally stable, as the exothermic transition occurs at temperatures at least 50 K greater than in the undoped nanoparticles. Corresponding TGA data (Figure 4b) shows that mass loss begins to occur around 600 K for all samples, with mass loss being particularly pronounced in the undoped sample. Furthermore, an XRD study of famatinite nanoparticles annealed at 575 K and 675 K was performed in conjunction with thermal analysis provided clear evidence that a phase change from famatinite to tetrahedrite (Cu12Sb4S13), a closely related sulfur-deficient material, occurs between those temperatures [31]. As a result, 600 K was selected as the maximum sintering temperature. For comparison, densifying nanoparticles of polyol-synthesized tetrahedrite required a maximum temperature of 625 K in order to achieve densities above 92% [44,45].
Using the SPS procedures as described in the methods section, pellets possessing relative densities of >90% were obtained for all three famatinite samples, with a brief summary of attempted SPS conditions displayed in Table S1. The Mn-doped sample exhibited the highest density (94%), while the undoped and Zn-doped pellets displayed 90% and 91% densities, respectively. An additional holding step was introduced into the SPS procedure to densify the Zn- and Mn-doped nanoparticles to produce pellets with sufficient density. To increase sample density, manipulation of other variables, such as the SPS pressure, was also attempted, but pellets were produced with low densities that were brittle and prone to cracking. Further optimization of the SPS parameters may allow future research to produce high-density famatinite pellets.
After processing with SPS, the famatinite pellets were characterized by XRD to check phase purity (Figure S1), revealing that famatinite remained the primary phase in all samples. Rietveld refinements (Tables S2 and S3) show that grain sizes for famatinite nanomaterials increased post-SPS with undoped having the largest grain size at 250 Å and the Zn- and Mn-doped having grain sizes of 130 and 150 Å, respectively. XRD characterization revealed a minor tetrahedrite (Cu12Sb4S13) impurity in the Mn-doped famatinite pellet, which, based on previous thermal analysis, is likely the result of partial decomposition of famatinite to tetrahedrite via sulfur loss [31]. The reference intensity ratio (RIR) method was used to estimate the relative quantities of each phase in the sample, with the impurity calculated to be a minor component of the overall sample.
XRD analysis was undertaken again for the famatinite pellets after analysis of the electronic transport properties (Figure S2). Rietveld refinements (Tables S2 and S3) show that grain sizes did not significantly change during characterization. A minor Cu1.8S impurity phase was detected for the undoped sample, while the minor tetrahedrite impurity phase persisted in the Mn-doped famatinite. Once again, RIR analysis confirmed that the relative quantity of the impurity phases in both samples remained minor. SEM characterization of the famatinite pellets after transport property analysis was also performed (Figure S3). Famatinite particles are agglomerated, possibly induced by mechanical and thermal stress from the densification and characterization processes. Diameters of the polycrystalline particles remained <100 nm, as observed by SEM. Interestingly, it appears that the polycrystalline particle agglomerations within the undoped sample are larger than those in the Zn-doped and Mn-doped samples. This observation agrees with the Rietveld analysis conducted on the post-characterization pellets, which revealed that the undoped famatinite had the largest grain size after densification and characterization (Tables S2 and S3). Overall, XRD and SEM characterization confirmed that the products remained nanostructured.

3.3. Electronic Transport Properties and Power Factor

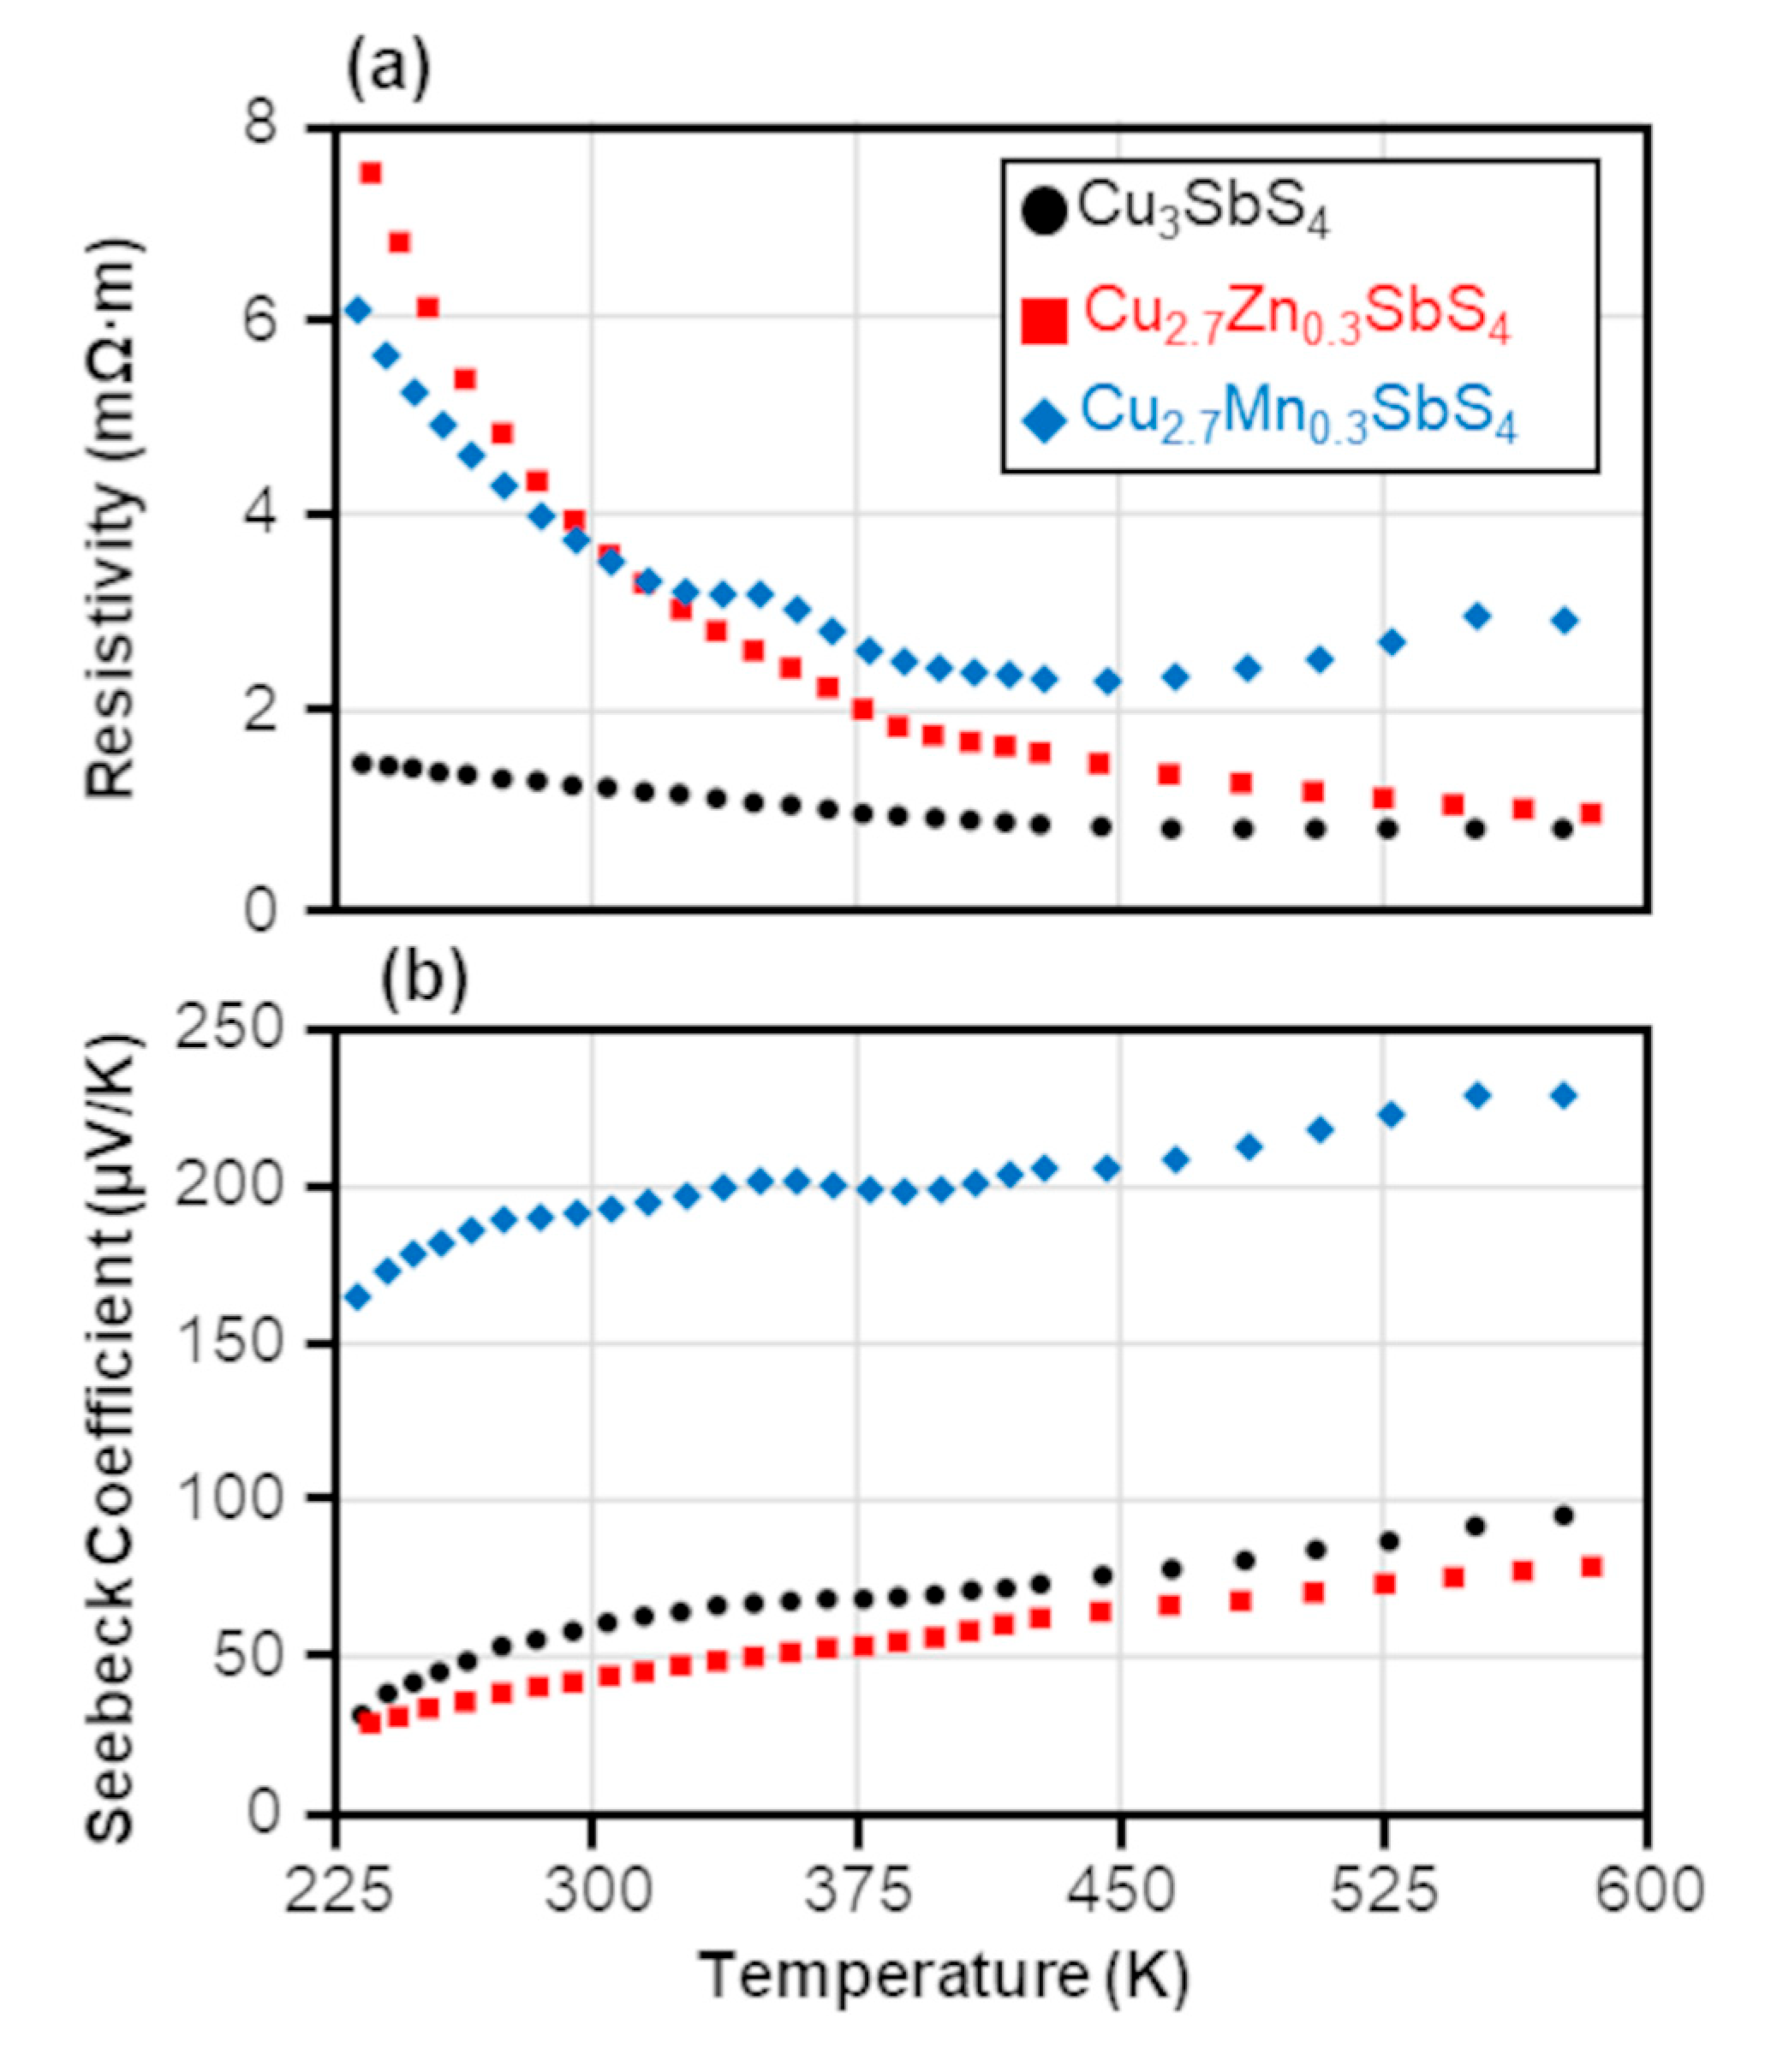
The temperature-dependent electronic transport properties of the SPS-processed undoped and doped famatinites (Cu3−xMxSbS4; M = Zn, Mn; x = 0, 0.3) are shown in Figure 5. The resistivity ( ρ ) of all the samples (Figure 5a) decreased with increasing temperature, exhibiting a typical semiconducting behavior. The undoped sample exhibits the lowest resistivity at 295 K ( ρ ~ 1.3 mΩ·m) compared to the Zn-doped ( ρ ~ 3.8 mΩ·m), and the Mn-doped ( ρ ~ 3.7 mΩ·m) samples. At 575 K, these ρ values reduced further to ρ ~ 0.8 mΩ·m, ρ ~ 1 mΩ·m and ρ ~ 2.9 mΩ·m, in the undoped, Zn-doped and Mn-doped famatinites, respectively. According to Rietveld analysis of the as-synthesized, densified, and post-characterization famatinite materials, the undoped sample possessed the largest grain sizes. As resistivity is known to increase as the grain diameter decreases in nanoscale materials due to increased density of grain boundaries that is expected to increase the scattering of charge carriers, the larger grain size for the undoped famatinite sample may have engendered a lower resistivity [52].
Wang et al. measured a resistivity of ρ ~ 0.44 mΩ·m at 500 K for the undoped famatinite nanoparticles prepared via a solvothermal process, which is approximately half the resistivity found for the polyol-synthesized famatinite nanomaterials at 500 K ( ρ ~ 0.81 mΩ·m) [46]. Similarly, lower resistivity values relative to the polyol-synthesized famatinite were obtained by D. Chen et al. for hot-injection synthesized undoped famatinite ( ρ ~ 0.14 mΩ·m) and Ni-doped famatinite (Cu2.25Ni0.75SbS4, ρ ~ 0.044 mΩ·m) nanoparticles at 523 K [41]. The higher dopant level (x = 0.75) for the Ni-doped famatinite published by D. Chen et al. compared to the doping level in the polyol-synthesized famatinite (x = 0.3) could partially account for the difference in resistivities. Furthermore, the Ni-doped famatinite synthesized by D. Chen et al. contains a significant secondary phase, which would affect the transport properties [41].
The polyol-synthesized famatinite nanoparticles as well as the famatinite nanomaterials synthesized by other solution-phase methods referenced above, all had relative densities ranging from 85–94% [41,46]. Efforts to increase the relative densities of these materials will likely help produce materials with lower resistivity. Furthermore, the electronic properties of nanomaterials are size-dependent, with nanomaterials exhibiting increased resistivity relative to bulk material [52]. However, Lee et al. and K. Chen et al. obtained resistivities of ρ ~ 5 mΩ·m [35] and ρ ~ 4 mΩ·m at 575 K [36], respectively, for bulk undoped famatinite synthesized by mechanical alloying with micron-scale grain sizes. These values are significantly higher than the resistivity of the undoped famatinite nanomaterials herein ( ρ ~ 0.8 mΩ·m). Additional research is therefore required to understand the impact of pellet density and particle size on the resistivity of famatinite nanomaterials.
The temperature-dependent Seebeck coefficient ( S ) for the polyol-synthesized famatinite nanoparticles is shown in Figure 5b. As the value of the Seebeck coefficient is positive for all samples across the entire temperature range, the famatinite nanoparticles exhibit p-type semiconducting behavior, while the steady increase in the Seebeck coefficient with increasing temperature indicates a diffusive behavior [53]. The undoped famatinite nanoparticles possess a Seebeck coefficient of S < 100 μVK−1 over the entire temperature range (225 K–575 K), with a maximum value of S ~ 94 μVK−1 for the undoped famatinite at 575 K, which is lower than the Seebeck coefficient measured for nanoscale undoped famatinite synthesized via the solvothermal method by Wang et al. ( S ~ 120 μVK−1 at 500 K) and via hot-injection by D. Chen et al. ( S ~ 180 μVK−1 at 500 K) [41,46]. Seebeck coefficients for nanoscale undoped famatinite produced by solution-phase methods described above are all lower than Seebeck coefficients obtained for undoped bulk famatinite by Lee et al. ( S ~ 600 μVK−1 at 575 K) [35] and K. Chen et al. ( S ~ 575 μVK−1 at 575 K) [36].
While the polyol-synthesized Zn-doped famatinite nanoparticles displayed a lower Seebeck coefficient ( S ~ 78 μVK−1 at 575 K) than the undoped sample, the polyol-synthesized Mn-doped famatinite nanoparticles exhibited a Seebeck coefficient ranging from S ~ 180 μVK−1 at room temperature to S ~ 225 μVK−1 at 575 K, greater than the Seebeck coefficients of the polyol-synthesized undoped and Zn-doped famatinite nanoparticles across all temperatures. Notably, the Mn-doped famatinite pellet possesses a higher density than other samples and also developed a minor tetrahedrite impurity during SPS (Figure S1), both of which could impact the Seebeck coefficient. The polyol-synthesized Mn-doped famatinite nanoparticles possess a higher Seebeck coefficient relative to hot-injection synthesized Ni-doped (Cu2.25Ni0.75SbS4) famatinite nanocrystals studied by D. Chen et al. that exhibited a Seebeck coefficient of ~180 μVK−1 at 523 K [41]. Interestingly, D. Chen et al. did not observe an expected decrease in the Seebeck coefficient as a function of Ni incorporation, which was attributed to the spin effect of the paramagnetic Ni2+ dopant ([Ar]3d8) [41]. Mn2+ ([Ar]3d5) is also a spin-active species, with a larger magnetic moment than Ni2+ due to having a higher number of unpaired electrons and a maximum total spin of 5/2 (compared to a spin of 1 for Ni2+), while Zn2+ is diamagnetic ([Ar]3d10). EPR studies conducted on the same Mn- and Zn-doped famatinite nanomaterials as investigated in the study herein confirmed that each sample exhibited different magnetic spin behavior, specifically our recent publication shows the presence of the Mn2+ spin state [54]. This phenomenon is hypothesized to partially account for the increased Seebeck coefficient when doping with Mn2+, the unchanged Seebeck coefficient observed when doping with Ni2+ [41], and the lower Seebeck coefficient displayed when doping with Zn2+.
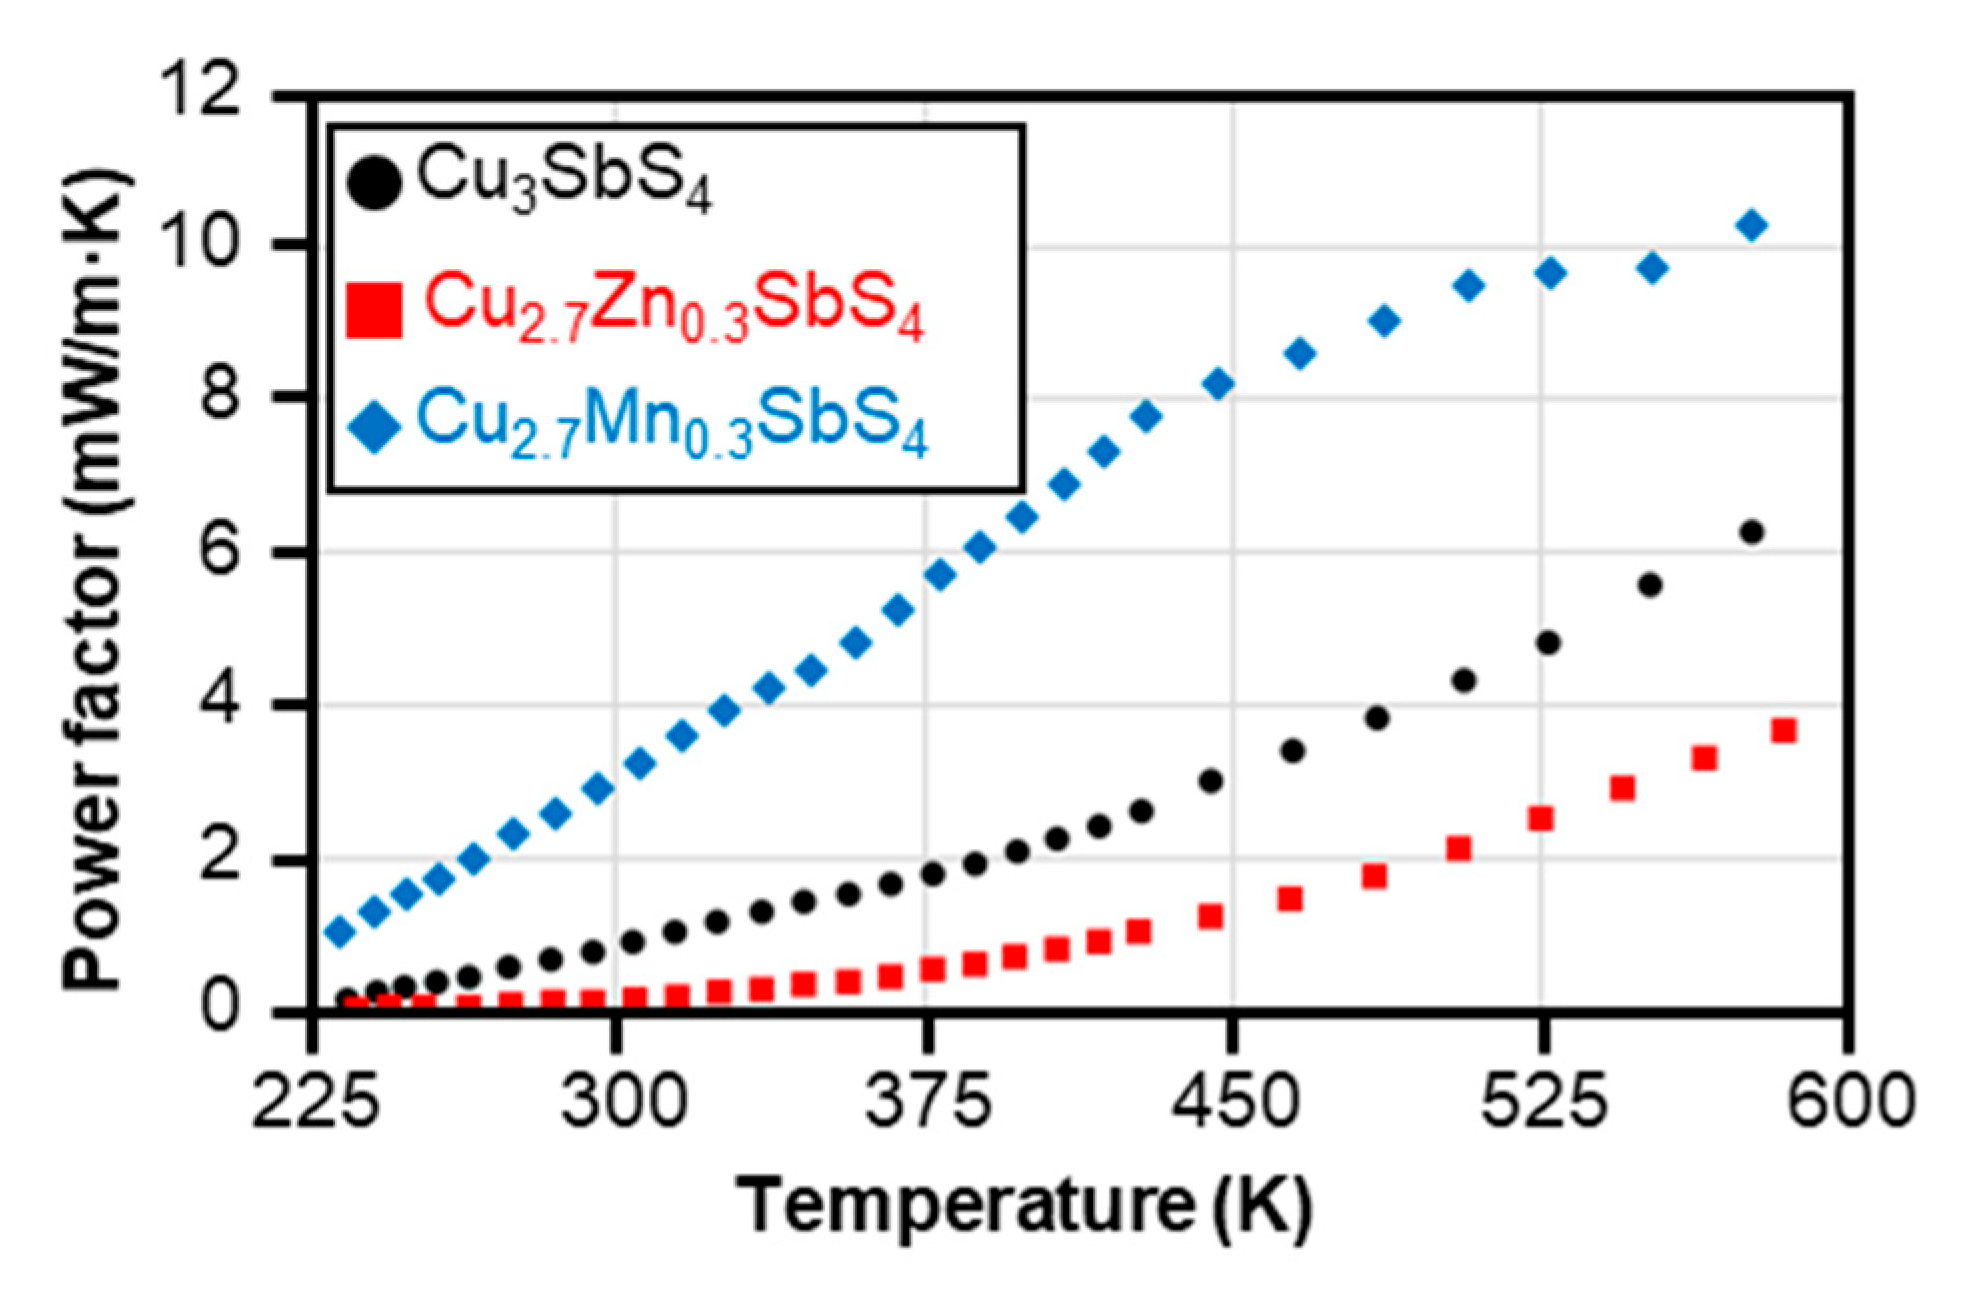
The temperature dependence of the power factor ( P F ) (presented as S 2 T / ρ where T is the absolute temperature in Kelvin) is displayed in Figure 6. For all samples, the P F is shown to increase with temperature. The P F for the undoped famatinite nanomaterials grows from P F ~ 0.8 mW·m−1K−1 at room temperature to a maximum of P F ~ 6.3 mW·m−1K−1 at 575 K. The Zn-doped famatinite nanoparticles, as a result of having higher ρ and lower S than the undoped sample, have a lower power factor than the undoped sample throughout the whole temperature range, increasing from P F ~ 0.16 mW·m−1K−1 at room temperature to P F ~ 3.7 mW·m−1K−1 at 575 K. The Mn-doped famatinite nanomaterials exhibit a P F , which increases at a linear rate from 225 K to 425 K, engendered by steady linear growth of S and exponential decay of the ρ . However, at T > 425 K, the P F begins to increase at a slower rate as a result of the ρ beginning to increase. The P F for the Mn-doped sample is significantly higher than the P F of the undoped or Zn-doped famatinite nanomaterials across the whole temperature range, increasing from P F ~ 2.9 mW·m−1K−1 at room temperature to P F ~ 10.6 mW·m−1K−1 at 575 K. This represents a nearly 75% increase in maximum P F at 575 K relative to the undoped sample, providing substantial evidence that Mn has great potential to increase the P F (and therefore ZT) of famatinite materials for thermoelectric applications. As a result, future studies into the charge carrier concentration, thermal diffusivity, thermal conductivity, and overall ZT of Mn-doped famatinite materials are merited.
Literature comparisons reveal that the P F of the polyol-synthesized famatinite nanoparticles is heavily impacted by a high resistivity. Despite having a lower Seebeck coefficient, undoped and higher concentration of Ni-doped famatinite nanoparticles studied by D. Chen et al. display P F ~ 117 mW·m−1K−1 and P F ~ 388 mW·m−1K−1 (at 525 K), respectively, due to possessing lower resistivities [41]. Similarly, Wang et al. produced nanostructured undoped famatinite (composed of hierarchical flower-like microspheres ~ 1.5 to 2 mm diameters) with a P F of 16.2 mW·m−1K−1 at 500 K (compared to ~9.5 mW·m−1K−1 at 500K for the Mn-doped famatinite herein) because while having a S less than the Mn-doped famaitnite, the Wang et al. sample had a ρ five times lower despite having a lower density of ~85% [46]. Therefore, a key aspect of future investigations should revolve around reducing ρ   while still maintaining a high S by optimizing the dopant concentration and the grain size. In the literature, K. Chen et al. and Pi et al. have found success in reducing the ρ of famatinite (synthesized by solid-state methods) by incorporating small amounts of Ge and Sn dopants, respectively, onto the Sb-site of famatinite [36,39]. While this doping also caused a corresponding drop in S , K. Chen et al. and Pi et al. were able to measure high P F values of P F > 575 mW·m−1K−1 (Cu3Sb0.85Ge0.15S4) [36] and P F > 460 mW·m−1K−1 (Cu3Sb0.92Sn0.08S4) [39], respectively, at 575 K. Therefore, a potential future avenue for solution-phase synthesis would be to dope nanostructured famatinite on both the copper and antimony sites simultaneously. Doping with a diamagnetic species with a low valence state on the Sb5+ site of famatinite would release additional hole carriers (thereby decreasing ρ ), while doping on the Cu-site with a spin-active species (such as Mn2+) may increase S . This process could lead to significantly elevated P F in a nanoscale famatinite material.

4. Conclusions

In summary, famatinite (Cu2.7M0.3SbS4, M = Cu, Zn, Mn) nanomaterials doped on the Cu-site with Zn and Mn were produced on a 2+-gram scale using the modified polyol process. This is the first time that the thermoelectric analysis of Zn- and Mn-doped famatinite synthesized by any method has been undertaken. As-synthesized nanoparticles were confirmed to be single-phase by XRD, while EDS revealed homogenous elemental distribution and elemental ratios close to the target composition. SPS methods were used to process as-synthesized famatinite nanomaterials into pellets, with DSC and TGA analysis consulted to optimize SPS conditions for each sample. The resistivities and Seebeck coefficients of the processed famatinite nanoparticles were measured, and the thermoelectric power factor was calculated for each sample. XRD characterization was performed on pellets both after densification with SPS and after electronic transport property analysis, showing that famatinite remained the majority phase throughout processing and characterization, while SEM images of the interior of the famatinite pellets post-characterization revealed that famatinite remained nanostructured.
All samples displayed a positive Seebeck coefficient, indicative of p-type semiconducting behavior. Seebeck coefficients of ~94 μVK−1 and ~77 μVK−1 were measured for the undoped and Zn-doped famatinite nanomaterials at 575 K, with the Mn-doped sample exhibiting a significantly increased Seebeck coefficient of ~229 μVK−1 at 575 K. The increase in Seebeck coefficients for the Mn-doped famatinite relative to the other two famatinite samples is hypothesized to be related to the high magnetic spin activity of the Mn2+ dopant species and also likely due to an increase in the number of free electrons contributed by Mn2+ over Cu1+. Future research could include doping famatinite with other magnetically active transition metal species such as Ni2+ and Co2+ to further study the impact of magnetic spin activity on the Seebeck coefficient of famatinite materials. Resistivities for the undoped, Zn-doped, and Mn-doped samples were found to be ~0.8 mΩ·m, ~1 mΩ·m, and ~2.9 mΩ·m at 575 K, respectively. These higher resistivities in part are due to low relative densities for processed famatinite pellets (90–94%) combined with small grain sizes (~7 nm). Due to an elevated Seebeck coefficient, the thermoelectric power factor for the Mn-doped famatinite (~10.3 mW·m−1K−1) is over 60% higher than that of the undoped famatinite (6.3 mW·m−1K−1) and over three times higher than the power factor of the Zn-doped famatinite (3.4 mW·m−1K−1).
The optimization of Mn-doped famatinite is a promising avenue for future research for those using conventional solid-state synthetic approaches as well as those undertaking solution-phase methodologies. The synthesis of famatinite doped with varying amounts of manganese should be explored, specifically targeting Mn-doped degenerate semiconducting famatinites with metal-like resistivity and simultaneously high Seebeck coefficients for a higher PF. Combining doping with manganese on the Cu-site (shown to increase the Seebeck coefficient) and doping with a low-valence metal or semimetal species such as tin or germanium on the Sb-site of famatinite (shown to decrease resistivity) could further optimize the power factor. To improve the resistivity of famatinite nanomaterials, investigations should explore the optimal grain/particle sizes and optimization of SPS procedures for solution-phase-produced nanomaterials. Finally, the thermal conductivity of Mn-doped famatinite materials should be studied, and the overall ZT should be determined. This research seeks to optimize the nontoxic and inexpensive thermoelectric material famatinite for future high-performance thermoelectric energy generation applications geared towards providing greener energy solutions worldwide.

Supplementary Materials

The following supporting information can be downloaded at: https://www.mdpi.com/article/10.3390/electronicmat6030010/s1, Table S1: Summary of SPS parameters used while developing an optimized densification process for famatinite nanomaterials, Figure S1: Calculated patterns derived from powder XRD analysis of famatinite nanoparticles after processing with SPS, Table S2: Rietveld refinement calculations for famatinite nanoparticles after processing with SPS, including lattice parameters, grain size, and Chi2 values, Figure S2: Calculated patterns derived from powder XRD analysis of famatinite nanoparticles after transport property analysis, Table S3: Rietveld refinement calculations for famatinite nanoparticles after transport property analysis, including lattice parameters, grain size, and Chi2 values, Figure S3: Scanning electron microscopy images of the interior of the famatinite pellets after transport property analysis, and Original uncropped TEM and SEM images.

Author Contributions

Conceptualization, J.E.D., M.S.J., A.B.III, S.B., A.R. and M.E.A.; Methodology, J.E.D., M.S.J., A.B.III, E.W., S.B. and M.E.A.; Investigation, J.E.D., E.W., M.S.J., S.B. and M.E.A.; Resources, A.R., S.B. and M.E.A.; Data Curation, J.E.D. and E.W.; Writing—Original Draft Preparation, J.E.D.; Writing—Review & Editing, J.E.D., M.S.J., A.R., S.B. and M.E.A.; Visualization, J.E.D., M.S.J. and M.E.A. Supervision, S.B. and M.E.A.; Project Administration, A.R., S.B. and M.E.A.; Funding Acquisition, A.R. and M.E.A. All authors have read and agreed to the published version of the manuscript.

Funding

Aspects of this work were financially supported by NSF Made in SC EPSCoR #OIA-1655740 and The Camille & Henry Dreyfus Foundation. Authors E.W., A.B., S.B. and A.M.R. acknowledge the seed funding for this project through the R.A. Bowen Endowed Professorship funds, Clemson University.

Data Availability Statement

The original contributions presented in this study are included in this article/Supplementary Material. Further inquiries can be directed to the corresponding author.

Acknowledgments

Additional support was provided by the Furman University Chemistry Department, Christopher Romanek, and Xuezhong He. The spark plasma sintered samples were prepared at Clemson University and the temperature dependent Seebeck coefficient and resistivity data presented herein were obtained at the Clemson Nanomaterials Institute, which Clemson University operates. S.B. and A.M. Rao acknowledge support through the R.A. Bowen Endowed Professorship funds at Clemson University.

Conflicts of Interest

The authors declare no conflicts of interest.

References

  1. Global Energy Transformation: A Roadmap to 2050. Available online: https://www.irena.org/-/media/Files/IRENA/Agency/Publication/2018/Apr/IRENA_Report_GET_2018.pdf (accessed on 3 April 2024).
  2. Nyquist, S. Insights from the Ground Up. Available online: https://www.mckinsey.com/industries/oil-and-gas/our-insights/energy-2050-insights-from-the-ground-up (accessed on 3 April 2024).
  3. Outlook for Electricity. Available online: https://www.iea.org/reports/world-energy-outlook-2022/outlook-for-electricity (accessed on 3 April 2024).
  4. Tritt, T.M. Thermoelectric Phenomena, Materials, and Applications. Annu. Rev. Mater. Res. 2011, 41, 433–448. [Google Scholar] [CrossRef]
  5. Shi, X.; Chen, L. Thermoelectric Materials Step Up. Nat. Mater. 2016, 15, 691–692. [Google Scholar] [CrossRef] [PubMed]
  6. Shi, X.-L.; Zou, J.; Chen, Z.-G. Advanced Thermoelectric Design: From Materials and Structures to Devices. Chem. Rev. 2020, 120, 7399–7515. [Google Scholar] [CrossRef] [PubMed]
  7. Finn, P.A.; Asker, C.; Wan, K.; Bilotti, E.; Fenwick, O.; Nielsen, C.B. Thermoelectric Materials: Current Status and Future Challenges. Front. Electron. Mater. 2021, 1, 677845. [Google Scholar] [CrossRef]
  8. Mamur, H.; Dilmaç, Ö.F.; Begum, J.; Bhuiyan, M.R.A. Thermoelectric Generators Act as Renewable Energy Sources. Clean. Mater. 2021, 2, 100030. [Google Scholar] [CrossRef]
  9. Olabi, A.G.; Al-Murisi, M.; Maghrabie, H.M.; Yousef, B.A.; Sayed, E.T.; Alami, A.H.; Abdelkareem, M.A. Potential Applications of Thermoelectric Generators (TEGs) in Various Waste Heat Recovery Systems. Int. J. Thermofluids 2022, 16, 100249. [Google Scholar] [CrossRef]
  10. Kumar, A.; Bano, S.; Govind, B.; Bhardwaj, A.; Bhatt, K.; Misra, D.K. A Review on Fundamentals, Design and Optimization to High ZT of Thermoelectric Materials for Application to Thermoelectric Technology. J. Electron. Mater. 2021, 50, 6037–6059. [Google Scholar] [CrossRef]
  11. Giri, K.; Wang, Y.-L.; Chen, T.-H.; Chen, C.-H. Challenges and Strategies to Optimize the Figure of Merit: Keeping Eyes on Thermoelectric Metamaterials. Mater. Sci. Semicond. Process. 2022, 150, 106944. [Google Scholar] [CrossRef]
  12. Yan, Q.; Kanatzidis, M.G. High-Performance Thermoelectrics and Challenges for Practical Devices. Nat. Mater. 2022, 21, 503–513. [Google Scholar] [CrossRef]
  13. Rowe, D.M.; Min, G. Multiple Potential Barriers as a Possible Mechanism to Increase the Seebeck Coefficient and Electrical Power Factor. AIP Conf. Proc. 1994, 316, 339–342. [Google Scholar] [CrossRef]
  14. Puneet, P.; Podila, R.; Karakaya, M.; Zhu, S.; He, J.; Tritt, T.M.; Dresselhaus, M.S.; Rao, A.M. Preferential Scattering by Interfacial Charged Defects for Enhanced Thermoelectric Performance in Few-Layered n-Type Bi2Te3. Sci. Rep. 2013, 3, 3212. [Google Scholar] [CrossRef]
  15. Mehdizadeh Dehkordi, A.; Zebarjadi, M.; He, J.; Tritt, T.M. Thermoelectric Power Factor: Enhancement Mechanisms and Strategies for Higher Performance Thermoelectric Materials. Mater. Sci. Eng. R Rep. 2015, 97, 1–22. [Google Scholar] [CrossRef]
  16. Jaldurgam, F.F.; Ahmad, Z.; Touati, F. Low-Toxic, Earth-Abundant Nanostructured Materials for Thermoelectric Applications. Nanomaterials 2021, 11, 895. [Google Scholar] [CrossRef]
  17. Powell, A.V. Recent Developments in Earth-Abundant Copper-Sulfide Thermoelectric Materials. J. Appl. Phys. 2019, 126, 100901. [Google Scholar] [CrossRef]
  18. Mulla, R.; Rabinal, M.H.K. Copper Sulfides: Earth-Abundant and Low-Cost Thermoelectric Materials. Energy Technol. 2019, 7, 1800850. [Google Scholar] [CrossRef]
  19. Coughlan, C.; Ibáñez, M.; Dobrozhan, O.; Singh, A.; Cabot, A.; Ryan, K.M. Compound Copper Chalcogenide Nanocrystals. Chem. Rev. 2017, 117, 5865–6109. [Google Scholar] [CrossRef]
  20. Ramasamy, K.; Sims, H.; Butler, W.H.; Gupta, A. Selective Nanocrystal Synthesis and Calculated Electronic Structure of All Four Phases of Copper–Antimony–Sulfide. Chem. Mater. 2014, 26, 2891–2899. [Google Scholar] [CrossRef]
  21. Suehiro, S.; Horita, K.; Yuasa, M.; Tanaka, T.; Fujita, K.; Ishiwata, Y.; Shimanoe, K.; Kida, T. Synthesis of Copper–Antimony-Sulfide Nanocrystals for Solution-Processed Solar Cells. Inorg. Chem. 2015, 54, 7840–7845. [Google Scholar] [CrossRef]
  22. Suzumura, A.; Watanabe, M.; Nagasako, N.; Asahi, R. Improvement in Thermoelectric Properties of Se-Free Cu3SbS4 Compound. J. Electron. Mater. 2014, 43, 2356–2361. [Google Scholar] [CrossRef]
  23. Weller, D.P.; Morelli, D.T. Tetrahedrite Thermoelectrics: From Fundamental Science to Facile Synthesis. Front. Electron. Mater. 2022, 2, 913280. [Google Scholar] [CrossRef]
  24. Lu, X.; Morelli, D.T.; Xia, Y.; Zhou, F.; Ozolins, V.; Chi, H.; Zhou, X.; Uher, C. High Performance Thermoelectricity in Earth-Abundant Compounds Based on Natural Mineral Tetrahedrites. Adv. Energy Mater. 2013, 3, 342–348. [Google Scholar] [CrossRef]
  25. Xu, B.; Zhang, X.; Sun, Y.; Zhang, J.; Wang, Y.; Yi, L. Elastic Anisotropy and Anisotropic Transport Properties of Cu3SbSe4 and Cu3SbS4. J. Phys. Soc. Jpn. 2014, 83, 094606. [Google Scholar] [CrossRef]
  26. Chen, K.; Di Paola, C.; Du, B.; Zhang, R.; Laricchia, S.; Bonini, N.; Weber, C.; Abrahams, I.; Yan, H.; Reece, M. Enhanced Thermoelectric Performance of Sn-Doped Cu3SbS4. J. Mater. Chem. C 2018, 6, 8546–8552. [Google Scholar] [CrossRef]
  27. Garin, J.; Parthé, E. The Crystal Structure of Cu3PSe4 and Other Ternary Normal Tetrahedral Structure Compounds with Composition 13564. Acta Cryst. B Struct. Sci. Cryst. Eng. Mater. 1972, 28, 3672–3674. [Google Scholar] [CrossRef]
  28. Crespo, C.T. Microscopic Optical Absorption, Analysis, and Applications of Famatinite Cu3SbS4. J. Phys. Chem. C 2016, 120, 7959–7965. [Google Scholar] [CrossRef]
  29. Van Embden, J.; Latham, K.; Duffy, N.W.; Tachibana, Y. Near-Infrared Absorbing Cu12Sb4S13 and Cu3SbS4 Nanocrystals: Synthesis, Characterization, and Photoelectrochemistry. J. Am. Chem. Soc. 2013, 135, 11562–11571. [Google Scholar] [CrossRef] [PubMed]
  30. Tanishita, T.; Suekuni, K.; Nishiate, H.; Lee, C.-H.; Ohtaki, M. A Strategy for Boosting the Thermoelectric Performance of Famatinite Cu3SbS4. Phys. Chem. Chem. Phys. 2020, 22, 2081–2086. [Google Scholar] [CrossRef]
  31. Jensen, M.S.; Plass, K.E.; Anderson, M.E. Synthetic Strategies, Thermal Stability, and Optical Properties for Nanostructured Famatinite with Cu-Site Doping. Chem. Mater. 2022, 34, 9086–9097. [Google Scholar] [CrossRef]
  32. Zhang, J.; Liu, R.; Cheng, N.; Zhang, Y.; Yang, J.; Uher, C.; Shi, X.; Chen, L.; Zhang, W. High-Performance Pseudocubic Thermoelectric Materials from Non-cubic Chalcopyrite Compounds. Adv. Mater. 2014, 26, 3848–3853. [Google Scholar] [CrossRef]
  33. Dutková, E.; Kováč, J.; Kováč, J.; Hejtmánek, J.; Levinský, P.; Kashimbetova, A.; Sayagués, M.J.; Fabián, M.; Lukáčová Bujňáková, Z.; Baláž, M.; et al. Properties of Mechanochemically Synthesized Famatinite Cu3SbS4 Nanocrystals. Micro 2023, 3, 458–470. [Google Scholar] [CrossRef]
  34. Neophytou, N.; Zianni, X.; Kosina, H.; Frabboni, S.; Lorenzi, B.; Narducci, D. Simultaneous Increase in Electrical Conductivity and Seebeck Coefficient in Highly Boron-Doped Nanocrystalline Si. Nanotechnology 2013, 24, 205402. [Google Scholar] [CrossRef]
  35. Lee, G.-E.; Pi, J.-H.; Kim, I.-H. Preparation and Thermoelectric Properties of Famatinite Cu3SbS4. J. Electron. Mater. 2020, 49, 2781–2788. [Google Scholar] [CrossRef]
  36. Chen, K.; Du, B.; Bonini, N.; Weber, C.; Yan, H.; Reece, M.J. Theory-Guided Synthesis of an Eco-Friendly and Low-Cost Copper Based Sulfide Thermoelectric Material. J. Phys. Chem. C 2016, 120, 27135–27140. [Google Scholar] [CrossRef]
  37. Lu, B.; Wang, M.; Yang, J.; Hou, H.; Zhang, X.; Shi, Z.; Liu, J.; Qiao, G.; Liu, G. Dense Twin and Domain Boundaries Lead to High Thermoelectric Performance in Sn-Doped Cu3SbS4. Appl. Phys. Lett. 2022, 120, 173901. [Google Scholar] [CrossRef]
  38. Pi, J.-H.; Lee, G.-E.; Kim, I.-H. Charge Transport and Thermoelectric Properties of Ge-Doped Famatinites Cu3Sb1−yGeyS4. Electron. Mater. Lett. 2021, 17, 427–435. [Google Scholar] [CrossRef]
  39. Pi, J.-H.; Lee, G.-E.; Kim, I.-H. Effects of Sn-Doping on the Thermoelectric Properties of Famatinite. J. Electron. Mater. 2020, 49, 2755–2761. [Google Scholar] [CrossRef]
  40. Shen, M.; Lu, S.; Zhang, Z.; Liu, H.; Shen, W.; Fang, C.; Wang, Q.; Chen, L.; Zhang, Y.; Jia, X. Bi and Sn Co-Doping Enhanced Thermoelectric Properties of Cu3SbS4 Materials with Excellent Thermal Stability. ACS Appl. Mater. Interfaces 2020, 12, 8271–8279. [Google Scholar] [CrossRef]
  41. Chen, D.; Zhao, Y.; Chen, Y.; Lu, T.; Wang, Y.; Zhou, J.; Liang, Z. Thermoelectric Enhancement of Ternary Copper Chalcogenide Nanocrystals by Magnetic Nickel Doping. Adv. Electron. Mater. 2016, 2, 1500473. [Google Scholar] [CrossRef]
  42. Heo, J.; Laurita, G.; Muir, S.; Subramanian, M.A.; Keszler, D.A. Enhanced Thermoelectric Performance of Synthetic Tetrahedrites. Chem. Mater. 2014, 26, 2047–2051. [Google Scholar] [CrossRef]
  43. Tippireddy, S.; Chetty, R.; Naik, M.H.; Jain, M.; Chattopadhyay, K.; Mallik, R.C. Electronic and Thermoelectric Properties of Transition Metal Substituted Tetrahedrites. J. Phys. Chem. C 2018, 122, 8735–8749. [Google Scholar] [CrossRef]
  44. Weller, D.P.; Stevens, D.L.; Kunkel, G.E.; Ochs, A.M.; Holder, C.F.; Morelli, D.T.; Anderson, M.E. Thermoelectric Performance of Tetrahedrite Synthesized by a Modified Polyol Process. Chem. Mater. 2017, 29, 1656–1664. [Google Scholar] [CrossRef]
  45. Weller, D.P.; Kunkel, G.E.; Ochs, A.M.; Morelli, D.T.; Anderson, M.E. Observation of N-Type Behavior in Fe-Doped Tetrahedrite at Low Temperature. Mater. Today Phys. 2018, 7, 1–6. [Google Scholar] [CrossRef]
  46. Wang, Q.; Li, J.; Li, J. Enhanced Thermoelectric Performance of Cu3SbS4 Flower-like Hierarchical Architectures Composed of Cl Doped Nanoflakes via an in Situ Generated CuS Template. Phys. Chem. Chem. Phys. 2018, 20, 1460–1475. [Google Scholar] [CrossRef] [PubMed]
  47. Bella, M.; Rivero, C.; Blayac, S.; Basti, H.; Record, M.C.; Boulet, P. Oleylamine-Assisted Solvothermal Synthesis of Copper Antimony Sulfide Nanocrystals: Morphology and Phase Control. Mater. Res. Bull. 2017, 90, 188–194. [Google Scholar] [CrossRef]
  48. Anderson, M.E.; Bharadwaya, S.S.N.; Schaak, R.E. Modified Polyol Synthesis of Bulk-Scale Nanostructured Bismuth Antimony Telluride. J. Mater. Chem. 2010, 20, 8362–8367. [Google Scholar] [CrossRef]
  49. Lee, G.-E.; Kim, I.-H. Preparation and Investigation of Thermoelectric Properties of Cu3SbS4-Cu3SbSe4 Solid Solutions. Korean J. Met. Mater. 2022, 60, 384–390. [Google Scholar] [CrossRef]
  50. Tritt, T.M.; Browning, V.M. Chapter 2 Overview of Measurement and Characterization Techniques for Thermoelectric Materials. In Semiconductors and Semimetals; Tritt, T.M., Ed.; Elsevier: Amsterdam, The Netherlands, 2001; Volume 69, pp. 25–49. ISBN 9780127521787. [Google Scholar]
  51. Nandihalli, N. A Short Account of Thermoelectric Film Characterization Techniques. Mater. Today Phys. 2023, 36, 101173. [Google Scholar] [CrossRef]
  52. Sachin; Pandey, B.K.; Jaiswal, R.L. Electrical Conductivity of Semiconducting Nanoparticles. Phys. B Condens. Matter 2022, 646, 414279. [Google Scholar] [CrossRef]
  53. Wu, C.-Y.; Thanh, T.V.; Chen, Y.-F.; Lee, J.-K.; Lin, J.-J. Free-Electronlike Diffusive Thermopower of Indium Tin Oxide Thin Films. J. Appl. Phys. 2010, 108, 123708. [Google Scholar] [CrossRef]
  54. Daniel, J.E.; Weaver, S.I.; Matthias, B.R.; Golden, R.; George, G.M.; Kerpal, C.; Donley, C.L.; Jarocha, L.E.; Anderson, M.E. Investigating Cu-Site Doped Cu–Sb–S Nanoparticles Using Photoelectron and Electron Paramagnetic Resonance Spectroscopy. J. Phys. Chem. C 2024, 128, 13888–13899. [Google Scholar] [CrossRef]
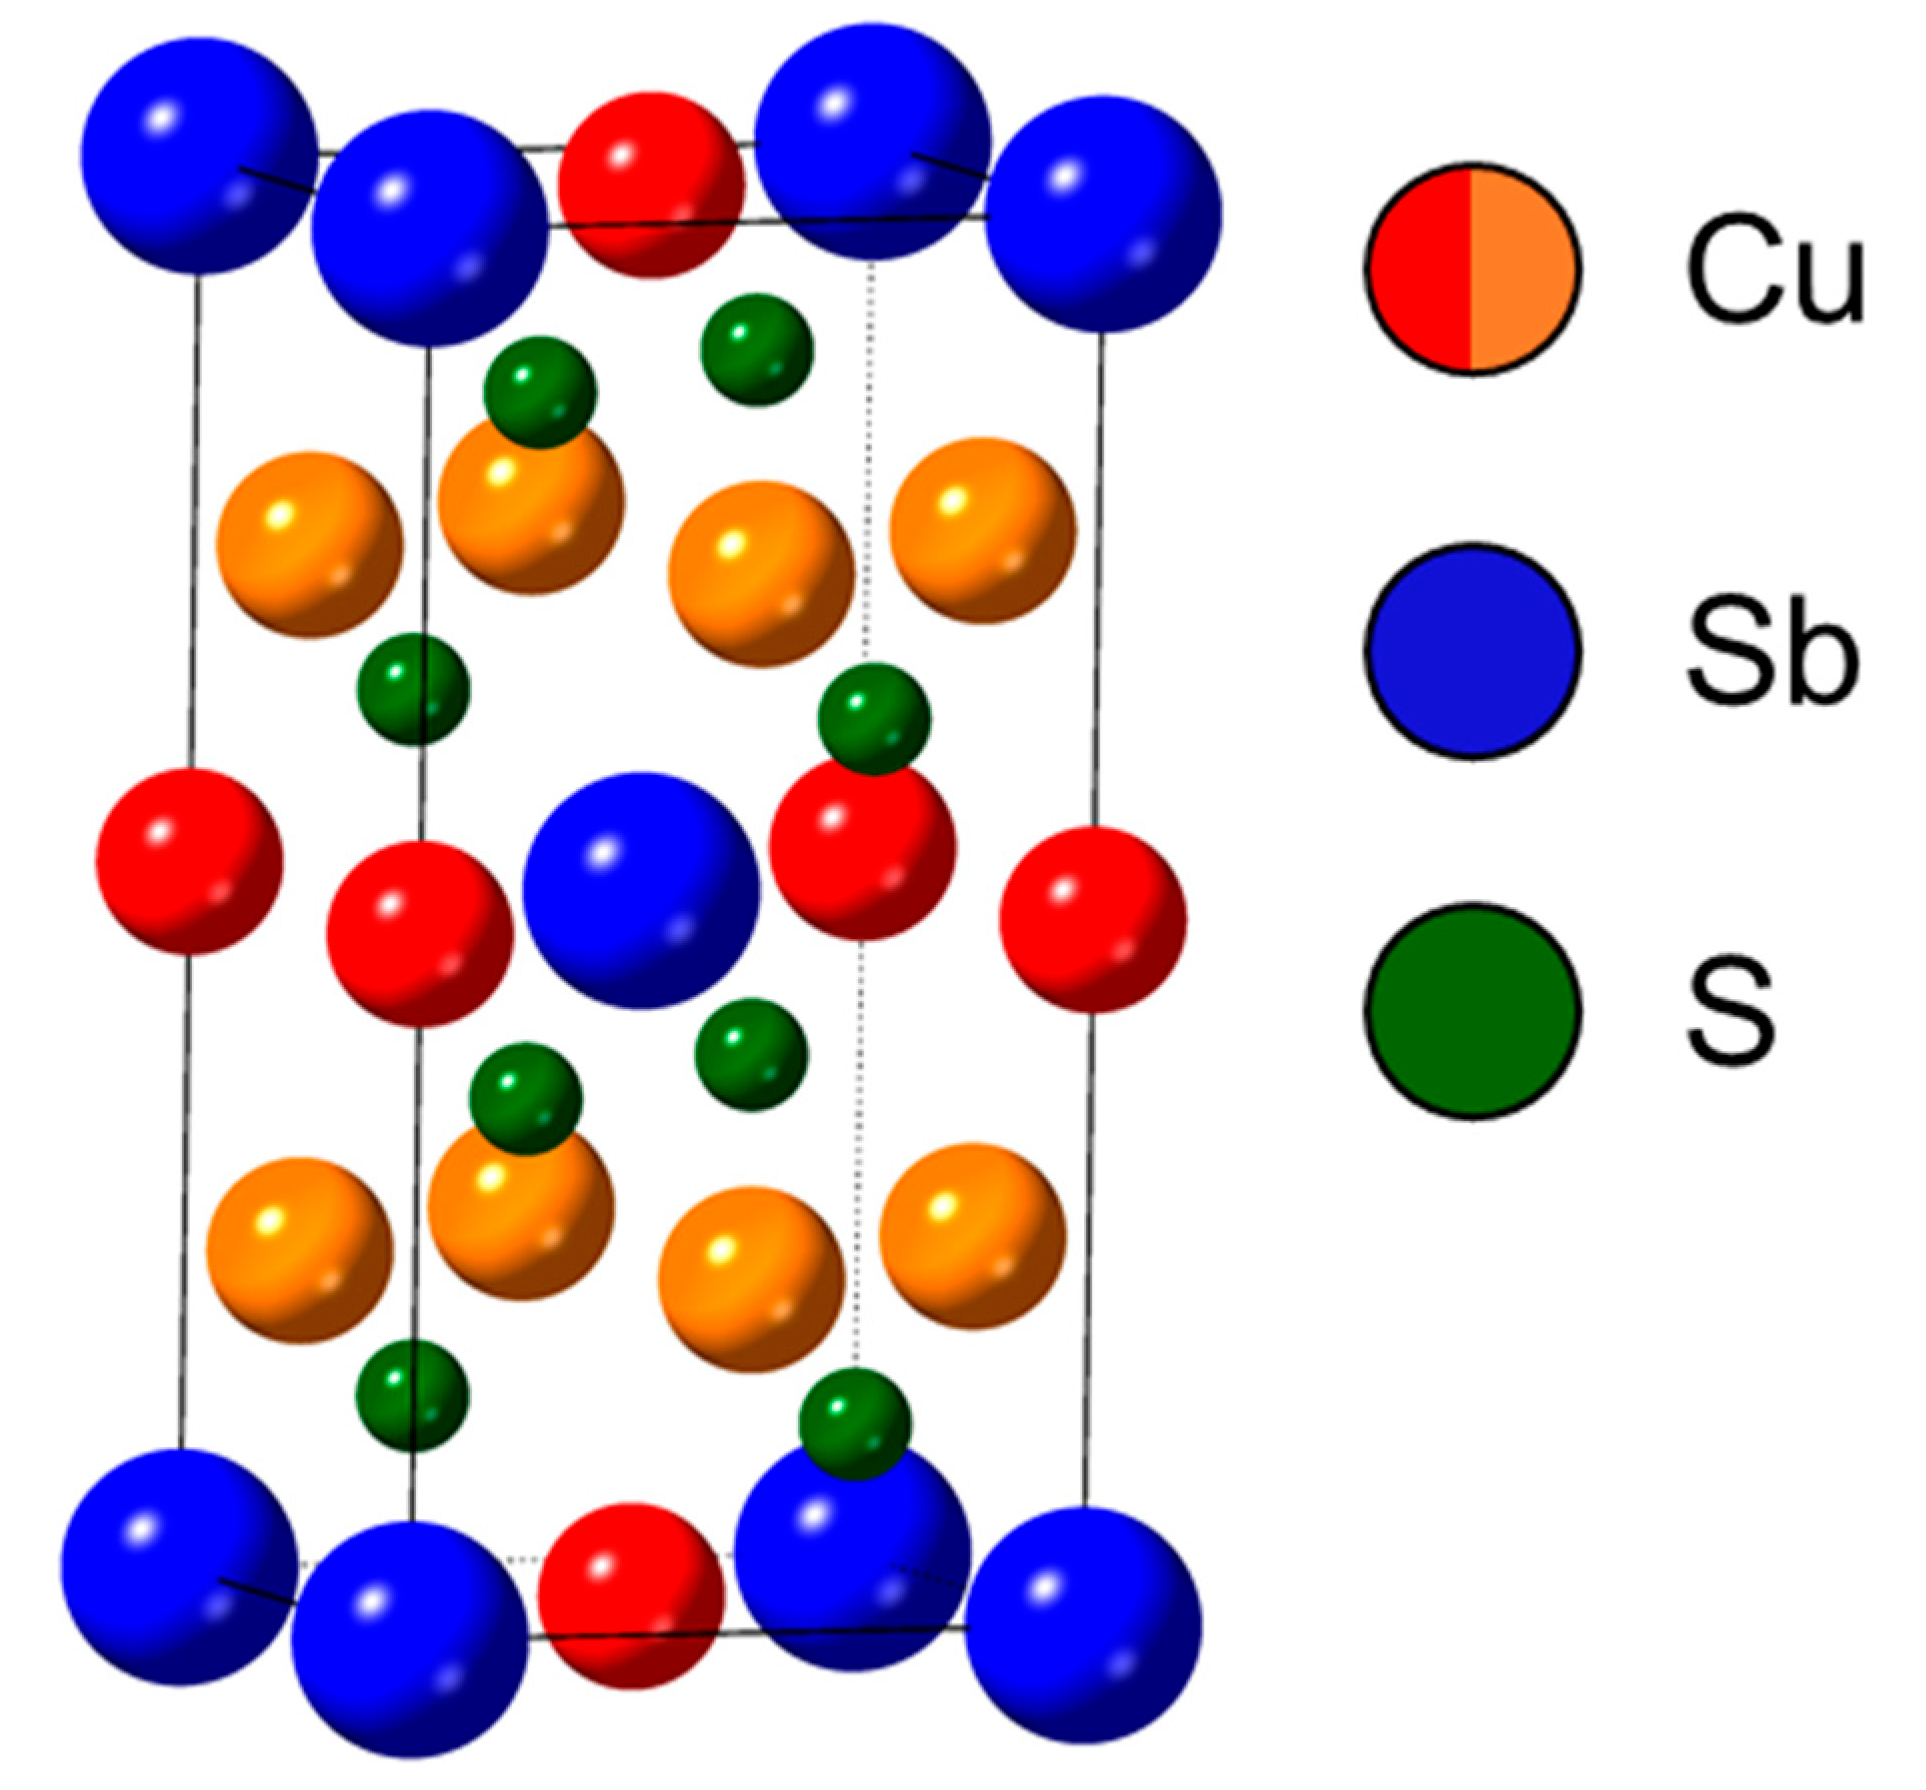
Figure 1. Unit cell of famatinite (Cu3SbS4), with the two distinct copper positions, viz., Cu-1 in red and Cu-2 in orange, respectively [27].
Electronicmat 06 00010 g001
Figure 2. Experimental powder X-ray diffraction patterns of as-synthesized famatinite (Cu2.7M0.3SbS4, M = Cu, Zn, Mn) nanoparticles with a reference pattern (PDF Card #01-071-0555) [27]. Patterns are labeled by their target composition and the three most intense peaks are indexed.
Electronicmat 06 00010 g002
Figure 3. (a,b) TEM images (with 20 nm and 50 nm scale bars) of famatinite nanoparticles with a target composition of Cu2.7Zn0.3SbS4. (c,d) SEM images (with 1μm scale bar) and (eh) EDS elemental maps associated with SEM image in (d). Scale bar of 1 μm in (d) is the same for (eh).
Electronicmat 06 00010 g003
Figure 4. (a) Differential scanning calorimetry and (b) thermogravimetric analysis data for undoped, Zn-doped, and Mn-doped famatinite (Cu2.7M0.3SbS4, M = Cu, Zn, Mn) nanoparticles.
Electronicmat 06 00010 g004
Figure 5. Temperature dependence of the (a) resistivity and (b) Seebeck coefficient for famatinite (Cu2.7M0.3SbS4, M = Cu, Zn, Mn) nanoparticles.
Electronicmat 06 00010 g005
Figure 6. Temperature dependence of the power factor ( S 2 T / ρ ) for famatinite (Cu2.7M0.3SbS4, M = Cu, Zn, Mn) nanoparticles.
Electronicmat 06 00010 g006
Table 1. Rietveld refinement data for as-synthesized famatinite nanoparticles.
Targeta (Å)c (Å)Grain Size (Å)Chi2 *
Cu3SbS45.381 (2)10.715 (5)76.1 (3)1.1688
Cu2.7Zn0.3SbS45.379 (2)10.707 (7)59.9 (3)0.9347
Cu2.7Mn0.3SbS45.383 (1)10.734 (4)67.8 (4)1.2658
Rietveld refinement performed by PDXL2 software. * Chi2 represents the goodness-of-fit of the Rietveld refinement.
Table 2. Elemental composition a of famatinite nanoparticles.
Target CompositionCuDopantSbS
Cu3SbS43.23 ± 0.05-1.05 ± 0.014.00 ± 0.06
Cu2.7Zn0.3SbS42.66 ± 0.030.284 ± 0.0050.875 ± 0.0084.00 ± 0.04
Cu2.7Mn0.3SbS42.71 ± 0.020.28 ± 0.020.98 ± 0.014.00 ± 0.04
a Elemental composition determined using EDS. All ratios normalized to S = 4.
Disclaimer/Publisher’s Note: The statements, opinions and data contained in all publications are solely those of the individual author(s) and contributor(s) and not of MDPI and/or the editor(s). MDPI and/or the editor(s) disclaim responsibility for any injury to people or property resulting from any ideas, methods, instructions or products referred to in the content.