Abstract
Most patients with non-alcoholic steatohepatitis (NASH) have insulin resistance, and there is a near-universal association between NASH and insulin resistance. Insulin resistance induces lipid accumulation in the liver, leading to the development of metabolic syndrome. However, most NASH rodent models fail to develop metabolic syndrome. LEW.1WR1 rats that are 23 weeks old showed increased body mass, epididymal fat, and liver mass, suggesting obesity-driven metabolic dysfunction. We have characterized steatosis, inflammation, Mallory–Denk body formation with hematoxylin and eosin (H&E), and fibrosis with Trichome blue staining. The presence of hepatic fibrosis with other features of NASH described above is one of the major strengths of this model since most of the currently available NASH models do not develop microvesicular steatosis or fibrosis. Together with the other important features of NASH described above, we confirm that male LEW.1WR1 rats develop NASH and insulin resistance with a standard diet.
1. Introduction
Nearly one-quarter of the U.S. population and a significant portion of the global population are affected by non-alcoholic fatty liver disease (NAFLD), with 20% of these cases advancing to non-alcoholic steatohepatitis (NASH) [1]. The incidence of NASH as a chronic liver condition has substantially increased, with projections suggesting that approximately 43 million adults in the United States will be affected by NASH-related hepatic diseases by the year 2025 [2]. Moreover, the worldwide financial expenditure for NASH treatment, recorded at 2.94 billion USD in 2019, is anticipated to escalate dramatically, reaching an estimated 54 billion USD by 2027 [3]. The increasing prevalence of obesity, insulin resistance, and diabetes has been closely linked to the widespread incidence of these liver diseases, marking a critical need for in-depth research and effective treatment strategies. Importantly, NASH signifies a heightened risk of cardiovascular diseases and type 2 diabetes, underscoring its role as a more ominous facet of NAFLD [3].
NASH is a critical and advanced stage within the NAFLD spectrum, representing a transition from simple steatosis to more severe liver damage. Lipotoxicity, resulting from increased lipid accumulation in non-adipose tissues, plays a pivotal role in this transition. It encompasses various cellular processes such as endoplasmic reticulum stress, oxygen production, lysosomal dysfunction, the abnormal activation of intracellular pathways, and hypoxia [4,5,6]. These factors cumulatively contribute to the development of NASH in both rodents and humans. NASH is characterized by inflammation, hepatocyte ballooning, and fibrosis, leading to cirrhosis [7]. Despite advancements in understanding the etiology of NASH, the pathophysiological processes, notably the transition from simple steatosis to NASH, remain largely enigmatic.
NASH progression links metabolic dysfunctions such as insulin resistance, obesity, and dyslipidemia, which exacerbate liver damage [8,9]. Central to these disorders is insulin resistance, a hallmark of metabolic syndrome intricately linked to NASH pathogenesis [10]. Insulin resistance exacerbates hepatic lipid accumulation [11], leading to steatosis [12], a precursor to NASH. Dysregulated lipid metabolism, characterized by increased free fatty acid flux and impaired lipid clearance, also contributes to hepatic fat accumulation [7]. Hyperglycemia and type 2 diabetes mellitus, commonly observed in NASH patients, further suggest a dysfunctional metabolic environment [13]. Elevated serum triglycerides and low high-density lipoprotein levels reflect dyslipidemia often accompanying NASH [14,15]. This metabolic disarray and oxidative stress from chronic inflammation and lipid peroxidation potentiate liver damage [11].
One significant challenge in NASH research has been the lack of reliable animal models that accurately reflect the human condition of NASH development. Existing models often rely on dietary modifications (high fat or high sucrose) or genetic deficiencies (Obese/Obese or Diabetic/Diabetic), which do not fully represent the spectrum of human NAFLD leading to NASH [16]. These models typically do not replicate the NASH characteristics in humans who develop the disease without associated diabetes or unrealistic diets [17,18]. This gap highlights the need for more representative animal models in studying NASH pathogenesis and therapy.
The LEW.1WR1 rat strain is a specific breed of the LEWIS rat lineage, derived through selective breeding from the LEW.1W and LEW.1A rat strains, both of which trace their origins back to the Wistar rat stock [19]. This specialized breeding aimed to create a rat model resembling human disease conditions, like type 1 diabetes mellitus (T1DM). The LEW.1WR1 strain has been genetically modified to have a composition that makes it prone to developing autoimmune diabetes spontaneously, with around 2% of the population naturally acquiring the condition. Environmental factors, like infections, further increase the likelihood of diabetes onset in these rats [20]. Their genetic makeup, including their histocompatibility complex (MHC) genes, significantly influences their susceptibility to disease, making them a valuable model for studying the processes involved in T1DM.
LEW.1WR1 rats are more prone to type 1 diabetes due to their MHC recombinant haplotype containing specific ‘u’ alleles crucial for attacking pancreatic β-cells through autoimmunity. Similar genetic susceptibility is observed in humans with T1DM in the HLA region, which makes these rats a valuable model for studying the disease. Key alleles present in regions like Iddm37, which includes the diubiquitin gene, play a critical role. This gene is essential for regulating responses and is associated with an increased risk and severity of diabetes. Additionally, the interaction between locations like Iddm14 and Iddm37 heightens the rat’s susceptibility to T1DM by increasing the production of self-reactive T cells and intensifying the autoimmune response [21].
The LEW.1WR1 rat model emerges as a crucial tool. This model, embodying the complexity of human metabolic disorders, provides invaluable insights into the interplay between hyperinsulinemia, insulin resistance, and the progression of NAFLD to its more malignant forms [22]. LEW.1WR1 rats, with their unique genetic predispositions and metabolic characteristics, mirror the human pathophysiology of NASH, offering a window into the underlying mechanisms driving this condition [20].
The LEW.1WR1 rat model is distinguished by its susceptibility to type 1 diabetes, closely associated with NASH metabolic disturbances [20]. These rats exhibit glucose intolerance, not attributed to overeating or a diet high in sucrose or fat [23]. Despite a reduction in beta cell area, they show increased body mass and epididymal fat mass in early adulthood, coupled with hyperinsulinemia and insulin resistance [23]. The connection between type 2 diabetes and NASH is underscored by the observation that metabolic dysregulation is a critical factor in the development of fatty liver disease [24]. In LEW.1WR1 rats, this link is further emphasized by genetic markers and metabolic profiles predisposing them to type 1 diabetes [25]. We believe that Ubiquitin D/FAT10 (Ubd) expression in the liver, which has been shown in other studies to be correlated with increased adiposity, insulin resistance, and inflammation, is likely a factor that is critically involved in the progression of simple steatosis to steatohepatitis, the more severe form of NAFLD [26,27].
This study introduces the LEW.1WR1 rat model as a promising candidate for studying NAFLD and NASH. LEW.1WR1 rats, alongside Wistar Furth rats (used as a control group), are descendants of the Wistar stock. While Wistar Furth rats exhibit resistance to type 1 diabetes and maintain normal insulin levels, LEW.1WR1 rats demonstrate increased circulating insulin levels, akin to what is observed in NAFLD and NASH patients. This unique physiological profile of LEW.1WR1 rats, combined with their predisposition to autoimmune disease and potentially aberrant inflammation responses, positions them as a suitable model for studying human-like NASH development. This model helps bridge the gap in knowledge regarding the progression of metabolic disorders to liver-specific pathologies. Thus, the LEW.1WR1 rat model stands as a pivotal resource in unraveling the complexities of hyperinsulinemia and its role in the malignant transformation of NAFLD, paving the way for more effective therapeutic strategies against NASH.
Therefore, we hypothesize that NASH development is significantly driven by metabolic disturbances, primarily insulin resistance and dyslipidemia, creating an environment conducive to hepatic injury and progression to steatohepatitis. Our study aims to validate this hypothesis by examining whether LEW.1WR1 rats develop NAFLD and progress to NASH. We plan to employ human-based pathological measures, including histological staining of liver sections and assessments of inflammation and fibrosis, to determine if these rats develop a human-like form of NASH.
2. Materials and Methods
2.1. Animals
Eleven male LEW.1WR1 rats arrived from Biomere (Worcester, MA, USA), and eight Wistar Furth-WF/NHsd rats arrived from Envigo (Indianapolis, IN, USA). Rats were 2–3 weeks old upon arrival. Rats were maintained with a 12 h light–dark cycle and randomized into three or four groups per cage. Rats were acclimated to the environment a week before testing began. The rats were five weeks old at the beginning of the experiments. The length of the entire study was 18 weeks. The University of Alabama in Huntsville Institutional Animal Care and Use Committee approved the experimental protocol.
2.2. Diets
During the acclimation period, the animals were given water and a standard Envigo chow diet ad libitum with access to enrichment. At five weeks old, both rat groups were put on a control diet (D12450k Research Diets, New Brunswick, NJ, USA).
2.3. Blood-Based Analysis
2.3.1. Glucose Tolerance Test
An intraperitoneal glucose tolerance test was performed on the rats at 17 weeks old to determine the metabolic response to a glucose bolus. Before the glucose tolerance test, the animals were weighed and fasted for 8 hours (h). A baseline blood glucose measurement was taken via tail prick before the rats were intraperitoneally injected with a glucose solution (2 g/kg body mass). The glucose solution was composed of 50% (weight) glucose (MP Biomedical) and phosphate-buffered saline (PBS) (Thermo Fisher Scientific, Waltham, MA, USA) and sterile-filtered before use. Subsequently, blood glucose was measured via tail prick in 30 min intervals for 120 min. All blood glucose measurements were made using a Zoetis AlphaTrak 2 glucometer.
2.3.2. Terminal Serum and Plasma Collection
Before terminal harvest, at 23 weeks old, a blood sample obtained via tail prick was collected in an ethylenediaminetetraacetic acid (EDTA) blood collection tube. This blood was spun down in a centrifuge for 15 min at 3500× g, and plasma was collected. Per Eve Technologies’ instructions, 1 microliter (μL) of Calbiochem Serine Protease Inhibitor Cocktail Set I (Cat: 565000-1VL, EMD Millipore, Burlington, MA, USA) and 1 μL of Dipeptidyl Peptidase IV (CD26), Porcine Kidney (DDP-IV) Inhibitor (317640-250MIU, EMD Millipore, Burlington, MA, USA) were added to 100 μL of plasma. Then, 50 μL of the mixture was aliquoted and placed in an Eppendorf® Safe-Lock tube. Samples were kept at −80 °C before shipping to Eve Technologies. The data are representative of the Rat Millipore MILLIPLEX Metabolic 11-Plex Array. Each data point represents a duplicate measurement.
The rats were anesthetized and exsanguinated via cardiac puncture under isoflurane anesthesia. A portion of blood collected during exsanguination via cardiac puncture was collected in a syringe and transferred to a conical tube, where it sat for 15 min to coagulate. Samples were centrifuged at 3500× g at 4 °C. The clear supernatant, serum, was collected. A second portion of blood from the syringes was transferred to a heparinized blood collection tube, RAM Scientific Safe-T-Fill, MFR# 077053, microcapillary blood collection 300μL, prepared with dipotassium EDTA. It was spun down in microcentrifuge tubes for plasma collection. Samples were centrifuged at 3500× g at 4 °C.
Then, 100 μL of serum was mixed with 100 μL of PBS into 1.5 mL Eppendorf tube, and 80 μL of the mixture was placed in an Eppendorf® Safe-Lock microcentrifuge tubes frozen, stored at −80 °C, and sent to Eve Technologies for Chemokine Array analysis. The data represented the Eve Technologies Rat Chemokine Array 27-Plex Discovery Assay® Array (RD27) in duplicate measures for each rat.
2.3.3. Homeostatic Model Assessment for Insulin Resistance (HOMA-IR)
Before terminal harvest, blood glucose measurements were taken via tail prick using the AlphaTrak2 glucometer. Blood glucose and Insulin values obtained from the metabolic array were converted to mmol/L and mIU/L, respectively, for use in the HOMA-IR calculation. Using those blood glucose values and the plasma insulin values, HOMA-IR values could be calculated for each animal, as described by Matthews, et al. [28], using Equation (1):
2.3.4. Extraction of Serum Metabolites for 1H-Nuclear Magnetic Resonance (NMR) Analysis
Frozen serum samples were thawed for approximately 1 h at 4 °C. For extraction normalization purposes, the serum samples (200 μL) were spiked with 100 μL thymine (6 millimolar (mM)). Metabolites were extracted using a methanol/chloroform extraction method [29]. Briefly, methanol (300 μL, −20 °C) and chloroform (300 μL, −20 °C) were added to each serum sample to precipitate proteins and separate lipids. The samples were vortexed for 30 seconds (s) and allowed to sit on ice for 10 min. The samples were then centrifuged at 13,800× g and 4 °C for 30 min. The upper (methanol) phase was removed in 100 μL aliquots, which were combined for a total volume of ~500 μL of extract from each sample. The methanol was removed by evaporation for approximately 2 h at 50 °C. The dried samples were stored at −20 °C until use.
2.3.5. 1H-NMR Analysis of Serum Metabolite Extracts
The dried serum metabolite extracts were reconstituted in 300 μL NMR solution, containing a 4:1 mixture of potassium phosphate buffer in H2O (100 mM, pH 7) and 4,4-dimethyl-4-silapentane-1-ammonium trifluoroacetate (DSA) in 70% Deuterium oxide (D2O). DSA was chosen as the internal standard for quantitation, because its amine group prevents interactions of the reference standard with cationic peptides, making it ideal for biological samples with a high protein content [30]. The reconstituted serum samples were transferred to 3-millimeter (mm) NMR tubes using an extended-tip glass pipette to reduce adhesion. Serum NMR spectra were acquired on a Bruker Avance NEO instrument with an 1H frequency of 500 MHz using a Prodigy X-optimized 5 mm probe at 25 °C. A noesygppr1d pulse experiment from the standard Bruker library was performed for the suppression of the H2O signal (δ 4.76 parts per million (ppm)). The spectra were obtained over 256 scans, with an acquisition time of 2.0 s, a spectral width of 16.38 ppm, and a relaxation delay of 10 s, resulting in 85,714 data points.
2.3.6. Quantitation of Serum Metabolites
Post-acquisition processing of 1H-NMR spectra was performed using MNova (version 15.0.0-34764, Mestrelab Research). All spectral processing and metabolite quantitation were performed as described by Wolfsberger, et al. [31], with minor modifications. Briefly, drift correction (5%) and exponential apodization (LB = 0.3 Hz) were applied after Fourier transformation into 65,536 data points. The trimethylsilyl (TMS) singlet of DSA was referenced to 0.00 ppm and was normalized to an intensity of 100 arbitrary units (a.u). Manual phasing was performed by a single researcher to minimize differences in phase correction between spectra. The baseline was corrected using a fifth-order Bernstein polynomial function. Characteristic peaks were identified for each metabolite, and peak positions (Supplementary Table S1) were confirmed in spiking studies. Peaks were selected using the multiplet analysis tool, and each multiplet with a signal-to-noise ratio (S/N) > 10 was integrated using the edited sum method and quantified using the TMS signal of DSA (1 mM) as an internal standard. The concentration was determined using the qNMR concentration function. Metabolite concentrations were corrected for extraction efficiency using the thymine internal standard, using Equation (2):
where C represents the concentration in millimolar.
2.4. Liver Analysis
Immediately after exsanguination, the liver was dissected out of the abdominal cavity and weighed. The left medial lobe was dissected, placed in a cassette, and placed in neutral buffered formalin (10%) (Fisher Scientific, Pittsburgh, PA, USA) for 24 h for fixing. The right medial lobe of the liver was dissected, placed in a tared centrifuge tube, weighed, flash-frozen, and stored at −80 °C until processed for triglyceride assay, western blotting, and quantitative polymerase chain reaction (qPCR).
2.4.1. Triglyceride Assay
Cayman Chemical Triglyceride Colorimetric Assay Kit was used to measure liver triglyceride levels. Liver tissue samples (350 mg) were minced using SuperFastPrep-2 using MP Biomedicals Matrix D Beads at the 6 setting for 40 s. The samples were homogenized with Nonidet P-40 for 1 min, three times in 5 min intervals (40 G), and samples were kept on ice between the process. The duplicates of each sample were used to determine triglyceride concentration. The assay was performed following the manufacturer’s protocol. The 530–550 nm absorbance was measured using a plate reader (M2 Molecular Devices).
2.4.2. Liver Histology
After fixation, the organ was placed in 70% ethanol (Thermo Fisher Scientific, Waltham, MA, USA) and mailed to Histowiz (Brooklyn, New York, NY, USA). Histowiz paraffin-embedded, sectioned (4 micrometers (μm)), and stained the slides with Hematoxylin and Eosin (H&E) and Trichome blue stain.
2.4.3. Histological Analysis
Scoring systems are outlined in Table 1. Steatosis, microvesicular steatosis, inflammatory foci, Mallory–Denk body formation, and fibrosis were scored following the protocols of Kleiner et al. [32] at 40× magnification. Steatosis grade was evaluated on all H&E-stained sections and scored from 0 to 3. The presence of microvesicular steatosis was evaluated in five randomly chosen rectangular areas of 0.3 mm2 at fields of 40× magnification in areas with steatosis and scored from 0 to 1. Lobular inflammation was evaluated by counting the number of inflammatory foci (the observation of at least three inflammatory cells in close proximity) per lobule in five randomly chosen lobules and was graded from 0 to 3. Mallory–Denk body formation was scored as 0: not present, and 1: present. Lastly, fibrosis was evaluated on entire sections stained by Trichome blue and scored from 0 to 4. The fibrosis area was measured using QuPath, and the fibrosis area was normalized to the total liver area.

Table 1.
Histological scoring systems for characterizing NAFLD in the livers of the LEW.1WR1 rats and Wistar Furth rats [32].
2.4.4. QuPath Analysis
QuPath 0.4.1 [33] was used for fibrosis analysis. Each region was selected separately and assigned for specific staining. The desired stain section and background were selected using the box drawing feature. The stain vector estimate decreased the blending of the two stains for more accurate separation. The stain area was determined by creating a threshold and allowing the filter to differentiate stains. Data were added to a thresholder box, which narrowed down the area of stains. The stain of interest was highlighted, and the total area was available under annotations.
2.4.5. Western Blot
For western blot analysis, the liver tissues were homogenized using a SuperFastPrep-2 using MP Biomedicals Matrix D Beads at the 6 setting for 40 s in radioimmunoprecipitation assay (RIPA) lysis buffer (1 molar (M)) sodium chloride, 1% Nonidet P-40, 0.5% sodium deoxycholate, 0.1% sodium dodecyl sulfate (SDS), 50 mM Tris (pH 7.4), 2 mM sodium pyrophosphate, 1 mM ethylenediaminetetraacetic acid (EDTA) with a protease inhibitor tablet (Thermo Fisher Scientific #A32955, Waltham, MA, USA), and phosphatase inhibitor cocktail II (Thermo Fisher Scientific, Alfa Aesar #J61022.AA, Waltham, MA, USA). Then, the samples were centrifuged (13,800× g, 4 °C), and the supernatant was collected in microcentrifuge tubes. The protein concentration was determined by the Lowry assay method. Equal amounts of protein samples (100 μg) were loaded into 10% polyacrylamide SDS gel lanes. The gels were electrophoresed, and the protein was transferred to a polyvinylidene fluoride or nitrocellulose membrane. Tris-buffered saline (TBS) + 1% casein was used to block for 1 h 5 mL of 5% bovine serum albumin (BSA) in tris-buffered saline with tween (TBST), and 5 μL of each primary antibody was used (1:1000) to dilute primary antibodies. The membranes were incubated overnight at 4 °C. The membrane was incubated with primary antibodies vascular endothelial growth factor receptor 2 (Vegfr-2, Cell Signaling #12599) and ꞵ-actin (Cell Signaling #3700). StarBright™ Blue Goat anti-mouse 520 and StarBright™ Blue Goat anti-rabbit 700 secondary antibodies from Bio-Rad Laboratories, Hercules, CA, USA, depending on the source of the primary antibody, were used at 1:5000 dilution. StarBright™ secondary antibody was diluted with TBS with 1% casein and 0.02% of SDS (1:5000). Chemiluminescence western blots followed a similar protocol, except the RIPA buffer did not contain Nonidet P-40 and sodium deoxycholate, and 80 μg of protein was loaded into the SDS Page gels. Primary antibodies (1:1000) were acetyl-CoA carboxylase (ACC, Cell Signaling #3676) and cleaved caspase-3 (Cell Signaling #9661). The secondary antibody was Anti-rabbit IgG and HRP-linked Antibody (1:5000) (Cell Signaling #7074), and Clarity Max ECL Substrate (Bio-Rad #1705062S) was used to visualize the blots on a ChemiDoc MP (Bio-Rad Laboratories, Hercules, CA, USA). The density analysis was quantified with Bio-Rad Image Lab software Version 6.1.0 build 7, and protein expression was normalized to the control protein ꞵ-actin.
2.4.6. qPCR
50 milligrams (mg) of liver sample was pulverized in liquid nitrogen prior to being placed in 1 mL of Trizol reagent and homogenized with SuperFastPrep-2 using MP Biomedicals Matrix D Beads at the 6 setting for 40 s. Messenger ribonucleic acid (mRNA) was extracted following the Trizol manufacturer’s instructions with the following modifications. After adding 75% ethanol, the samples were vortexed briefly and centrifuged for 5 min at 10,000× g and 4 °C. The pellet was resuspended in 25 µL of RNase-free water and incubated at 55–60 °C for 10 min. Then, the samples were placed on the ice for 15 s.
mRNA was quantified using NanoDrop™ One/OneC Microvolume UV-Vis Spectrophotometer (Thermo Fisher Scientific, Waltham, MA, USA) OD 260/280. mRNA was converted into complementary desoxyribonucleic acid (DNA) using the High-Capacity cDNA Reverse Transcriptase Kit (Applied Biosystems, Waltham, MA, USA). We followed the manufacturer’s instructions for cDNA conversion. The PowerUp Sybr Green Master Mix (Applied BioSystems, Waltham, MA, USA) was used in qPCR reactions.
The delta-delta Ct method was used to calculate the relative gene expression of samples. The data are reported as a fold change. The housekeeping gene Ribosomal protein L32 (Rpl32) was used as a reference to compare relative gene expression in the liver. The primers (Appendix A) were designed using Primer Blast and assembled by Invitrogen.
2.5. Abdominal and Visceral Fat Analysis
During the harvest, surgical scissors were used to dissect all the visible abdominal fat from the peritoneal cavity, including the mesentery and the fat from around the organs of each rat. The fat was placed in a tared weigh boat and recorded in grams.
2.6. Statistical Analysis
Statistical analyses were performed using GraphPad Prism version 9.4 software. The Kolmogorov–Smirnov and Shapiro–Wilk tests were used to test the normality of the sample population. For data with a normal distribution, an unpaired Student’s t-test was used to compare the two rat groups. For data without a normal distribution, the nonparametric two-tailed unpaired Mann–Whitney test was used to compare the rat groups. Differences were determined to be significant if p < 0.05. For 1H-NMR data, outliers were identified and removed using the ROUT method (Q = 1%), and statistical significance (p < 0.05) was determined using an unpaired t-test with Welch’s correction.
The letters above the columns indicate that the groups are statistically different. All data were expressed as means +/− standard deviation (SD), and n values reflect biological replicates and are listed as (Wistar Furth rats, LEW.1WR1 rats).
3. Results
3.1. LEW.1WR1 Rats Have Increased Fat Storage
LEW.1WR1 rats had a significantly increased terminal body mass compared to Wistar Furth rats (Figure 1A). Rodents typically store fat in the abdominal, visceral, and epididymal areas [34]. The LEW.1WR1 rats had significantly increased abdominal and visceral fat mass and epididymal fat mass compared to Wistar Furth rats (Figure 1B,C). LEW.1WR1 rats had a higher percentage of total abdominal fat than Wistar Furth rats (Figure 1D). Considering the increased terminal body mass, this indicates the LEW.1WR1 rats were overweight and may be storing fat in other areas of the body. LEW.1WR1 rats had significantly increased liver mass, percentage liver mass relative to total body mass, and liver triglycerides compared to Wistar Furth rats (Figure 1E–G). These results suggest that the LEW.1WR1 rats may be storing fat in their livers and have ectopic lipid deposition, where excess fat is stored in vital organs [35].
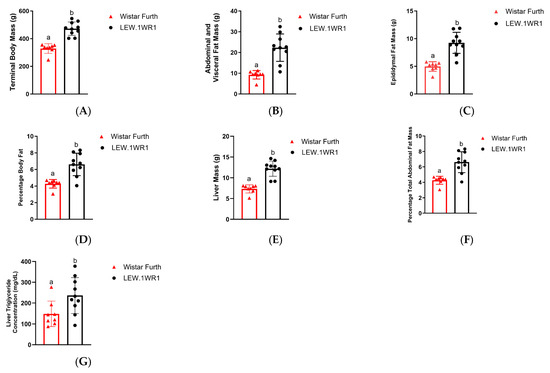
Figure 1.
LEW.1WR1 rats have increased fat storage. (A) LEW.1WR1 rats had increased terminal body mass (p < 0.0001, n = 8, 10), (B) abdominal and visceral fat mass (p < 0.0001, n = 8, 10), (C) epididymal fat mass (p < 0.0001, n = 8, 10), (D) percentage total abdominal mass relative to terminal body mass (p = 0.0003, n = 8, 10), (E) liver mass (p < 0.000, n = 8, 10), (F) percentage liver mass relative to terminal body mass (p = 0.0009, n = 8, 10), and (G) liver triglycerides (p = 0.0270, n = 8, 10). Different letters above the columns indicate the groups are statistically different. All data are expressed as means +/− SD. n values reflect biological replicates and are listed as (Wistar Furth rats, LEW.1WR1 rats).
3.2. LEW.1WR1 Rats Have Impaired Metabolism
Increased mass may indicate impaired metabolic function. To measure metabolic function in the rat groups, we measured metabolic hormones and blood metabolites, and assessed glucose tolerance. At 17 weeks old, the LEW.1WR1 rats and the Wistar Furth rats had no significant difference in glucose tolerance (Figure 2A,B). However, the LEW.1WR1 rats and the Wistar Furth rats showed impaired glucose tolerance. Furthermore, blood glucose was not significantly different between the two groups at 23 weeks old (Figure 2C), indicating that hyperglycemia did not cause increased fat storage in the LEW.1WR1 rats. The 23-week-old LEW.1WR1 rats had significantly increased plasma concentrations of insulin (Figure 2D).
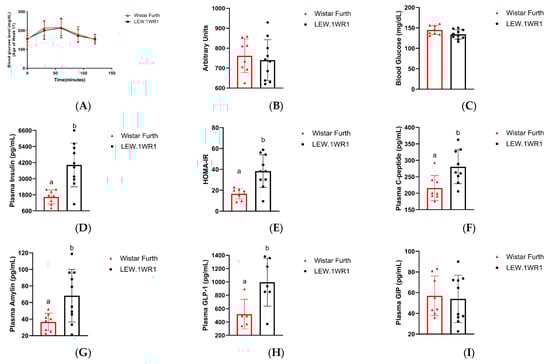
Figure 2.
LEW.1WR1 rats have impaired metabolism. The 17-week-old LEW.1WR1 rats did not show alterations to glucose metabolism in a (A) glucose tolerance test and the associated (B) area under the curve (n.s., n = 8, 10). The 23-week-old LEW.1WR1 rats did not show significantly different (C) blood glucose levels compared to Wistar Furth rats. LEW.1WR1 rats did show an increased plasma concentration of (D) insulin (p = 0.0011, n = 8, 10) and elevated (E) HOMA-IR values (p = 0.00017, n = 8, 10). LEW.1WR1 rats also had elevated plasma concentrations of (F) C-peptide (p = 0.0100, n = 8, 9), (G) amylin (p = 0.0128, n = 8, 10), and (H) Glucagon-like peptide-1 (GLP-1, p = 0.0172, n = 5, 7), but did not have altered concentrations of (I) Glucose-dependent insulinotropic polypeptide (GIP, n.s., n = 8, 10). n values reflect biological replicates and are listed as (Wistar Furth rats, LEW.1WR1 rats). Different letters above the columns indicate the groups are statistically different. All data are expressed as mean +/− SD.
To determine if the LEW.1WR1 rats developed insulin resistance, we used HOMA-IR to give a quantitative estimate of insulin resistance in rats. HOMA-IR uses the fasting glucose concentration and insulin levels to give an index of the insulin response to glucose. The HOMA-IR value for the LEW.1WR1 rats was 38.3 ± 15, which was significantly greater than the HOMA-IR value for the Wistar Furth rats (16.7 ± 4.8) (Figure 2E). Since blood glucose was not significantly different between the two rat groups, hyperglycemia was not the cause of the elevated HOMA-IR values in LEW.1WR1 rats. Thus, the elevated insulin and HOMA-IR values indicate that the LEW.1WR1 rats were insulin-resistant.
LEW.1WR1 rats had increased plasma levels of C-peptide and amylin (Figure 2F,G). Since C-peptide and amylin are co-secreted with insulin, these results indicate that the LEW.1WR1 rats have increased insulin secretion. Plasma metabolic hormones associated with hunger and satiety were not significantly different between the rat groups, except for leptin, which was significantly increased in the LEW.1WR1 rats (Supplementary Figure S1). Additionally, the concentration of glucagon-like peptide (GLP)-1 was increased in LEW.1WR1 rats, while the concentration of glucose-dependent insulinotropic polypeptide (GIP) was not significantly different between the two rat groups (Figure 2H,I). These incretin hormones regulate insulin and glucagon secretion in response to blood glucose, and the increased levels of GLP-1, along with the unchanged concentration of GIP, indicate increased insulin secretion and decreased glucagon secretion in LEW.1WR1 rats. Taken together, these results indicate that the LEW.1WR1 rats had increased insulin secretion and developed insulin resistance but did not have alterations to glucose metabolism. Our targeted 1H-NMR metabolomics analysis corroborates these results.
An analysis of target metabolites was performed using 1H-NMR to quantify metabolite concentrations in the serum of the LEW.1WR1 rats and Wistar Furth rats obtained upon terminal harvest (see Table 2). Several metabolites were present in altered concentrations in the LEW.1WR1 rat models, although the difference was not statistically significant. For example, the LEW.1WR1 rats had altered serum levels of several intermediates of the citric acid cycle. The serum concentration of α-ketoglutarate was slightly elevated in the LEW.1WR1 rats (p = 0.0734), while the concentration of oxaloacetate was slightly decreased (p = 0.0679). These results may indicate that the LEW.1WR1 rats exhibit increased oxidative stress and impaired mitochondrial function. The serum concentration of tyrosine was slightly elevated in the LEW.1WR1 rat (p = 0.0521), indicating alterations in amino acid metabolism. Finally, the concentration of glycerol was slightly increased in the LEW.1WR1 rats (p = 0.0895). Together with the results of the triglyceride assay (Figure 1G), the elevated serum levels of glycerol may indicate alterations in the synthesis and secretion of triglycerides in the liver of LEW.1WR1 rats.
Table 2.
Targeted 1H-NMR metabolomic analysis of rat serum.
No other metabolites showed differences between the rat groups that approached statistical significance. The lack of statistical significance may be a result of the large variance between biological replicates, particularly for the Wistar Furth rats. For nearly 65% of the metabolites tested, the Wistar Furth group had a larger relative standard deviation than the LEW.1WR1 group. This larger variance was, in many cases, due to a multimodal distribution of metabolite concentrations, which was particularly pronounced for α-ketoglutarate, 3-hydroxybutyrate, acetoacetate, acylcarnitine, and choline. Taken together, these results suggest that the LEW.1WR1 rat does not have alterations in glucose metabolism and changes in lipid metabolism and mitochondrial dysfunction may drive the development of fatty liver disease.
3.3. LEW.1WR1 Rats Develop Fatty Liver Disease
LEW.1WR1 rats had significantly higher steatosis scores than Wistar Furth rats (Figure 3C), and both rats had the presence of microvesicular steatosis (Figure 3F). The higher liver triglycerides (Figure 1G) and increased lipid droplet gene perilipin 2 (Plin2) (Figure 3G) in LEW.1WR1 rats support the presence of steatosis and microvesicular steatosis in the liver. There are limitations to steatosis scoring and visualization. Steatosis scoring is more qualitative than quantitative; each score has a wide range, which may explain why two LEW.1WR1 rats are within the median of the steatosis scores for the Wistar Furth rats. Cell wall distortion also made it more difficult to identify characteristics of steatosis, and fat deposits may have hidden the features of inflammatory foci in representative images. LEW.1WR1 rats have a trend of decreased peroxisome proliferator activated receptor alpha (Ppar-α, p = 0.0521), indicating LEW.1WR1 rats may have decreased fatty acid oxidation compared to Wistar Furth rats. LEW.1WR1 rats have significantly increased de novo lipogenesis genes acetyl-coA carboxylase 1 (Acc1) and fatty acid synthase (Fasn), with a possible trend in stearoyl-coA desaturase (Scd-1), which, along with increased Plin2, indicate that LEW.1WR1 rats have increased de novo lipogenesis and lipid droplet production compared to Wistar Furth rats. The western blot analysis for acetyl-CoA carboxylase (ACC) shows no significant difference between the LEW.1WR1 rats and Wistar Furth rats (Figure 3J). Still, there was a trend of increased ACC expression levels in the LEW.1WR1 rats (Figure 3K). These results support increased steatosis and de novo lipogenesis in LEW.1WR1 rats.
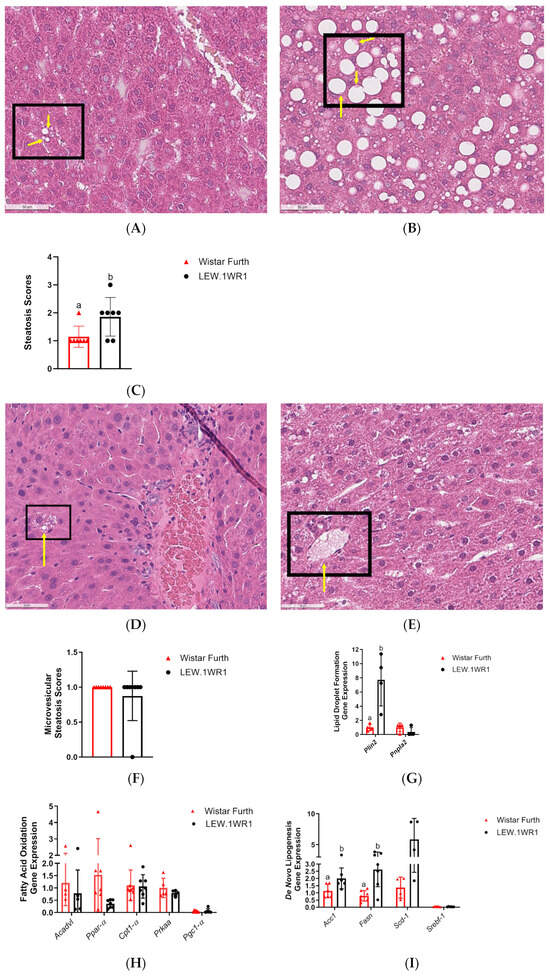
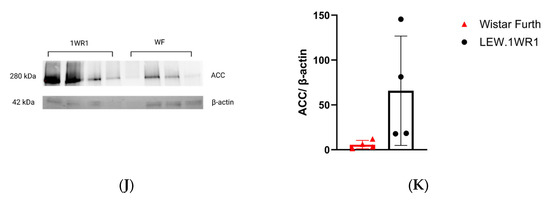
Figure 3.
LEW.1WR1 rats develop fatty liver disease. (A) Representative image (40× magnification) of liver steatosis in a Wistar Furth rat (scale: 50 µm). (B) Representative image (40× magnification) of liver steatosis in a LEW.1WR1 rat (scale: 50 µm). The boxes show steatosis, and the arrows indicate the nuclei that have been displaced in the cells. (C) LEW.1WR1 rats had significantly more steatosis than Wistar Furth rats (p = 0.0334, n = 7, 7). (D) Representative image (40× magnification) of microvesicular steatosis in a Wistar Furth rat (scale: 50 µm). (E) Representative image (40× magnification) of microvesicular steatosis in a LEW.1WR1 rat (scale: 50 µm). The boxes and arrows show microvesicular steatosis. (F) Wistar Furth rats and LEW.1WR1 rats both had microvesicular steatosis (n = 8, 8), and (G) LEW.1WR1 rats had significantly increased lipid droplet perilipin 2 (Plin2) gene expression (p = 0.0286, n = 4, 4), and a trend of increased patatin-like phospholipase domain-containing protein 2 (Pnpl2, n = 4, 4), which are characteristic of NAFLD. (H) LEW.1WR1 rats show a trend of decreased fatty acid oxidation gene expression: acyl-coA dehydrogenase very long chain (Acadvl, n = 4, 5), peroxisome proliferator activated receptor alpha (Ppar-α, n = 8,7), carnitine palmitoyltransferase 1A (Cpt1-α, n = 7, 7), Protein Kinase AMP-Activated Catalytic Subunit Alpha (Prkaa, n = 5, 5), and peroxisome proliferator-activated receptor gamma, coactivator 1 alpha (Pgc1-α, n = 7, 5). (I) LEW.1WR1 rats have increased de novo lipogenesis gene expression: acetyl-coA carboxylase 1 (Acc1, p = 0.0361, n = 6, 6), fatty acid synthase (Fasn, p = 0.0058, n = 7, 7), stearoyl-coA desaturase (Scd-1, n = 4, 4), and sterol regulatory element binding transcription factor 1 (Srebf-1, n = 5, 6). (J) Acetyl-CoA Carboxylase (ACC) protein expression in the liver. (K) Liver protein expression of ACC normalized β-actin expression (n = 4, 4). Different letters above the columns indicate the groups are statistically different. All data were expressed as means +/− SD.
3.4. LEW.1WR1 Rats Have Increased Inflammation
As NAFLD progresses from simple steatosis to NASH and, eventually, to more severe forms of NASH accompanied by liver fibrosis initiated by factors like lipid accumulation, lipotoxicity, and oxidative stress, the immune system becomes increasingly involved [36,37]. Markers of inflammatory response are detected in serum samples at this stage. When serum samples from both LEW.1WR1 rats and Wistar Furth rats were assessed, there was an upregulation of pro-inflammatory cytokines such as tumor necrosis factor-alpha (TNF-α) (Figure 4A) and interferon-gamma (INF-γ) (Figure 4B) in LEW.1WR1 rats compared to the Wistar Furth rats. These cytokines are crucial in mediating inflammatory responses and may contribute to forming inflammatory foci in the liver, characterized by clusters of immune cells that infiltrate the liver tissue (Figure 4D,E). Although the inflammatory foci scores panel showed the presence of inflammatory foci in both strains (Figure 4F), inflammatory genes were highly expressed in LEW.1WR1 rats compared to the Wistar Furth rats except for liver X receptor-alpha (Lxr-α), which was significantly decreased in LEW.1WR1 rats (Figure 4G). Additionally, an increase in monocyte chemoattractant protein (MCP) was observed, further recruiting inflammatory cells to these foci and intensifying the inflammation (Figure 4C). Moreover, the upregulation of vascular endothelial growth factor (VEGF) in LEW.1WR1 rats (Figure 4H) suggests alterations in hepatic vascular dynamics, which may exacerbate the pathological state of steatosis. The outcome of the western blot analysis for cleaved caspase-3 (CC3), a hallmark protein indicative of apoptosis, indicates the presence of this apoptotic marker in both LEW.1WR1 and Wistar Furth rats (Figure 4I). A trend towards elevated expression levels of CC3 was observed in the Wistar Furth rats (Figure 4J).
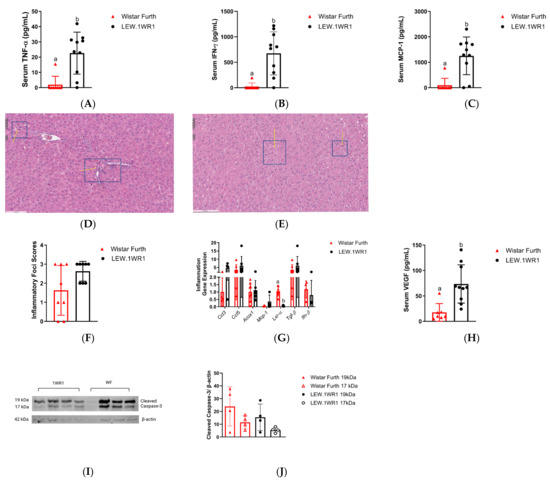
Figure 4.
LEW.1WR1 rats have increased inflammation. LEW.1WR1 rats had increased serum levels of (A) Tumor necrosis factor alpha (TNF-α, p = 0.0011, n = 8, 10), (B) Interferon-gamma (IFN-γ, p = 0.007, n = 8, 10), and (C) Monocyte Chemoattractant Protein-1 (MCP-1, p = 0.0007, n = 8, 10). Representative images of (D) inflammatory foci in H&E-stained sections of LEW.1WR1 rat livers and (E) inflammatory foci in H&E-stained sections of Wistar Furth rat livers. Inflammatory foci are shown with arrows pointing to clusters of inflammatory cells; insets show 20× magnification. However, (F) inflammatory foci scores (n = 8, 8) were not significantly different between LEW.1WR1 rats and Wistar Furth rats, but the strains differed in the (G) expression of inflammation-related gene liver X receptor-alpha (Lxr-α, p < 0.0002, n = 7, 7), but not c-c motif chemokine ligand 3 (Ccl3, n = 4, 4), c-c motif chemokine ligand 5 (Ccl5, n = 7, 7), acyl-coA oxidase 1 (Acox1, n = 8, 7), monocyte chemoattractant protein-1 (Mcp-1, n = 4, 7), transforming growth factor beta 1 (Tgf-β, n = 7, 7), or interferon beta-1a (Ifn-β, n = 4, 4). (H) LEW.1WR1 rats had significantly more serum VEGF than Wistar Furth rats (p = 0.0007, n = 7, 10). (I) Cleaved caspase-3 protein expression in the liver. (J) Liver protein expression of cleaved caspase-3 normalized β-actin expression (n = 4, 4). Different letters above the columns indicate the groups are statistically different. All data were expressed as means +/− SD.
3.5. LEW.1WR1 Rats Have Increased Markers of Liver Damage
In the progression of liver inflammation, a series of complex biochemical changes occurs, signaling a transition towards a more severe hepatic pathology. One of the notable histological markers in this process is the increased presence of Mallory–Denk bodies, indicative of hepatocellular damage and a stressed cellular environment. Mallory–Denk bodies appear as irregularly shaped, eosinophilic aggregates located within the cytoplasm of hepatocytes, as indicated by the white arrow, and are identified using H&E staining (Figure 5A,B) [38]. LEW.1WR1 rats showed more Mallory–Denk bodies than Wistar Furth rats (Figure 5A,B); this could be seen in the Mallory–Denk body score (Figure 5C).
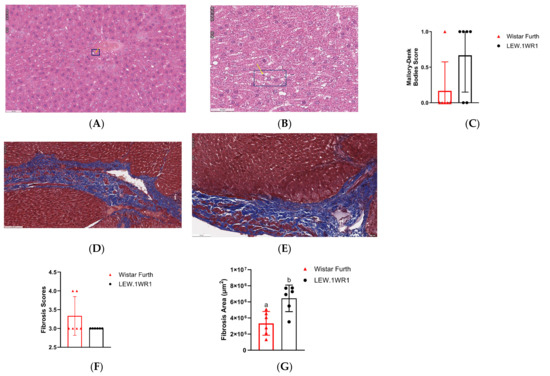
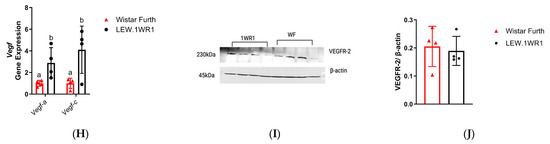
Figure 5.
LEW.1WR1 rats have increased markers of liver damage. H&E-stained sections of the liver show Mallory–Denk bodies as pinkish inclusions in samples from (A) Wistar Furth rats and (B) LEW.1WR1 rats, respectively. The boxes and arrows show Mallory-Denk bodies. (C) Mallory–Denk body scores (n = 6, 6). Trichrome-stained sections in the liver of (D) Wistar Furth rats and (E) LEW.1WR1 rats showing fibrosis severity as blue collagen. (F) Fibrosis score (p = 0.0152, n = 6, 6). (G) Fibrosis area under the curve (p = 0.0152, n = 6, 6). (H) vascular endothelial growth factor A (Vegf-a, p = 0.0286, n = 4, 4) and vascular endothelial growth factor C (Vegf-c, n = 4, 4) gene expression in the liver. (I) Vascular endothelial growth factor receptor 2 (VEGFR-2) protein expression in the liver. (J) Liver VEGFR-2 protein expression normalized to β-actin expression (n = 4, 4). Different letters above the columns indicate the groups are statistically different. All data were expressed as means +/−SD.
Accompanying this is an escalation in the fibrosis score (Figure 5F), a quantifiable measure reflecting the extent of fibrotic tissue deposition in the liver, which is a direct consequence of prolonged inflammatory responses. Figure 5D,E shows the extent of fibrosis observed when the liver tissues were trichrome-stained. LEW.1WR1 rats showed a higher value when the fibrosis area under the curve was assessed (Figure 5G). Concurrently, there is an upregulation of key angiogenic genes, particularly vascular endothelial growth factor A (Vegf-a) and vascular endothelial growth factor C (Vegf-c) in LEW.1WR1 rats compared to Wistar Furth rats (Figure 5H). These genes are crucial in promoting vascular growth and remodeling, processes that are often accelerated in inflamed and fibrotic liver tissue. By contrast, a Western blot analysis reveals no significant difference in VEGFR-2, the receptor for VEGF, in liver tissues (Figure 5I). The heightened expression of Vegf gene expression is a marker of enhanced angiogenic signaling, driven by the ongoing inflammatory and fibrotic processes. Thus, the presence of Mallory–Denk bodies, increased fibrosis score, and altered expression of Vegf genes and their receptor collectively paint a picture of a liver under significant pathological stress, moving towards advanced disease states [38].
4. Discussion
Mordes et al. mentioned the observation that type 1 diabetic LEW.1WR1 rats develop fatty infiltration in the livers of those rats [20]. Our study shows that, in the absence of type 1 diabetes, LEW.1WR1 rats develop metabolic dysfunction that leads to the development of a malignant form of NAFLD. Current models of NASH rely upon a two-hit stimulus of diet induction of NAFLD followed by a pharmacological induction of inflammation. The LEW.1WR1 rat develops impaired liver metabolism and steatohepatitis without the traditional interventions in other rodent models, which would make it a more human-like model of NASH.
NASH is clearly associated with insulin resistance and hyperinsulinemia [24]. Insulin resistance exacerbates hepatic lipid accumulation [11]. Our previous work in these rats showed glucose intolerance not attributed to overeating or a diet high in sucrose or fat [21]. They showed increased body mass and epididymal fat mass in early adulthood, coupled with hyperinsulinemia. LEW.1WR1 rats under a control diet showed evidence of obesity, as suggested by the body and liver weight gain. The increased abdominal and epididymal fat mass indicates that part of the LEW.1WR1 rats’ excess weight was through lipid accumulation in subcutaneous fatty pads. This work also observed insulin resistance in the rats, as indicated by the significantly higher HOMA-IR values. However, insulin resistance did not cause significant differences in serum metabolites. The metabolites that were close to significant were from groups related to altered mitochondrial metabolism, a finding suggested by previous work in the LEW.1WR1 rat [39]. Microvesicular steatosis is also commonly associated with severe mitochondrial β-oxidation defects from genetic or acquired causes [40]. Insulin resistance is typically associated with changes related to fatty acid and protein/amino acid metabolism, and the metabolites that were close to significance were metabolites identified in human patients with insulin resistance [41,42]. We were unable to see clustering in our PCA plots. We suggest insulin resistance, and the subsequent negative changes to mitochondrial metabolism, drives the storage of fat in the liver in LEW.1WR1 rats, which may eventually lead to NASH.
In our study, LEW.1WR1 rats showed increased inflammatory foci scores, increased serum TNF- levels, and liver inflammation gene expression. Inflammation is a hallmark of NAFLD progression characterized by the upregulation of soluble inflammatory cytokines, including TNF-. In the liver, Kupffer cells are the primary source of hepatic TNF-α and are recruited and activated in a nutritional model of nonalcoholic steatohepatitis [38]. The increasing severity of steatosis was positively associated with lobular inflammation, fibrosis, and definite steatohepatitis [43]. Steatosis, lobular inflammation, and hepatocellular ballooning are necessary for diagnosing NASH; fibrosis is also typically observed [44]. The ballooning, lobular inflammation, and cell degeneration symptoms observed in LEW.1WR1 rats were not as severe as currently available diet-induced or chemically induced NASH rodent models [45]. Various noninvasive clinical scores have been proposed to diagnose NASH and predict fibrosis. This study measured some of the serum, protein, and gene markers related to NASH and fibrosis development. However, a histopathological evaluation of biopsy specimens remains the gold standard for diagnosing NAFLD/NASH [46]. Long-term treatment with TNF- induces the formation of MDB-like aggresomes and FAT10/Ubd expression [47], suggesting that inflammatory cytokines play a critical role in FAT10/Ubd upregulation and MDB formation [48] in LEW.1WR1 rats. We also observed significantly decreased Liver X Receptor-Alpha (Lxr- gene expression in the liver compared to Wistar Furth rats. LXRs modulate inflammatory and immune pathways and exhibit anti-inflammatory and anti-fibrotic activity in adverse liver disease models [49]. Both LEW.1WR1 rats and Wistar Furth rats had high Tgf-β, which can be an indicator of liver fibrosis [50].
Angiogenesis, the formation of new vessels from a pre-existing vascular system, is an active event dependent on growth factors and hypoxia in several organs during the growth and repair of injured tissues [38]. The parallel development of fibrosis during liver injury and its association with hypoxia and VEGF expression has been described by many studies [51]. Vascular endothelial growth factor (VEGF), a potent angiogenic factor, is also significantly increased in LEW.1WR1 rats compared to Wistar Furth rats. We have observed increased vascular endothelial growth factor A (Vegf-a) and vascular endothelial growth factor C (Vegf-c) expression in the liver in the LEW.1WR1 rats, suggesting the possibility of increased lipid accumulation followed by hypoxia, driving them to have increased Vegf expression. Vascular endothelial growth factor receptor 2 (VEGFR-2) is most important in VEGF-induced angiogenesis. Studies showed blocking VEGFR-2 can prevent NASH by attenuating inflammation and steatosis [52]. Even though LEW.1WR1 rats have increased VEGF serum levels and Vegf gene expression in the liver, VEGFR-2 expression in the liver was not significantly increased.
Apoptotic cascades not only play an important role in the mechanism of NAFLD/NASH pathogenesis but also stimulate immune cells and hepatic stellate cells, propelling the liver toward fibrogenesis [53]. Caspases have been important in apoptosis, with caspase-3 being indispensable in mediating cell death, leading to the targeted cleavage of important cellular proteins through cytochrome c-dependent or -independent pathways. Caspase-3 is also necessary for several defining features of apoptosis, including the condensation of apoptotic chromatin and the fragmentation of DNA across all cell types [54]. The positive expression of cleaved caspase-3 protein in both LEW.1WR1 and Wistar Furth rats (Figure 4I) indicates increased apoptosis in these animals. The activation of caspase-3 could indicate the liver’s response to metabolic stress, leading to cell death and, subsequently, triggering inflammatory responses (Figure 4D,E) to exacerbate the disease progression.
Acetyl-CoA carboxylase (ACC) is the enzyme that facilitates the first committed step of de novo lipogenesis (DNL) in the breakdown of mitochondrial fatty acid and crucially impacts these processes. An increase in DNL within the liver and a decrease in the breakdown of fatty acids are believed to be key contributors to steatosis [55]. Our western blot analysis results indicate that acetyl-CoA carboxylase (ACC) is present in both LEW.1WR1 rats and Wistar Furth rat strains (Figure 3J) with a trend of increased expression in LEW.1WR1 rats, which supports our results or increased DNL and steatosis in the LEW.1WR1 rats.
As a limitation of this study, the transition from NAFLD to NASH was not determined in this LEW.1WR1 rat model. Our best guess based on the research in our laboratory is that, between 18 weeks and 23 weeks, the transition between the non-malignant forms of steatosis to steatohepatitis occurs. Our study does not address the exact time when LEW.1WR1 rats develop NAFLD and NASH, so we cannot rule out the possibility of developing NAFLD and NASH before 23 weeks. Due to the current inability to purchase the LEW.1WR1 rat commercially, as in the past, we were unable to carry out the timeline studies. The relative contribution of high-fat or high-sucrose diets on NASH development in LEW.1WR1 rats needs further investigation. Furthermore, VEGF activation can be regulated through Hypoxia-inducible factor 1 (HIF-1α) [51,56]. HIF-1α activates Raf/MEK/ERK or the PI3K/AKT/tuberin/mTOR or the STAT3 signaling pathway, which regulate angiogenesis processes [57] in the liver, which may be an interesting future direction of research in LEW.1WR1 rats.
We also believe that FAT10/Ubd expression in the liver that has been shown in other studies is correlated with increased adiposity and insulin resistance, and inflammation is likely a factor that is critically involved in the progression of simple steatosis to steatohepatitis, the more severe form of NAFLD [42,43]. The inbred Wistar rat, the Wistar Furth rat, is often used in immunological, mammary cancer, and metabolic studies. Due to its resistance to virus-induced diabetes, it was used as a control rat for LEW.1WR1 rats, but they do not appear to be resistant to developing a small amount of fatty liver. In this study, however, we observe reduced steatohepatitis relative to the LEW.1WR1 rats without a stimulus like thioacetamide [58]. The utilization of Wistar rats for metabolic studies may have made it more of a positive control than a negative control.
Despite advancements in understanding the etiology of NASH, the pathophysiological processes, notably the transition from simple steatosis to NASH, remain largely enigmatic. LEW.1WR1 rats, with their unique genetic predispositions and metabolic characteristics, mirror the human pathophysiology of NASH, offering a window into the underlying mechanisms driving this condition [46].
Supplementary Materials
The following supporting information can be downloaded at: https://www.mdpi.com/article/10.3390/endocrines5020012/s1, Figure S1. Plasma metabolites that are associated with hunger and satiety: (A) ghrelin (n.s., n = 3, 6), (B) leptin (p = 0.0060, n = 8, 9), (C) pancreatic polypeptide (PP) (n.s., n = 8, 10), and (D) peptide tyrosine tyrosine (PYY) (n.s., n = 7, 6); Table S1. Characteristic 1H-NMR peaks for metabolites of interest. Table S2. qPCR primers.
Author Contributions
M.M.W., Q.C.W.-V., E.C.H. and M.A.D.: formal analysis; L.M., C.R.A., A.S., M.M.W., E.C.H. and Q.C.W.-V.: investigation; Q.C.W.-V., M.M.W., E.C.H., M.A.D. and S.T.L.-R.: writing—original draft; Q.C.W.-V., E.C.H., M.A.D., S.T.L.-R. and B.W.G.V.: writing—review and editing. S.T.L.-R. and B.W.G.V.: conceptualization, and methodology. S.T.L.-R. and B.W.G.V.: supervision, and project administration. S.T.L.-R. and B.W.G.V.: funding acquisition. All authors have read and agreed to the published version of the manuscript.
Funding
This research was funded by The University of Alabama in Huntsville, the Louis Stokes Alliance for Minority Participation NSF Grant (1619659, NSF), Research Publication Grant in Engineering, Medicine, and Science from the American Association of University Women, UAH Adriel D. Johnson, Sr. Fellowship, and the Alabama Space Grant Consortium.
Institutional Review Board Statement
The experimental protocol was approved by the University of Alabama in Huntsville Institutional Animal Care and Use Committee on 24 April 2018 (protocol code: 2018.R003.MetabolicCages).
Informed Consent Statement
Not applicable.
Data Availability Statement
The data available upon request due to restrictions. The data presented in this study are available upon request from the corresponding author. The data are not publicly available due to being stored in the Histowiz repository. NMR data can be shared upon request.
Acknowledgments
The authors would like to thank Victoria McConnell, Hannah Underhill, Helen Gibson, James Wolfsberger, and Jennifer Nix. Special thanks goes to John Vincent for the use of metabolic cages. Special thanks goes to W. Thomas Love for the additional support with antibodies.
Conflicts of Interest
The authors declare no conflicts of interest.
Appendix A
| Primer sequences | |
| Gene name | Sequence 5′-3′ |
| Rpl32 forward | AAACTGGCGGAAACCCAGAG |
| Rpl32 reverse | GCAATCTCAGCACAGTAAGATT |
| Vegf-a forward | CGACAGAAGGGGAGCAGAAA |
| Vegf-a reverse | CCTTGGCTTGTCACATCTGC |
| Vegf-c forward | GTTCGGATGTCCGGTTTCCT |
| Vegf-c reverse | GCCTTCGAAACCCTTGACCT |
| Ccl3 forward | CCTATGGACGGCAAATTCCAC |
| Ccl3 reverse | AGATCTGCCGGTTTCTCTTGG |
| Ccl5 forward | CATATGGCTCGGACACCACT |
| Ccl5 reverse | GACTGCAAGGTTGGAGCACT |
| Acox1 forward | TGCTTTGGTGTCTGTCACTTC |
| Acox1 reverse | ATTGAGGCCAACAGGTTCCA |
| Mcp-1 forward | CTTCCTCCACCACTATGCAGG |
| Mcp-1 reverse | GATGCTACAGGCAGCAACTG |
| Lxr-a forward | GAGGGCTGCAAGGGATTCTT |
| Lxr-a reverse | CATTTGCGAAGGCGACACTC |
| Tgf-β forward | CCACGTAGTAGACGATGGGC |
| Tgf-β reverse | GCTAGCTGATTACTTCTGTGTAGT |
| IFN-β forward | ACTACAAGCAGCTCCAGTTC |
| IFN-β reverse | TGAGGTTGAGCCTTCCATTC |
| Plin2 forward | GGCCAGTGAGATGGCTTAAT |
| Plin2 reverse | TGTGTGTGTGTGTGTGTAGAG |
| Pnpla2 forward | GAGTTTCGGATGGAGAGAATGT |
| Pnpla2 reverse | GCCACAGTACACAGGGATAAA |
| Acadvl forward | ACTGTCTTTGCCAAAACGCC |
| Acadvl reverse | GCCCATCTTCTTTTCGGGGA |
| Ppar-a forward | CATACAGGAGAGCAGGGATTTG |
| Ppar-a reverse | GCCTCTGATCACCACCATTT |
| Cpt1-a forward | CCACGAAGCCCTCAAACAGA |
| Cpt1-a reverse | CACACCCACCACCACGATAA |
| Prkaa forward | TGGAGGTGAATTGTTCGACTACAT |
| Prkaa reverse | ACAGTAGTCCACGGCAGACAGA |
| Acc1 forward | CTTGGGGTGATGCTCCCATT |
| Acc1 reverse | GCTGGGCTTAAACCCCTCAT |
| Fasn forward | GCATTTCCACAACCCCAACC |
| Fasn reverse | AACGAGTTGATGCCCACGAT |
| Scd-1 forward | ACATTCAATCTCGGGAGAACA |
| Scd-1 reverse | CCATGCAGTCGATGAAGAAC |
| Srebf-1 forward | CATGGACGAGCTACCCTTCG |
| Srbf-1 reverse | GGGCATCAAATAGGCCAGGG |
References
- Shetty, A.; Syn, W.-K. Health and Economic Burden of Nonalcoholic Fatty Liver Disease in the United States and Its Impact on Veterans. Fed. Pract. 2019, 36, 14–19. [Google Scholar] [PubMed]
- Estes, C.; Anstee, Q.M.; Arias-Loste, M.T.; Bantel, H.; Bellentani, S.; Caballeria, J.; Colombo, M.; Craxi, A.; Crespo, J.; Day, C.P.; et al. Modeling NAFLD Disease Burden in China, France, Germany, Italy, Japan, Spain, United Kingdom, and United States for the Period 2016–2030. J. Hepatol. 2018, 69, 896–904. [Google Scholar] [CrossRef]
- Muzurović, E.; Peng, C.C.-H.; Belanger, M.J.; Sanoudou, D.; Mikhailidis, D.P.; Mantzoros, C.S. Nonalcoholic Fatty Liver Disease and Cardiovascular Disease: A Review of Shared Cardiometabolic Risk Factors. Hypertension 2022, 79, 1319–1326. [Google Scholar] [CrossRef]
- Buzzetti, E.; Pinzani, M.; Tsochatzis, E.A. The Multiple-Hit Pathogenesis of Non-Alcoholic Fatty Liver Disease (NAFLD). Metabolism 2016, 65, 1038–1048. [Google Scholar] [CrossRef] [PubMed]
- Begriche, K.; Massart, J.; Robin, M.-A.; Bonnet, F.; Fromenty, B. Mitochondrial Adaptations and Dysfunctions in Nonalcoholic Fatty Liver Disease. Hepatology 2013, 58, 1497–1507. [Google Scholar] [CrossRef]
- Van Den Brandt, J.; Kovács, P.; Klöting, I. Features of the Metabolic Syndrome in the Spontaneously Hypertriglyceridemic Wistar Ottawa Karlsburg W (RT1u Haplotype) Rat. Metabolism 2000, 49, 1140–1144. [Google Scholar] [CrossRef]
- Gaggini, M.; Morelli, M.; Buzzigoli, E.; DeFronzo, R.A.; Bugianesi, E.; Gastaldelli, A. Non-Alcoholic Fatty Liver Disease (NAFLD) and Its Connection with Insulin Resistance, Dyslipidemia, Atherosclerosis and Coronary Heart Disease. Nutrients 2013, 5, 1544–1560. [Google Scholar] [CrossRef] [PubMed]
- Chalasani, N.; Younossi, Z.; Lavine, J.E.; Diehl, A.M.; Brunt, E.M.; Cusi, K.; Charlton, M.; Sanyal, A.J.; American Gastroenterological Association; American Association for the Study of Liver Diseases. The Diagnosis and Management of Non-Alcoholic Fatty Liver Disease: Practice Guideline by the American Gastroenterological Association, American Association for the Study of Liver Diseases, and American College of Gastroenterology. Gastroenterology 2012, 142, 1592–1609. [Google Scholar] [CrossRef]
- Bellentani, S.; Saccoccio, G.; Masutti, F.; Crocè, L.S.; Brandi, G.; Sasso, F.; Cristanini, G.; Tiribelli, C. Prevalence of and Risk Factors for Hepatic Steatosis in Northern Italy. Ann. Intern. Med. 2000, 132, 112–117. [Google Scholar] [CrossRef]
- Marušić, M.; Paić, M.; Knobloch, M.; Liberati Pršo, A.-M. NAFLD, Insulin Resistance, and Diabetes Mellitus Type 2. Can. J. Gastroenterol. Hepatol. 2021, 2021, 6613827. [Google Scholar] [CrossRef]
- Chen, Z.; Yu, R.; Xiong, Y.; Du, F.; Zhu, S. A Vicious Circle between Insulin Resistance and Inflammation in Nonalcoholic Fatty Liver Disease. Lipids Health Dis. 2017, 16, 203. [Google Scholar] [CrossRef] [PubMed]
- Pasmans, K.; Adriaens, M.E.; Olinga, P.; Langen, R.; Rensen, S.S.; Schaap, F.G.; Olde Damink, S.W.M.; Caiment, F.; van Loon, L.J.C.; Blaak, E.E.; et al. Hepatic Steatosis Contributes to the Development of Muscle Atrophy via Inter-Organ Crosstalk. Front. Endocrinol. 2021, 12, 733625. [Google Scholar] [CrossRef] [PubMed]
- Robertson, R.P.; Harmon, J.; Tran, P.O.T.; Poitout, V. Beta-Cell Glucose Toxicity, Lipotoxicity, and Chronic Oxidative Stress in Type 2 Diabetes. Diabetes 2004, 53 (Suppl. S1), S119–S124. [Google Scholar] [CrossRef]
- Gao, B.; Tsukamoto, H. Inflammation in Alcoholic and Nonalcoholic Fatty Liver Disease: Friend or Foe? Gastroenterology 2016, 150, 1704–1709. [Google Scholar] [CrossRef]
- Hermans, M.P.; Valensi, P. Elevated Triglycerides and Low High-Density Lipoprotein Cholesterol Level as Marker of Very High Risk in Type 2 Diabetes. Curr. Opin. Endocrinol. Diabetes Obes. 2018, 25, 118–129. [Google Scholar] [CrossRef]
- Tesfay, M.; Goldkamp, W.J.; Neuschwander-Tetri, B.A. NASH: The Emerging Most Common Form of Chronic Liver Disease. Mo. Med. 2018, 115, 225–229. [Google Scholar]
- Hansen, H.H.; Feigh, M.; Veidal, S.S.; Rigbolt, K.T.; Vrang, N.; Fosgerau, K. Mouse Models of Nonalcoholic Steatohepatitis in Preclinical Drug Development. Drug Discov. Today 2017, 22, 1707–1718. [Google Scholar] [CrossRef] [PubMed]
- Kucera, O.; Cervinkova, Z. Experimental Models of Non-Alcoholic Fatty Liver Disease in Rats. World J. Gastroenterol. 2014, 20, 8364–8376. [Google Scholar] [CrossRef]
- Cort, L.; Habib, M.; Eberwine, R.; Hessner, M.J.; Mordes, J.P.; Blankenhorn, E.P. Diubiquitin (Ubd) is a Susceptibility Gene for Virus-triggered Autoimmune Diabetes in Rats. Genes Immun. 2014, 15, 168. [Google Scholar] [CrossRef]
- Mordes, J.P.; Guberski, D.L.; Leif, J.H.; Woda, B.A.; Flanagan, J.F.; Greiner, D.L.; Kislauskis, E.H.; Tirabassi, R.S. LEW.1WR1 Rats Develop Autoimmune Diabetes Spontaneously and in Response to Environmental Perturbation. Diabetes 2005, 54, 2727–2733. [Google Scholar] [CrossRef]
- Blankenhorn, E.P.; Cort, L.; Greiner, D.L.; Guberski, D.L.; Mordes, J.P. Virus-Induced Autoimmune Diabetes in the LEW.1WR1 Rat Requires Iddm14 and a Genetic Locus Proximal to the Major Histocompatibility Complex. Diabetes 2009, 58, 2930. [Google Scholar] [CrossRef]
- Bril, F.; Lomonaco, R.; Orsak, B.; Ortiz-Lopez, C.; Webb, A.; Tio, F.; Hecht, J.; Cusi, K. Relationship between Disease Severity, Hyperinsulinemia, and Impaired Insulin Clearance in Patients with Nonalcoholic Steatohepatitis. Hepatology 2014, 59, 2178–2187. [Google Scholar] [CrossRef] [PubMed]
- Wilkerson-Vidal, Q.C.; Wimalarathne, M.; Collins, G.; Wolfsberger, J.G.; Clopp, A.; Mercado, L.; Fowler, E.; Gibson, H.; McConnell, V.; Martin, S.; et al. Young Adult Male LEW.1WR1 Rats Have Reduced Beta Cell Area and Develop Glucose Intolerance. Mol. Cell. Endocrinol. 2023, 562, 111837. [Google Scholar] [CrossRef] [PubMed]
- Chitturi, S.; Abeygunasekera, S.; Farrell, G.C.; Holmes-Walker, J.; Hui, J.M.; Fung, C.; Karim, R.; Lin, R.; Samarasinghe, D.; Liddle, C.; et al. NASH and Insulin Resistance: Insulin Hypersecretion and Specific Association with the Insulin Resistance Syndrome. Hepatology 2002, 35, 373–379. [Google Scholar] [CrossRef]
- Kruger, A.J.; Yang, C.; Tam, S.W.; Hinerfeld, D.; Evans, J.E.; Green, K.M.; Leszyk, J.; Yang, K.; Guberski, D.L.; Mordes, J.P.; et al. Haptoglobin as an Early Serum Biomarker of Virus-Induced Autoimmune Type 1 Diabetes in Biobreeding Diabetes Resistant and LEW1.WR1 Rats. Exp. Biol. Med. 2010, 235, 1328–1337. [Google Scholar] [CrossRef]
- Wimalarathne, M.M.; Wade, A.M.; Love-Rutledge, S. LEW.1WR1 Rats Have Increased Insulin Levels and Liver Lipid Lipolytic Gene Expression during Their Type 1 Diabetes Susceptibility Window. FASEB J. 2020, 34 (Suppl. S1), 1. [Google Scholar] [CrossRef]
- Dali-Youcef, N.; Vix, M.; Costantino, F.; El-Saghire, H.; Lhermitte, B.; Callari, C.; D’Agostino, J.; Perretta, S.; Paveliu, S.; Gualtierotti, M.; et al. Interleukin-32 Contributes to Human Nonalcoholic Fatty Liver Disease and Insulin Resistance. Hepatol. Commun. 2019, 3, 1205–1220. [Google Scholar] [CrossRef]
- Matthews, D.R.; Hosker, J.P.; Rudenski, A.S.; Naylor, B.A.; Treacher, D.F.; Turner, R.C. Homeostasis model assessment: Insulin resistance and ꞵ-cell function from fasting plasma glucose and insulin concentrations in man. Diabetologia 1985, 28, 412–419. [Google Scholar] [CrossRef]
- Snytnikova, O.A.; Khlichkina, A.A.; Sagdeev, R.Z.; Tsentalovich, Y.P. Evaluation of sample preparation protocols for quantitative NMR-based metabolomics. Metabolomics 2019, 15, 84. [Google Scholar] [CrossRef]
- Nowick, J.S.; Khakshoor, O.; Hashemzadeh, M.; Brower, J.O. DSA: A New Internal Standard for NMR Studies in Aqueous Solution. Org. Lett. 2003, 5, 3511–3513. [Google Scholar] [CrossRef]
- Wolfsberger, J.G.; Hunt, E.C.; Bobba, S.S.; Love-Rutledge, S.; Vogler, B. Metabolite quantification: A fluorescence-based method for urine sample normalization prior to 1H-NMR analysis. Metabolomics 2022, 18, 80. [Google Scholar] [CrossRef] [PubMed]
- Kleiner, D.E.; Brunt, E.M.; Van Natta, M.; Behling, C.; Contos, M.J.; Cummings, O.W.; Ferrell, L.D.; Liu, Y.; Torbenson, M.S.; Unalp-Arida, A.; et al. Nonalcoholic Steatohepatitis Clinical Research Network. Design and validation of a histological scoring system for nonalcoholic fatty liver disease. Hepatology 2005, 41, 1313–1321. [Google Scholar] [CrossRef] [PubMed]
- Bankhead, P.; Loughrey, M.B.; Fernández, J.A.; Dombrowski, Y.; McArt, D.G.; Dunne, P.D.; McQuaid, S.; Gray, R.T.; Murray, L.J.; Coleman, H.G.; et al. QuPath: Open source software for digital pathology image analysis. Sci. Rep. 2017, 7, 16878. [Google Scholar] [CrossRef] [PubMed]
- Chusyd, D.E.; Wang, D.; Huffman, D.M.; Nagy, T.R. Relationships between Rodent White Adipose Fat Pads and Human White Adipose Fat Depots. Front Nutr. 2016, 3, 10. [Google Scholar] [CrossRef] [PubMed]
- Snel, M.; Jonker, J.T.; Schoones, J.; Lamb, H.; De Roos, A.; Pijl, H.; Smit, J.W.A.; Meinders, A.E.; Jazet, I.M. Ectopic Fat and Insulin Resistance: Pathophysiology and Effect of Diet and Lifestyle Interventions. Int. J. Endocrinol. 2012, 2012, 983814. [Google Scholar] [CrossRef] [PubMed]
- Peiseler, M.; Schwabe, R.; Hampe, J.; Kubes, P.; Heikenwälder, M.; Tacke, F. Immune mechanisms linking metabolic injury to inflammation and fibrosis in fatty liver disease—Novel insights into cellular communication circuits. J. Hepatol. 2022, 77, 1136–1160. [Google Scholar] [CrossRef] [PubMed]
- Tiniakos, D.G.; Vos, M.B.; Brunt, E.M. Nonalcoholic fatty liver disease: Pathology and pathogenesis. Annu. Rev. Pathol. 2010, 5, 145–171. [Google Scholar] [CrossRef] [PubMed]
- Takahashi, Y.; Fukusato, T. Histopathology of nonalcoholic fatty liver disease/nonalcoholic steatohepatitis. World J. Gastroenterol. 2014, 20, 15539. [Google Scholar] [CrossRef] [PubMed]
- Wimalarathne, M.M. Hyperinsulinemic LEW.1WR1 Rats Develop Insulin Resistance and Nonalcoholic Steatohepatitis (Order No. 30309824). Available from Dissertations & Theses @ University of Alabama in Huntsville; ProQuest One Academic. (2786218946). 2023. Available online: https://www.proquest.com/dissertations-theses/hyperinsulinemic-lew-1wr1-rats-develop-insulin/docview/2786218946/se-2 (accessed on 5 January 2024).
- Oliva, J.; Bardag-Gorce, F.; Lin, A.; French, B.A.; French, S.W. The role of cytokines in Ubd promoter regulation and Mallory-denk body-like aggresomes. Exp. Mol. Pathol. 2010, 89, 1. [Google Scholar] [CrossRef]
- Gu, X.; Al Dubayee, M.; Alshahrani, A.; Masood, A.; Benabdelkamel, H.; Zahra, M.; Li, L.; Abdel Rahman, A.M.; Aljada, A. Distinctive Metabolomics Patterns Associated With Insulin Resistance and Type 2 Diabetes Mellitus. Front. Mol. Biosci. 2020, 7, 609806. [Google Scholar] [CrossRef]
- Zhang, X.; Wang, Y.; Hao, F.; Zhou, X.; Han, X.; Tang, H.; Ji, L. Human serum metabonomic analysis reveals progression axes for glucose intolerance and insulin resistance statuses. J. Proteome Res. 2009, 8, 5188–5195. [Google Scholar] [CrossRef] [PubMed]
- Fromenty, B.; Berson, A.; Pessayre, D. Microvesicular steatosis and steatohepatitis: Role of mitochondrial dysfunction and lipid peroxidation. J. Hepatol. 1997, 26, 13–22. [Google Scholar] [CrossRef] [PubMed]
- Chalasani, N.; Wilson, L.; Kleiner, D.E.; Cummings, O.W.; Brunt, E.M.; Ünalp, A. Relationship of steatosis grade and zonal location to histological features of steatohepatitis in adult patients with non-alcoholic fatty liver disease. J. Hepatol. 2008, 48, 829–834. [Google Scholar] [CrossRef] [PubMed]
- Shimozono, R.; Asaoka, Y.; Yoshizawa, Y.; Aoki, T.; Noda, H.; Yamada, M.; Kaino, M.; Mochizuki, H. Nrf2 activators attenuate the progression of nonalcoholic steatohepatitis-related fibrosis in a dietary rat model. Mol. Pharmacol. 2013, 84, 62–70. [Google Scholar] [CrossRef] [PubMed]
- Carreres, L.; Jílková, Z.M.; Vial, G.; Marche, P.N.; Decaens, T.; Lerat, H. Modeling Diet-Induced NAFLD and NASH in Rats: A Comprehensive Review. Biomedicines 2021, 9, 378. [Google Scholar] [CrossRef] [PubMed]
- French, S.W.; Lee, J.; Zhong, J.; Morgan, T.R.; Buslon, V.; Lungo, W.; French, B.A. Alcoholic liver disease- Hepato-cellular carcinoma transformation. J. Gastrointest. Oncol. 2012, 3, 174–181. [Google Scholar] [CrossRef] [PubMed]
- French, S.W.; French, B.A.; Oliva, J.; Li, J.; Bardag-Gorce, F.; Tillman, B.; Canaan, A. FAT10 knock out mice livers fail to develop Mallory-denk bodies in the DDC mouse model. Exp. Mol. Pathol. 2012, 93, 309. [Google Scholar] [CrossRef]
- Beaven, S.W.; Wroblewski, K.; Wang, J.; Hong, C.; Bensinger, S.; Tsukamoto, H.; Tontonoz, P. Liver X receptor signaling is a determinant of stellate cell activation and susceptibility to fibrotic liver disease. Gastroenterology 2011, 140, 1052–1062. [Google Scholar] [CrossRef]
- Dooley, S.; ten Dijke, P. TGF-β in progression of liver disease. Cell Tissue Res. 2012, 347, 245–256. [Google Scholar] [CrossRef]
- Carmeliet, P.; Jain, R.K. Molecular mechanisms and clinical applications of angiogenesis. Nature 2011, 473, 298–307. [Google Scholar] [CrossRef]
- Nath, B.; Szabo, G. Hypoxia and Hypoxia Inducible Factors: Diverse Roles in Liver Diseases. Hepatology 2012, 55, 622. [Google Scholar] [CrossRef] [PubMed]
- Kanda, T.; Matsuoka, S.; Yamazaki, M.; Shibata, T.; Nirei, K.; Takahashi, H.; Kaneko, T.; Fujisawa, M.; Higuchi, T.; Nakamura, H.; et al. Apoptosis and non-alcoholic fatty liver diseases. World J. Gastroenterol. 2018, 24, 2661–2672. [Google Scholar] [CrossRef] [PubMed]
- Porter, A.G.; Jänicke, R.U. Emerging roles of caspase-3 in apoptosis. Cell Death Differ. 1999, 6, 99–104. [Google Scholar] [CrossRef] [PubMed]
- Dandan, M.; Han, J.; Mann, S.; Kim, R.; Li, K.; Mohammed, H.; Chuang, J.C.; Zhu, K.; Billin, A.N.; Huss, R.S.; et al. Acetyl-CoA carboxylase inhibitor increases LDL-apoB production rate in NASH with cirrhosis: Prevention by fenofibrate. J. Lipid Res. 2023, 64, 100339. [Google Scholar] [CrossRef] [PubMed]
- Ruan, G.X.; Kazlauskas, A. VEGF-A engages at least three tyrosine kinases to activate PI3K/Akt. Cell Cycle 2012, 11, 2047. [Google Scholar] [CrossRef] [PubMed]
- Pugh, C.W.; Ratcliffe, P.J. Regulation of angiogenesis by hypoxia: Role of the HIF system. Nat. Med. 2003, 9, 677–684. [Google Scholar] [CrossRef]
- Zhao, G.; Nakano, K.; Chijiiwa, K.; Ueda, J.; Tanaka, M. Inhibited activities in CCAAT/enhancer-binding protein, activating protein-1 and cyclins after hepatectomy in rats with thioacetamide-induced liver cirrhosis. Biochem. Biophys. Res. Commun. 2002, 292, 474–481. [Google Scholar] [CrossRef]
Disclaimer/Publisher’s Note: The statements, opinions and data contained in all publications are solely those of the individual author(s) and contributor(s) and not of MDPI and/or the editor(s). MDPI and/or the editor(s) disclaim responsibility for any injury to people or property resulting from any ideas, methods, instructions or products referred to in the content. |
© 2024 by the authors. Licensee MDPI, Basel, Switzerland. This article is an open access article distributed under the terms and conditions of the Creative Commons Attribution (CC BY) license (https://creativecommons.org/licenses/by/4.0/).