Article

Experimental Study and Simplified Modelling of 1 kW Proton Exchange Membrane Fuel Cell for Mobile and Stationary Hybrid Systems Optimization


1
Academician Evgeni Budevski Institute of Electrochemistry and Energy Systems Bulgarian Academy of Sciences (IEES-BAS), Academician Georgi Bonchev Str, bl. 10, 1113 Sofia, Bulgaria
2
Faculty of Electrical Engineering, Technical University of Sofia, 8 Kliment Ohridski Blvd., 1000 Sofia, Bulgaria
*
Author to whom correspondence should be addressed.
Electrochem 2026, 7(3), 26; https://doi.org/10.3390/electrochem7030026
Submission received: 30 June 2026 / Revised: 17 August 2026 / Accepted: 31 August 2026 / Published: 2 September 2026

Abstract

The conversion of hydrogen into electricity is a subject of intense interest. Various technologies are available at laboratory level, but in industrial applications, the most established of them is the proton exchange membrane-based fuel cell. This increased interest, combined with the maturity of the technology, has led to attempts to integrate fuel cells into hybrid systems with renewable energy sources. Such hybrid systems are subject to numerous studies, most of which are aimed at optimizing installed capacity in order to reduce the cost of energy production, of investment, etc. This article aims to provide an experiment-based approach for a simple yet accurate model linking electrical power with hydrogen consumption that can be used in the design and optimization procedures for hybrid systems. For this purpose, an experimental setup with a 1 kW fuel cell was built at the Technical University of Sofia, where experimental studies were conducted to enable the development of the model. Although the proposed model does not reflect the influence of certain technological factors on the operation of the fuel cell, it provides sufficient accuracy to determine the hydrogen consumption for a given electrical power when used in operation simulations of the hybrid system.

1. Introduction

Over the past decade, hydrogen technologies have emerged as one of the key pillars of the global transition toward a low-carbon economy [1,2,3]. The accelerated deployment of renewable energy sources, combined with the need to reduce greenhouse gas emissions and enhance energy independence, has driven significant scientific and industrial efforts toward the development of the hydrogen economy [4,5]. In this context, fuel cells (FC) are regarded as a key technology for the highly efficient conversion of the chemical energy of hydrogen into electrical energy with zero or minimal pollutant emissions [6,7]. Polymer electrolyte membrane fuel cells (PEMFCs) are characterized by high energy efficiency, rapid dynamic response, and the ability to operate over a wide power range. Owing to these advantages, they have found extensive applications in transportation, stationary power generation systems, uninterruptible power supply (UPS) systems, and various industrial applications [8].
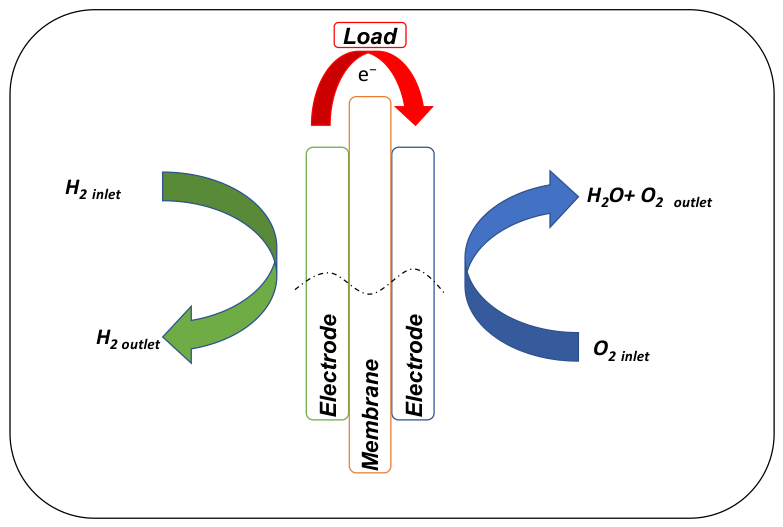
The key functional component of a PEM fuel cell is the membrane electrode assembly (MEA). It consists of two gas diffusion electrodes, namely the anode and cathode, mechanically separated by a proton-conducting polymer membrane. Within this component, the fundamental electrochemical reactions take place, namely the hydrogen oxidation reaction (HOR) at the anode and the oxygen reduction reaction (ORR) at the cathode, through which the chemical energy of the fuel is directly converted into electrical energy [9,10]. A schematic diagram of MEA applicable for a PEMFC is shown in Figure 1.
In recent years, significant advancements have been achieved in the development of electrocatalysts, polymer electrolyte membranes, and the architectural design of membrane electrode assemblies. The loading of noble metals—primarily platinum—has been substantially reduced through the utilization of carbon-based catalytic supports, while novel membranes featuring minimized thickness, enhanced mechanical strength, and superior chemical stability have successfully lowered internal resistance. Furthermore, the optimization of gas diffusion electrodes and flow channel geometries has facilitated more efficient reactant distribution and effective water management [11,12,13]. Collectively, all these technological improvements mitigate both activation overpotential and ohmic resistance within the fuel cell. Consequently, a marked increase in energy and Faradaic efficiencies is observed, yielding minimized thermal losses alongside enhanced operational reliability and durability of proton exchange membrane fuel cells [14,15].
Another important characteristic of this type of energy conversion device is its ability to be assembled into stack configurations, where multiple individual cells are electrically connected in series [16]. This arrangement increases the overall operating voltage (Vcell) of the system while maintaining a compact and modular design. Consequently, fuel cell stacks can deliver higher power outputs suitable for practical energy applications. According to the Nernst equation, the voltage of a PEM fuel cell is given by
E = E 0 + R T n F ln P H 2 P O 2 0.5 P H 2 O ,
where E is the actual cell voltage, E0 is the standard reversible potential (1.23 V), R is the universal gas constant (8.314 J/(molK)), T is the absolute temperature (K), n is the number of electrons transferred in the electrochemical reaction (n = 2), F is Faraday’s constant (96,485 C/mol), and P H 2 , P O 2   a n d   P H 2 O represent the corresponding partial pressures of hydrogen, oxygen, and water, respectively (expressed in [atm] or normalized by standard pressure P0 = 1 atm) [17].
The Nernst equation demonstrates that the cell voltage is directly influenced by the operating temperature and the partial pressures of the reactants and products [17]. Therefore, optimization of these parameters is essential for achieving high fuel cell performance and efficiency.
The apparent activation energy of the fuel cell can be determined from the temperature dependence of the electrochemical reaction rate according to the Arrhenius equation:
i = A exp E a R T
where i is the current density, A is the pre-exponential factor, and Ea is the apparent activation energy.
Taking the natural logarithm yields the linearized Arrhenius expression:
ln i = ln A E a R T
The apparent activation energy can therefore be calculated from the slope of the Arrhenius plot of ln(i) versus (R/T):
E a = R d ln i d 1 T
The overall activation energy of the fuel cell can be considered as the sum of the contributions from the anodic reaction, cathodic reaction, and ohmic transport processes:
E a = E a , a n o d e E a , c a t h o d e E a , o h m i c
where Ea,anode is the activation energy associated with the hydrogen oxidation reaction, Ea,cathode is the activation energy associated with the oxygen reduction reaction, and Ea,ohmic is the apparent activation energy associated with proton transport through the polymer electrolyte membrane.
Consequently, the temperature dependence of the fuel cell performance is governed by the combined effects of electrode kinetics and ionic transport, which together determine the overall apparent activation energy of the electrochemical conversion process [18,19].
The electrochemical characteristics described above determine the performance of fuel cells at the single-cell and stack levels. However, the practical value of fuel cell technology becomes evident when it is integrated into complete energy systems that combine renewable energy generation, hydrogen production, storage, and utilization. Such integrated systems enable the conversion of intermittent renewable energy into a storable energy carrier, thereby improving energy security, flexibility, and overall system reliability [20].
In recent years, the rapid development of hydrogen technologies has led to the deployment of numerous demonstration and pilot installations worldwide [21]. These systems typically integrate renewable energy sources, electrolyzers, hydrogen storage units, and fuel cells, creating sustainable pathways for energy storage and power generation. The following examples illustrate some of the most representative operational hybrid renewable-hydrogen systems currently in service. Such an example is the MYRTE Platform in the University of Corsica Pascal Paoli in Ajaccio, France, composed of a 560 kWp photovoltaic (PV) system, 50 kW electrolyzer, three 28 m3 tanks for 35 bar (two for hydrogen and one for oxygen), and a 110 kW fuel cell [22]. In this case, the hydrogen production/storage/consumption system is used to smooth the power fluctuations of the stochastic solar source. As an additional benefit, Rodler et al. [23] report the possibility of using the produced heat by both the fuel cell and the electrolyzer. A smaller real system is investigated by Sophian et al. [24], located in Kuala Terengganu, Malaysia. It consists of 1 kW PV installation, 1 kW wind generator, 1000 Ah battery bank, and 1 kW PEM electrolyzer. The purpose of the system is to produce hydrogen; the reported amount is 130–140 mL/min for solar radiation in the range 200–800 W/m2 and wind speed in the range 2–5 m/s. Considering the high interest in hydrogen in the last decades, different installations started their operation. A non-exhaustive list is presented in Table 1.
Despite the presence of those experimental platforms, most authors concentrate their efforts on the simulation of different hybrid systems and the optimization of the system or its control. Different approaches to represent the fuel cell are used in those papers. The first one is to consider the fuel cell only as a fixed efficiency. This is the case in [32], where four different locations are investigated (in Brazil, Bolivia, and Malaysia). The studied hybrid system consists of PV plant, wind generator, battery bank, and hydrogen system (electrolyzer, tank, and fuel cell). The authors use Non-dominated Sorting Genetic Algorithm II. Their aim is the system optimization according to the number of supply interruptions and the system price. The sensitivity of the system to the influence of different parameters is also investigated. Showers and Chowdhury [33] used HOMER Pro software (version 3.18.0, build 3.18.8823.1207) to optimize a combination of PV plant, battery bank, supercapacitor, and full conversion hydrogen system (electrolyzer, tank, and fuel cell). The fuel cell in this study is considered as 60% efficiency. The optimization results show that to avoid 10 kWh of non-satisfied energy, the installed system should be more than two times more expensive. The same software is used in [34] for the optimization of PV-wind-powered hybrid system in Lijiang, China, with batteries and a hydrogen system with a dual use—to supply mobile hydrogen consumers and to produce electricity via a fuel cell. The results demonstrate the feasibility of the system for the considered load profile. HOMER is also used by Esteves and Gabbar [35] for the simulation of the operation of a fast-charging station in Toronto, Canada, powered by small modular nuclear reactors, PV and wind generators, an electrolyzer, H2 storage, and fuel cell. The hydrogen tank provides hydrogen for mobile hydrogen consumers and for the fuel cell. The authors claim that the proposed system provides reliable and sustainable energy to fast-charging stations, thus lowering both CO2 emissions and power grid dependency.
The second approach is the use of the detailed electrochemical model of the fuel cell, presented above. Möller and Krauter [36,37] studied a hybrid system with a PV installation, a battery, an electrolyzer, a hydrogen tank, and a fuel cell. The system is modelled in Matlab/Simulink R2021b. The meteorological data are from Würzburg, Germany, while the system’s load profile is generated with Swiss software (Energy tools 2021). Their first paper concentrates on the system’s modelling, while in the second, the influence of different parameters on the system performance is examined. In both cases, the fuel cell is used only during the winter. Pratticò et al. [38] use the voltage fuel cell model, which is implemented in the Matlab’s Simscape library, to propose a fuzzy logic control of a hybrid system with PV and wind generators, batteries, and fuel cell. The studied system is located in Reggio Calabria, Italy, and its operation is investigated for one day in June. The results demonstrate the good operation of the system, but it should be noted that the fuel cell is activated only under critical conditions, which extends its lifetime. The control of a hybrid system with a fuel cell on the basis of the detailed model has been also studied by Wang et al. [39]. The authors propose two levels of control: of the energy flows and of the power converters in the system. The system considered consists of a PV plant, a battery, an electrolyzer, an H2 tank, and a fuel cell, and Matlab is used to perform the simulations of different scenarios, which demonstrate the good operation of the proposed control. The same hybrid system and software have been used by Hidouri [40] to demonstrate the good performance of the energy control, reaching an overall efficiency of 62% and significant reduction of CO2 emissions. More specific control is proposed in [41]. The studied hybrid system consists of PV and wind generators, battery storage, an electrolyzer, a tank, and a fuel cell. The control is performed on the DC bus and reduces the voltage fluctuations by 24.07% and the stabilization time by 56.92%, while the fuel cell efficiency is increased by 31.88% due to the lower fuel cell temperature.
The detailed fuel cell model is also used for studies related to the mobile use of hydrogen. Banawi et al. [42] investigated a hybrid system installed on a boat with PV and wind generators, a battery, and a fuel cell. The study is performed in Matlab via simulation of 1 h of operation, which is the mission time of the ferry. The load is mainly supplied by the fuel cell and the battery, both using onshore produced resources, hydrogen and electricity, respectively. The results illustrate the feasibility of such ferries in concordance with the Saudi Arabian strategy for reduction of CO2 emissions via the installation of renewable energy sources used to produce energy and hydrogen. Another mobile aspect is studied by Bartolucci et al. [43]. The examined system consists of a PV installation, an electrolyzer, a battery, and metal-hydride canisters, with an emphasis on the last component. The hybrid system supplies the consumption of a household, and the energy excess is transformed into hydrogen and stored in the canisters. Two canisters alternate between use in the house and a hydrogen-driven small car. Different operation modes for the canisters are considered to increase the quantity of the absorbed hydrogen. The 1-month simulations of the system operation during four different seasons demonstrate good system operation.
Lee and Lee [44] investigated an energy management strategy for a fuel cell hybrid electric bus based on nonlinear model predictive control and an adaptive equivalent consumption minimization strategy. The studied vehicle employed a 180 kW fuel cell system, whose behavior was represented using a third-order approximation of hydrogen consumption map. Simulation results demonstrated that the proposed control approach achieved lower hydrogen consumption and improved overall energy management performance compared with several benchmark strategies, highlighting its potential for enhancing the efficiency of fuel cell-powered public transportation systems. Another mobile application, a fuel cell hybrid tramway, was investigated by Tao et al. [45]. The authors proposed an energy management strategy combining dynamic programming and a state-machine-based control approach. The 280 kW fuel cell system was represented using a parabolic approximation of its performance characteristics. The results demonstrated that the proposed energy management strategy reduced hydrogen consumption while simultaneously enhancing fuel cell durability and maintaining the battery state of charge within a desirable operating range.
Unfortunately, some authors do not specify the used model of the fuel cell. This is the case with Al-Rbaihat [46], who uses TRNSYS to consider a hybrid system with PV and wind generators, an electrolyzer, a tank, and a fuel cell, located in Perth, Australia. The study is oriented toward the calculation of different parameters that estimate the performance of the system and their comparison with different literature sources.
The above review, together with the analysis presented in [47], demonstrates that the simulation of the operation of hybrid systems with renewable energy sources, mobile systems, and others, containing fuel cells, using electrochemical-based models requires detailed representations of all system elements. This is due to the nature of the electrochemical models, which are formulated in terms of voltage and current, whereas system-level studies are typically based on power and energy flows. The detailed models of the power electronics in the systems often necessitate smaller simulation step (μs or ms), which increases the simulation time and limits the applicability of electrochemical fuel cell models in system-level optimization studies that require numerous simulations over extended time horizons and involve multiple interacting system components. A frequently used alternative to these complex models in the literature is a fixed-efficiency representation of the fuel cell. While computationally efficient, this approach compromises model fidelity by neglecting load-dependent efficiency variations. Some authors use parabolic or cubic approximation models to represent hydrogen consumption as a function of fuel cell power. The main drawback of these polynomial models is the lack of information regarding the methodology used to derive the model data, as well as the absence of reported polynomial coefficients and quantitative accuracy metrics. This significantly limits their reproducibility, validation, and practical applicability.
This paper proposes a black-box (input-output) modelling approach for fuel cells based on an experimental investigation of a commercial fuel cell system. The proposed model provides a practical alternative to detailed electrochemical fuel cell models and can be readily applied by researchers and engineers involved in the integration of fuel cells into various energy systems. Its main advantage is that it does not require extensive expertise in fuel cell electrochemistry or detailed knowledge of technological parameters and design features, many of which are proprietary information and are typically not disclosed by manufacturers. Although the simplifications introduced in this model may reduce its accuracy compared with more precise electrochemical models, it still represents the behavior of the fuel cell more accurately than a fixed-efficiency representation. Furthermore, these simplifications allow the use of simpler models for other hybrid system components (power electronic converters, etc.), reducing simulation time while retaining sufficient accuracy. The model relates the electrical power required from the fuel cell by the load to the hydrogen consumption. This allows for the sizing of the required hydrogen supply (hydrogen pipeline capacity, tank capacity, electrolyzer rated power, etc.) for the system load. Consequently, the model is suitable for feasibility studies, sizing procedures, and system optimization tasks, which consider the system from an engineering perspective.
To realize the abovementioned simplified model, the following actions are performed and respectively described in the paper: an experimental platform with 1 kW PEMFC is realized in the Renewable energy sources laboratory (electrical aspects) in Technical University of Sofia; the PEMFC is investigated for different operational conditions; the simplified model of the PEMFC is synthetized on the basis of the experimental results.

2. Materials and Methods

2.1. Experimental Platform

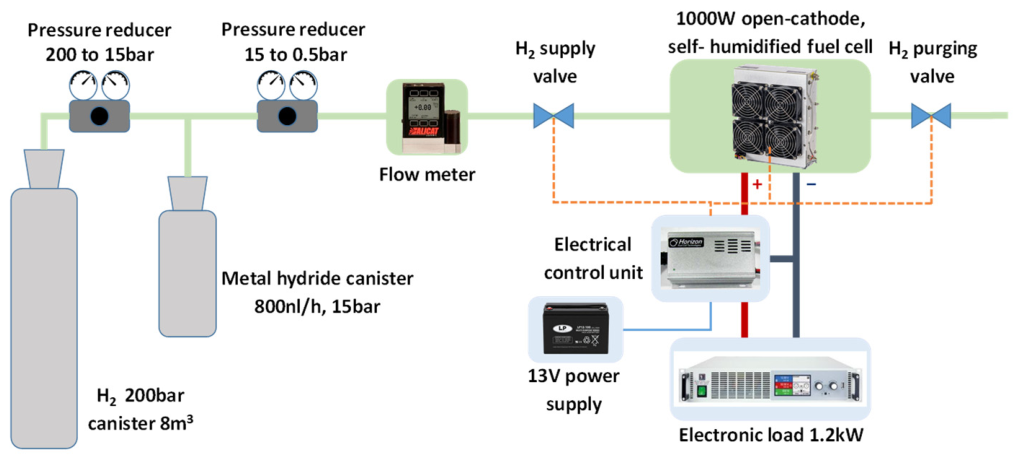
The experimental platform of the renewable energy sources laboratory (electrical aspects) at the Technical University of Sofia consists of two hydrogen canisters, two pressure reducers, a fuel cell, and an electronic load. Its schematic diagram is presented in Figure 2, where the pressure reducers contain valves and analog pressure sensors, the green line represents the hydrogen line, the orange dotted lines represent the control of the valves and of the fuel cell temperature via an air blower, and blue and red lines represent electrical connections.
The high-pressure storage canister concept is imposed by budget constraints and replaces an electrolyzer and a compressor as a source of hydrogen. The metal-hydride canister ensures a buffer between the high-pressure source and the fuel cell and supplies the fuel cell for low powers. The used metal hydride storage canister is Heliocentris MHS 800 (Heliocentris Academia International GmbH, Berlin, Germany). This metal hydride storage canister allows safe and compact storage of relatively large amounts of hydrogen gas at low pressures. The parameters of the used storage canister are presented in Table 2.
The flow of hydrogen gas in the system is measured by an M-20 SLPM-D mass flow meter by Alicat Scientific (Duiven, The Netherlands). The flow meter uses laminar differential pressure technology and is able to measure mass flow, volumetric flow, temperature, and pressure. Some of its parameters are presented in Table 3.
The fuel cell used in this study is an open-cathode PEM fuel cell by Horizon Educational (Horizon Fuel Cell Europe, s.r.o., Prague, Czech Republic). The fuel cell is of type H-1000 with a rated power of 1000 W and is equipped with an FCS-1000 short circuit unit (SCU). The main parameters of the fuel cell are presented in Table 4.
During the experiments, the fuel cell was loaded by a programmable electronic DC load “EA-EL 9080-85 B HP” by EA-Elektro-Automatik GmbH (Viersen, Germany). The load supports four common regulation modes: constant voltage, constant current, constant power, and constant resistance. Some of the more important technical specifications of the programmable load are presented in Table 5.
To ensure the safety of operation, a Dräger Polytron SE Ex sensor for flammable gases is used with a Dräger PointGard 3200 gas detection system. They are produced by Drägerwerk AG & Co. KGaA (Lübeck, Germany) and ensure the proper detection and signalization of hydrogen gas leaks, as well as the activation of an air purifying system in the laboratory.

2.2. Experiments

All measurements were performed using a laboratory fuel cell unit and test station under controlled operating conditions, including voltage, current, power, hydrogen flow rate, pressure monitoring, and temperature measurement. The investigated PEMFC is an open-cathode, self-humidified fuel cell; therefore, no external humidification control was applied. The operating conditions were maintained within the limits specified by the manufacturer, ensuring stable and reproducible experimental conditions for the evaluation of the investigated parameters.
The electrochemical characterization of the PEM fuel cell stack was performed using a galvanostatic polarization method with a 1 kW electronic load. Before the measurements, the operating temperature of the stack was monitored by means of a Model H2 infrared thermal camera to ensure stable thermal conditions throughout the experiments. The stack was subjected to a series of constant-current operating points, and the voltage response was recorded after reaching steady-state conditions at each current level. In parallel, the hydrogen consumption was continuously measured, allowing the evaluation of fuel utilization and system efficiency as a function of the produced electrical power.
In addition to the steady-state polarization measurements, dynamic transient response tests (DTSTs) were carried out using the same experimental setup and measurement procedure. During these tests, the stack was exposed to predefined dynamic current profiles designed to simulate transient operating conditions. The corresponding voltage response, stack temperature, and hydrogen consumption were continuously monitored and recorded to assess the dynamic performance and operational stability of the system.

2.3. Fuel Cell Model Synthesis and Limitations

The proposed model is intended as a system-level empirical model that represents the overall behavior of the complete fuel cell system rather than a detailed electrochemical model in which all internal operating variables are independently controlled. As stated above, the model aims to determine the hydrogen consumption for a given fuel cell electrical power. The model is developed under the following assumptions:
  • The model is based on experimental data, and the use of a commercially available fuel cell together with its original control system was a deliberate methodological choice, as it reflects the conditions under which such systems operate in practical engineering applications.
  • The fuel cell temperature is controlled by the fuel cell integrated cooling system according to the manufacturer’s control algorithm, and its influence is not considered in the simplified model.
  • The fuel cell uses self-humidification, but neither this parameter nor other operational parameters are considered in the simplified model.
  • The inlet hydrogen pressure is sufficient to maintain stable operation of the fuel cell up to its rated power.
The developed simplified model of the investigated PEM fuel cell is based on the experimental data obtained for different loads and hydrogen pressures. The hydrogen consumption is measured with a mass flow meter, while the load is imposed by an electronic load, both described above. For each pressure, the relationship between the hydrogen consumption and electrical power is determined and then fitted using Matlab’s Curve Fitting Toolbox. The obtained curve approximations are analyzed; thereafter, a unified modelling equation is proposed with some additional assumptions.
The simplifications in the model, obviously, highlight some limitations:
  • The aging of the fuel cell is not taken into account. One of the reasons is that the laboratory experiments do not allow the simulation of aging. The other reason that the presented simplified model cannot take the aging of the fuel cell into account, by using different strategies like the one presented in [48], is because the aim of the model is to avoid the determination and, respectively, the use of voltage and current.
  • The dependence of the fuel cell performance on the temperature is not considered. Despite the well-known influence of the temperature, the aim of the model is to avoid the consideration of operational parameters. Thus, the improvement of the cell performance with special thermal control [49] or the possibility for better health monitoring [50] are not taken into account.
These limitations can be overcome in further improvements of the model.

3. Results

3.1. Experimental Study of the Fuel Cell

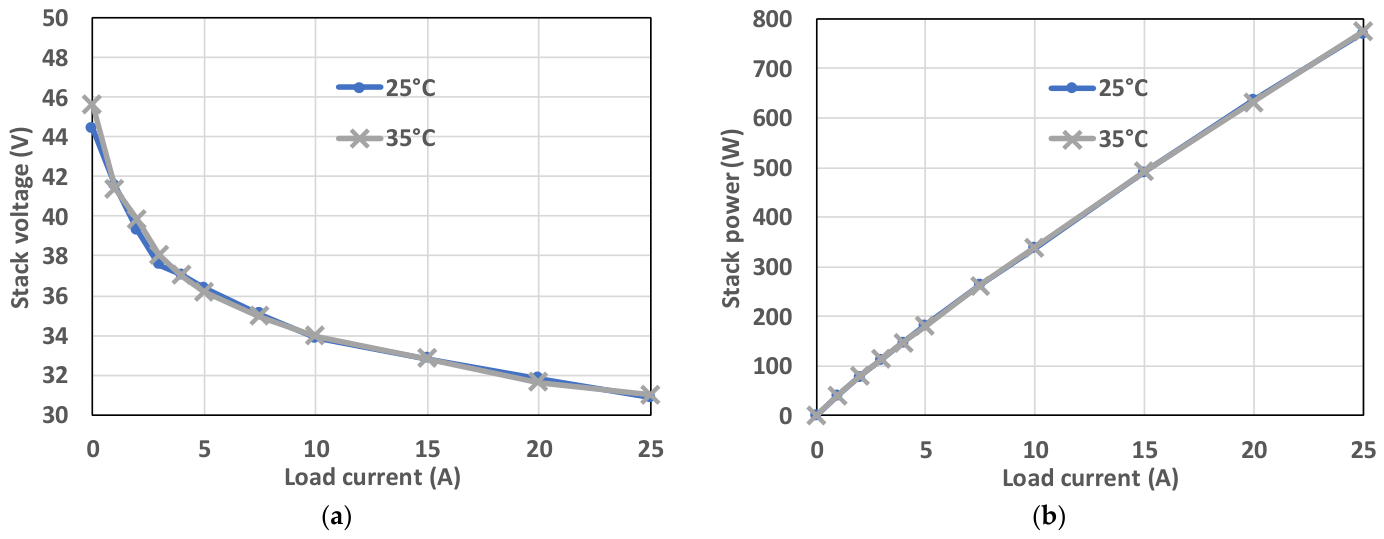
The fuel cell stack was experimentally connected and investigated according to the methodology described in Section 2.2. Although PEM fuel cells are typically capable of operating at temperatures above 60–80 °C, elevated temperatures may adversely affect the water management of the polymer electrolyte membrane. Insufficient membrane hydration can increase the membrane resistance, reduce proton conductivity, and consequently deteriorate the overall fuel cell performance. Therefore, the experiments in this study were intentionally conducted at relatively low operating temperatures to ensure stable membrane hydration and reproducible experimental conditions. The environmental conditions during the experiments were 1004 hPa atmospheric pressure and 47% relative air humidity. The maximal allowed operating pressure was maintained at 0.8 bar (gauge pressure) in accordance with the manufacturer’s specifications. The pressure values below correspond to gauge pressure. Before the experiment, the ohmic resistances were measured using a Hioki (Nagano, Japan) resistance measurement instrument, and the average value was 15.5 mΩ per cell. The measurement was performed on an individual cell, and the reported value corresponds to the arithmetic mean obtained from five independent measurements. Polarization curves were recorded under quasi-steady-state operating conditions by gradually increasing the load current and allowing the system to reach stable operation at each measurement point. The resulting current–voltage characteristics are presented in Figure 3. Figure 3a presents the polarization curves of the investigated fuel cell stack measured at operating temperatures of 25 °C (room temperature) and 35 °C, while Figure 3b presents the respective power curves. The polarization curves exhibit the typical behavior of PEM fuel cells, characterized by an initial voltage drop associated with activation losses, followed by a nearly linear region dominated by ohmic losses. A slight improvement in cell voltage is observed at 35 °C in the low-current region, indicating enhanced electrochemical reaction kinetics and reduced activation polarization. The relatively small temperature difference of 10 °C between the two investigated operating conditions is not expected to produce a substantial change in the overall PEMFC performance. Within this near-ambient temperature range, the beneficial effects of slightly improved electrochemical kinetics are largely compensated by thermodynamic and membrane hydration effects. Consequently, the operating conditions may be considered effectively constant for the purpose of the simplified model developed in this study. However, at higher current densities, the polarization curves nearly overlap, suggesting a negligible influence of temperature on the stack’s ohmic resistance within the investigated temperature range. The corresponding power curves show a continuous increase in output power with increasing current, reaching a maximum value of approximately 780 W at 25 A. The negligible difference between the power characteristics at 25 °C and 35 °C confirms that the investigated temperature increase has a limited effect on the overall stack performance under medium and high load conditions, which justifies the assumption of the simplified model cited in Section 2.3. These results indicate that moderate temperature elevation primarily affects the activation-controlled region, while the overall electrochemical performance and maximum power output of the fuel cell stack remain practically unchanged within the temperature range investigated.
In order to investigate the influence of operating pressure on the electrochemical performance of the fuel cell stack, additional polarization measurements were conducted at pressures lower than the maximal allowed operating pressure of 0.8 bar. The polarization curves were recorded under identical experimental conditions to ensure a reliable comparison of the stack performance.
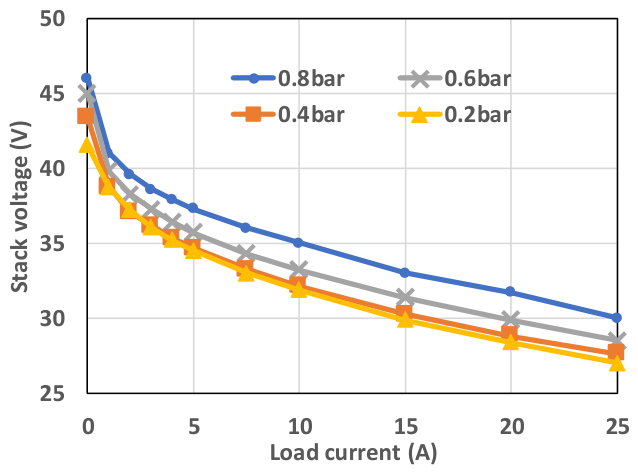
Figure 4 presents the polarization curves of the investigated fuel cell stack recorded at operating pressures ranging from 0.2 to 0.8 bar with a step of 0.2 bar. The results demonstrate a clear improvement in stack performance with increasing pressure over the entire current range. The open-circuit voltage increases from approximately 41.5 V at 0.2 bar to 45.5 V at 0.8 bar, which is consistent with the Nernst equation. The higher reactant partial pressures increase the equilibrium cell potential and reduce thermodynamic losses. In the low-current region, where activation losses dominate, the voltage drop becomes less pronounced at higher pressures, indicating improved electrochemical reaction kinetics. At higher current loads, the polarization curves exhibit similar slopes, suggesting that the stack ohmic resistance remains practically unchanged. Nevertheless, the higher-pressure curves are shifted toward higher voltage values, confirming the positive effect of pressure under different operating conditions. At a load current of 25 A, the stack voltage increases from approximately 24.8 V at 0.2 bar to 28.2 V at 0.8 bar, corresponding to an increase in output power of about 14%. No significant concentration polarization is observed within the investigated operating range, indicating sufficient reactant supply to the electrodes.
The experiments presented below aim to fully study and characterize the fuel cell and its stability under changing operational conditions. To investigate the actual effects of pressure, transient response tests of the fuel cell were conducted across a wide range of operating conditions, including step changes in load current from low to high values. The obtained results are presented in Figure 5.
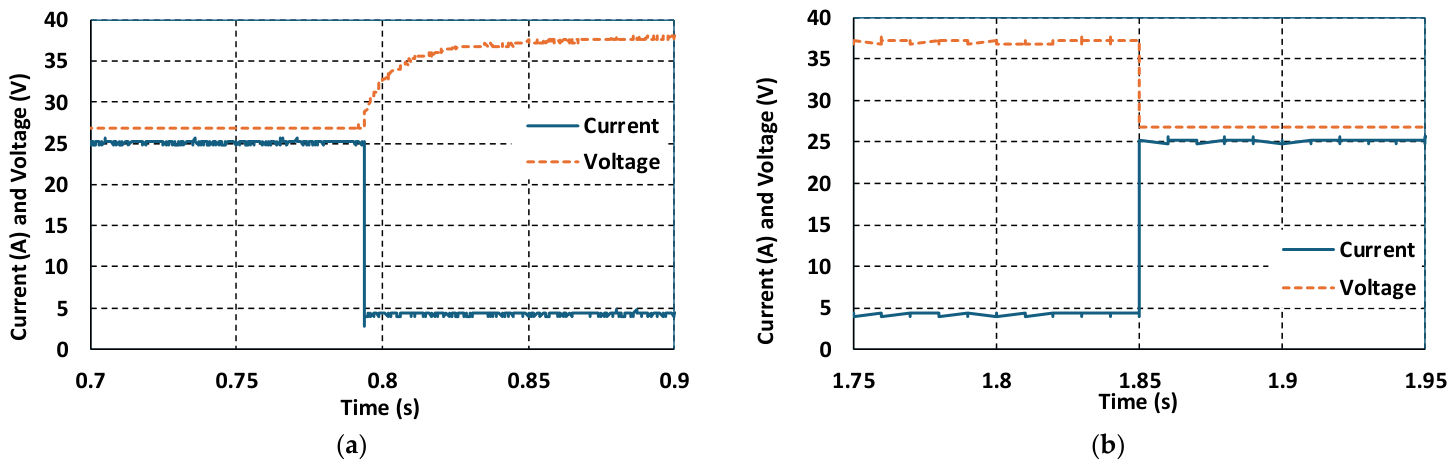
Figure 5a,b present the dynamic voltage response of the fuel cell under abrupt step changes in current load, corresponding to high-to-low and low-to-high transitions, respectively. These measurements are used to evaluate transient electrochemical behavior, capacitive effects, and mass transport limitations within the membrane-electrode assembly. In Figure 5a, a step-down current change occurs at t ≈ 0.79 s, where the load decreases from 25 A to 4.5 A. Although the current change is instantaneous, the voltage exhibits a short exponential relaxation (~50 ms) before stabilizing at approximately 38 V. This response is mainly attributed to double-layer capacitance effects and reactant redistribution in the gas diffusion layers. In Figure 5b, a step-up current change at t = 1.85 s increases the load from 4.5 A to 25 A. The voltage drops immediately from ~37 V to ~27 V, reflecting dominant ohmic losses at high current density. The absence of significant voltage undershoot indicates efficient reactant supply and effective water management, suggesting no severe mass transport limitations. Overall, the results confirm fast transient response behavior governed mainly by double-layer capacitance, combined with stable operation under rapid load variations and minimal transport constraints.
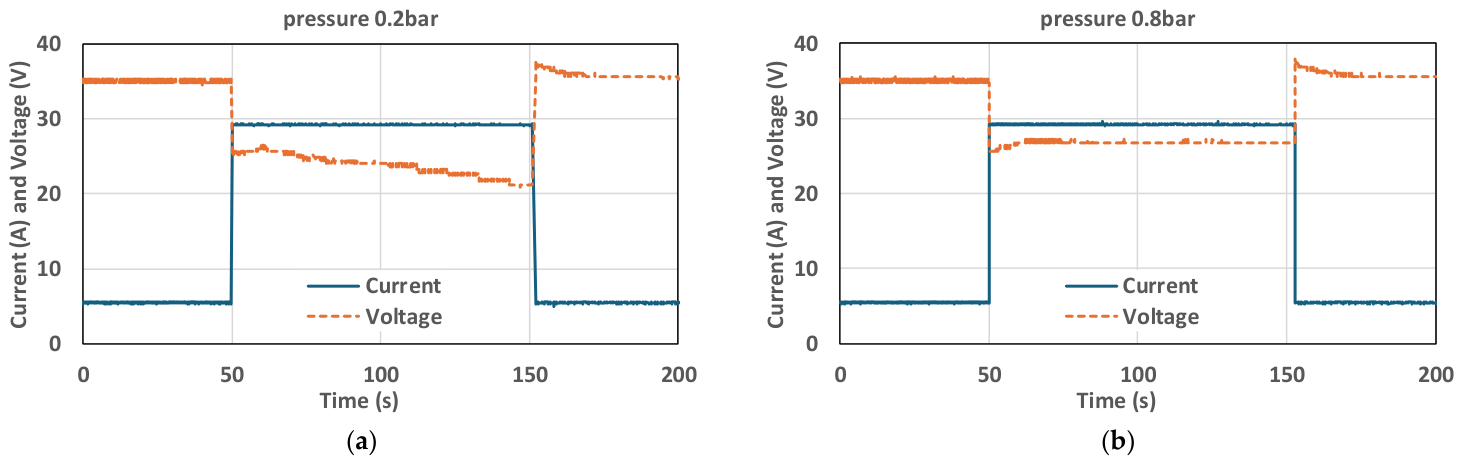
To estimate the effect of the hydrogen pressure during step variations of the load current, experiments are performed for different pressure values and with different time scales of the oscilloscope, which allow observations over a longer time period instead of focusing on the transient process. The results for low (0.2 bar) and high (0.8 bar) pressure for combined low-to-high and high-to-low current transitions are presented in Figure 6a and Figure 6b, respectively. At low pressure (0.2 bar), a step increase in load at t = 50 s leads to continuous voltage degradation from approximately 26 V to 21 V over the 100 s interval. This behavior is characteristic of severe mass transport limitations, primarily associated with oxygen starvation and liquid water accumulation in the gas diffusion layer (GDL). The insufficient gas flow at low pressure restricts water removal and impedes oxygen diffusion to the catalyst layer, resulting in progressive performance loss.
In contrast, at higher pressure (0.8 bar), the fuel cell exhibits stable dynamic behavior. After the initial transient at t = 50 s, the voltage rapidly stabilizes at approximately 27 V with no significant long-term degradation. The improved performance is attributed to increased reactant partial pressures, enhanced oxygen availability, and more effective convective water removal, which together suppress flooding and improve mass transport within the porous structure. Upon load reduction at t = 150 s, both cases exhibit a temporary voltage overshoot; however, the recovery at 0.2 bar is slower, indicating residual liquid water accumulation and delayed pore reactivation. Overall, the results demonstrate that higher operating pressure significantly enhances transient stability by mitigating mass transport limitations, improving water management, and sustaining higher steady-state voltage levels under dynamic loading conditions.
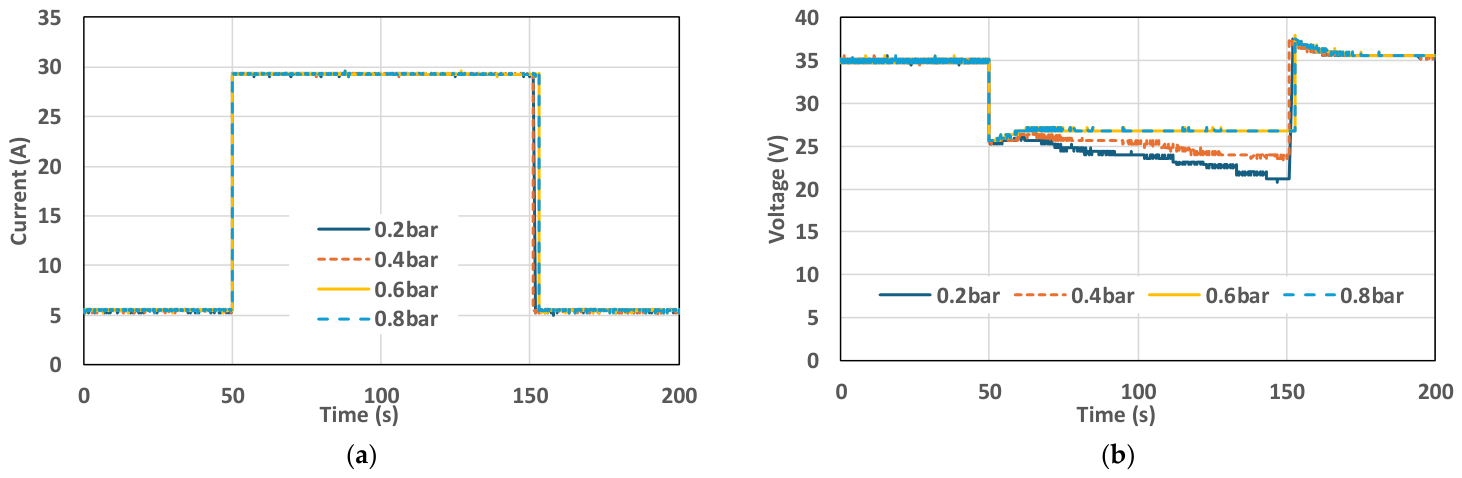
The different transient processes for various hydrogen pressures are compared in Figure 7. The variation of the current (Figure 7a) is imposed by the electronic load, which explains the step form of the current. The step change from 30 A to 5 A is performed manually. This causes small differences in the time of the beginning of the current decrease. Figure 7b shows the variation of the voltage for different hydrogen pressures. For higher pressures (0.6 and 0.8 bar), the voltage values are very close, whereas lower pressure leads to a noticeable voltage drop at high load (30 A).
The presented results provide a comprehensive overview of the dynamic response of the fuel cell system by correlating the imposed current profile with the corresponding voltage transients across four operating pressures (0.2, 0.4, 0.6, and 0.8 bar). This combined analysis enables a clear qualitative and quantitative assessment of the influence of operating pressure on system stability under highly dynamic loading conditions. The load current profile remains identical for all experiments, ensuring full comparability of the results. A constant low-load regime of 5 A is applied in the intervals 0–50 s and 150–200 s, while a step increase to 30 A is imposed between 50–150 s, representing a severe high-load operating condition for the fuel cell. The corresponding voltage response reveals a distinct pressure-dependent transition in performance stability. As mentioned above, at low pressure (0.2 bar) and high load current, the voltage deteriorates due to severe mass transport limitations. At intermediate pressure (0.4 bar), the degradation trend is partially mitigated; however, a slow decline in voltage from approximately 26 V to 24 V persists, indicating that mass transport processes remain only partially sufficient to sustain steady-state operation under high current density. In contrast, at elevated pressures (0.6 and 0.8 bar), the voltage response is highly stable, forming a nearly constant plateau at approximately 27 V throughout the entire high-load interval. The convergence of the two curves indicates that a critical pressure threshold is reached, beyond which efficient water evacuation and enhanced reactant partial pressures ensure stable electrochemical operation without significant mass transport losses. Following load removal at t = 150 s, all cases exhibit a transient voltage overshoot associated with double-layer relaxation and rapid redistribution of reactants. However, the recovery time is significantly longer at lower pressures, further confirming the presence of residual liquid water and slower pore reactivation dynamics. Overall, the results demonstrate the existence of a clear pressure threshold governing transient fuel cell stability. Operating above this threshold (≥0.6 bar according to our experiments) effectively suppresses mass transport limitations, ensures stable voltage output under high current demand, and enhances overall electrochemical performance under dynamic conditions.

3.2. Simplified Model of PEM Fuel Cell

The galvanostatic polarization method experiments presented above enable the determination of the hydrogen consumption for a given fuel cell power output. Such information is essential for the analysis and optimization of hybrid systems, as it is required for time domain simulations of system operation. Using Matlab’s Curve Fitting Tool, an approximation of the hydrogen mass flow rate M F H 2 as a function of the produced electrical power PFC is obtained. The equation describing the fit is a third-degree polynomial, which gives precise results in combination with simplicity:
M F H 2 = p 1 P F C 3 + p 2 P F C 2 + p 3 P F C + p 4 ,
where p1, p2, p3, and p4 are the polynomial coefficients.
Equation (6) describes the hydrogen mass flow rate as a function of the electrical power generated by the fuel cell stack. Although hydrogen consumption is directly related to the electrochemical reaction rate and stack current by Faraday’s law, electrical power is the more relevant operating variable for system-level energy-management applications. Due to the nonlinear dependence of stack voltage on current, arising from activation, ohmic, and mass transport losses, the relationship between hydrogen consumption and stack power is inherently nonlinear. Accordingly, a third-order polynomial is employed in Equation (6) to approximate this relationship over the operating range considered. The resulting formulation provides an explicit representation of the fuel-cell hydrogen consumption characteristic while maintaining low computational complexity, making it particularly suitable for long-term system-level simulations.
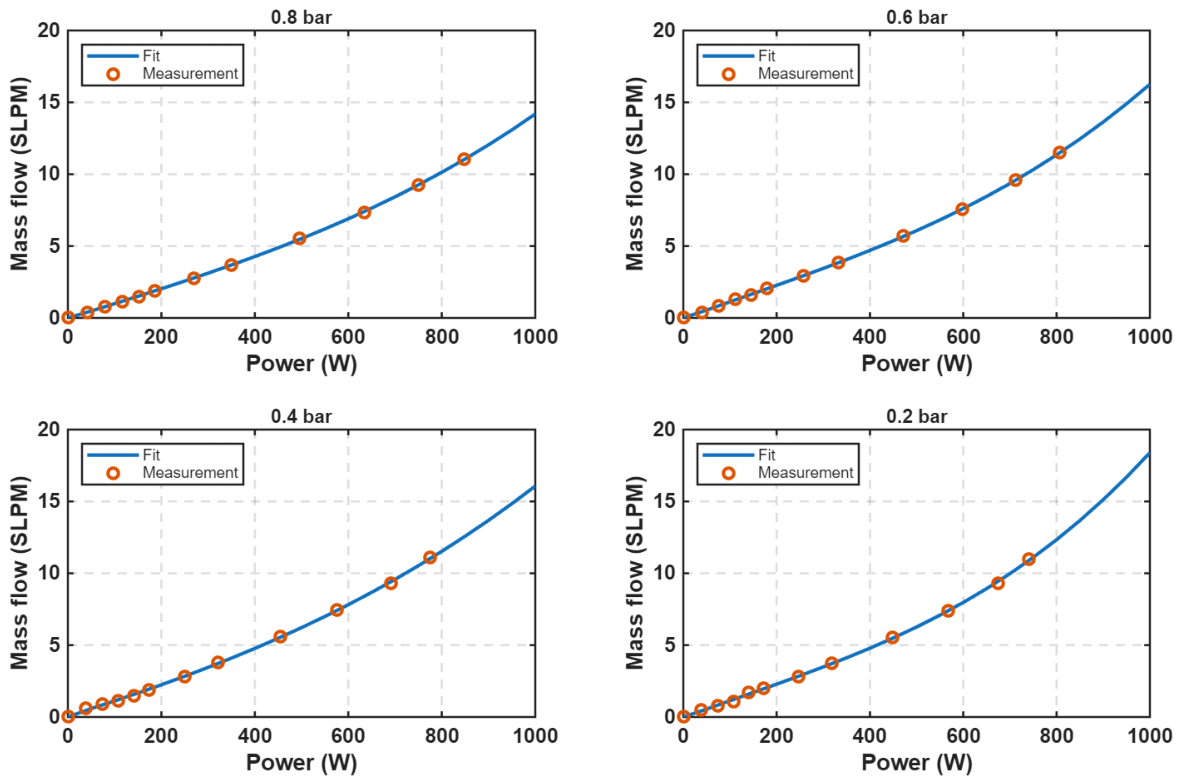
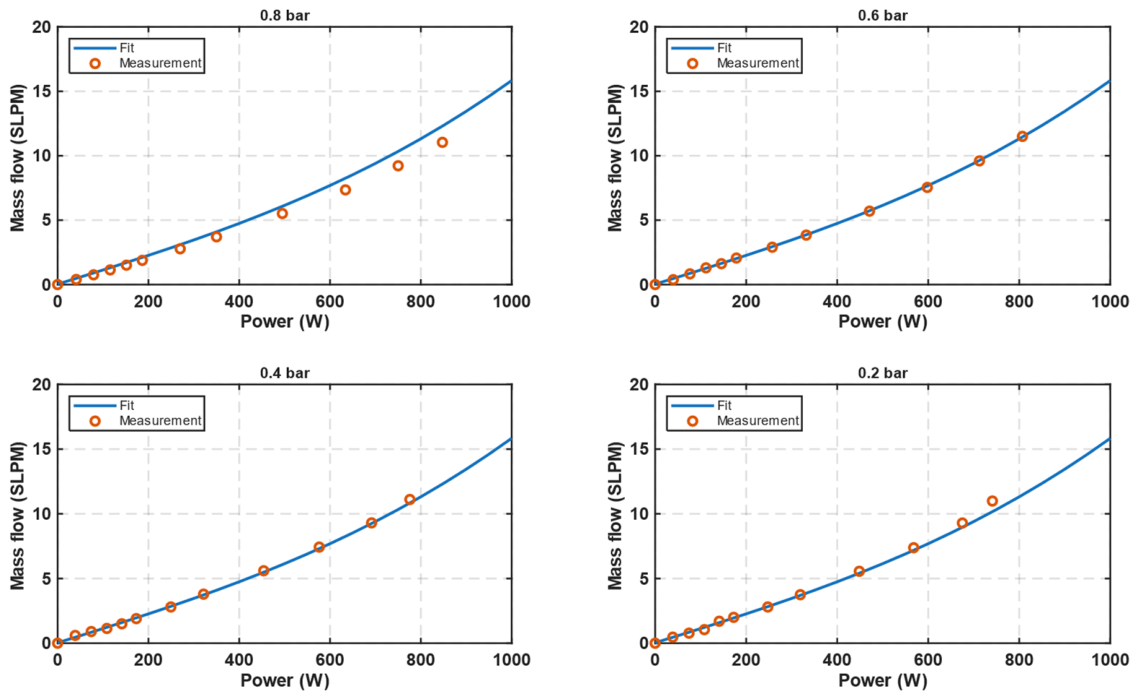
The obtained approximations of the experimental data at hydrogen pressures of 0.8, 0.6, 0.4, and 0.2 bar are presented in Figure 8. The polynomial coefficients for these curves are summarized in Table 6, while the respective goodness-of-fit parameters are in Table 7.
The presented results show the good quality of the performed approximation and allow for the application of the proposed model for different purposes.
However, the hydrogen pressure represents a model variable, which complicates the model. A simplification is possible if we assume that the model is independent of the pressure. For this purpose, on the basis of the results presented above, new polynomial coefficients are synthetized (see Table 8), which give excellent approximation for two curves: at 0.4 and 0.6 bar. These pressures are just outside the interval of the fuel cell’s rated pressure (0.45–0.55 bar, see Table 4). The fits obtained with the proposed polynomial model and the experimental data for the different hydrogen pressures are presented in Figure 9. The respective goodness-of-fit parameters are summarized in Table 9. These results show a good correlation between the experimental data and the fitting curves for all pressures (see the R-Square parameter). More important is the low relative root mean square error calculated for the pressures close to the rated operating conditions (~1.37% for 0.6 bar and ~2.99% for 0.4 bar).
These results confirm the applicability of the proposed model for fuel cell operation at rated hydrogen pressure and demonstrate its suitability for further application.
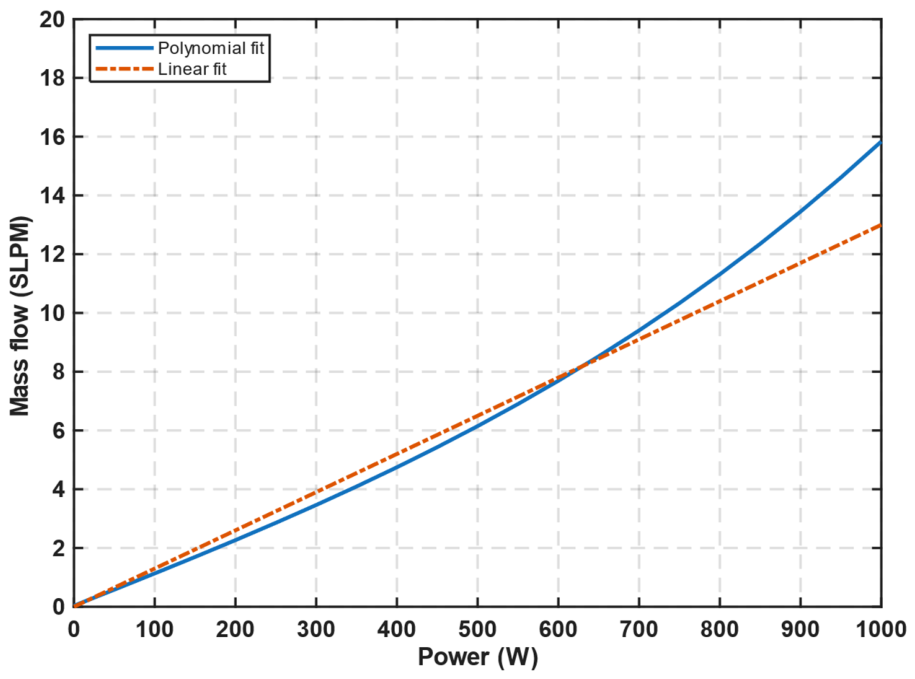
For applications requiring less computational power, the proposed polynomial fuel cell model is further simplified by linearization using the manufacturer’s rated hydrogen consumption data. Figure 10 presents a comparison between the linear and polynomial approximations. The results show that, in the power range from 0 to approximately 650 W, the linear model predicts higher hydrogen consumption than the polynomial model, whereas at higher power levels, it underpredicts the consumption.
Table 10 summarizes the goodness-of-fit parameters of the linear model in comparison with the experimental data at different pressures and with the proposed cubic polynomial model. As expected, the accuracy of the linear model is lower than that of the cubic polynomial model (shown in Table 9). For pressures at the boundaries of the manufacturer-recommended range (0.4 and 0.6 bar), the RRMSE of the linear model is approximately 10%, increasing to about 15% at the maximum allowed hydrogen pressure (0.8 bar). The RRMSE of the linear model compared to the polynomial model is around 10%. It should be noted that the main contribution to the RRMSE of the linear model comes from the power range above 800 W. Consequently, for power levels up to approximately 80% of the rated power, the linear model provides a reasonable first-order approximation within the investigated operating range. These results suggest that linearization of the hydrogen consumption versus power relationship can provide a practical approximation for preliminary system-level analyses when only manufacturer data are available and high prediction accuracy is not essential. This is often the case in feasibility studies and early-stage design of complex hybrid renewable energy systems incorporating fuel cells. Nevertheless, the applicability of this approximation outside the investigated operating conditions should be verified through further validation.

4. Conclusions and Discussion

The paper presents an approach for experimental study of a 1 kW PEM fuel cell, which provides the necessary data for the development of a fuel cell model of the type “input-output,” representing the hydrogen consumption as a function of the required electrical power. The provided literature review shows that three main types of fuel cell models are commonly used: complex (from an engineering point of view) electrochemical model, a simple constant-efficiency representation, and polynomial approximation. The first approach complicates the modelling and simulation of hybrid systems with renewable energy sources and fuel cells. The second one significantly decreases the precision of the calculations. The practical use of the third approach is constrained by the limited availability of published model parameters and validation data, which hinders model reproduction and broader application. Therefore, the proposed approach yields a fuel cell model that combines simplicity, satisfactory accuracy, and reproducibility, making it suitable for practical engineering applications.
For this purpose, an experimental platform was created at the Technical University of Sofia, which permits the experimental studies of a commercially available PEM fuel cell with its original control system. The studied fuel cell is supplied with hydrogen from two canisters (one with 200 bar pressure and one metal-hydride). The hydrogen mass flow is measured with a dedicated flow meter, while the load of the fuel cell is controlled by an electronic load.
Two groups of experiments are performed on the studied fuel cell.
In the first group, the polarization (voltage–current) curves and the power–current curves of the FC stack are determined for different cell temperatures (25 °C and 35 °C) and for hydrogen gauge pressures ranging from 0.2 to 0.8 bar with a step of 0.2 bar. The upper pressure limit corresponds to the maximum value allowed by the manufacturer. The different points of the characteristics are obtained at steady-state conditions, and the hydrogen consumption is recorded for each load. The analysis of the voltage–current and power curves at different temperatures for constant hydrogen pressure indicates that the influence of cell temperature can be neglected within the considered range and operating conditions.
The second group of experiments investigates the fuel cell behavior during high-to-low and low-to-high step changes in load current. The recorded current and voltage waveforms show the fuel cell’s dynamic performance and allow for the comparison of the voltage transient responses at different hydrogen pressures and time intervals.
The mathematical model proposed by the authors enables the calculation of the hydrogen mass flow rate as a function of the produced electrical power of a PEM fuel cell stack. The model is developed using experimental data for mass flow and load power of the fuel cell for different hydrogen pressures. First, the data are fitted with third-order polynomial functions with different coefficients for each pressure level. These approximations demonstrate very good precision with RRMSE values below 3%. In the next stage, a simplified polynomial model (with new polynomial coefficients), independent of hydrogen pressure, is derived. This model maintains good accuracy, particularly for pressures 0.4 and 0.6 bar, with RRMSE values of 2.99% and 1.37%, respectively. These two pressures are just outside the fuel cell recommended pressure boundaries (0.45–0.55 bar). At pressures outside the recommended operating range, the model error increases to approximately 7% at 0.2 bar and 15% at 0.8 bar, indicating that the highest accuracy is achieved near the recommended operating conditions. Nevertheless, the obtained accuracy is sufficient for the application of the proposed model in simulations of fuel cell operation and in optimization studies of hybrid renewable energy systems, provided that the model assumptions and limitations are taken into account. It should be emphasized that the proposed polynomial model is an operational reduced-order model rather than a universal electrochemical model. Consequently, its applicability is limited to the range of operating conditions investigated in this study. Significant variations in temperature or other operating parameters beyond this range may reduce the model accuracy and require recalibration of the model coefficients.
Further, for some practical applications, where high precision is not required, a linear approximation model based on the manufacturer’s data is proposed. The linearization introduces about 10% of RRMSE for the hydrogen pressure range 0.4 to 0.6 bar. For a fuel cell user who does not have accurate measurement systems, but only the manufacturer’s data, this error is acceptable.
The proposed approach can be applied to the modelling of different fuel cells, and the simplified model can be readily adapted to different fuel cell types and control strategies by appropriately adjusting the polynomial coefficients. The developed models are suitable for different system-level simulation studies, including the design, sizing, optimization, and performance assessment of hybrid energy systems incorporating fuel cells. By accurately estimating hydrogen consumption, the model enables the proper sizing of hydrogen supply infrastructure, such as storage systems, pipelines, and hydrogen production units, thereby ensuring reliable system operation. Owing to its simplicity and computational efficiency, the proposed model can be easily implemented in a variety of software platforms used for system-level simulation and analysis of hybrid energy systems.

Author Contributions

Conceptualization, V.L., L.S. and G.B.; methodology, V.L., L.S. and G.B.; software, I.B.; validation, G.B., L.S., I.B. and V.M.; formal analysis, Z.Z.; investigation, G.B. and L.S.; resources, G.B. and I.B.; data curation, G.B., L.S., I.B. and V.M.; writing—original draft preparation, G.B. and L.S.; writing—review and editing, I.B. and Z.Z.; visualization, G.B., L.S. and I.B.; supervision, V.L. and Z.Z.; project administration, L.S.; funding acquisition, L.S. All authors have read and agreed to the published version of the manuscript.

Funding

This research was funded by the Bulgarian National Science Fund grant № KΠ-06-H77/2 project “Research and optimization of hybrid system with renewable energy sources for power supply of livestock farm”.

Institutional Review Board Statement

Not applicable.

Informed Consent Statement

Not applicable.

Data Availability Statement

The original contributions presented in this study are included in the article. Further inquiries can be directed to the corresponding author.

Conflicts of Interest

The authors declare no conflicts of interest. The funders had no role in the design of the study; in the collection, analyses, or interpretation of data; in the writing of the manuscript; or in the decision to publish the results.

Abbreviations and Symbols

The following abbreviations are used in this manuscript:
APre-exponential factor
AFCAlkaline fuel cell
CHPCombined heat and power
DSTDynamic stress test
EActual cell voltage
E0Standard reversible potential (1.23 V)
EaApparent activation energy
Ea,anodeActivation energy associated with the hydrogen oxidation reaction
Ea,cathodeActivation energy associated with the oxygen reduction reaction
Ea,ohmicApparent activation energy related to proton transport through the membrane and other ohmic losses within the membrane-electrode assembly
FFaraday’s constant (96,485 C/mol)
GDLGas diffusion layer
G-o-FGoodness-of-fit
HORHydrogen oxidation reaction
iCurrent density
MEAMembrane electrode assembly
M F H 2 Hydrogen mass flow
nNumber of electrons transferred in the electrochemical reaction
ORROxygen reduction reaction
p1Coefficient of the cubic term in the polynomial
p2Coefficient of the quadratic term in the polynomial
p3Coefficient of the linear term in the polynomial
p4Coefficient of the constant term in the polynomial
PFCProduced electrical power of the fuel cell
P H 2 Partial pressures of hydrogen
P H 2 O Partial pressures of water
P O 2 Partial pressures of oxygen
PEMFCPolymer electrolyte membrane or proton exchange membrane fuel cell
PVPhotovoltaic
RUniversal gas constant (8.314 J/(molK))
RMSERoot mean square error
RRMSERelative root mean square error
SLPMStandard liter per minute
SSESum of squared errors
TAbsolute temperature in K
UPSUninterruptible power supply

References

  1. Ammar, M.; Oyewale, B.O.; Elseragy, A.; Albayati, I.M.; Aliyu, A.M. A Global Review of Blue and Green Hydrogen Fuel Production Technologies, Trends and Future Outlook to 2050. Fuels 2025, 6, 88. [Google Scholar] [CrossRef] [Scilit]
  2. Osuizugbo, I.C.; Awuzie, B.O. Mapping the Global Research Trends on Pro-Sustainability Behaviours in the Built Environment: A Systematic Review. Sustainability 2026, 18, 3718. [Google Scholar] [CrossRef] [Scilit]
  3. Begáni, M.; Javorská, M.; Bednárová, L.; Molokáč, M. Comparative Assessment of Next-Generation Hydrogen Production Technologies: Insights from Hydrogen Expo Hamburg 2025. Clean Technol. 2026, 8, 82. [Google Scholar] [CrossRef] [Scilit]
  4. Mokrzycki, E.; Gawlik, L. The Role of Green Hydrogen in Decarbonizing the Refining and Petrochemical Industries. Energies 2026, 19, 977. [Google Scholar] [CrossRef] [Scilit]
  5. Karmaker, S.C.; Chapman, A.; Sen, K.K.; Hosan, S.; Saha, B.B. Renewable Energy Pathways toward Accelerating Hydrogen Fuel Production: Evidence from Global Hydrogen Modeling. Sustainability 2023, 15, 588. [Google Scholar] [CrossRef] [Scilit]
  6. Cigolotti, V.; Genovese, M.; Fragiacomo, P. Comprehensive Review on Fuel Cell Technology for Stationary Applications as Sustainable and Efficient Poly-Generation Energy Systems. Energies 2021, 14, 4963. [Google Scholar] [CrossRef] [Scilit]
  7. Zimprich, S.; Dávila-Portals, D.; Matthiesen, S.; Gwosch, T. New Control Strategy for Heating Portable Fuel Cell Power Systems for Energy-Efficient and Reliable Operation. Machines 2022, 10, 1159. [Google Scholar] [CrossRef] [Scilit]
  8. Wu, Q.; Dong, Z.; Zhang, X.; Zhang, C.; Iqbal, A.; Chen, J. Towards More Efficient PEM Fuel Cells Through Advanced Thermal Management: From Mechanisms to Applications. Sustainability 2025, 17, 943. [Google Scholar] [CrossRef] [Scilit]
  9. Mo, S.; Du, L.; Huang, Z.; Li, S.; Chang, S.; Zhao, Y.; Jiang, Z. Recent Advances on PEM Fuel Cells: From Key Materials to Membrane Electrode Assembly. Electrochem. Energy Rev. 2023, 6, 28. [Google Scholar] [CrossRef] [Scilit]
  10. Dafalla, A.M.; Wei, L.; Habte, B.T.; Guo, J.; Jiang, F. Membrane Electrode Assembly Degradation Modeling of Proton Exchange Membrane Fuel Cells: A Review. Energies 2022, 15, 9247. [Google Scholar] [CrossRef] [Scilit]
  11. Nasser, B.; Kazim, H.; Sabri, M.; Tawalbeh, M.; Al-Othman, A. AI in Membrane Design and Optimization for Hydrogen Fuel Cells. Membranes 2026, 16, 97. [Google Scholar] [CrossRef] [Scilit] [PubMed]
  12. Karmakar, A.; Sarker, M.; Najafianashrafi, Z.; Mora, J.M.; Kakati, N.; Chuang, P.-Y.A. Influence of Ionomer Overcoating on the Interfacial Properties and Performance of Gas Diffusion Electrode-Based Proton Exchange Membrane Fuel Cells. Energies 2026, 19, 2728. [Google Scholar] [CrossRef] [Scilit]
  13. Irshad, H.M.; Shahgaldi, S. Comprehensive Review of Bipolar Plates for Proton Exchange Membrane Fuel Cells with a Focus on Materials, Processing Methods and Characteristics. Int. J. Hydrogen Energy 2025, 111, 462–487. [Google Scholar] [CrossRef] [Scilit]
  14. Yu, C.; Luo, L.; Han, Y.; Mao, P.; Liu, Y. Multiphysics and Multiscale Modeling of PEM Water Electrolyzers: From Transport Mechanisms to Performance Optimization. Energies 2026, 19, 2361. [Google Scholar] [CrossRef] [Scilit]
  15. Ustuner, G.; Hung, Y.; Mahajan, D. Investigation of Proton Exchange Membrane Fuel Cell Performance by Exploring the Synergistic Effects of Reaction Parameters via Power Curve and Impedance Spectroscopy Analysis. Energies 2024, 17, 2530. [Google Scholar] [CrossRef] [Scilit]
  16. Panaitescu, F.-V.; Chivu, R.-M.; Panaitescu, M.; Voicu, I. Dynamic Response Characteristics of PEM Fuel Cells: Enabling Stable Integration of Wind Power and Green Hydrogen. Sustainability 2026, 18, 4165. [Google Scholar] [CrossRef] [Scilit]
  17. Ali, M.A.; Mandour, M.E.; Lotfy, M.E. Optimal Adaptive Modeling of Hydrogen Polymer Electrolyte Membrane Fuel Cells Based on Meta-Heuristic Algorithms Considering the Membrane Aging Factor. Fuels 2025, 6, 30. [Google Scholar] [CrossRef] [Scilit]
  18. Bai, B.; Chen, Y.-T. Simulation of the Oxygen Reduction Reaction (ORR) Inside the Cathode Catalyst Layer (CCL) of Proton Exchange Membrane Fuel Cells Using the Kinetic Monte Carlo Method. Energies 2018, 11, 2529. [Google Scholar] [CrossRef] [Scilit]
  19. Nizameev, I.R.; Kadirov, D.M.; Nizameeva, G.R.; Sabirova, A.F.; Kholin, K.V.; Morozov, M.V.; Mironova, L.G.; Zairov, R.R.; Minzanova, S.T.; Sinyashin, O.G.; et al. Complexes of Sodium Pectate with Nickel for Hydrogen Oxidation and Oxygen Reduction in Proton-Exchange Membrane Fuel Cells. Int. J. Mol. Sci. 2022, 23, 14247. [Google Scholar] [CrossRef] [Scilit] [PubMed]
  20. Yue, M.; Lambert, H.; Pahon, E.; Roche, R.; Jemei, S.; Hissel, D. Hydrogen Energy Systems: A Critical Review of Technologies, Applications, Trends and Challenges. Renew. Sustain. Energy Rev. 2021, 146, 111180. [Google Scholar] [CrossRef] [Scilit]
  21. Yin, Y.; Wang, J.; Li, L. An Assessment Methodology for International Hydrogen Competitiveness: Seven Case Studies Compared. Sustainability 2024, 16, 4981. [Google Scholar] [CrossRef] [Scilit]
  22. Poggi, P.; Darras, C.; Muselli, M.; Pigelet, G. The PV-Hydrogen MYRTE Platform—PV Output Power Fluctuations Smoothing. Energy Procedia 2014, 57, 607–616. [Google Scholar] [CrossRef] [Scilit]
  23. Rodler, A.; Haurant, P.; Faggianelli, G.-A.; Pigelet, G.; Poggi, P. Combined Heat and Power Generation of the Hydrogen Chain Based on MYRTE Platform. In Proceedings of the ISES Solar World Congress 2015, Daegu, Republic of Korea, 8–12 November 2015; pp. 1508–1517. [Google Scholar] [CrossRef] [Scilit]
  24. Sopian, K.; Ibrahim, M.Z.; Wan Daud, W.R.; Othman, M.Y.; Yatim, B.; Amin, N. Performance of a PV-Wind Hybrid System for Hydrogen Production. Renew. Energy 2009, 34, 1973–1978. [Google Scholar] [CrossRef] [Scilit]
  25. Darras, C.; Muselli, M.; Poggi, P.; Voyant, C.; Hoguet, J.C.; Montignac, F. PV Output Power Fluctuations Smoothing: The MYRTE Platform Experience. Int. J. Hydrogen Energy 2012, 37, 14015–14025. [Google Scholar] [CrossRef] [Scilit]
  26. Magnoni, S.; Bassi, A.M. Creating Synergies from Renewable Energy Investments: A Community Success Story from Lolland, Denmark. Energies 2009, 2, 1151–1169. [Google Scholar] [CrossRef] [Scilit]
  27. Fischer, U.R.; Krautz, H.J.; Wenske, M.; Tannert, D.; Krüger, P.; Ziems, C. Hydrogen Hybrid Power Plant in Prenzlau, Brandenburg. In Hydrogen Science and Engineering: Materials, Processes, Systems and Technology; Stolten, D., Emonts, B., Eds.; Wiley-VCH: Weinheim, Germany, 2016; pp. 1033–1052. [Google Scholar] [CrossRef] [Scilit]
  28. Kopp, M.; Coleman, D.; Stiller, C.; Scheffer, K.; Aichinger, J.; Scheppat, B. Energiepark Mainz: Technical and Economic Analysis of the Worldwide Largest Power-to-Gas Plant with PEM Electrolysis. Int. J. Hydrogen Energy 2017, 42, 13311–13320. [Google Scholar] [CrossRef] [Scilit]
  29. Shiroudi, A.; Taklimi, S.R.H.; Mousavifar, S.A.; Taghipour, P. Stand-Alone PV-Hydrogen Energy System in Taleghan-Iran Using HOMER Software: Optimization and Techno-Economic Analysis. Environ. Dev. Sustain. 2013, 15, 1389–1402. [Google Scholar] [CrossRef] [Scilit]
  30. Våland, T.; Bartholdsen, W.; Ottestad, M.; Våge, M. Grimstad Renewable Energy Park; Agder University College: Grimstad, Norway, 2002; Available online: https://drive.google.com/file/d/1w5xYY_DdGMCjQP9LOukkmFL9WOUMTQoi/view (accessed on 15 June 2026).
  31. İlhan, N.; Ersöz, A.; Çubukçu, M. A Renewable Energy Based Hydrogen Demonstration Park in Turkey—HYDEPARK. In Proceedings of the World Hydrogen Energy Conference (WHEC 2010), Essen, Germany, 16–21 May 2010; pp. 312–315. [Google Scholar]
  32. Ramos, C.; Marchesan, G.; Cardoso, G., Jr.; Dal Forno, I.; Mroginski, T.P.; Araújo, O.; Costa, W.; Gadelha, R.; Batista, V.; Resener, M. Optimization of Isolated Microgrid Sizing Considering the Trade-Off between Costs and Power Supply Reliability. Energies 2026, 19, 195. [Google Scholar] [CrossRef] [Scilit]
  33. Showers, O.S.; Chowdhury, S. Optimal Design and Cost–Benefit Analysis of a Solar Photovoltaic Plant with Hybrid Energy Storage for Off-Grid Healthcare Facilities with High Refrigeration Loads. Energies 2025, 18, 4596. [Google Scholar] [CrossRef] [Scilit]
  34. Shi, J.; Xu, R.; Li, D.; Zhu, T.; Fan, N.; Hong, Z.; Wang, G.; Han, Y.; Zhu, X. Multi-Criteria Optimization and Techno-Economic Assessment of a Wind–Solar–Hydrogen Hybrid System for a Plateau Tourist City Using HOMER and Shannon Entropy-EDAS Models. Energies 2025, 18, 4183. [Google Scholar] [CrossRef] [Scilit]
  35. Esteves, O.L.A.; Gabbar, H.A. Nuclear-Renewable Hybrid Energy System with Load Following for Fast Charging Stations. Energies 2023, 16, 4151. [Google Scholar] [CrossRef] [Scilit]
  36. Möller, M.C.; Krauter, S. Hybrid Energy System Model in Matlab/Simulink Based on Solar Energy, Lithium-Ion Battery and Hydrogen. Energies 2022, 15, 2201. [Google Scholar] [CrossRef] [Scilit]
  37. Möller, M.C.; Krauter, S. Investigation of Different Load Characteristics, Component Dimensioning, and System Scaling for the Optimized Design of a Hybrid Hydrogen-Based PV Energy System. Hydrogen 2023, 4, 408–433. [Google Scholar] [CrossRef] [Scilit]
  38. Pratticò, D.; Laganà, F.; Versaci, M.; Franković, D.; Jakoplić, A.; Vlahinić, S.; La Foresta, F. Enhancing Power Quality and Reducing Costs in Hybrid AC/DC Microgrids via Fuzzy Energy Management Systems. Energies 2025, 18, 5985. [Google Scholar] [CrossRef] [Scilit]
  39. Wang, Z.; Fan, F.; Zhang, H.; Song, K.; Jiang, J.; Sun, C.; Xue, R.; Zhang, J.; Chen, Z. Flexible On-Grid and Off-Grid Control for Electric–Hydrogen Coupling Microgrids. Energies 2025, 18, 985. [Google Scholar] [CrossRef] [Scilit]
  40. Hidouri, D.; Ben Omrane, I.; Khalil, K.; Cherif, A. Energy Management of a 1 MW Photovoltaic Power-to-Electricity and Power-to-Gas for Green Hydrogen Storage Station. World Electr. Veh. J. 2025, 16, 227. [Google Scholar] [CrossRef] [Scilit]
  41. Cheng, J.; Meng, J.; Bao, G.; Hu, X. Control of DC Bus Voltage in a 10 kV Off-Grid Wind–Solar–Hydrogen Energy Storage System. Energies 2025, 18, 2328. [Google Scholar] [CrossRef] [Scilit]
  42. Banawi, H.A.; Bahabri, M.O.; Hariri, F.A.; Ajour, M.N. Hybrid Wind–Solar–Fuel Cell–Battery Power System with PI Control for Low-Emission Marine Vessels in Saudi Arabia. Automation 2025, 6, 69. [Google Scholar] [CrossRef] [Scilit]
  43. Bartolucci, L.; Cennamo, E.; Cordiner, S.; Mulone, V.; Polimeni, A. Hybrid Renewable Energy Systems: Integration of Urban Mobility through Metal Hydrides Solution as an Enabling Technology for Increasing Self-Sufficiency. Energies 2025, 18, 5306. [Google Scholar] [CrossRef] [Scilit]
  44. Lee, J.; Lee, H. Nonlinear Model Predictive Control Based Adaptive Equivalent Consumption Minimization Strategy for Fuel Cell Electric Bus Considering Average Travel Speed. IEEE Access 2023, 11, 102605–102622. [Google Scholar] [CrossRef] [Scilit]
  45. Tao, S.; Chen, W.; Gan, R.; Li, X.; Wang, Y. Energy Management Strategy Based on Dynamic Programming with Durability Extension for Fuel Cell Hybrid Tramway. Railw. Eng. Sci. 2021, 29, 299–313. [Google Scholar] [CrossRef] [Scilit]
  46. Al-Rbaihat, R. Sensitivity Analysis of a Hybrid PV–WT Hydrogen Production System via an Electrolyzer and Fuel Cell Using TRNSYS in Coastal Regions: A Case Study in Perth, Australia. Energies 2025, 18, 3108. [Google Scholar] [CrossRef] [Scilit]
  47. Pukrushpan, J.T. Modeling and Control of Fuel Cell Systems and Fuel Processors. Ph.D. Thesis, Department of Mechanical Engineering, The University of Michigan, Ann Arbor, MI, USA, 2003. Available online: https://public.websites.umich.edu/~annastef/FuelCellPdf/pukrushpan_thesis.pdf (accessed on 27 July 2026).
  48. Tang, X.; Yang, M.; Shi, L.; Hou, Z.; Xu, S.; Sun, C. Adaptive State-of-Health Temperature Sensitivity Characteristics for Durability Improvement of PEM Fuel Cells. Chem. Eng. J. 2024, 491, 151951. [Google Scholar] [CrossRef] [Scilit]
  49. Song, K.; Hou, T.; Jiang, J.; Grigoriev, S.A.; Fan, F.; Qin, J.; Wang, Z.; Sun, C. Thermal Management of Liquid-Cooled Proton Exchange Membrane Fuel Cell: A Review. J. Power Sources 2025, 648, 237227. [Google Scholar] [CrossRef] [Scilit]
  50. Meng, X.; Sun, C.; Mei, J.; Tang, X.; Hasanien, H.M.; Jiang, J.; Fan, F.; Song, K. Fuel Cell Life Prediction Considering the Recovery Phenomenon of Reversible Voltage Loss. J. Power Sources 2025, 625, 235634. [Google Scholar] [CrossRef] [Scilit]
Figure 1. Schematic diagram of the MEA applicable for PEMFC system.
Electrochem 07 00026 g001
Figure 2. Schematic diagram of the experimental platform with fuel cell.
Electrochem 07 00026 g002
Figure 3. Measured (a) polarization curves and (b) power curves of PEMFC stack at 25 °C and 35 °C.
Electrochem 07 00026 g003
Figure 4. Polarization curves (U, I) of the fuel cell stack recorded at different operating pressures ranging from 0.2 bar to 0.8 bar with step of 0.2 bar. The experiments were conducted at a constant operating temperature of 35 °C.
Electrochem 07 00026 g004
Figure 5. Transient processes of the voltage and current with hydrogen pressure 0.8 bar for (a) decreasing current step variation from 25 A to 4.5 A and (b) increasing current step variation from 4.5 to 25 A.
Electrochem 07 00026 g005
Figure 6. Transient processes of the voltage and current for current step variations from 5 A to 30 A and back to 5 A for hydrogen pressures: (a) 0.2 bar and (b) 0.8 bar.
Electrochem 07 00026 g006
Figure 7. Comparison of the transient processes for different hydrogen pressures (0.2, 0.4, 0.6, and 0.8 bar) for current step variation from 5 A to 30 A and back to 5 A for (a) the fuel cell current and (b) fuel cell voltage.
Electrochem 07 00026 g007
Figure 8. Approximations of the experimentally measured mass flow in function of power at different operating pressures: 0.8 bar (up, left), 0.6 bar (up, right), 0.4 bar (down, left), and 0.2 bar (down, right). SLPM, standard liter per minute.
Electrochem 07 00026 g008
Figure 9. Approximation with the new coefficients of the mass flow in function of power at different operating pressures: 0.8 bar (up, left), 0.6 bar (up, right), 0.4 bar (down, left), and 0.2 bar (down, right).
Electrochem 07 00026 g009
Figure 10. Comparison of the linear and cubic polynomial approximation of hydrogen consumption versus power relationship.
Electrochem 07 00026 g010
Table 1. Non-exhaustive list of operating hybrid systems with renewable energy and hydrogen production for different purposes (fuel cells or mobile application); AFC, alkaline fuel cell; CHP, combined heat and power.
ProjectLocationRESFC UseReference
MYRTEAjaccio, FrancePVPEM FC[22,25]
Unnamed projectKuala Terengganu,
Malaysia
PV + windH2 injection and mobility[24]
Lolland Hydrogen CommunityLolland,
Denmark
WindPEM FC and micro-CHP
systems
[26]
Prenzlau Hybrid Power Plant (ENERTRAG)Prenzlau,
Germany
Wind + biogasCHP using H2 and biogas[27]
Energiepark MainzMainz,
Germany
Wind + grid
renewable electricity
H2 injection and mobility[28]
Taleghan Solar Hydrogen Energy SystemTaleghan,
Iran
PVPEM FC[29]
Grimstad Renewable Energy ParkGrimstad,
Norway
PV + windAFC[30]
HYDEPARK (Hydrogen Demonstration Park)Gebze, Kocaeli,
Turkey
PV + windPEM FC[31]
Table 2. Parameters of the Heliocentris MHS 800 storage canister.
ParameterValue
PS (max. filling pressure level according to Pressure Equipment Directive)25 bar
Max. coupling pressure of quick coupling17.2 bar
Nominal temperature20 °C
Operation temperatureFrom −5 °C to 55 °C
Thermalization temperatureFrom 5 °C to 55 °C
H2-Purity99.999%
H2 Capacity (@ 20 °C and 25 bar)800 Nl
Nominal discharge rate4 Nl/min
Bottle volume2.0 l
Table 3. Parameters of the Alicat M-20SLPM-D mass flow meter.
ParameterValue
PS (max. filling pressure level according to Pressure Equipment Directive)25 bar
Mass flow accuracy±0.6% of reading or ±0.1% of full scale, whichever is greater
Pressure accuracyAbove 1 atm: ±0.5% of reading
Below 1 atm: ±4.83 mbar
Flow measurement range0.01–100% of full scale
Operating pressure0.8–11 bar (absolute pressure)
Pressure sensitivityMass flow zero shift: ±0.01% of full scale per atm from tare pressure
Temperature sensitivityMass flow zero shift: ±0.01% of full scale per °C from tare temperature
Temperature accuracy±0.75 °C
Operating temperature rangeFrom −10 °C to 60 °C (ambient and gas)
Sensor response time<1 ms
Table 4. Parameters of the Horizon Educational H-1000 fuel cell.
ParameterValue
Type of fuel cellPEM
Number of cells48
Rated power1000 W
Rated performance28.8 V @ 35 A
ReactantsHydrogen and air
Ambient temperature5–30 °C
Max stack temperature65 °C
Hydrogen pressure0.45–0.55 bar
Maximal allowable operating pressure0.8 bar
HumidificationSelf-humidified
H2 flow rate at max output13 L/min
Hydrogen purity≥99.995% dry H2
Efficiency of system40% @ 28.8 V
Table 5. Parameters of the EA-EL 9080-85 B HP programmable DC load.
ParameterValue
PowerFrom 0 to 1200 W
Power @ 40 °CFrom 0 to 1000 W
VoltageFrom 0 to 80 V
CurrentFrom 0 to 85 A
ResistanceFrom 0.09 to 30 Ω
Umin for Imax~2.2 V
Constant Current accuracy<0.2%
Constant Voltage accuracy<0.1%
Constant Power accuracy<0.5%
Constant Resistance accuracy≤1% + 0.3% of nominal current
Table 6. Polynomial coefficients of the approximations at different operating hydrogen pressures.
Coefficient0.8 bar0.6 bar0.4 bar0.2 bar
p14.45 × 10−97.265 × 10−93.267 × 10−91.051 × 10⁻⁸
p2−4.451 × 10⁻⁷−2.743 × 10⁻⁶−2.484 × 10⁻⁶−4.118 × 10⁻⁶
p30.010210.011770.010250.01204
p4−0.02864−0.035170.06525−0.04195
Table 7. Goodness-of-fit parameters of the performed approximation for different operating hydrogen pressures. SSE, sum of squared errors; RMSE, root mean square error; RRMSE, relative root mean square error.
Goodness-of-Fit (G-o-F) Parameter 0.8 bar0.6 bar0.4 bar0.2 bar
R-Square0.999930.999920.999560.99939
SSE0.0106680.0126730.0664530.0912
Adjusted R-sq0.99990.999890.999390.99916
RMSE0.0365180.0398010.0911410.10677
RRMSE (%)0.9677061.0103912.3739792.799484
Table 8. Synthetized fit coefficients.
Parameterp1p2p3p4
Value4.5 × 10−94 × 10−70.01090.0349
Table 9. Goodness-of-fit parameters of the proposed polynomial model.
G-o-F Parameter0.8 bar0.6 bar0.4 bar0.2 bar
R-Square0.9999005790.9998362470.9994768570.99869762
SSE4.3591138560.0346748320.1576843040.912259447
Adjusted R-sq0.9998906370.9998198710.9994245430.998567382
RMSE0.6027101190.0537547150.1146314040.275720185
RRMSE (%)15.971472121.3646214862.985840777.229318558
Table 10. Goodness-of-fit parameters of the linear approximation model.
G-o-F Parameter0.8 bar0.6 bar0.4 bar0.2 barPolynomial
R-Square0.9923961240.9919750480.9918421640.9896853560.99736525
SSE3.914099662.0017264811.9127018572.7515579631.3353068
Adjusted R-sq0.9916357370.9911725520.991026380.9886538920.997101774
RMSE0.5711173010.4084244610.3992390530.4788491380.333579925
RRMSE (%)15.1342805710.3682960210.3991070912.5553120310.17398403
Disclaimer/Publisher’s Note: The statements, opinions and data contained in all publications are solely those of the individual author(s) and contributor(s) and not of MDPI and/or the editor(s). MDPI and/or the editor(s) disclaim responsibility for any injury to people or property resulting from any ideas, methods, instructions or products referred to in the content.