
Amperometric Alcohol Vapour Detection and Mass Transport Diffusion Modelling in a Platinum-Based Sensor


Abstract
1. Introduction
1.1. Electrooxidation of Alcohols
- I = steady-state current in amps (A);
- n = no. of electrons (taken to be four);
- F = Faraday’s constant taken as 96,485 C/mol;
- A = area of working electrode (cm2);
- C = concentration of analyte (mol/dm3);
- D = effective diffusion coefficient (cm2/s);
- L = apparent diffusion layer thickness (cm).
1.2. Sensor Technology Considerations
1.3. Statement of Objectives
2. Experiment Methods
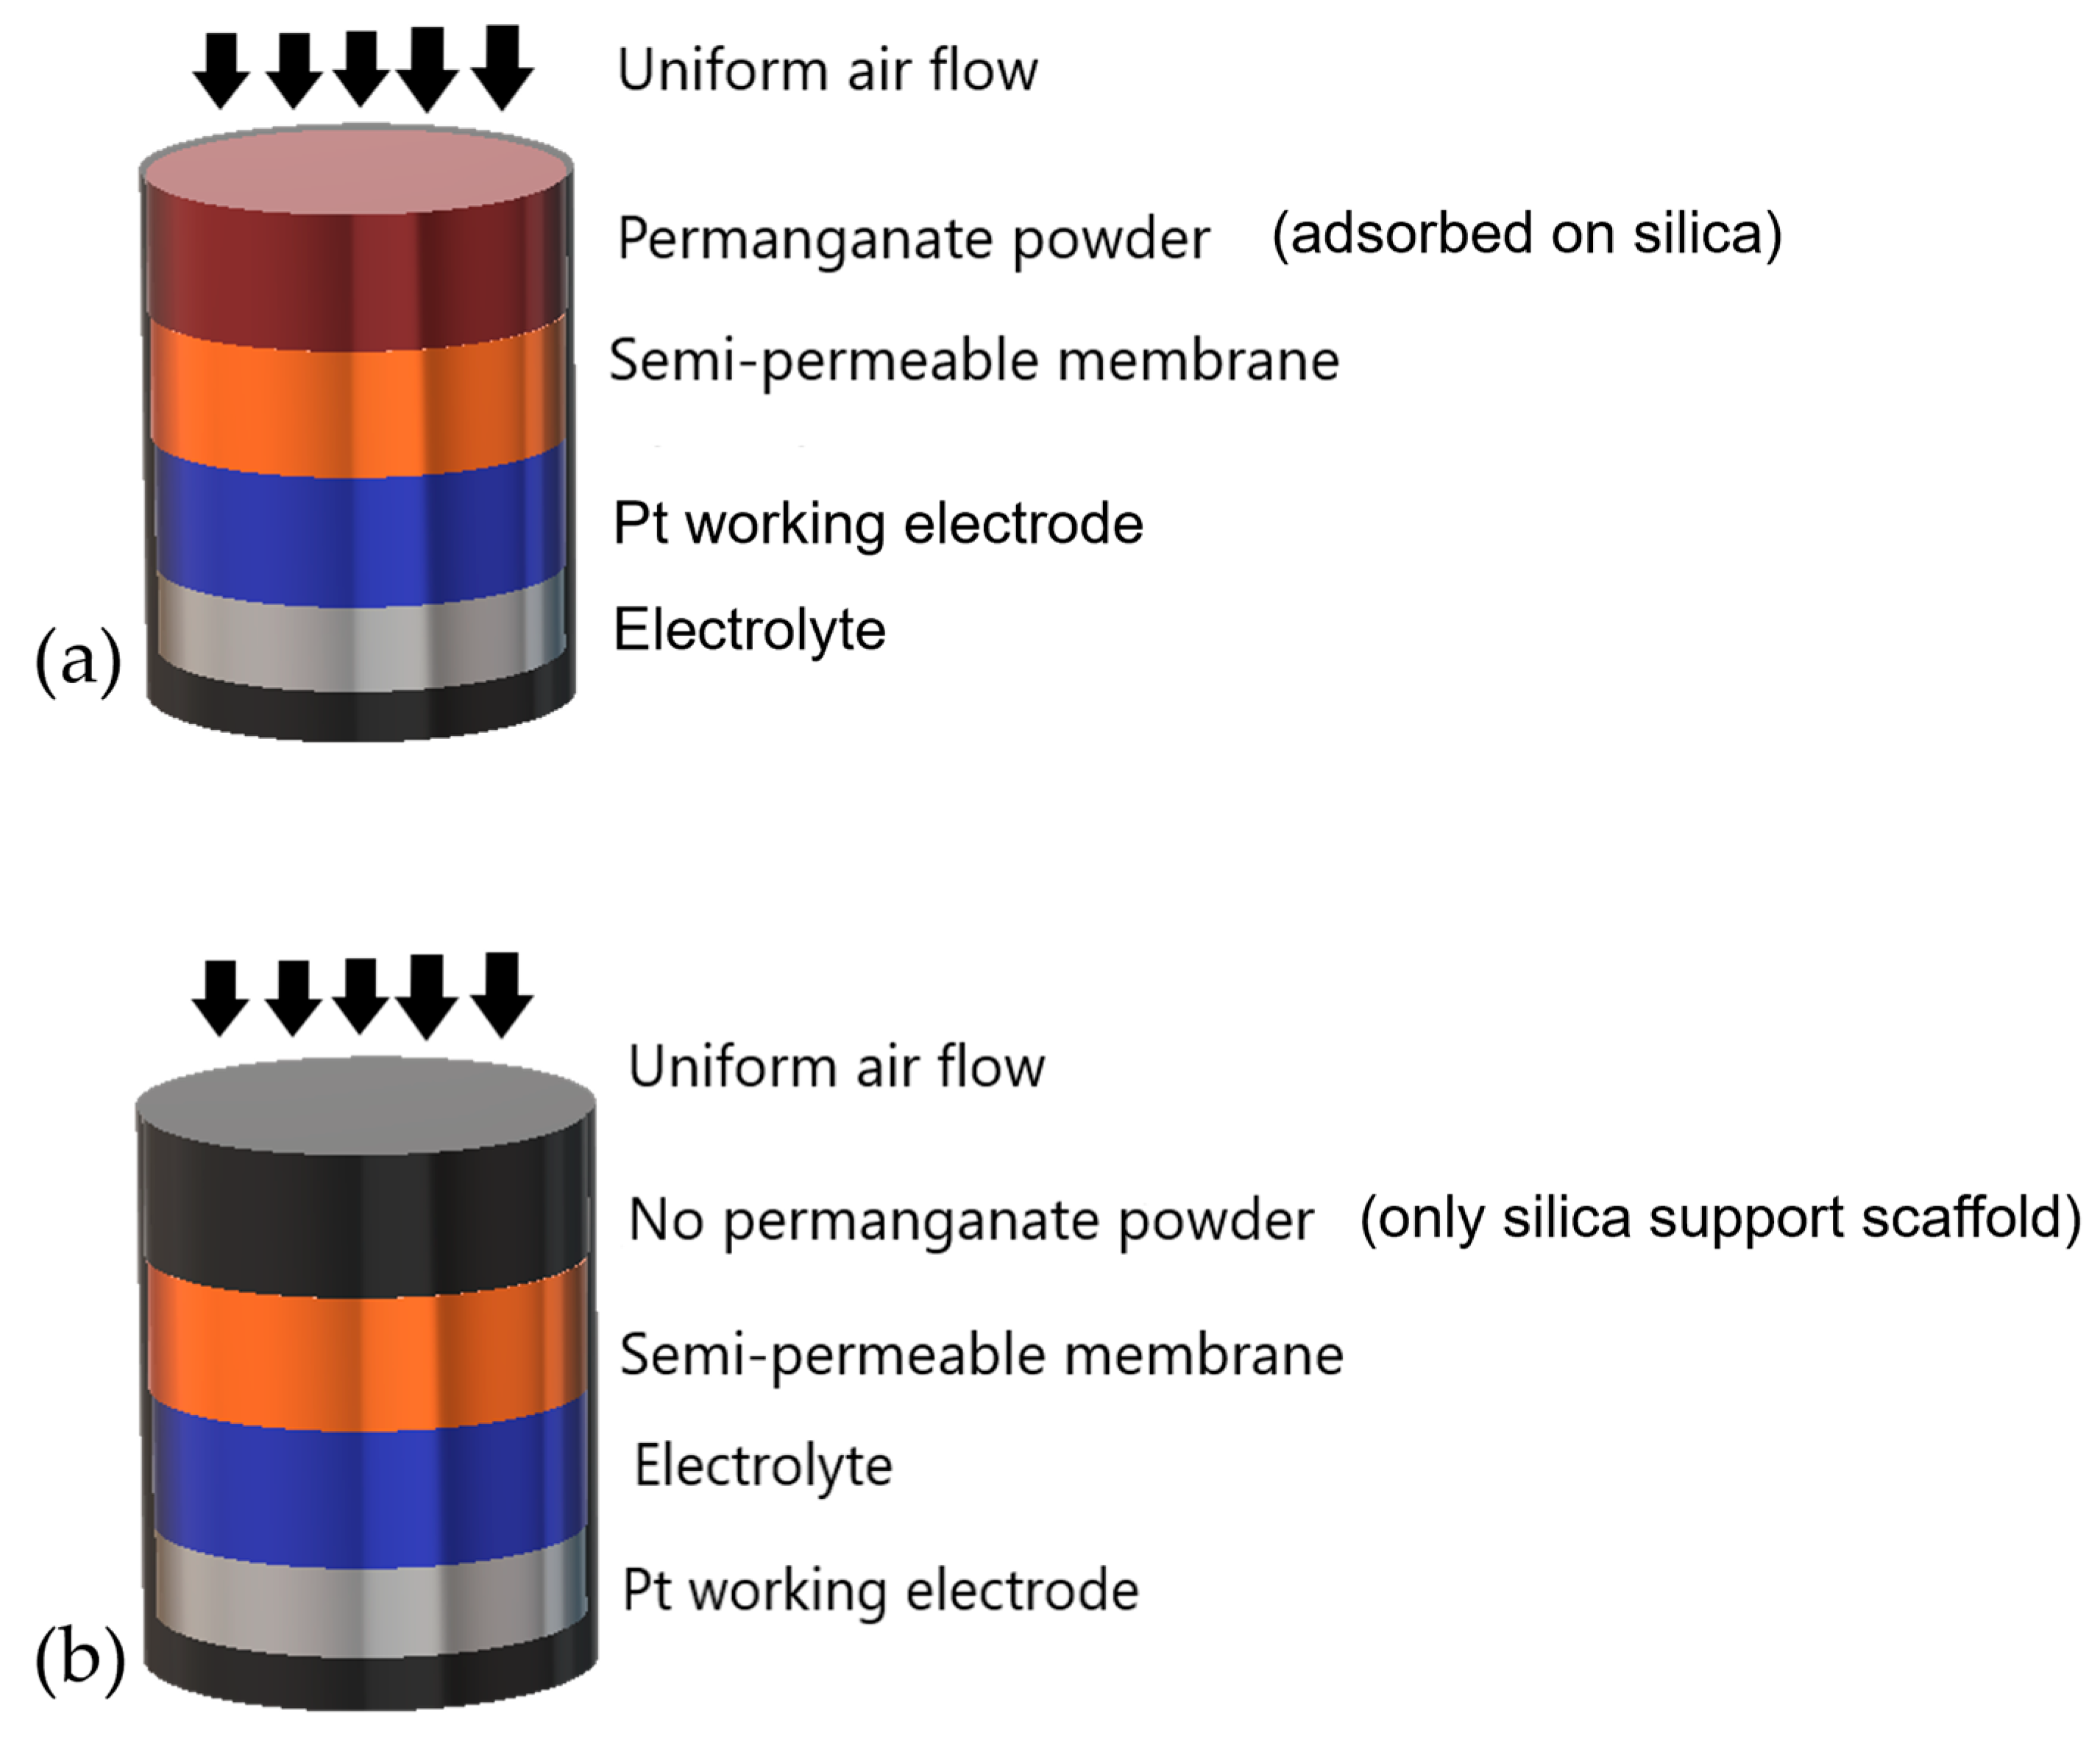
2.1. CO-AF Sensor
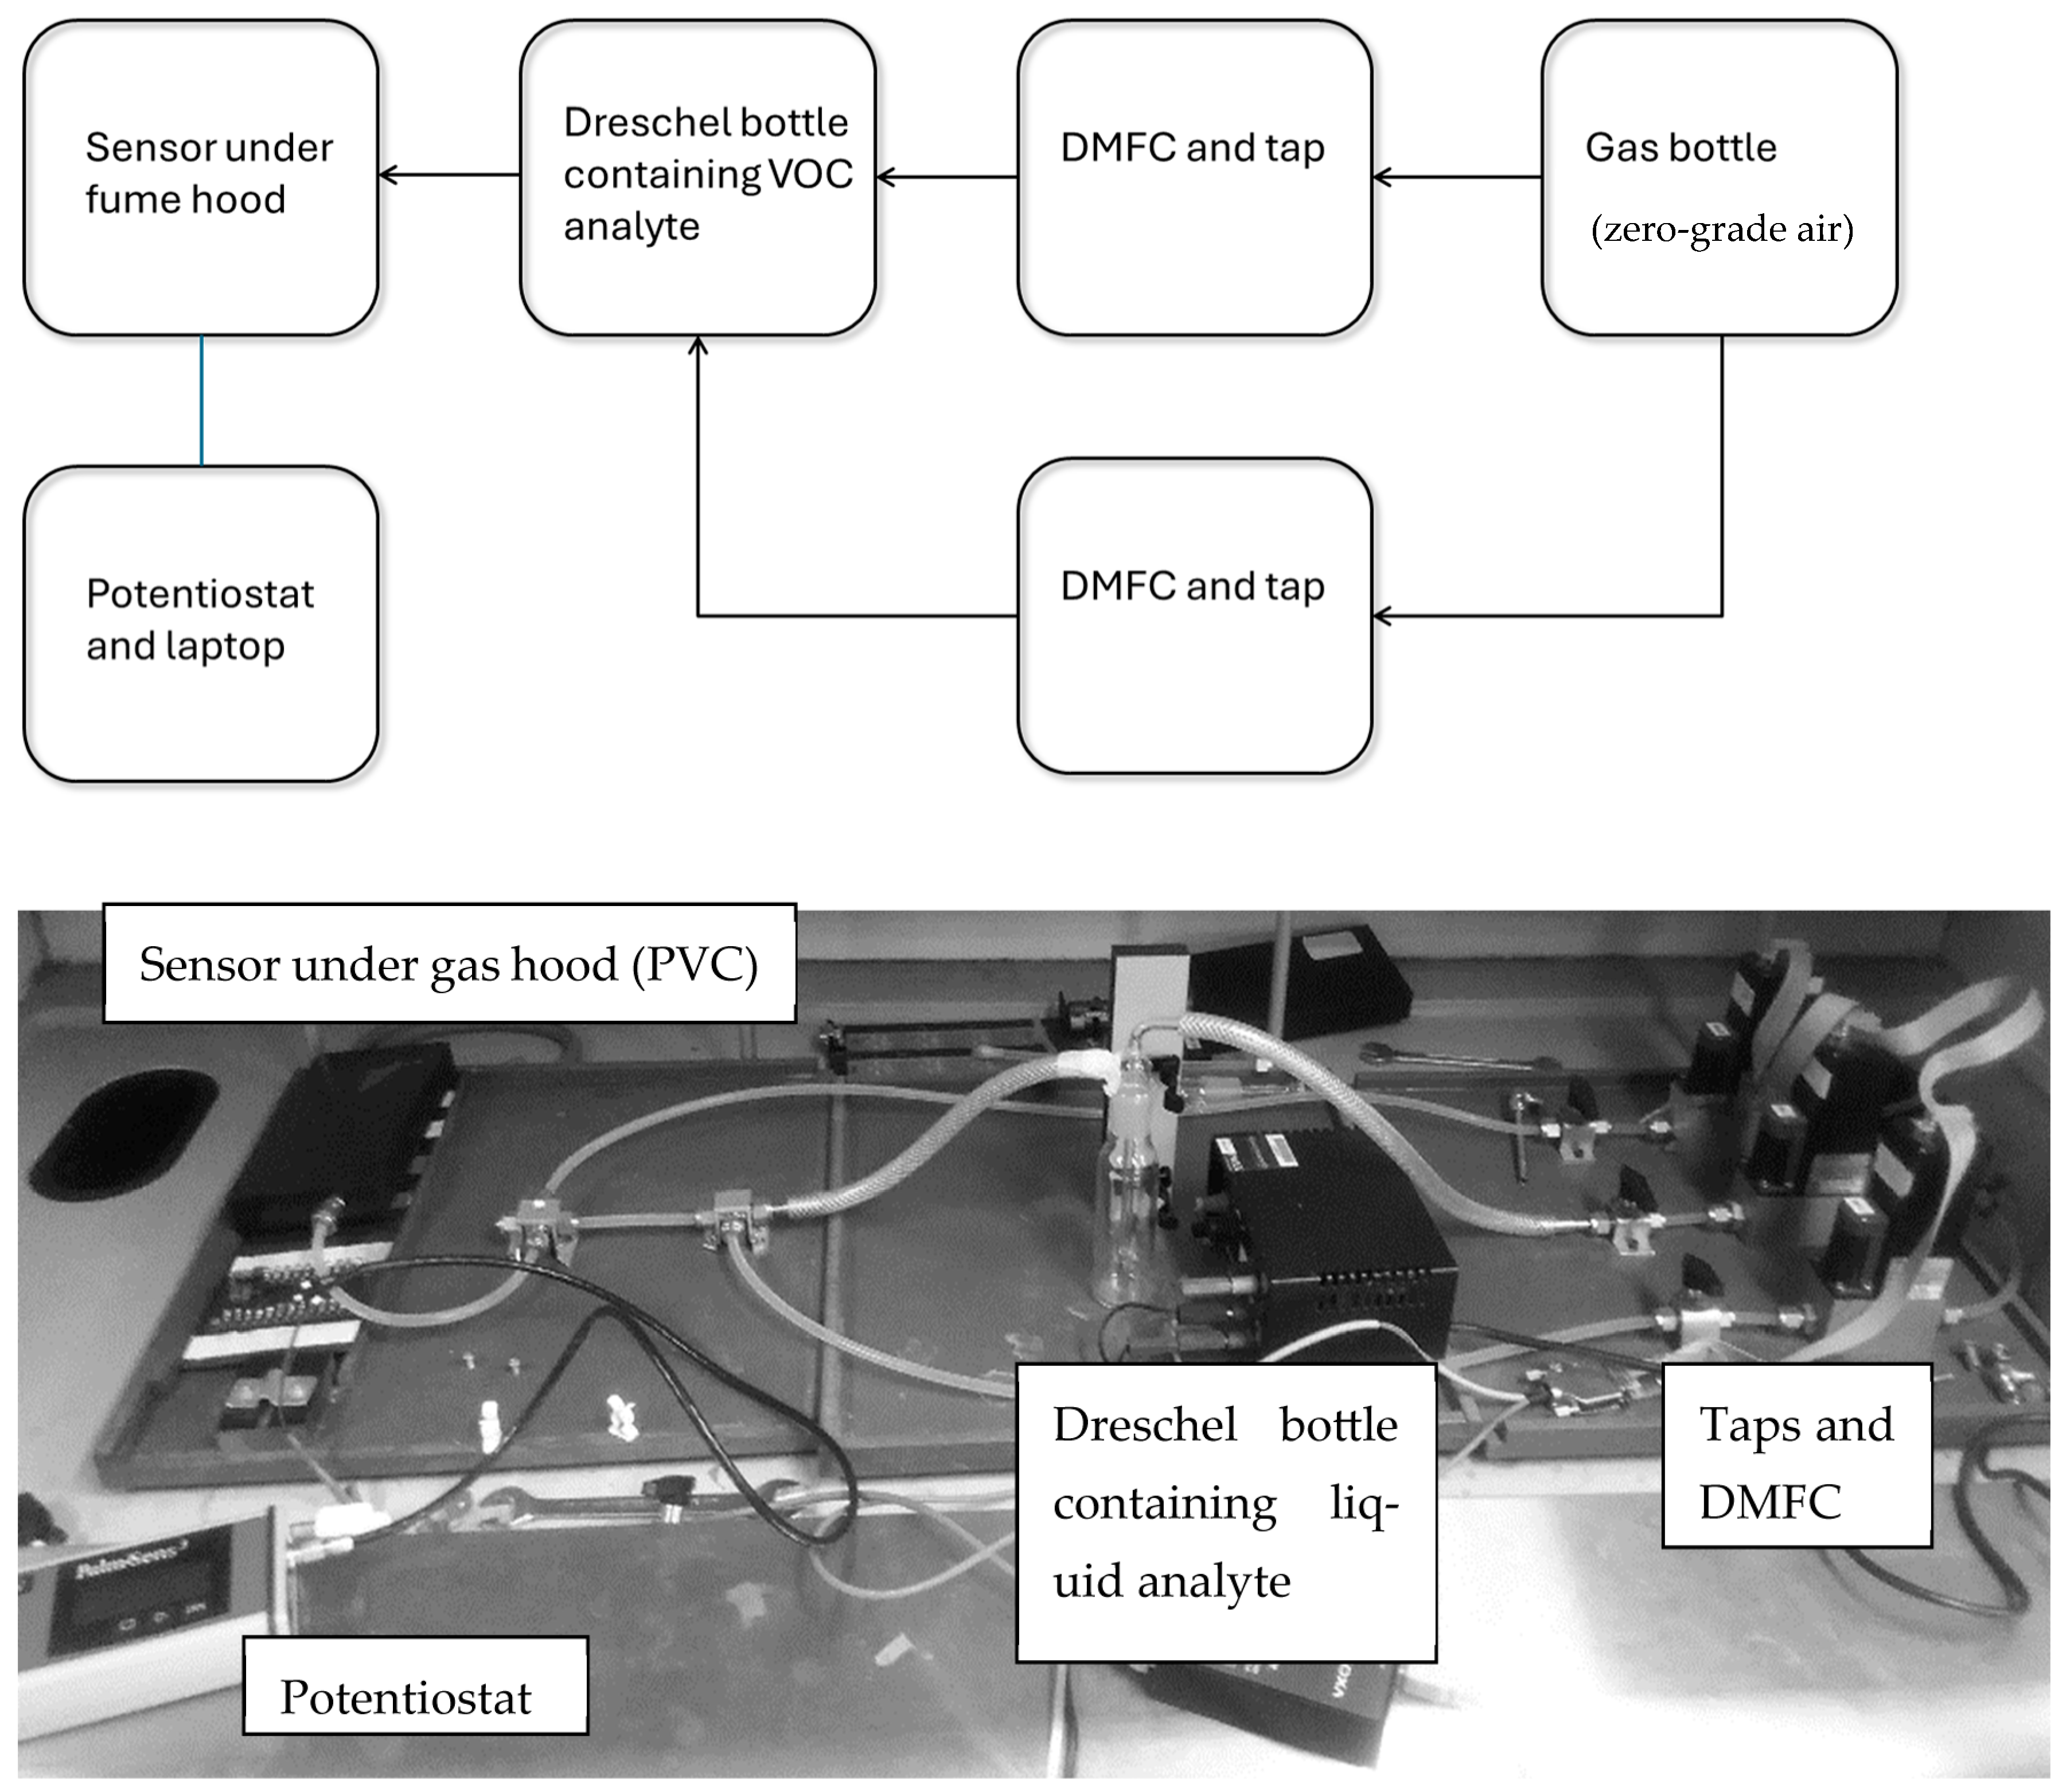
2.2. Test Rig Setup
- Pt = partial pressure (kPa);
- Vg = volume flow rate of analyte (mL/min);
- P = standard vapour pressure (kPa);
- Va = volume flow rate of zero air (mL/min).
- P = vapour pressure (kPa);
- A, B, C = constants derived from experimental data;
- T = temperature (K).
3. Results and Discussion
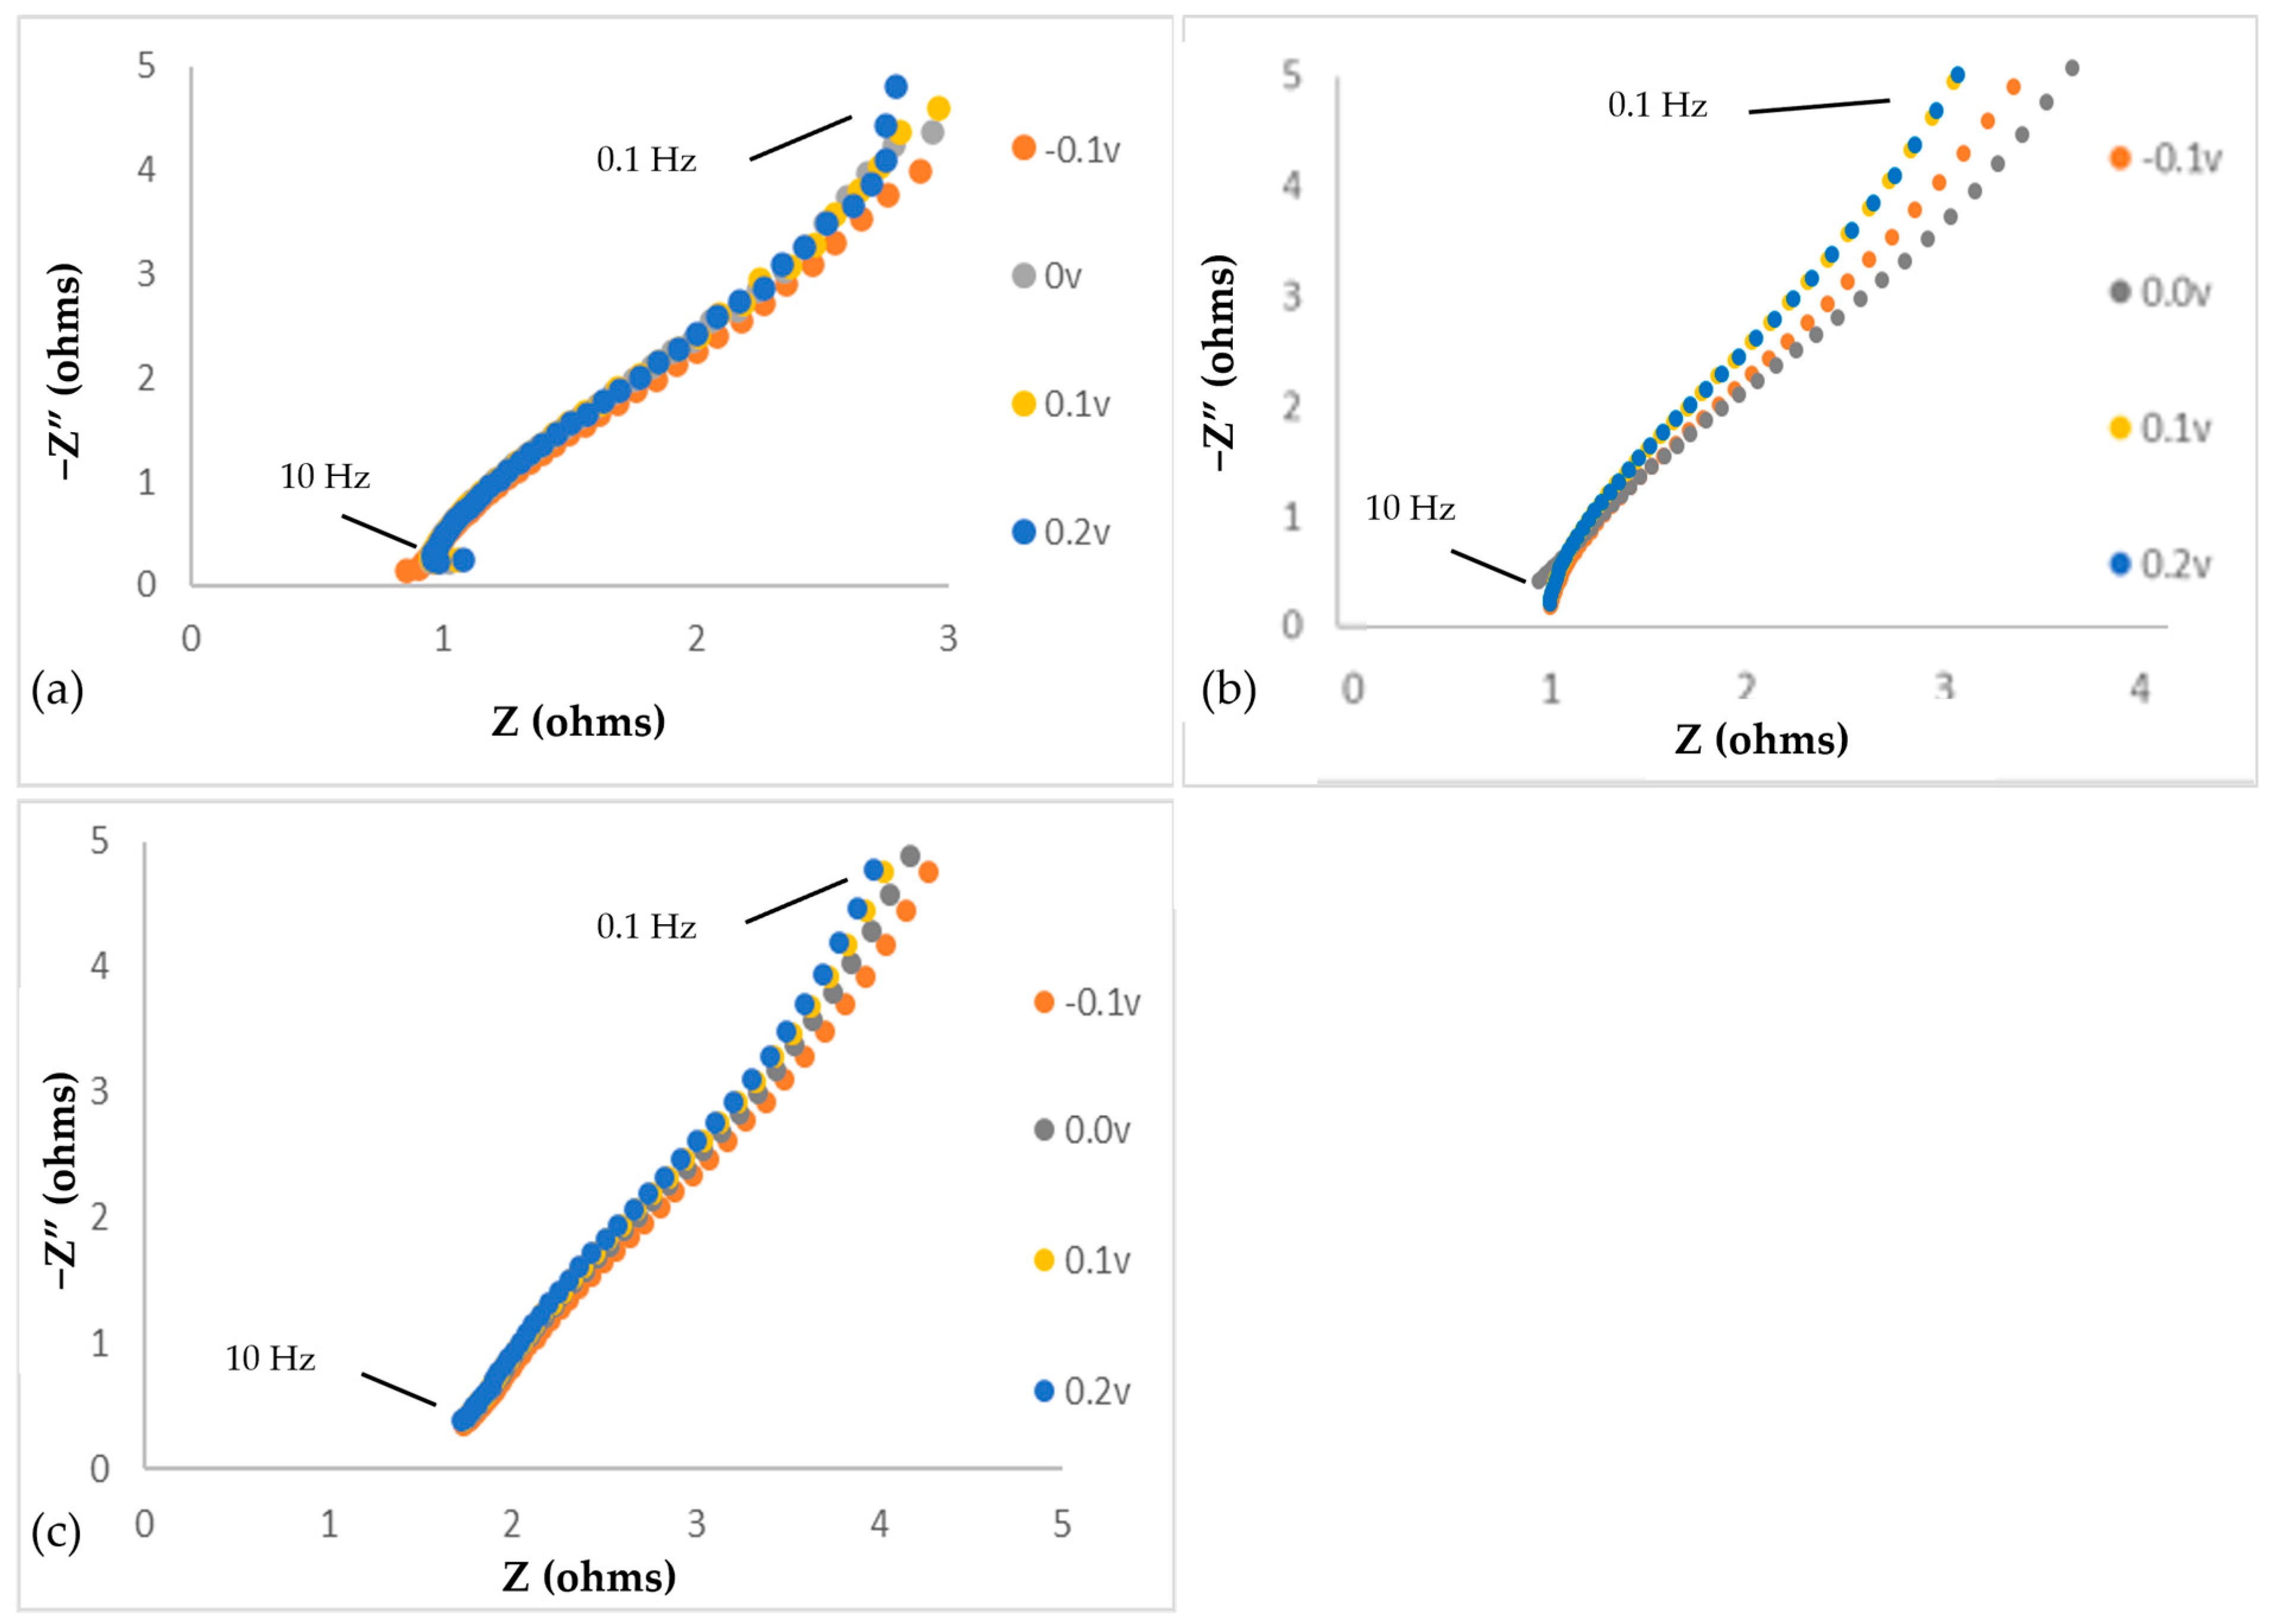
3.1. Impedance Spectroscopy
3.2. Differential Capacitance of the Sensors
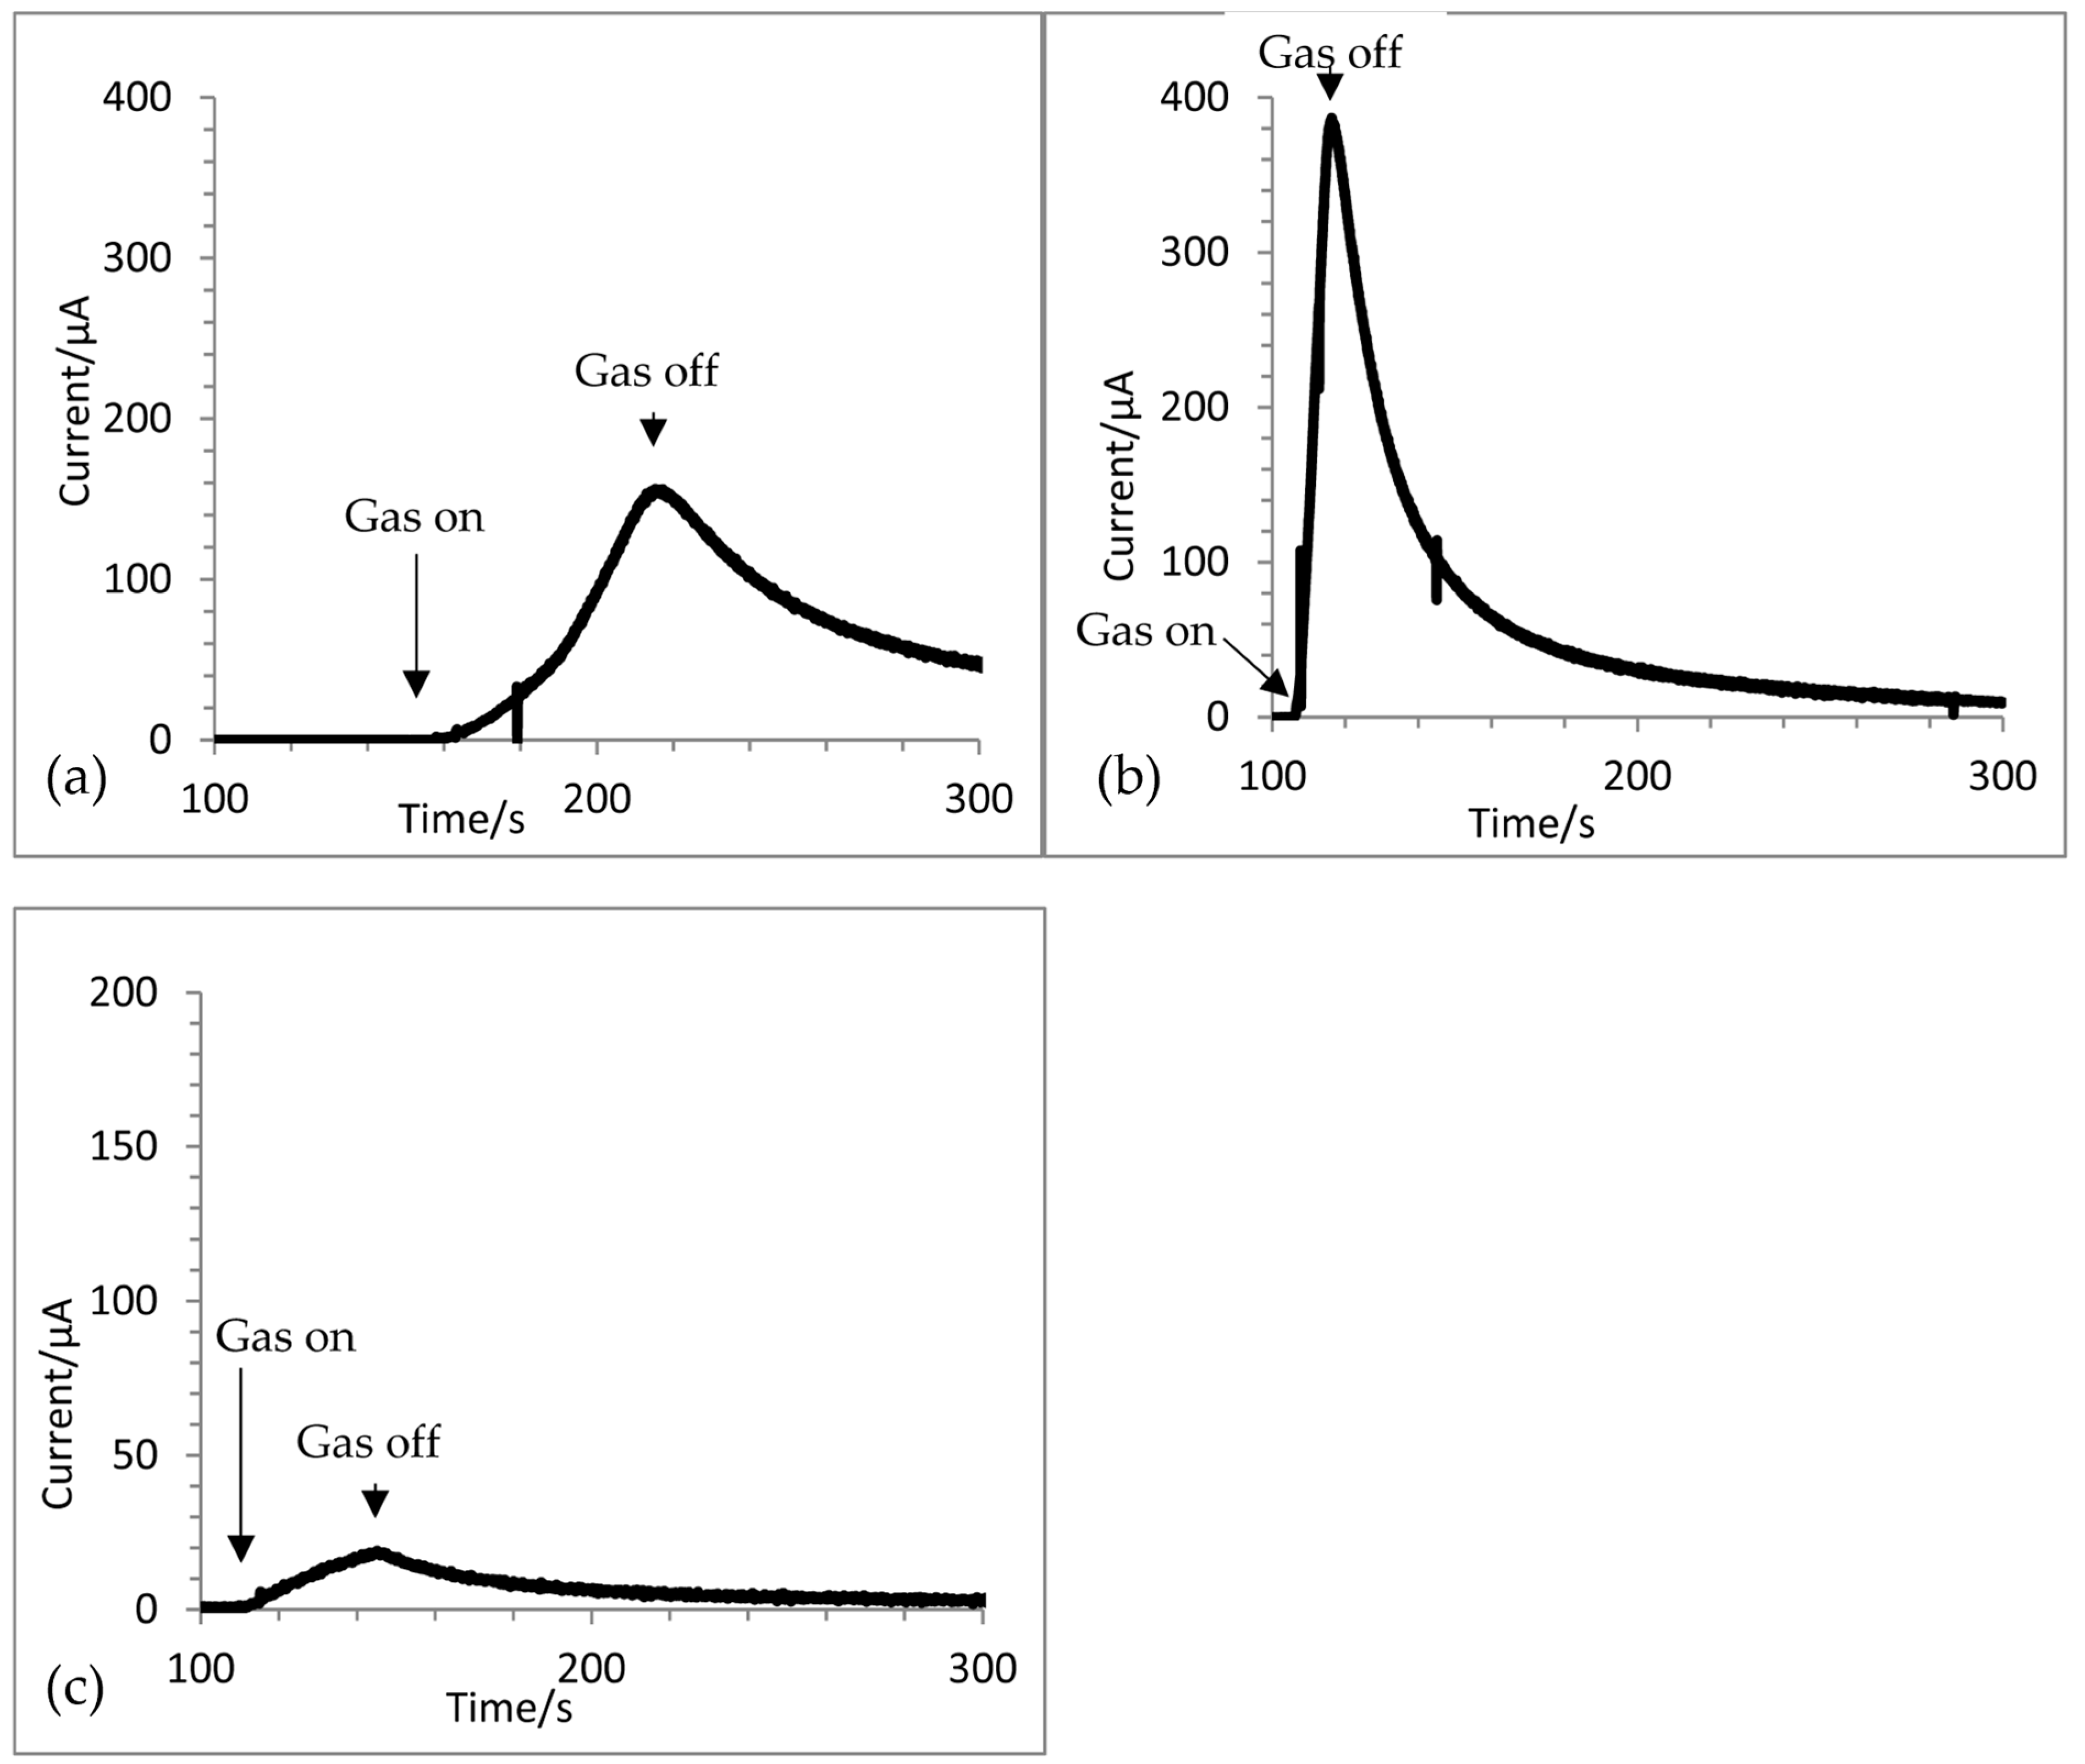
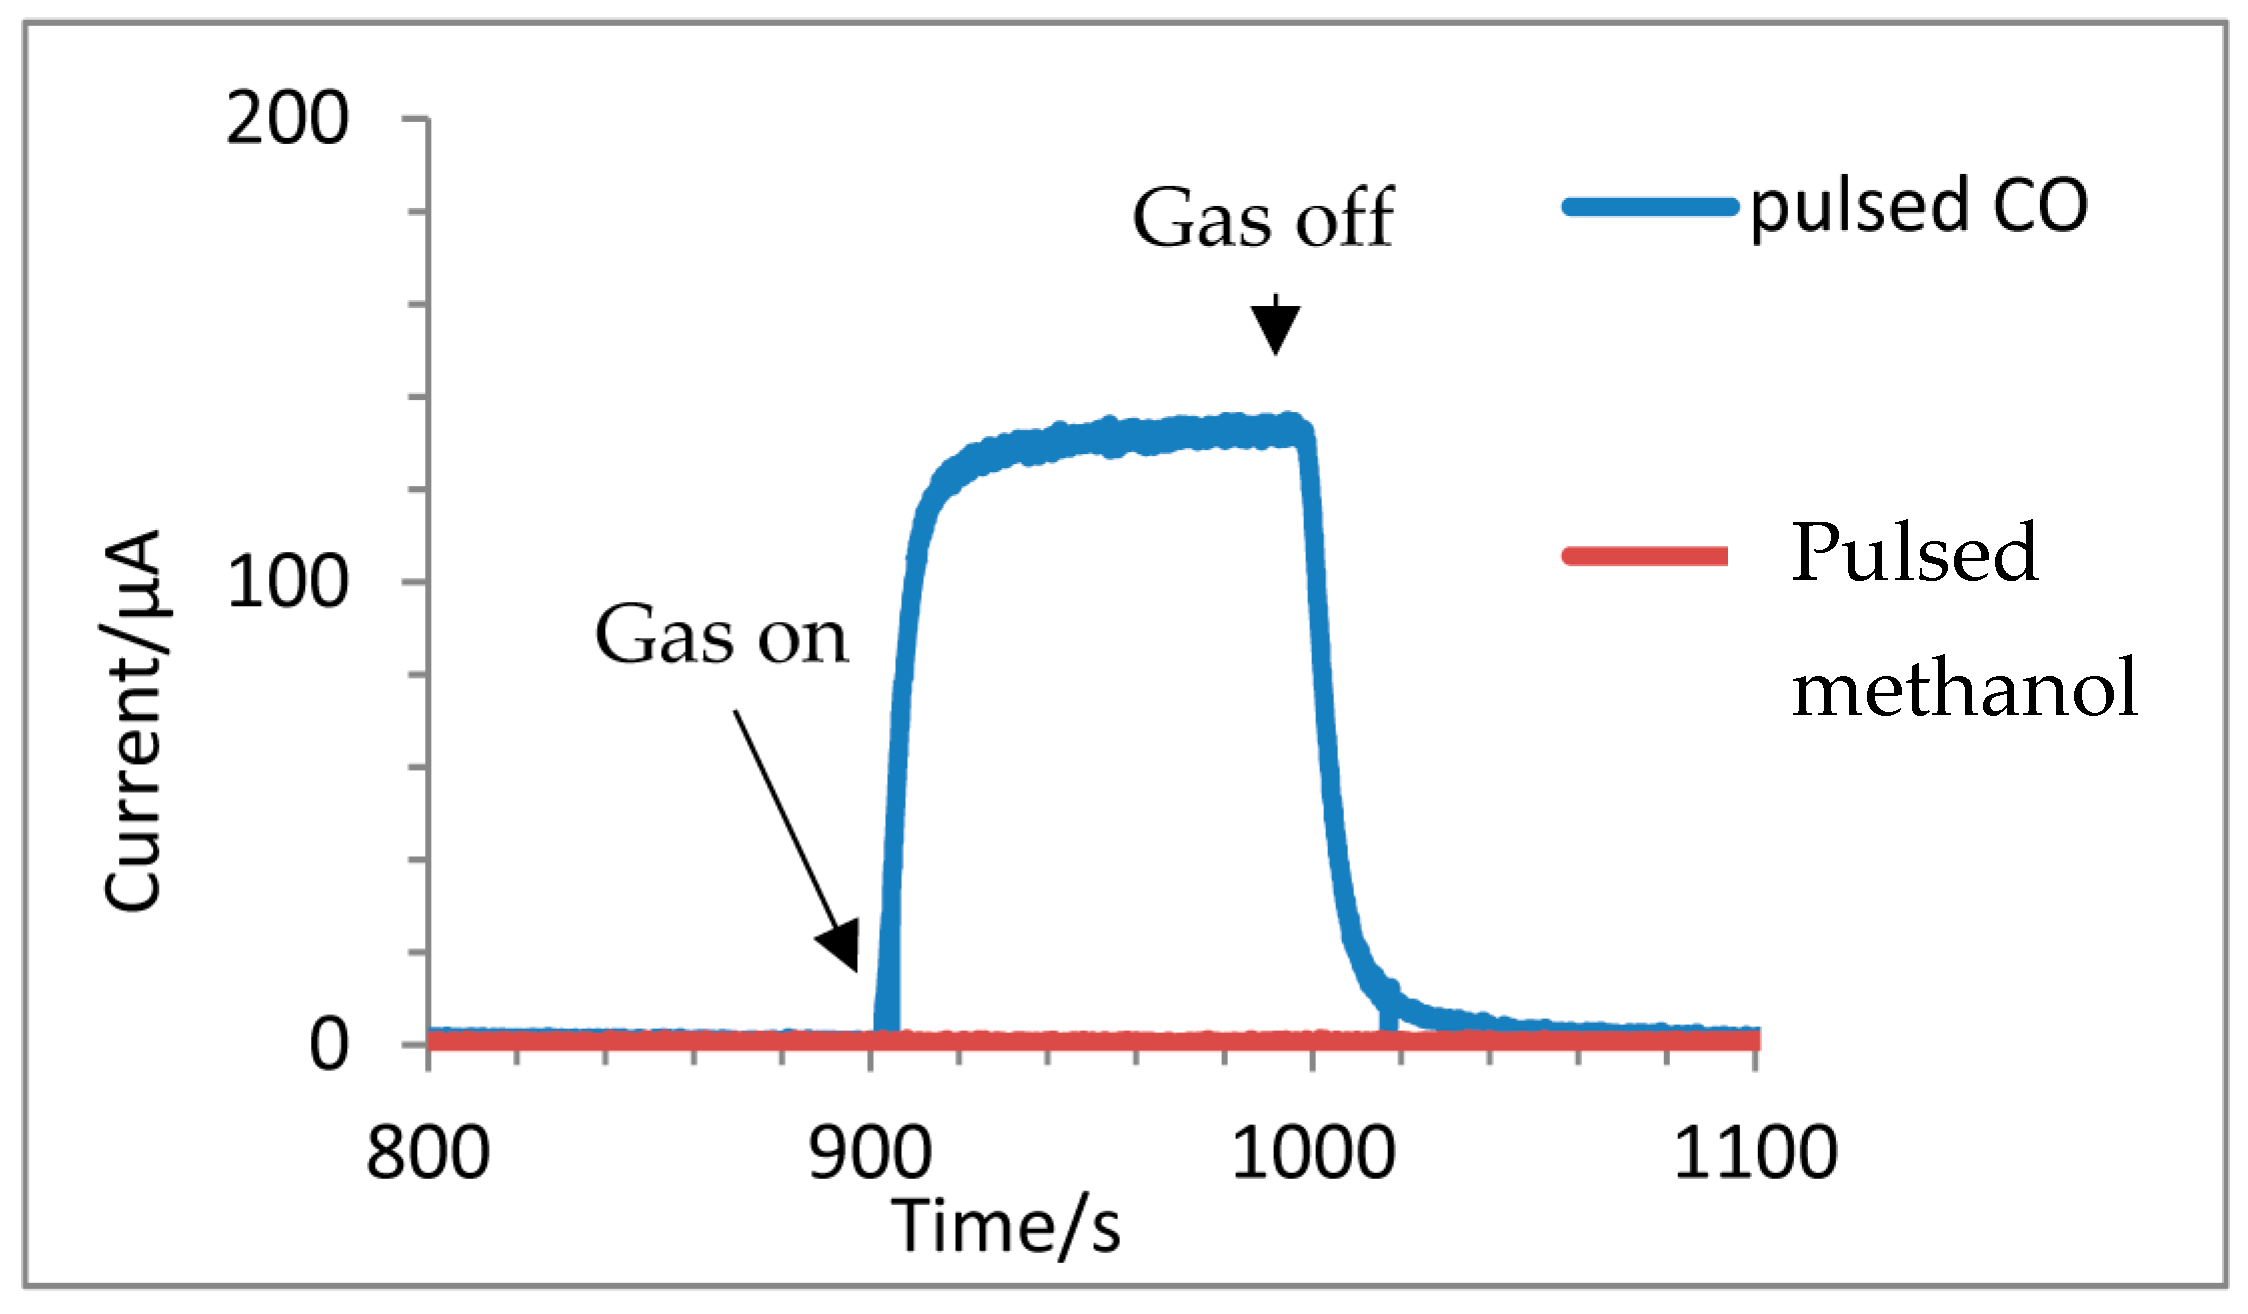
3.3. Chronoamperometry Response to a Concentration Step
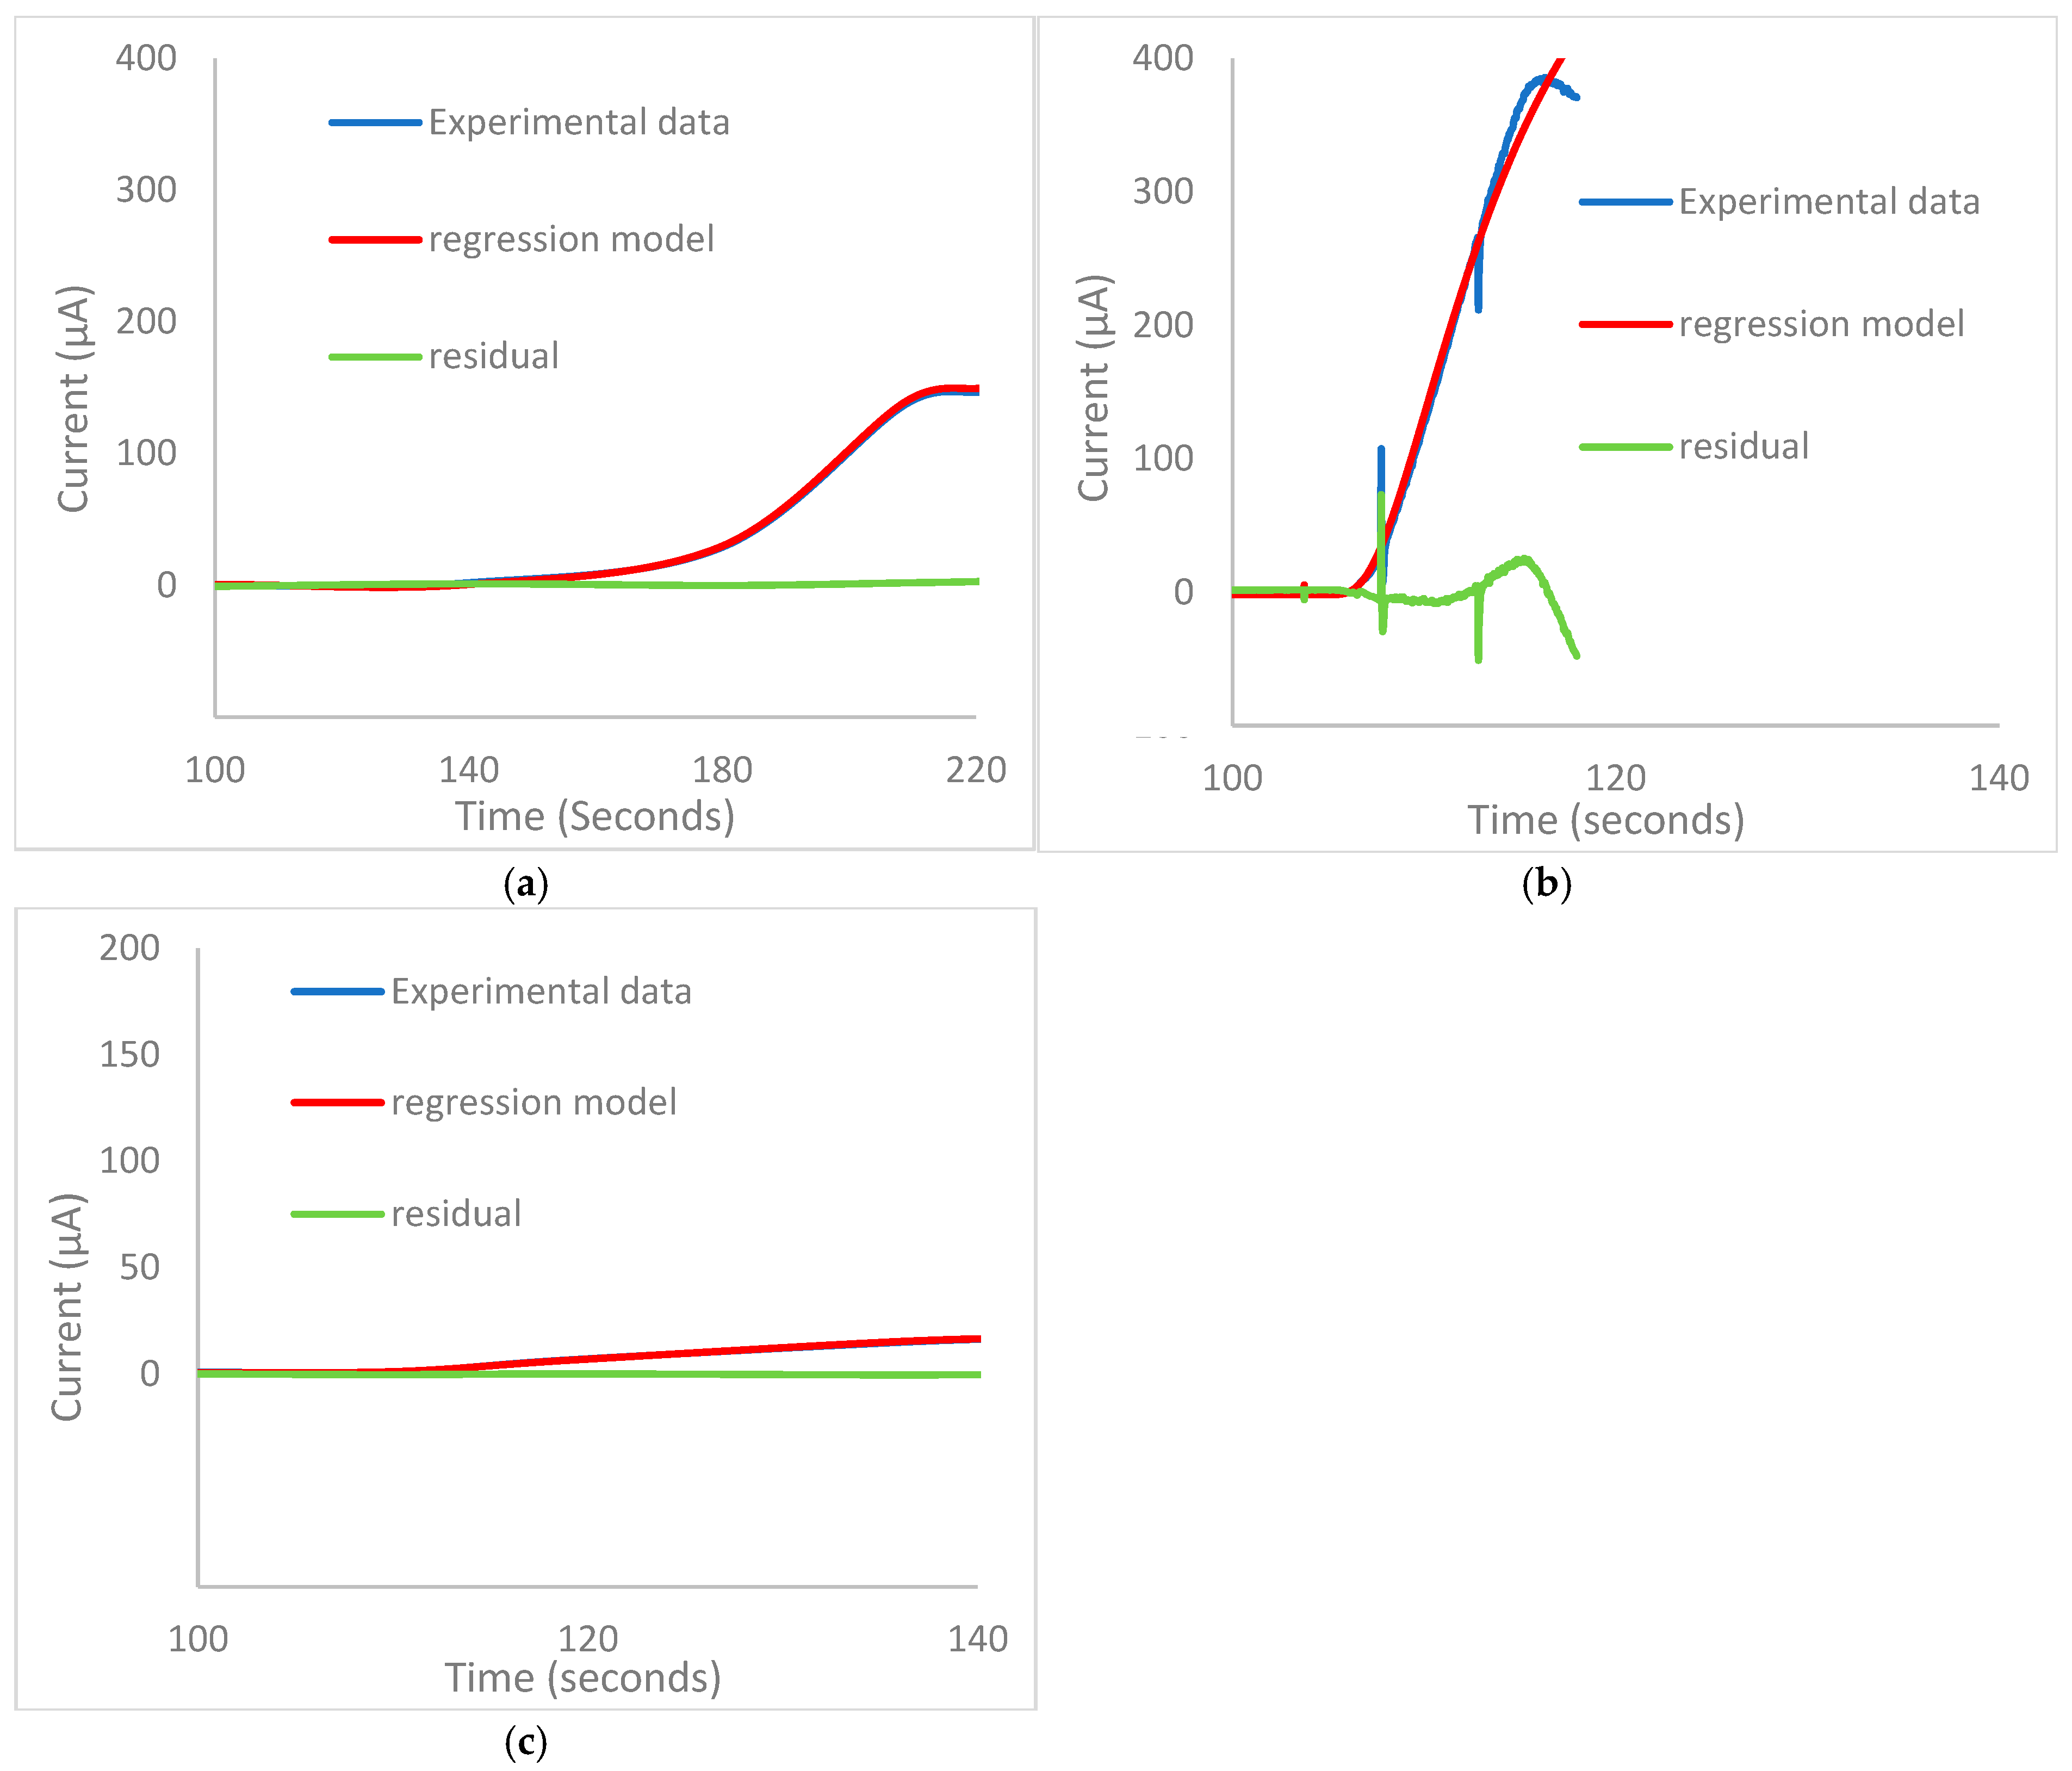
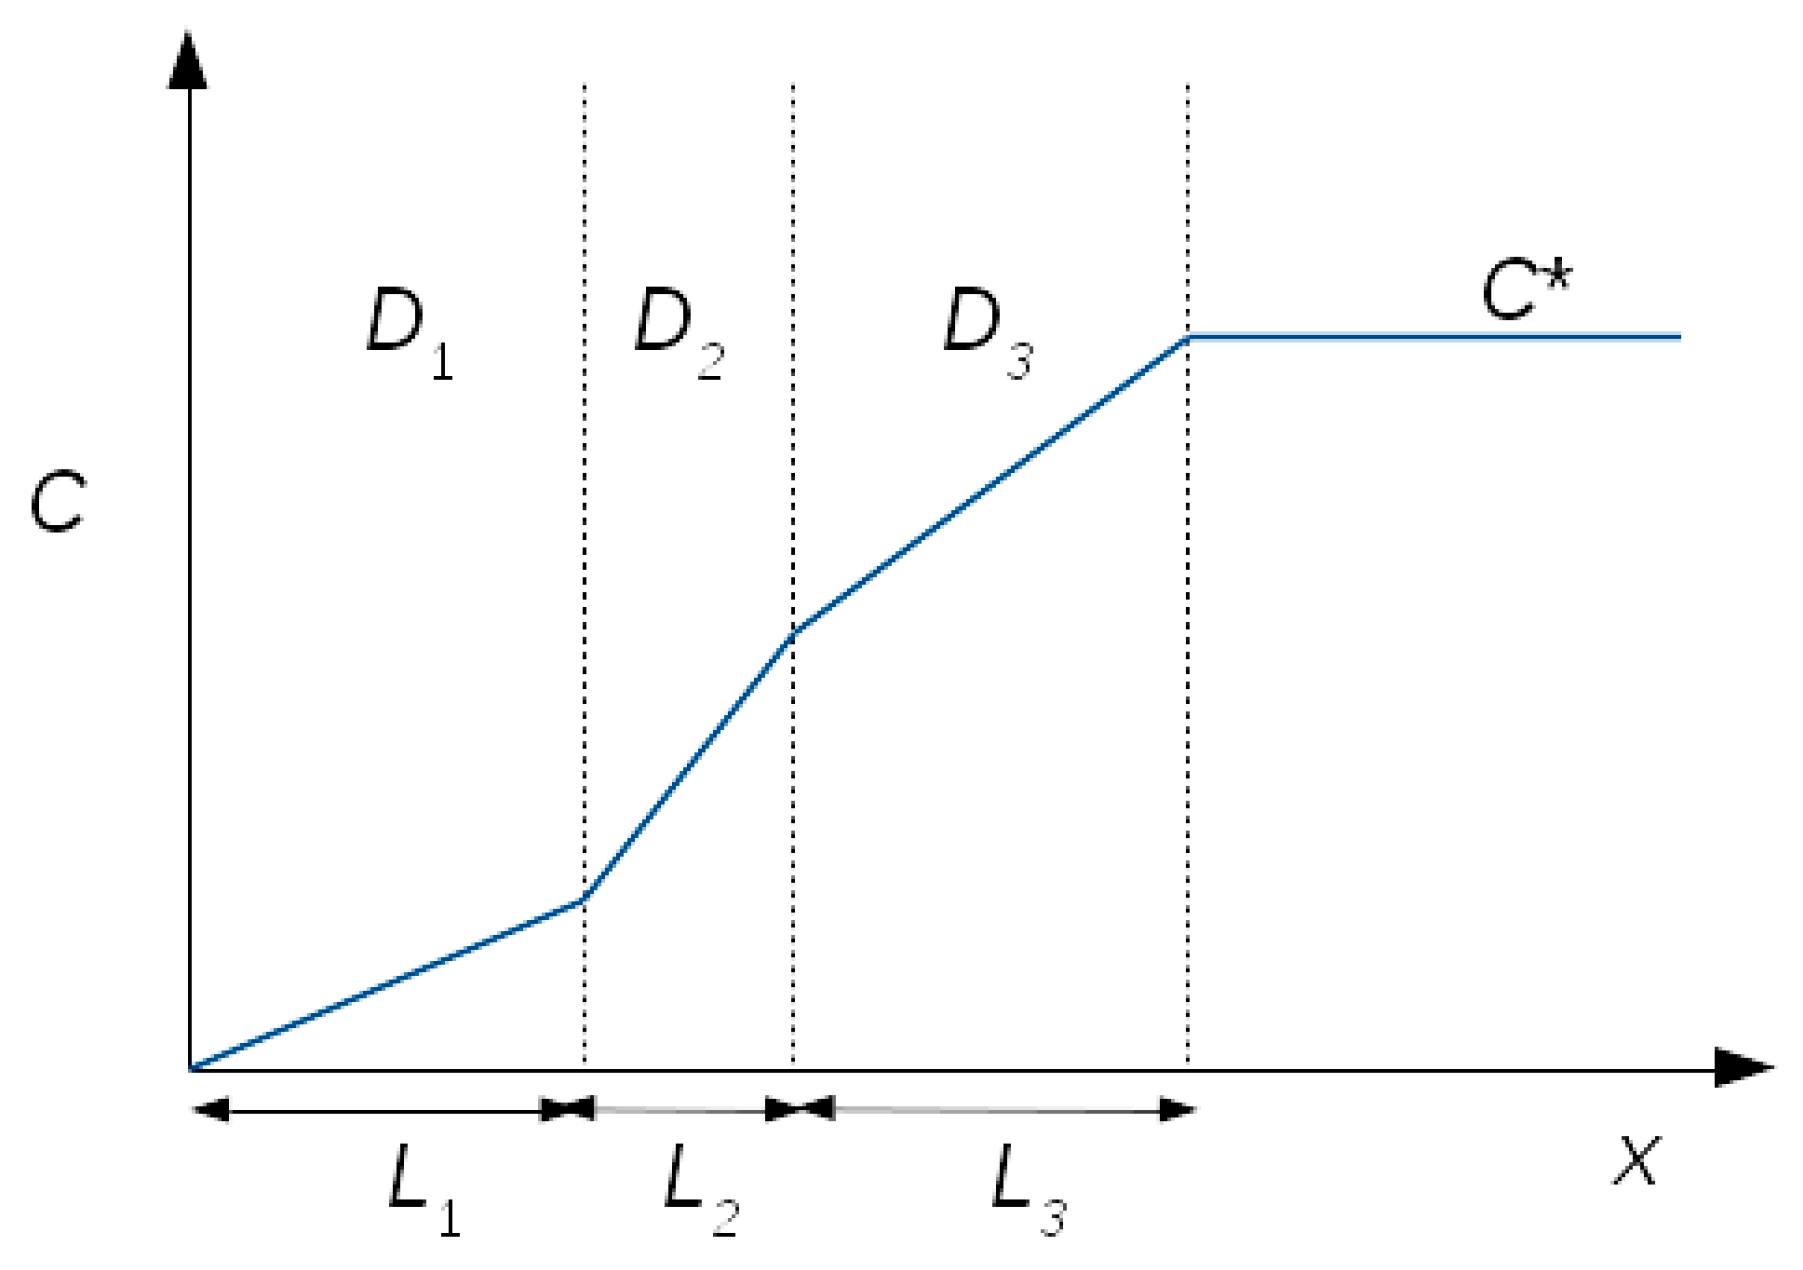
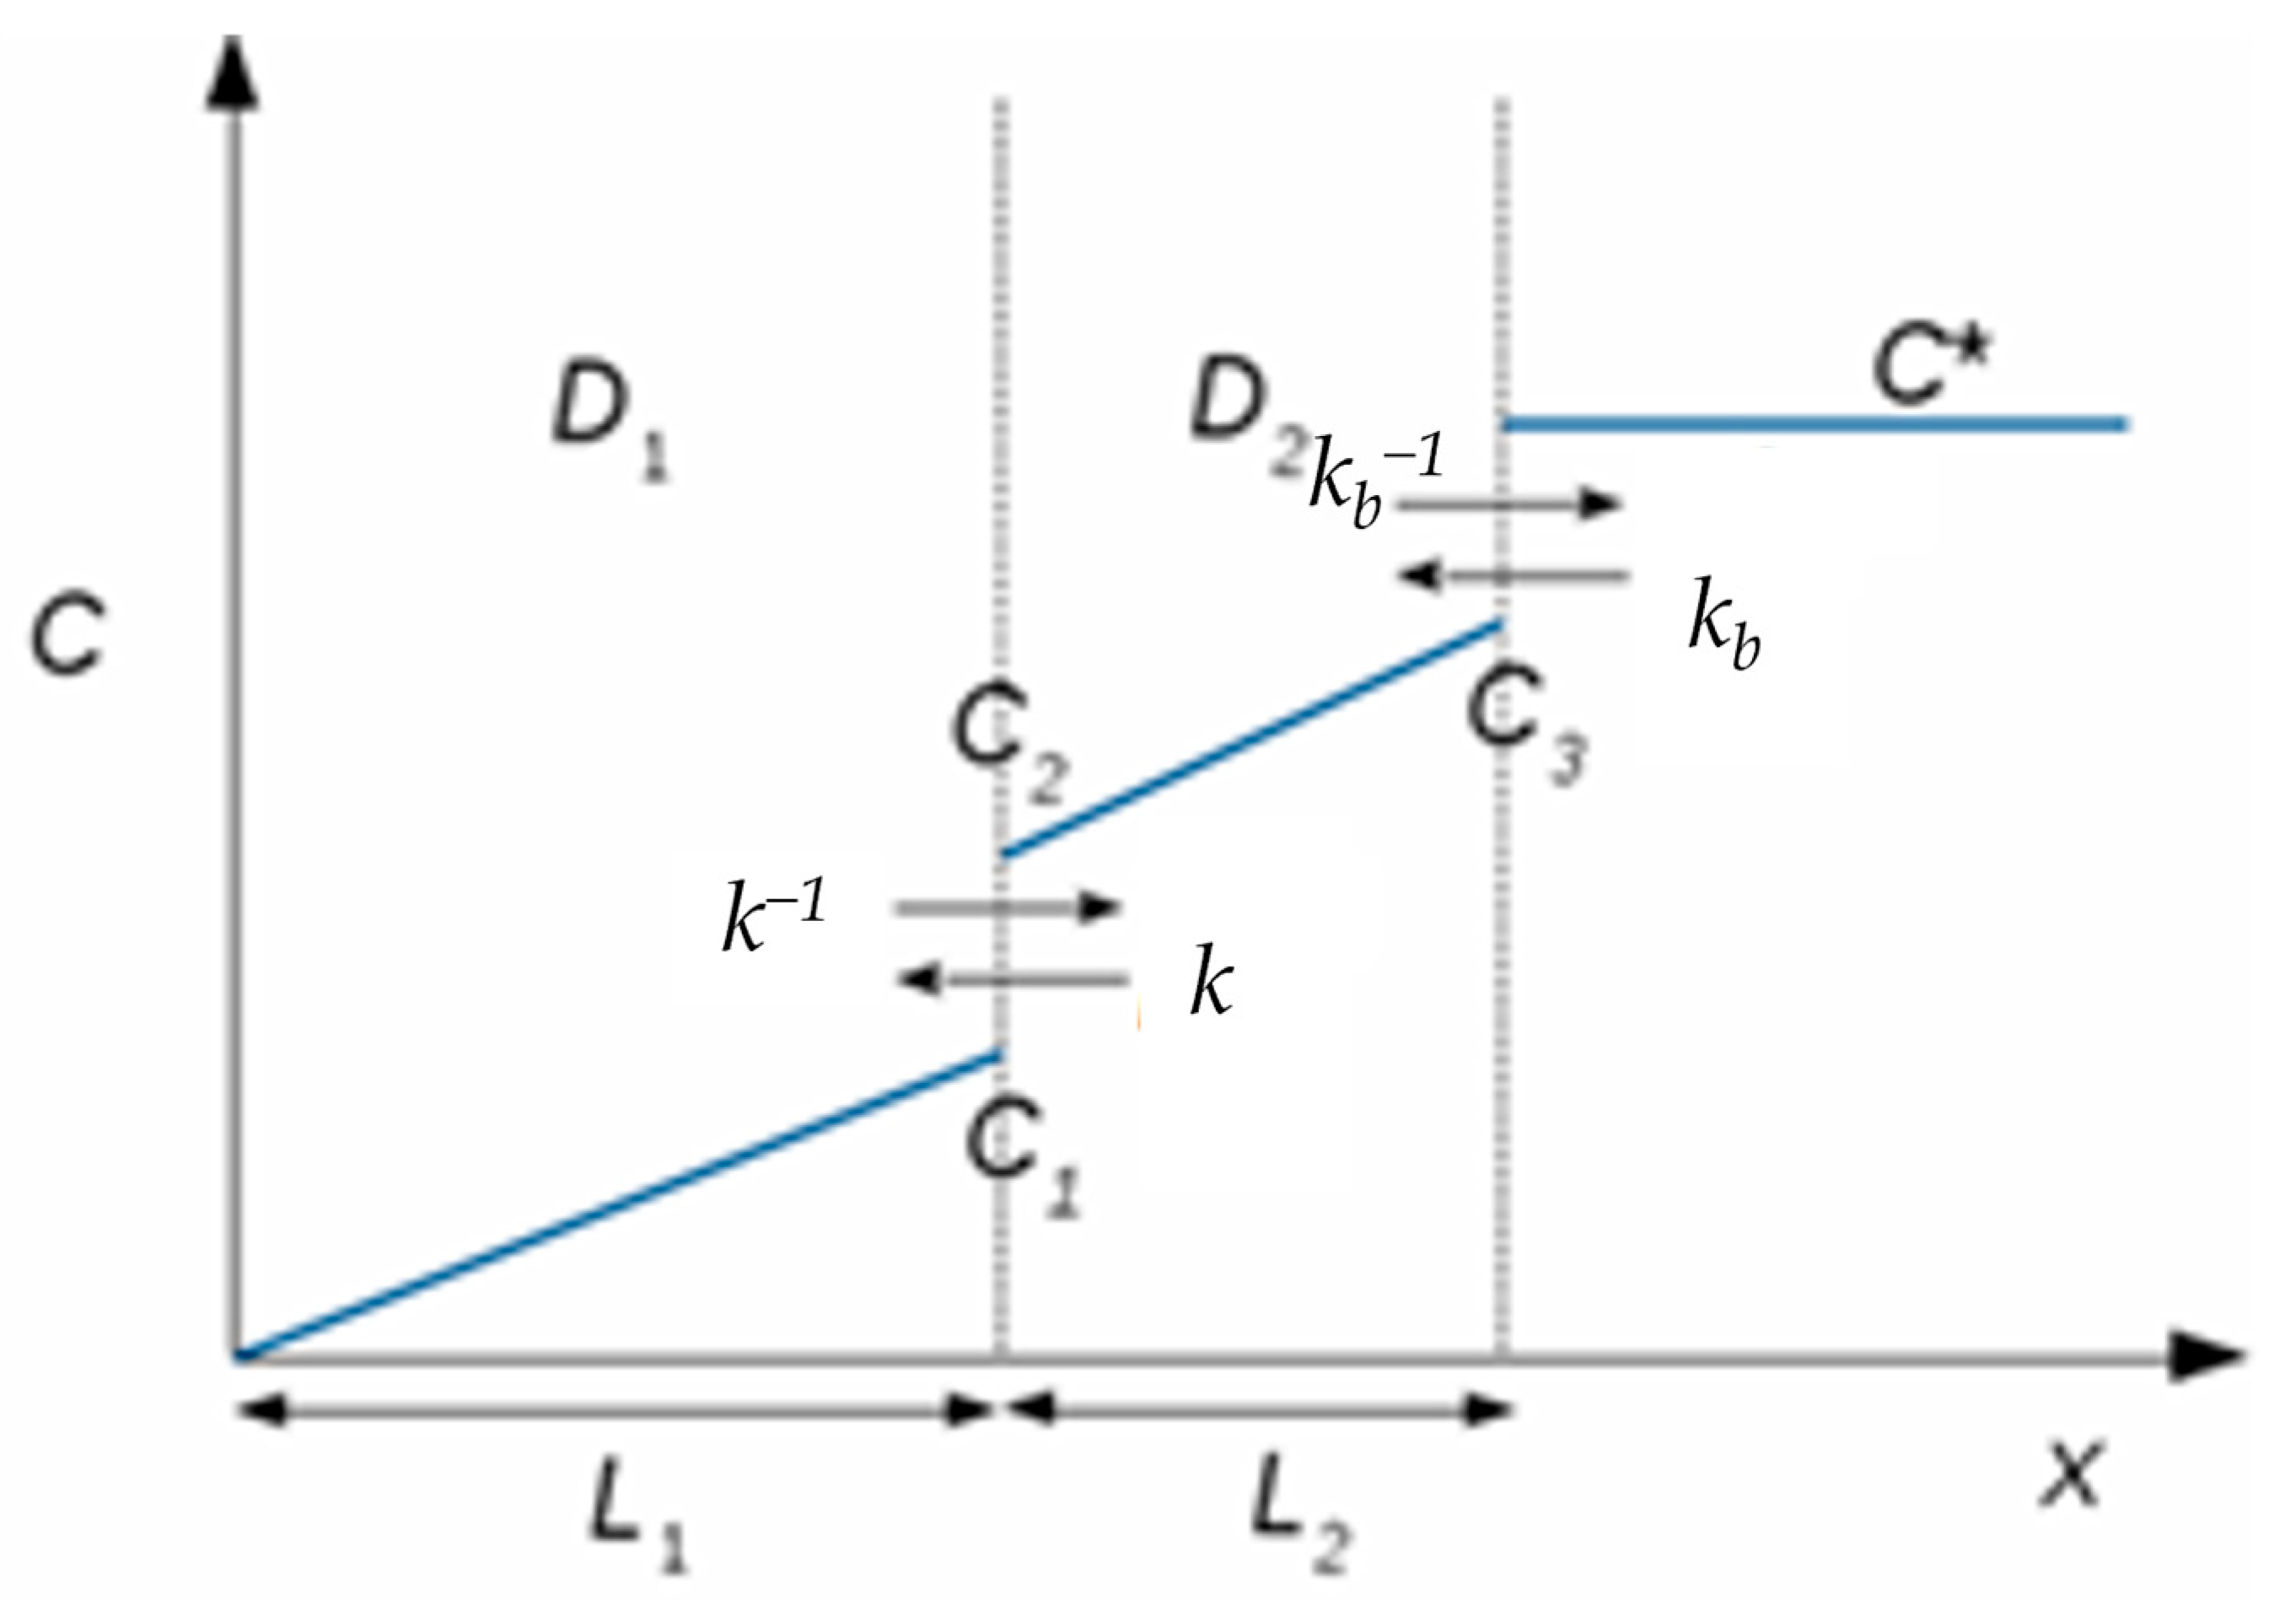
3.4. Modelling the Chronoamperometric Response
Modelling Limitations
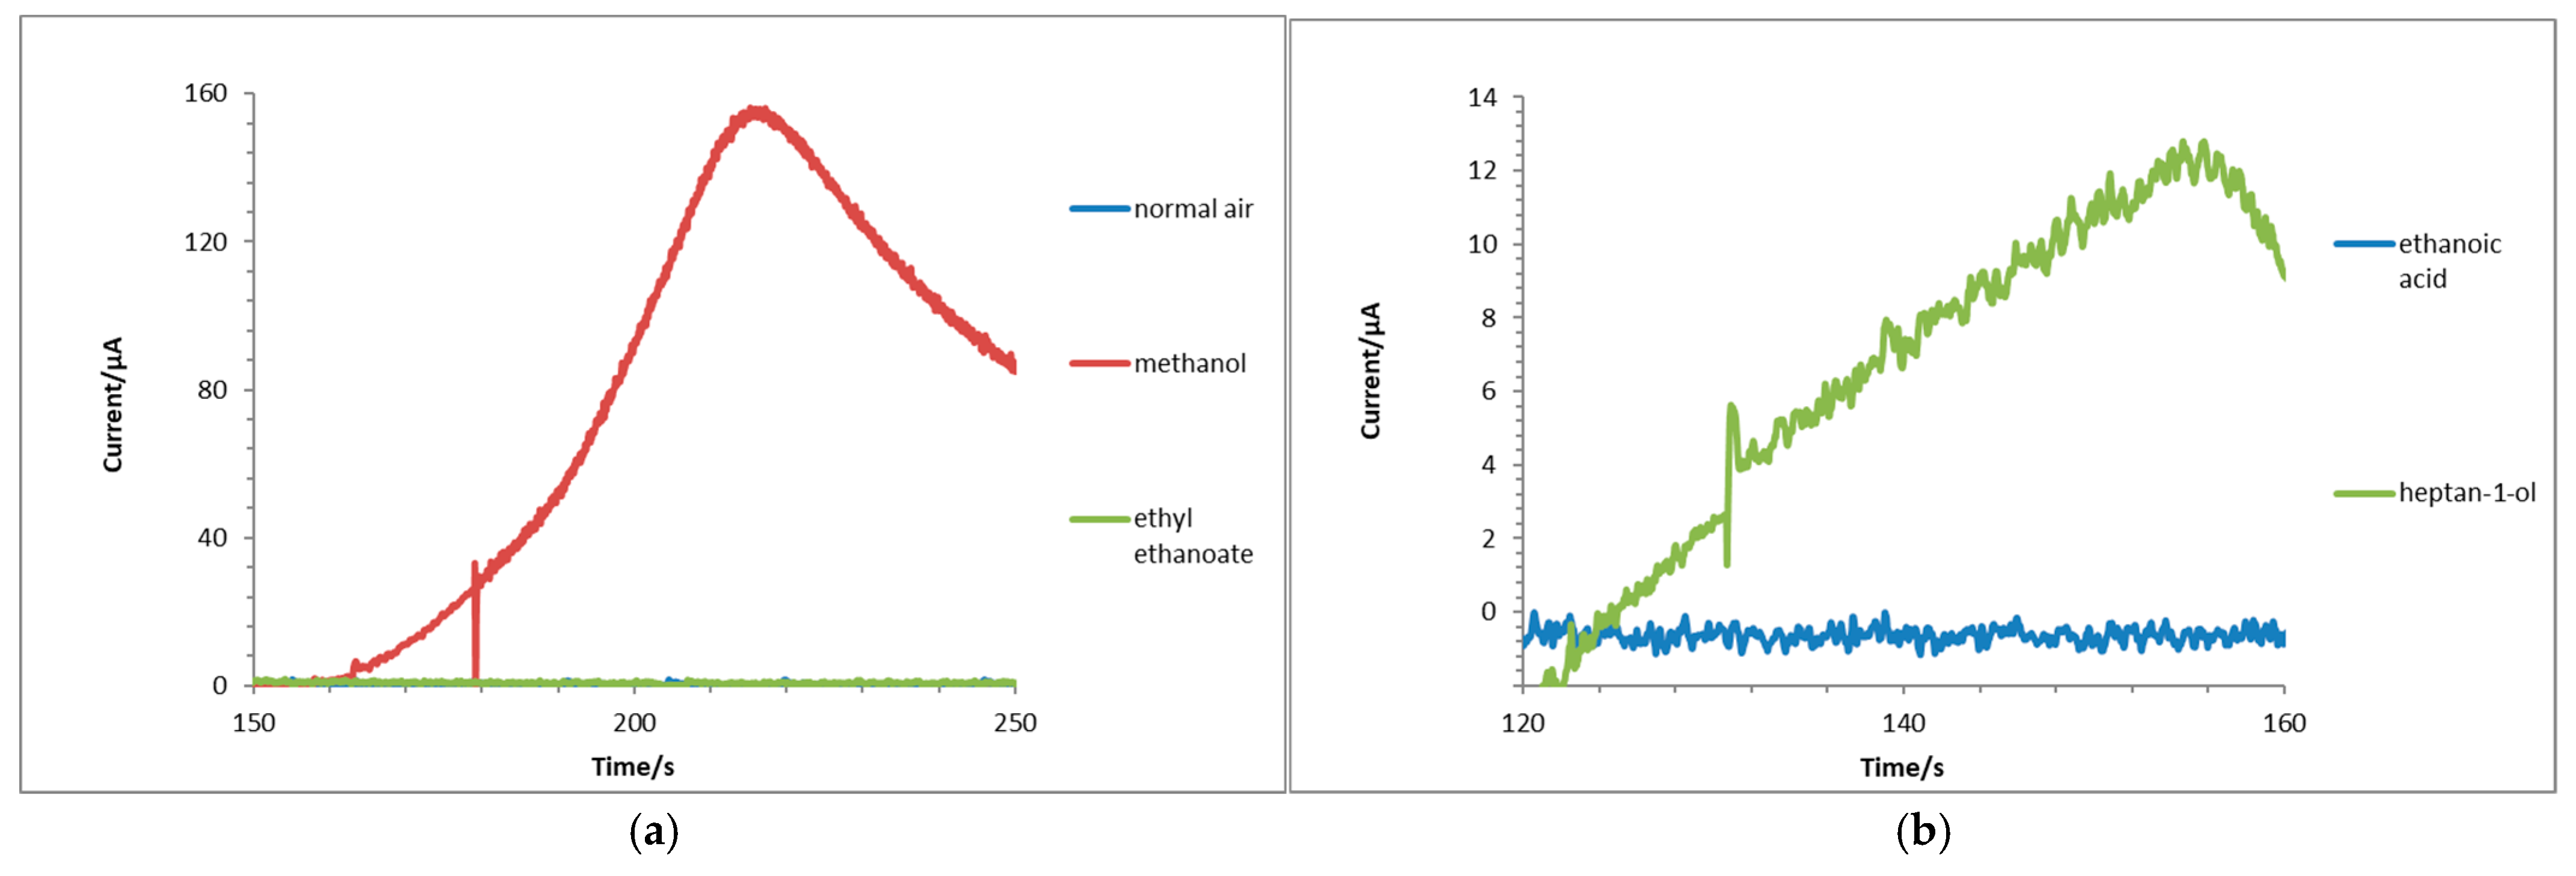
3.5. Response to Different Functional Groups
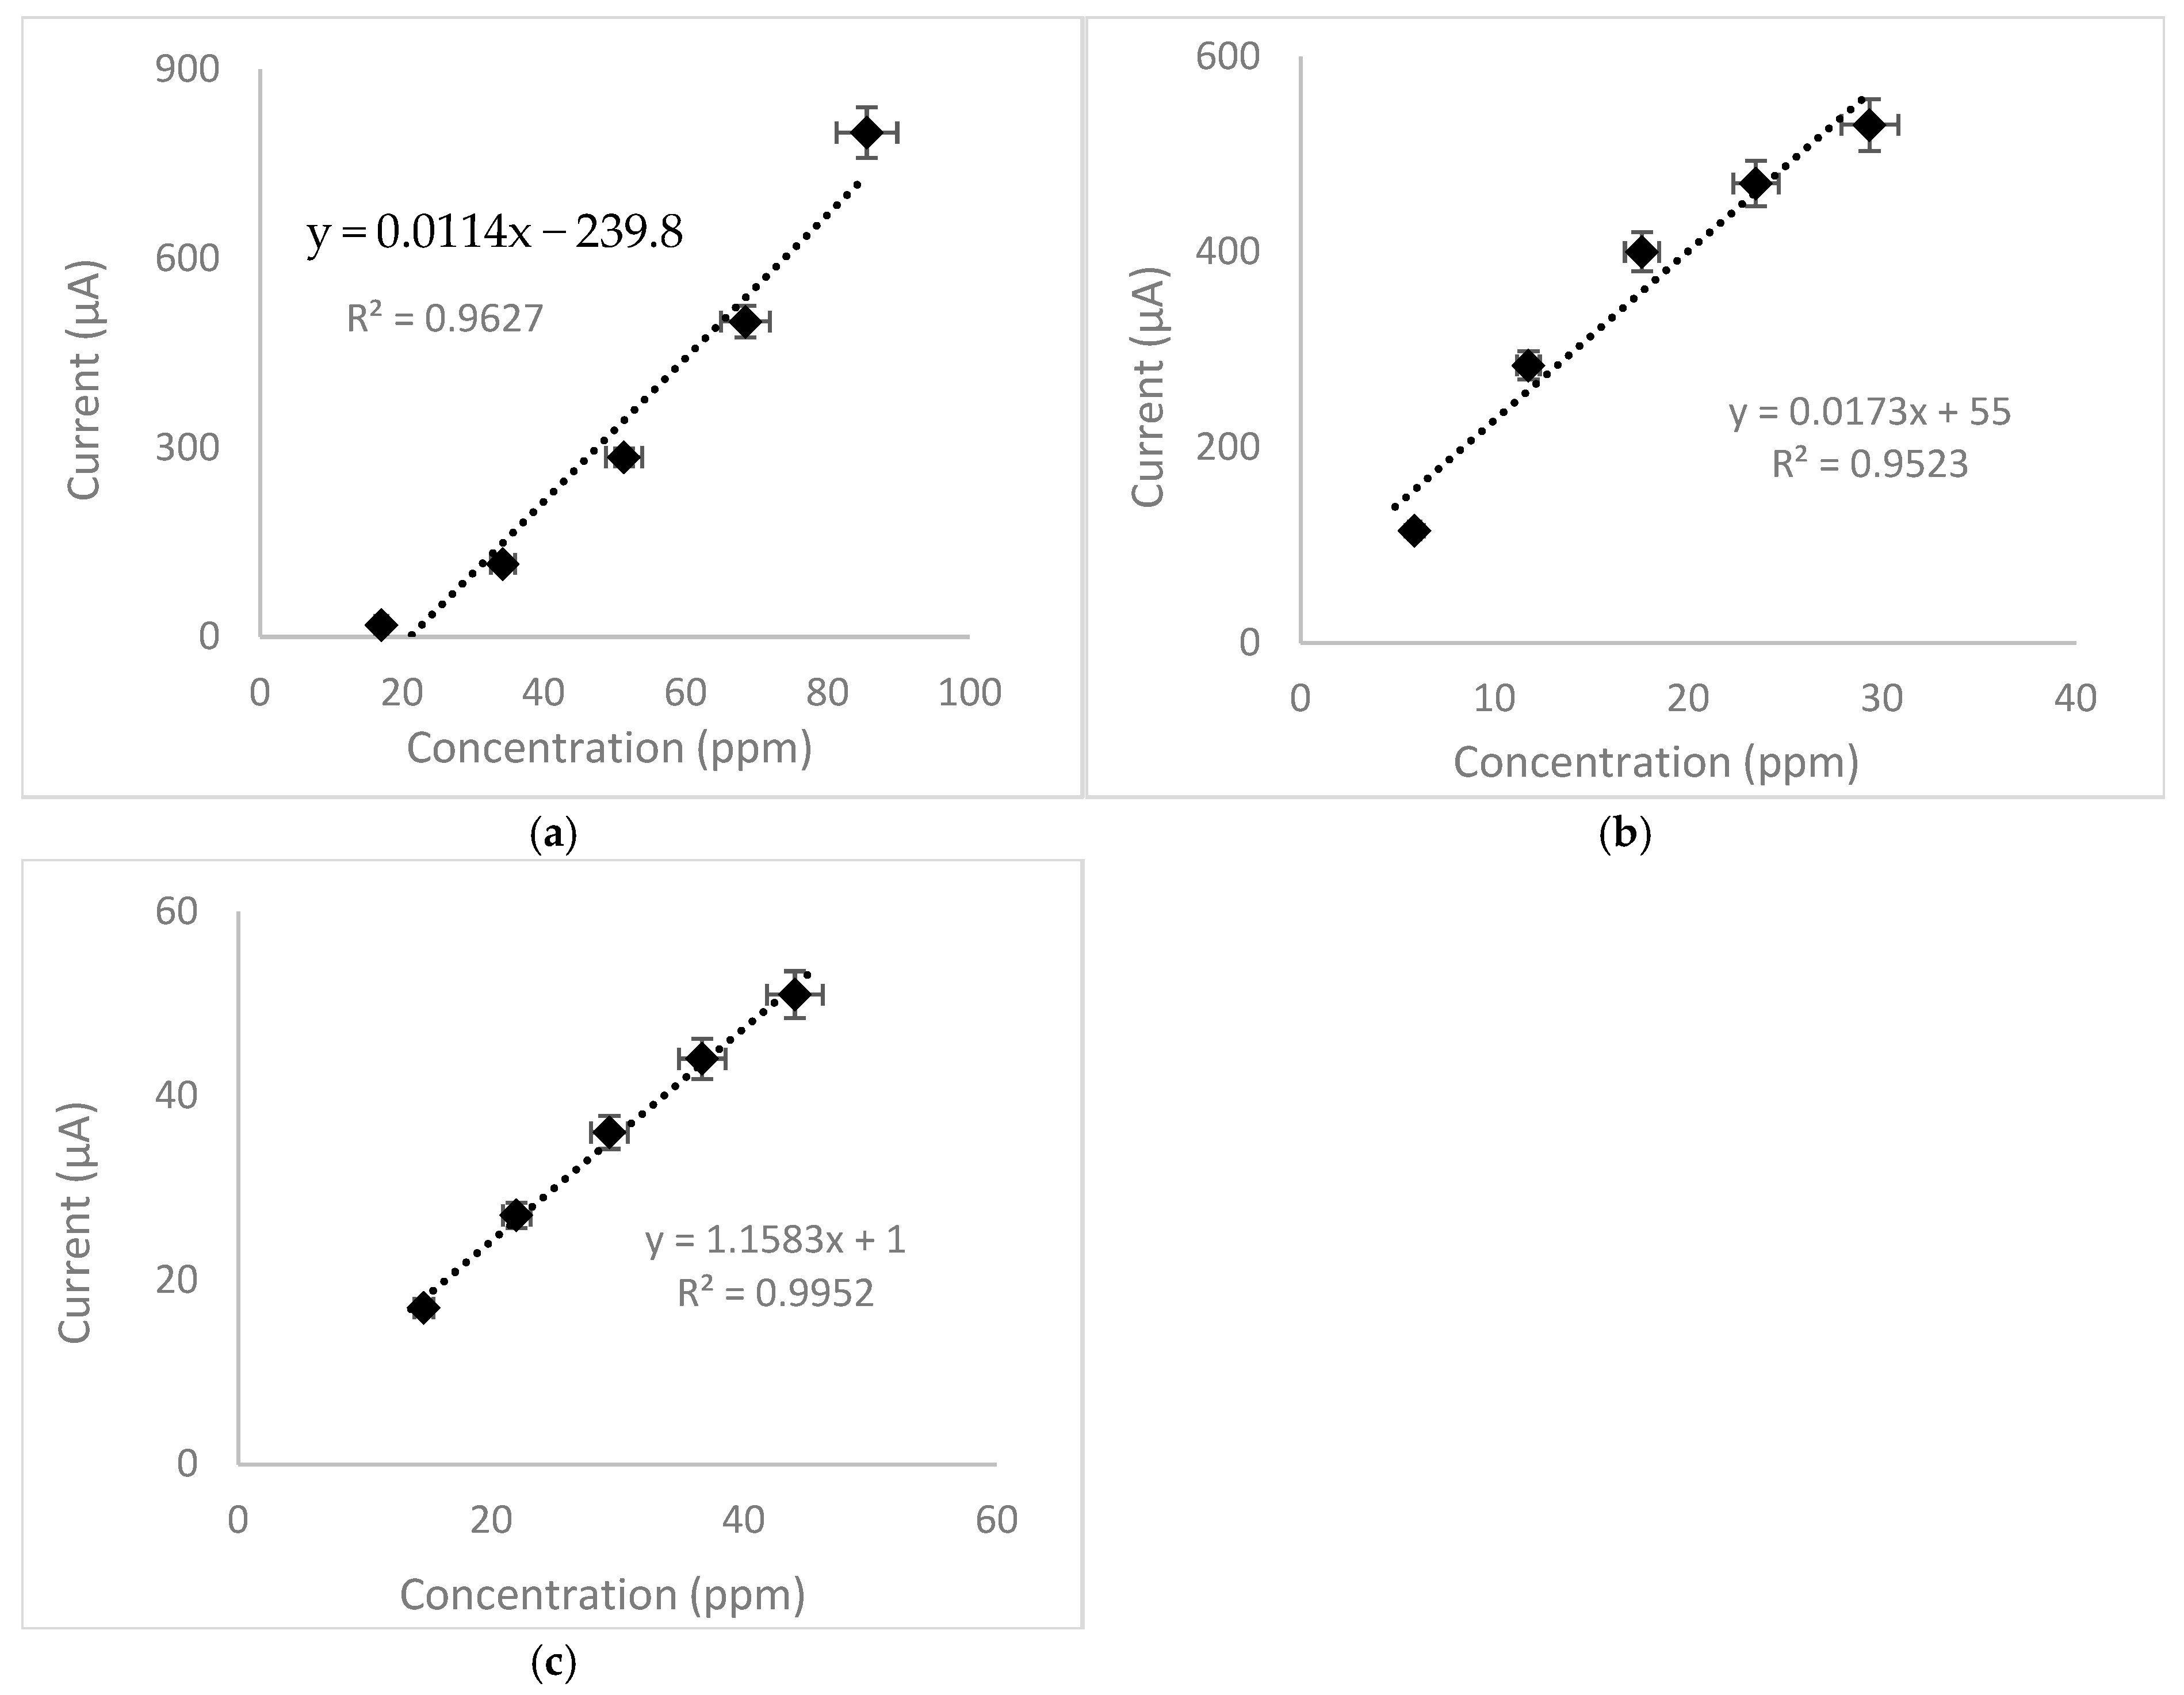
3.6. Quantitative Analysis
4. Conclusions
Author Contributions
Funding
Institutional Review Board Statement
Informed Consent Statement
Data Availability Statement
Acknowledgments
Conflicts of Interest
References
- Han, B.; Rupam, T.; Chakraborty, A.; Saha, B. A comprehensive review on VOCs sensing using different functional materials: Mechanisms, modifications, challenges and opportunities. Renew. Sustain. Energy Revs. 2024, 196, 114365. [Google Scholar] [CrossRef]
- Leidinger, M.; Sauerwold, T.; Conrad, T.; Reimringer, W.; Ventura, G.; Schutze, A. Selective Detection of Hazardous Indoor VOCs Using Metal Oxide Gas Sensors. Procedia Eng. 2014, 87, 1449–1452. [Google Scholar] [CrossRef]
- Raysoni, A.U.; Stock, T.H.; Sarnat, J.A.; Chavez, M.C.; Sarnat, S.E.; Montoya, T.; Holguin, F.; Li, W.-W. Evaluation of VOC concentrations in indoor and outdoor microenvironments at near-road schools. Environ. Pollut. 2017, 231, 681–693. [Google Scholar] [CrossRef]
- Khan, M.R.R.; Kang, S.-W. A High Sensitivity and Wide Dynamic Range Fiber-Optic Sensor for Low-Concentration VOC Gas Detection. Sensors 2014, 14, 23321–23336. [Google Scholar] [CrossRef]
- Chung, C.-K.; Ku, C.-A. An Effective Resistive-Type Alcohol Vapor Sensor Using One-Step Facile Nanoporous Anodic Alumina. Micromachines 2023, 14, 1330. [Google Scholar] [CrossRef]
- Sheng, H.; Ma, S.; Han, T.; Yun, P.; Yang, T.; Ren, J. A highly sensitivity and anti-humidity gas sensor for ethanol detection with NdFeO3 nano-coral granules. Vacuum 2022, 195, 110642. [Google Scholar] [CrossRef]
- Yu, J.; Wang, C.; Yuan, Q.; Yu, X.; Wang, D.; Chen, Y. Ag-Modified Porous Perovskite-Type LaFeO3 for Efficient Ethanol Detection. Nanomaterials 2022, 12, 1768. [Google Scholar] [CrossRef]
- Zhang, D.; Cao, Y.; Wu, J.; Zhang, X. Tungsten trioxide nanoparticles decorated tungsten disulfide nanoheterojunction for highly sensitive ethanol gas sensing application. Appl. Surf. Sci. 2020, 503, 144063. [Google Scholar] [CrossRef]
- Rodionov, Y.V.; Keppen, O.I.; Sukhacheva, M.V. A Photometric Assay for Ethanol. Appl. Biochem. Microbiol. 2002, 38, 395. [Google Scholar] [CrossRef]
- Schlangen, C.; Hammerle, M.; Moos, R. Amperometric enzyme electrodes for the determination of volatile alcohols in the headspace above fruit and vegetable juices. Microchim. Acta 2012, 179, 115–121. [Google Scholar] [CrossRef]
- Stepanov, A.G.; Zamaraev, K.I.; Thomas, J.M. 13C CP/MAS and 2H NMR study of tert-butyl alcohol dehydration on H-ZSM-5 zeolite. Evidence for the formation of tert-butyl cation and tert-butyl silyl ether intermediates. Catal. Lett. 1992, 13, 407–422. [Google Scholar] [CrossRef]
- Perez-Ponce, A.; de la Guardia, M. Partial least-squares–Fourier transform infrared spectrometric determination of methanol and ethanol by vapour-phase generation. Analyst 1998, 123, 1253–1258. [Google Scholar] [CrossRef]
- Ayad, M.M.; Torad, N.L. Alcohol vapours sensor based on thin polyaniline salt film and quartz crystal microbalance. Talanta 2009, 78, 1280–1285. [Google Scholar] [CrossRef]
- Jochmann, M.A.; Yuan, X.; Schmidt, T.C. Determination of volatile organic hydrocarbons in water samples by solid-phase dynamic extraction. Anal. Bioanal. Chem. 2007, 387, 2163–2174. [Google Scholar] [CrossRef]
- Ayad, M.M.; El-Hefnawey, G.; Torad, N.L. A sensor of alcohol vapours based on thin polyaniline base film and quartz crystal microbalance. J. Hazard. Mater. 2009, 168, 85–88. [Google Scholar] [CrossRef]
- Aragon, P.; Atienza, J.; Climent, M.D. Analysis of Organic Compounds in Air: A Review. Crit. Rev. Anal. Chem. 2000, 30, 121–151. [Google Scholar] [CrossRef]
- Tsang, S.; Bulpitt, C. Rare earth oxide sensors for ethanol analysis. Sens. Actuators B Chem. 1998, 52, 226–235. [Google Scholar] [CrossRef]
- Balbino, M.A.; Oiye, E.N.; Ribeiro, M.F.M.; Cruz Junio, J.W.; Eleoterio, I.C.; Ipolito, A.J.; Oliveira, M.F. Use of screen-printed electrodes for quantification of cocaine and Δ9-THC: Adaptions to portable systems for forensic purposes. J. Solid State Electrochem. 2016, 20, 2435–2443. [Google Scholar] [CrossRef]
- Smith, J.P.; Metters, J.P.; Kampouris, D.K.; Lledo-Fernandez, C.; Sutcliffe, O.B.; Banks, C.E. Forensic electrochemistry: The electroanalytical sensing of Rohypnol® (flunitrazepam) using screen-printed graphite electrodes without recourse for electrode or sample pre-treatment. Analyst 2013, 138, 6185–6191. [Google Scholar] [CrossRef]
- Cumba, L.R.; Smith, J.P.; Zuway, K.Y.; Sutcliffe, O.B.; do Carmo, D.R.; Banks, C.E. Forensic electrochemistry: Simultaneous voltammetric detection of MDMA and its fatal counterpart “Dr Death” (PMA). Anal. Methods 2016, 8, 142–152. [Google Scholar] [CrossRef]
- Morisawa, M.; Amemiya, Y.; Kohzu, H.; Liang, C.X.; Muto, S. Plastic optical fibre sensor for detecting vapour phase alcohol. Meas. Sci. Technol. 2001, 12, 877–881. [Google Scholar] [CrossRef]
- Wang, S.; Lee, H.-S. The development of in situ electrochemical oil-condition sensors. Sens. Actuators B Chem. 1994, 17, 179–185. [Google Scholar] [CrossRef]
- Nakamura, K.; Endoh, H.; Sakuraba, Y.; Yamamoto, S. High Resolution Analogue Detection Distributed Temperature Sensor using Deconvolution. In Optical Fiber Sensor; Optica Publishing Group: Washington, DC, USA, 1996; Volume 3. [Google Scholar] [CrossRef]
- Morisawa, M.; Kohzu, H.; Amemiya, Y.; Liang, C.-X.; Muto, S. Simple optic sensor for fuel gases. In International Conference on Sensors and Control Techniques (ICSC 2000); SPIE: Bellingham, WA, USA, 2000; Volume 4077, pp. 88–91. [Google Scholar]
- Gadomska, J.; Donten, M.; Stojek, Z.; Nyholm, L. Mass transport-controlled steady-state currents for methanol in a flow injection system. Analyst 1996, 121, 1869–1871. [Google Scholar] [CrossRef]
- Besson, M.; Gallezot, P. Selective oxidation of alcohols and aldehydes on metal catalysts. Catal. Today 2000, 57, 127–141. [Google Scholar] [CrossRef]
- Tripkovic, A.V.; Gojkovic, S.L.; Popovic, K.D.; Lovic, J.D. Methanol oxidation at platinum electrodes in acid solution: Comparison between model and real catalysts. J. Serb. Chem. Soc. 2006, 71, 1333–1343. [Google Scholar] [CrossRef]
- Raicheva, S.N.; Kalcheva, S.V.; Christov, M.V.; Sokolova, E.I. Mechanism of the electrooxidation of ethyl alcohol and acetaldehyde on a smooth platinum electrode: I. Contribution of the chemical and electrochemical reactions to the overall anodic process. Electroanal. Chem. Inter. Electrochem. 1974, 55, 213–222. [Google Scholar] [CrossRef]
- Shen, P.K.; Tseung, A.C.C. Anodic Oxidation of Methanol on Pt / WO3 in Acidic Media. J. Electrochem. Soc. 1994, 141, 3082–3090. [Google Scholar] [CrossRef]
- Yuan, C.X.; Fan, Y.-R.; Zhang, T.; Guo, H.-X.; Zhang, J.-X.; Wang, Y.-L.; Shan, D.-L.; Lu, X.-Q. A new electrochemical sensor of nitro aromatic compound based on three-dimensional porous Pt–Pd nanoparticles supported by graphene–multiwalled carbon nanotube composite. Biosens. Bioelectron. 2014, 58, 85–91. [Google Scholar] [CrossRef]
- Chen, Y.; Chen, K.-Y.; Tseung, A.C.C. An electrochemical alcohol sensor based on a co-electrodeposited Pt ∣ WO3 electrode. J. Electroanal. Chem. 1999, 471, 151–155. [Google Scholar] [CrossRef]
- Tripkovic, A.V.; Popovic, K.D.; Grgur, B.N.; Blizanac, B.; Ross, P.N.; Markovic, N.M. Methanol electrooxidation on supported Pt and PtRu catalysts in acid and alkaline solutions. Electrochim. Acta 2002, 47, 3707–3714. [Google Scholar] [CrossRef]
- Jarvi, T.D.; Sriramulu, S.; Stuve, E.M. Reactivity and extent of poisoning during methanol electro-oxidation on platinum (100) and (111): A comparative study. Colloids Surf. A Physicochem. Eng. Asp. 1998, 134, 145–153. [Google Scholar] [CrossRef]
- Prabhuram, J.; Manoharan, R. Investigation of methanol oxidation on unsupported platinum electrodes in strong alkali and strong acid. J. Power Sources 1998, 74, 54–61. [Google Scholar] [CrossRef]
- Mathieu, M.-V.; Primet, M. Sulfurization and regeneration of platinum. Appl. Catal. 1984, 9, 361–370. [Google Scholar] [CrossRef]
- Shi, W.; Yi, B.; Hou, M.; Jing, F.; Ming, P. Hydrogen sulfide poisoning and recovery of PEMFC Pt-anodes. J. Power Sources 2007, 165, 814–818. [Google Scholar] [CrossRef]
- Kowalczyk, Z.; Stolecki, K.; Rarog-Pilecka, W.; Miskiewicz, E.; Wilczkowska, E.; Karpinski, Z. Supported ruthenium catalysts for selective methanation of carbon oxides at very low COx/H2 ratios. Appl. Catal. A Gen. 2008, 342, 35–39. [Google Scholar] [CrossRef]
- Kutz, R.B.; Braunsschweig, B.; Mukherjee, P.; Behrens, R.L.; Dlott, D.D.; Wieckowski, A. Reaction pathways of ethanol electrooxidation on polycrystalline platinum catalysts in acidic electrolytes. J. Catal. 2011, 278, 181–188. [Google Scholar] [CrossRef]
- Han, L.; Ju, H.; Xu, Y. Ethanol electro-oxidation: Cyclic voltammetry, electrochemical impedance spectroscopy and galvanostatic oscillation. Int. J. Hydrogen Energy 2012, 37, 15156–15163. [Google Scholar] [CrossRef]
- Joo, S.H.; Park, J.Y.; Renzas, J.R.; Butcher, D.R.; Huang, W.; Somorjai, G.A. Size Effect of Ruthenium Nanoparticles in Catalytic Carbon Monoxide Oxidation. Nano Lett. 2010, 10, 2709–2713. [Google Scholar] [CrossRef]
- Rizo, R.; Perez-Rodriguez, S.; Garcia, G. Well-Defined Platinum Surfaces for the Ethanol Oxidation Reaction. ChemElectroChem 2019, 6, 4725–4738. [Google Scholar] [CrossRef]
- Rizo, R.; Ferre-Vilaplana, A.; Herrero, E.; Feliu, J.M. Ethanol Electro-oxidation Reaction Selectivity on Platinum in Aqueous Media. ACS Sustain. Chem. Eng. 2023, 11, 4960–4968. [Google Scholar] [CrossRef]
- Rousseau, S.; Coutanceau, C.; Lamy, C.; Leger, J.-M. Direct ethanol fuel cell (DEFC): Electrical performances and reaction products distribution under operating conditions with different platinum-based anodes. J. Power Sources 2006, 158, 18–24. [Google Scholar] [CrossRef]
- Vigier, F.; Coutanceau, C.; Hahn, F.; Belgsir, E.M.; Lamy, C. On the mechanism of ethanol electro-oxidation on Pt and PtSn catalysts: Electrochemical and in situ IR reflectance spectroscopy studies. J. Electroanal. Chem. 2004, 563, 81–89. [Google Scholar] [CrossRef]
- Florez-Montano, J.; Garcia, G.; Guillen-Villafuerte, O.; Rodriguez, J.L.; Planes, G.A.; Pastor, E. Mechanism of ethanol electrooxidation on mesoporous Pt electrode in acidic medium studied by a novel electrochemical mass spectrometry set-up. Electrochim. Acta 2016, 209, 121–131. [Google Scholar] [CrossRef]
- Kumar, A.; Sanger, A.; Kumar, A.; Chandra, R. Highly sensitive and selective CO gas sensor based on a hydrophobic SnO2/CuO bilayer. RSC Adv. 2016, 6, 47178–47184. [Google Scholar] [CrossRef]
- Rutolo, M.F.; Clarkson, J.P.; Harper, G.; Covington, J.A. The use of gas phase detection and monitoring of potato soft rot infection in store. Postharvest Biol. Technol. 2018, 145, 15–19. [Google Scholar] [CrossRef]
- Agbroko, S.O.; Covington, J. A novel, low-cost, portable PID sensor for the detection of volatile organic compounds. Sens. Actuators B Chem. 2018, 275, 10–15. [Google Scholar] [CrossRef]
- Favard, A.; Aguir, K.; Contaret, T.; Dumas, A.; Bendahan, M. Detection and measuring of BTEX traces at the ppb level using metal oxide gas sensor. Mater. Today Proc. 2019, 6, 323–327. [Google Scholar] [CrossRef]
- Ambrose, D.; Sprake, C.H.S.; Townsend, R. Thermodynamic properties of organic oxygen compounds XXXVII. Vapour pressures of methanol, ethanol, pentan-1-ol, and octan-1-ol from the normal boiling temperature to the critical temperature. J. Chem. Thermodyn. 1975, 7, 185–190. [Google Scholar] [CrossRef]
- Ambrose, D.; Sprake, C.H.S. Thermodynamic properties of organic oxygen compounds XXV. Vapour pressures and normal boiling temperatures of aliphatic alcohols. J. Chem. Thermodyn. 1970, 2, 631–645. [Google Scholar] [CrossRef]
- Sun, S.; Halseid, M.C.; Heinen, M.; Jusys, Z.; Behm, R.J. Ethanol electrooxidation on a carbon-supported Pt catalyst at elevated temperature and pressure: A high-temperature/high-pressure DEMS study. J. Power Sources 2009, 190, 2–13. [Google Scholar] [CrossRef]
- Yan, S.-Y.; Huang, Y.-R.; Yang, C.-Y.; Liu, C.-W.; Wang, J.-H.; Wang, K.-W. Enhanced activity of ethanol oxidation reaction on PtM (M=Au, Ag and Sn): The importance of oxophilicity and surface oxygen containing species. Electrochim. Acta 2018, 259, 733–741. [Google Scholar] [CrossRef]
- Available online: http://www.Alphasense.com/WEB1213/wp-content/uploads/2013/07/COAF.pdf (accessed on 24 May 2013).
- Available online: https://webbook.nist.gov/chemistry/ (accessed on 14 April 2024).
- Crank, J. Mathematics of Diffusion, 2nd ed.; Clarendon Press: Oxford, UK, 1975. [Google Scholar]
- Sander, R. Compilation of Henry’s law constants (version 4.0) for water as solvent. Atmos. Chem. Phys. 2015, 15, 4399–4981. [Google Scholar]
- Katikawong, P.; Ratana, T.; Veerasai, W. Temperature dependence studies on the electro-oxidation of aliphatic alcohols with modified platinum electrodes. J. Chem. Sci. 2009, 121, 329–337. [Google Scholar] [CrossRef]
- Wang, H.; Jusys, Z.; Behm, R.J. Ethanol Electrooxidation on a Carbon-Supported Pt Catalyst: Reaction Kinetics and Product Yields. J. Phys. Chem. B 2004, 108, 19413–19424. [Google Scholar] [CrossRef]
- Kinoshita, K.; Lundquist, J.T.; Stonehart, P. Potential cycling effects on platinum electrocatalyst surfaces. J. Electroanal. Chem. Interfacial Electrochem. 1973, 48, 157–166. [Google Scholar] [CrossRef]
- Rand, D.A.J.; Woods, R. A study of the dissolution of platinum, palladium, rhodium and gold electrodes in 1 m sulphuric acid by cyclic voltammetry. J. Electroanal. Chem. Interfacial Electrochem. 1972, 35, 209–218. [Google Scholar] [CrossRef]
- Saunders, L.; Mudashiru, L.K.; Baron, R.; Horrocks, B.R. Diffusion Models of Mass Transport for the Characterisation of Amperometric Gas Sensors. ChemElectroChem 2024, 11, 202300708. [Google Scholar] [CrossRef]
- Li, F.; Niu, J. Simultaneous estimation of VOCs diffusion and partition coefficients in building materials via inverse analysis. Build. Environ. 2005, 40, 1366–1374. [Google Scholar] [CrossRef]
- Liu, Y.; Zhou, X.; Wang, D.; Song, C.; Liu, J. A diffusivity model for predicting VOC diffusion in porous building materials based on fractal theory. J. Hazard. Mater. 2015, 299, 685–695. [Google Scholar] [CrossRef] [PubMed]
- Xu, J.; Zhang, J.S. An experimental study of relative humidity effect on VOCs’ effective diffusion coefficient and partition coefficient in a porous medium. Build. Environ. 2011, 46, 1785–1796. [Google Scholar] [CrossRef]
- Shen, X.; Chen, Z. Fractal diffusion of VOCs in dry porous building materials. Build. Simul. 2010, 3, 225–231. [Google Scholar] [CrossRef]
- Hafner, S.D.; Montes, F.; Alan Rotz, C. A mass transfer model for VOC emission from silage. Atmos. Environ. 2012, 54, 134–140. [Google Scholar] [CrossRef]
- Tang, M.J.; Shiraiwa, M.; Poschl, U.; Cox, R.A.; Kalberer, M. Compilation and evaluation of gas phase diffusion coefficients of reactive trace gases in the atmosphere: Volume 2. Diffusivities of organic compounds, pressure-normalised mean free paths, and average Knudsen numbers for gas uptake calculations. Atmos. Chem. Phys. 2015, 15, 5585–5598. [Google Scholar] [CrossRef]
- Van Loon, L.L.; Allen, H.C.; Wyslouzil, B.E. Effective Diffusion Coefficients for Methanol in Sulfuric Acid Solutions Measured by Raman Spectroscopy. J. Phys. Chem. A 2008, 112, 10758–10763. [Google Scholar] [CrossRef]
- Michelsen, R.R.; Staton, S.J.R.; Iraci, L.T. Uptake and Dissolution of Gaseous Ethanol in Sulfuric Acid. J. Phys. Chem. A 2006, 110, 6711–6717. [Google Scholar] [CrossRef]
- Batista, E.A.; Hoster, H.; Iwasita, T. Analysis of FTIRS data and thermal effects during methanol oxidation on UHV-cleaned PtRu alloys. J. Electroanal. Chem. 2003, 554, 265–271. [Google Scholar] [CrossRef]
- Fugivara, C.S.; Sumodjo, P.T.A.; Rabockai, T. Adsorption kinetics of n-propanol on platinized platinum electrode in sulphuric acid solution. Electrochim. Acta 1989, 34, 363–370. [Google Scholar] [CrossRef]
- Simari, C.; Enotiadis, A.; Lo Vecchio, C.; Baglio, V.; Coppola, L.; Nicotera, I. Advances in hybrid composite membranes engineering for high-performance direct methanol fuel cells by alignment of 2D nanostructures and a dual-layer approach. J. Membr. Sci. 2020, 599, 117858. [Google Scholar] [CrossRef]
- Vasile, N.S.; Monteverde Videla, A.H.A.; Simari, C.; Nicotera, I.; Specchia, S. Influence of membrane-type and flow field design on methanol crossover on a single-cell DMFC: An experimental and multi-physics modeling study. Int. J. Hydrogen Energy 2017, 42, 27995–28010. [Google Scholar] [CrossRef]


| Sensor Technology | Application | Advantages | Disadvantages |
|---|---|---|---|
| Photoionisation | VOC gas concentration analysis [47] | High accuracy whilst being relatively cheap to run [48] | Low selectivity which can give false readings in complex samples |
| Solid State (Metal Oxide) Semiconductor | High-stability analyte gas analysis [46] | Thermal energy allows the reaction analysis of otherwise stable (undetectable) compounds | Only usable where a constant large power supply is available |
| Amperometric | Environmental analysis in remote locations | It has a high selectivity whilst being small and compact, which allows for portable usage [43] | Lower precision than other technologies and a smaller limit of detection range |
| VOC | Vapour Pressure at 20 °C (kPa) | Concentration at 50 mL min−1 Constant Flow Rate (×10−3 mol dm−3) | A | B | C |
|---|---|---|---|---|---|
| methanol | 13.3 ± 0.3 | 5 | 5.2 | 1581 | −33.5 |
| ethanol | 5.9 ± 0.1 | 2 | 5.4 | 1670 | −40.2 |
| heptan-1-ol | 0.02 ± 0.01 | 0.8 | 4.0 | 1257 | −133.5 |
| Alcohol | Calculated Capacitance (±0.02 F) |
|---|---|
| methanol | 0.12 |
| ethanol | 0.14 |
| heptan-1-ol | 0.15 |
| VOC | L (±0.1 µm) | D (±1 × 10⁻¹² cm2 s−1) | L2/D (±0.2 × 10⁶ s) |
|---|---|---|---|
| methanol | 0.3 | 3 | 3.3 |
| ethanol | 0.1 | 1 | 3.1 |
| heptan-1-ol | 0.2 | 4 | 0.6 |
Disclaimer/Publisher’s Note: The statements, opinions and data contained in all publications are solely those of the individual author(s) and contributor(s) and not of MDPI and/or the editor(s). MDPI and/or the editor(s) disclaim responsibility for any injury to people or property resulting from any ideas, methods, instructions or products referred to in the content. |
© 2025 by the authors. Licensee MDPI, Basel, Switzerland. This article is an open access article distributed under the terms and conditions of the Creative Commons Attribution (CC BY) license (https://creativecommons.org/licenses/by/4.0/).
Share and Cite
Saunders, L.; Baron, R.; Horrocks, B.R. Amperometric Alcohol Vapour Detection and Mass Transport Diffusion Modelling in a Platinum-Based Sensor. Electrochem 2025, 6, 24. https://doi.org/10.3390/electrochem6030024
Saunders L, Baron R, Horrocks BR. Amperometric Alcohol Vapour Detection and Mass Transport Diffusion Modelling in a Platinum-Based Sensor. Electrochem. 2025; 6(3):24. https://doi.org/10.3390/electrochem6030024
Chicago/Turabian StyleSaunders, Luke, Ronan Baron, and Benjamin R. Horrocks. 2025. "Amperometric Alcohol Vapour Detection and Mass Transport Diffusion Modelling in a Platinum-Based Sensor" Electrochem 6, no. 3: 24. https://doi.org/10.3390/electrochem6030024
APA StyleSaunders, L., Baron, R., & Horrocks, B. R. (2025). Amperometric Alcohol Vapour Detection and Mass Transport Diffusion Modelling in a Platinum-Based Sensor. Electrochem, 6(3), 24. https://doi.org/10.3390/electrochem6030024