Abstract
Highly dispersion antimony-doped tin oxide (ATO) nanoparticles were synthesized using a (220 °C, 2 L autoclave, medium scale) one-step hydrothermal method with Na2SnO3 and KSb(OH)6 as precursors without a post-sintering process. The particle size reduces to a few nanometers with the increase in Sb content. The resulting various Sb-doping content ATO nanoparticles were coated onto a Ti foil substrate as an electrode for further electrochemical evaluation. The findings demonstrate that the prepared 30% Sb-doped ATO nanoparticles serve as a high-conductivity electrode material with excellent reversibility, substantial specific capacitance, and superior capacitance retention. The 30% ATO electrode exhibits the highest specific capacitance of 343.2 F g−1 at a current density of 1 A g−1 and maintains 93% of its capacitance after the first 10 charge/discharge cycles. The results indicate that ATO materials prepared by the hydrothermal method are promising candidates for supercapacitor electrodes.
1. Introduction
Tin oxide (SnO2) is a wide-band gap n-type semiconductor, primarily due to oxygen vacancies, with numerous applications in gas sensors, transparent conductive coatings, solar cells, and supercapacitors [1,2,3,4]. However, its intrinsic conductivity remains relatively low. To enhance its electrical properties, doping with various elements such as indium (In), antimony (Sb), fluorine (F), aluminum (Al), and gallium (Ga) has proven effective, significantly improving electron transport within the material [5,6,7,8]. Antimony-doped tin oxide (ATO) exhibits high electrical conductivity, facilitating efficient charge transfer between the electrode material and the electrolyte. Additionally, ATO offers several advantages, including cost-effectiveness, excellent conductivity, high stability, and ease of synthesis, making it a promising electrode material for energy storage applications [9]. Various synthesis methods have been employed to fabricate ATO nanoparticles (NPs), including the combustion method [10], ammonia-diffusion co-precipitation [11], the sol–gel method [12], and hydrothermal techniques [13]. Typically, the formation of nanosized crystalline nuclei occurs at moderate temperatures (200–300 °C), but further high-temperature sintering is often necessary to enhance crystallinity [14].
Supercapacitors are energy storage devices known for their high power density compared to conventional batteries, which have gained significant attention for hybrid vehicles. Among various electrode materials, pseudocapacitive materials—including transition metal oxides and conductive polymers—exhibit superior energy storage capabilities, often delivering power densities 10 to 100 times greater than electric double-layer capacitors (EDLCs) [15]. Antimony-doped tin oxide (ATO) has emerged as a promising pseudocapacitive material for supercapacitor electrodes due to the improved electrical conductivity and increased surface active sites introduced by Sb doping, which facilitate faster ion transport and enhanced faradaic redox reactions at the electrode-electrolyte interface [16]. Various synthesis methods have been explored to fabricate ATO nanoparticles (NPs) with optimized electrochemical performance. For instance, Fouad et al. employed the co-precipitation method to fabricate ATO NPs, and subsequent electrochemical tests—including cyclic voltammetry, galvanostatic charge–discharge, and electrochemical impedance spectroscopy—demonstrated a specific capacitance of 140 F/g [17]. Similarly, Xu et al. synthesized ATO NPs via co-precipitation, yielding particles ranging from 0.5 to 100 μm in size. Their electrochemical analysis showed a specific capacitance of 158.2 F/g at a current density of 1 A/g, retaining 72% of its capacitance even at 10 A/g [18]. Further advancements in ATO-based electrodes include Zhang et al.’s work, where hydrothermally synthesized ~12 nm ATO nanoparticles were combined with MnO2 nanostructures to develop a composite supercapacitor electrode. Electrochemical testing in a 1 M Na2SO4 electrolyte revealed high reversibility, a specific capacitance of 186.8 F/g, and capacity retention of 76.8% after 1000 cycles [19]. Additionally, Venusamy et al. synthesized SnO2 and SnO2/reduced graphene oxide (rGO) nanocomposites using the hydrothermal method, with SnO2 nanoparticles of 10–20 nm. Electrochemical evaluation in a 3 M KOH electrolyte indicated a specific capacitance of 346 F/g at a current density of 0.95 A/g for the SnO2/rGO nanocomposite electrode—significantly outperforming pure SnO2 (267 F/g) [16]. This improvement was attributed to the synergistic effect of rGO’s high electrical conductivity and large surface area. Despite the promising performance of ATO-based materials in supercapacitors, systematic investigations remain limited. Key parameters such as particle size, dopant concentration, and their influence on electrochemical properties require further exploration to fully optimize ATO electrodes for practical applications.
In this study, we present a one-step hydrothermal approach for synthesizing highly dispersed ATO nanoparticles (NPs) without requiring a post-sintering process. This method enables the formation of high dispersion nano-sized crystalline particles at 220 °C under a high pressure of 20 MPa. The synthesized powder was utilized as an electrode material for supercapacitor applications. The structural, morphological, and electrochemical performance were investigated in detail.
2. Materials and Methods
Fabrication of ATO nanoparticles: The reagents used in the preparation of the mixture were sodium stannate (Na2SnO3, 98%, Macklin, Shanghai, China) and potassium hexahydroxoantimonate (KSb(OH)6, 99%, Macklin, Shanghai, China), which were utilized as Sb5+ and Sn4+ ion precursors. The precursors were dissolved in the DI water (1 L, 0.2 mol) with various Sb/(Sn + Sb) mol ratios of 0%, 10%, 30%, and 50%. Hydrochloric acid (HCl) was then added slowly until the pH of the solution reached 2. The mixture was subjected to autoclave treatment at 220 °C and stirred at 200 rpm for 12 h, resulting in a green solution containing ATO material. The solution was filtered, washed with distilled water to remove impurities, and dried at 100 °C for 1 h to obtain the powder.
Electrode fabrication: The ATO slurry was prepared by mixing 80 wt% of the ATO nanoparticles, 10 wt% of polyvinylidene fluoride (PVDF) binder, and 10% of conductive graphite in N-Methyl Pyrrolidone (NMP) solvent. This slurry was uniformly coated onto the titanium foil substrate via a doctor blade with a gap of 75 μm. The ATO-coated titanium foil was then dried at 80 °C in a vacuum oven for 12 h to remove the organic solvents, along with thermal pressing using a laminating machine (Model No. A3-330D, Guangzhou, China) (150 °C, 300 mm/min) to enhance the adhesion between the film and the foil substrate. The thickness and weight were measured to determine the amount of active material.
Characterization: The crystal structure and morphological characteristics of the as-synthesized ATO materials were characterized using X-ray diffraction (XRD, Rigaku-SmartLab XE, Tokyo, Japan), Scanning Electron Microscopy (SEM, JEOL JSM 6610LV, Tokyo, Japan), and Transmission Electron Microscopy (TEM, JEOL JEM-1010, Tokyo, Japan). The transmittance properties and bandgap were measured and calculated from the ultraviolet–visible spectra (UV-VIS, V-650 JASCO, Tokyo, Japan). The electrochemical performance of the ATO electrodes was evaluated using a Zahner Zennium electrochemical workstation with a three-electrode configuration. A platinum plate was used as the counter electrode, Ag/AgCl as the reference electrode, and the ATO electrode as the working electrode. The electrolyte was a 1 M KOH aqueous solution. Cyclic voltammetry (CV), galvanostatic charging/discharging (GCD), and electrochemical impedance spectroscopy (EIS) were performed. The process of the synthesis method, electrode fabrication, and three-electrode measurements are shown in Figures S1, S3, and S4.
3. Results and Discussion
Typically, SnCl4 and SbCl5 are used as precursors for the hydrothermal synthesis process. However, these salts have strong hygroscopic properties, and it is difficult to accurately determine the mass of the precursors. Therefore, the precursors used in this study are Na2SnO3 and KSb(OH)6. The process of nanoparticle ATO formation is as follows:
Na2SnO3 + KSb(OH)6 + 3HCl → SnxSby(OH)z ↓+ (K,Na)Cl
In the hydrothermal process, at high temperature and pressure, crystalline ATO nanoparticles are obtained:
SnxSby(OH)z → SnxSbyO2 + 1/2zH2O
The structural morphology of the SnO2-doped Sb nanoparticles was observed by TEM, as shown in Figure 1. The results indicate that the average particle size decreases from approximately 12 nm to 6 nm as the Sb precursor concentration increases from 0 to 30%. The solution changed from white to dark blue (see Figure S2), indicating the successful incorporation of Sb into the SnO2 host lattice. However, at 50% Sb doping, the particle size distribution becomes broader, with an average particle size of around 8 nm. Additionally, the nanoparticles tend to aggregate. This result is consistent with Figure S2 (Supporting Information), where the 0% and 50% samples appear opaque, whereas the 10% and 30% samples remain transparent. The presence of Sb ions in the SnO2 lattice at certain concentrations may enhance dispersion in the aqueous solution, reducing agglomeration and preventing an increase in crystal particle size. This observation is consistent with a study by J. Brokken-Zijp et al., which also reported a notable reduction in particle size as the doping concentration increased from 0% to 33%, attributed to the segregation of Sb to the surface of the ATO particles, which decreases the rate of crystal growth [20].
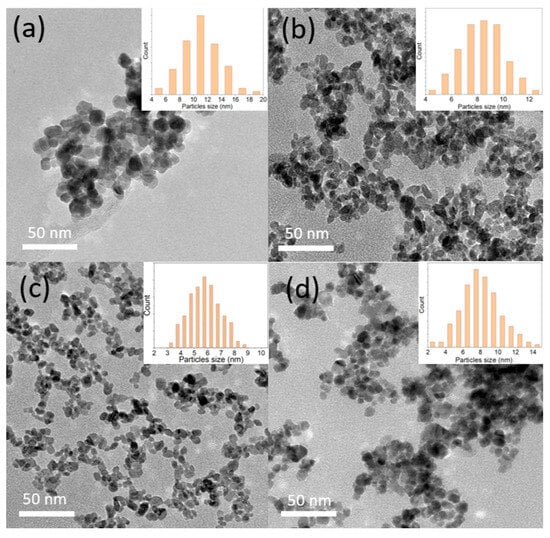
Figure 1.
The TEM images and particle size distribution of the synthesized ATO samples: (a) 0% Sb, (b) 10% Sb, (c) 30% Sb, and (d) 50% Sb.
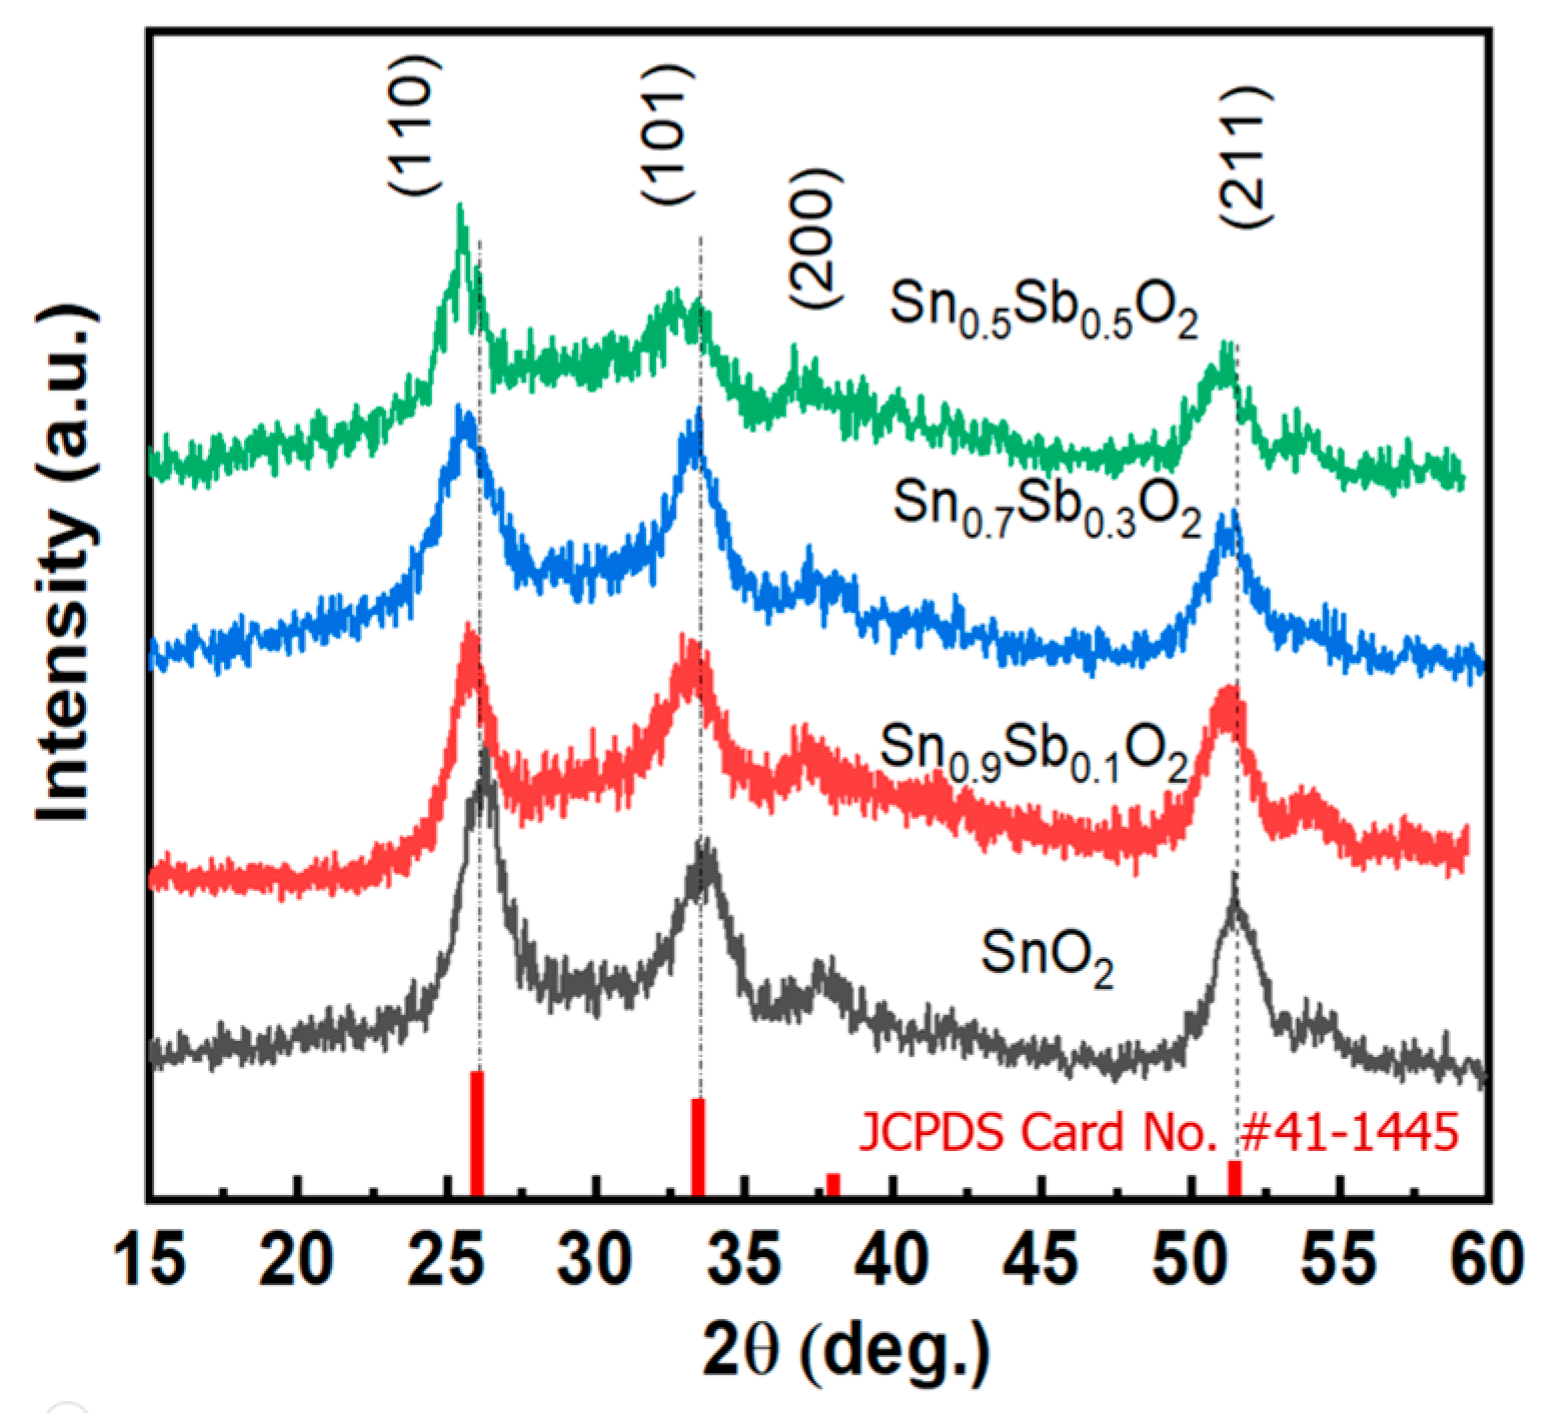
Next, X-ray Diffraction (XRD) measurements were performed to determine the crystal structure of the synthesized nanoparticles, as shown in Figure 2. It can be observed that all the diffraction peaks correspond to SnO2 with a tetragonal rutile structure, and this result aligns with the standard data from JCPDS (Card No. #41-1445) [21]. No additional impurity peaks were detected in the XRD spectrum. Additionally, when observing the diffraction peak at (110), a shift towards a smaller 2θ angle can be seen. The reduction in the distance between the planes can be explained by the substitution of Sn4+ with Sb5+ in the SnO2 crystal structure, leading to lattice distortion. Specifically, the average bond length between Sb5+ and O2− is approximately 1.978 Å, slightly larger than the Sn4+-O2− bond length (1.956 Å) [22]. The average crystal size of the material was calculated using the Scherrer equation. Table S1 presents the results of calculating the average particle size of the SnO2 phase at the (110) plane for different doping concentrations. It can be observed that the average crystal size decreases from 11.75 nm to 7–8 nm. This result is fully consistent with the HRTEM images shown in Figure 1.
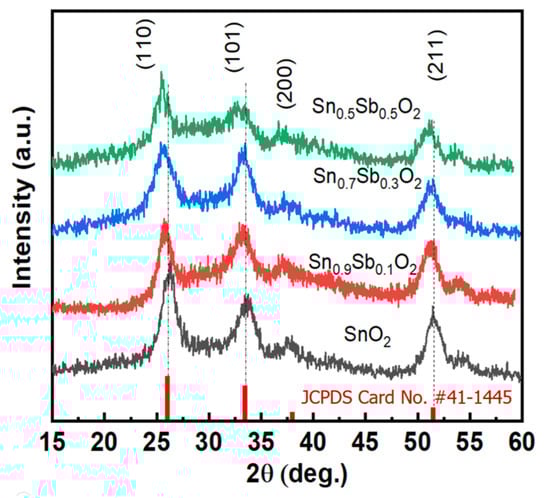
Figure 2.
The X-ray diffraction patterns of the ATO samples with different Sb concentrations with standard card (red line).
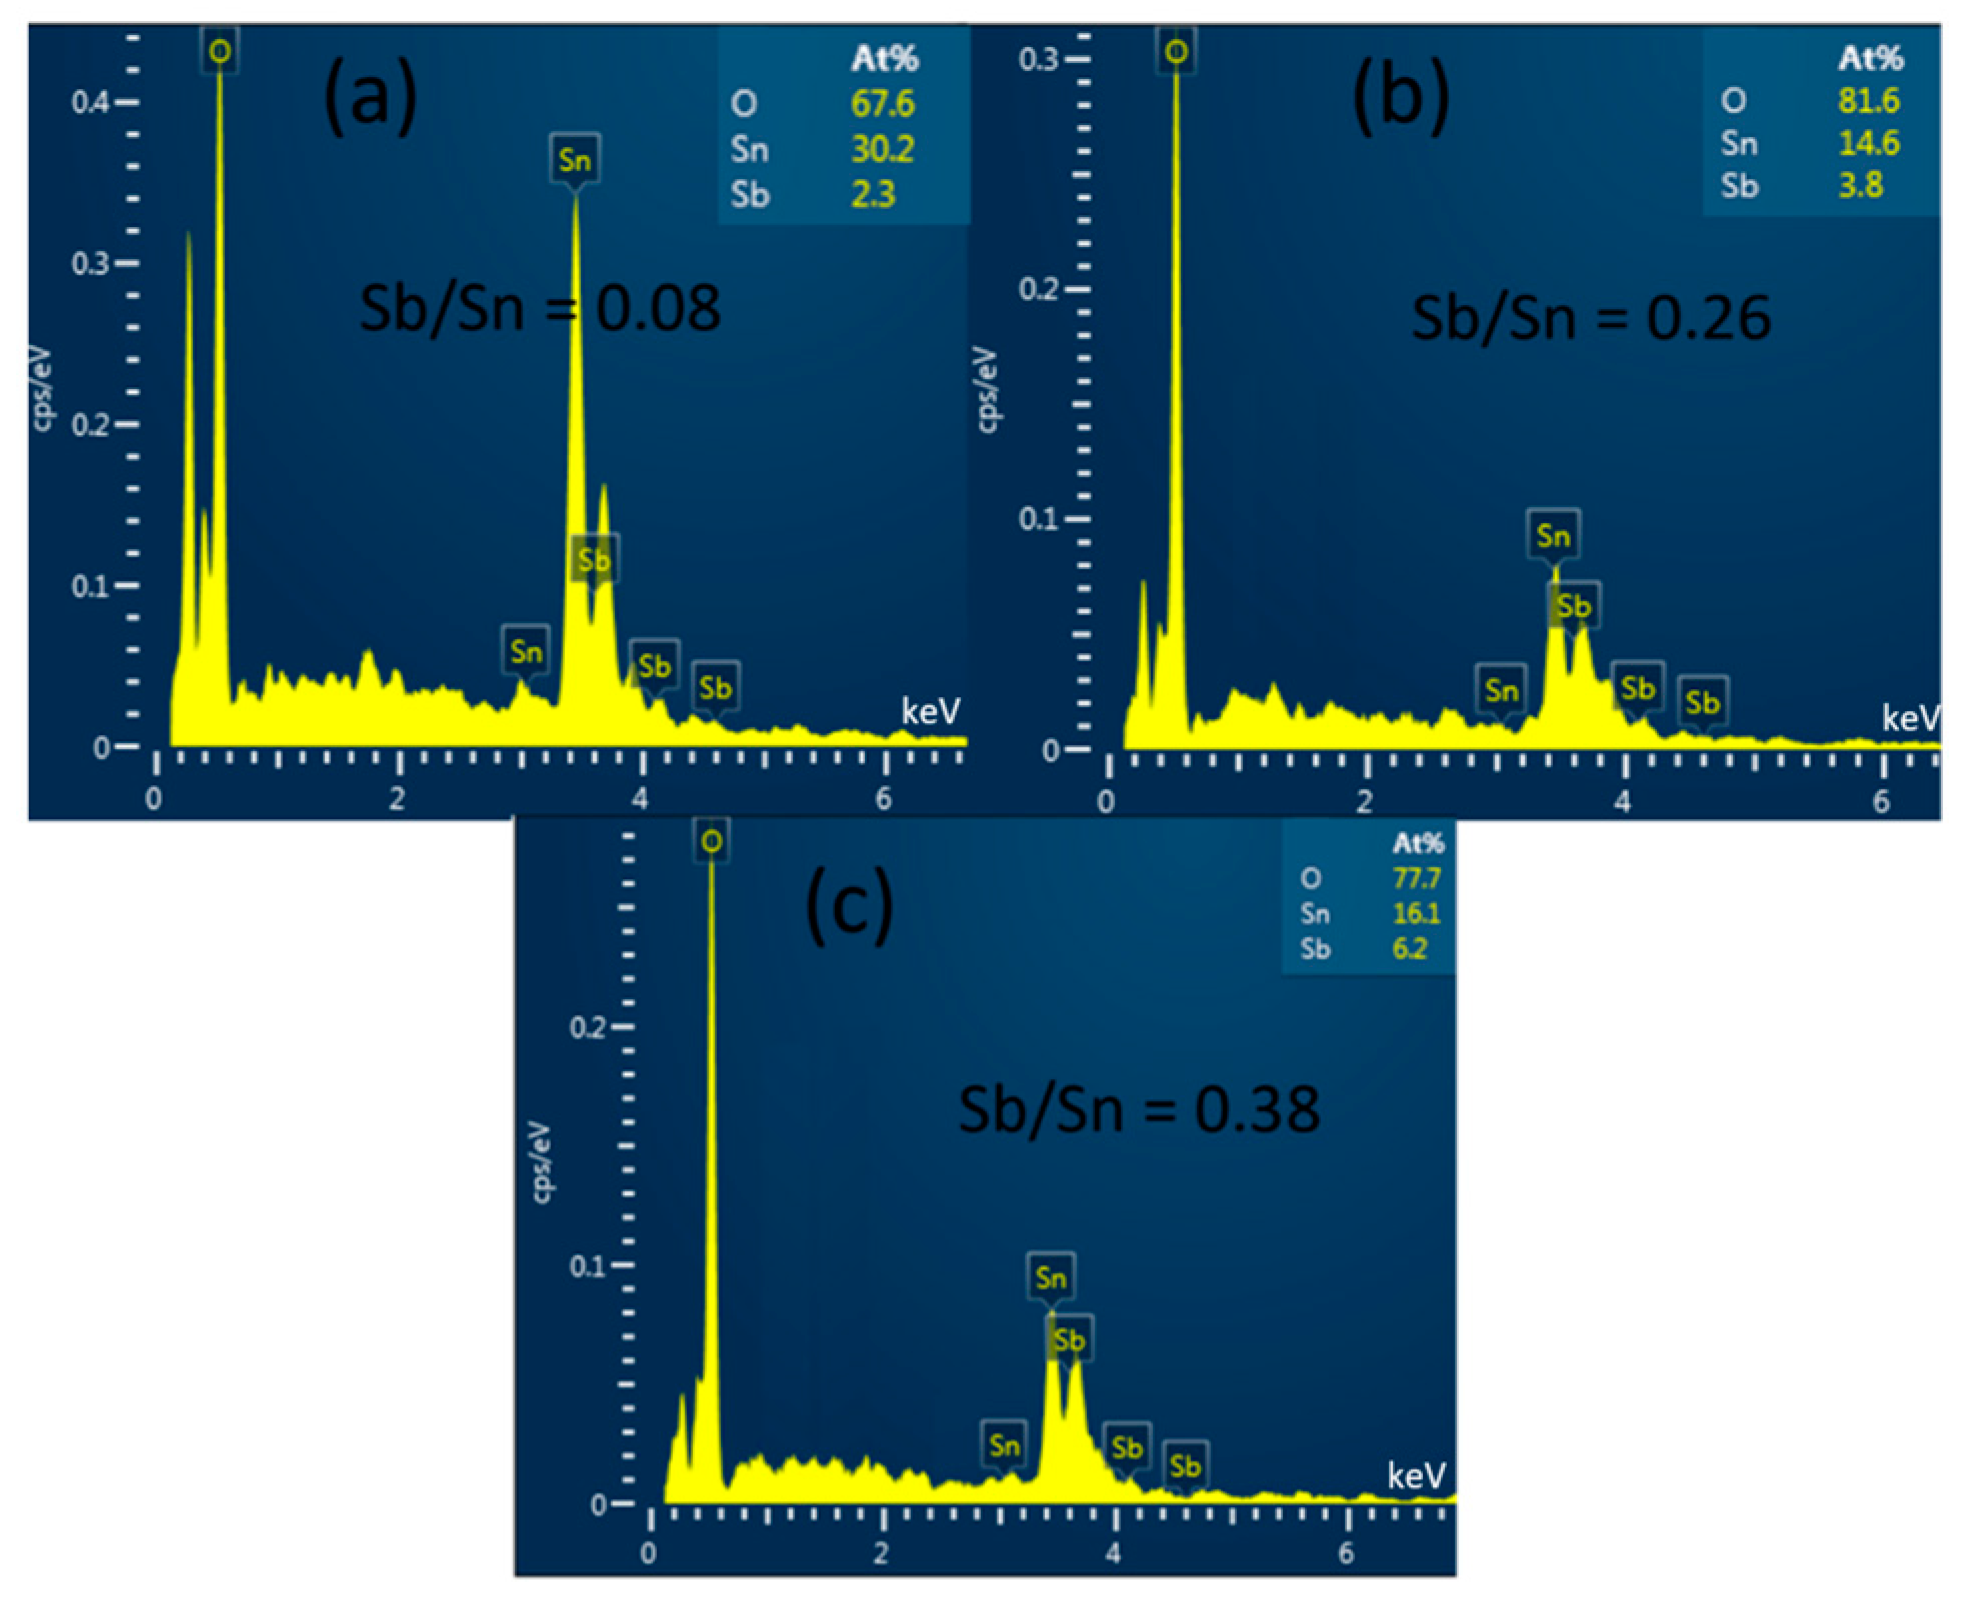
To determine the composition of the ATO powder samples synthesized by the hydrothermal method with different Sb/(Sn + Sb) precursor ratios, we conducted EDS measurements, and the results are shown in Figure 3. The EDS analysis reveals that the basic elements of the powder samples are Sb, Sn, and O. The samples with Sb/Sn precursor ratios of 10%, 30%, and 50% showed EDS results of 8%, 26%, and 38%, respectively. It can be observed that as the Sb/Sn precursor ratio increases, the Sb/Sn ratio in the resulting samples tends to decrease. This may be due to excess Sb not entering the SnO2 lattice and being removed during the washing process.

Figure 3.
EDS images (Atomic percentage data in the subfigures) of ATO samples with (a) 10%, (b) 30%, and (c) 50% Sb.
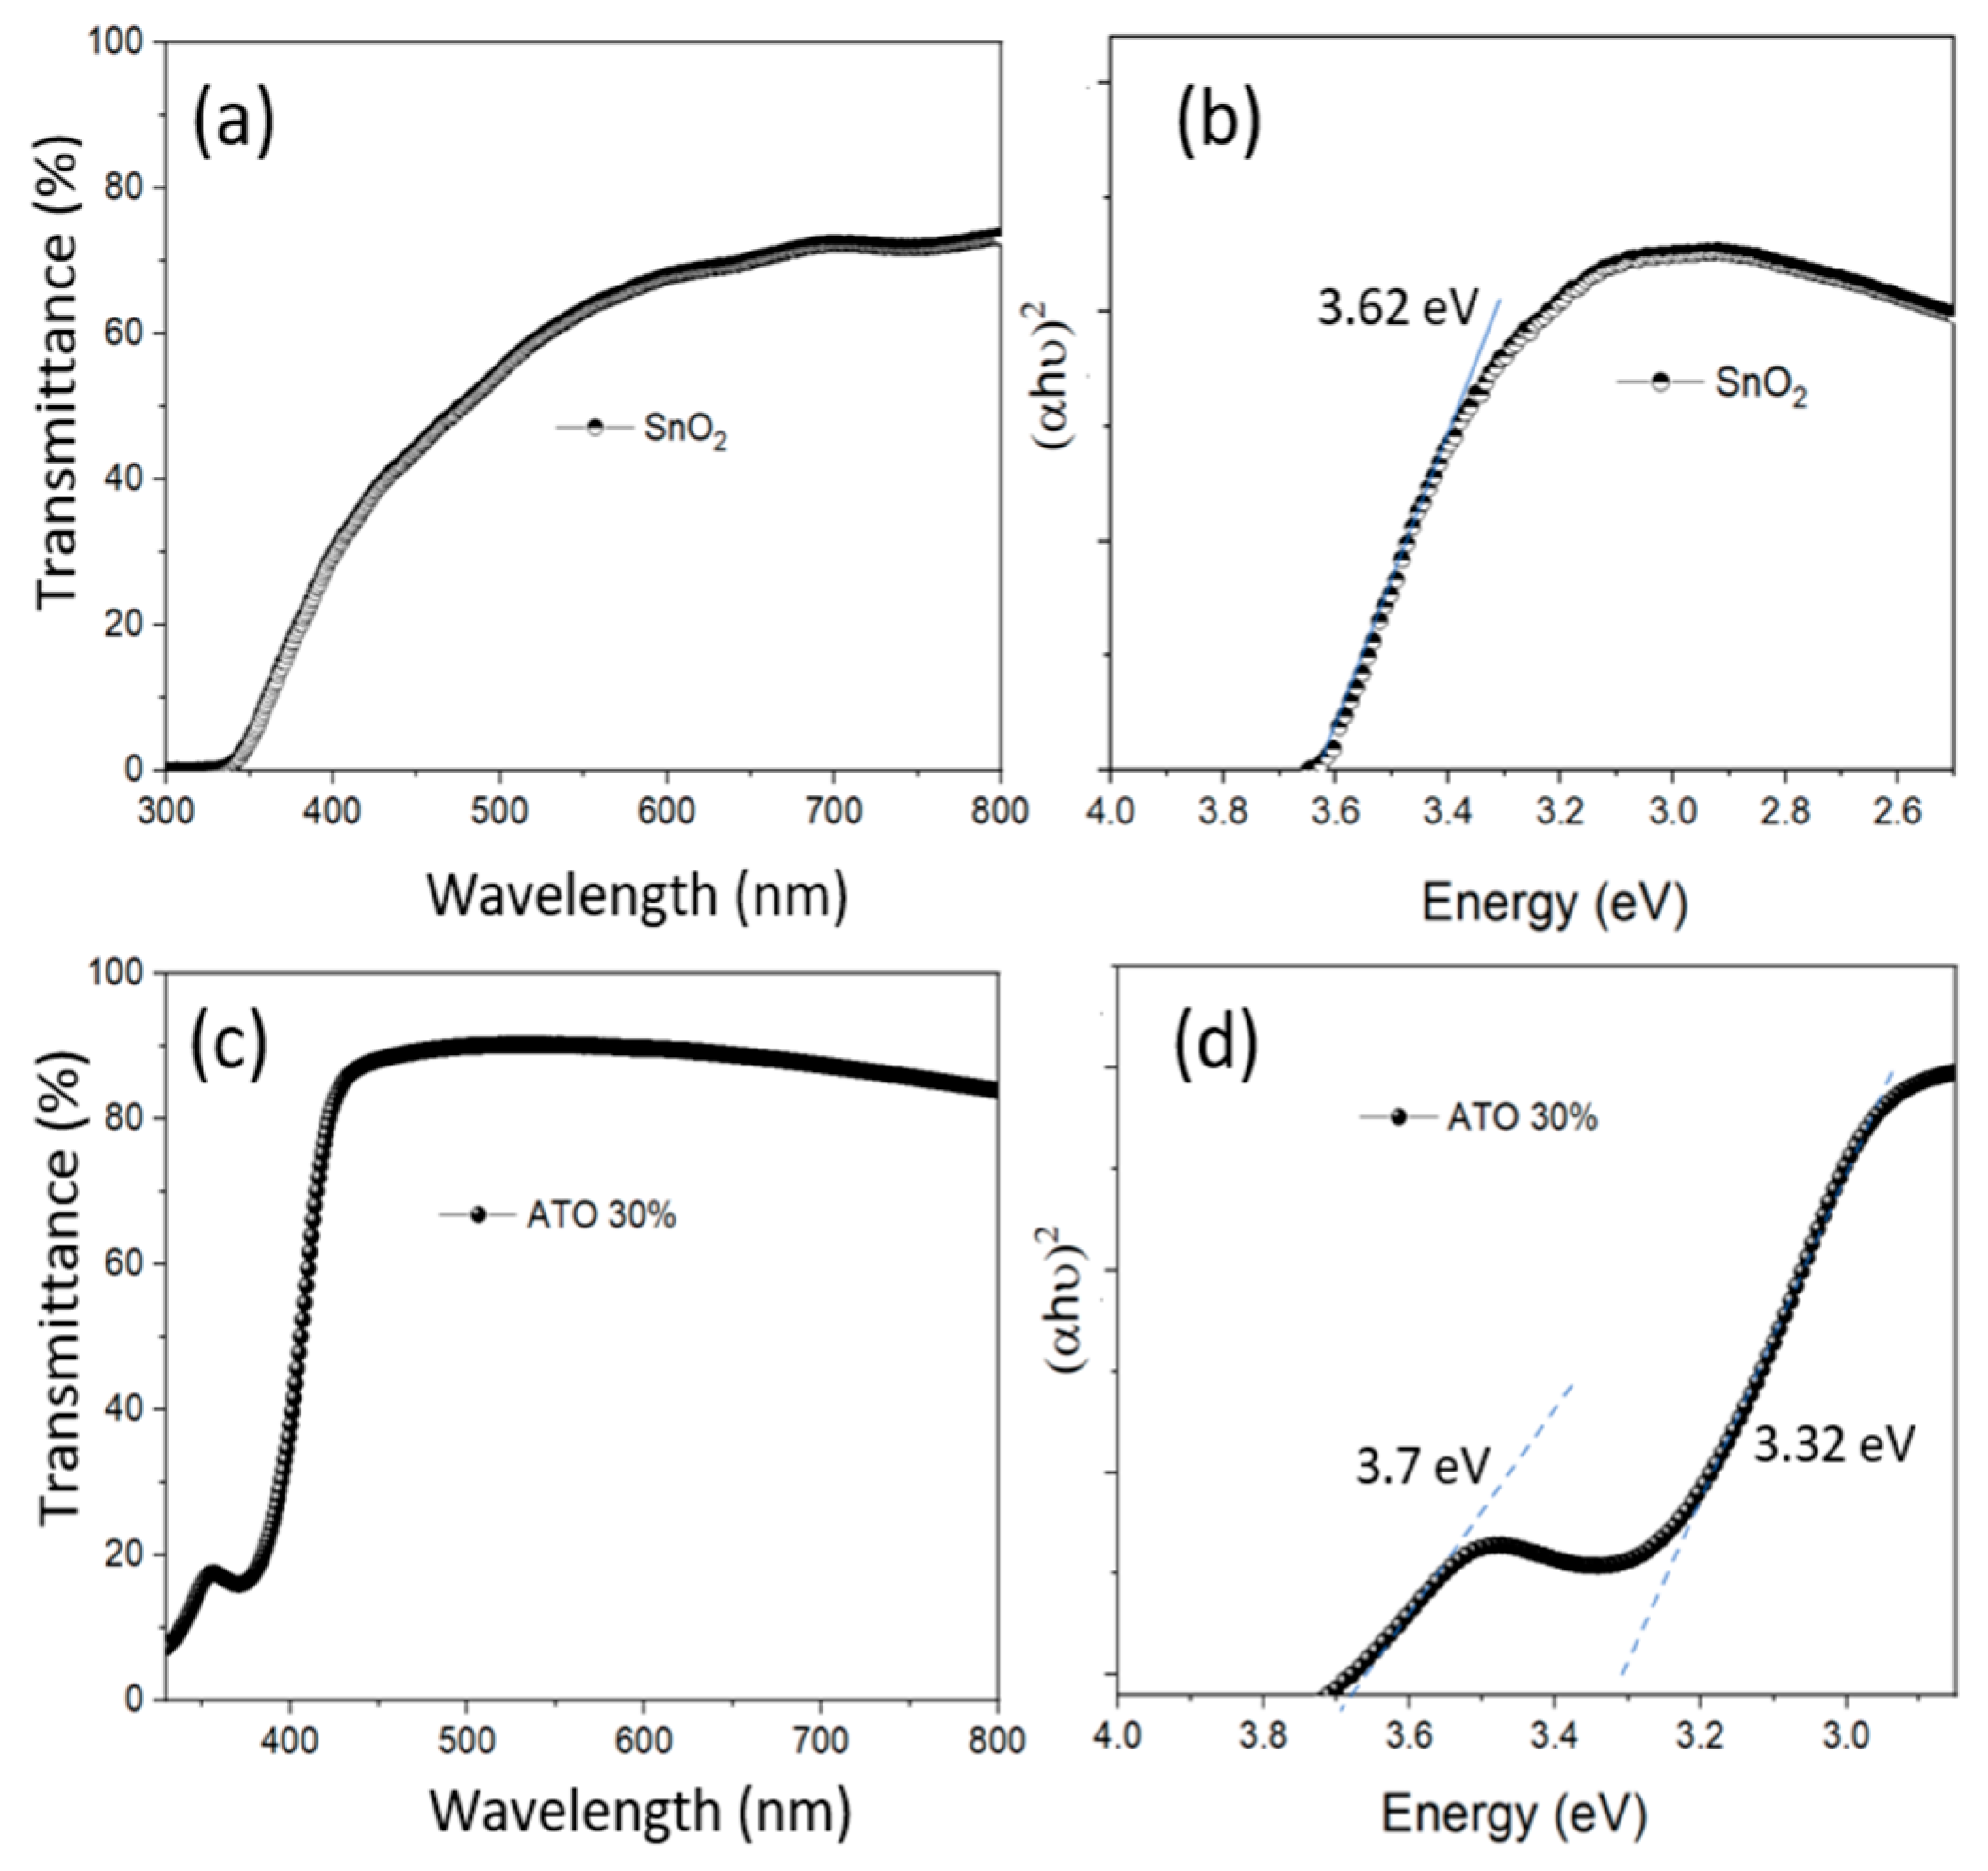
The UV-Vis spectra of the nano ATO solution samples with 0% and 30% doping after synthesis via the hydrothermal method are shown in Figure 4. It can be observed that the 30% ATO sample exhibits higher transmittance than the 0% ATO sample, which may be attributed to its smaller particle size and more uniform size distribution. Additionally, the band-to-band absorption edge of the ATO material shifts toward shorter wavelengths compared to the SnO2 sample, which can be attributed to the increase in bandgap value resulting from the reduced particle size [23]. From the calculated bandgap values (shown in Figure 4b,d), it can be observed that the bandgap value for SnO2 is approximately 3.62 eV. For the 30% ATO sample, the main absorption edge is observed at around 3.32 eV. This shift may be attributed to the incorporation of Sb5⁺ ions into the SnO2 lattice, which introduces donor-like energy levels and alters the electronic band structure [24]. For the 30% ATO sample, the main absorption edge appears at around 3.32 eV, indicating that Sb⁵⁺ ions doped into the SnO2 lattice introduce new donor-like energy levels within the bandgap. This effect is attributed to the formation of impurity states and the Burstein–Moss shift caused by increased carrier concentration due to Sb doping, as reported in previous studies.
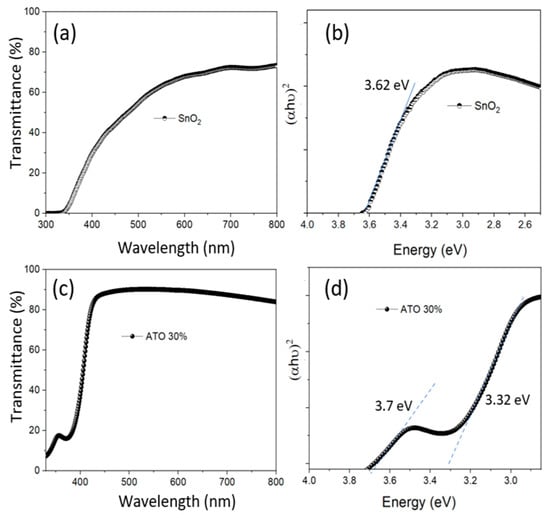
Figure 4.
The UV-Vis spectra and tafel plots of the SnO2 (0% ATO) (a,b) and 30% ATO NPs (c,d) after synthesis by the hydrothermal method.
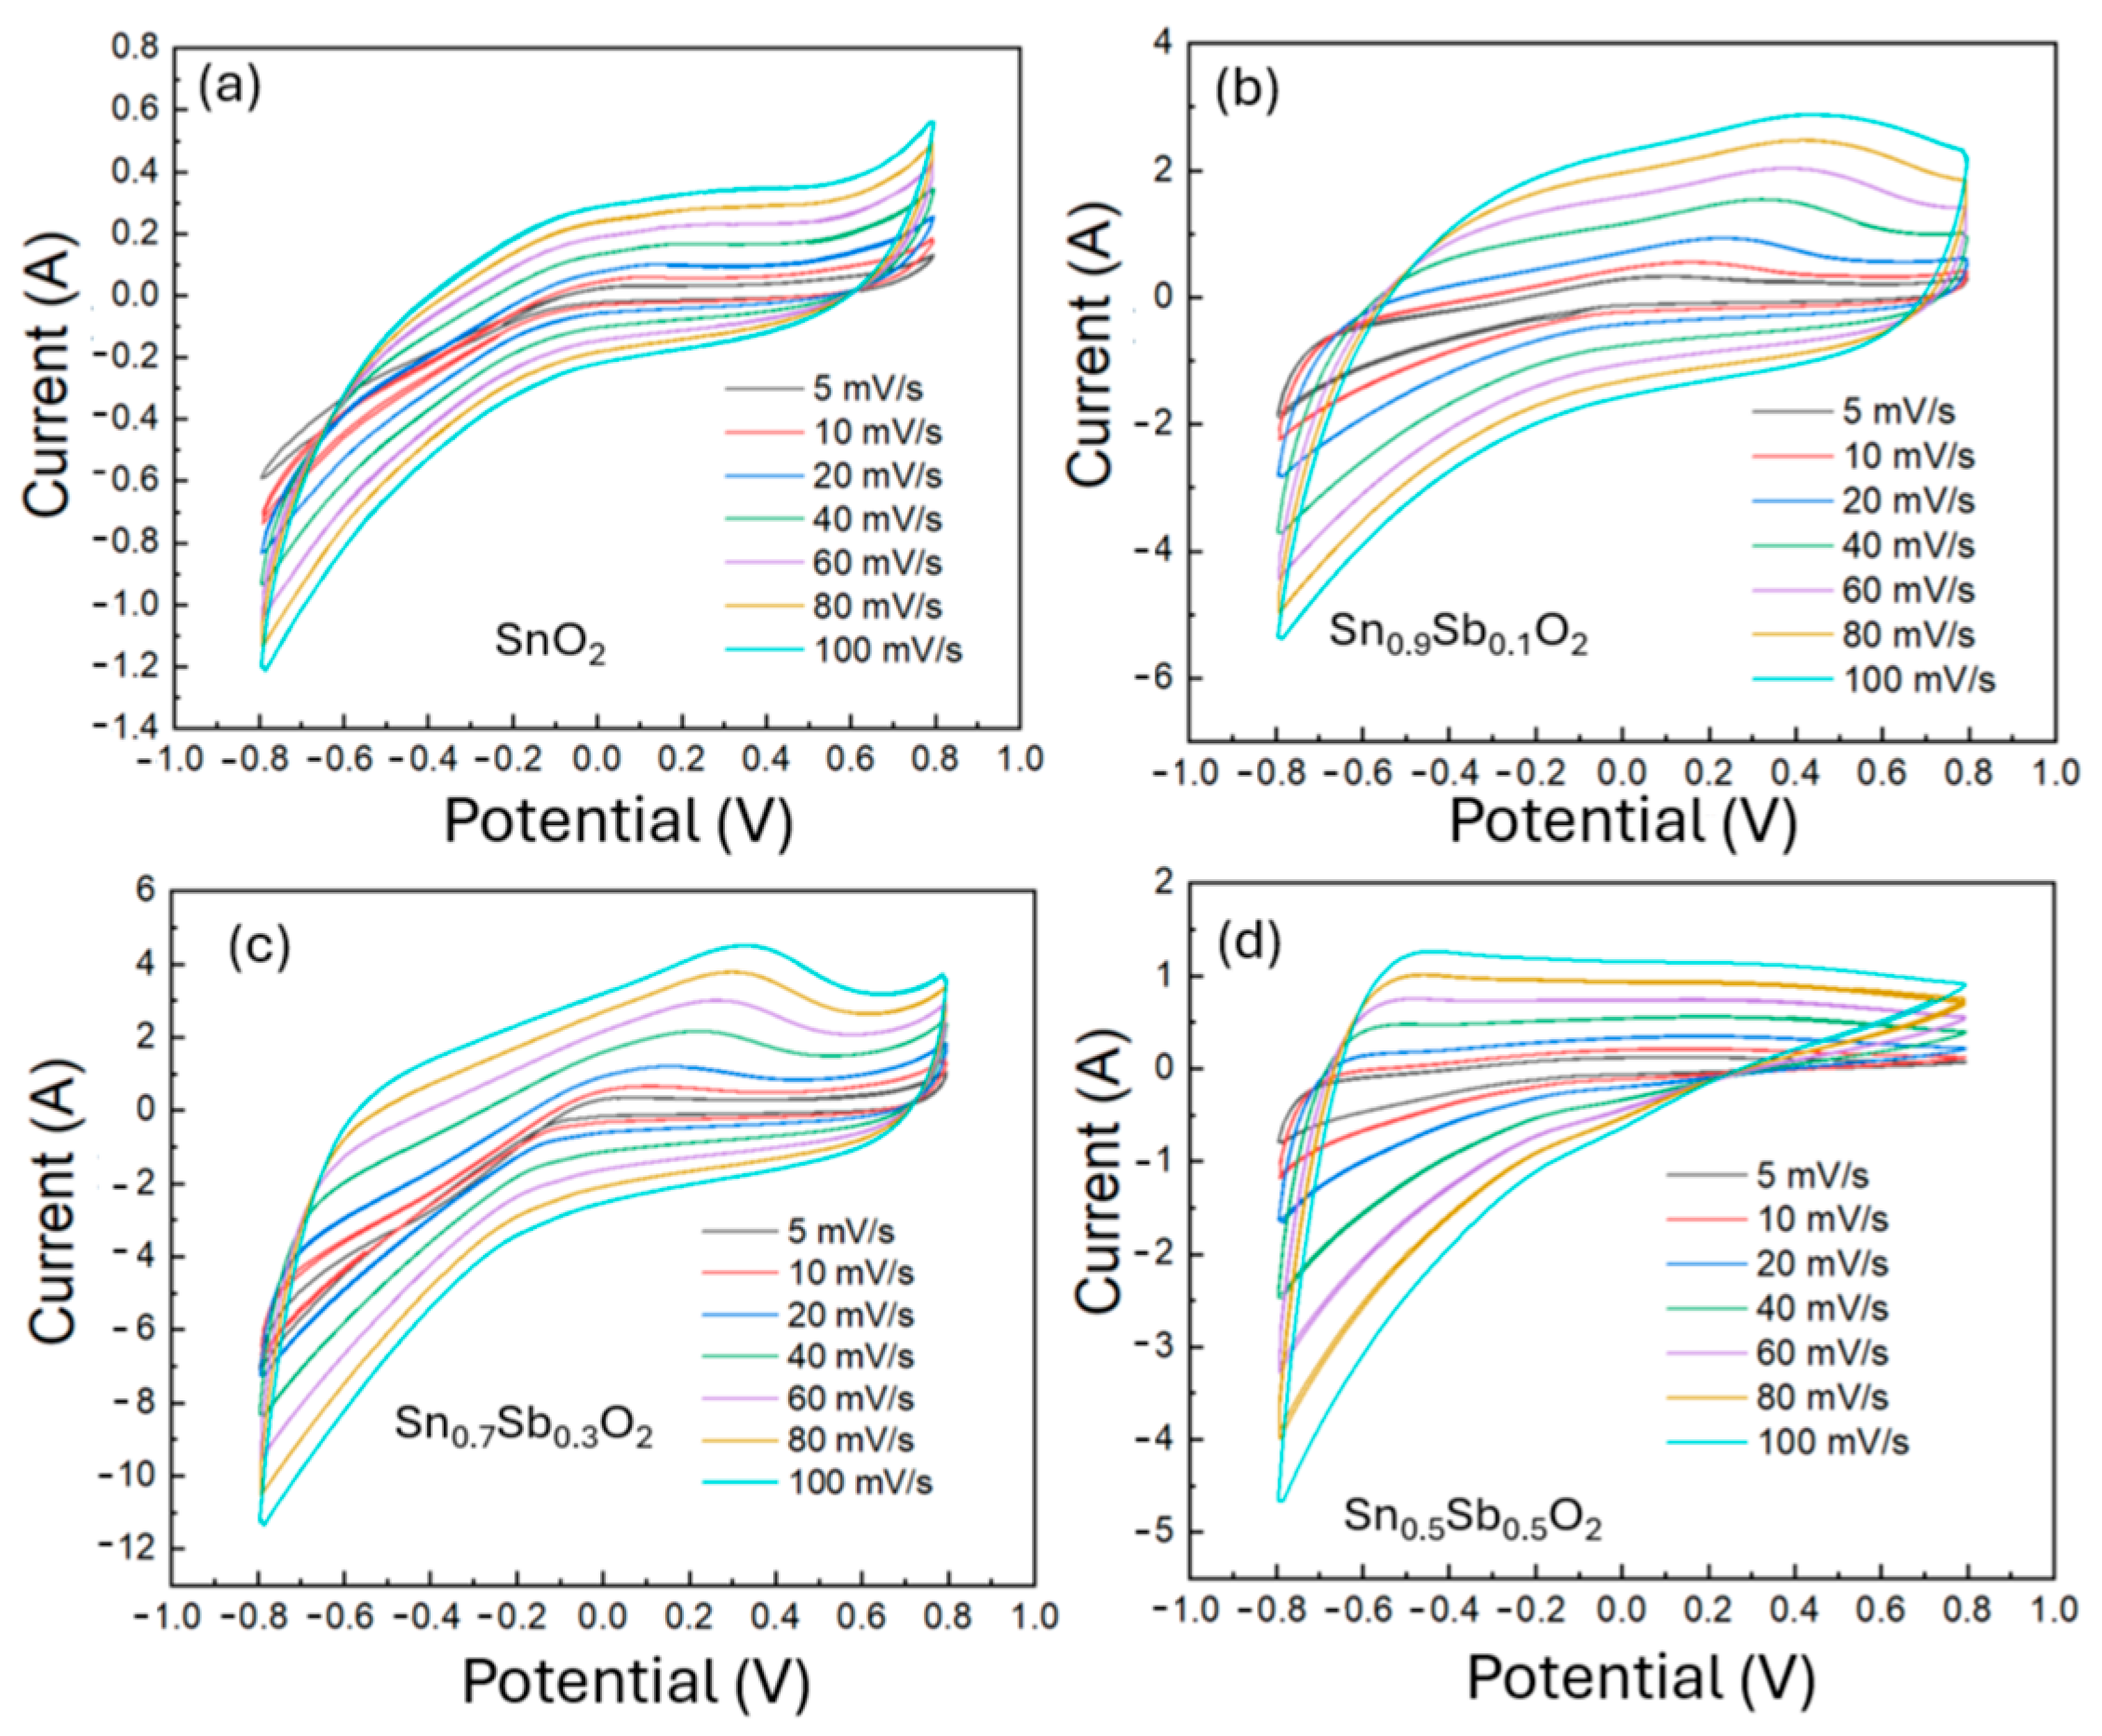
To evaluate the electrochemical performance of the ATO-based electrode, a mixture of ATO, PVDF binder, and graphite was prepared in N-Methyl Pyrrolidone (NMP) solvent to enhance both electrical conductivity and structural porosity. This slurry was uniformly coated onto a Ti foil using the doctor blade method and subsequently dried. Since the drying process can introduce voids and uneven thickness, a thermal pressing step was employed to improve adhesion between the active layer and the current collector, as well as to ensure thickness uniformity. As illustrated in Figure S3, the electrode thickness was reduced from approximately 54 µm after drying to 42 µm after pressing. In addition, the electrode mass was precisely measured using an analytical balance to support accurate electrochemical evaluation. Figure S4 further confirms the porous morphology of the electrode surface, which promotes efficient electrolyte penetration and ion transport. The CV measurement was performed in a 1M KOH electrolyte solution to evaluate the electrochemical properties of the electrode materials. Figure 5 shows the CV curves of ATO material samples with different Sb doping ratios (0%, 10%, 30%, 50%) at various scan rates from 5 to 100 mV/s within a voltage range of −0.8 to 0.8 V. From the charge–discharge profile and CV curves, it can be observed that the 0%, 10%, and 30% ATO electrode samples exhibit symmetry and reversibility. In contrast, the 50% sample does not show symmetry, indicating poor electrode reversibility. The 30% ATO electrode shows the largest area in the CV curve, suggesting a higher charge storage capacity and improved electrochemical response.
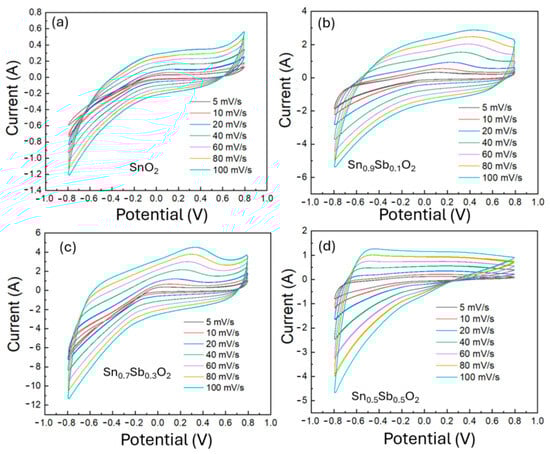
Figure 5.
Cyclic voltammetry (CV) curves of ATO electrode samples with varying Sb doping concentrations: (a) 0%, (b) 10%, (c) 30%, and (d) 50%.
This can be explained by the fact that as the Sb/Sn ratio increases, the particle size decreases, and Sb ions also participate in the electrochemical process. The involvement of Sb ions in the SnO2 matrix provides more active sites for redox reactions, leading to an increase in the area of the CV curve. The CV curve of the 30% sample shows an oxidation peak due to the effect of the faradaic reaction.
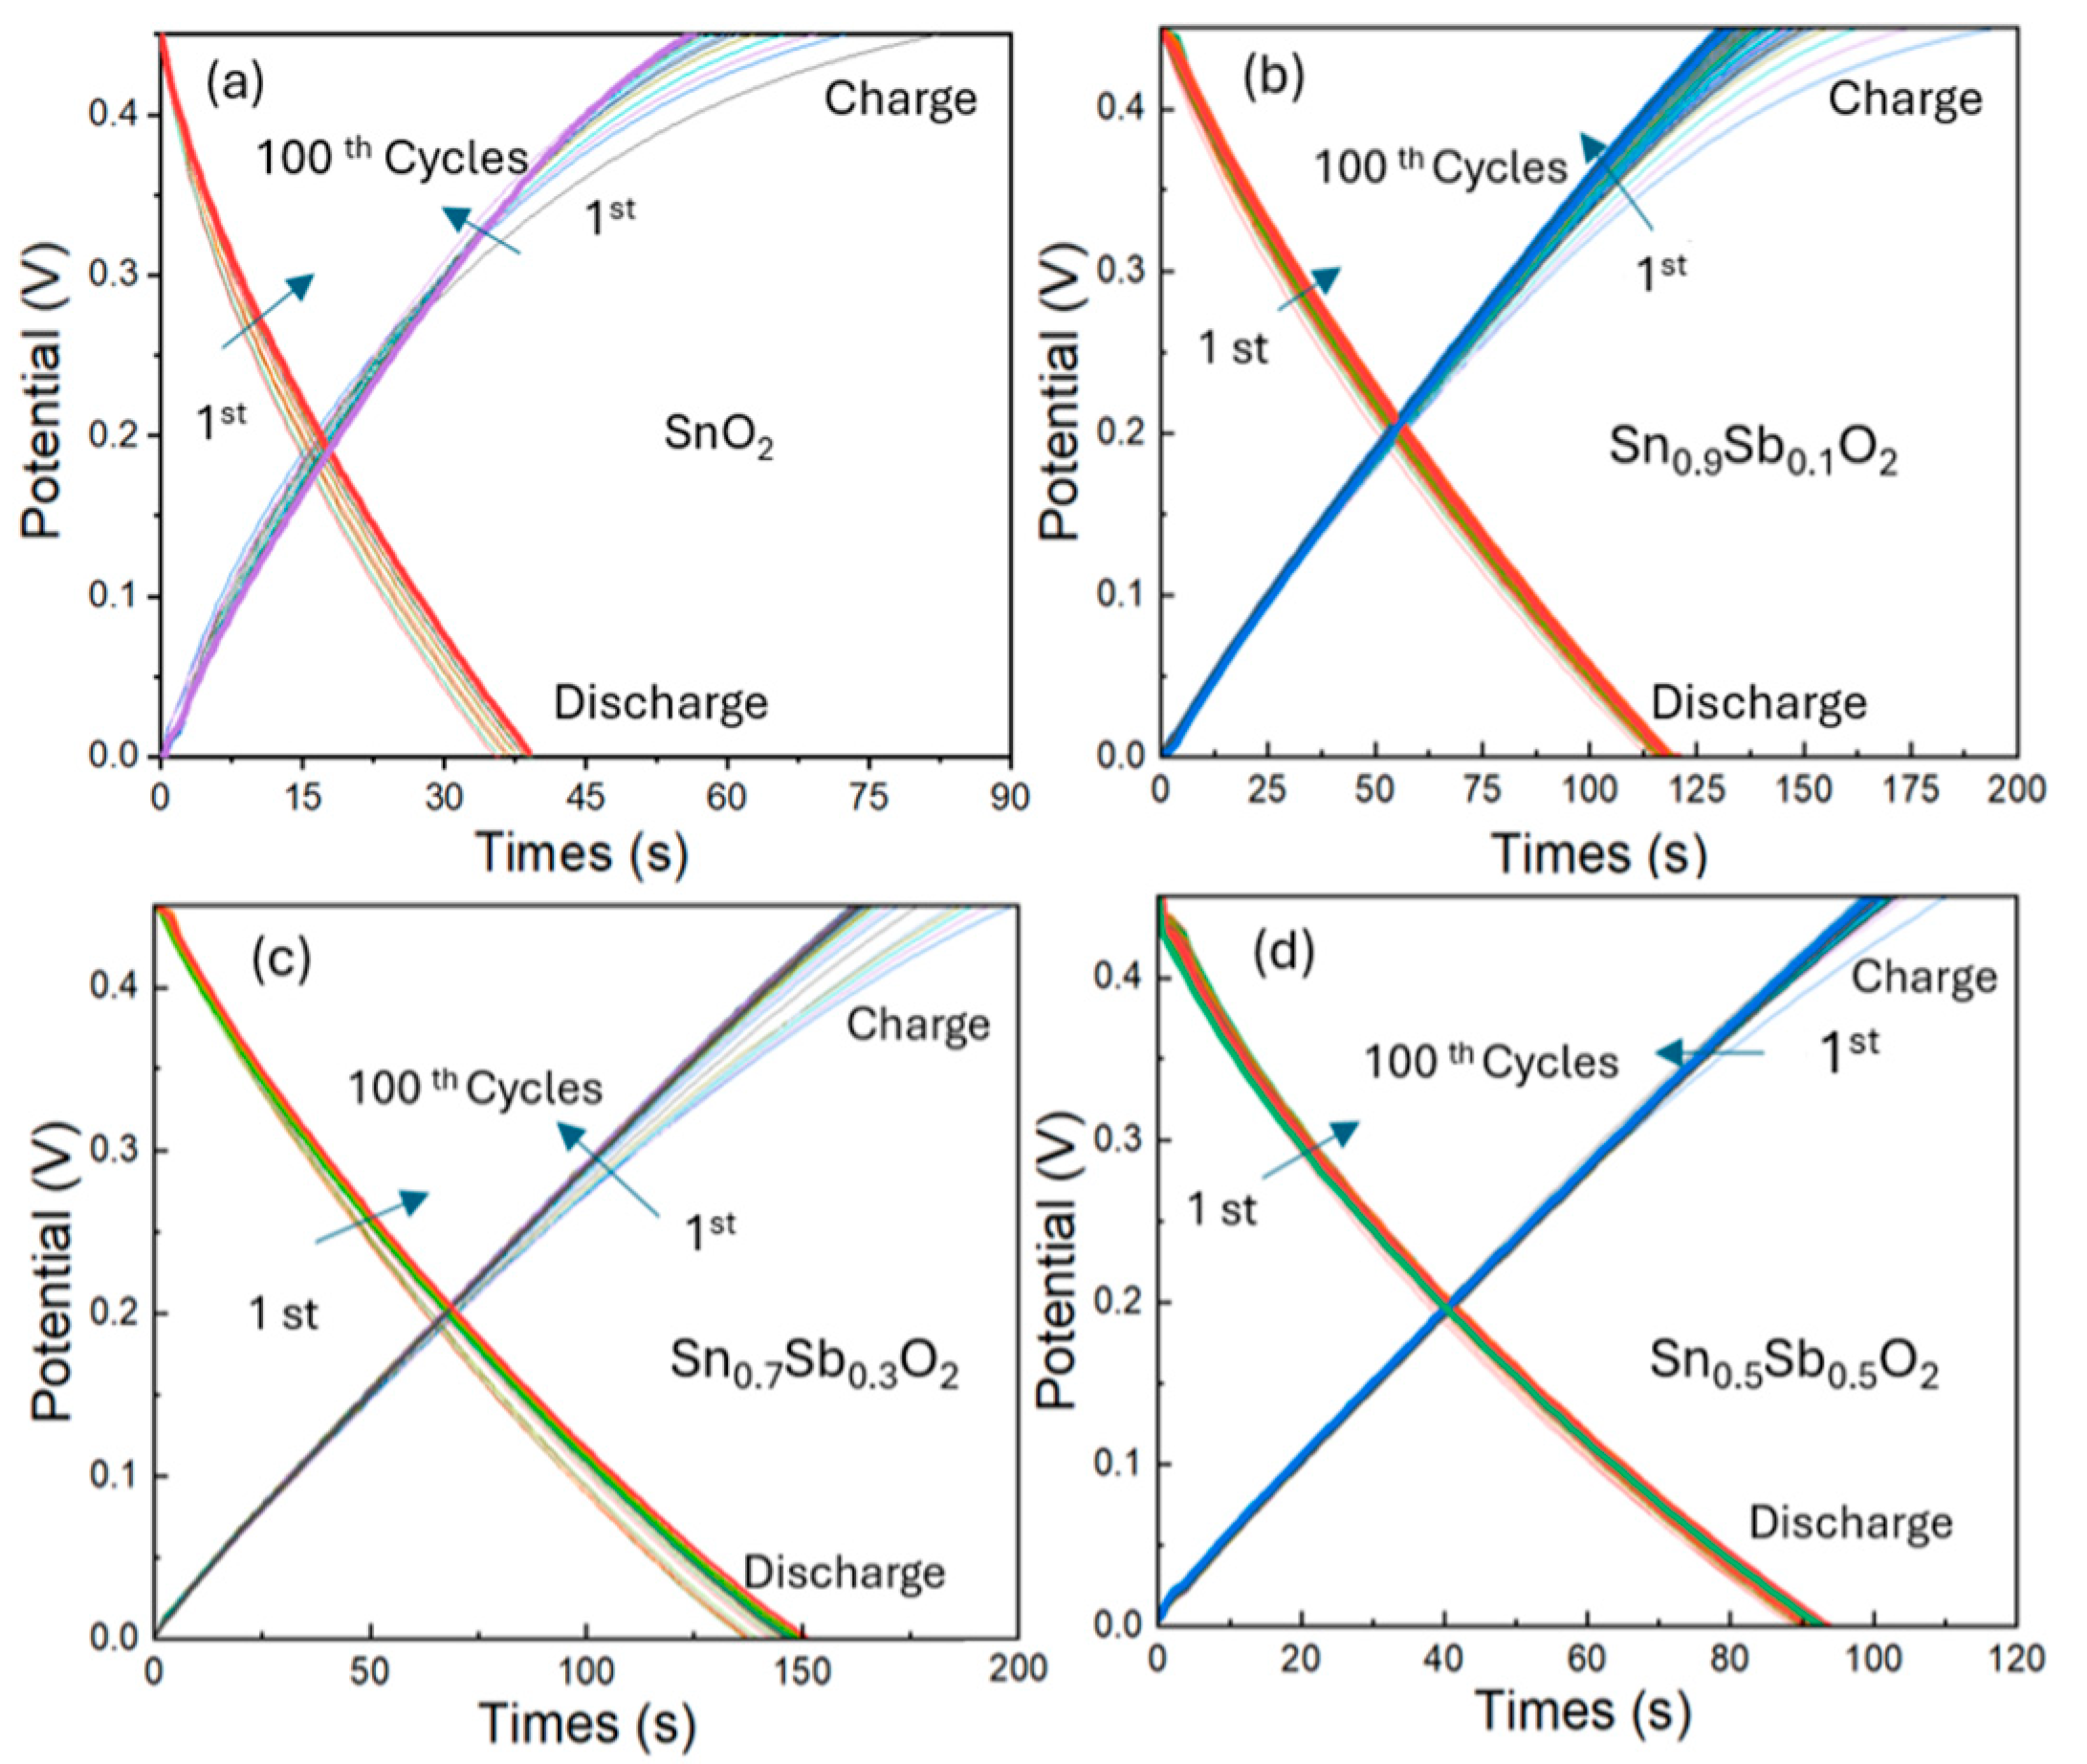
The galvanostatic charge–discharge (GCD) curve shown in Figure 6 illustrates the voltage variation over time during the charging and discharging processes of ATO electrodes over 100 cycles at a current of 1 A/g, and voltage from 0 to 0.45V. From the results, it can be observed that the charging and discharging times of the ATO samples are significantly longer compared to the undoped SnO2 sample. Specifically, the 30% ATO sample has the longest charging and discharging times of 90 s and 165 s, while the SnO2 sample only takes 59 s for charging and 37 s for discharging. This difference can be explained by the material properties of ATO. The ATO sample has a crystal structure with Sb5+ replacing Sn4+ ions, and these lead to the formation of free electrons, increasing its conductivity. Moreover, ATO has a larger surface area due to its smaller particle sizes, which enhances the adsorption and storage of ions on the electrode surface. Additionally, the presence of Sb⁵⁺ ions provides more sites for ion storage, thereby increasing its charge storage capacity. In contrast, SnO2, with larger particle sizes and low conductivity, has a limited charge storage capacity, leading to shorter charging and discharging times.
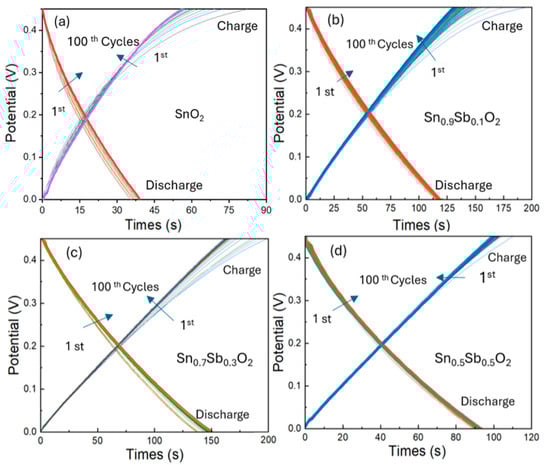
Figure 6.
Galvanostatic charge–discharge (GCD) curves (from 1st to 100th cycles) of ATO electrode samples with varying Sb doping concentrations: (a) 0%, (b) 10%, (c) 30%, and (d) 50%, measured at a current density of 1 A/g. The arrow indicates the trend in the charge-discharge profile change from the 1st to the 100th cycle.
Further, to confirm the specific capacitance (CS) values of the electrodes, charge/discharge curves were calculated from the relation [25]:
where I represents the discharge current, ∆t is the discharge time, m denotes the mass of the active material, and ∆V refers to the potential range. Based on the data in Table S2, the ATO 30% electrode sample exhibits the highest specific capacitance of 343.5 F/g at a current density of 1 A g−1. This enhanced capacitive performance can be attributed to the complementary effect of faradaic (redox, CV curve shape with peaks) and non-faradaic (the electrostatic accumulation of charge at the electrode-electrolyte interface without any chemical changes, CV curve with near-reactangular-shape) reactions (see Figure 5) [26], along with the improved conductivity and increased surface area of the ATO nanoparticles.
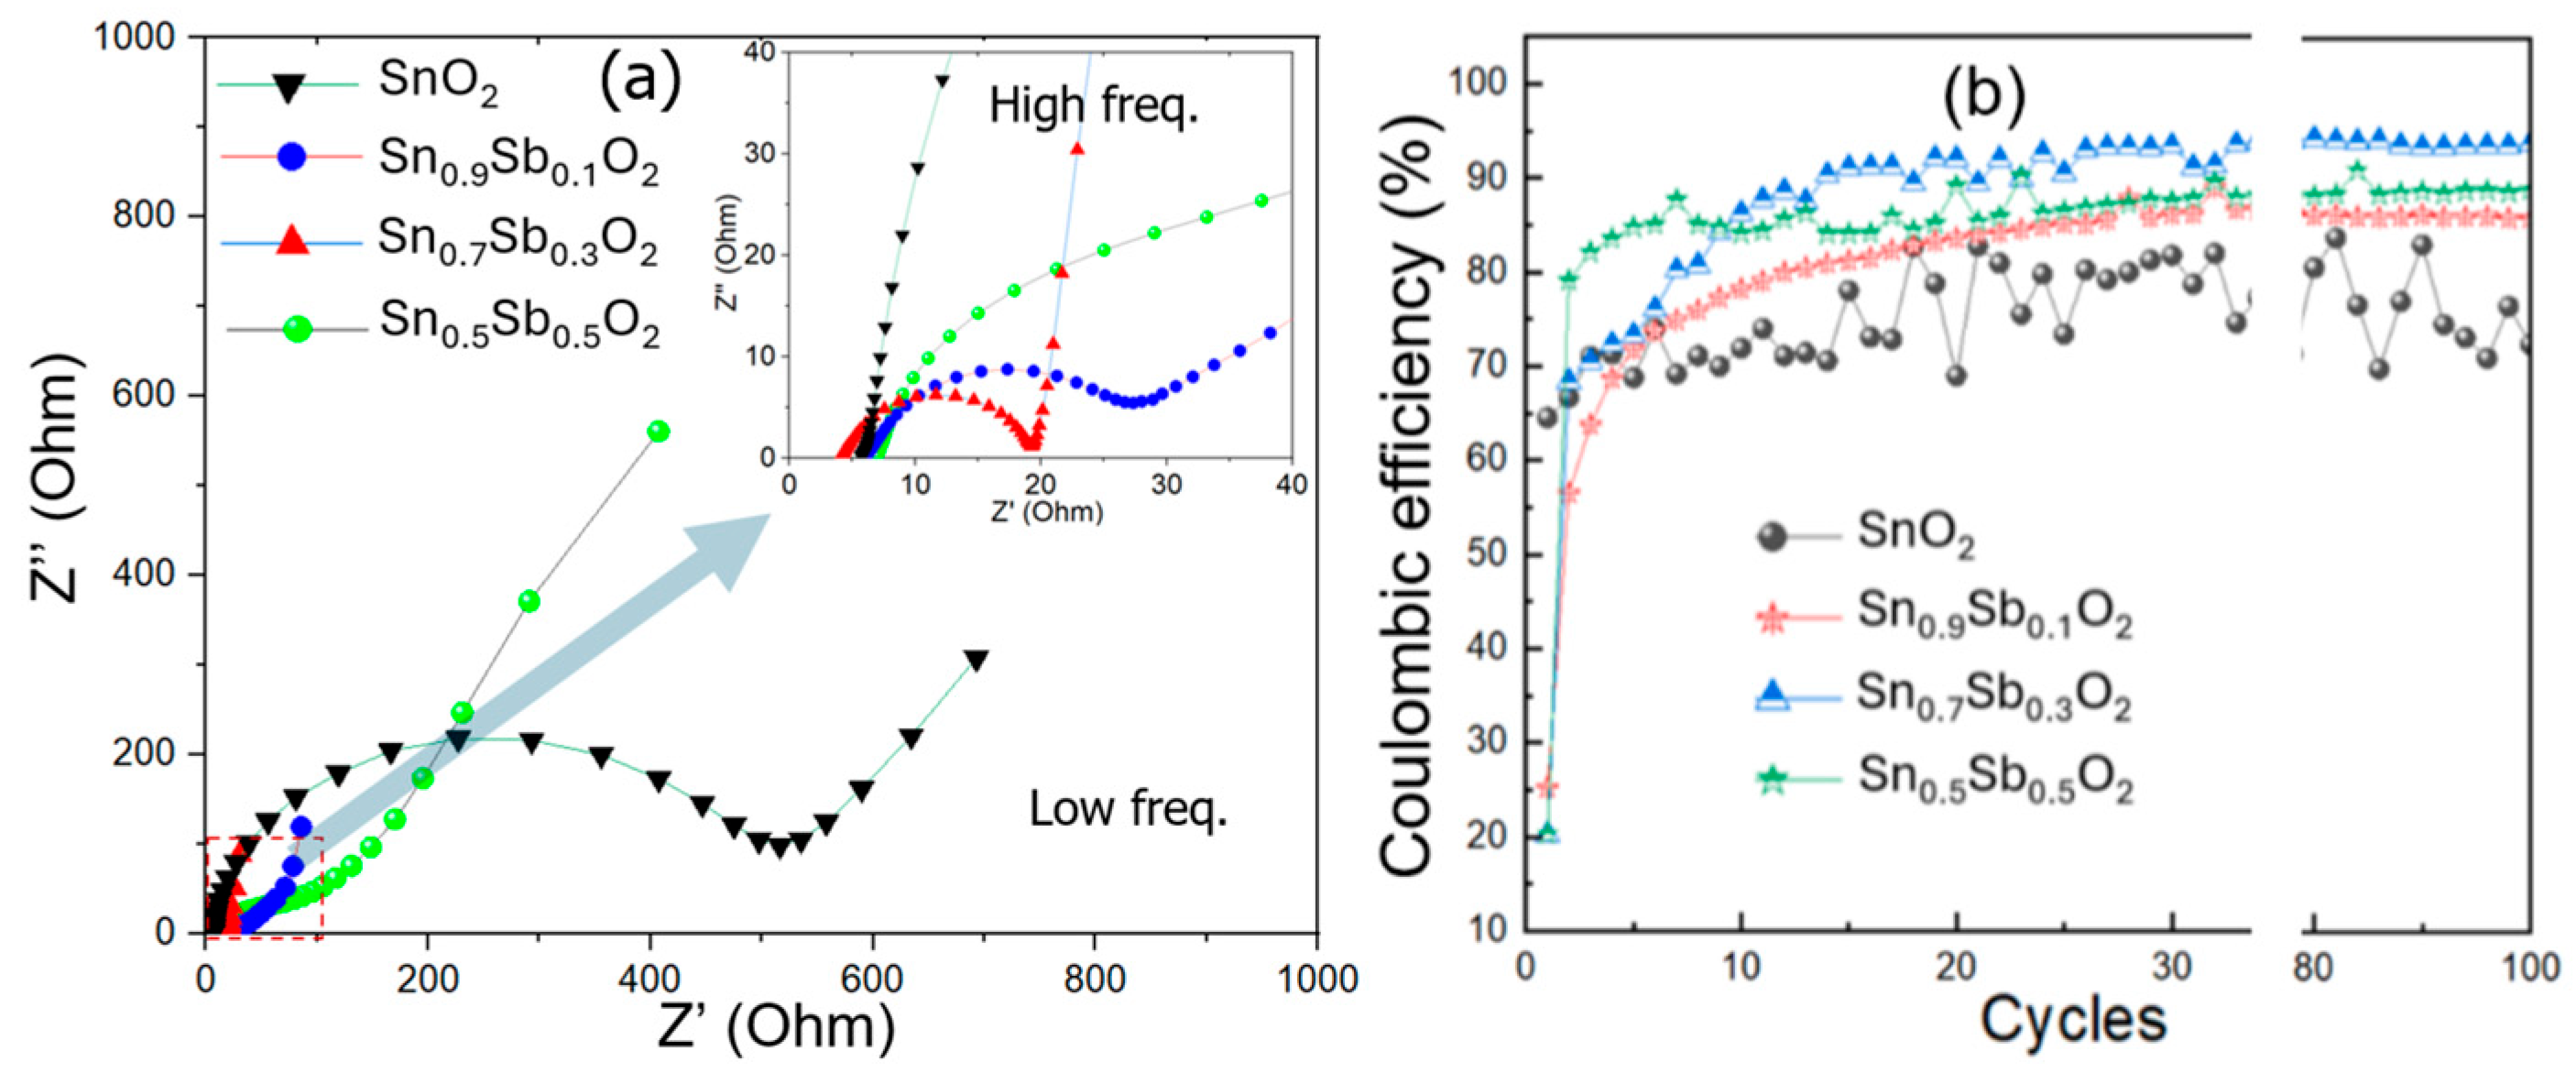
The electrochemical impedance spectroscopy (EIS, 100 hz to 1 MHz with a perturbation amplitude of 5 mV) clearly demonstrates a significant difference in the charge transfer capability from low to high (inset of figure) frequencies between the ATO material samples. Nyquist plots of the ATO electrode samples are shown in Figure 7a. The curve for the SnO2 sample has a larger semicircle diameter, indicating a higher charge transfer resistance. In contrast, the curve for the ATO sample has a smaller semicircle diameter, showing better charge transfer capability [26,27]. The lowest charge transfer resistance in the sample with a 30% Sb ratio could be due to the optimal concentration of Sb doping in the SnO2 matrix. The Sb ions incorporated into the SnO2 matrix help reduce the particle size, provide more active sites for electron transport, and increase conductivity, which results in a decrease in charge transfer resistance. Therefore, the ATO material sample with an Sb/Sn ratio of 30% exhibits optimized charge storage, charge transfer, ion adsorption, and release capabilities.
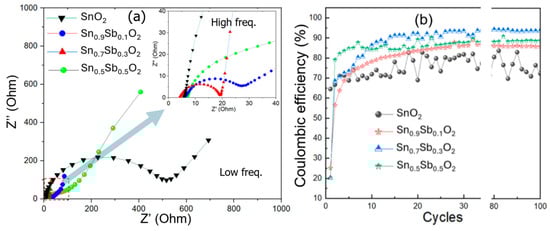
Figure 7.
(a) Nyquist plots (The inset of the figure provides a magnified view of the red dashed area.), and (b) the dependence of Coulombic efficiency on the charge–discharge cycle of the ATO electrode samples.
The Coulombic efficiency is defined as the ratio of discharge time to charge time at a constant charge/discharge current density. Figure 7b shows the Coulombic efficiency graph over 100 charge–discharge cycles for ATO electrode samples with Sb content of 0%, 10%, 30%, and 50%. Following the initial cycles, the Coulombic efficiency of the samples increases significantly. The ATO sample with 30% Sb content quickly reaches a stable efficiency above 93% after about 10 cycles, while the SnO2 sample shows a charge–discharge efficiency below 80% and remains unstable. Additionally, the ATO samples with 10% and 50% Sb content only achieve a charge–discharge efficiency below 85%.
Based on the comparison of electrode materials for supercapacitors (Table S3), our research demonstrates that the ATO material exhibits remarkable performance in terms of specific capacitance, energy density, and power density, highlighting its strong potential for advanced energy storage applications.
4. Conclusions
In summary, by using anhydrous salt precursors such as Na2SnO3 and KSb(OH)6 and a hydrothermal process at high temperature (220 °C, 20 MPa), we successfully synthesized highly crystalline ATO nanomaterials without the need for a post-sintering process. The results indicate that the synthesized ATO samples exhibit high crystallinity, with crystal sizes ranging from 4 to 6 nm, and the highest Sb/(Sb + Sn) concentration can reach 30%. The as-prepared ATO nanoparticle slurry was directly coated onto a Ti foil substrate as an electrochemical electrode. Galvanostatic charge–discharge measurements show that the ATO electrode can achieve a capacitance of up to 343.2 F g−1 at a current density of 1 A g−1 and retains 93% of its Coulombic efficiency after the first 10 charge/discharge cycles. The findings suggest that ATO materials synthesized using the hydrothermal method are promising candidates for supercapacitor electrodes.
Supplementary Materials
The following supporting information can be downloaded at https://www.mdpi.com/article/10.3390/electrochem6020022/s1, Figure S1. (a) Process of synthesizing ATO nanoparticles, (b) image of the autoclave system, (c) process of fabricating the electrode; Figure S2. The SEM images and photos of the solution synthesis and after drying of ATO and SnO2 samples; Figure S3. Determination of the thickness of the film before and after thermal pressing; Figure S4. SEM image of the ATO electrode sample; Table S1: The lattice parameters (a,c) and the unit cell volume (V) of ATO materials; Table S2: Experimental data on the specific capacitance of different ATO samples; Table S3: The summarized performance of various SnO2-based supercapacitor electrodes. References [28,29,30,31,32] are cited in the supplementary materials.
Author Contributions
V.-H.H.—conceptualization, investigation, data analysis, formal analysis, writing—original draft preparation. D.-L.N.—methodology, N.T.—review and editing, V.-D.T.—review and editing, V.-N.L.—original draft preparation, T.-T.D.—corresponding author, conceptualization, writing—review and editing, funding acquisition. All authors have read and agreed to the published version of the manuscript.
Funding
This research was funded by the Hanoi University of Science and Technology (HUST), project no. T2023-PC-045.
Institutional Review Board Statement
Not applicable.
Informed Consent Statement
Not applicable.
Data Availability Statement
Data is contained within the article or Supplementary Materials.
Conflicts of Interest
The authors declare no conflicts of interest.
References
- Yoo, B.; Kim, K.; Lee, S.H.; Kim, W.M.; Park, N.-G. ITO/ATO/TiO2 triple-layered transparent conducting substrates for dye-sensitized solar cells. Sol. Energy Mater. Sol. Cells 2008, 92, 873–877. [Google Scholar] [CrossRef]
- Sneha, C.; Baiju, V.K.; Varghese, S. Antimony doped Tin oxide MOS sensors for Hydrogen Detection at Low Concentrations. Sens. Actuators A Phys. 2023, 362, 114665. [Google Scholar] [CrossRef]
- Englund, S.; Kubart, T.; Keller, J.; Moro, M.V.; Primetzhofer, D.; Suvanam, S.S.; Scragg, J.S.; Platzer-Björkman, C. Antimony-Doped Tin Oxide as Transparent Back Contact in Cu2ZnSnS4 Thin-Film Solar Cells. Phys. Status Solidi. 2019, 216, 601–607. [Google Scholar] [CrossRef]
- Zhang, J.; Gao, L. Synthesis and characterization of antimony-doped tin oxide (ATO) nanoparticles by a new hydrothermal method. Mater. Chem. Phys. 2004, 87, 10–13. [Google Scholar] [CrossRef]
- Lee, K.T.; Liu, D.M.; Liang, Y.; Matsushita, N.; Ikoma, T.; Lu, S.Y. Porous fluorine-doped tin oxide as a promising substrate for electrochemical biosensors—Demonstration in hydrogen peroxide sensing. J. Mater. Chem. B 2014, 2, 7779–7784. [Google Scholar] [CrossRef] [PubMed]
- Vidhya, S.N.; Balasundaram, O.N.; Chandramohan, M. Structural and optical investigations of gallium doped tin oxide thin films prepared by spray pyrolysis. J. Saudi Chem. Soc. 2016, 20, 703–710. [Google Scholar] [CrossRef]
- Yu, Z.; Perera, I.R.; Daeneke, T.; Makuta, S.; Tachibana, Y.; Jasieniak, J.; Mishra, A.; Bäuerle, P.; Spiccia, L.; Bach, U. Indium tin oxide as a semiconductor material in efficient p-type dye-sensitized solar cells. NPG Asia Mater. 2016, 8, 305. [Google Scholar] [CrossRef]
- Altaf, U.; Ansari, M.Z.; Rubab, S. Influence of aluminium doping on structural and optical properties of tin oxide nanoparticles. Mater. Chem. Phys. 2023, 297, 127304. [Google Scholar] [CrossRef]
- An, G.H.; Lee, D.Y.; Lee, Y.J.; Ahn, H.J. Ultrafast Lithium Storage Using Antimony-Doped Tin Oxide Nanoparticles Sandwiched between Carbon Nanofibers and a Carbon Skin. ACS Appl. Mater. Interfaces 2016, 8, 30264–30270. [Google Scholar] [CrossRef]
- Zhang, J.; Gao, L. Synthesis of antimony-doped tin oxide (ATO) nanoparticles by the nitrate–citrate combustion method. Mater. Res. Bull. 2004, 39, 2249–2255. [Google Scholar] [CrossRef]
- Li, Y.; Wang, J.; Feng, B.; Duan, K.; Weng, J. Synthesis and characterization of antimony-doped tin oxide (ATO) nanoparticles with high conductivity using a facile ammonia-diffusion co-precipitation method. J. Alloys Compd. 2015, 634, 37–42. [Google Scholar] [CrossRef]
- Benrabah, B.; Bouaza, A.; Hamzaoui, S.; Dehbi, A. Sol-gel preparation and characterization of antimony doped tin oxide (ATO) powders and thin films. Eur. Phys. J. Appl. Phys. 2009, 48, 30301. [Google Scholar] [CrossRef]
- Amutha, E.; Rajaduraipandian, S.; Sivakavinesan, M.; Annadurai, G. Hydrothermal synthesis and characterization of the antimony–tin oxide nanomaterial and its application as a high-performance asymmetric supercapacitor, photocatalyst, and antibacterial agent. Nanoscale Adv. 2023, 5, 255–267. [Google Scholar] [CrossRef] [PubMed]
- Anh, T.X.; Tung, D.T.; Nhan, D.Q.; Hoang, T.V.; Trung, D.Q.; Thu, L.D.; Hoang, P.H.; Cuong, N.D. Study of ATO nanoparticles by the solvothermal method for thermal insulated coated glass: A green energy application. Green Process. Synth. 2016, 5, 105869. [Google Scholar] [CrossRef]
- Dissanayake, K.; Kularatna-Abeywardana, D.J. A review of supercapacitors: Materials, technology, challenges, and renewable energy applications. Energy Storage 2024, 96, 112563. [Google Scholar] [CrossRef]
- Osora, H.; Kolkoma, D.; Anduwan, G.; Waimbo, M.; Velusamy, S. Hydrothermally Grown SnO2 and SnO2/rGO Nanocomposite and Its Physio-Electrochemical Studies for Pseudocapacitor Electrode Applications. J. Clust. Sci. 2024, 35, 891–901. [Google Scholar] [CrossRef]
- Babar, U.D.; Borage, D.B.; Wagh, G.S.; Jadhav, V.S.; Chavan, P.P.; Chougale, A.D.; Rathod, K.C.; Patil, R.B.; Pawar, U.T.; Kamble, P.D.; et al. Chemically Synthesized Sb-Doped SnO2 Nanoparticles for Supercapacitor Application. J. Nanoelectron. Optoelectron. 2024, 19, 364–369. [Google Scholar] [CrossRef]
- Zhang, J.; Sun, Y.; Xu, J. Fabrication of antimony doped tin oxide nanopowders as an advanced electrode material for supercapacitors. Micro Nano Lett. 2019, 14, 254–258. [Google Scholar] [CrossRef]
- Zhang, Z.; Ma, C.; He, L.; Huang, M.; Yu, L.; Zhang, Y. Facile synthesis of ATO/MnO2 core–shell architectures for electrochemical capacitive energy storage. Ceram. Int. 2014, 40, 10309–10315. [Google Scholar] [CrossRef]
- Kleinjan, W.E.; Brokken-Zijp, W.E.; Van De Belt, R.; Chen, Z.; De With, G. Antimony-doped tin oxide nanoparticles for conductive polymer nanocomposites. J. Mater. Res. 2008, 23, 869–880. [Google Scholar] [CrossRef]
- Li, J.; Chen, C.; Li, J.; Li, S.; Dong, C. Synthesis of Tin-Glycerate and It Conversion into SnO2 Spheres for Highly Sensitive Low-Ppm-Level Acetone Detection. J. Mater. Sci. Mater. Electron. 2020, 31, 16539–16547. [Google Scholar] [CrossRef]
- Gagné, O.C.; Hawthorne, F.C. Bond-length distributions for ions bonded to oxygen: Metalloids and post-transition metals. Acta Crystallogr. Sect. B 2018, 74, 63–78. [Google Scholar] [CrossRef]
- Duong, T.; Do, N.; Pham, T.; Nguyen, C. A facile nonaqueous solution approach to controlling the size of ZnO crystallites and predominant {0001} facets. J. Alloys Compd. 2016, 686, 854–858. [Google Scholar] [CrossRef]
- Van Pham, T.; Hirano, T.; Tanabe, E.; Septiani, E.L.; Cao, K.L.A.; Ogi, T. Tailored Nanoscale Structure of Flame-Made Antimony Doped Tin Oxides and Their Near-Infrared Shielding Properties. Nanoscale 2025, 26, 74–81. [Google Scholar]
- Jayachandiran, J.; Yesuraj, J.; Arivanandhan, M.; Muthuraaman, B.; Jayavel, R.; Nedumaran, D. Bifunctional investigation of ultra-small SnO2 nanoparticle decorated rGO for ozone sensing and supercapacitor applications. RSC Adv. 2021, 11, 856–866. [Google Scholar] [CrossRef]
- Arote, S.A. Electrochemical Energy Storage Mechanisms and Performance Assessments: An Overview. In Electrochemical Energy Storage Devices and Supercapacitors; IOP Publishing: Bristol, UK, 2021; Volume 26, pp. 74–81. [Google Scholar]
- Duong, T.-T.; Tuan, T.Q.; Dung, D.V.A.; Van Quy, N.; Vu, D.-L.; Nam, M.H.; Chien, N.D.; Yoon, S.-G.; Le, A.-T. Application of Polyaniline Nanowires Electrodeposited on the FTO Glass Substrate as a Counter Electrode for Low-Cost Dye-Sensitized Solar Cells. Curr. Appl. Phys. 2014, 14, 1607–1611. [Google Scholar] [CrossRef]
- Zhang, Y.; Hu, Z.; Liang, Y.; Yang, Y.; An, N.; Li, Z.; Wu, H. Growth of 3D SnO2 nanosheets on carbon cloth as a binder-free electrode for supercapacitors. J. Mater. Chem. A 2015, 3, 15057–15067. [Google Scholar] [CrossRef]
- Saravanakumar, B.; Ravi, G.; Ganesh, V.; Ameen, F.; Al-Sabri, A.; Yuvakkumar, R. Surfactant assisted zinc doped tin oxide nanoparticles for supercapacitor applications. J. Sol-Gel Sci. Technol. 2018, 86, 521–535. [Google Scholar] [CrossRef]
- Sivakumar, S.; Manikandan, E.; Mahalakshmi, B.; Ahmad mala, N.; Nelson prabu, L. Synthesis and characterization of optical, magnetic and electrochemical behavior of manganese–zinc co-doped tin oxide nanoparticles. Vacuum 2020, 173, 109116. [Google Scholar] [CrossRef]
- Asaithambi, S.; Sakthivel, P.; Karuppaiah, M.; Sankar, G.U.; Balamurugan, K.; Yuvakkumar, R.; Thambidurai, M.; Ravi, G. Investigation of electrochemical properties of various transition metals doped SnO2 spherical nanostructures for supercapacitor applications. J. Energy Storage 2020, 31, 101530. [Google Scholar] [CrossRef]
- Ren, L.; Xu, B.; Wang, G.; Yin, X.; Liu, Y.; Yang, W.; Chen, Y. Fabrication of an Antimony Doped Tin Oxide–Graphene Nanocomposite for Highly Effective Capacitive Deionization of Saline Water. RSC Adv. 2020, 10, 39130–39136. [Google Scholar] [CrossRef] [PubMed]

Disclaimer/Publisher’s Note: The statements, opinions and data contained in all publications are solely those of the individual author(s) and contributor(s) and not of MDPI and/or the editor(s). MDPI and/or the editor(s) disclaim responsibility for any injury to people or property resulting from any ideas, methods, instructions or products referred to in the content. |
© 2025 by the authors. Licensee MDPI, Basel, Switzerland. This article is an open access article distributed under the terms and conditions of the Creative Commons Attribution (CC BY) license (https://creativecommons.org/licenses/by/4.0/).