
Reduction of Cd(II) Ions in the Presence of Tetraethylammonium Cations. Adsorption Effect on the Electrode Process


Abstract
:1. Introduction
2. Theory
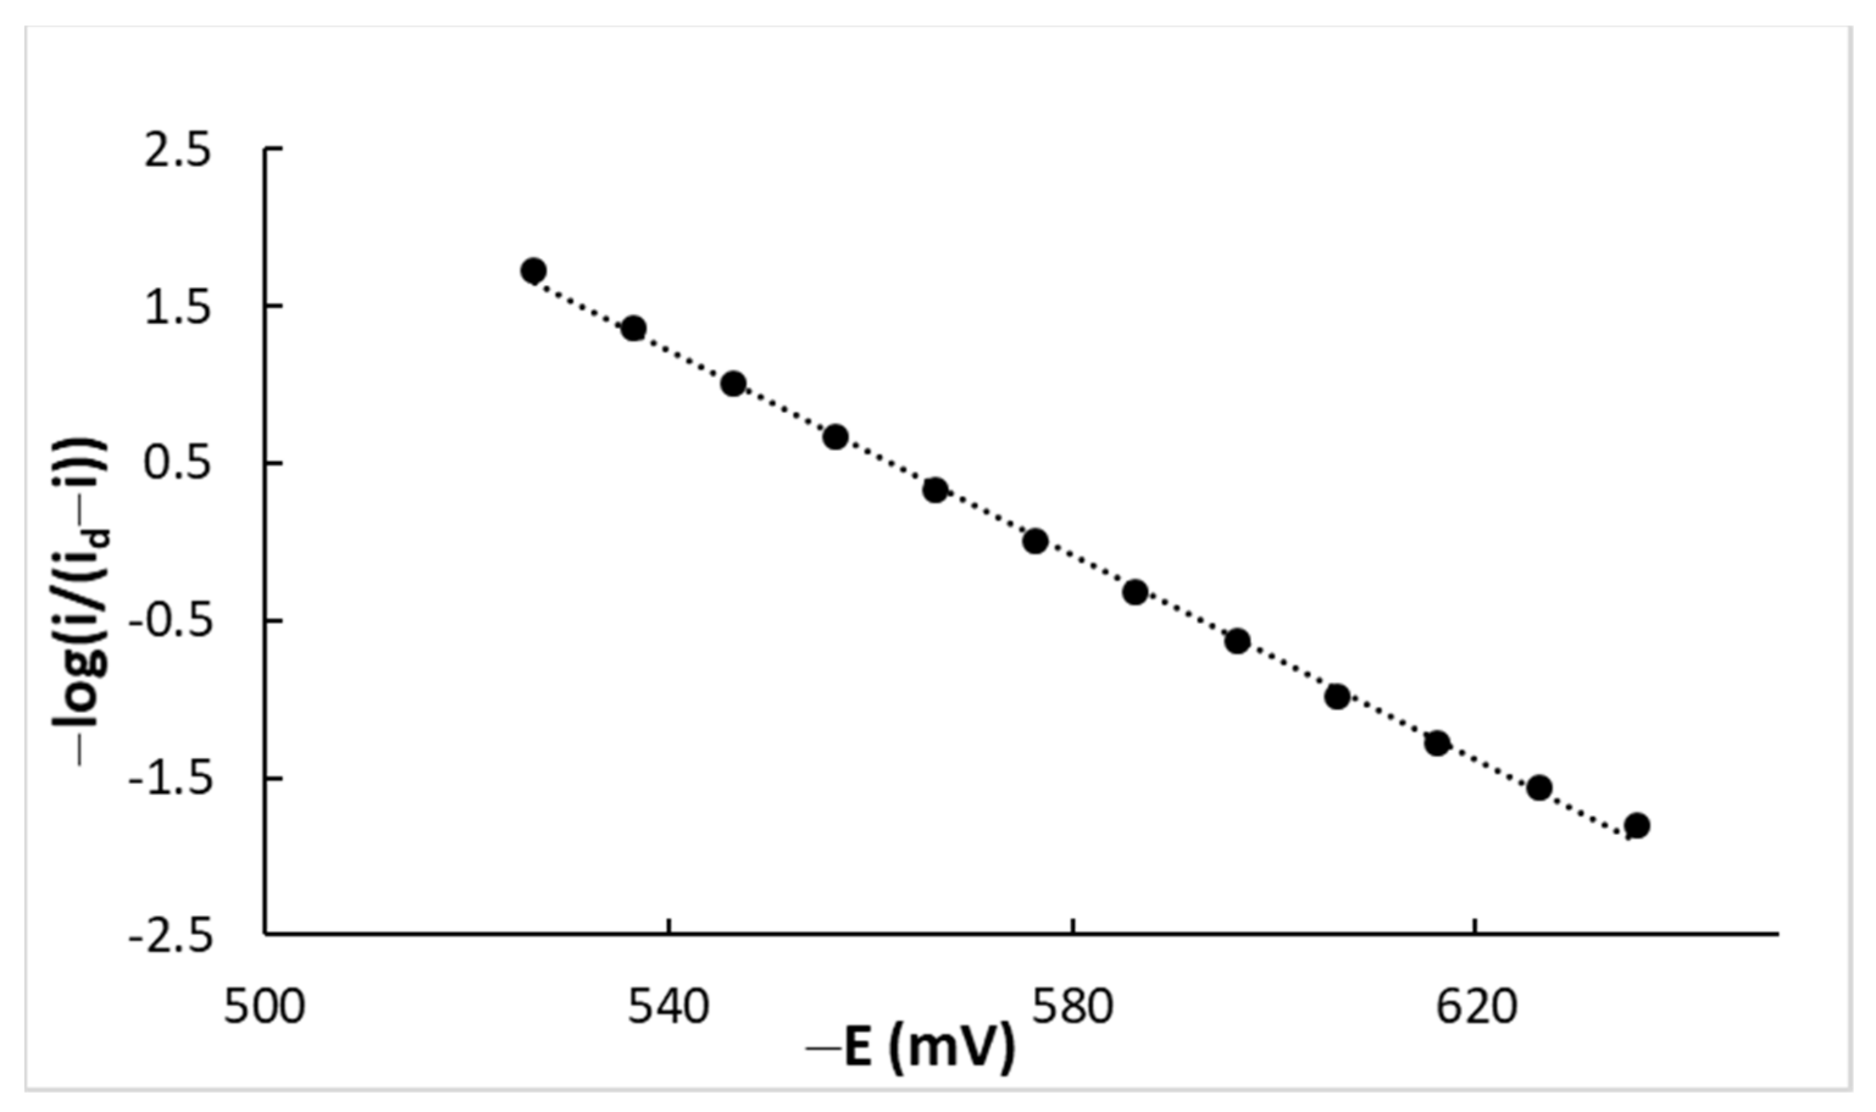
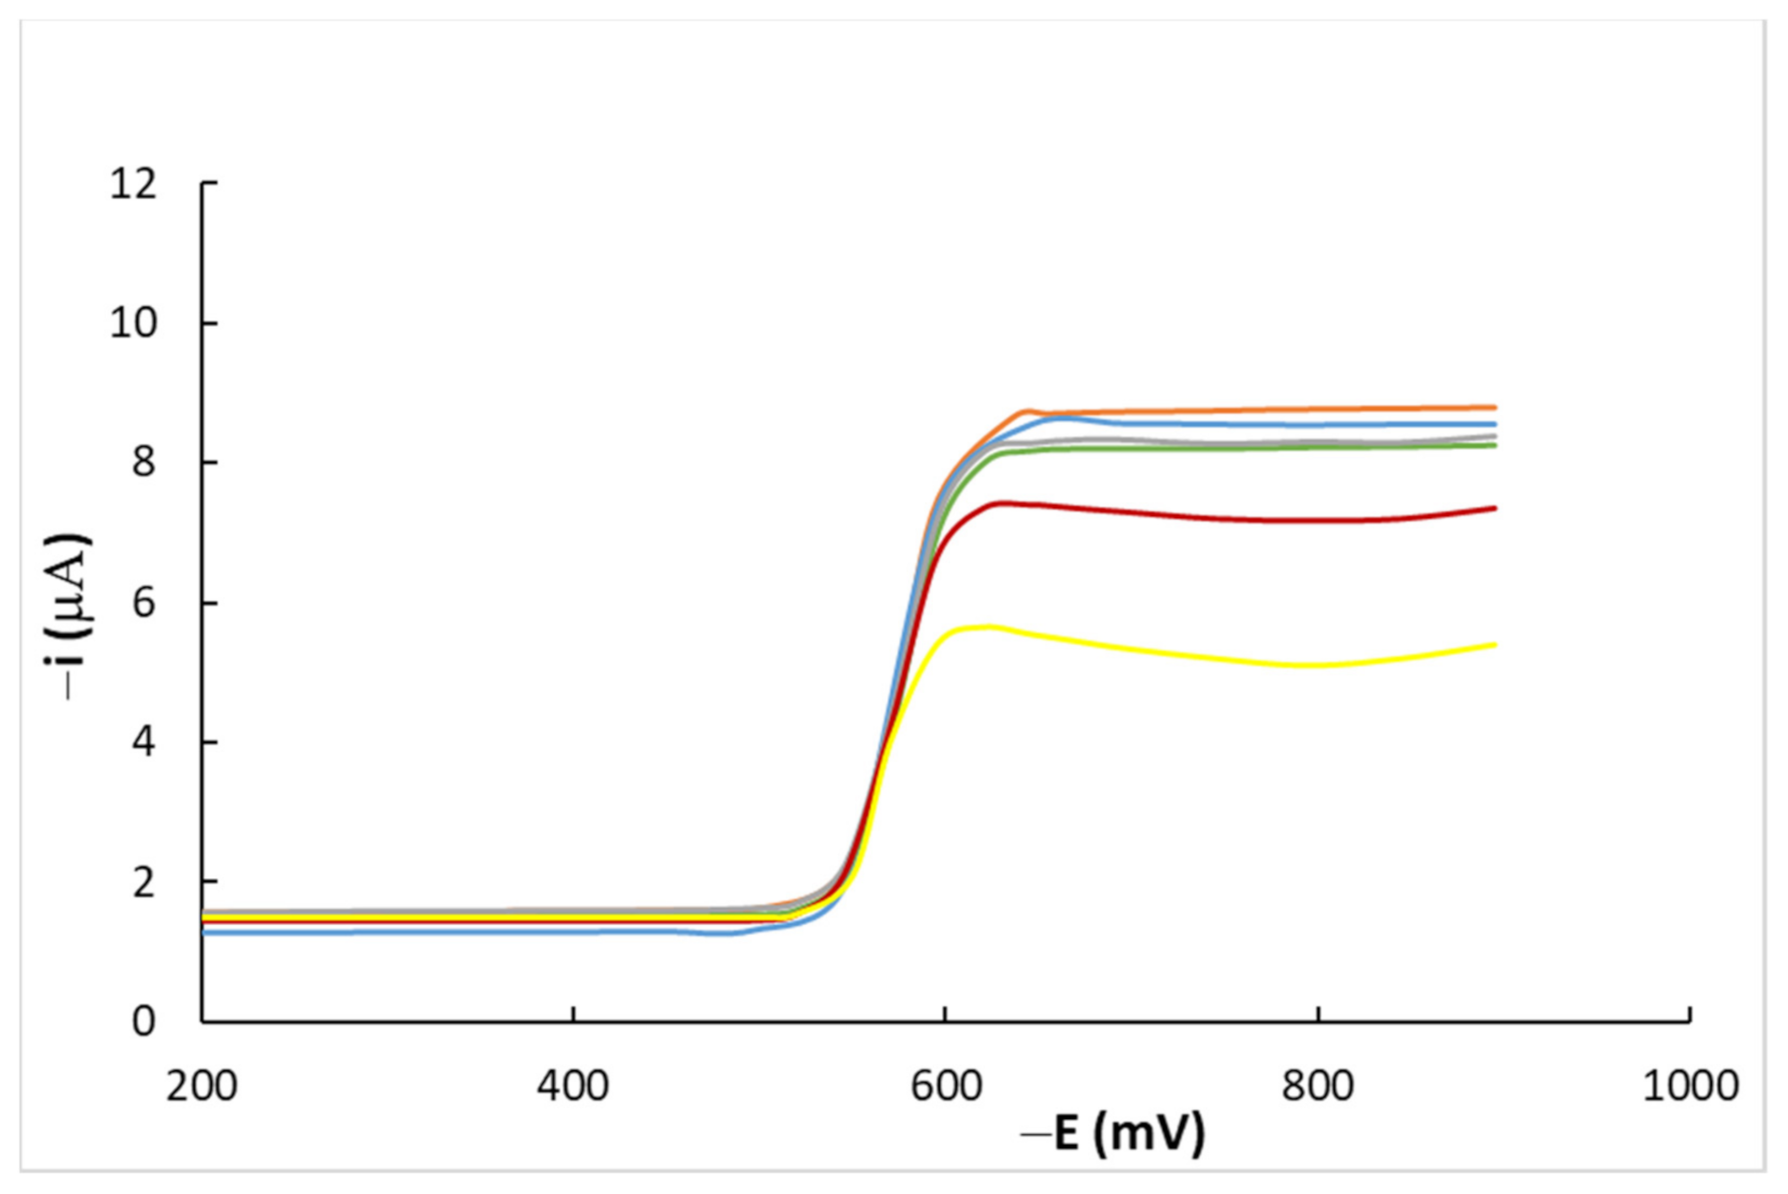
2.1. Polarograms
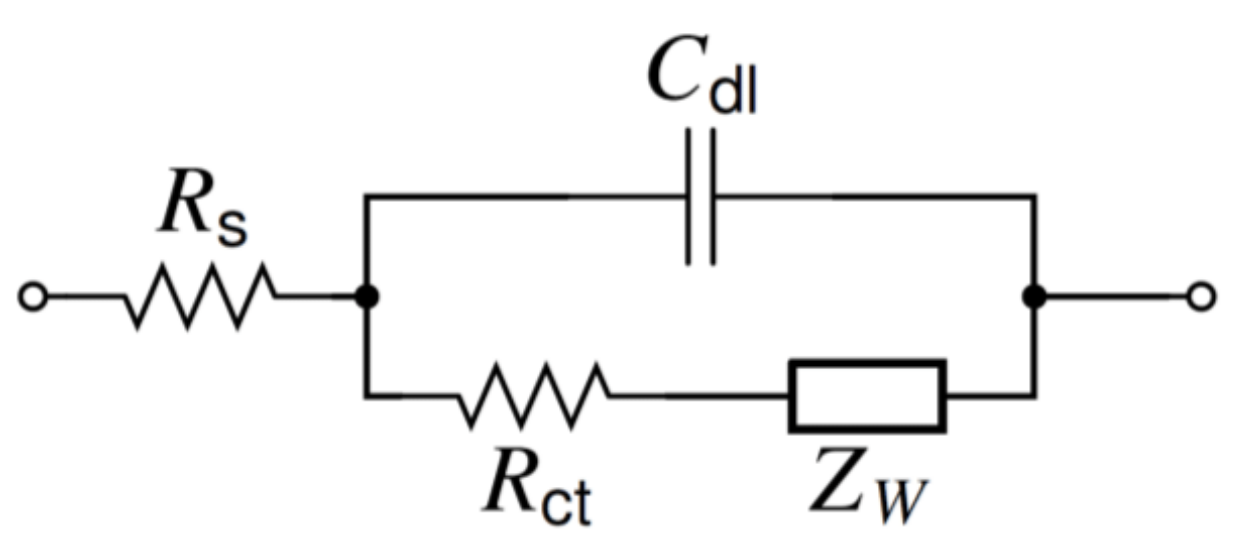
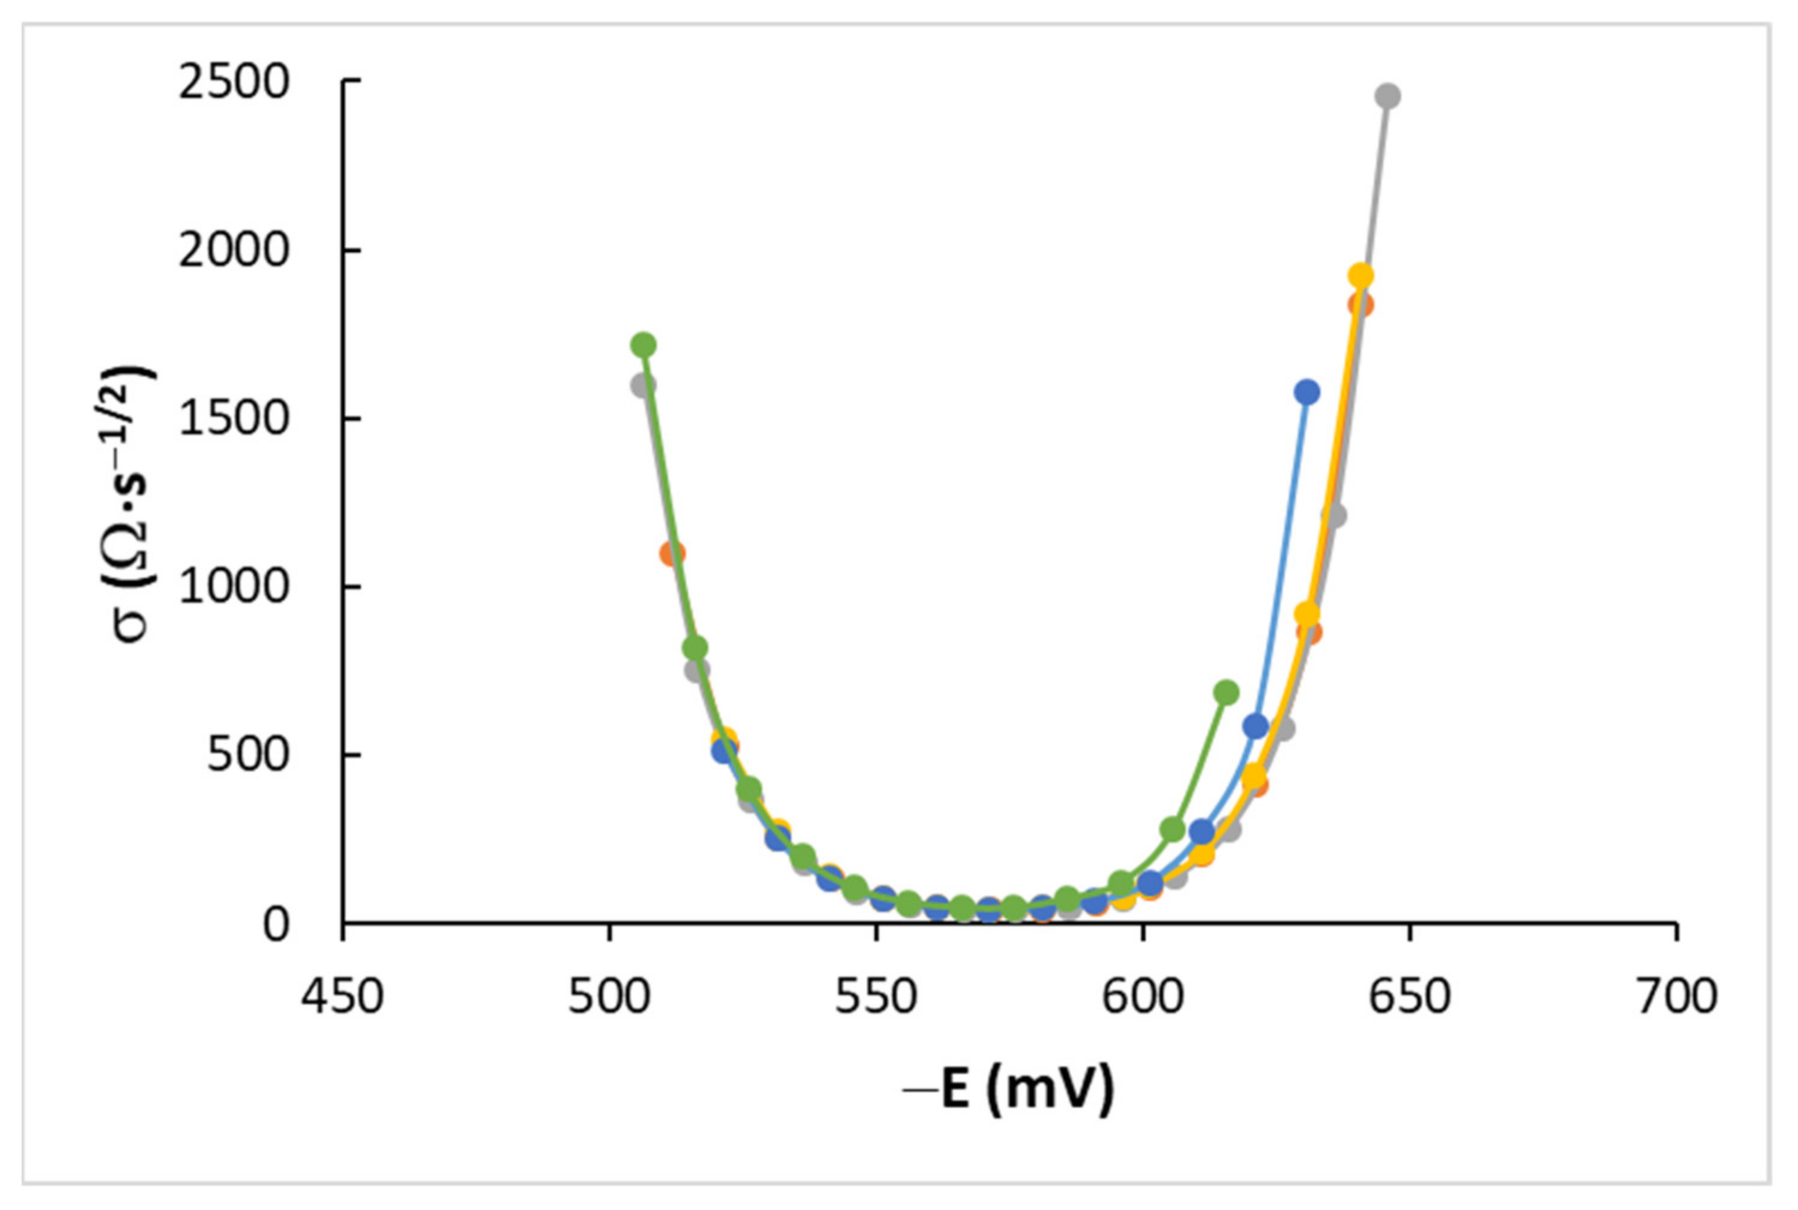
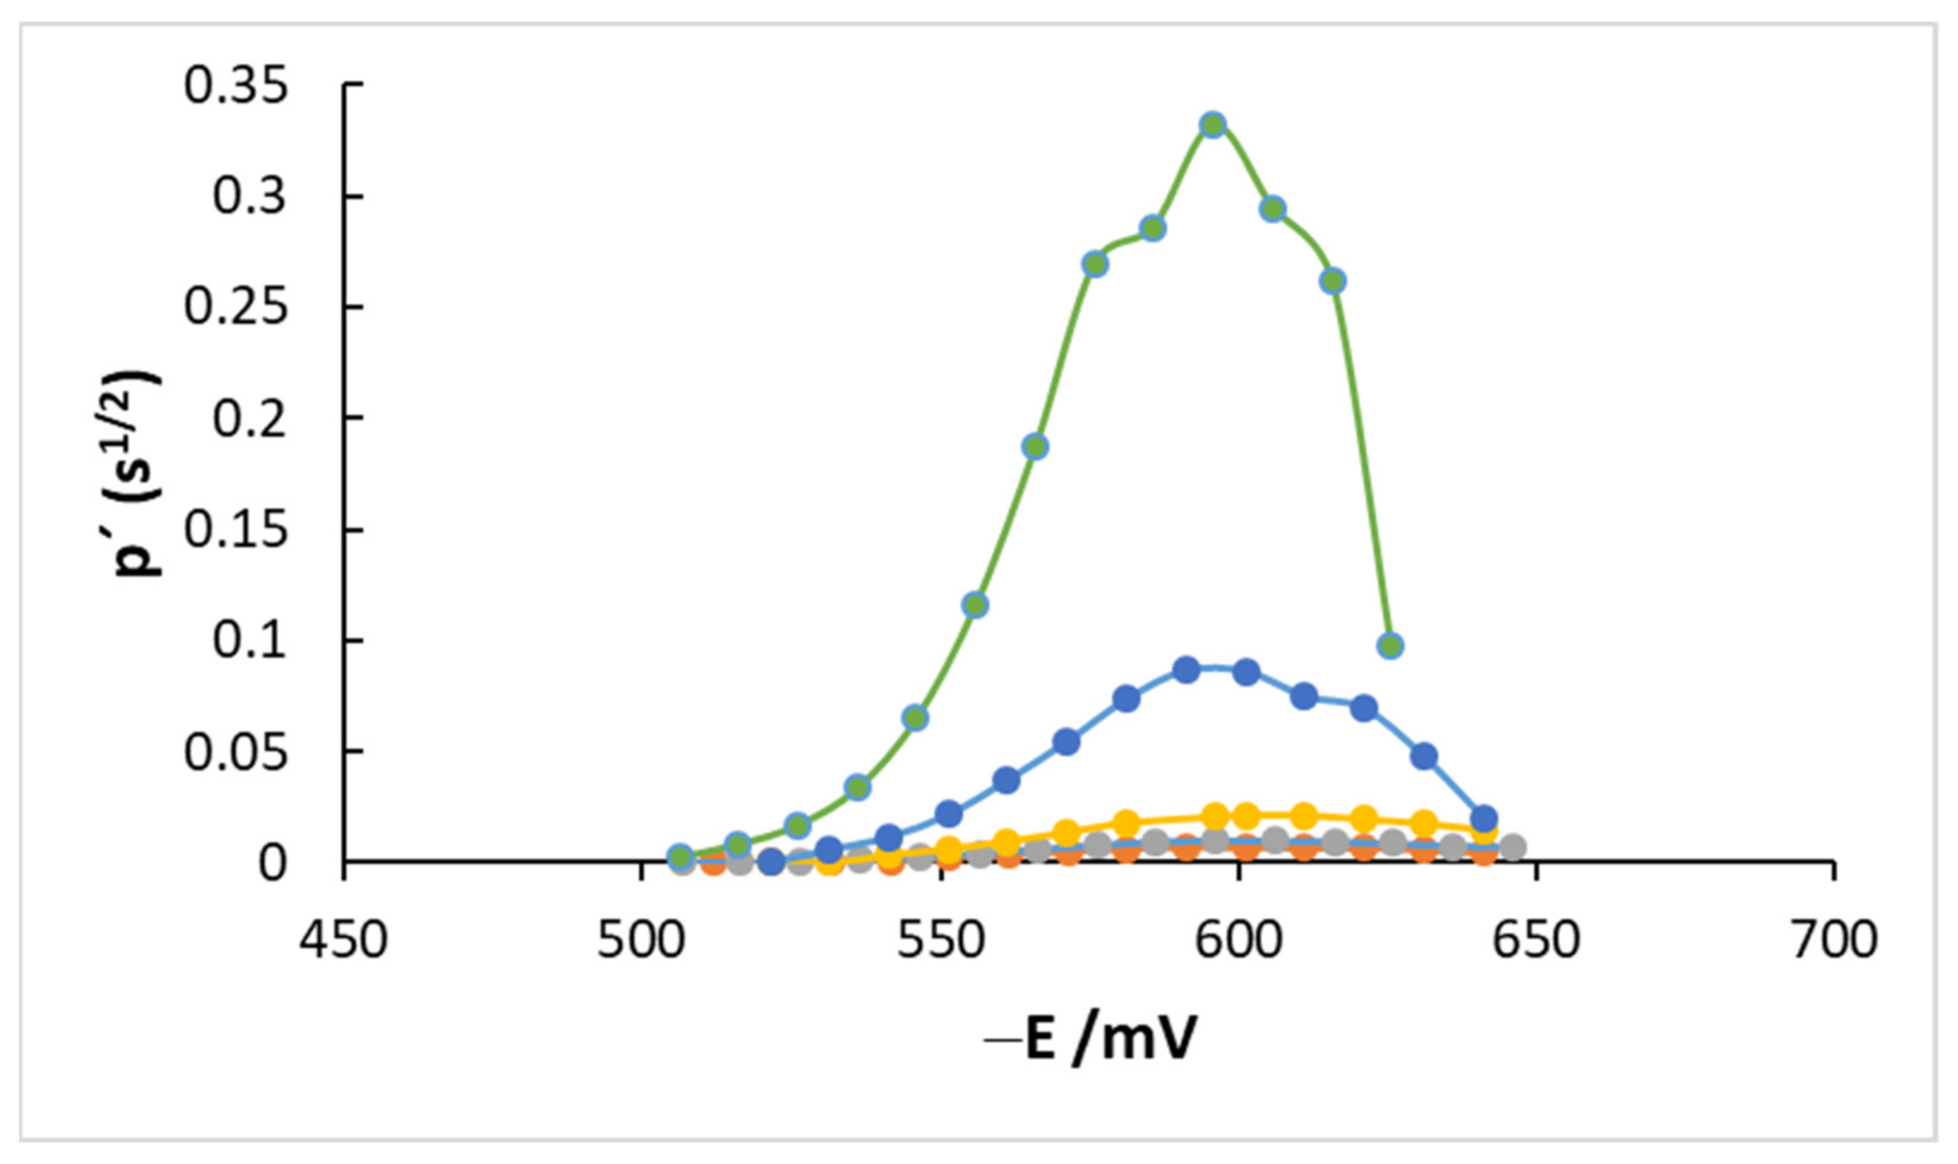
2.2. Impedance
2.2.1. General Equations
2.2.2. Other Treatments
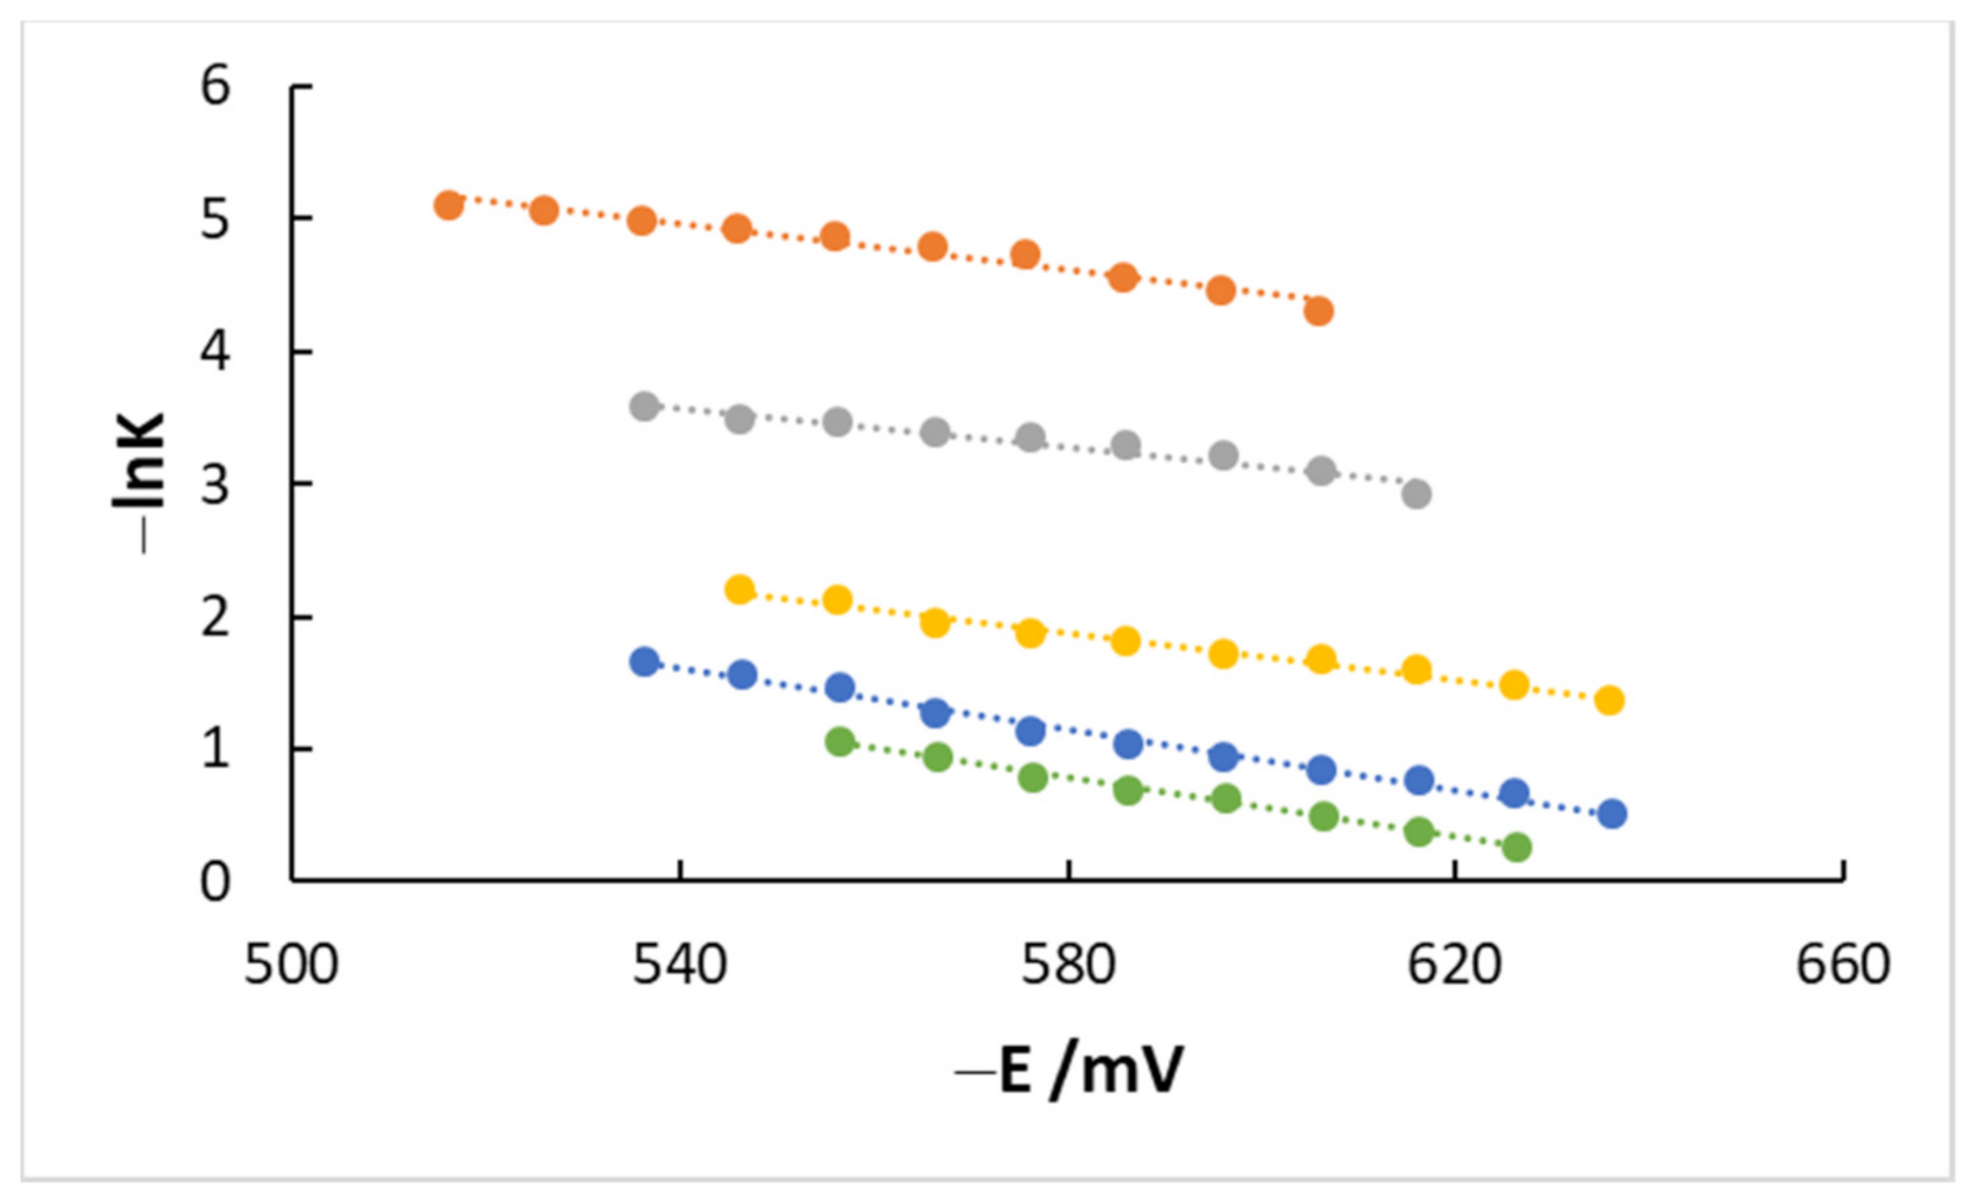
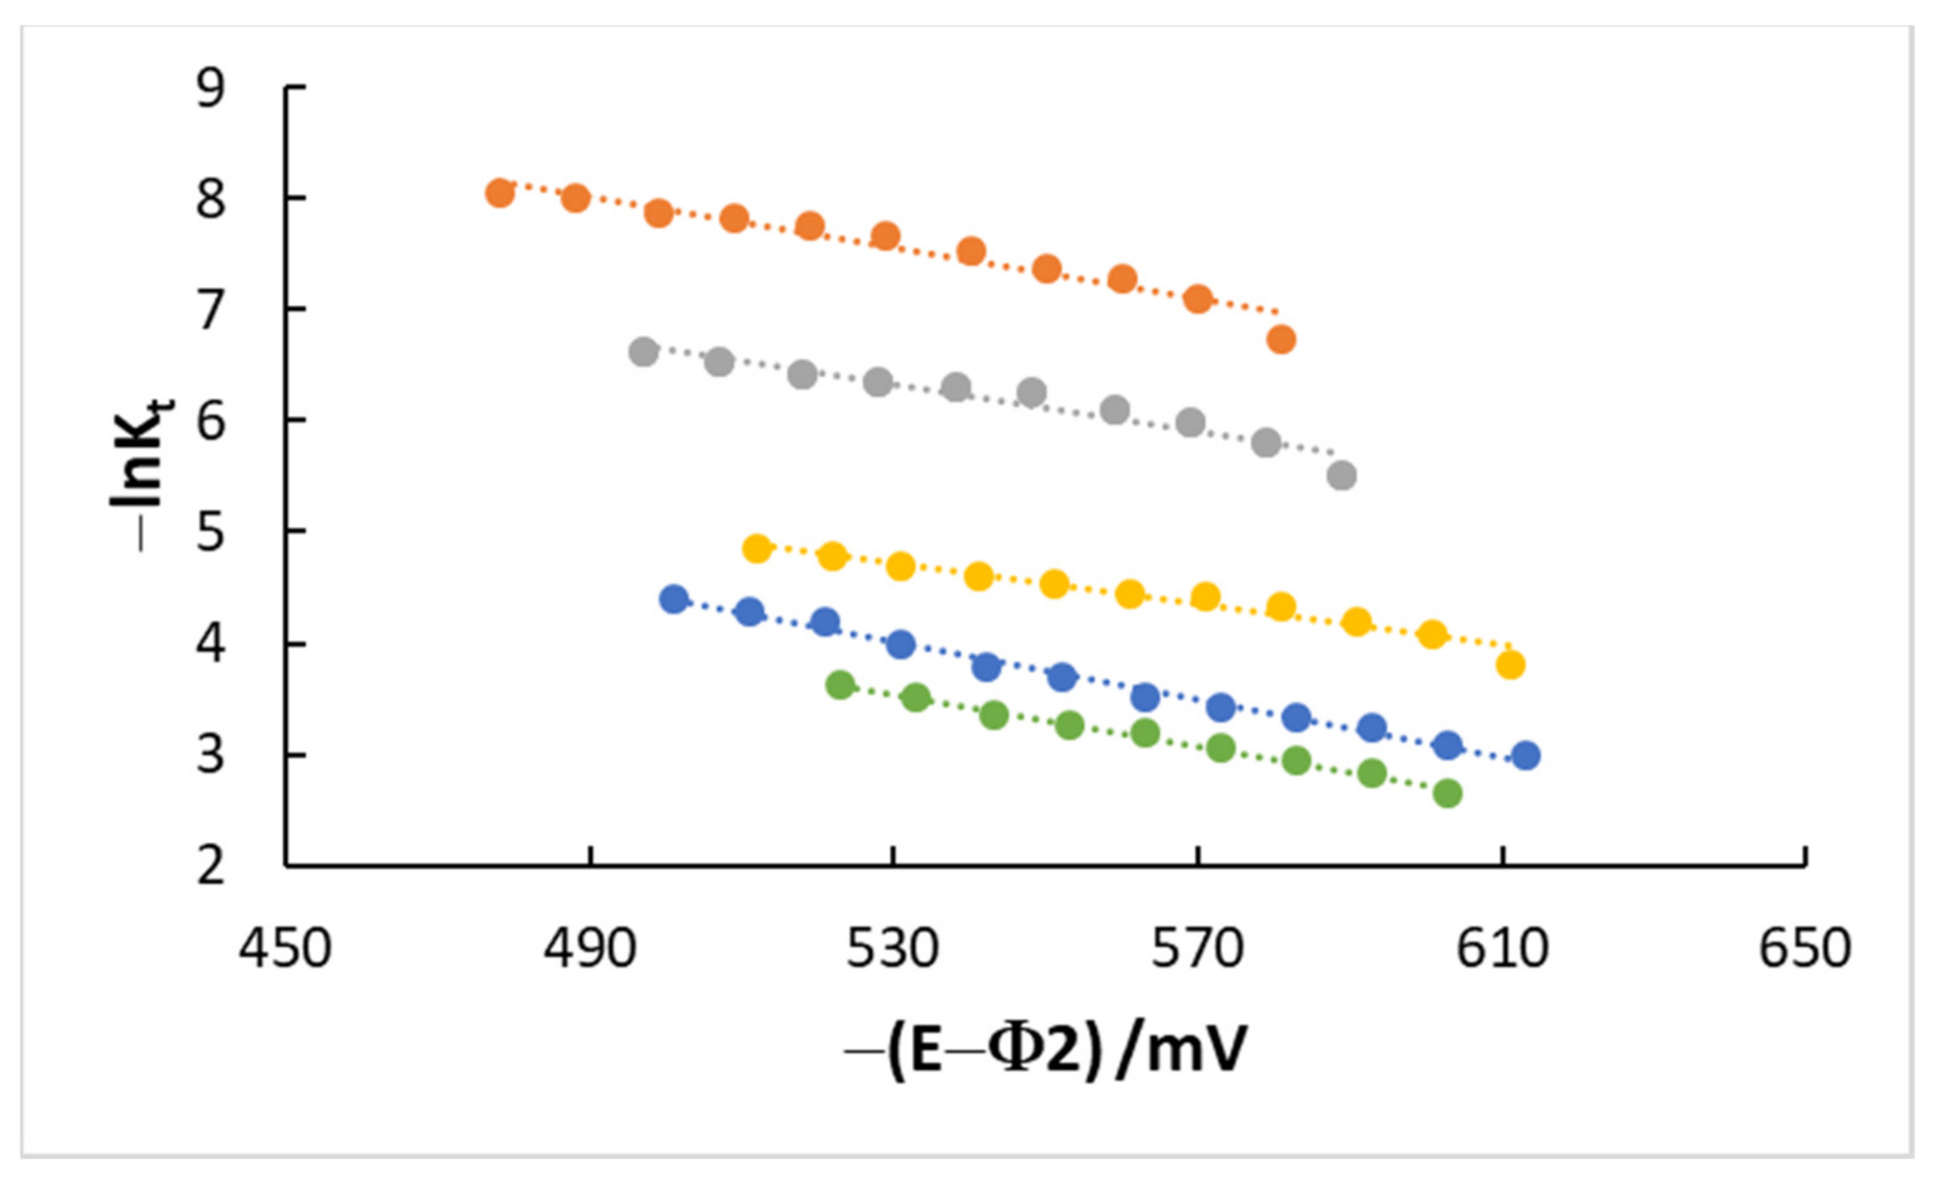
2.3. Kinetic Parameters
2.3.1. The Influence of the Double Layer (Adsorption)
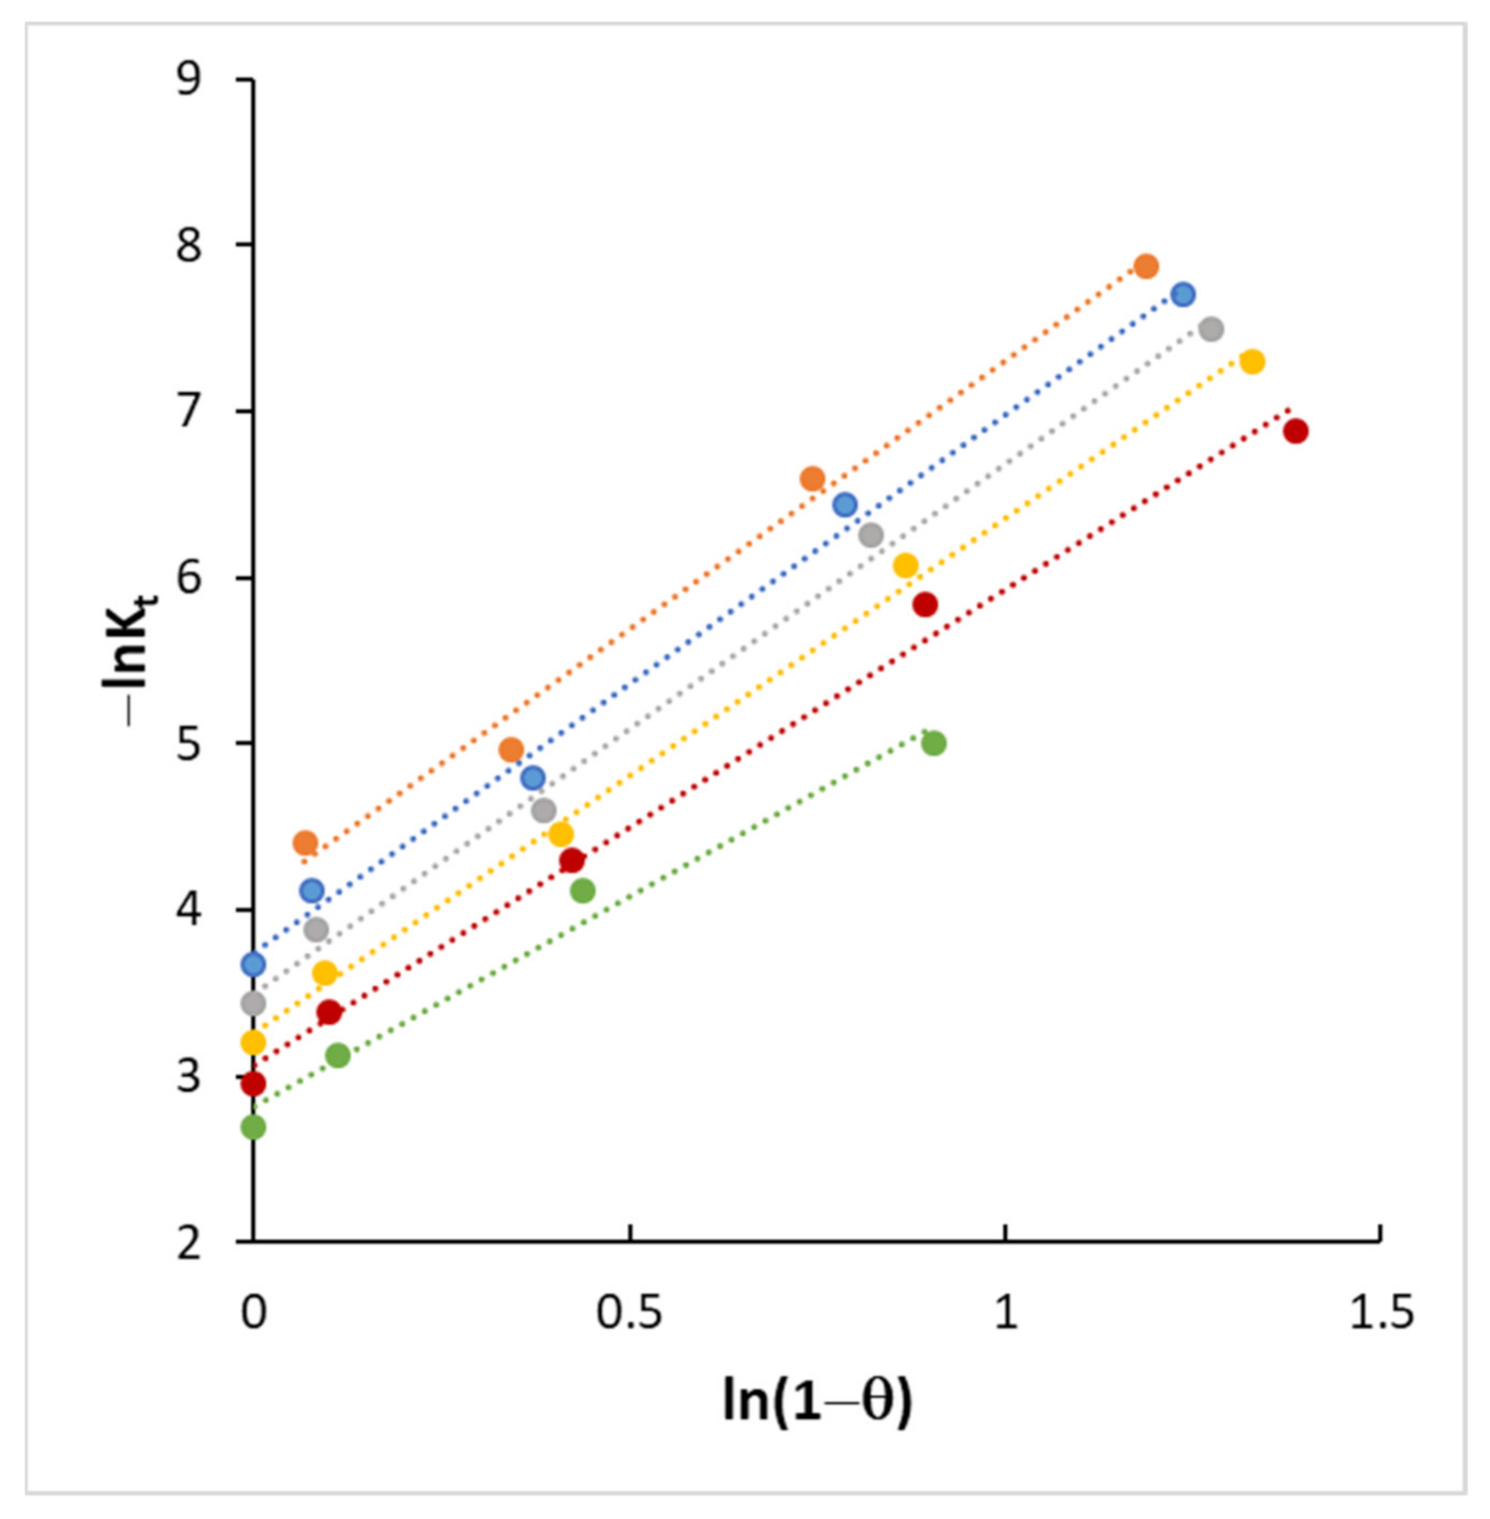
2.3.2. Coverage
3. Material and Methods
4. Results and Discussion
4.1. DC Measurements
4.2. AC Measurements
4.3. Kinetics and Coverage
5. Conclusions
Supplementary Materials
Funding
Institutional Review Board Statement
Informed Consent Statement
Data Availability Statement
Conflicts of Interest
References
- Struijs, J.; Sluyters-Rehbach, M.; Sluyters, J.H. The mechanism of the Cd(II) reduction in 1 M fluoride, perchlorate and chloride solutions at the DME, a combined DC, AC admittance and demodulation study. J. Electroanal. Chem. 1984, 171, 177–193. [Google Scholar] [CrossRef]
- Bongenaar, C.P.M.; Remijnse, A.G.; Sluyters-Rehbach, M.; Sluyters, J.H. On the selection of the most probable mechanism of the Cd(II) reduction at mercury from 1M KF solution. J. Electroanal. Chem. 1980, 111, 139–153. [Google Scholar] [CrossRef]
- Bongenaar, C.P.M.; Remijnse, A.G.; Temmerman, E.; Sluyters-Rehbach, M.; Sluyters, J.H. A faradaic impedance study of the electrochemical reduction of Cd(II) ions from aqueous 1M (KF+KCl) mixed electrolyte solution at the dropping mercury electrode. J. Electroanal. Chem. 1980, 111, 155–162. [Google Scholar] [CrossRef]
- Brug, G.J.; Sluyters-Rehbach, M.; Sluyters, J.H. A study of the reduction of tris-oxalato Fe(III) from aqueous 1 M oxalate solution at a polycrystalline gold electrode. J. Electroanal. Chem. 1984, 176, 297–308. [Google Scholar] [CrossRef]
- Souto, R.M.; Sluyters-Rehbach, M.; Sluyters, J.H. On the catalytic effect of thiourea on the electrode reduction of cadmium (II) ions at the DME from aqueous 1 M KF solutions. J. Electroanal. Chem. 1986, 201, 33–45. [Google Scholar] [CrossRef]
- Sluyters-Rehbach, M.; Souto, R.M.; Sluyters, J.H. Induced reactant adsorption accompanying the reduction of cadmium(II) ions from 1 M KF solutions containing thiourea at elevated concentrations: An ac admittance study. J. Electroanal. Chem. 1989, 264, 195–215. [Google Scholar] [CrossRef]
- Souto, R.M.; Saakes, M.; Sluyters-Rehbach, M.; Sluyters, J.H. The catalysis of the electrochemical reduction of cadmium ions by chloride ions. A mechanistic study in mixed 1 M KF + KCl aqueous solutions at the dropping mercury electrode. J. Electroanal. Chem. 1987, 245, 167–189. [Google Scholar] [CrossRef]
- Saakes, M.; Sluyters-Rehbach, M.; Sluyters, J.H. The inhibition of Cd(II) reduction at the DME from aqueous 1 M NaClO4 by sucrose. J. Electroanal. Chem. 1990, 282, 161–174. [Google Scholar] [CrossRef]
- Saakes, M.; Sluyters-Rehbach, M.; Souto, R.M.; Sluyters, J.H. The reduction pathway of the Cd(II) reduction in mixed (0.8-x) M NaClO4 + x M NaF base electrolytes. J. Electroanal. Chem. 1989, 264, 217–234. [Google Scholar] [CrossRef]
- Torrent, J.; González, R.; Sanz, F.; Molero, M. The adsorption of tetraethylammonium ions at a mercury electrode from perchlorate solutions. J. Electroanal. Chem. 1989, 270, 381–393. [Google Scholar] [CrossRef]
- Torrent, J. Estudi Termodinamic de L’adsorcio en les Interfaces Hg/HClO4 i Hg/HClO4, TEAClO4 (aq). Influencia Sobre la Reduccio de l’Eu(III). Ph.D. Thesis, University of Barcelona, Barcelona, Spain, 1988. [Google Scholar]
- Vallés, E.; Sanz, F.; Virgili, J. Efecto de algunos cationes tetraalquilamonio sobre la cinética electródica Eu(III)/Eu(II) a recubrimientos intermedios. An. Quim. 1985, 81A, 233–240. [Google Scholar]
- Devanathan, M.A.V.; Fernando, M.J. Specific adsorption of tetra-alkyl-ammonium iodides at the mercury-water interface and the structure of the electrical double layer. Trans. Faraday Soc. 1962, 58, 368–381. [Google Scholar] [CrossRef]
- Piro, J.; Bennes, R.; Bou Karam, E. Ètude de l’adsorption des ammoniums quaternaires à l’interface mercure-solution par mesures des charges de l’electrode. J. Electroanal. Chem. 1974, 57, 399–412. [Google Scholar] [CrossRef]
- Kimmerle, F.M.; Ménard, H. Ionic surface excesses of the tetramethylammonium halides. J. Electroanal. Chem. 1974, 54, 101–121. [Google Scholar] [CrossRef]
- Hamdi, M.; Bennes, R.; Schuhmann, D.; Vanel, P. A study of superficial associations at a mercury electrode in the case of tetrabutylammonium halide solutions. J. Electroanal. Chem. 1980, 108, 255–270. [Google Scholar] [CrossRef]
- Torrent, J.; Sanz, F. Influencia de la adsorción del catión tetraetilamonio en la reducción del europio(III). An. Quim. 1991, 87, 327–331. [Google Scholar]
- Torrent, J.; Sanz, F.; Virgili, J. Activity coefficients of aqueous perchloric acid. J. Solut. Chem. 1986, 15, 363–375. [Google Scholar] [CrossRef]
- Torrent, J.; Sanz, F. Activity coefficients of tetraethylammonium perchlorate in aqueous solutions. Port. Electrochim. Acta 1986, 4, 51–59. [Google Scholar]
- Bard, A.J.; Faulkner, L.R. Electrochemical Methods. Fundamentals and Applications; John Wiley & Sons: Hoboken, NJ, USA, 1980. [Google Scholar]
- Sluyters-Rehbach, M.; Sluyters, J.H. Sine Wave Methods in the Study of Electrode Processes. In Electroanalytical Chemistry; Bard, A.J., Ed.; Marcel Dekker: New York, NY, USA, 1970; Volume 4, pp. 1–128. [Google Scholar]
- Sluyters-Rehbach, M.; Sluyters, J.H. AC Tehcniques. In Comprehensive Treatise of Electrochemistry; Bockris, J.O., Conway, B.E., Yeager, E., White, R.E., Eds.; Plenum Press: New York, NY, USA, 1984; Volume 9, pp. 177–292. [Google Scholar]
- Bongenaar, C.P.M.; Sluyters-Rehbach, M.; Sluyters, J.H. A high-precision network analyzer system for the measurement of the electrode impedance of both stationary and non-stationary electrode, with special attention to the dropping mercury electrode. J. Electroanal. Chem. 1980, 109, 23–39. [Google Scholar] [CrossRef]
- Brug, G.J.; van den EEden, A.L.G.; Sluyters-Rehbach, M.; Sluyters, J.H. The analysis of electrode impedances complicated by the presence of a constant phase element. J. Electroanal. Chem. 1984, 176, 275–295. [Google Scholar] [CrossRef]
- Van der Pool, F.; Sluyters-Rehbach, M.; Sluyters, J.H. On the elucidation of mechanisms of electrode reactions by combination of AC and faradaic rectification polarography. Application to the Zn2+/Zn(Hg) and Cd2+/Cd(Hg) reduction. J. Electroanal. Chem. 1975, 58, 177–188. [Google Scholar] [CrossRef]


| c(TEA) (mM) | 0 | 0.75 | 2 | 5 |
|---|---|---|---|---|
| m (mg) | 4.258 | 4.324 | 4.196 | 4.179 |
| id (μA) | 7.1 | 7.1 | 6.7 | 6.7 |
| D × 106 (cm2/s) | 12.6 | 12.6 | 11.4 | 11.4 |
| Corr sphericity D × 106 (cm2/s) | 9.1 | 9.1 | 8.3 | 8.3 |
| CTEA/mM | 0 | 0.75 | 2 | 5 | 10 |
|---|---|---|---|---|---|
| −Em = −E1/2r/mV | 573.0 | 572.9 | 573.4 | 572.4 | 570.5 |
| σm/Ω·s−1/2 | 39.9 | 39.0 | 41.6 | 41.4 | 46.8 |
| DO × 106/cm2·s−1 | 9.9 | 10.4 | 9.1 | 9.2 | 7.2 |
| −Ef/mV | 573 | 573 | 574 | 573 | 573 |
| CTEA/mM | 0 | 0.75 | 2 | 5 | 10 |
|---|---|---|---|---|---|
| −Emax/mV | 598.1 | 600.4 | 604.5 | 598.4 | 593.0 |
| p′max × 103/s1/2 | 7.0 | 9.9 | 21.5 | 88.7 | 317.0 |
| Kf/cm·s−1 | 0.57 | 0.40 | 0.19 | 0.045 | 0.013 |
Publisher’s Note: MDPI stays neutral with regard to jurisdictional claims in published maps and institutional affiliations. |
© 2021 by the author. Licensee MDPI, Basel, Switzerland. This article is an open access article distributed under the terms and conditions of the Creative Commons Attribution (CC BY) license (https://creativecommons.org/licenses/by/4.0/).
Share and Cite
Torrent-Burgués, J. Reduction of Cd(II) Ions in the Presence of Tetraethylammonium Cations. Adsorption Effect on the Electrode Process. Electrochem 2021, 2, 415-426. https://doi.org/10.3390/electrochem2030027
Torrent-Burgués J. Reduction of Cd(II) Ions in the Presence of Tetraethylammonium Cations. Adsorption Effect on the Electrode Process. Electrochem. 2021; 2(3):415-426. https://doi.org/10.3390/electrochem2030027
Chicago/Turabian StyleTorrent-Burgués, Juan. 2021. "Reduction of Cd(II) Ions in the Presence of Tetraethylammonium Cations. Adsorption Effect on the Electrode Process" Electrochem 2, no. 3: 415-426. https://doi.org/10.3390/electrochem2030027
APA StyleTorrent-Burgués, J. (2021). Reduction of Cd(II) Ions in the Presence of Tetraethylammonium Cations. Adsorption Effect on the Electrode Process. Electrochem, 2(3), 415-426. https://doi.org/10.3390/electrochem2030027