1. Introduction
The development of double layer capacitance (DLC) as an electric energy storage has focused [
1,
2] on the enhancement of the output energy, the power, and cycle stability. Industrial improvements have been conceptually directed [
3,
4] towards: (a) the geometric feature of electrodes such as the enhancement of specific surface areas, (b) solutions to increase ionic conductance, and (c) an increase in applied voltages. The first item has been realized using porous electrodes or powder electrodes in competition of loss of electric conduction [
5]. Secondly, combinations of solvents with salts are significant in order to exhibit highly ionic conduction [
6]. Thirdly, inactive electrodes and solutions with widely depolarized voltage domains have been searched tentatively in order to enhance the energetic performance with the square of the applied voltage [
7,
8]. These improvement techniques have been used on an empirical basis rather than thermodynamic theory.
In contrast, a scientific view of DLC may be directed to variations by measuring variables such as (i) time- and (ii) voltage-dependence as well as roles in (iii) ions, (iv) solvents, and adsorption. A well-known time-dependence (i) is frequency dispersion [
9], which has been explained in terms of the concept of the constant phase element (CPE) [
10,
11,
12,
13]. The DLC has decreased with an increase in ac-frequency through the power law [
14,
15,
16,
17]. As for the voltage-dependence (ii), the DLC does not vary remarkably with dc-voltage in a narrow domain by ac-impedance so that no potential of zero charge (pzc) was observed [
14,
18,
19]. However, measurements in a wide voltage domain have made the dependence specified by current-controlled charge-discharge controls [
20]. The effects of ions on the DLC (iii) have not been recognized in the variations of kinds and concentration of salts [
14,
18] under conventional voltammetric conditions. In contrast, different kinds of solvents (iv) have varied DLC values significantly in the light of effectively oriented dipole moments [
18]. Consequently, voltammetrically observed DLC is a phenomenon in the Helmholtz (or inner) layer, which is independent of the diffuse double layer by ionic concentration distributions. These fundamental studies seem to be inconsistent with industrial efforts of enhancing ionic conductance [
4,
21,
22,
23,
24]. The challenges of examining concentration-dependence [
25,
26,
27,
28,
29,
30,
31] have not been supported by thermodynamic bases because of ionic complications.
The ionic effects of the DLC have classically been described by the Gouy–Chapman (GC) theory, which exhibits V-shaped capacitance vs. voltage curves. Since the theory is known to hold only for low concentrations of salts, we attempted to find V-shaped under various ionic conditions to fail [
14]. The slight V-shape appeared at concentrations less than 0.05 mM [
19]. The direction of finding the V-shape in low concentrations is inconsistent with the industrial improvements to usage of high concentrations. The invalidity of the GC theory has resulted in the extra-condensation of ions beyond the finite size of ions near an electrode by external electric field [
32]. Since the observed DLCs occur mostly in the Helmholtz layer, it is not easy to extract an ionic contribution for the GC theory. It is necessary to establish a theory expressing the ionic effect on DLCs even at high concentrations for practical use.
As concentrations in solutions are increased, their thermodynamic properties generally vary from ideal solution to regular solutions, keeping the mixing entropy ideal [
33]. A further increase in concentrations deviates the entropy from the ideal mixing owing to the interaction of solutes. The deviation gets more remarkable for electrolytes than non-ionic solutes because of electric interaction over a long distance. As a result, the free energy of ions is influenced both by chemical and electric interaction. This has not been applied to the GC theory, in that the probability of ions in the GC theory is expressed by Boltzmann’s distribution only at electric potential,
ϕ, in the form of exp(-z
eϕ/
kBT) for the charge valence
z and charge
e. The probability should include a term of chemical potential,
μ, and concentration,
c. Since concentrations vary in the double layer domain, local energy is not only varied with z
eϕ but also chemical term
cμ, i.e., the probability being exp[−(z
eϕ +
cμ)/
kBT]. In this point, the GC theory belongs to a canonical ensemble. The extension to the inclusion of
cμ corresponds to a concept of the grand canonical ensemble.
We would like to interpret the ionic effects in terms of the above concept. The first work is to obtain stable data of DLC in the wide domain of ionic concentrations and voltage without effects of floating capacitance. A technique of avoiding floating capacitance is to use a wire electrode without unstable gaps between an electrode and an insulator [
14,
16]. Classical data at mercury electrodes are not reliable because mercury metal has not only been dispersed spontaneously to solutions in invisibly micro-droplets but also contained water up to visible volume change [
34]. Furthermore, it is important to take into account the frequency dispersion in order to determine DLC values accurately. We show here the concentration- and voltage-dependence of the DLC including frequency-dispersion obtained by ac-impedance at a platinum wire in KCl and HCl solutions. The two kinds of the dependence will demonstrate invalidity of the Stern model but support an equivalent circuit with the parallel combined capacitances. A model based on the grand canonical ensemble is presented to explain not only the two kinds of the experimental dependence but also the equivalent parallel circuit.
3. Results
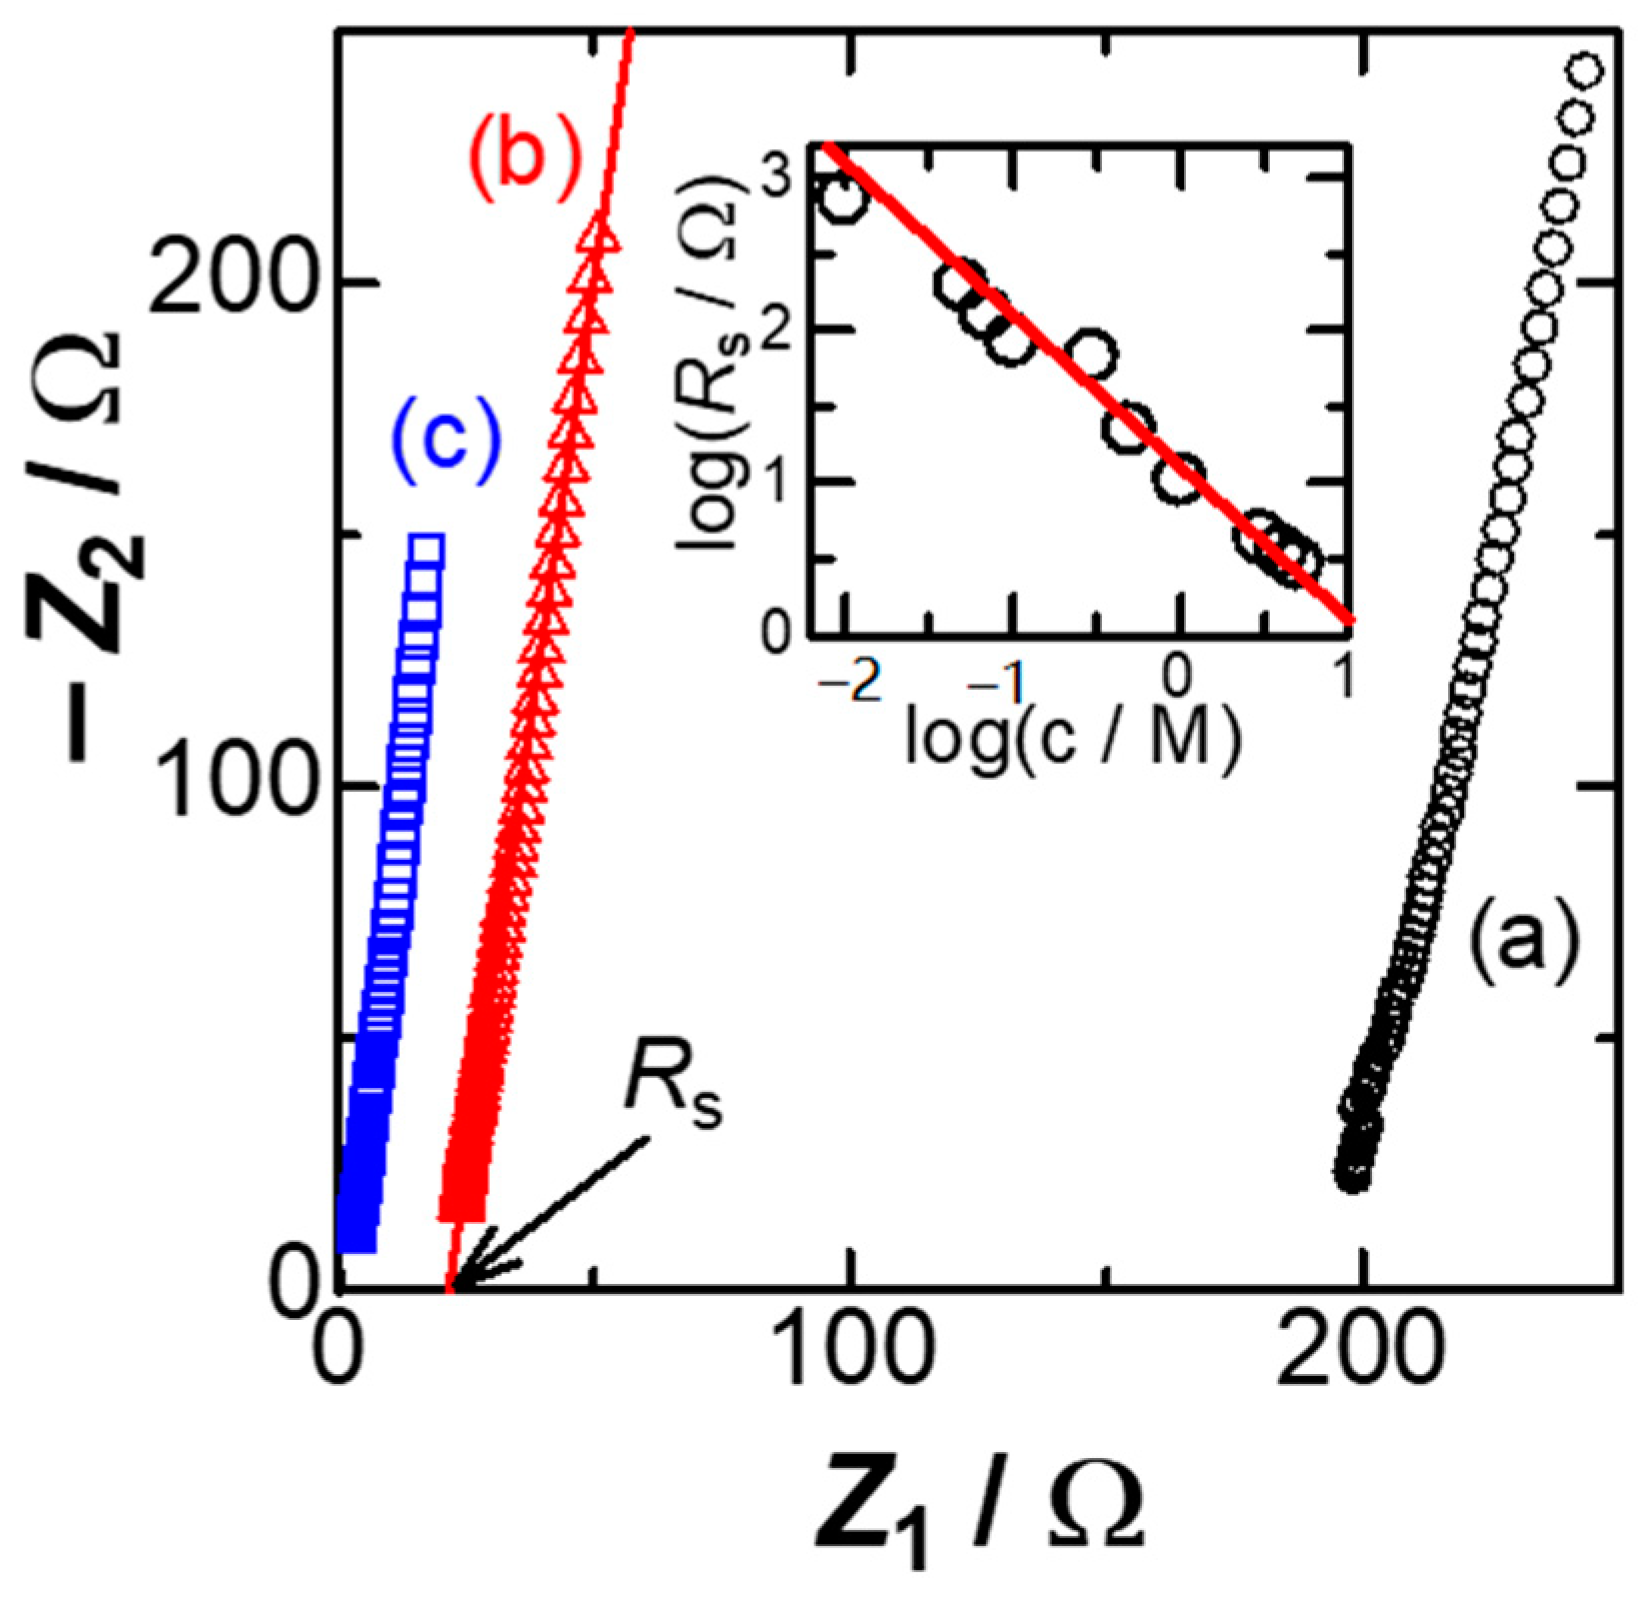
Figure 1 shows Nyquist plots, the real impedance
Z1 vs. the imaginary one,
Z2, at the Pt wire electrode in three concentrations of KCl solutions at the dc-potential,
Edc = 0.0 V vs. Ag|AgCl. All the plots fell on each line, of which a slope of more than 5 represents frequency-dispersion. A value on the
Z1 axis extrapolated to zero of
Z2 is the solution resistance,
Rs. Logarithmic plot of
Rs against concentration of KCl,
c, has a linear relation, as shown in the inset of
Figure 1. Although the ideal behavior of the ionic conduction is ∂(log
Rs)/∂(log
c) = −1, the local slopes at lower concentrations were slightly smaller than −1. This is probably because of leakage of salt from the reference Ag|AgCl electrode to the solution [
36].
When the ac voltage of
V =
Vace
iωt is applied to the frequency-dispersive capacitance
C, the observed ac current density is determined by the time-derivative of the charge,
CV, i.e., [
16]
Since plots of the imaginary admittance against the real one for a flat electrode in simple electrolytes exhibited a line with a constant slope, 1/
λ, we have −2π
f 2(d
C/d
f)/
ωC =
λ or −
f(d
C/d
f)/
C =
λ. This is a differential equation for
C with respect to
f. A solution is
where
C1Hz is the capacitance value at
f = 1 Hz. Inserting Equation (1) into Equation (2) yields for the admittance:
The real and the imaginary admittance subtracting
Rs is given by:
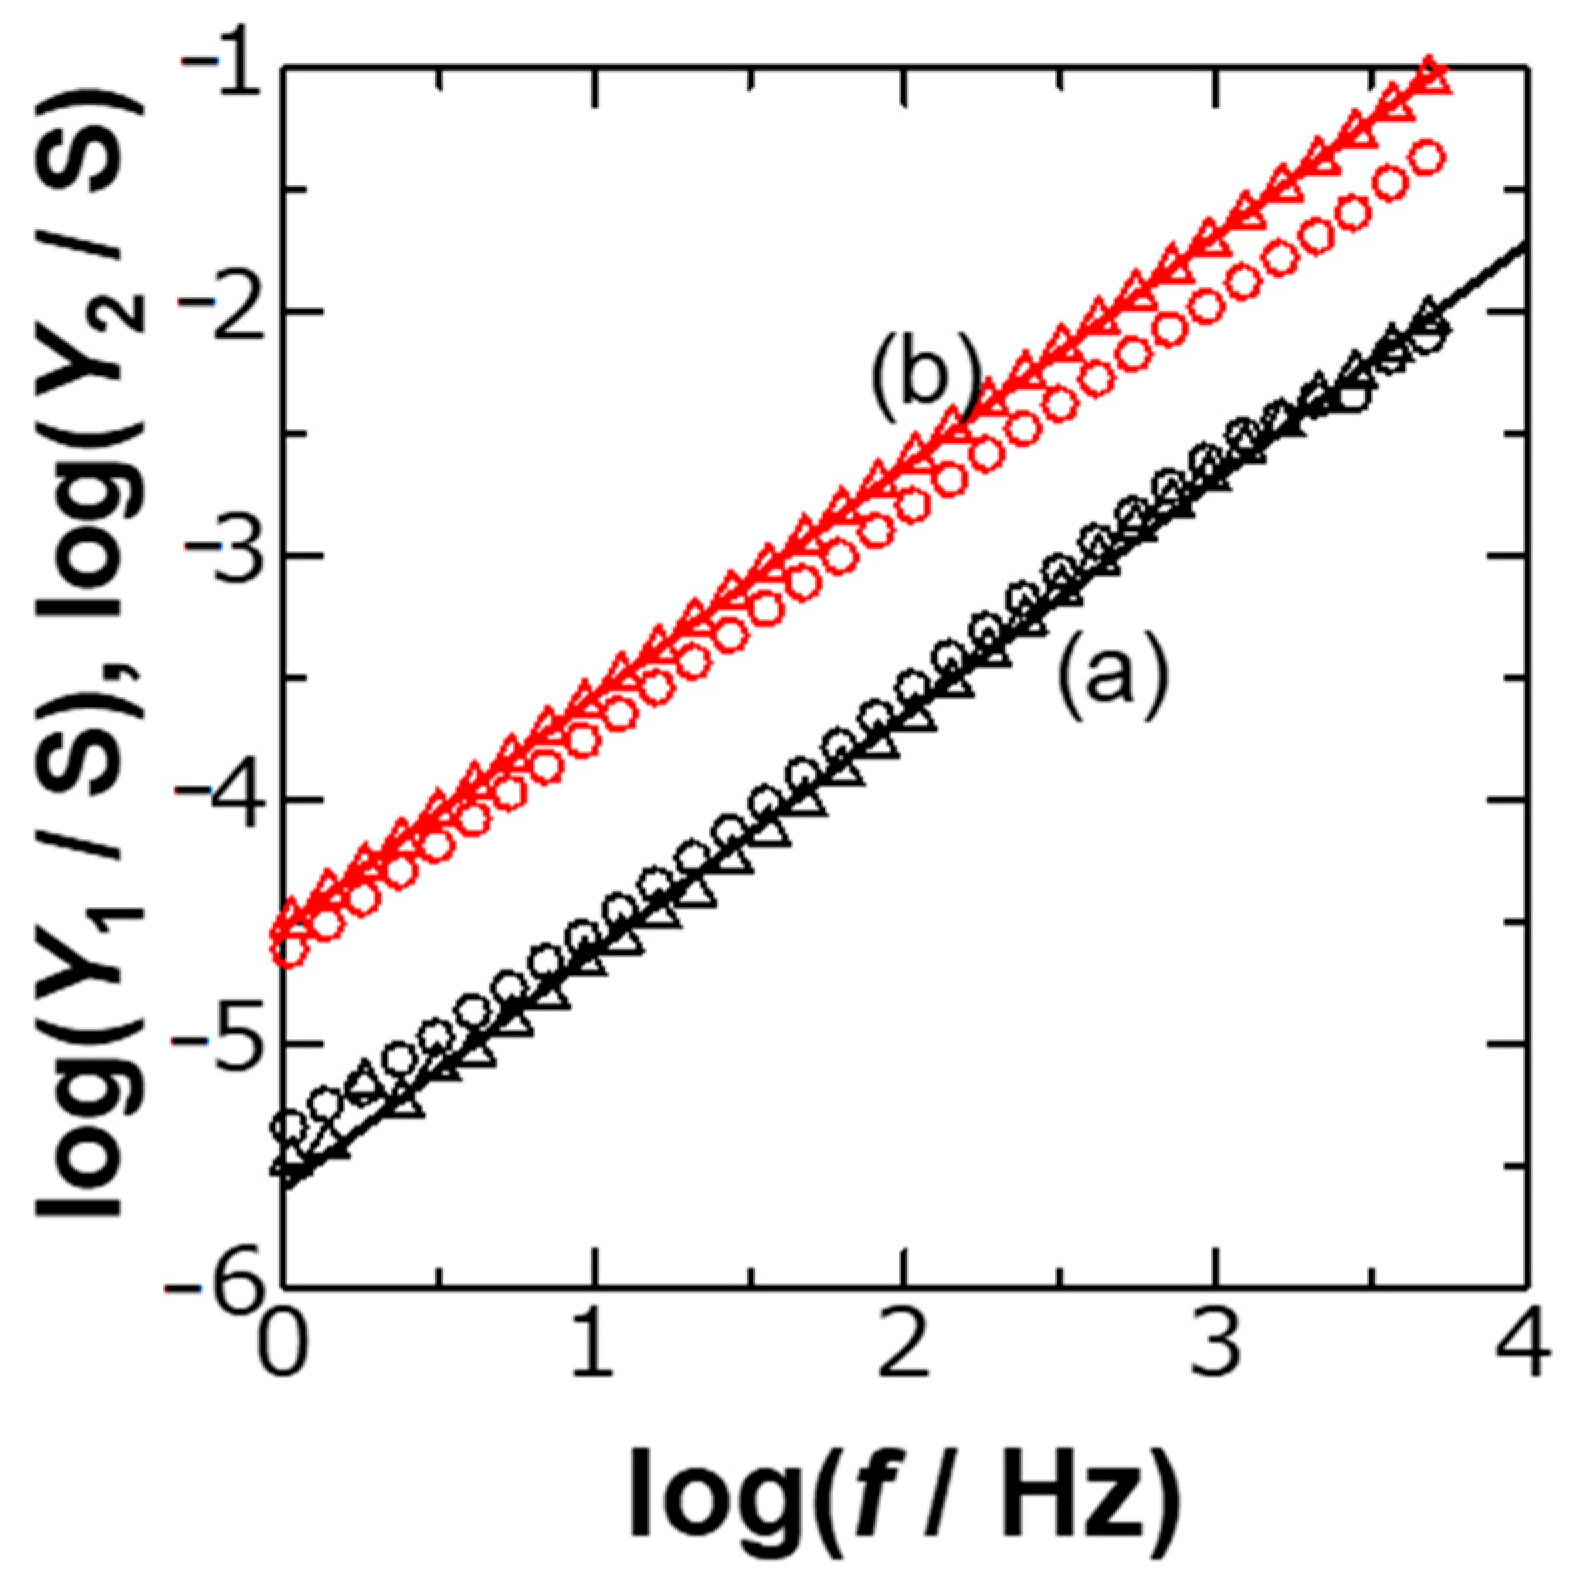
Figure 2 shows logarithmic variations of
Y1 and
Y2 with
f, calculated from experimental values of
Z1,
Z2 and
Rs, for two concentrations of KCl. The plots fell on each line, as can be predicted from Equations (2) and (3), i.e.,
The slope in the plots in
Figure 2 should be 1 −
λ, where the approximated values of
λ were 0.1. The DLC without frequency dispersion might show
λ = 0, or zero resistive component (
Y1 = 0 or
Z1 =
Rs). Non-zero values of
λ suggest the CPE behavior.
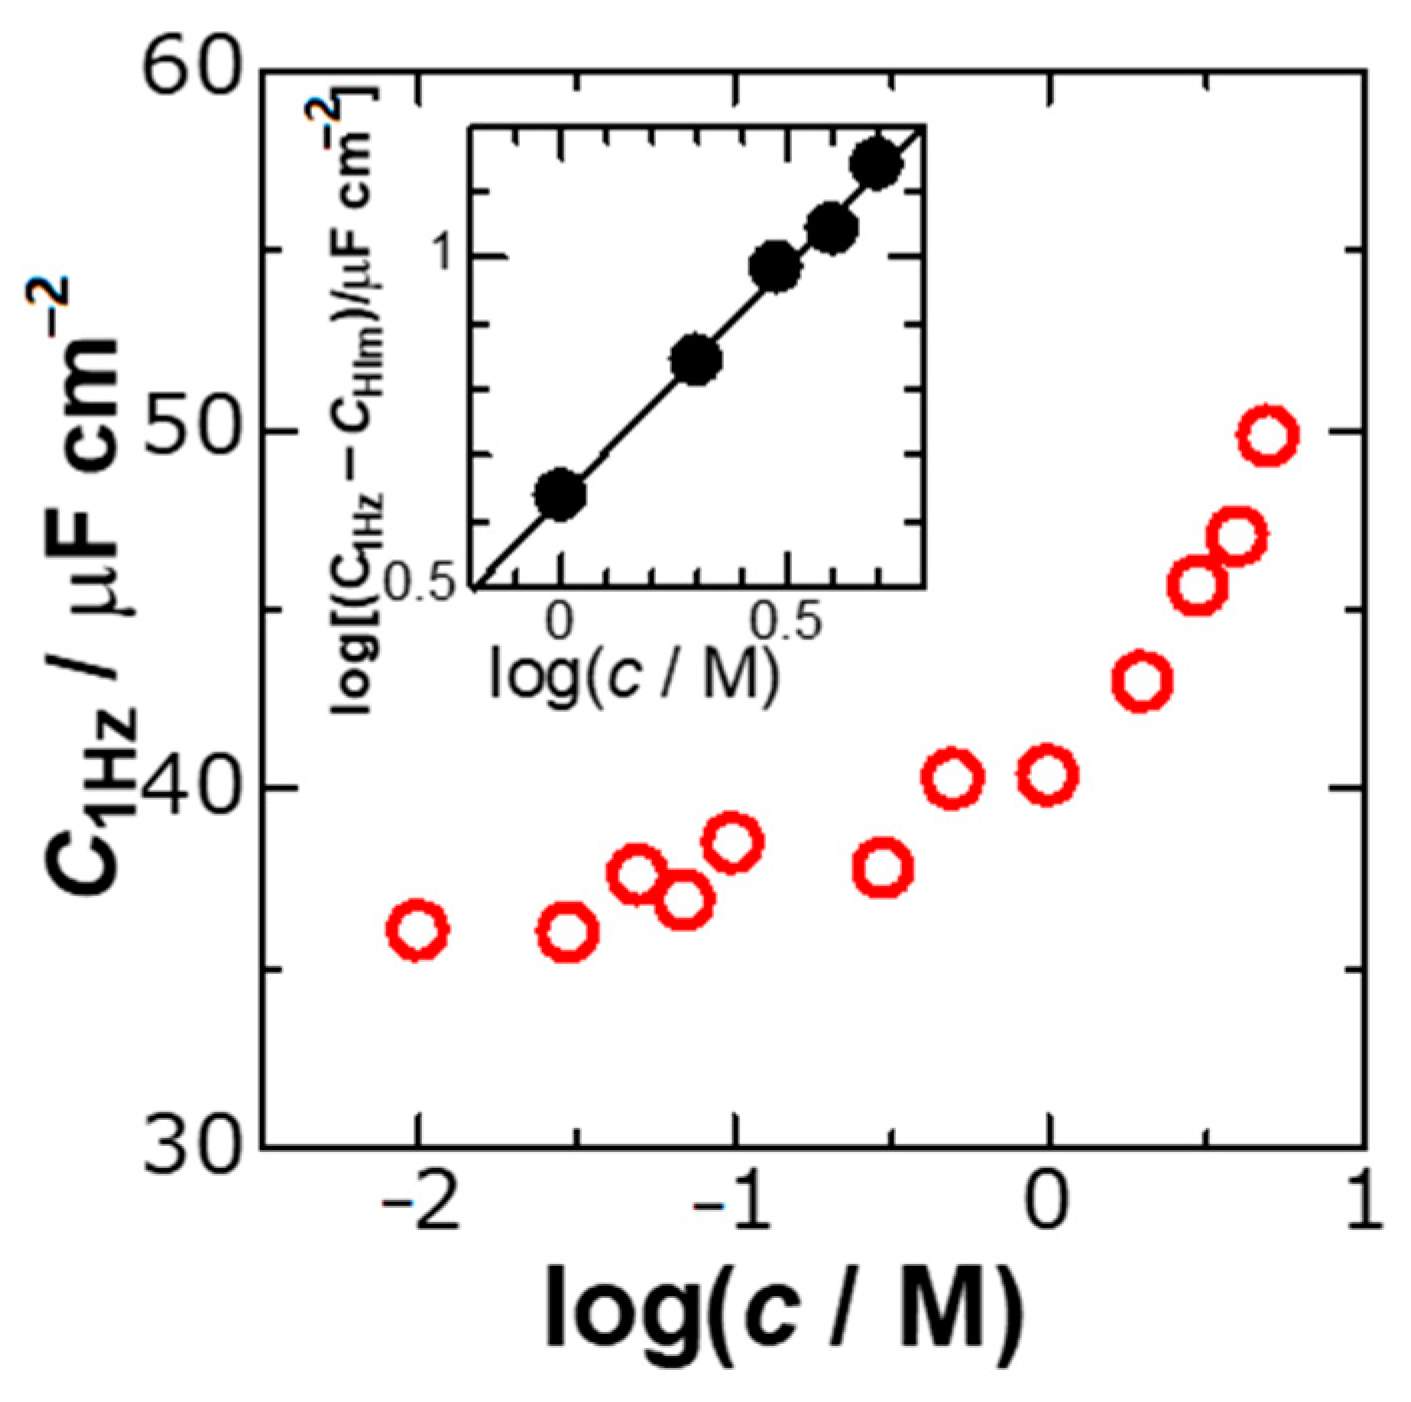
We evaluated
C1Hz from the intercepts of the lines of
Y2 in
Figure 2 at each concentration,
c, and plotted the values of
C1Hz with
c in
Figure 3. No variation of
C1Hz for
c < 0.3 M can be recognized, whereas an increase in
C1Hz for
c > 1 M is remarkable. It is the latter behavior of the ionic effect that we would like to present in this report. The difference of
C1Hz from the capacitance in the Helmholtz layer,
CHlm (=
C1Hz for
c < 0.3 M) represents the ionic contribution to
C1Hz. Logarithmic plots of
C1Hz-
CHlm against
c in the inset of
Figure 3 fell on a line with the slope of 0.70, indicating that
C1Hz should be proportional to
c0.7 rather than
c itself. This relation implies that the DLC is not formed by ionic distributions due to volume (
c-dependence) or the GC theory (
c1/2-dependence) but should be caused by localization of ions involving the two-dimensional factor (
c2/3-dependence). Our new finding is that the extracted ionic capacitance is proportional to the surface concentration (
c2/3).
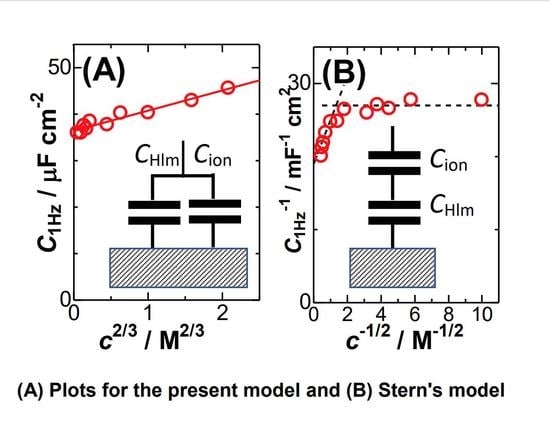
The linearity of the plots in the inset of
Figure 3 implies that the capacitance can be expressed by the sum of the
c2/3 term and
CHlm for a constant
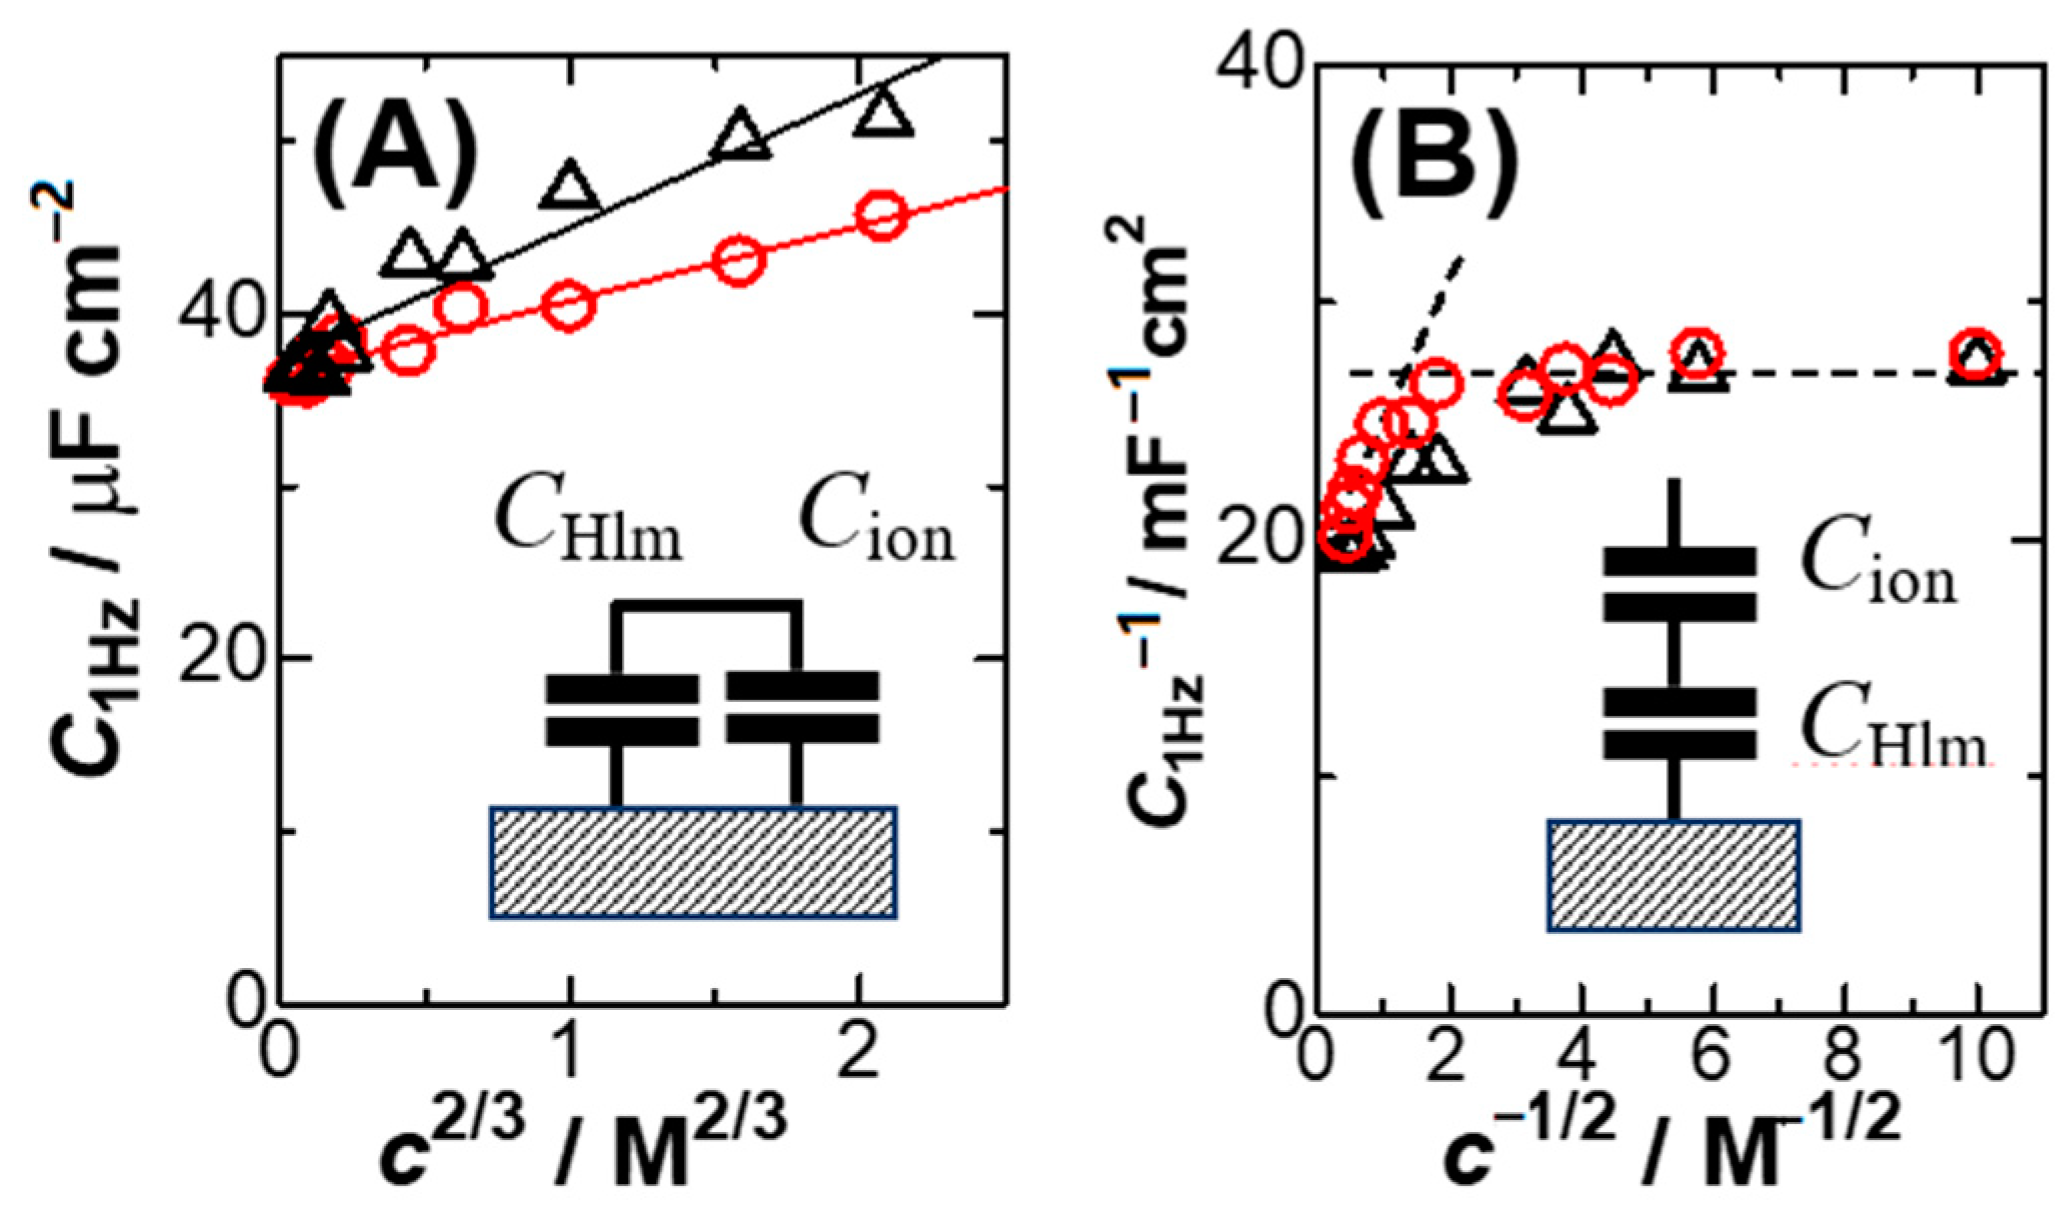
kIn order to find a quality of the linearity, we plotted
C1Hz against
c2/3 in
Figure 4A for KCl and HCl. The quality for KCl (circles) is higher than that for HCl (triangles), probably because high concentrations of HCl are less dissociated electrolytically. Concentrations of HCl determined by pH might enhance the quality. Equation (6) is inconsistent with the Stern model in that the two capacitances are combined in parallel, as shown in the inset of
Figure 4A. In order to see a level of the deviation from the Stern model (series connection)
We attempted to plot 1/
CHlm against
c−1/2 in
Figure 4B, where
k’ is a constant. The non-linear variation suggests the invalidity of the Stern model in the range from 1 mM to 5 M at platinum electrodes. The Stern model should include at least the linear relation of 1/
C with
c−1/2. However, there is no report of such plots to our knowledge.
An increase in the electric field is predicted to increase in the DLC because it activates the displacement of ions to relax the applied field. As a result, the variation of the DLC with the dc-potential,
Edc, may exhibit a V-shaped curve, like from the GC theory.
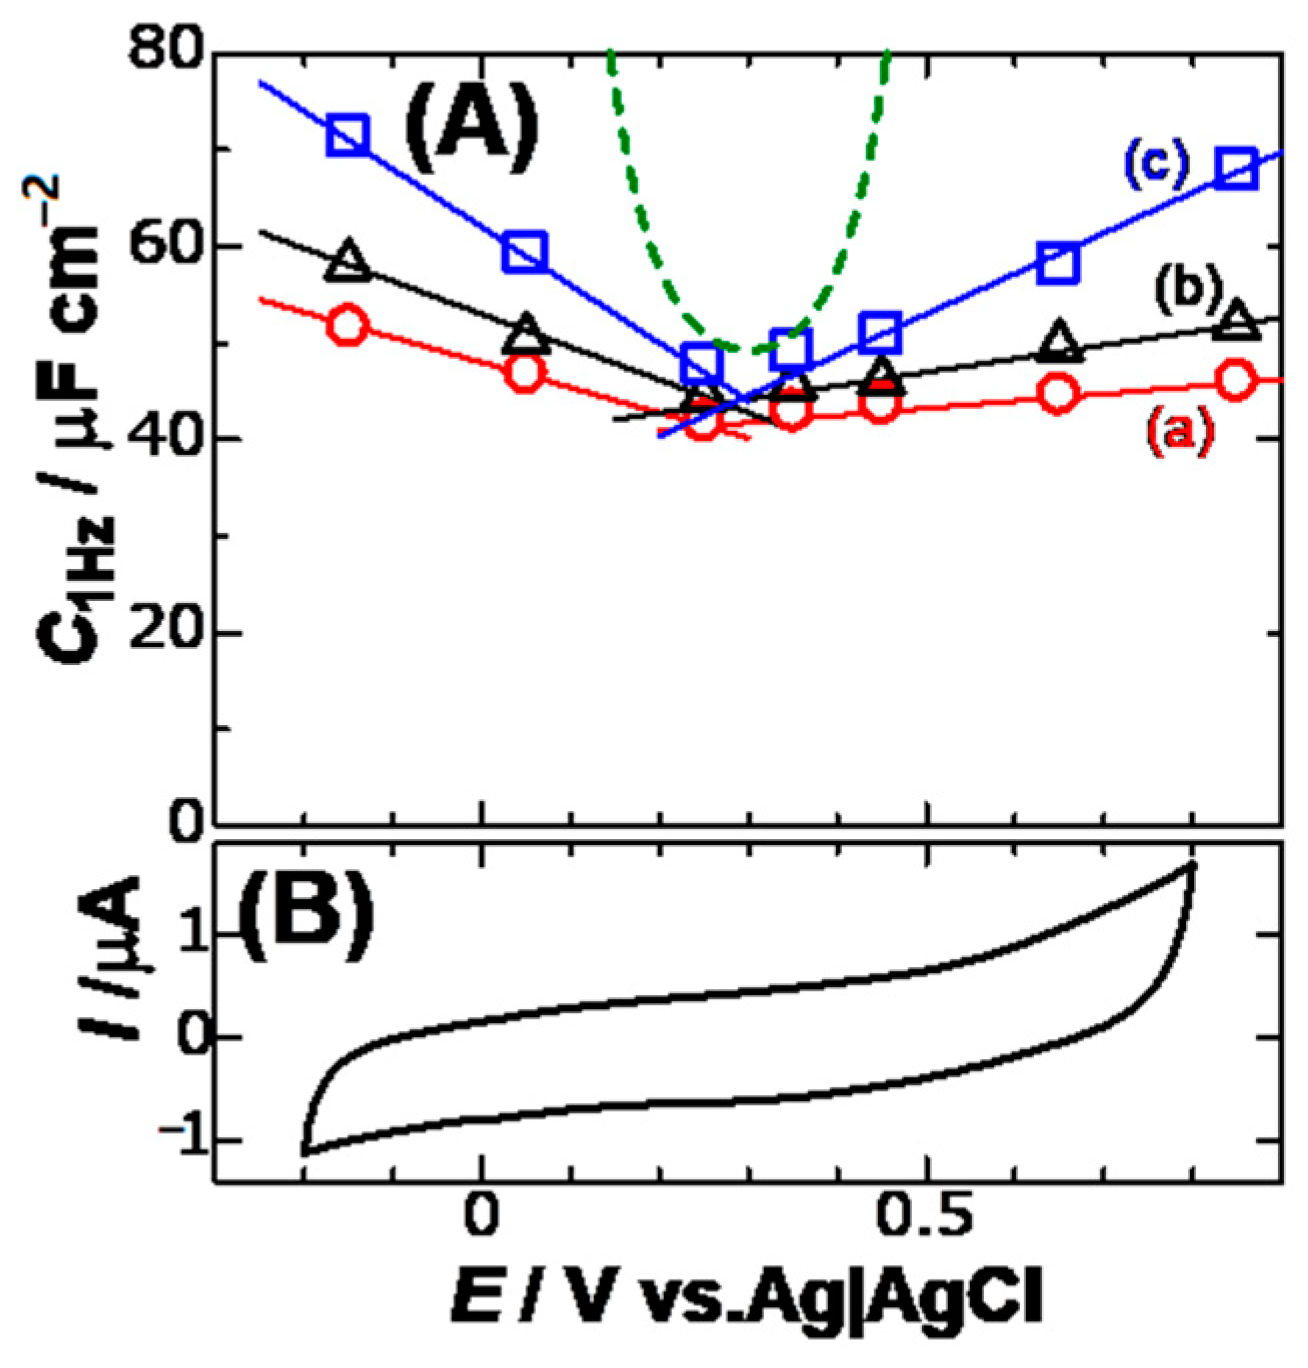
Figure 5 shows plots of
C1Hz against
Edc for three concentrations of KCl. Since cyclic voltammograms in this potential domain took a typically capacitive form, the values of
C1Hz in
Figure 5 should be capacitance without any faradaic component. A minimum of the variations is found, which is common to the concentrations. This is the pzc, of which value is ca. 0.3 V vs. Ag|AgCl. The minimum indicates that K
+ has the same interactively electric energy with the electrode as Cl
− at this potential. Variations of
C1Hz beyond the pzc were linear rather than an exponential variation. The curves (dashed curve) calculated from the GC theory through:
This is shown in
Figure 5. The experimental variation is quite different from the GC theory. The magnitude of the slopes of the lines in
Figure 5 increased linearly with an increase in the concentration. The increase suggests the attribution of the slopes to ionic effects, being our finding in this report.
The slopes in the plots of log
Y2 against log
f in
Figure 2 were invariant to salt concentrations with the standard deviation less than 0.002 of
λ. The invariance indicates that
CHlm and
Cion reveal a common value of
λ. This inspires us to imagine that the frequency-dispersion observed at the time as long as even 1 s or
f = 0.16 Hz occurs both in the Helmholtz layer and the ionic diffuse layer in a similar way. Since ions can move almost freely in the diffuse layer, the dispersion can appear naturally. The common dispersion in the Helmholtz layer means that dipoles in the layer should move or have freedom like in ions in solution. Frequency-dispersion is caused by long-term molecular interactions, which can be regarded as belonging to a cooperative phenomenon [
16]. The frequency dispersion in the Helmholtz layer occurs through solvent interactions while that in the diffuse layer occurs by ionic diffusion. The common values of
λ in spite of the difference in origins mean that two interactions are related each other.
4. Theory and Discussion
Our model of DLCs is composed of
CHlm and
Cion. The latter has been discussed on the basis of Poisson–Boltzmann’s distribution which leads to GC theory. The GC theory includes a failure in that it predicts condensed ions over finite sizes of ions [
36] in the phenomenological viewpoint. The failure in thermodynamic viewpoint results from the expression for concentrations given by the voltage (
ϕ)-driven Boltzmann’s distribution, i.e.,
c± =
k exp[−(±)
Fϕ/
RT] for a constant
k and concentrations for a cation (+) and an anion (−). The energy should not be determined only by the potential but may vary with non-electrically interactive forces. Therefore, it ought to include the chemical potential term,
cμ, where
μ is the chemical potential of the ion. The introduction of
cμ corresponds to the use of a grand canonical ensemble rather than a canonical ensemble. The term of
cμ makes the Boltzmann equation non-linear with respect to
c± to fail obtaining explicit forms of
c±. A method of circumventing the complication is to confine ions into cells so that one ion occupies a same volume as in the bulk, and to determine equilibrium distance of the ion from the electrode by the electric force under the thermal fluctuation. As a result, the extra condensation caused by the term, exp[−(±)
Fϕ/
RT], is prevented by keeping the volume constant. The equilibrium between the electric energy and the thermal energy is obtained by taking the partition function.
Cion can be determined from the average distance of an ion from the electrode. The observed capacitance is a composite of
CHlm and
Cion.
We use here mono-valent ions for the electrolyte with bulk concentration of
c. If the cations and the cations are uniformly distributed in the solution, one ion occupies the volume of 1/2
cNA for the Avogadro constant
NA. The volume is assumed to be in a cube of which side length is
L = (2
cNA)
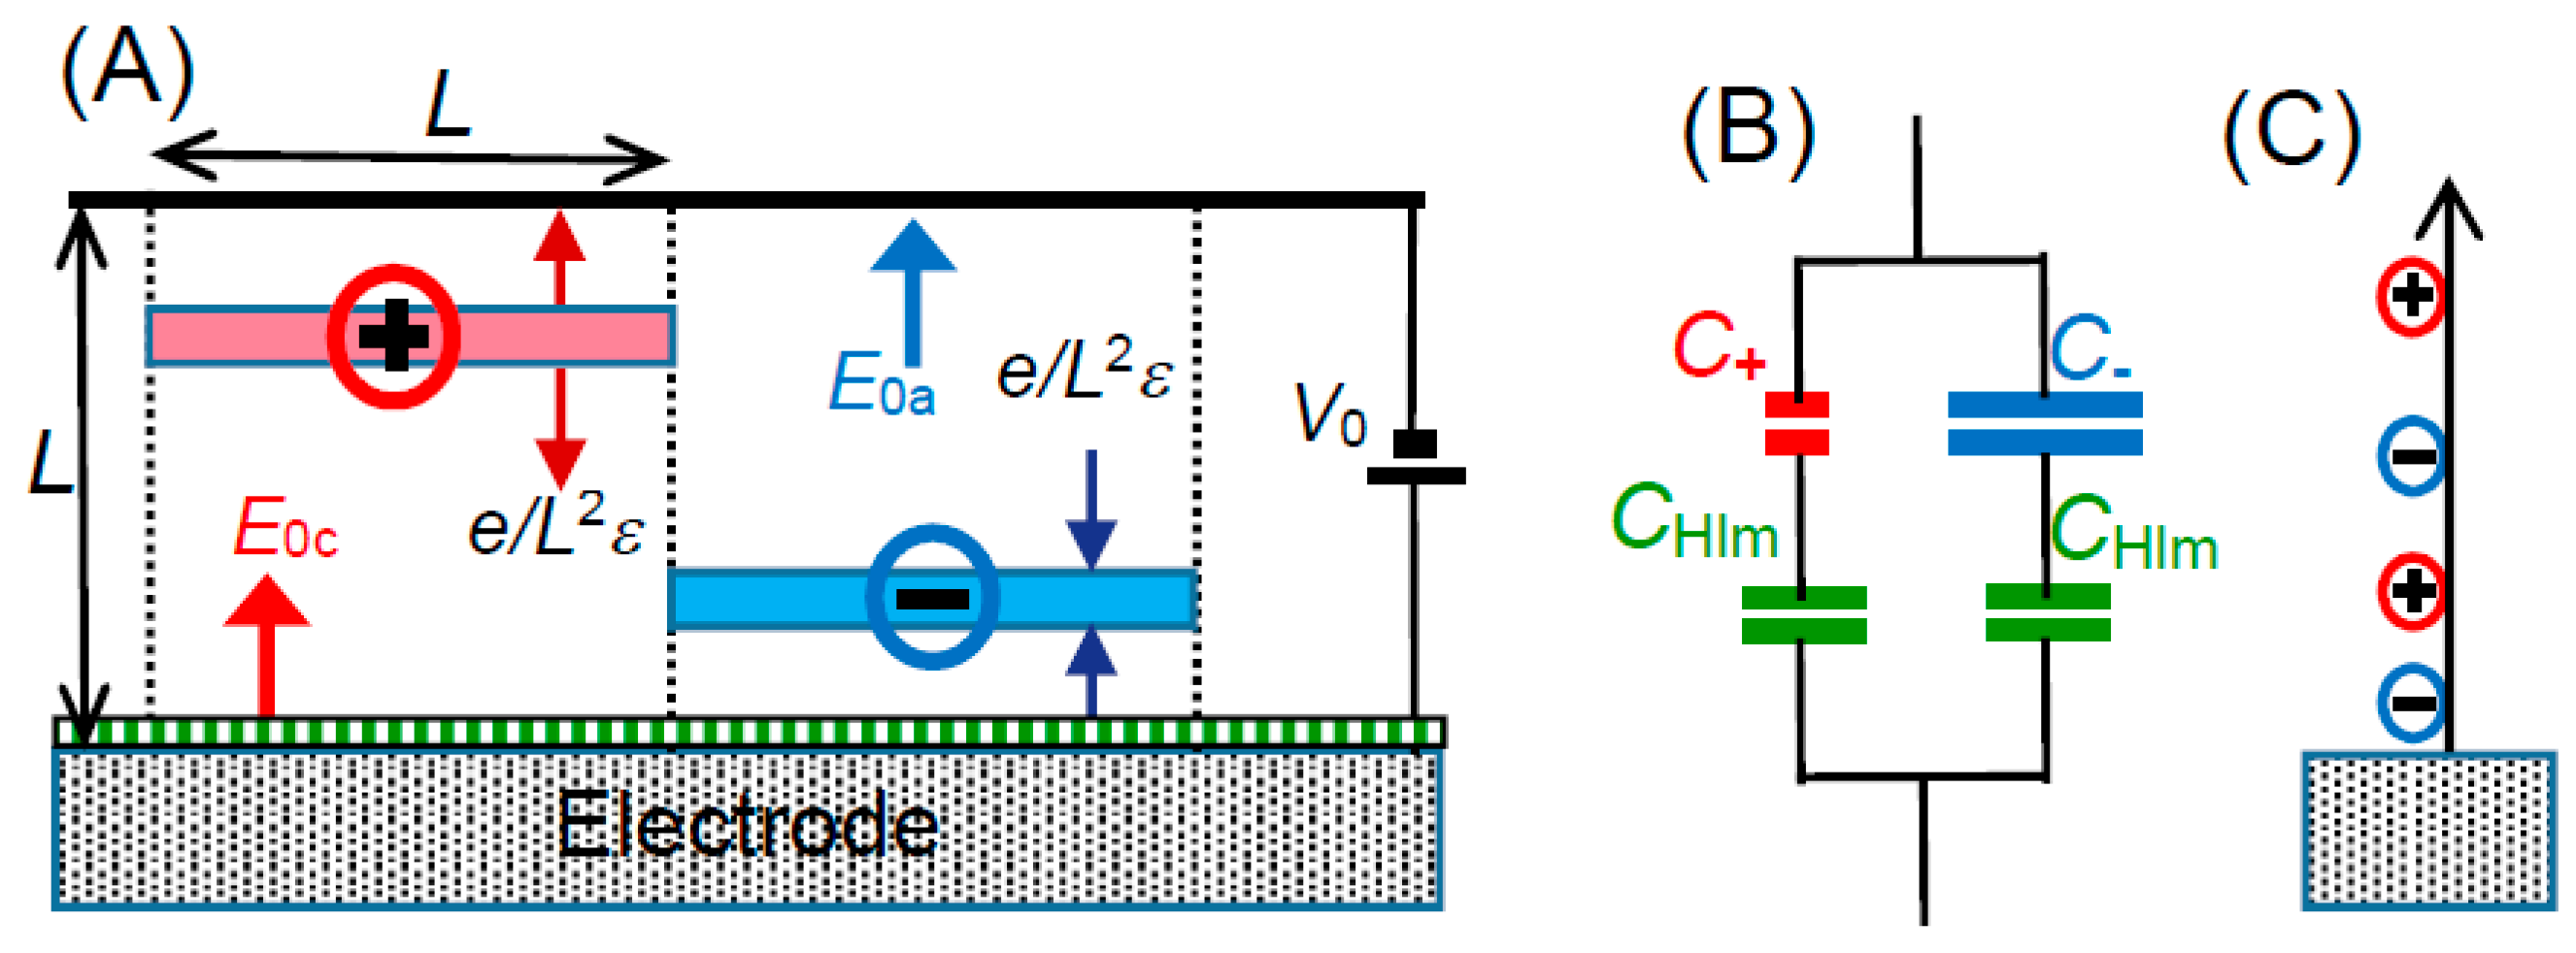
−1/3, as illustrated in
Figure 6A. A cube includes either a cation or an anion. Cubic cells with cations and anions are arranged alternately. An ion near the electrode generates electric lines starting from the ion and merging the electrode perpendicularly. The electric profiles can be evaluated by means of the technique of the mirror image [
37]. Our concern is not the local electric field but the field averaged over the square
L2 of a cell in contact with the electrode. In order to avoid the complication of profile of electric lines, a spherical ion is assumed to be a uniformly charged plate with the charge density
σ = ±
e/
L2, where
e is the elemental charge. Then, the plates generate electric fields, ±
e/
L2ε, according to the Gauss’ law, where
ε is the permittivity of the solution. We let an anion be located at a distance
xa from the electrode to which the voltage
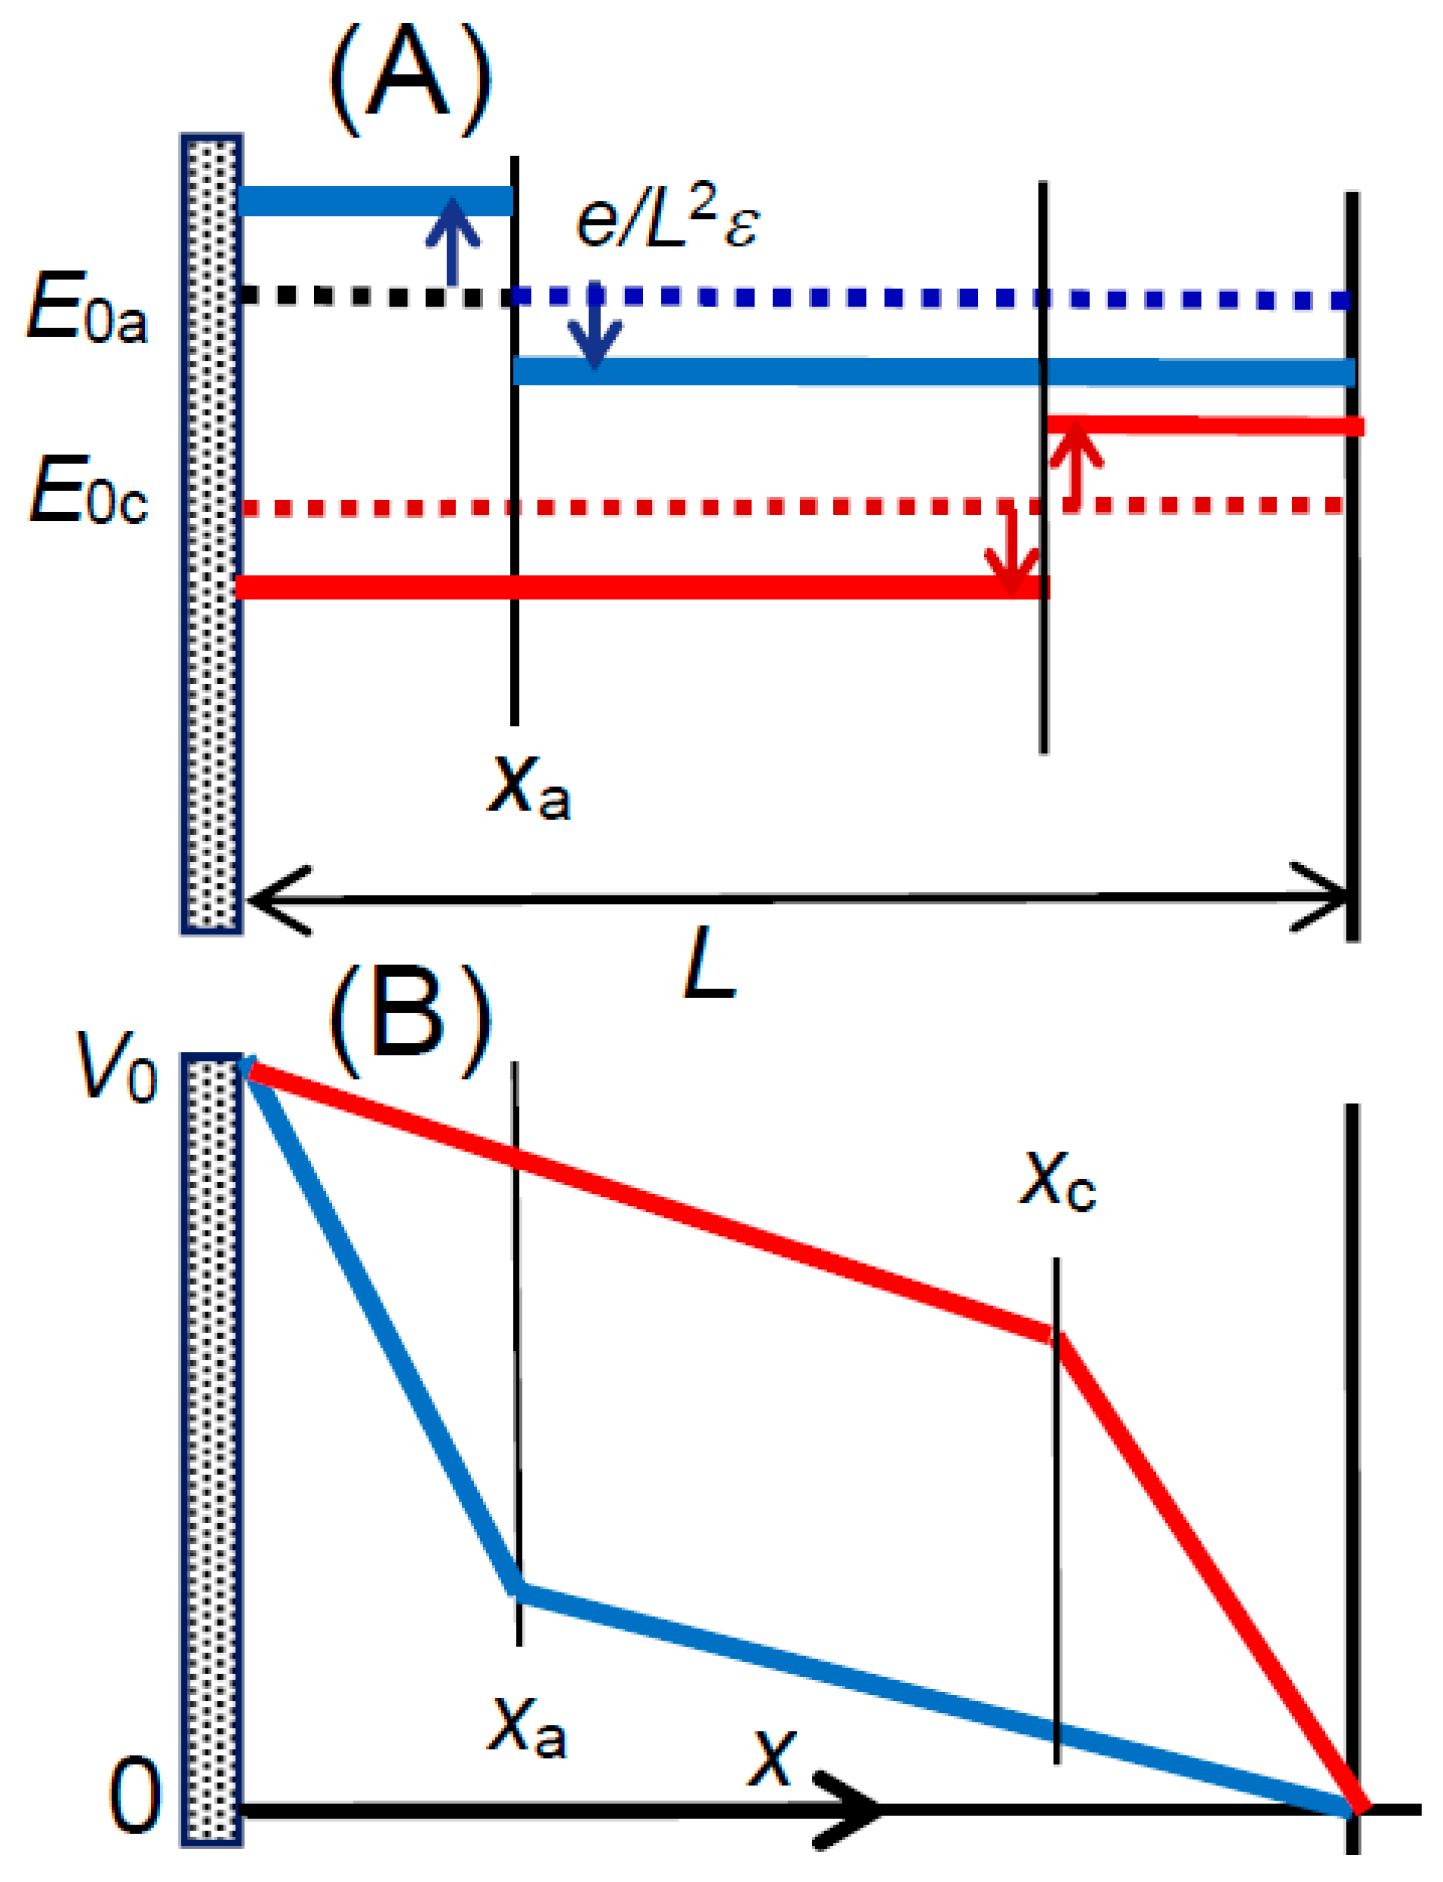
V0 is applied externally. We obtain a voltage distribution in the cell from the electric field mixed with the applied field and the anion. By letting the applied electric field be
E0a at
xa, the combined field,
Ea, is given by the addition of
E0a by ±
e/
L2, depending on the location of the anion,
xa, so that:
as shown in
Figure 6A and
Figure 7A. The voltage,
Va, at the anodic cell is given by the integration of −
Ea with respect to
x. Under the condition of continuity at
xa, eliminating
E0a from the expressions for
Va of the anion yields:
of which variations are illustrated in
Figure 7B. Our concern lies in
Va(
xa), i.e.,
A typical value of e/Lε is 0.25 V for the relative permittivity εr = 78 (dielectric constant of water) and c = 1 mol dm−3 or L = 9.4 nm. The voltage distribution in Equation (13) represents a composite energy of eV0 + cμ/NA by means of confining ions to a given cell. Therefore, the term of eVa(xa) is regarded as the reduced energy for a grand canonical ensemble of eV0 + cμ/NA.
We determine
xa by balance of the electric energy
eVa(
xa) with the thermal energy with the help of the canonical ensemble. The probability of the anion at
x is expressed by exp[−(−
e)
Va(
xa)/
kBT] for the Boltzmann constant,
kB. Since values of
xa can vary from 0 to
L, the partition function is given by:
where
Λ =
V0Lε/2
e,
Φ =
eV0/
kBT and
z =
xa/
L. The averaged location of the anion is given by
The definition of a capacitance for the anion,
Ca =
σ/
Va, to which Gauss’ law is applied to yield
Ca =
ε/
d, where
d is the distance between the charged plate and a location supplying the voltage
Va. Since there are two distances, from 0 to
xa and from
xa to
L, in series,
Ca is given by:
The substitution of
e for −
e, or change of signs of
Λ and
Φ, yields
Zc and
. The symmetric profiles of the electric fields at the anionic cell and the cationic one imply
=
L −
, which can derive
Cc to the same form as
Ca. Since the capacitance caused by ions is the sum of
Ca and
Cc, i.e.,
The values of
/
L were computed from Equations (14) and (15) for given values of
V0,
ε,
c at 25 °C by means of numerical computation of the integrals. Although
Za can be represented by a sum of error functions with complicated forms, the computation of the integral form is easier than that of the error functions.
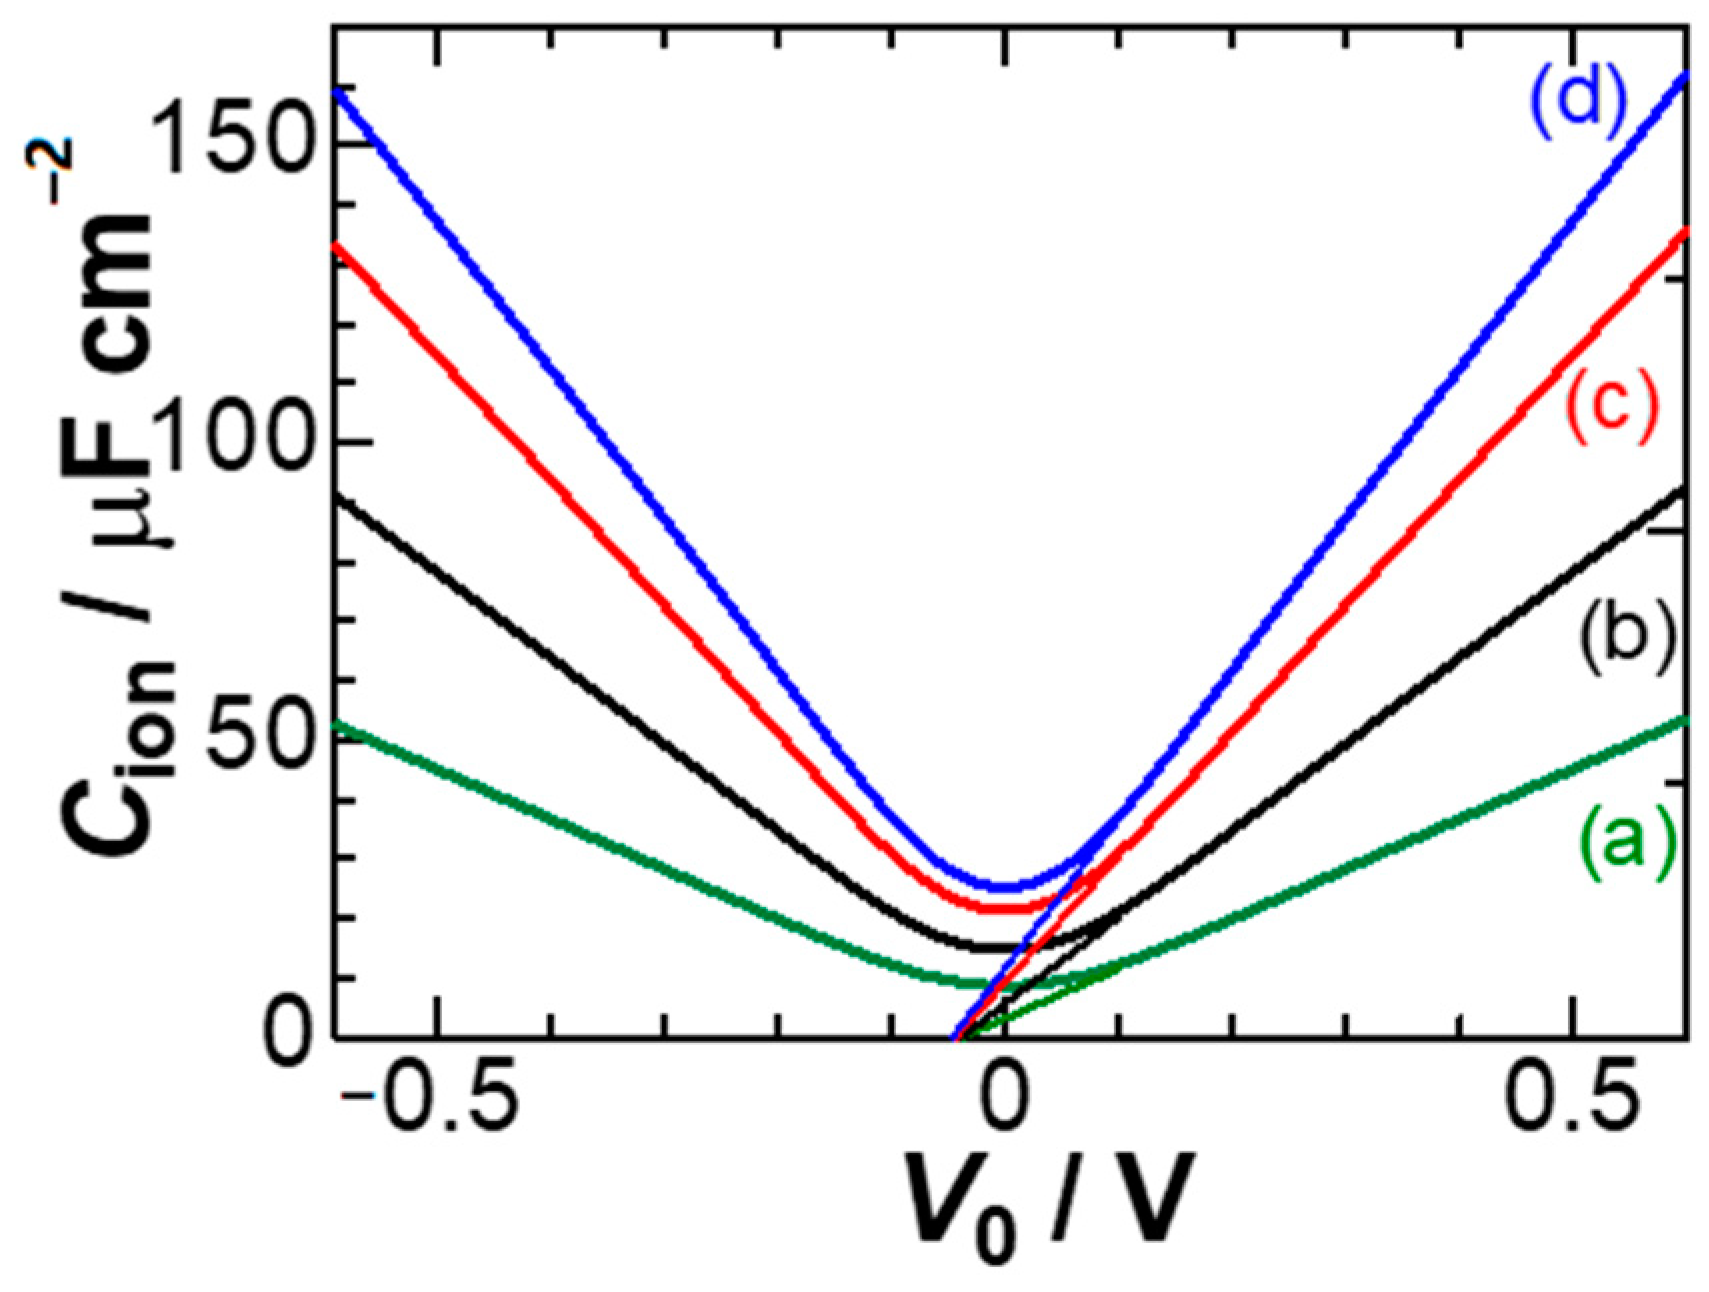
Figure 8 shows dependence of
Cion on
V0 for some ionic concentrations. A feature of the curves is the linear variation in
Cion, which is in contrast to the exponential variation of the GC theory. We try to find an expression for
Cion at large values of
V0. A large value of
V0 makes 1 −
z/
Λ approximated to 1 in Equations (14) and (15). As a result,
Za and (
xa)
av are reduced to:
Combining the two yields
/
L ≈ −1/(e
Φ − 1) + 1/
Φ ≈ 1/
Φ. Consequently, we have for large values of
V0:
Therefore, Cion for large V0 is linear to V0. The slope is inversely proportional to L or proportional to c1/3. Equation (15) means the location of the anion averaged over 0 to L, which provides the anionic capacitance. The observed capacitance is the sum of the anionic capacitance and the cationic one. If the voltage is estimated from the differential capacitance through dV/dσ for the surface charge density σ, it is actually a mean-field voltage in the context of the derivation of the capacitance.
The equivalent circuit in
Figure 6B includes basically two types of Stern model, being a series capacitance of
CHlm and
Ca, and a series one of
CHlm and
Cc. The composite capacitances are
CHlmCa/(
CHlm +
Ca) and
CHlmCc/(
CHlm +
Cc). Since they take a parallel combination, the further composite capacitance to be observed is given by:
When salt concentrations are so high positively that (
)
av < (
)
av like the image in
Figure 6A, we can estimate the relation,
Ca <
CHlm <
Cc. Applying this relation to Equation (19) under the extreme condition, we can rewrite Equation (19) approximately as:
This means that the observed capacitance can be approximated as a sum of the DLC by solvent dipoles and the one of capacitances either by the anion or the cation. As a result, the capacitance behaves as if it might take a parallel combination of
CHlm and either ionic capacitance (
Cc or
Ca). This explains the result in
Figure 4.
It is interesting to consider the reason why the Stern model deviates from experimental data although it looks reasonable in the concept. The GC equation supporting the Stern model has combined the one-dimensional Poisson’s equation with Boltzmann’s equation so that ions driven both by applied electric field and electric force among inter-ions are dispersed by thermal fluctuation. An anion is attracted for a positive potential toward the electrode, the one-dimensional of the GC theory predicts that the anion attracts a cation until the balance of the repulsion by the applied electric field, as in
Figure 6C. As a result, both anions and cations would be concentrated to the electrode over finite size of ions. This unreasonable prediction can be avoided by the one-dimensional electric force to anions and by keeping equilibrium distance in the layers parallel to the electrode, as in
Figure 6A. Mathematically, the three-dimensional distribution provides the volume of an anion to be
xaL2, while the GC theory gives
xa3.
The calculated values of
C1Hz in
Figure 8 are five times larger than the experimental ones in
Figure 5A. This may be selection of
εr (=
ε/
ε0) as the bulk value (78) in water. Since water molecules are partially structured with electric field, values of
εr should be smaller than in the bulk. For example, reasonable values of
εr are close to 6 in the Helmholtz layers [
18,
38,
39], which has been demonstrated to be the field effect [
40].
The slopes of lines in
Figure 5A for
Edc <
Epzc are larger than those for
Edc >
Epzc in magnitude. This asymmetry cannot be explained in terms of difference in ionic molar conductivity because of similar values of both K
+ and Cl
− but may be related with difference of
εr in the K
+-driven cell and the Cl
−-driven one.
Our model is to make the field effect on ions only in the direction normal to the electrode and to keep the ionic concentration in planes parallel to the electrode. It corresponds to size effects of ions by occupying ions to give lattice sizes [
41], by taking into account the orientational ordering of water dipoles [
42], by introducing interaction between the field and hydrostatic pressure [
43], and by using molecular dynamics to predict detailed ionic distribution near the point of zero charge [
44].
