Article

Investigation of the Applicability of Helium-Based Cooling System for Li-Ion Batteries

by
Mohammad Alipour
1,*,
Aliakbar Hassanpouryouzband
2,* and
Riza Kizilel
1,*
1
Tüpraş Energy Center, Koç University, Rumelifeneri Yolu, Sarıyer 34450, Istanbul, Turkey
2
Grant Institute, University of Edinburgh, West Main Road, Edinburgh EH9 3JW, UK
*
Authors to whom correspondence should be addressed.
Electrochem 2021, 2(1), 135-148; https://doi.org/10.3390/electrochem2010011
Submission received: 28 January 2021 / Revised: 2 March 2021 / Accepted: 3 March 2021 / Published: 8 March 2021
(This article belongs to the Collection Feature Papers in Electrochemistry)

Abstract

:
This paper proposes a novel He-based cooling system for the Li-ion batteries (LIBs) used in electric vehicles (EVs) and hybrid electric vehicles (HEVs). The proposed system offers a novel alternative battery thermal management system with promising properties in terms of safety, simplicity, and efficiency. A 3D multilayer coupled electrochemical-thermal model is used to simulate the thermal behavior of the 20 Ah LiFePO4 (LFP) cells. Based on the results, He gas, compared to air, effectively diminishes the maximum temperature rise and temperature gradient on the cell surface and offers a viable option for the thermal management of Li-ion batteries. For instance, in comparison with air, He gas offers 1.18 and 2.29 °C better cooling at flow rates of 2.5 and 7.5 L/min, respectively. The cooling design is optimized in terms of the battery’s temperature uniformity and the battery’s maximum temperature. In this regard, the effects of various parameters such as inlet diameter, flow direction, and inlet flow rate are investigated. The inlet flow rate has a more evident influence on the cooling efficiency than inlet/outlet diameter and flow direction. The possibility of using helium as a cooling fluid is shown to open new doors in the subject matter of an effective battery thermal management system.

1. Introduction

The environmental issues associated with fossil fuels necessitate the use of alternative renewable sources of energy. Lithium-ion batteries (LIBs) as rechargeable devices play a crucial role in electrochemical energy storage systems [1,2]. The application areas are increasing for LIB technology demanding high energy and power densities. Particularly in electric vehicles (EVs), their widespread applications attract much attention [3,4]. However, these batteries suffer from safety problems, cost, and thermal issues [5,6,7,8,9,10]. Batteries operating at high ambient temperatures or high current rates need to be cooled down. Similarly, batteries running at low temperatures need to be heated to start and maintain sufficient power output [11,12]. Therefore, the temperature of the battery pack needs to be controlled and kept within an optimum range. Besides the absolute temperature of the battery pack, the temperature non-uniformity between the cells causes serious problems such as electric unbalances and capacity fading. Therefore, a battery thermal management system (BTMS) must be considered for high capacity battery packs and modules to ensure safety and improve the performance [13,14,15,16,17].
Thermal management systems could be categorized as passive or active systems. In the passive system, only the ambient environment is used. However, in the active system, a built-in source provides heating or cooling according to the operation condition [18]. Choosing a proper cooling method is essential for increasing safety, extending the battery life and reducing costs [19]. As a BTMS, air, liquid, phase change material (PCM), or any combinations can be used. Despite a very promising thermal management performance of PCM, limited phase change latent heat, thermal conductivity, and durability of PCM make them insufficient BTMS in extreme conditions [11,20]. In liquid-based thermal management systems, the cooling medium can be in direct contact with the batteries, whereas the more common use is in systems where the liquid is circulated around the battery cell or the battery pack in a closed system (in a tube or jacket) [11,18].
In the case of a direct liquid cooling, dielectric fluids such as mineral oils are required to avoid short circuit risks. However, in non-direct thermal management systems, water, glycol, water-glycol combinations, ethylene glycol or refrigerants are used where the cooling medium is held in a tube or jacket. As direct systems require additional systems to control the dielectric fluids to be used, they increase production costs and bring thermal management systems in a complicated condition.
In non-direct systems, the use of liquids with lower viscosity and thermal conductivity than those used in direct systems is possible, but the efficiency of the thermal management system decreases considerably since the liquid and battery unit do not come into direct contact [11]. The most commonly used thermal management systems are systems where gas is used, as the control is much easier than liquid used in thermal management systems. Although it is possible to use refrigerant gases in these systems, mainly air is preferred [9,21,22,23,24]. However, air-based BTMS suffer from the low thermal conductivity of air. Therefore, using another alternative gas-based BTMS with a higher thermal conductivity than air could be promising. The thermal conductivity of He gas is six times more than air at 300 K [25]. Furthermore, compared to other cooling mediums (i.e., water, oil, glycol, PCM, and air), He is the lightest cooling medium, which can reduce the overall weight of BTMS. The inert nature of the He gas is another advantage of this heat transfer medium over others considering the safety issues. If any of the cells are damaged, lithium battery components will not react with the He gas since it is non-flammable. Moreover, the battery packs in the designed system will be retained in fully enclosed chambers, therefore, battery components will not come into contact with air and moisture if thermal runaway happens. Helium is a preferred material for cooling long-term superconducting magnets and fusion reactors, but to the best of our knowledge, there is no example of using helium in EVs as a cooling fluid [26,27,28,29,30].
In this study, a new gas-based BTMS is introduced using helium gas as a cooling medium, which has higher thermal conductivity, higher heat capacity, lower density, and also provides better safety in regards to air. A 3D multilayer cell model is used to test the cooling efficiency of the developed gas-based cooling system. Experimental data are used to validate the model first. Then the cooling performance of the He gas is evaluated and compared with air. The He gas showed very promising results in terms of reducing the maximum temperature rise and temperature gradient on the surface. To further optimize the cooling performance, the effects of design parameters such as inlet/outlet diameter, inlet flow rate, and flow direction are investigated. The novel He-based BTMS is believed to attract significant attention with the promising results obtained by the experimental measurements and the model.

2. Experimental Procedure

Commercially available pouch-type 20 Ah LiFePO4 cells (227 × 160 × 7.2 mm) were used for thermal and electrochemical tests in this work. Electrochemical tests include a constant current-constant voltage (CCCV) charging step followed by rest and constant current discharge at constant ambient temperature. The cells were charged in galvanostatic mode at 1C with a voltage cut-off limit of 3.65 V and then in a potentiostatic mode until the current dropped to 100 mA. The cells were then kept at rest until the surface temperature reached ambient temperature. Finally, the cells were discharged at the desired rate (1C–3C) until the voltage dropped to 2.2 V. The Neware CT-4004-20V30A-NFA battery testing system was used for cycling the battery cell. VT model N type thermocouples were placed at three different points on the cell surface to monitor the variation of the surface temperature at different parts (Figure 1). All experiments were conducted in a KK 240 TOP + FIT model POL-EKO APARATURA thermal chamber to keep the ambient temperature constant. An acrylic plastic box with outer dimensions of 310 × 200 × 40 mm was used as a cooling chamber. A gas inlet and outlet with a diameter of 1/8 inch were placed at the two opposite faces of the box. A pressure gauge is used to test the gas leak in the cooling box and also to monitor the gas pressure (Figure 1).

3. Model Development

3.1. Governing Equations

The model includes the mathematical equations used for both the battery and the cooling system. These equations were developed based on the fundamentals of thermodynamics and transport phenomena. It comprises the porous electrode theory, Ohm’s law, mass transfer in the solid and electrolyte phase, and concentrated solution theory for spherical active material particles. The 3D thermal model is based on energy balance equations derived from principles of nonequilibrium thermodynamics. Finally, the electrochemical model is integrated with the thermal model to simulate the battery behavior.
The governing equations and boundary conditions used in the coupled electrochemical-thermal model as well as kinetic, transport, and thermal properties are reported in literature and our previous work [31,32,33,34].
To model the cooling system, the equations describing the fluid flow and heat transfer in the cooling medium are included. These equations consist of the conservation of mass, momentum, and energy described by the continuity equation, the Navier–Stokes equations. The equation of mass conservation is given by Equation (1).
ρ f t + . ρ f v = 0
Assuming that Δ ρ f ρ f 1 (incompressible gas under moderate temperature and pressure variations), the mass conservation equation can be modified as below:
. v = 0
The momentum conservation equation is expressed as:
t ρ f v + . ρ f v v = p +   .   τ + F
For Newtonian fluids, the viscous stress is proportional to the deviatoric stress tensor:
τ =   μ   ( v + v T ) 2 3 μ I ( . v )
No slip boundary condition is considered at all walls where the cooling fluid is contacting the battery and the box. The boundary conditions in gas inlet and outlet are defined as Equations (5) and (6), respectively:
ρ f ρ s t ( v . n ) d S = Q s v
where ρ s t =   M n V m
[ p I + μ ( v + v T ) ] n = p 0 n
The energy conversion equations for the cooling fluid is expressed as:
ρ f c p , f t T f + ρ f c p , f v . T f   +   . q =   Q p + Q v d +   Q
where q , Q p , Q v d , and Q are the conductive heat flux vector, pressure work, viscose dissipation, and internal heat source, respectively. The heat sources are expressed in terms of the following equations:
q = k f T f
Q p =   β T f p t + v . p
Q v d =   τ   :   v
Q = 0
For ideal gases, the term β T f is equal to unity. Therefore, the final form of Equation (7) becomes as follows:
ρ f c p , f t T f + ρ f c p , f v . T f =   . ( k f T f ) + p t + v . p + τ   :   v
Finally, the energy conversion equation for the box is expressed as:
t ρ b c b T b = . k b T b +   Q
Convective heat dissipation on the box outer boundaries is also considered and defined as:
n   .   q = h   T e x t T b

3.2. Numerical 3D Modeling

The numerical model is developed using a finite element software, COMSOL. It couples a 1D electrochemical module with 3D heat transfer and laminar flow modules for analyzing electrochemical-thermal behavior of the LFP cell under cooling conditions. A laminar model is applied since the Reynolds number was below 2300 in this study. All the electrochemical, thermal, and fluid dynamics equations are solved numerically using COMSOL. The equations are coupled as shown in Figure 2. The 1D electrochemical module calculates the heat generation rates including reversible, irreversible, and ohmic heat rates. At the same time, the 3D laminar flow module provides the absolute pressure and velocity field to the 3D heat transfer module. Using the provided information, the 3D thermal solver finds the temperature field in the battery cell and sends back the average temperature to the 1D electrochemical solver to update temperature-dependent physiochemical properties.
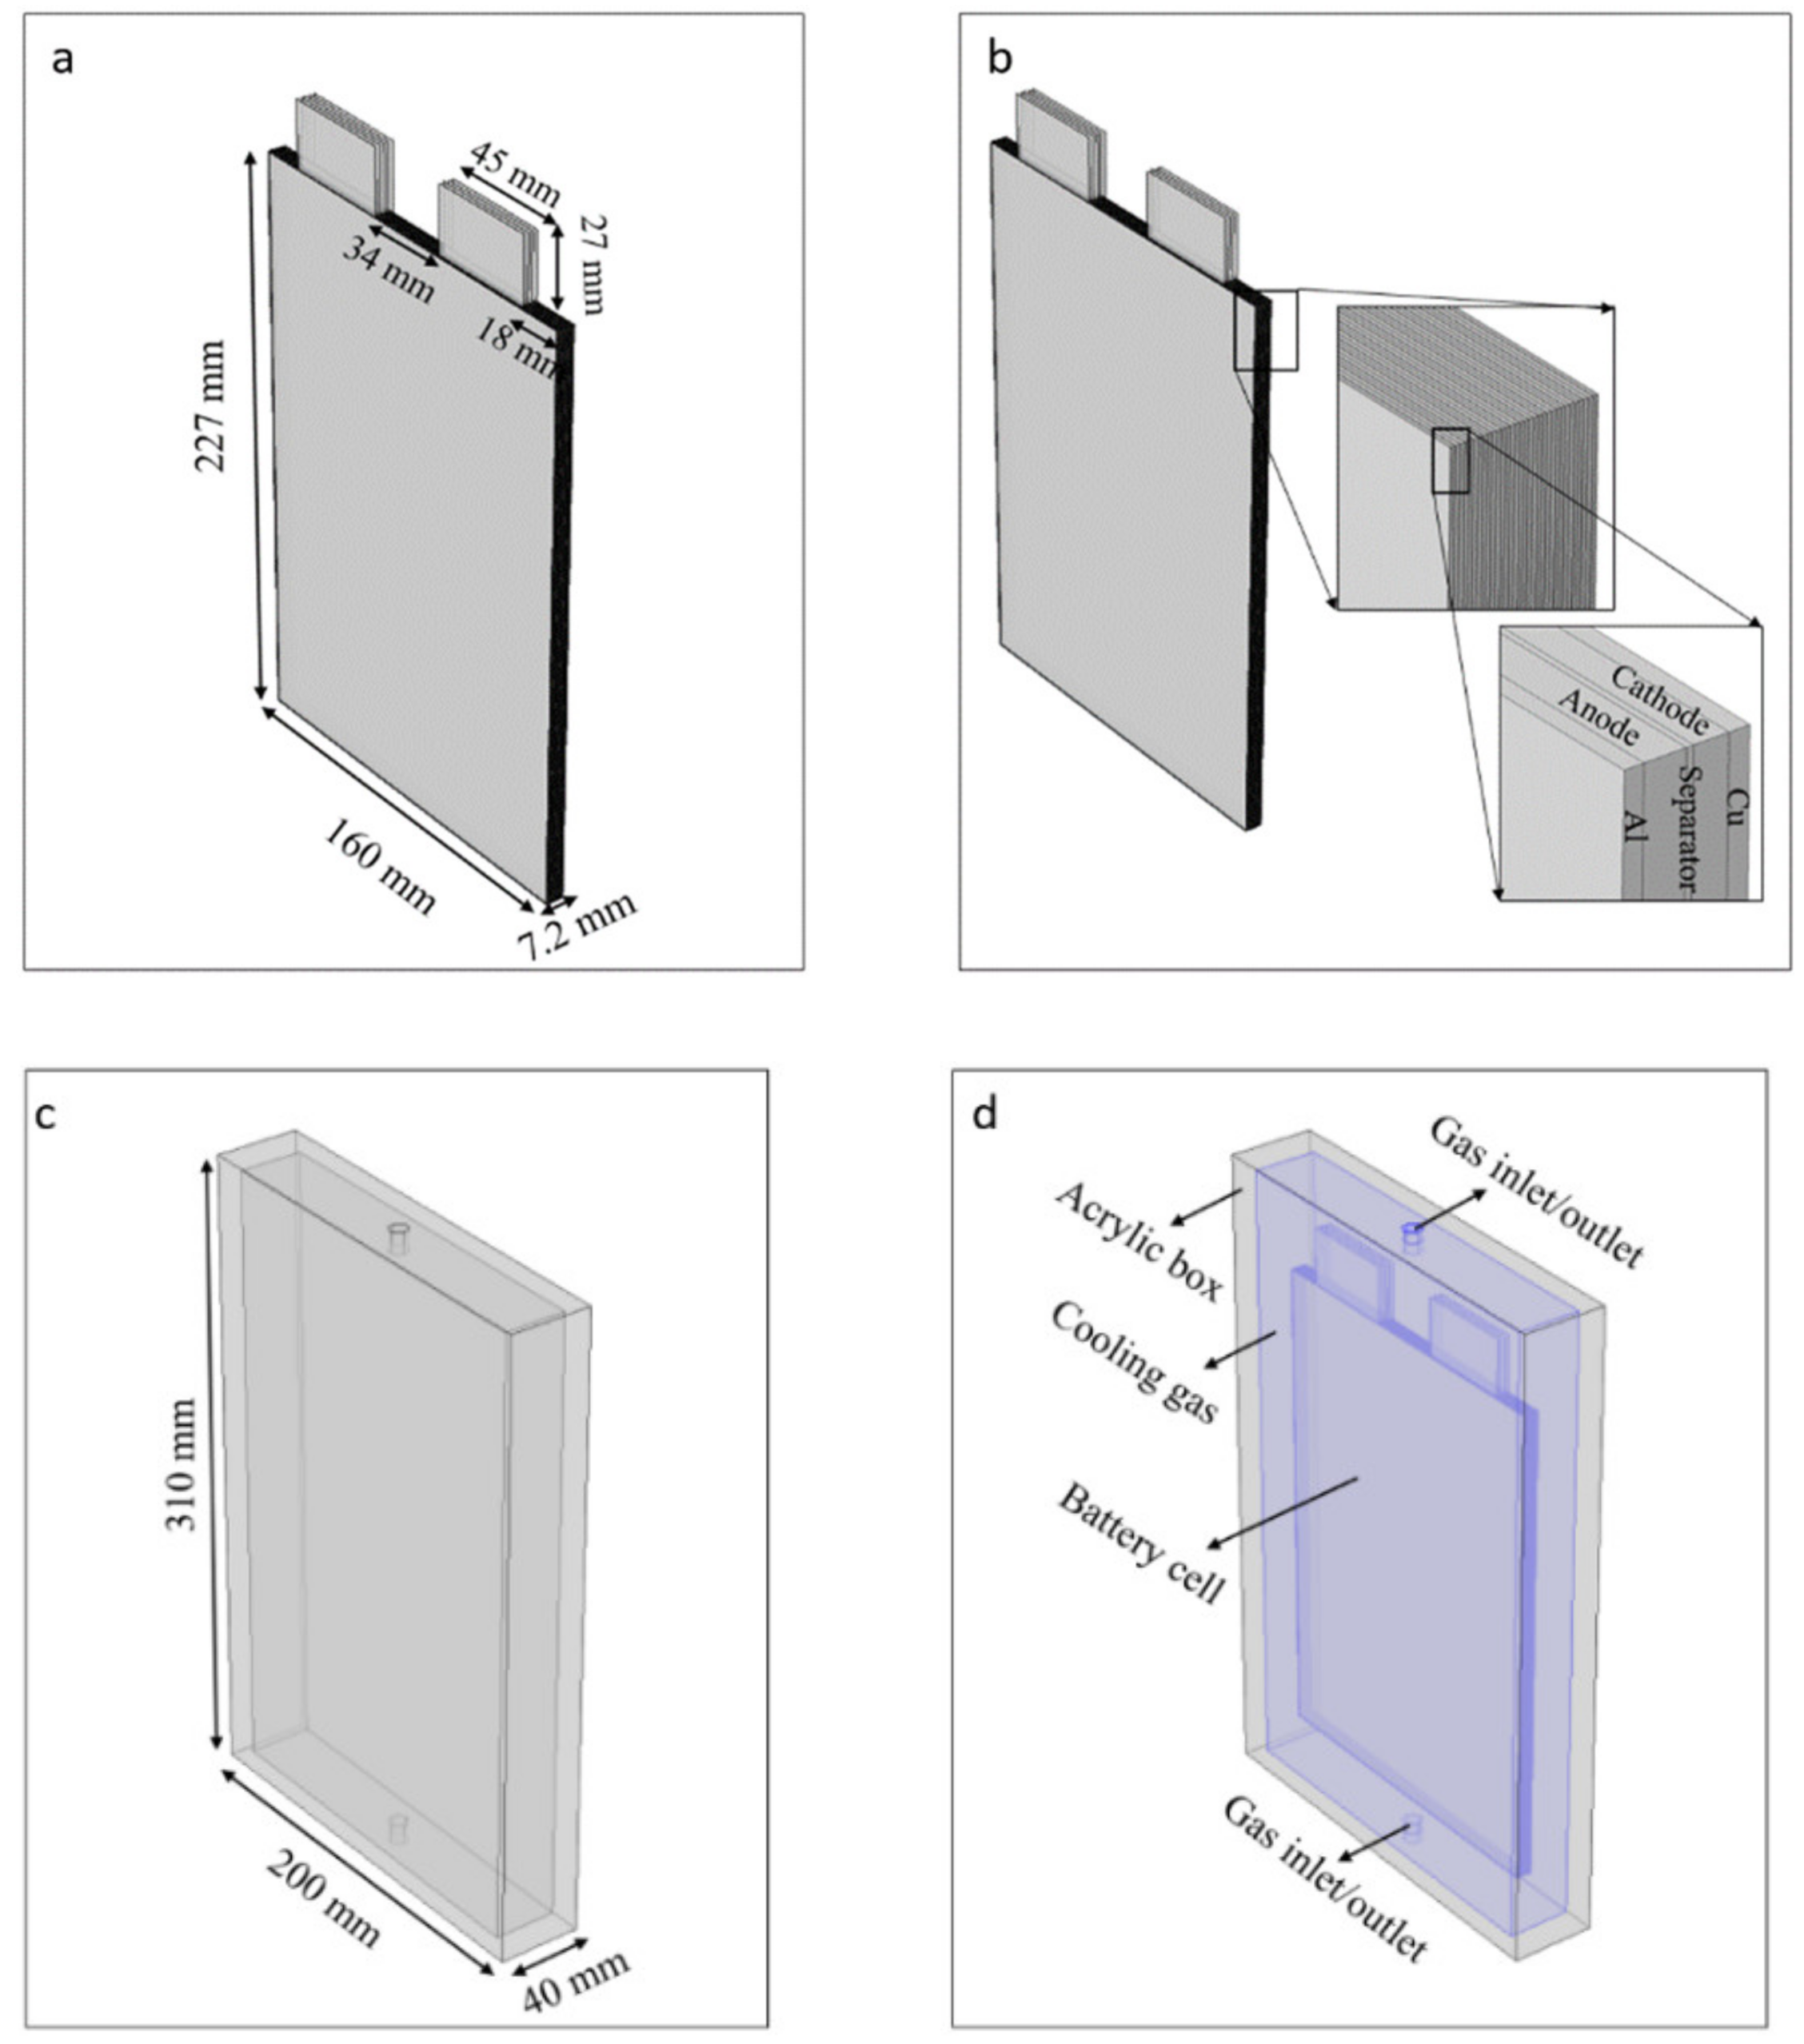
The model consists of a multilayer 20 Ah LiFePO4 cell (Figure 3b) confined inside an Acrylic plastic cooling box (Figure 3d). The dimensions of the cell and cooling box are illustrated in Figure 3a,b, which are the same as the experimental cell and box. Volumetric flow rate and atmospheric pressure are chosen as inlet and outlet boundary conditions. A free tetrahedral feature node with the maximum element size of 0.0278 m and minimum element size of 7.5 × 10 5 m is used for mesh generation and independency of model results to mesh quantity is verified. The battery cell is discharged at 30 °C and the extreme current rate of 3C, and the inlet coolant temperature is set to ambient temperature. Laminar flow with no shear slip condition on cooling box internal walls and cell surfaces was applied. The temperature-dependent physical and thermal properties of the gases used as coolant are listed in Table 1, where an analytical ideal gas function is used for density and piecewise functions are used for the other properties.

4. Results and Discussion

High-capacity LIBs generate a high amount of heat during cycling. The generated heat needs to be dissipated properly to avoid safety problems and to prolong battery cycle life. Ohmic heat, reaction heat, and entropic heat are the main sources of total heat generation in LIBs. Figure 4 shows the total heat generation in the LFP cell during 3C (60 A) and 1C (20 A) discharge. The rapid increase in the heat generation rate at the beginning and end of the discharge is due to the increased ohmic and concentration polarization.[35] The amount of the total heat generation values at 3C and 1C discharges passes 65,000 and 12,500 W/m3, respectively. Therefore, the cooling performance of the cell is evaluated at the extreme discharge current rate, which is 3C.

4.1. Model Validation

In order to evaluate the quality of the developed multi-physics model, the results obtained by the model are validated by the experimental measurements. In this approach, the surface temperature of the cell is monitored experimentally and using the model at three different points denoted as T1, T2, and T3 (Figure 1), and the results are compared. The temperature validation is performed at 30 °C and 3C discharge under both no-cooling and cooling conditions. T1 and T3 are representing the maximum and minimum temperature on the cell surface throughout the discharge, respectively. Figure 5a,b shows the temperature change of the aforementioned points without cooling and with He-based cooling ( V · = 10   lpm ), respectively. According to the results, as getting closer to cell tabs, higher variations are seen in maximum temperature rise under no-flow and flow conditions. For example, as flow is set to 10 L/min, based on the experimental measurements, maximum temperature rises on T1, T2, and T3 drop approximately 5, 3, and 2 °C, respectively, compared to no flow condition. This could be explained by the fact that at high current rates, due to significant amount of ohmic heat generation at cell tabs, regions near to tabs get warmer than other points. In addition, the cold flow first meets the regions near to tabs, and gets warmer moving along the cell height. The effects of inlet/outlet locations are discussed thoroughly in Section 4.3.2. The standard error of estimates (SEE) are calculated for all the points, and they are listed in Table 2. The SEE show that experimental measurements are in good agreement with modeling results. Additionally, it indicates that the model fits better to the experimental measurements when there is cooling.

4.2. Thermal Behavior of the Cell under No-Cooling Condition

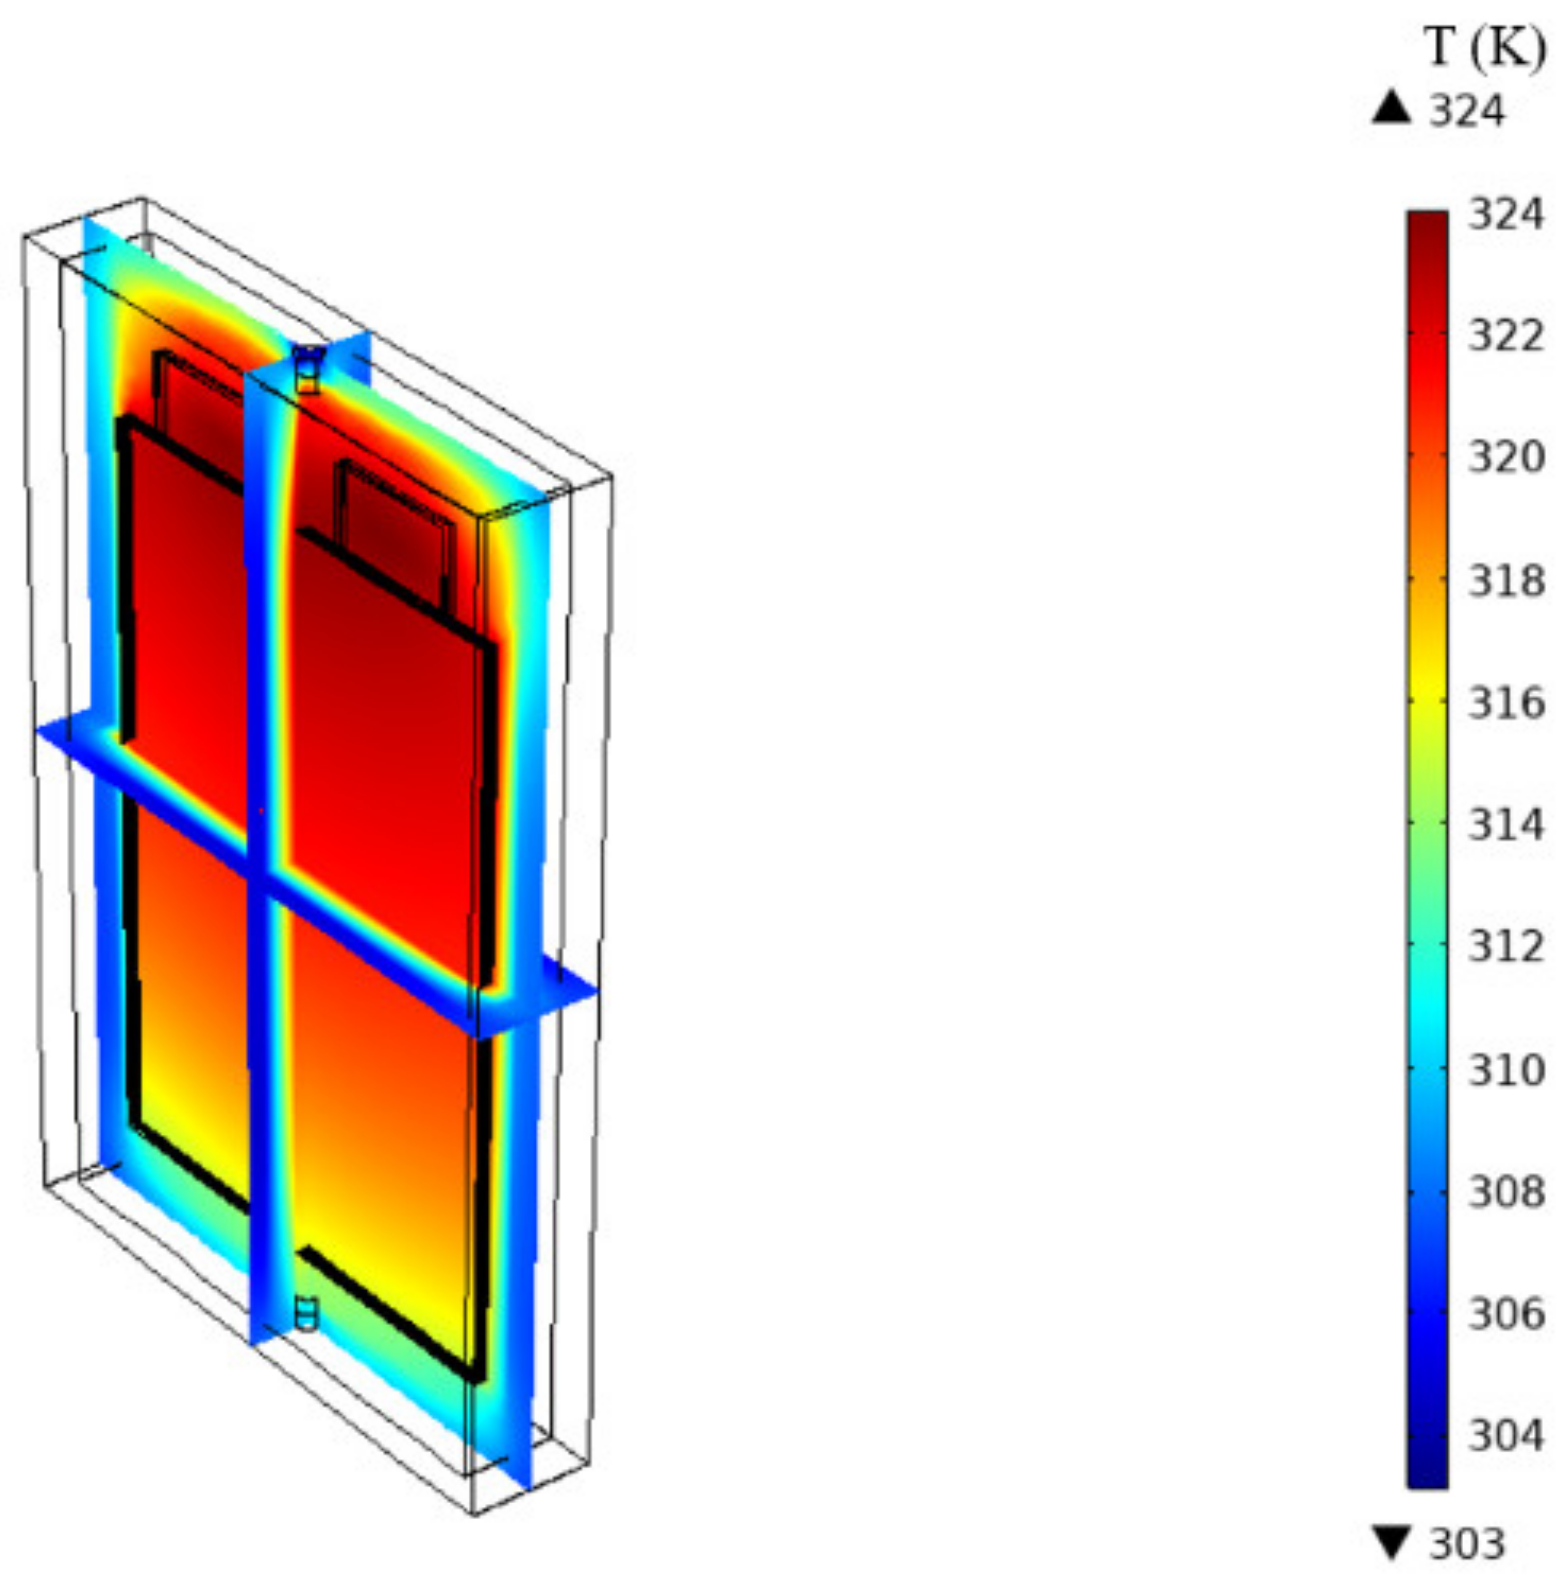
Temperature rise and temperature uniformity have huge impacts on the electrochemical behavior and accordingly the battery performance, safety, and cycle-life [36]. Figure 6 illustrates the temperature profile of the cell surface at the end of 3C discharge without using any cooling system. With no cooling, the battery cell’s temperature rises from 303.15 K (30 °C) to 324 K (51 °C). However, based on Pesaran et al. [37], the optimal temperature range for lithium ion battery operation is between 15 and 35 °C. Furthermore, discharging LiFePO4 cells above 45 °C significantly increases the rate of chemical degradation reactions in the cathode [38]. As a result, the LiFePO4 electrode forms a Fe+2 ion and catalyzes the side reactions on the anode, resulting in thicker SEI film [38,39,40]. The compounds of the SEI layer are not soluble in the electrolyte solution, and they precipitate and form a protective film on the surface of electrodes. This limits the Li+ diffusion rate through the SEI layer and increases the bulk and SEI resistances. Furthermore, as the thickness of the SEI layer increases, more Li ions are consumed irreversibly. Consequently, power and capacity losses at high temperatures are unavoidable. Besides the absolute temperature of a battery cell, non-uniform temperature distribution on and inside the cell causes electric unbalances, poor battery performance, and localized aging [3,17,41,42,43]. Moreover, Figure 5 depicts that the temperature gradient on the cell surface is approximately 6 °C. Therefore, an efficient BTMS is indispensable to keep the battery cell within an optimum temperature range with uniform temperature distribution.

4.3. Thermal Behavior of the Cell under Gas-Based Cooling

A series of simulations are conducted to investigate the response of a cooling system with different gas types, inlet diameters, flow directions, and inlet flow rates. All the simulations are performed at the same initial and inlet temperature (30 °C), the discharge current rate is set to 3C (an extreme case), and the operation is stopped when the battery cell voltage drops to 2.2 V.

4.3.1. Comparison of Cooling Performance of the Air and Helium Gas

One of the main reasons to commonly use air in cooling systems is because it is always free and available. However, air-based cooling systems suffer from the low thermal conductivity of air. Therefore, any gas with higher thermal conductivity can be preferable for efficient cooling. Helium gas has a thermal conductivity of 0.151 Wm−1 K−1 at 300 K, and it is about six times more than the air’s conductivity which is only 0.026 Wm−1 K−1. In this section, the cooling efficiency of He is compared with air using the developed model where both gasses are fed with the same volumetric flow rates and at the same operating conditions.
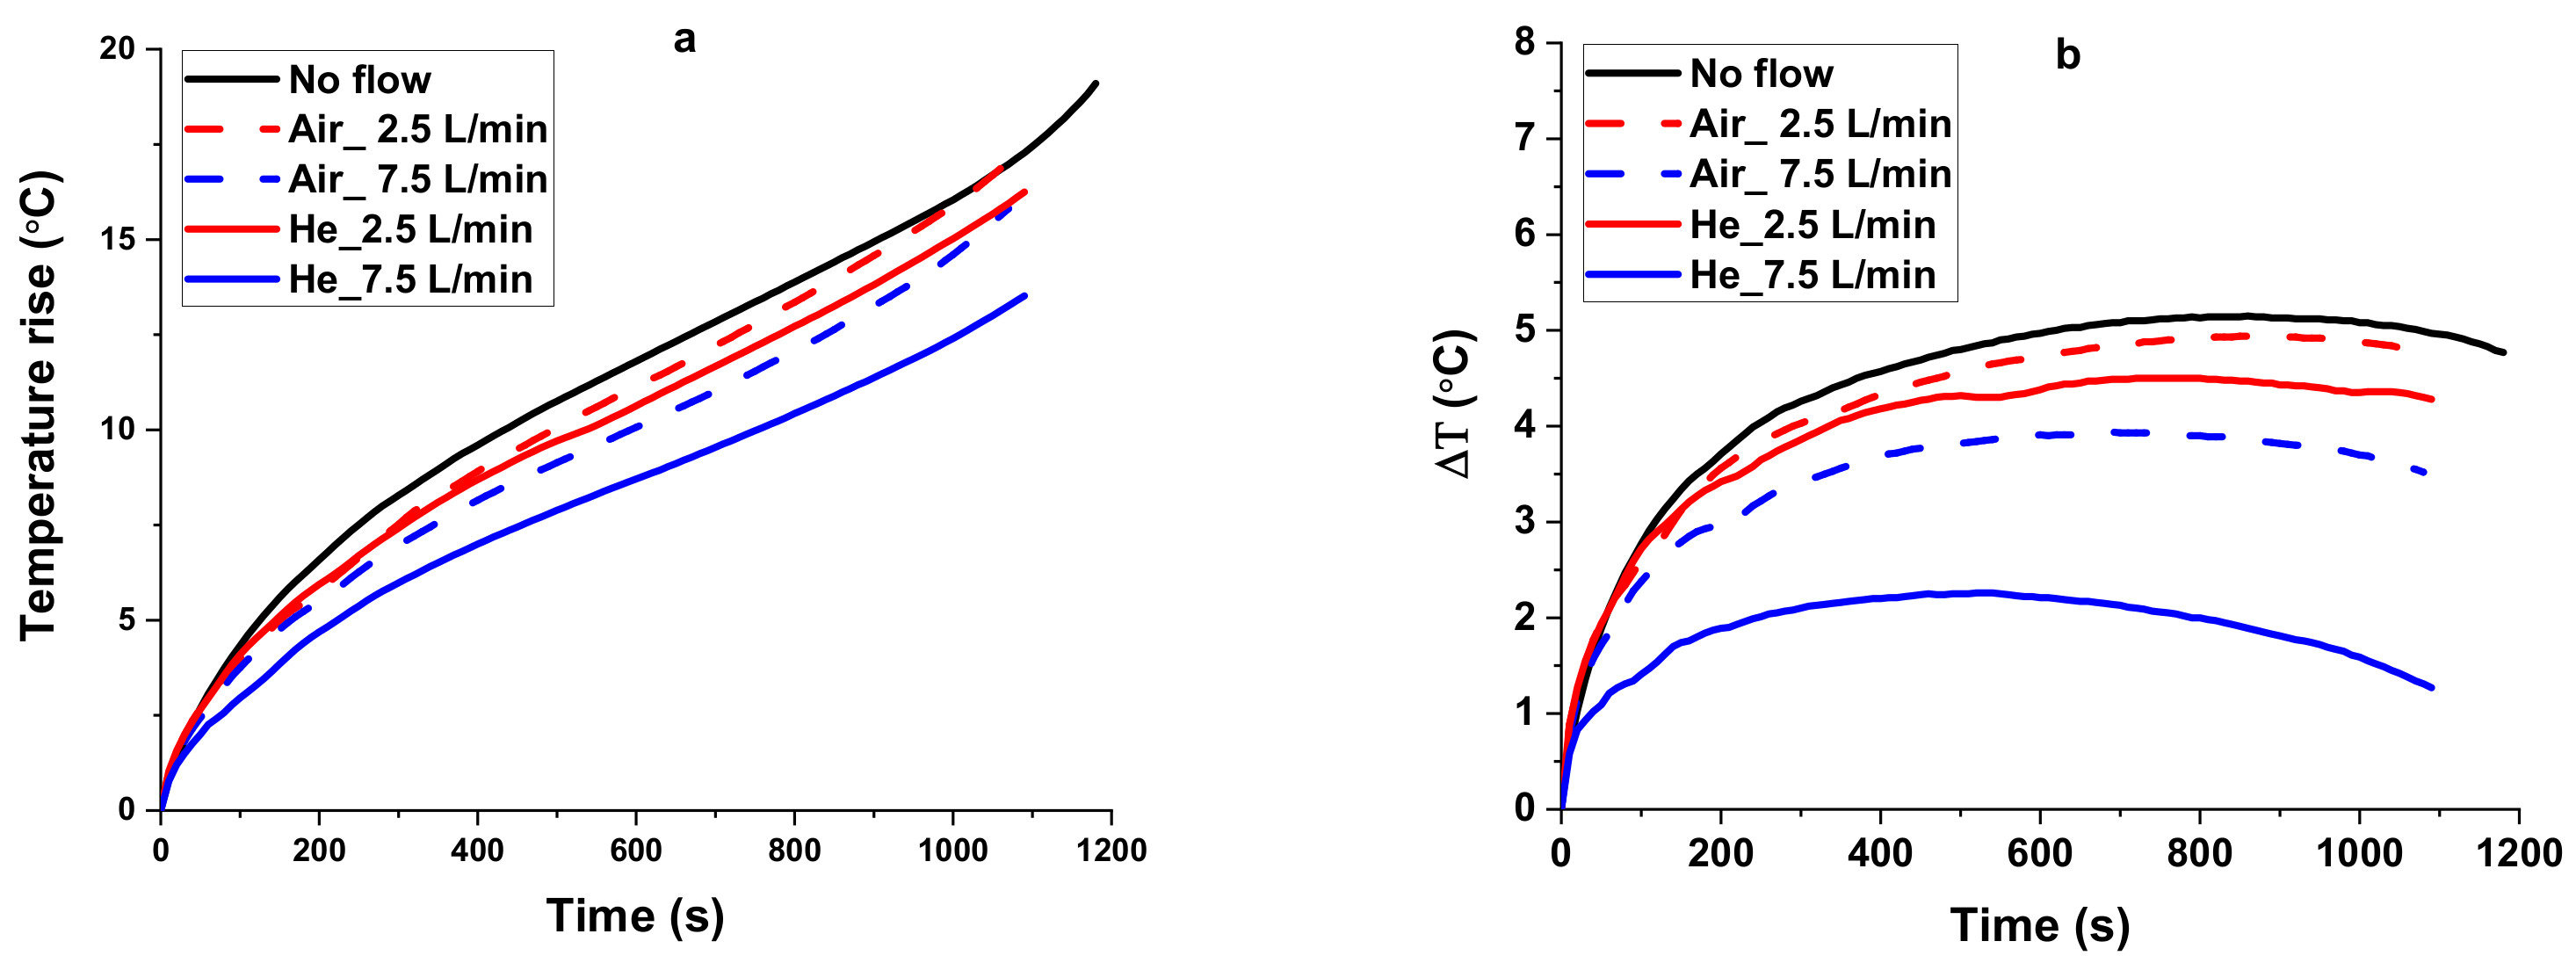
Figure 7a,b illustrates the change on the maximum temperature on cell surface (ΔT1), and the temperature gradient on cell surface ΔT (T1 − T3) along with the discharge time, respectively. Without any cooling, i.e., under natural convection, ΔT1 is increased as high as 19.2 °C at the end of the discharge. On the other hand, with 2.5 L/min air fed to the cooling system, it is calculated as 17.38 °C, where airflow offers only a 1.82 °C drop compared to natural convection. With He fed to the cooling system with the same flow rate, ΔT1 is increased up to 16.2 °C. This is promising because, contrary to air, He-based cooling results in about 3 °C drop on the cell surface at the same low flow rate. With the 7.5 L/min as an inlet flow rate, the ΔT1 is increased up to 15.81 and 13.52 °C under air-cooling and He-cooling, respectively. The model results show that He gas cools down the battery 1.18 and 2.29 °C more than air at flow rates of 2.5 and 7.5 L/min, respectively. This is because He has higher thermal conductivity than air and dissipates the generated heat in the cell faster. Furthermore, there is only 0.39 °C difference between the cooling performance of the He with a low flow rate of 2.5 L/min and the air with a high flow rate of 7.5 L/min. This means that to achieve the same cooling performance as He, air must be pumped three times more.
In addition to the maximum temperature on cell surface (T1), the temperature uniformity ΔT, which is the temperature difference between the T1 and T3, is also considered for comparing the cooling efficiencies. As shown in Figure 7b, with no cooling, a huge temperature gradient is seen on the cell surface (ΔT = 4.77 °C). When the flow rate is set to 2.5 L/min, ΔT values at the end of the discharge are dropped to 4.65 and 4.28 °C for air and He, respectively. Even though ΔT values are lower than the one in no cooling case, neither air nor He provides sufficient temperature uniformity at this flow rate. When the flow rate is increased to 7.5 L/min, ΔT values are dropped to 3.52 and 1.23 °C for air and He, respectively. It is clear that He with V · = 7.5 L/min provides sufficiently uniform temperature along the surface of the cell. This result can be very favorable in controlling the battery temperature uniformity in EVs. It is also worth mentioning that the He gas dissipates more heat from the battery cell, which offers a better cooling efficiency compared to air.

4.3.2. Effects of Design Parameters

The temperature of the cooling gas is highly affected by the sudden expansion and changes its temperature. This may have an effect on the cooling design. Similarly, counter current flow or co-current flow also changes the efficiency of the cooling system. Flow rate obviously affects the cooling performance but increasing flow rate also increases the pumping power. Therefore, it is critically important to study the effect of the inlet and outlet diameter, flow direction, and flow rate to improve the cooling efficiency.

Effects of Inlet/Outlet Diameter

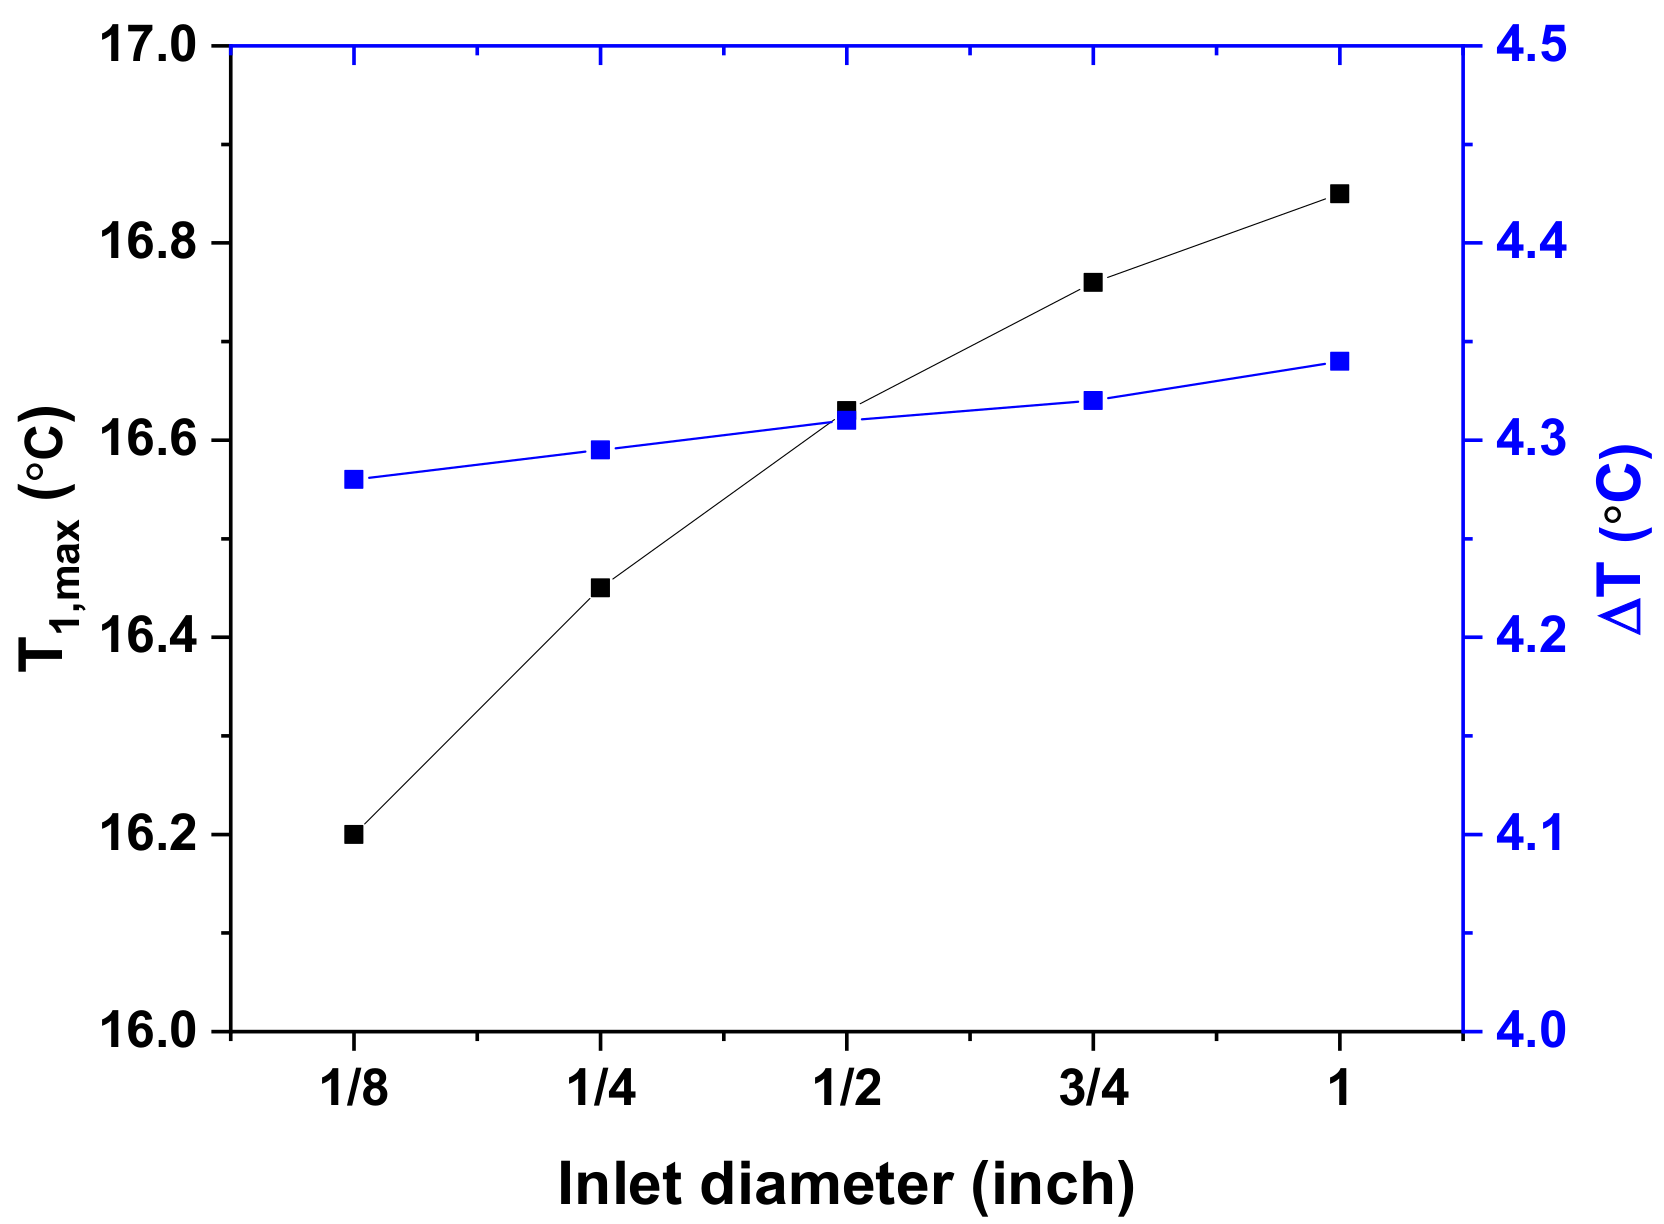
The velocity of the cooling fluid is affected by the size of the openings entering and exiting the container. To evaluate the effect of inlet diameter, it is changed from 1/8 inch to 1 inch. The inlet and outlet diameters are equal in all of the cases to get a uniform velocity profile inside the cooling box. Since He offers a better cooling efficiency, it is fed to the cooling system with a flow rate of 2.5 L/m from the top inlet and comparison is done accordingly. Figure 8 shows the maximum temperature increment (T1,max) and the temperature gradient (ΔT) on the cell surface for a cooling system with different inlet diameters. The results show that the inlet diameter has a negligible effect on T1,max as it differed only 0.65 °C when the diameter is changed from 1/8” to 1”. Likewise, almost no variations are seen in ΔT by changing the inlet diameter. Overall, despite the small variations, the inlet/outlet diameter does not influence the cooling performance significantly. The temperature of a gas decreases when it expands suddenly. However, expansion from 1/8” and 1/4” changes the T1,max only 0.25 °C. Therefore, this small change is believed to cause a small effect on the cooling performance of the gas.

Effects of Flow Direction

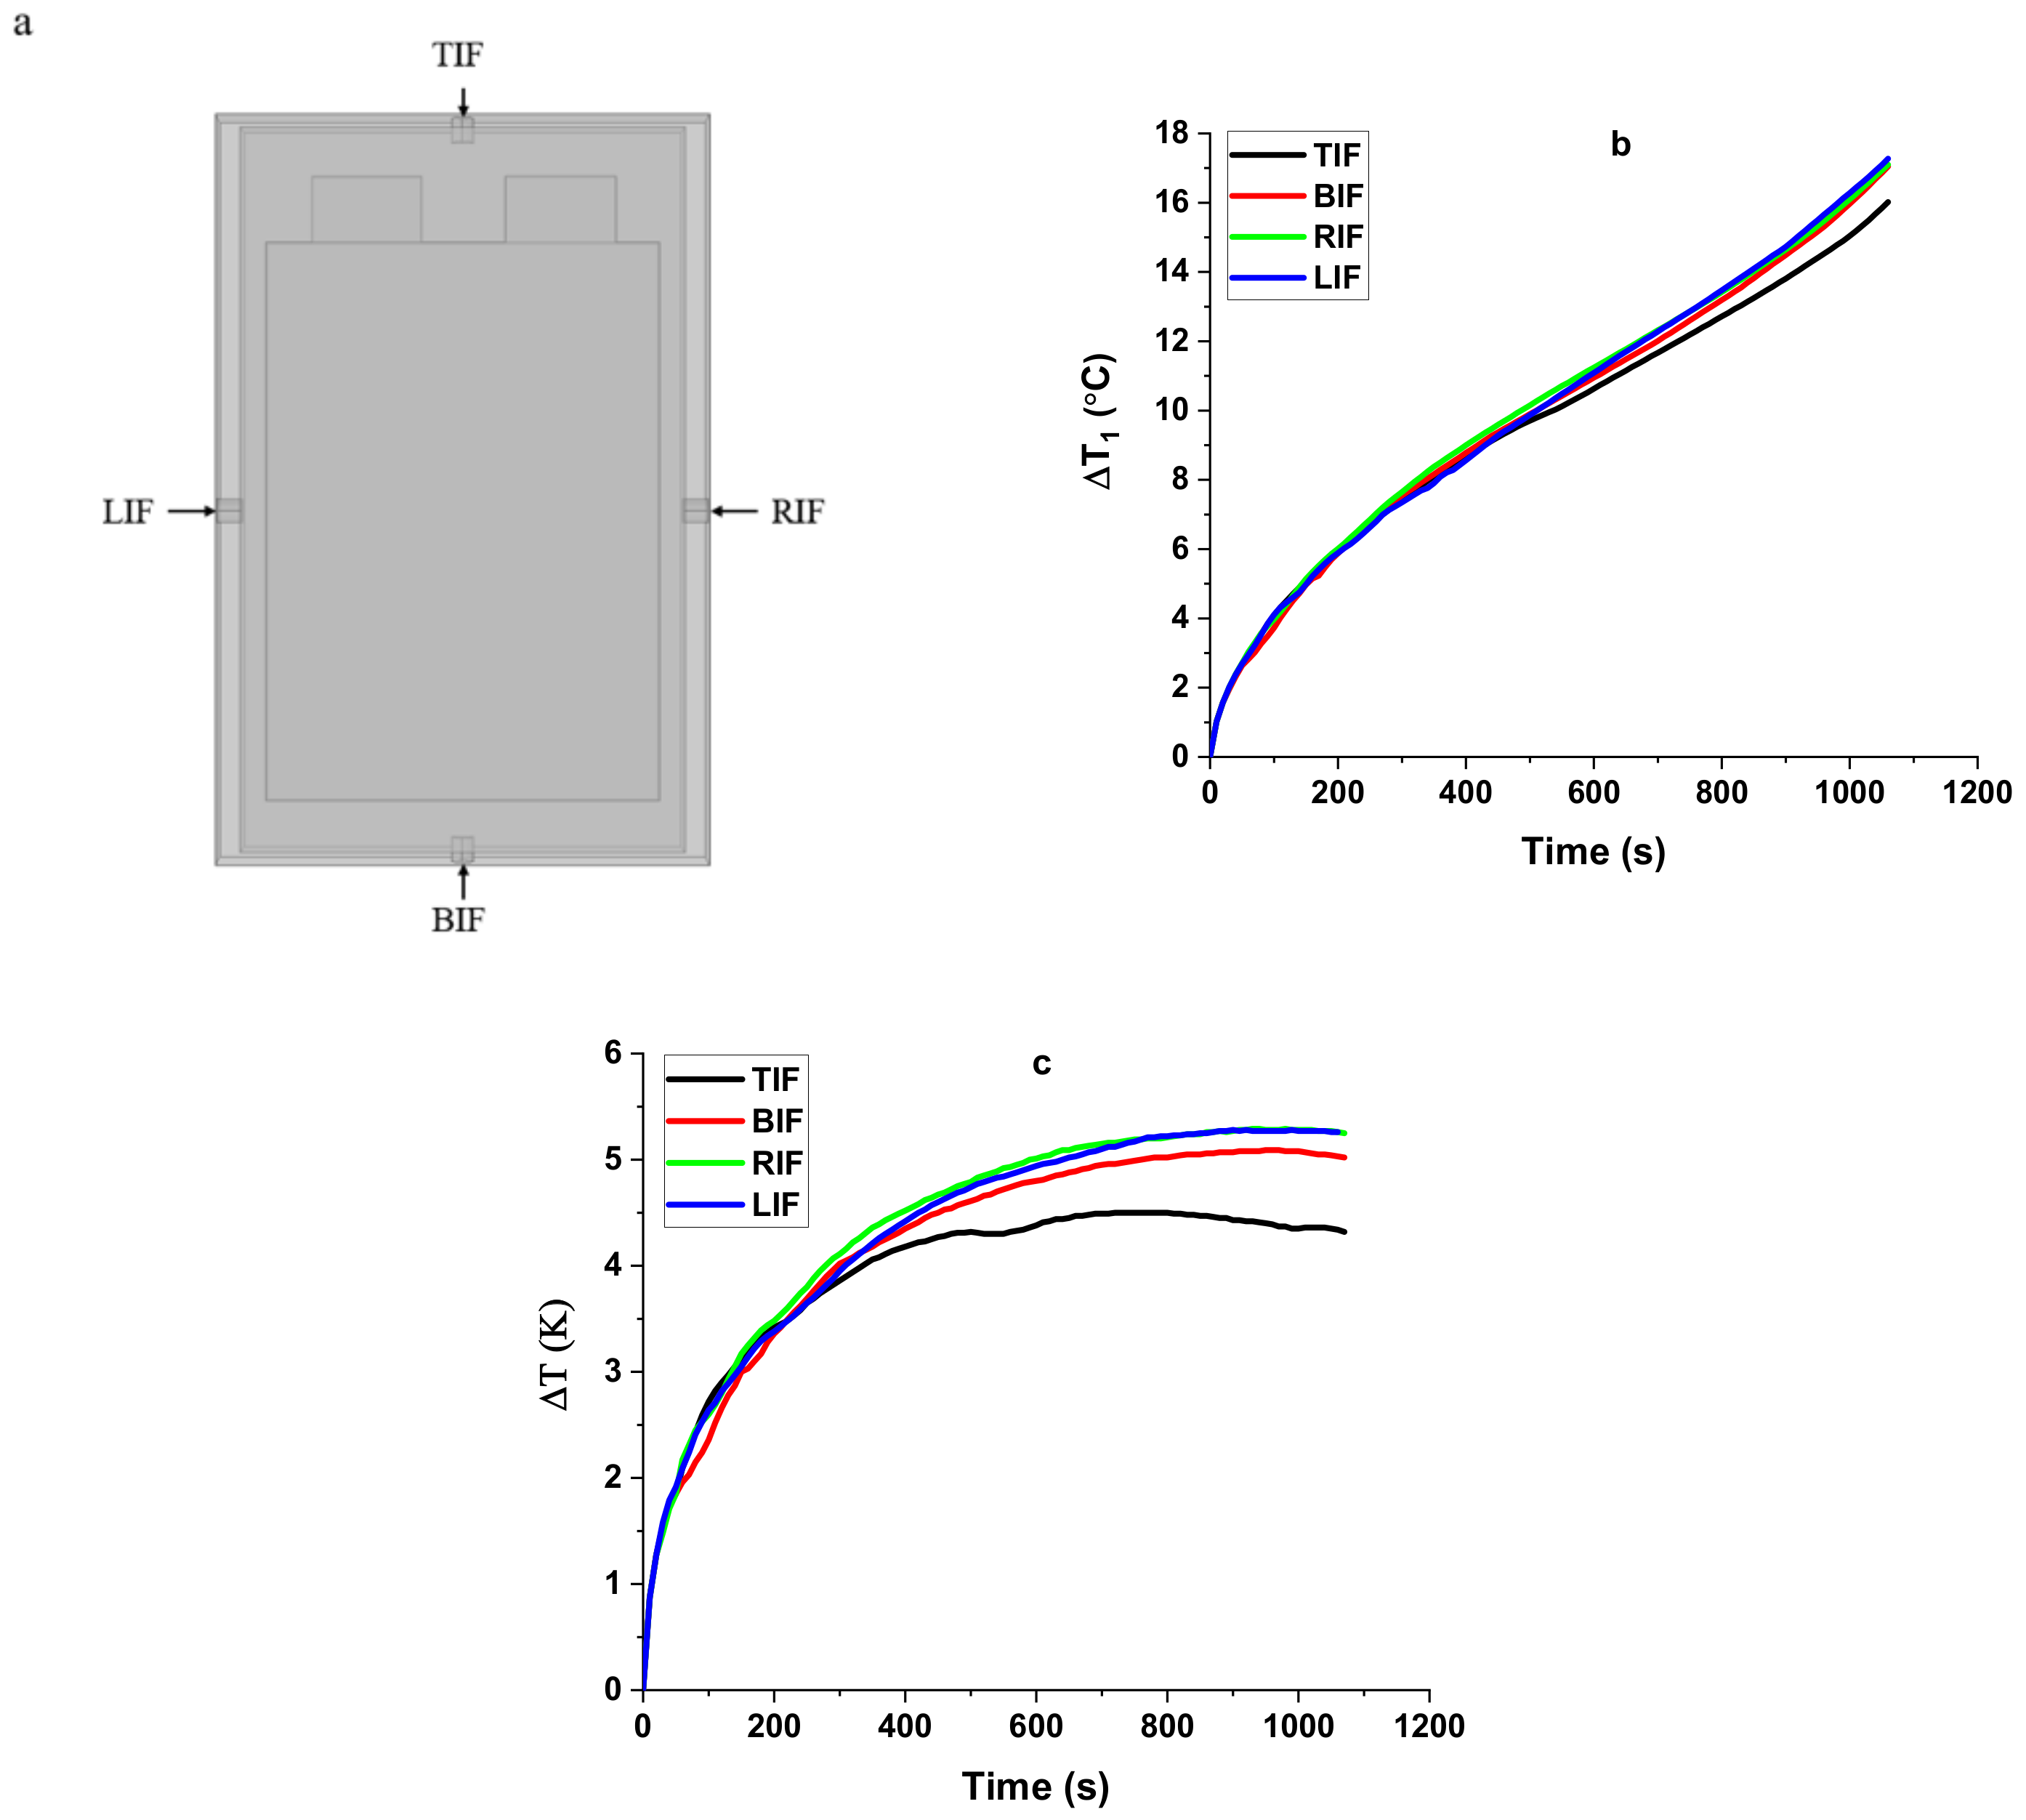
In most of the cooling/heating systems, flow direction affects temperature rise and its distribution. In this section, the effects of four flow directions are investigated: the top-inlet flow (TIF), the bottom-inlet flow (BIF), the right-inlet flow (RIF), and the left-inlet flow (LIF). In this approach, the He gas with a flow rate of 2.5 L/min alternately is set to top, bottom, right, and left inlet with the diameter of 1/8 inch, as shown in Figure 9a.
Figure 9b shows the change on the maximum temperature on cell surface (ΔT1) for the TIF, BIF, RIF, and LIF cooling, which becomes 16.2, 17.05, 17.1, and 17.27 °C at the end of discharge, respectively. In the first 500 s, the direction of the flow does not make any change on cooling efficiency, but significant change appears later on. The TIF cooling results in better cooling since the fresh cool gas first meets the regions near to the cell tabs, which cause significant heat release due to ohmic resistance, consequently becoming the hottest regions during discharge. On the other hand, the BIF, RIF, and LIF cooling results in almost the same cooling efficiency even though the heat release is higher on the positive current collector.
Figure 9c illustrates the ΔT value on the cell surface for the TIF, BIF, RIF, and LIF. Similarly, the TIF shows the best performance in terms of decreasing the ΔT. The value of the ΔT at the end of the discharge process reaches 4.28, 5.01, 5.21, and 5.20 °C under cooling with TIF, BIF, RIF, and LIF, respectively. Therefore, the BIF, RIF, and LIF methods may not be proper cooling choices. Overall, considering the cooling performance in terms of decreasing the maximum temperature rise and temperature uniformity, the TIF method is the best option.

Effects of Inlet Flow Rate

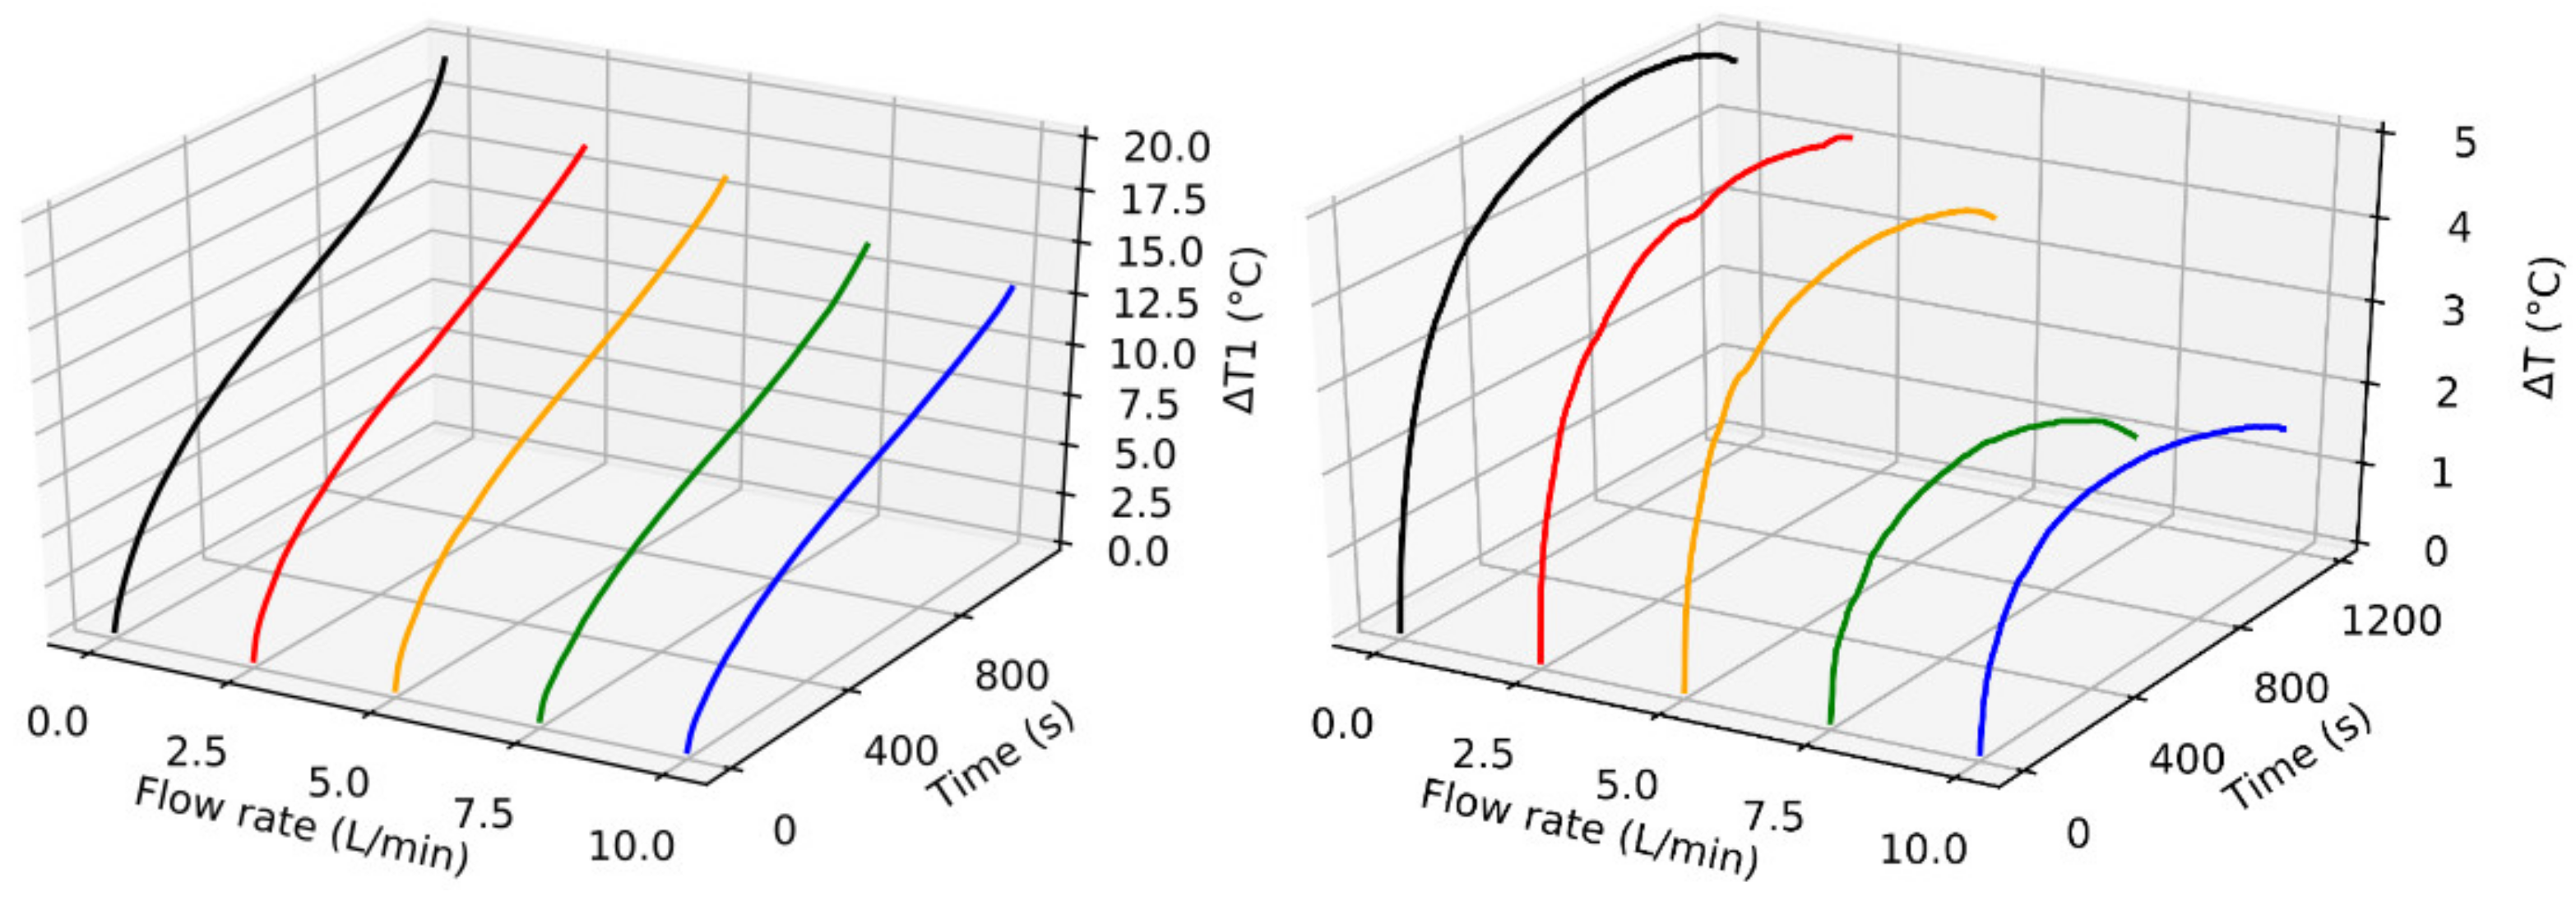
In this section, the effect of inlet flow rate is investigated when the He gas is fed to the top inlet with a diameter of 1/8 inch. As shown in Figure 10, both the ΔT1 and ΔT values are favored by the inlet flow rate. According to the results, at the end of discharge, ΔT1 is increased as high as 19.2 °C under natural convection, while it is dropped to 16.2, 15.93, 13.52, and 13.01 °C when the inlet flow rate is set to 2.5, 5, 7.5, and 10 L/min, respectively. Similarly, at the end of discharge, the ΔT values became 4.77, 4.28, 3.62, 1.23 °C, and 1.61 °C for no-flow, 2.5, 5, 7.5, and 10 L/min, respectively. The better cooling at higher inlet flow rates can be explained by the higher convective heat flux magnitude. The magnitude of convective heat flux is in direct correlation with the velocity of the flow, as shown in Equation (15).
C o n v e c t i v e   h e a t   f l u x   m a g n i t u d e =   ( ρ f v x E i ) 2 + ( ρ f v y E i ) 2 + ( ρ f v z E i ) 2
Overall, the cooling efficiency in terms of decreasing the values of ΔT1 and ΔT is significantly influenced by the inlet flow rate. In this study with the aforementioned operation conditions, 7.5 L/min is the optimum flow rate since it keeps the maximum temperature below 35 °C and also keeps the ΔT as low as possible. However, more power is needed to pump the gas with a high flow rate.

5. Conclusions

In this study, a novel He -based battery thermal management system is proposed to efficiently control the temperature rise and temperature non-uniformity of LIBs. A multilayer electrochemical-thermal battery model for a pouch type 20 Ah LiFePO4 cell is used to simulate the battery thermal behavior. The cooling efficiency of the He-based cooling system is examined and is compared with air cooling. The effects of different inlet diameters, inlet flow rates, and flow directions are investigated.
The simplicity of a gas-based cooling system is an advantage over a liquid-coolant framework. Air cooling offers less weight, is leak-free, needs fewer components, and might cost less. However, an air-based cooling system suffers from the low heat transfer coefficient and small heat capacity of the cooling medium. Due to the perfect physical and thermal properties, a He-based cooling system compensates the drawbacks associated with an air-based cooling system, while preserving its advantages over liquid-based cooling systems. The main findings of this study are summarized as follows:
  • With the perfect thermal and physical properties, the He gas shows promising cooling efficiency compared to air. The He gas at low flow rates offers a close cooling performance with the air at higher flow rates. Therefore, using the He as a cooling medium will decrease the energy consumed for gas circulation.
  • The inlet/outlet diameter has a negligible effect on cooling performance.
  • The flow direction significantly changes the ΔT1 and ΔT values. The most effective method is to feed the gas from the top inlet where the fresh gas meets the hot regions first.
  • The inlet gas flow rate is found to be the most effective parameter in controlling the ΔT1 and ΔT values. However, the higher flow rates result in higher energy consumption for circulating the cooling gas.

Author Contributions

Conceptualization, M.A. and R.K.; methodology, M.A. and R.K; software, M.A.; validation, M.A.; formal analysis, M.A. and R.K.; investigation, M.A. and R.K.; resources, M.A.; data curation, M.A.; writing—original draft preparation, M.A.; writing—review and editing, M.A., R.K. and A.H.; visualization, M.A., R.K. and A.H.; supervision, R.K.; project administration, R.K.; funding acquisition, R.K. All authors have read and agreed to the published version of the manuscript.

Funding

This research was funded by the Scientific and Technological Research Council of Turkey (TUBITAK), grant number 218M589.

Institutional Review Board Statement

Not applicable.

Informed Consent Statement

Not applicable.

Data Availability Statement

Data sharing not applicable.

Acknowledgments

The authors acknowledge financial support from the Scientific and Technological Research Council of Turkey (TUBITAK) under Grant No.218M589.

Conflicts of Interest

The authors declare no conflict of interest.

Nomenclature

aElectrode specific surface area (m−1)
AtabCross section of the tab (m2)
CdlElectrical double layer capacitance (F/m2)
ceLithium concentration in electrolyte (mol/m3)
CpSpecific heat (J/kg·K)
csLithium concentration in solid (mol/m3)
cs,0Initial lithium concentration in solid (mol/m3)
cs,maxMax li ion concentration in solid (mol/m3)
cs,surSurface concentration of lithium in the active material (mol/m3)
DeDiffusion coefficient of Li ion in electrolyte (m2/s)
DsDiffusion coefficient of Li ion in solid (m2/s)
fAverage molar activity coefficient
FFaraday’s constant (96,487 C/mol)
F Body forces (N)
hConvective heat transfer coefficient (W/m2·K)
IIdentity tensor
i0Exchange current density (A/m2)
iappTotal applied current density (A/m2)
ilocLocal working current density of the cell unit (A/m2)
iNNormal inward current density through the electrode/cc interface (A/m2)
kReaction rate constant (m2.5/mol0.5·s)
L_battBattery cell thickness (m)
MMean molar mass (kg/mol)
NTotal number of cell layers
PAbsolute pressure (Pa)
QsvStandard flow rate (m3/s)
rRadios of electrode particle (m)
RUniversal gas coefficient (8.314 J/mol·K)
SInlet cross section area (m2)
ttime (s)
TAbsolute temperature (K)
t+Transferring number of Li+
UeqOpen circuit potential (V)
v Velocity (m/s)
VmStandard molar volume (m3/mol)
αaAnodic transfer coefficient
αcCathodic transfer coefficient
ßBulk expansion coefficient
εeVolume fraction of the fillers
κeffEffective ionic conductivity of the electrolyte (S/m)
λThermal conductivity (W/m·K)
μ Dynamic viscosity (Pa·s)
ρDensity (kg/m3)
σsElectronic conductivity of the solid phase (S/m)
σeIonic conductivity of electrolyte (S/m)
τ Viscos
φsSolid-phase potential (V)
φeElectrolyte-phase potential (V)
Subscripts, superscripts and acronyms
0Initial value
bBox
ccCurrent collector
effEfficient
fFluid
iIndicator (i = pe, ne)
eElectrolyte
extexternal
neNegative electrode
maxMaximum
pePositive electrode
sSolid
sepSeparator

References

  1. Scrosati, B.; Garche, J. Lithium batteries: Status, prospects and future. J. Power Sources 2010, 195, 2419–2430. [Google Scholar] [CrossRef]
  2. Hassanpouryouzband, A.; Joonaki, E.; Farahani, M.V.; Takeya, S.; Ruppel, C.; Yang, J.; Tohidi, B. Gas hydrates in sustainable chemistry. Chem. Soc. Rev. 2020, 49, 5225–5309. [Google Scholar] [CrossRef] [PubMed]
  3. Kim, G.-H.; Pesaran, A.; Spotnitz, R. A three-dimensional thermal abuse model for lithium-ion cells. J. Power Sources. 2007, 170, 476–489. [Google Scholar] [CrossRef]
  4. Maleki, H.; Shamsuri, A.K. Thermal analysis and modeling of a notebook computer battery. J. Power Sources. 2003, 115, 131–136. [Google Scholar] [CrossRef]
  5. Lu, L.; Han, X.; Li, J.; Hua, J.; Ouyang, M. A review on the key issues for lithium-ion battery management in electric vehicles. J. Power Sources 2013, 226, 272–288. [Google Scholar] [CrossRef]
  6. Bandhauer, T.M.; Garimella, S.; Fuller, T.F. A critical review of thermal issues in lithium-ion batteries. J. Electrochem. Soc. 2011, 158, R1–R25. [Google Scholar] [CrossRef]
  7. Tarascon, J.-M.; Armand, M. Issues and challenges facing rechargeable lithium batteries. Mater. Sustain. Energy. 2011. [Google Scholar] [CrossRef]
  8. Wen, J.; Yu, Y.; Chen, C. A review on lithium-ion batteries safety issues: Existing problems and possible solutions. Mater. Express. 2012, 2, 197–212. [Google Scholar] [CrossRef]
  9. Rao, Z.; Wang, S. A review of power battery thermal energy management. Renew. Sustain. Energy Rev. 2011, 15, 4554–4571. [Google Scholar] [CrossRef]
  10. Alipour, M.; Ziebert, C.; Conte, F.V.; Kizilel, R. A review on temperature-dependent electrochemical properties, aging, and performance of lithium-ion cells. Batteries 2020, 6, 35. [Google Scholar] [CrossRef]
  11. An, Z.; Jia, L.; Ding, Y.; Dang, C.; Li, X. A review on lithium-ion power battery thermal management technologies and thermal safety. J. Therm. Sci. 2017, 26, 391–412. [Google Scholar] [CrossRef]
  12. Alipour, M.; Esen, E.; Varzeghani, A.R.; Kizilel, R. Performance of high capacity Li-ion pouch cells over wide range of operating temperatures and discharge rates. J. Electroanal. Chem. 2020, 860, 113903. [Google Scholar] [CrossRef]
  13. Ling, Z.; Zhang, Z.; Shi, G.; Fang, X.; Wang, L.; Gao, X.; Liu, X. Review on thermal management systems using phase change materials for electronic components, Li-ion batteries and photovoltaic modules. Renew. Sustain. Energy Rev. 2014, 31, 427–438. [Google Scholar] [CrossRef] [Green Version]
  14. Zhao, J.; Rao, Z.; Huo, Y.; Liu, X.; Li, Y. Thermal management of cylindrical power battery module for extending the life of new energy electric vehicles. Appl. Therm. Eng. 2015, 85, 33–43. [Google Scholar] [CrossRef]
  15. Mohammadian, S.K.; Zhang, Y. Thermal management optimization of an air-cooled Li-ion battery module using pin-fin heat sinks for hybrid electric vehicles. J. Power Sources 2015, 273, 431–439. [Google Scholar] [CrossRef]
  16. Qian, Z.; Li, Y.M.; Rao, Z.H. Thermal performance of lithium-ion battery thermal management system by using mini-channel cooling. Energy Convers. Manag. 2016, 126, 622–631. [Google Scholar] [CrossRef]
  17. Chen, D.; Jiang, J.; Kim, G.-H.; Yang, C.; Pesaran, A. Comparison of different cooling methods for lithium ion battery cells. Appl. Therm. Eng. 2016, 94, 846–854. [Google Scholar] [CrossRef] [Green Version]
  18. Pesaran, A.A. Battery thermal management in EV and HEVs: Issues and solutions. Battery Man. 2001, 43, 34–49. [Google Scholar]
  19. Zhao, R.; Liu, J.; Gu, J. The effects of electrode thickness on the electrochemical and thermal characteristics of lithium ion battery. Appl. Energy 2015, 139, 220–229. [Google Scholar] [CrossRef]
  20. Wang, Q.; Jiang, B.; Xue, Q.; Sun, H.; Li, B.; Zou, H.; Yan, Y.Y. Experimental investigation on EV battery cooling and heating by heat pipes. Appl. Therm. Eng. 2015, 88, 54–60. [Google Scholar] [CrossRef]
  21. Ladrech, F. Battery thermal management for HEV & EV–Technology overview. In Proceedings of the Automotive Summit, Brussels, Belgium, 10 November 2010. [Google Scholar]
  22. Mousavi, M.; Hoque, S.; Rahnamayan, S.; Dincer, I.; Naterer, G.F. (Eds.) Optimal design of an air-cooling system for a Li-ion battery pack in electric vehicles with a genetic algorithm. In Proceedings of the 2011 IEEE Congress of Evolutionary Computation (CEC), New Orleans, LA, USA, 5–8 June 2011; pp. 1848–1855. [Google Scholar]
  23. Xie, J.; Ge, Z.; Zang, M.; Wang, S. Structural optimization of lithium-ion battery pack with forced air cooling system. Appl. Therm. Eng. 2017, 126, 583–593. [Google Scholar] [CrossRef]
  24. Alipour, M.; Kizilel, R. Numerical Investigation of Design Parameters Effects on Performance of Cooling System Designed for A Lithium-Ion Cell. J. Therm. Eng. 2020, 6, 257–271. [Google Scholar] [CrossRef]
  25. Mason, E.; Saxena, S. Approximate formula for the thermal conductivity of gas mixtures. Phys. Fluids. 1958, 1, 361–369. [Google Scholar] [CrossRef]
  26. Muller, W.H.; Roth, G.; Stautner, W.; Turowski, P.; Lehmann, W.; Graf, F. NMR magnet system with superconducting coil in a helium bath. Google Patents. 1993. Available online: https://patents.google.com/patent/US5220800A/en (accessed on 2 March 2021).
  27. Arp, V. Forced flow, single-phase helium cooling systems. In Advances in Cryogenic Engineering; Springer: Boston, MA, USA, 1972; pp. 342–351. [Google Scholar]
  28. Benkowitsch, J.; Krafft, G. Numerical analysis of heat-induced transients in forced flow helium cooling systems. Cryogenics 1980, 20, 209–215. [Google Scholar] [CrossRef]
  29. Ihli, T.; Ilić, M. Efficient helium cooling methods for nuclear fusion devices: Status and prospects. Fusion Eng. Des. 2009, 84, 964–968. [Google Scholar] [CrossRef]
  30. Baxi, C.; Wong, C. Review of helium cooling for fusion reactor applications. Fusion Eng. Des. 2000, 51, 319–324. [Google Scholar] [CrossRef]
  31. Alipour, M.; Esen, E.; Kizilel, R. Investigation of 3-D multilayer approach in predicting the thermal behavior of 20 Ah Li-ion cells. Appl. Therm. Eng. 2019, 153, 620–632. [Google Scholar] [CrossRef]
  32. Ye, Y.; Saw, L.H.; Shi, Y.; Somasundaram, K.; Tay, A.A. Effect of thermal contact resistances on fast charging of large format lithium ion batteries. Electrochim. Acta 2014, 134, 327–337. [Google Scholar] [CrossRef]
  33. Samba, A.; Omar, N.; Gualous, H.; Capron, O.; Van den Bossche, P.; Van Mierlo, J. Impact of tab location on large format lithium-ion pouch cell based on fully coupled tree-dimensional electrochemical-thermal modeling. Electrochim. Acta 2014, 147, 319–329. [Google Scholar] [CrossRef]
  34. Xu, M.; Zhang, Z.; Wang, X.; Jia, L.; Yang, L. A pseudo three-dimensional electrochemical–thermal model of a prismatic LiFePO4 battery during discharge process. Energy 2015, 80, 303–317. [Google Scholar] [CrossRef]
  35. Chen, K. Heat Generation Measurements of Prismatic Lithium Ion Batteries. Doctor Thesis, University of Waterloo, Waterloo, ON, Canada, 27 September 2013. [Google Scholar]
  36. Song, W.; Chen, M.; Bai, F.; Lin, S.; Chen, Y.; Feng, Z. Non-uniform effect on the thermal/aging performance of Lithium-ion pouch battery. Appl. Therm. Eng. 2018, 128, 1165–1174. [Google Scholar] [CrossRef]
  37. Pesaran, A.; Santhanagopalan, S.; Kim, G. Addressing the Impact of Temperature Extremes on Large Format Li-Ion Batteries for Vehicle Applications (Presentation); National Renewable Energy Lab.(NREL): Golden, CO, USA, 2013. [Google Scholar]
  38. Waldmann, T.; Wilka, M.; Kasper, M.; Fleischhammer, M.; Wohlfahrt-Mehrens, M. Temperature dependent ageing mechanisms in Lithium-ion batteries–A Post-Mortem study. J. Power Sources 2014, 262, 129–135. [Google Scholar] [CrossRef]
  39. Amine, K.; Liu, J.; Belharouak, I. High-temperature storage and cycling of C-LiFePO4/graphite Li-ion cells. Electrochem. Commun. 2005, 7, 669–673. [Google Scholar] [CrossRef]
  40. Deshpande, R.; Verbrugge, M.; Cheng, Y.-T.; Wang, J.; Liu, P. Battery cycle life prediction with coupled chemical degradation and fatigue mechanics. J. Electrochem. Soc. 2012, 159, A1730–A1738. [Google Scholar] [CrossRef]
  41. Karimi, G.; Li, X. Thermal management of lithium-ion batteries for electric vehicles. Int. J. Energy Res. 2013, 37, 13–24. [Google Scholar] [CrossRef]
  42. Kim, U.S.; Shin, C.B.; Kim, C.-S. Effect of electrode configuration on the thermal behavior of a lithium-polymer battery. J. Power Sources. 2008, 180, 909–916. [Google Scholar] [CrossRef]
  43. Al Hallaj, S.; Selman, J. A novel thermal management system for electric vehicle batteries using phase-change material. J. Electrochem. Soc. 2000, 147, 3231–3236. [Google Scholar] [CrossRef]
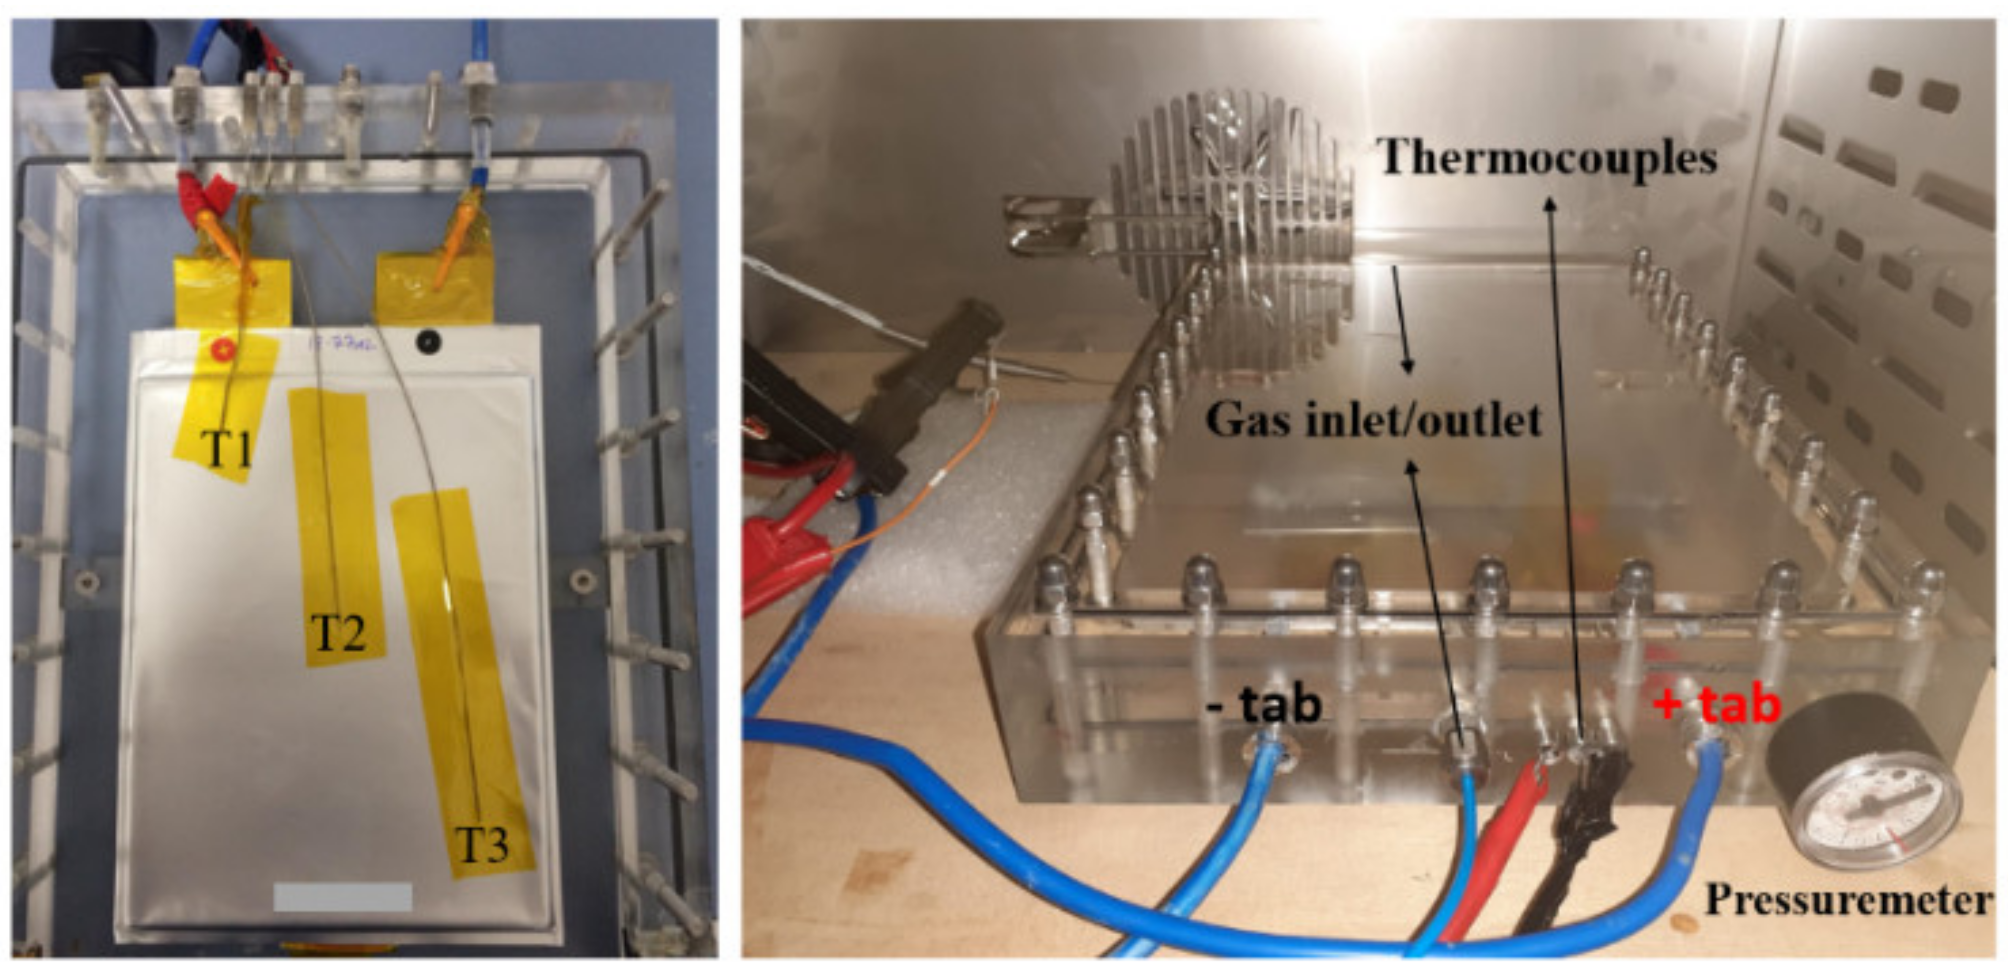
Figure 1. Experimental gas-based cooling setup.
Electrochem 02 00011 g001
Figure 2. Schematic coupling of the electrochemical, heat transfer, and CFD (Computational Fluid Dynamics) modules.
Electrochem 02 00011 g002
Figure 3. (a) dimensions of a single cell; (b) schematic of a multilayer cell; (c) dimensions of a cooling box; and (d) a battery cell cooling system.
Electrochem 02 00011 g003
Figure 4. Total heat generation at (a) 1C and (b) 3C discharge.
Electrochem 02 00011 g004
Figure 5. Local temperature validation under (a) no-flow condition and (b) He-cooling with V · = 10   L / m i n .
Electrochem 02 00011 g005
Figure 6. Temperature non-uniformity under natural convection.
Electrochem 02 00011 g006
Figure 7. (a) The change on the maximum temperature (ΔT1), and (b) the temperature gradient ΔT (T1 − T3) on cell surface.
Electrochem 02 00011 g007
Figure 8. The maximum temperature increment (T1,max) and temperature gradient (ΔT) on cell surface under cooling with various inlet/outlet diameters.
Electrochem 02 00011 g008
Figure 9. (a) Schematic of top-inlet flow (TIF), the bottom-inlet flow (BIF), the right-inlet flow (RIF), and the left-inlet flow (LIF), and effects of flow direction on (b) ΔT1 and (c) ΔT.
Electrochem 02 00011 g009
Figure 10. The maximum temperature rise (Tmax) and temperature gradient (ΔT) for the cooling system with various inlet flow rates.
Electrochem 02 00011 g010
Table 1. Material properties of gases and the cooling box.
ItemAirHelium
Density (kg/m3) P × 0.02897 8.314 × T P × 0.004 8.314 × T
Specific heat capacity (kJ/kg·K) 1047.6 0.372 T + 9.45 × 10 4 T 2 6.024 × 10 7 T 3 + 1.28 × 10 10 T 4 5196.499 2.4308 × 10 16 T
Thermal conductivity (W/m·K) 0.00227 + 1.154 × 10 4 T 7.902 × 10 8 T 2 + 4.117 × 10 11 T 3 7.438 × 10 15 T 4 0.00294 + 5.0765 × 10 4 T 4.225 × 10 7 T 2 + 2.1209 × 10 10 T 3
Dynamic viscosity (10−5 Pa·s) 8.383 × 10 7 + 8.3571 × 10 8 T 7.6942 × 10 11 T 2 + 4.6437 × 10 14 T 3 1.0658 × 10 17 T 4 3.725 × 10 6 + 6.8345 × 10 8 T 5.07299 × 10 11 T 2 + 2.3668 × 10 14 T 3
P and T are representing the absolute pressure and temperature, respectively.
Table 2. Standard error of estimates.
SENo-Flow V ·   =   10   lpm
T10.730.27
T20.220.29
T30.410.18
Publisher’s Note: MDPI stays neutral with regard to jurisdictional claims in published maps and institutional affiliations.