1. Introduction
The ongoing industrial revolution towards Industry 4.0 has driven significant technology changes, presenting both opportunities and threats. In the manufacturing context, additive-type manufacturing methods represent the state of the art for more responsive, localised and adaptive production systems. Fused Filament Fabrication (FFF)-derived 3D prints have become ubiquitous and have enabled households to print spare parts on demand using thermoplastic feedstocks with ease. The democratisation of 3D printing technology allows for rapid and localised manufacturing. In metal manufacturing, 3D printing technologies have attracted considerable attention using methods such as Electron Beam Melting (EBM) and laser powder bed fusion (LPBF). LPBF is arguably one of the most widely recognised additive manufacturing processes [
1,
2,
3].
The technique in question is the selective laser sintering of metal powder that builds the structures up layer by layer. This kind of additive manufacturing is beneficial for on-demand production, rapid prototyping, and reducing waste and lead time. These benefits can be instrumental in achieving the custom material properties and geometries that conventional manufacturing processes cannot reach. Demand for highly customisable components can be catered to by producing in bulk, thus addressing demand across a range of sectors or industries like transport, energy, and healthcare. Moreover, as production systems proceed towards decentralised systems, dependencies as well as transport costs are reduced, which lowers carbon footprints or emissions, resulting in more sustainable manufacturing as a whole. Less material waste and energy consumption align with the aim of green production and the prospect of integrating additive manufacturing into a smart manufacturing set-up that promotes overall efficiency and innovation.
To accomplish all the above, it is important to describe the material properties and acquire first principles by testing the material. It is important to evaluate these material properties for many applications, such as additive manufacturing. The accurate measurement of material properties is essential while optimising and validating these advanced manufacturing processes. It is important to understand a number of mechanical properties such as Young’s modulus, yield strength, stress–strain curves and flow behaviour to understand material performance. The Gleeble 3800 hot deformation simulator is used to assess some of these properties quickly, which is important for many applications, including additive manufacturing [
4]. The Gleeble hot deformation simulator is state-of-the-art and is ideal to accurately characterise material behaviour during a variety of thermal and mechanical conditions. The benefits of coupling the Gleeble for understanding the properties of additive-manufactured billets will be expanded. In addition, a small sample size permits a preliminary test to acquire the material properties of materials in a very rapid time frame [
5]. It allows for compressive and tensile experiments [
6]. The combination of manufacturing and testing allows us to optimise the printing parameters for improved performance and quality assurance. One of the most important engineering metrics is the understanding of the stress–strain behaviour of deformation, which, e.g., gives us insight into material mechanical behaviour [
7]. It is generally important to consider many operational factors during testing, such as thermal gradient and friction between samples and dies, etc. [
8]. The goal is to eliminate outside operational factors during testing.
Moreover, a finite element (FE) model was built in Abaqus 2022 to represent the test conditions accurately and provide additional understanding of the test procedure and friction conditions. The material data included elastic modulus, yield strength, Poisson’s ratio, raw temperature-dependent stress–strain characteristics and more [
9]. All of the boundary conditions correspond with the experiments to allow a direct comparison between the experimental and simulation results.
The material investigated here is the aluminium alloy A20X [
10,
11,
12,
13,
14,
15]. This recent work on A20X shows that heat treatment and direct ageing tailor precipitation and microstructure, improving local and global mechanical performance while influencing corrosion behaviour. Single-track modelling/experiments clarify melt-pool dynamics and defect formation, strengthening process–structure links and guiding parameter selection. Friction stir welding studies demonstrate viable joining of AM A20X with competitive properties, expanding application pathways for structural components. In an ideal world, cylindrical samples would deform uniformly throughout the period of compression testing. However, during any actual experimental testing of various alloys, especially A20X, it is clear from the load–displacement curve that there is non-homogeneous deformation in the barrel-shaped samples [
16]. To better understand the barrel-shaped samples and also to impact the experimental results, mathematical and numerical models are required to correct the measurements [
17]. The aim of this study is to use an approach to correct the stress–strain data in order to develop valid flow curves. In the literature [
18,
19,
20,
21,
22,
23,
24,
25], mathematical models are developed and described in order to correct the flow curves. This model was used in this work, and the model was executed using automated Python 3.11 scripts. In addition to the mathematical correction, the FE model that was created in this study was used to help validate and compare the experimental data.
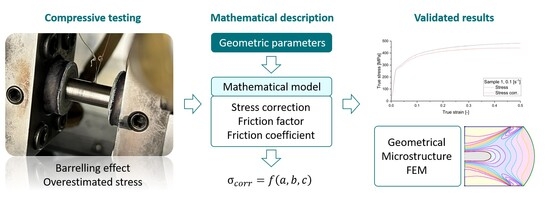
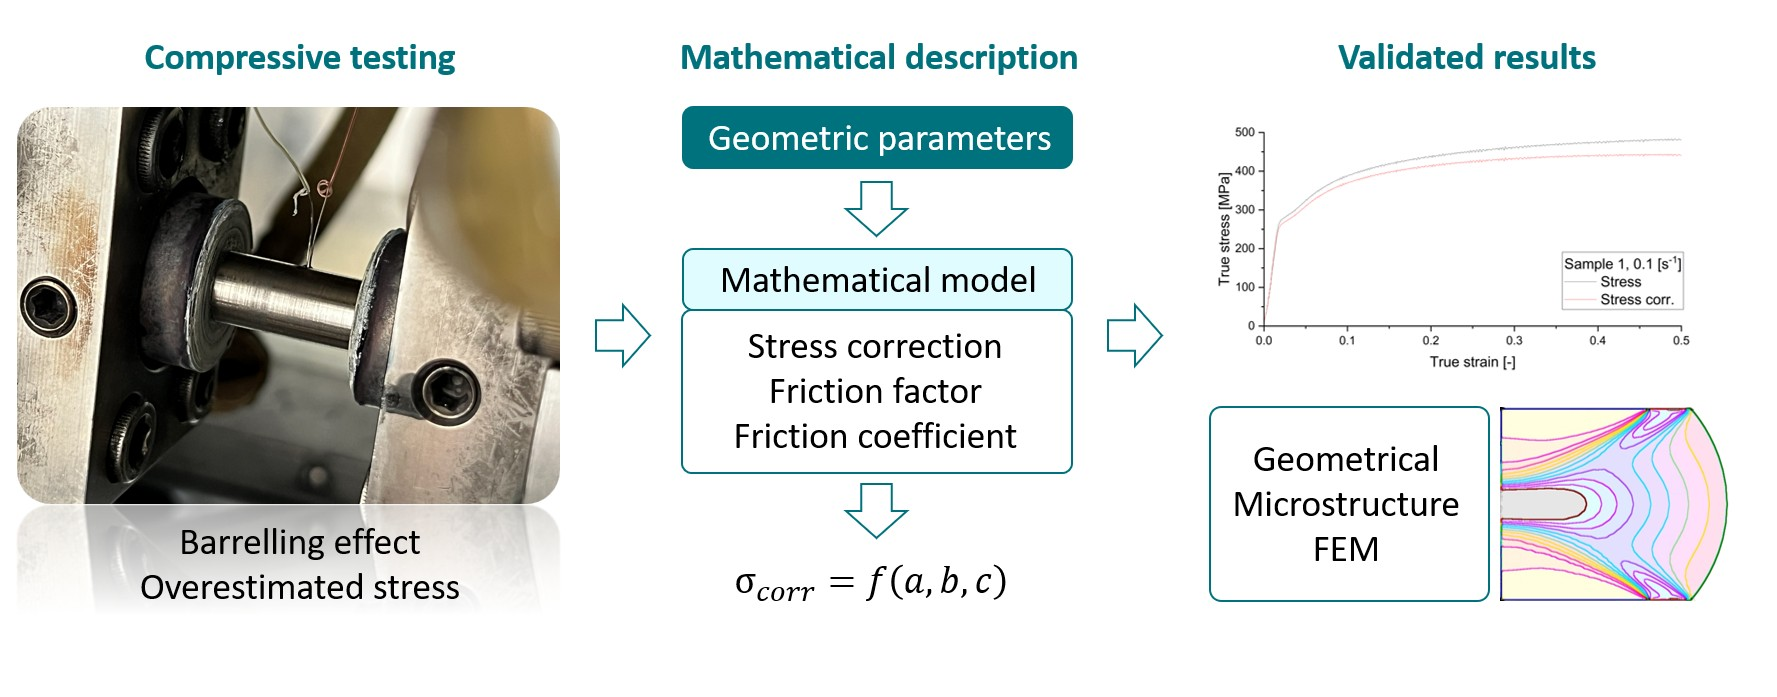
Together, the mathematical correction and calibrated 2D FE modelling reliably captured barrelling and friction effects, yielding significantly reduced (and thus more accurate) stresses and robust predictions of plastic strain and deformation. Efficient extraction of the friction coefficient and strong agreement with microstructural observations further validate the approach, supporting its use for trustworthy flow curve derivation and deformation analysis.
2. Materials and Methods
2.1. Material—Aluminium Alloy A20X
A205 (gas-atomised powder) is a lightweight, high-strength aluminium alloy powder derived from the aerospace-approved A20X alloy. Developed for additive manufacturing, it exhibits a unique solidification behaviour under the high cooling rates of laser powder bed fusion (LPBF), producing high-density, crack-free, non-dendritic microstructures. The powder is compatible with leading LPBF systems, is suitable for trials with blown powder deposition equipment, and has received approvals for use in aerospace, with applications also in the space, defence, and high-end automotive sectors. LPBF components achieve densities greater than 99.7% without hot isostatic pressing (HIP), and the alloy’s bulk density is 2.85 g/cm3.
ECKART supplies A205 with a particle size distribution tailored for powder bed fusion, typically with D10 = 20 μm and D90 = 63 μm [
26].
The composition conforms to AMS 4471 and is determined by ASTM E34 (wet chemical) and ASTM E1251 (spectrochemical) methods, see
Table 1.
Room-temperature tensile properties were measured according to ASTM B557 on machined test bars, with no HIP treatment. In the as-built condition, the ultimate tensile strength (UTS) was 357–394 MPa, the yield stress was 350–385 MPa, the elongation was 12–15%, and Young’s modulus was 74 GPa. With a proprietary heat treatment (T7, solution, quench, precipitation hardening), a maximum UTS of 511 MPa can be reached.
2.2. Testing Methods of Friction
To determine friction, the sample geometry has a significant influence on the findings. Common methods are compression tests conducted on cylindrical samples or on rings. For compression, the sample is placed between two parallel dies and compressed to a specific degree. A comparison is found in
Table 2. For our purposes, cylindrical samples were used due to the space in the forming machine. For more information, the interested reader is further referred to [
27,
28].
The Gleeble 3800 hot forming simulator at the chair of metal forming was prepared with the wedge module to determine material properties in the compressive regime. This module can simulate forging processes and determine recrystallisation behaviour and compressive material data.
Compressive forming operations require material properties in this domain. The advantage of the compression test is its ability to achieve a much larger degree of deformation compared to tensile testing. This allows for the determination of flow curves and material parameters in a larger domain. Each specific testing schedule will depend on material properties, testing temperature and specific experimental conditions. Some materials will have a very limited level of plastic deformation under compression and specific conditions. If the conditions are correct, materials can be deformed considerably beyond yield before failure within the correct testing domain. This demonstrates the importance of the correct material testing procedures and subsequently determining the correct parameters. It must also be emphasised that understanding these factors will be necessary in determining the material’s mechanical response during testing. A cylindrical sample is used for compression tests in a standard way. However, at higher levels of deformation, the likelihood of error increases; therefore, the goals should be to minimise error wherever possible.
The cylindrical samples for testing had a diameter of 10 mm and a height of 15 mm. This diameter-to-height ratio is needed to prevent the sample from buckling during testing. The samples were loaded horizontally into the testing machine and subjected to resistance heating, while one thermocouple (type K) was positioned at the centre of each sample to control and monitor the temperature. The attached thermocouple also ensures controlled heating.
The samples were tested at different global strain rates (
) of 0.1 s
−1, 1.0 s
−1, and 10.0 s
−1 and at room temperature (25 °C).
Table 3 shows the sample measures and the corresponding strain rate.
2.3. Barrelling Correction
A common problem observed during compression testing is friction. As a first measure, it is important to ensure that the samples are compressed between flat and parallel dies with minimal friction. Different solutions are possible to minimise friction between clamps and samples. Before each experiment, the tungsten carbide clamps are prepared to have an even and flat surface. Nickel paste is applied to the clamps, and a graphite sheet is glued on top. This stack-up on each clamp helps reduce friction as much as possible. This ensures optimal contact, reducing thermal and mechanical resistance that could otherwise affect the experimental outcomes. The graphite could be substituted with tantalum sheets when needed, which tends to lead to a different temperature gradient for higher-temperature tests.
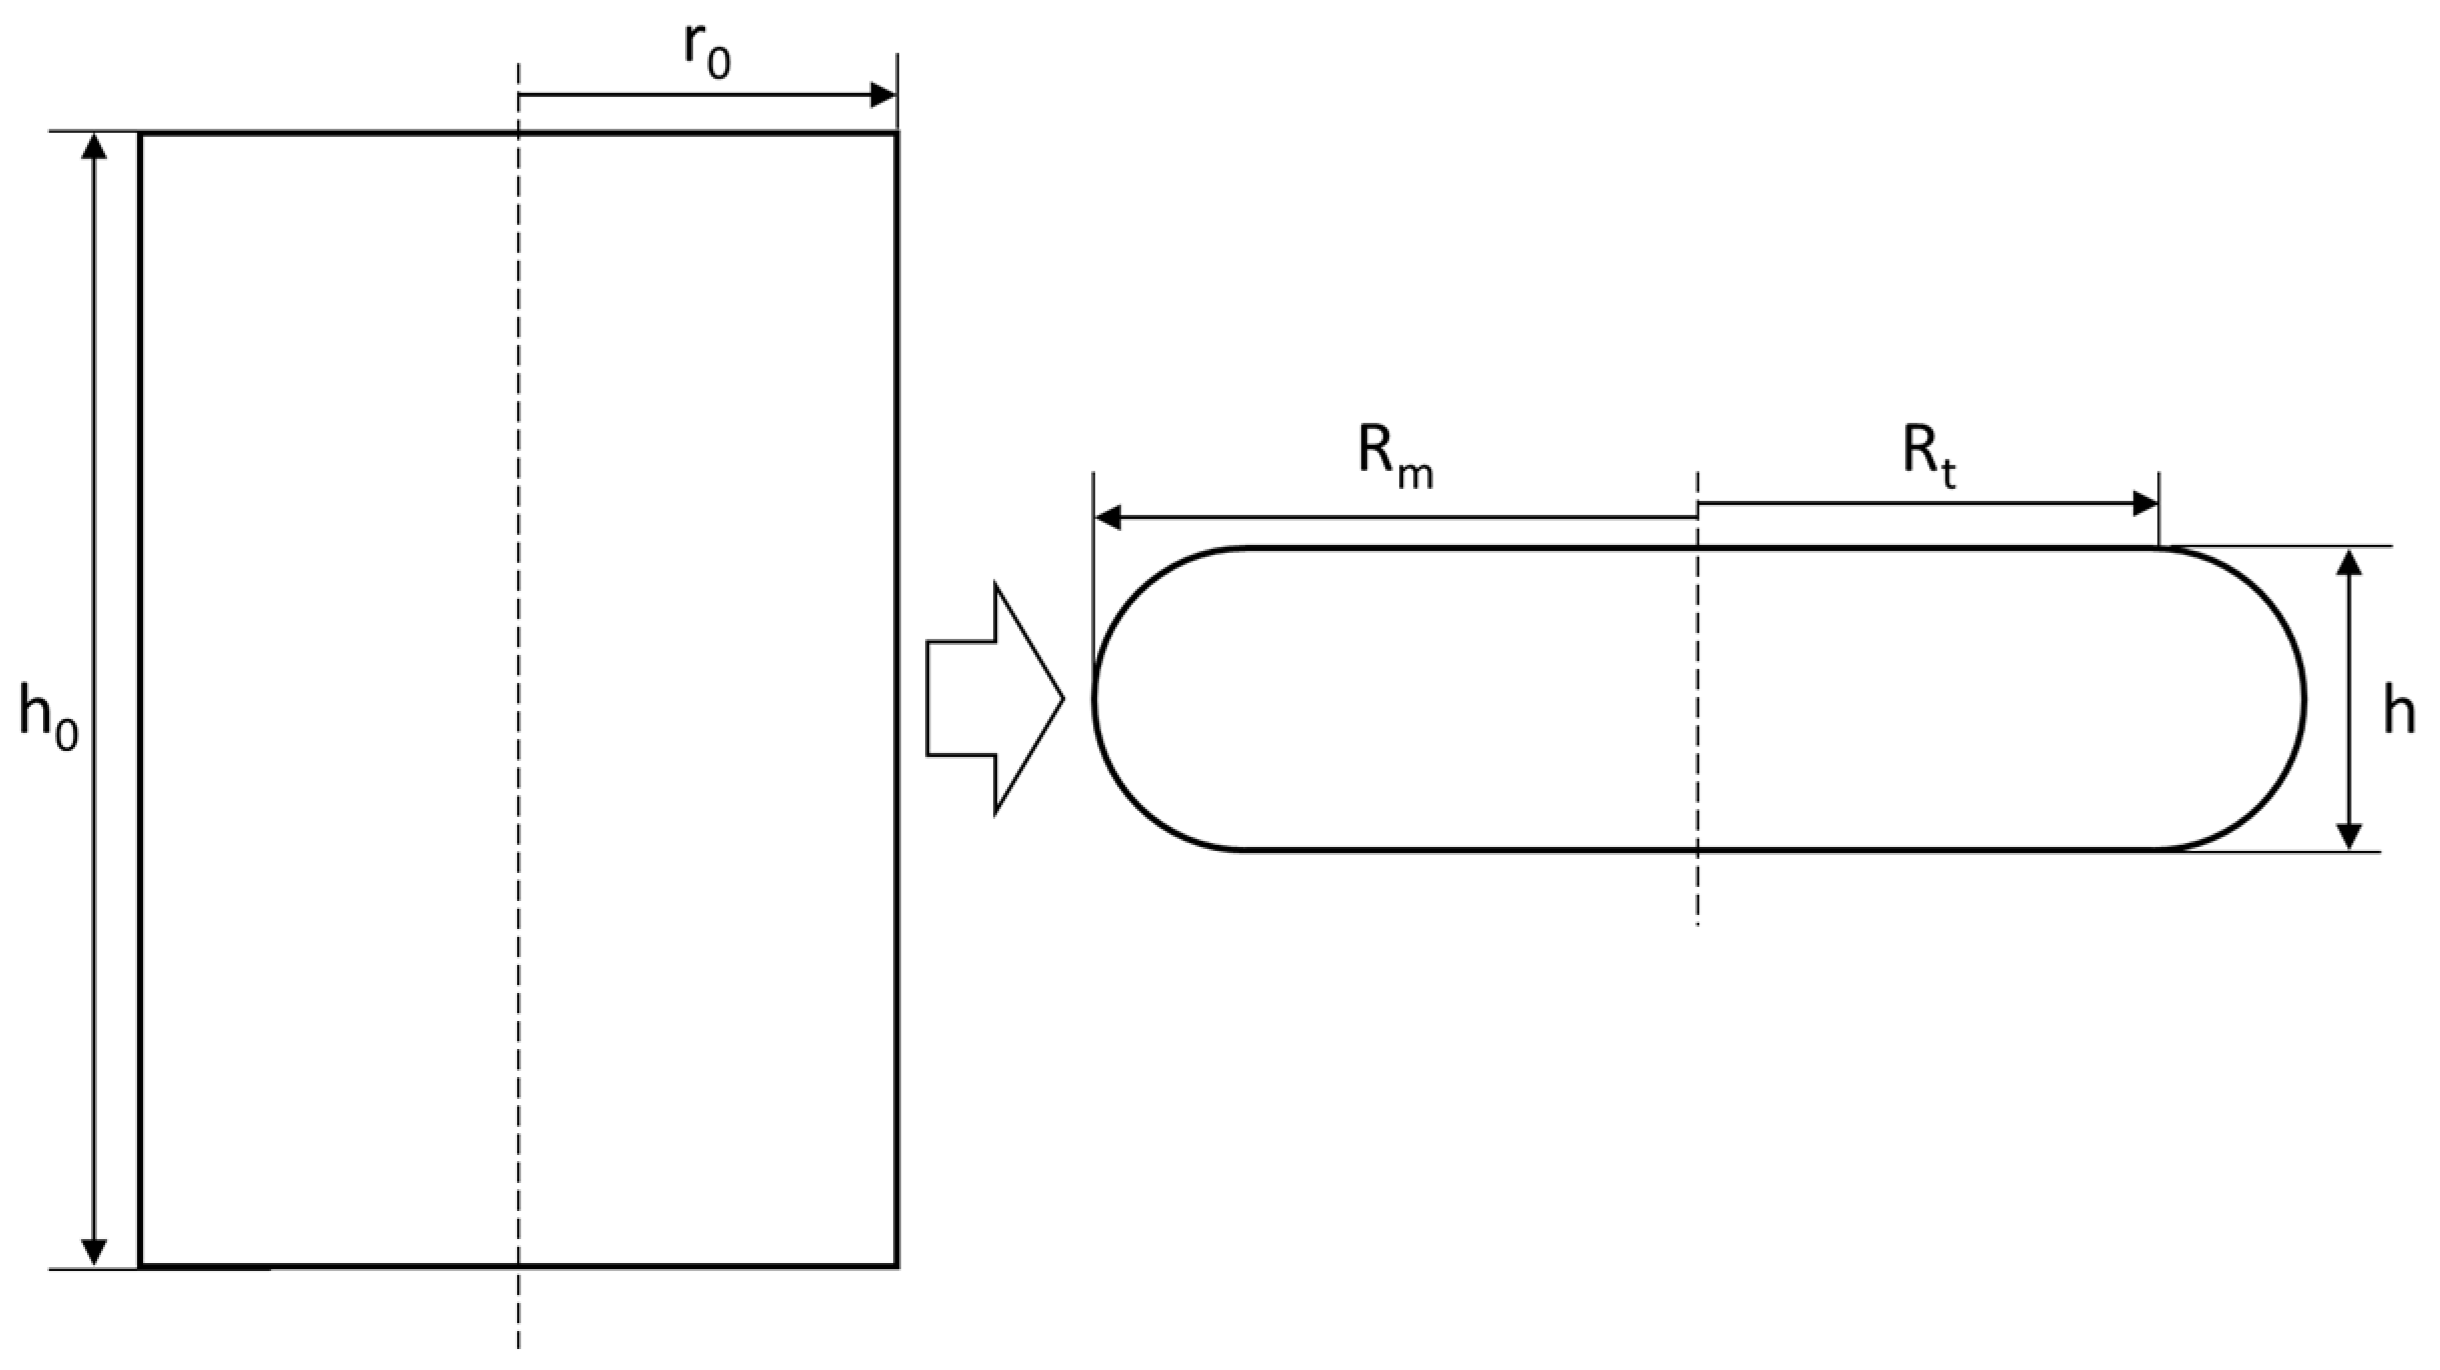
Figure 1 illustrates a schematic representation of the sample before and after the test. The measures are needed for the correction of the stress–strain curves.
The following equations show how several researchers adopted equations to describe the correct flow stress [
19,
25,
30,
31]. Collectively, these works demonstrate that reliable constitutive modelling of metallic alloys under compression depends on accurate flow curve correction (including friction effects) and robust parameter identification from isothermal tests, as shown for Ti-6Al-4V, AZ31 Mg, and Al–6%Mg. Together with improved friction evaluation methods, they provide transferable frameworks for capturing strain rate and temperature sensitivities, enabling more predictive descriptions of hot and warm flow behaviour across alloys. In bulk cylindrical compression, the run parameter b quantifies barrelling in the assumed velocity/shape field: b = 0 denotes uniform parallel-sided deformation, and larger b indicates greater sidewall bulging. This parameter is obtained by fitting the model to the deformed geometry and is test-specific rather than a material constant. The friction factor m is the ratio of interface shear stress to the material’s shear yield strength, ranging from 0 (frictionless) to 1 (sticking). Compared with the Coulomb coefficient of friction, m increases with the coefficient of friction and local contact pressure and decreases with material shear strength, so there is no universal one-to-one conversion between m and the Coulomb coefficient.
Ra, shown in Equation (1), describes the theoretical radius with the initial radius r
0, the initial height h
0 and the end height h.
The radius R
t, found at the contact surface, additionally depends on the maximum radius R
m of the final sample geometry; see Equation (2).
The run parameter b can be calculated using Equation (3), which takes into account the two radii R
a and R
t derived from Equations (1) and (2), as well as the heights of the samples before and after the compression test.
Furthermore, Equation (4) describes the determination of the friction factor m [
30], calculated according to the barrelling.
For the final calculation, the corrected strain
, as seen in Equation (5), has to be derived from the height difference.
The following equation (Equation (6)) illustrates the adjusted flow stress
, which is dependent on the previous equations.
describes the measured flow stress.
2.4. Finite Element Modelling
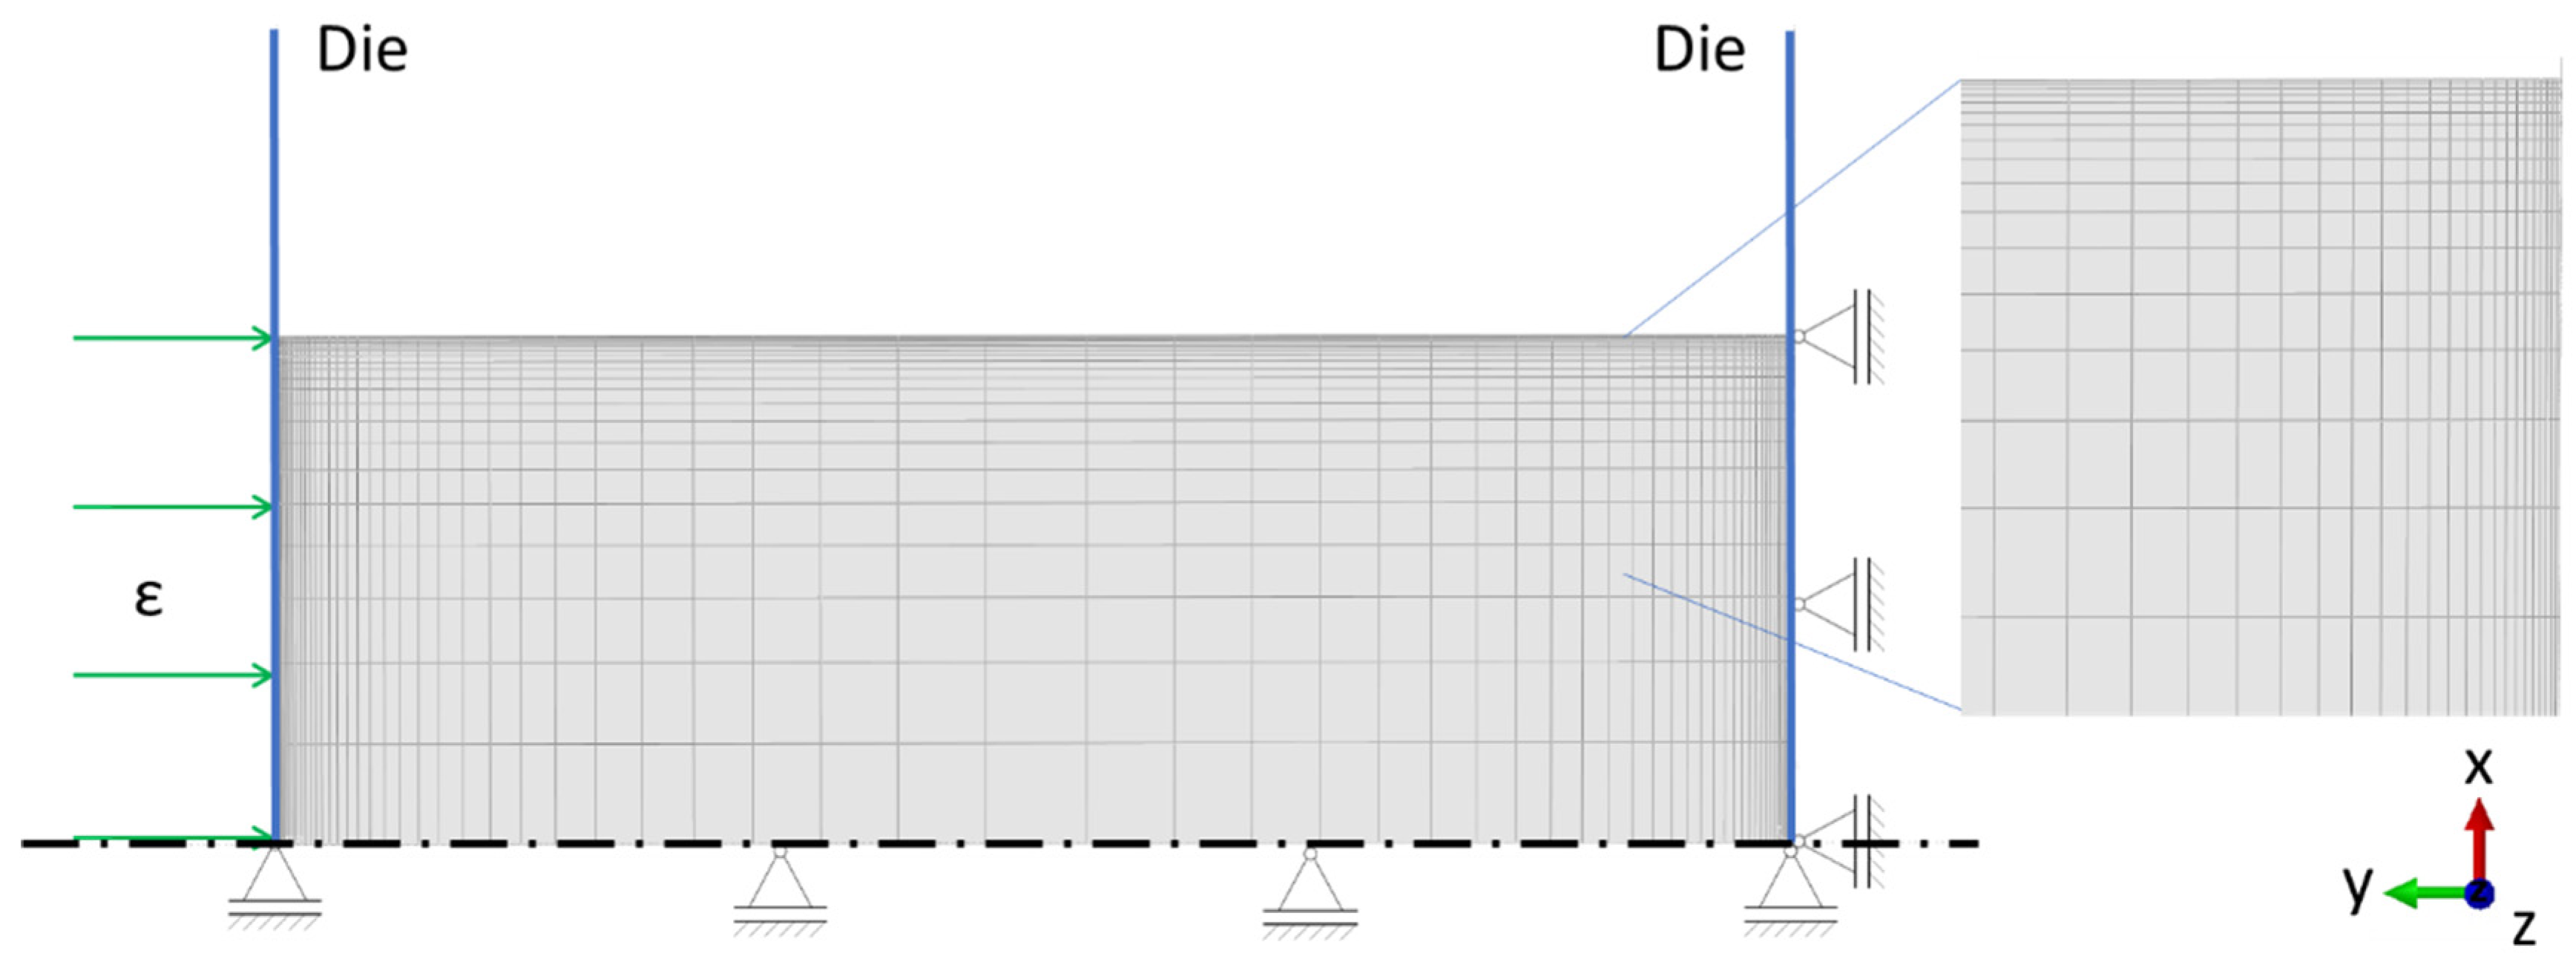
Finite element (FE) modelling is used to simulate the material behaviour and validate experimental results. Abaqus/CAE 2022 is used for the FE simulations in this study. The FE model is schematically shown in
Figure 2. It was built up as a 2D model while applying symmetry. The tungsten carbide dies are idealised as rigid parts that help create the boundary conditions. As a sample, a deformable body is modelled that is clamped between the dies. The symmetry line also lies on the y-axis.
Different boundary conditions must be applied to have a working model. As seen in
Figure 2, the right die is fixed in the y-direction, while the left die can move in the y-direction. To prevent the rotation of the dies, reference points are defined according to boundary conditions. The symmetry line of the model is fixed in the x-direction to prevent uncontrolled movement. For the whole sample, a starting temperature is applied with a predefined field.
Friction between the sample and the die is defined as tangential with an isotropic friction coefficient. The movement of the left die is simulated with a linear displacement, which depicts the corresponding strain rate of each experiment.
A 4-node axisymmetric thermally coupled quadrilateral, bilinear displacement and temperature element type, CAX4T, is chosen. The whole model consists of 1562 elements that are finer at the outer regions and coarser in the centre. The finer mesh leads to a good resolution in the necessary regions, while the coarser mesh in the centre helps reduce the calculation time.
Figure 2 shows the mesh and all relevant boundary conditions. With a fine meshed region, it is possible to depict the deformation in this region more realistically. During large deformations, the shell surface contacts the die.
The material data, as seen in
Table 4, is implemented partially temperature-dependent for possible future evaluations. Note that the SI-unit system is applied, with mm, to, and K. Thermal conductivity and specific heat will be needed for future models, where a description of the thermal gradient can be investigated. Other quantities like density, Poisson ratio, Young’s modulus and flow stress are necessary for building a consistent model. A20X is modelled with linear elasticity (E and ν) and von Mises plasticity with associated flow and isotropic hardening. The hardening is provided in tabulated form from the barrelling- and friction-corrected true stress-true plastic strain curves, with separate tables for each nominal strain rate (0.1, 1.0, 10 s
−1). The calibration window spans the full experimental strain range; curves are smoothed to ensure monotonic hardening. No damage or thermal softening is used for the room-temperature cases.
As for friction, a tangential behaviour is defined as a contact property. Friction is formulated with the penalty method, while the directionality is isotropic. The friction coefficient is varied for the corresponding models. To scope the Rt/Rm-μ mapping and local strain fields, we employed a surrogate aluminium plasticity in Abaqus. This surrogate was used solely for geometry/friction identification and strain visualisation at room temperature; it was not used for force calibration or for generating the reported A20X flow curves. A sensitivity check revealed a weak dependence of the Rt/Rm-µ trend on the precise hardening within this range. All constitutive results for A20X (flow curves, comparisons) are based on the barrelling-/friction-corrected experimental data.
The constitutive response sets the contact pressure and thus the degree of barrelling and the friction inferred from geometry. Higher flow stress/stronger hardening increases bulging (lower Rt/Rm) and raises the friction estimates; softer or saturating hardening has the opposite effect. Rate sensitivity, if ignored, biases Rt/Rm at higher strain rates and inflates the apparent friction. While isotropic von Mises is adequate here, significant LPBF-induced anisotropy would alter lateral flow and shift the Rt/Rm–μ mapping. A brief sensitivity check (±10% hardening) changed Rt/Rm by ~1–3% and the inferred μ by ~0.01–0.03, indicating that the FE-assisted identification is robust within typical calibration uncertainty.
3. Results
Friction shows a significant impact on the deformation of the sample. To systematically investigate the shape of the final sample, the friction coefficient between the sample and the clamps is iteratively changed for the FE model. Due to the different coefficients, the barrelling of the samples varies.
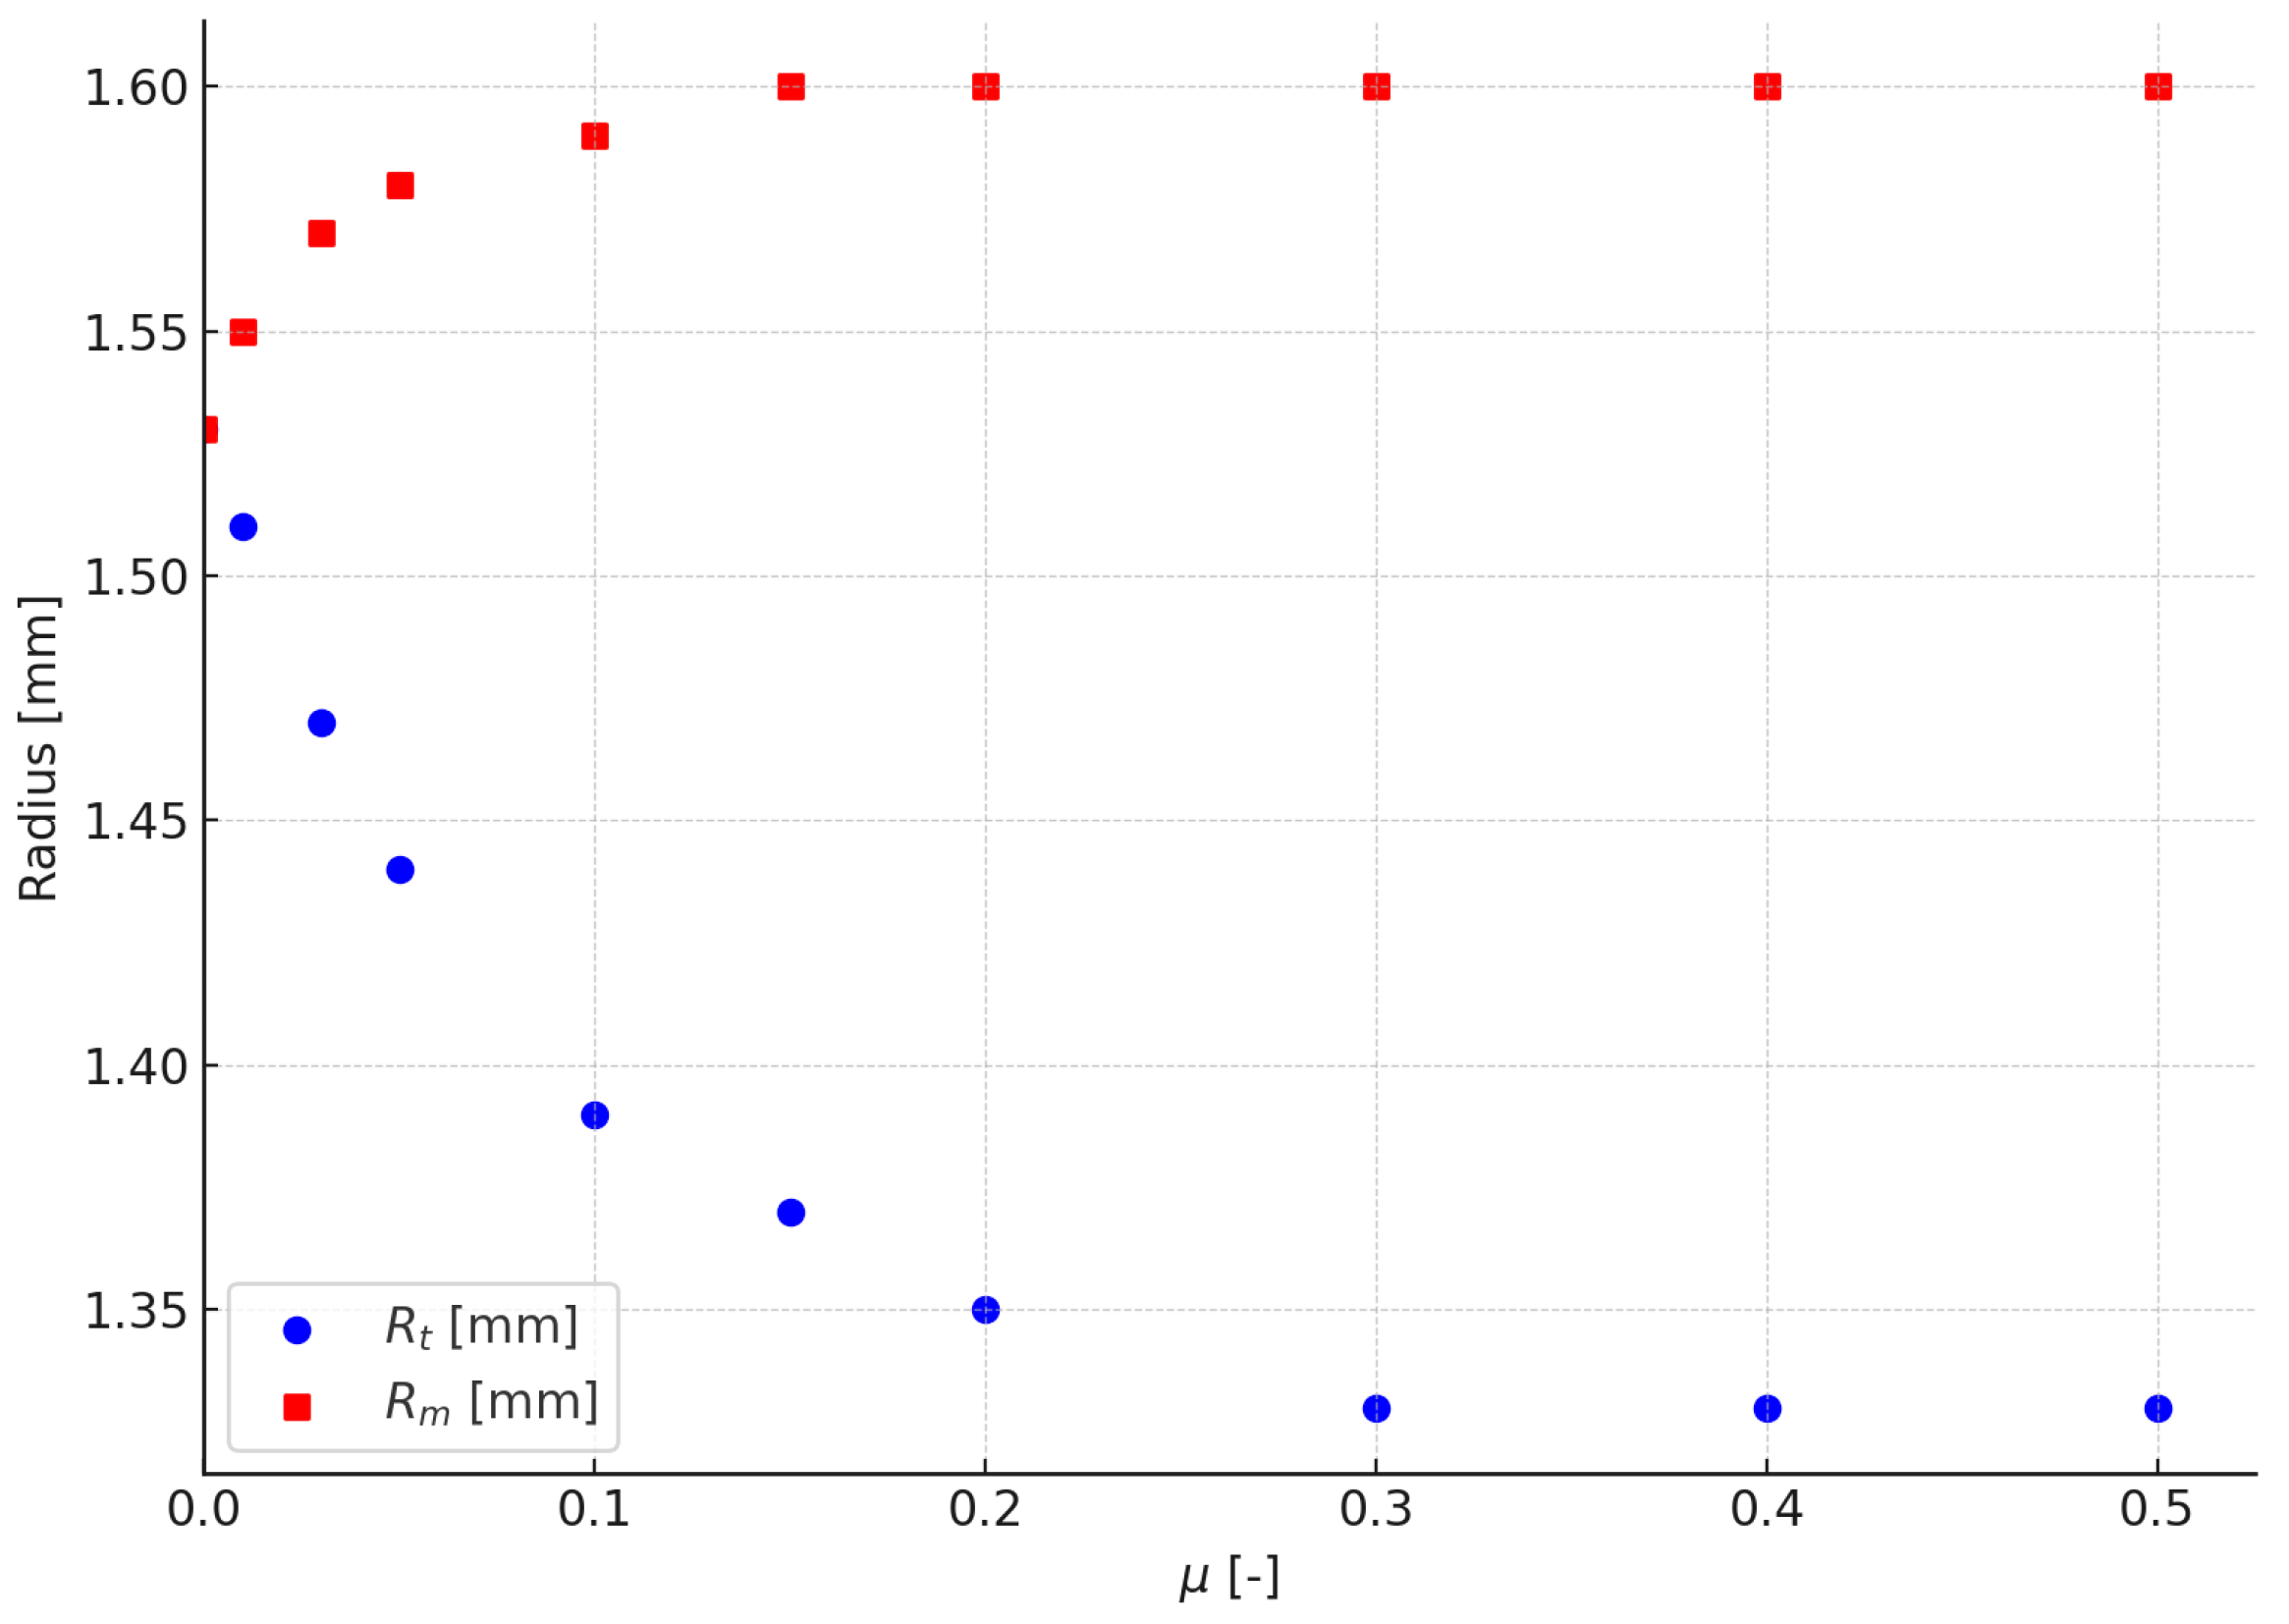
Figure 3 shows this influence on the related radii, while Rt describes the radius at the top/front and Rm at the centre of the sample. Rt decreases until a friction coefficient of about 0.4, due to the friction between clamps and samples, leading to deformation resistance. The centre radius, Rm, rises to a friction coefficient of 0.15 due to the free deformation and stays nearly constant. With that information, it is possible to gain insights into the friction conditions during testing.
To simplify the data shown in
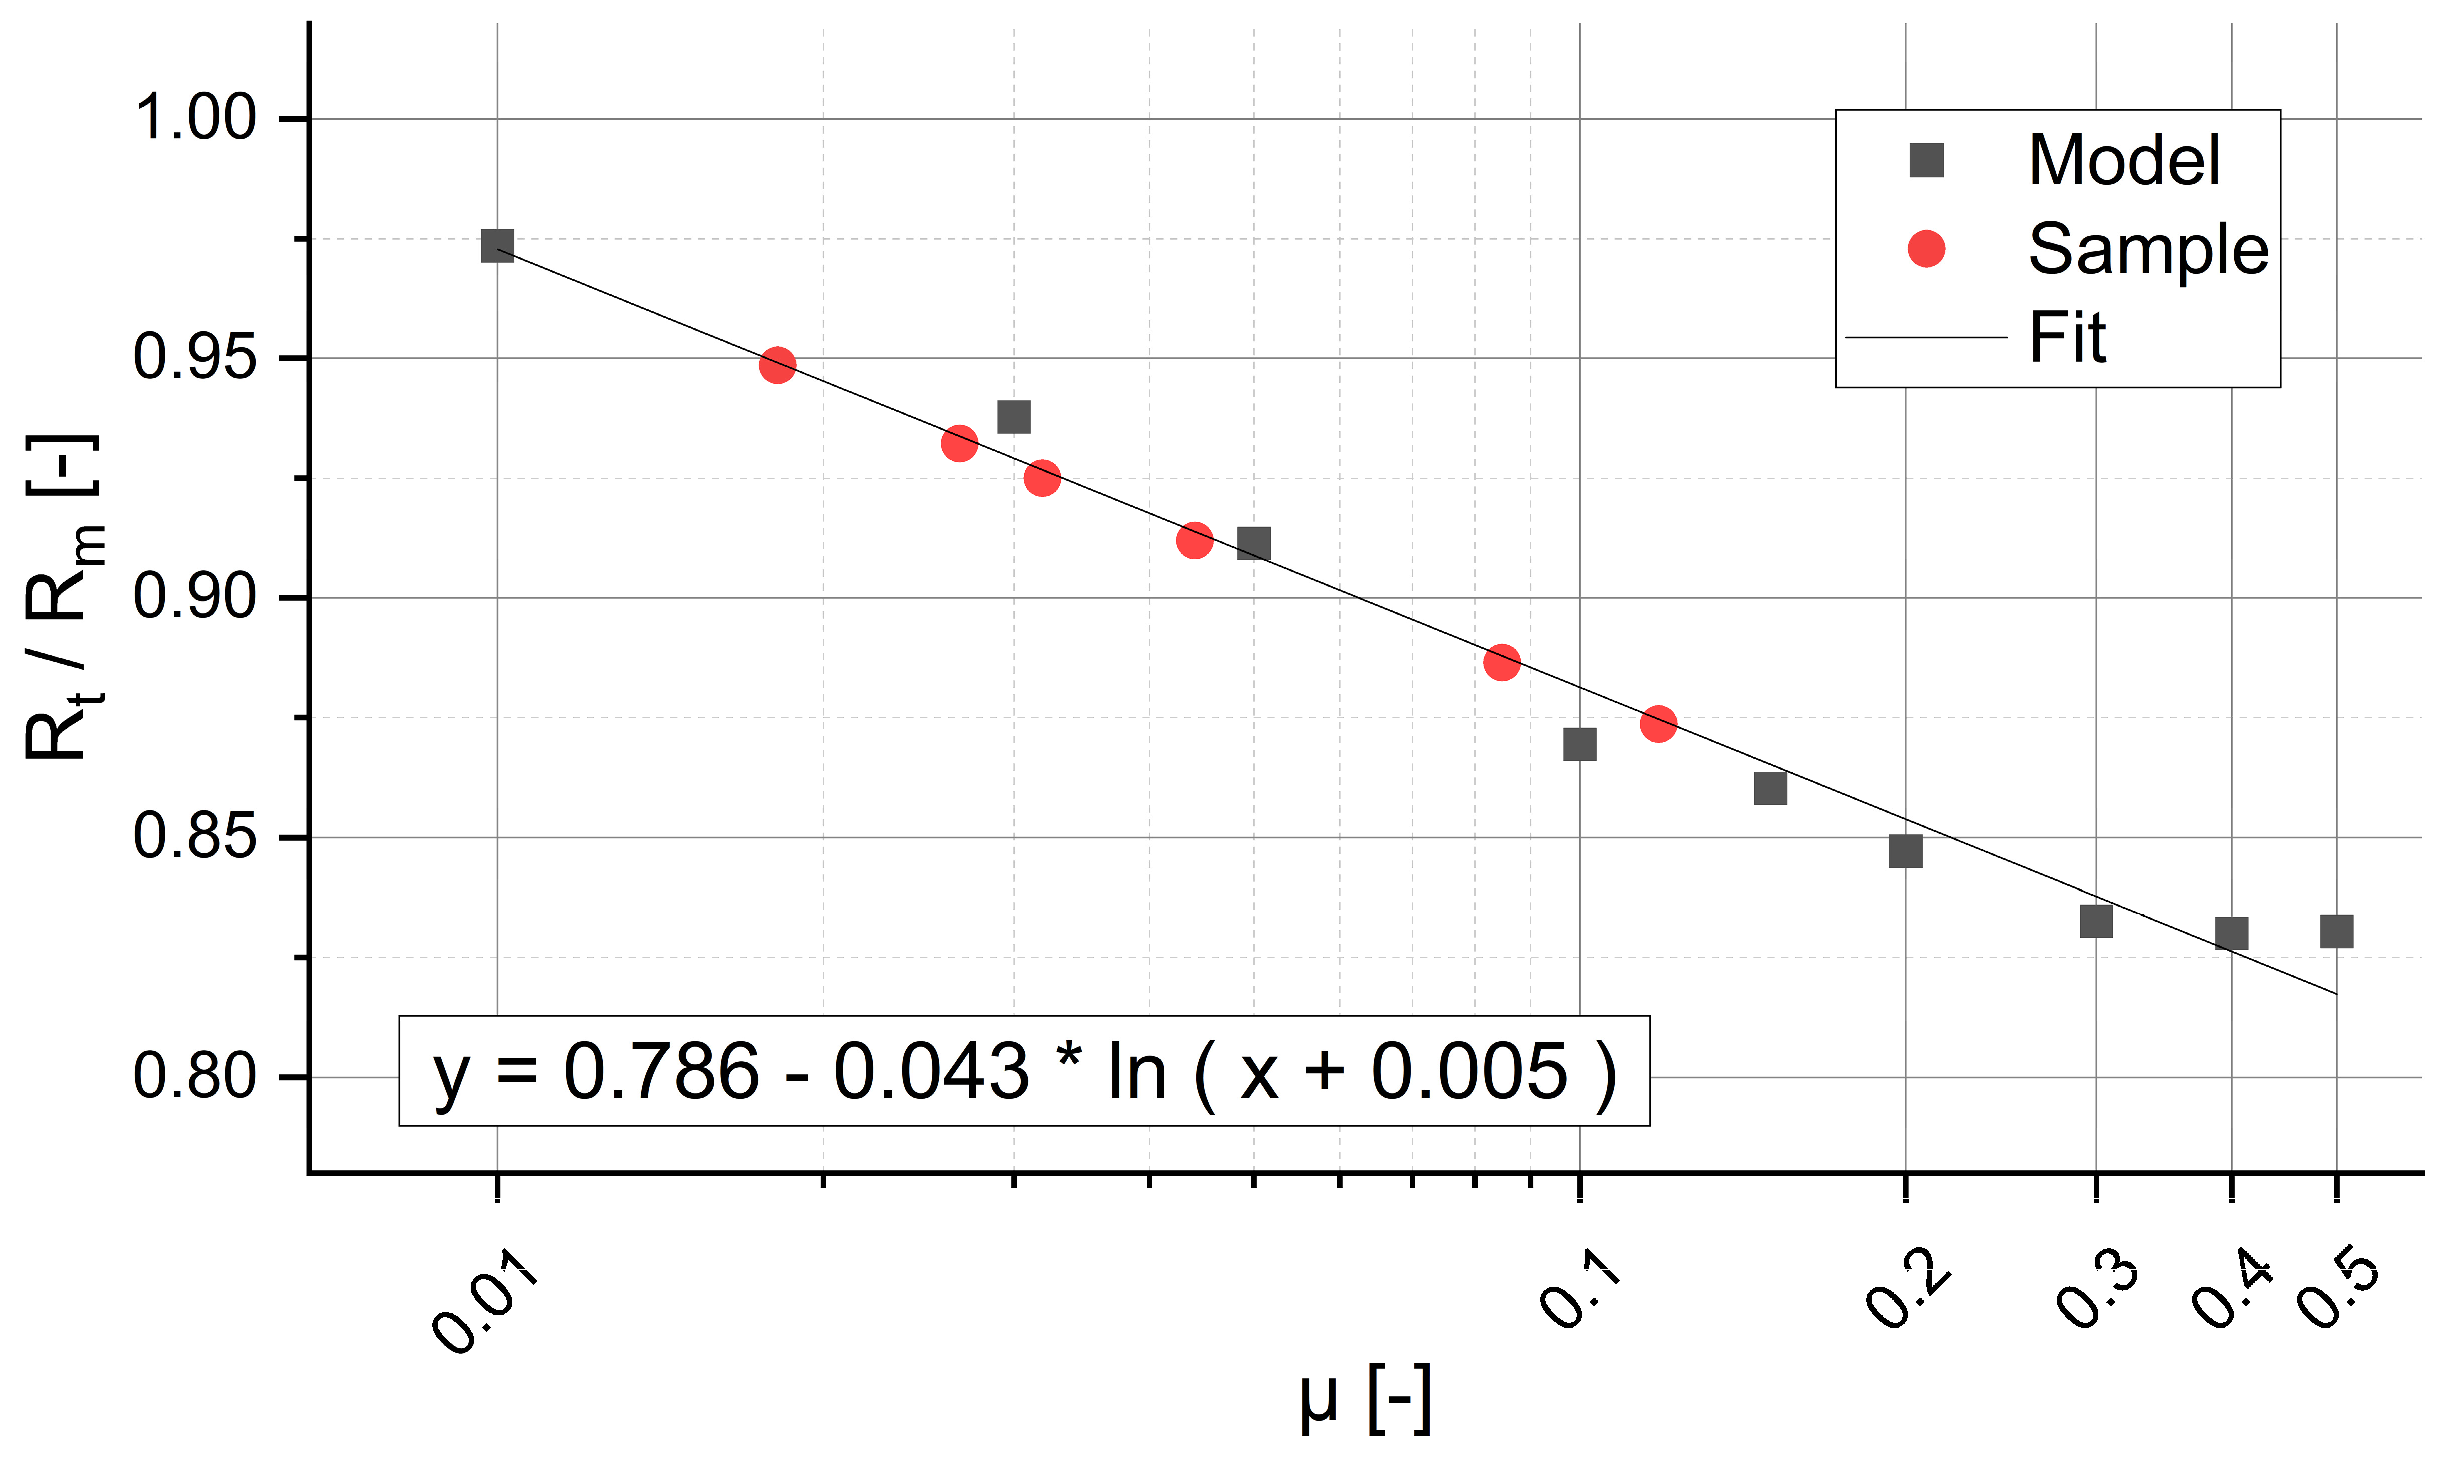
Figure 4, the quotient of Rt/Rm helps draw a quick conclusion and a relation to the friction coefficient. Plotting the result in a logarithmic plot, shown in
Figure 4, leads to a nearly straight line. The ratio of Rt to Rm lies well between 0.8 and 1.0, while a steady state for friction was found at around 0.5. The deviation of the values from the approximation line is calculated to be R
2 = 0.9767. Therefore, the coefficient of determination shows a good fit for the data and the trendline.
The trendline is described in Equation (7). For the end user, the diagram is helpful because it is simple to determine the relationship between the samples’ radii and find that the friction coefficient between the sample and dies can be assessed. This was carried out for six samples of A20X, shown with red circles. Friction varied for each sample in a range from 0.04 to 0.12.
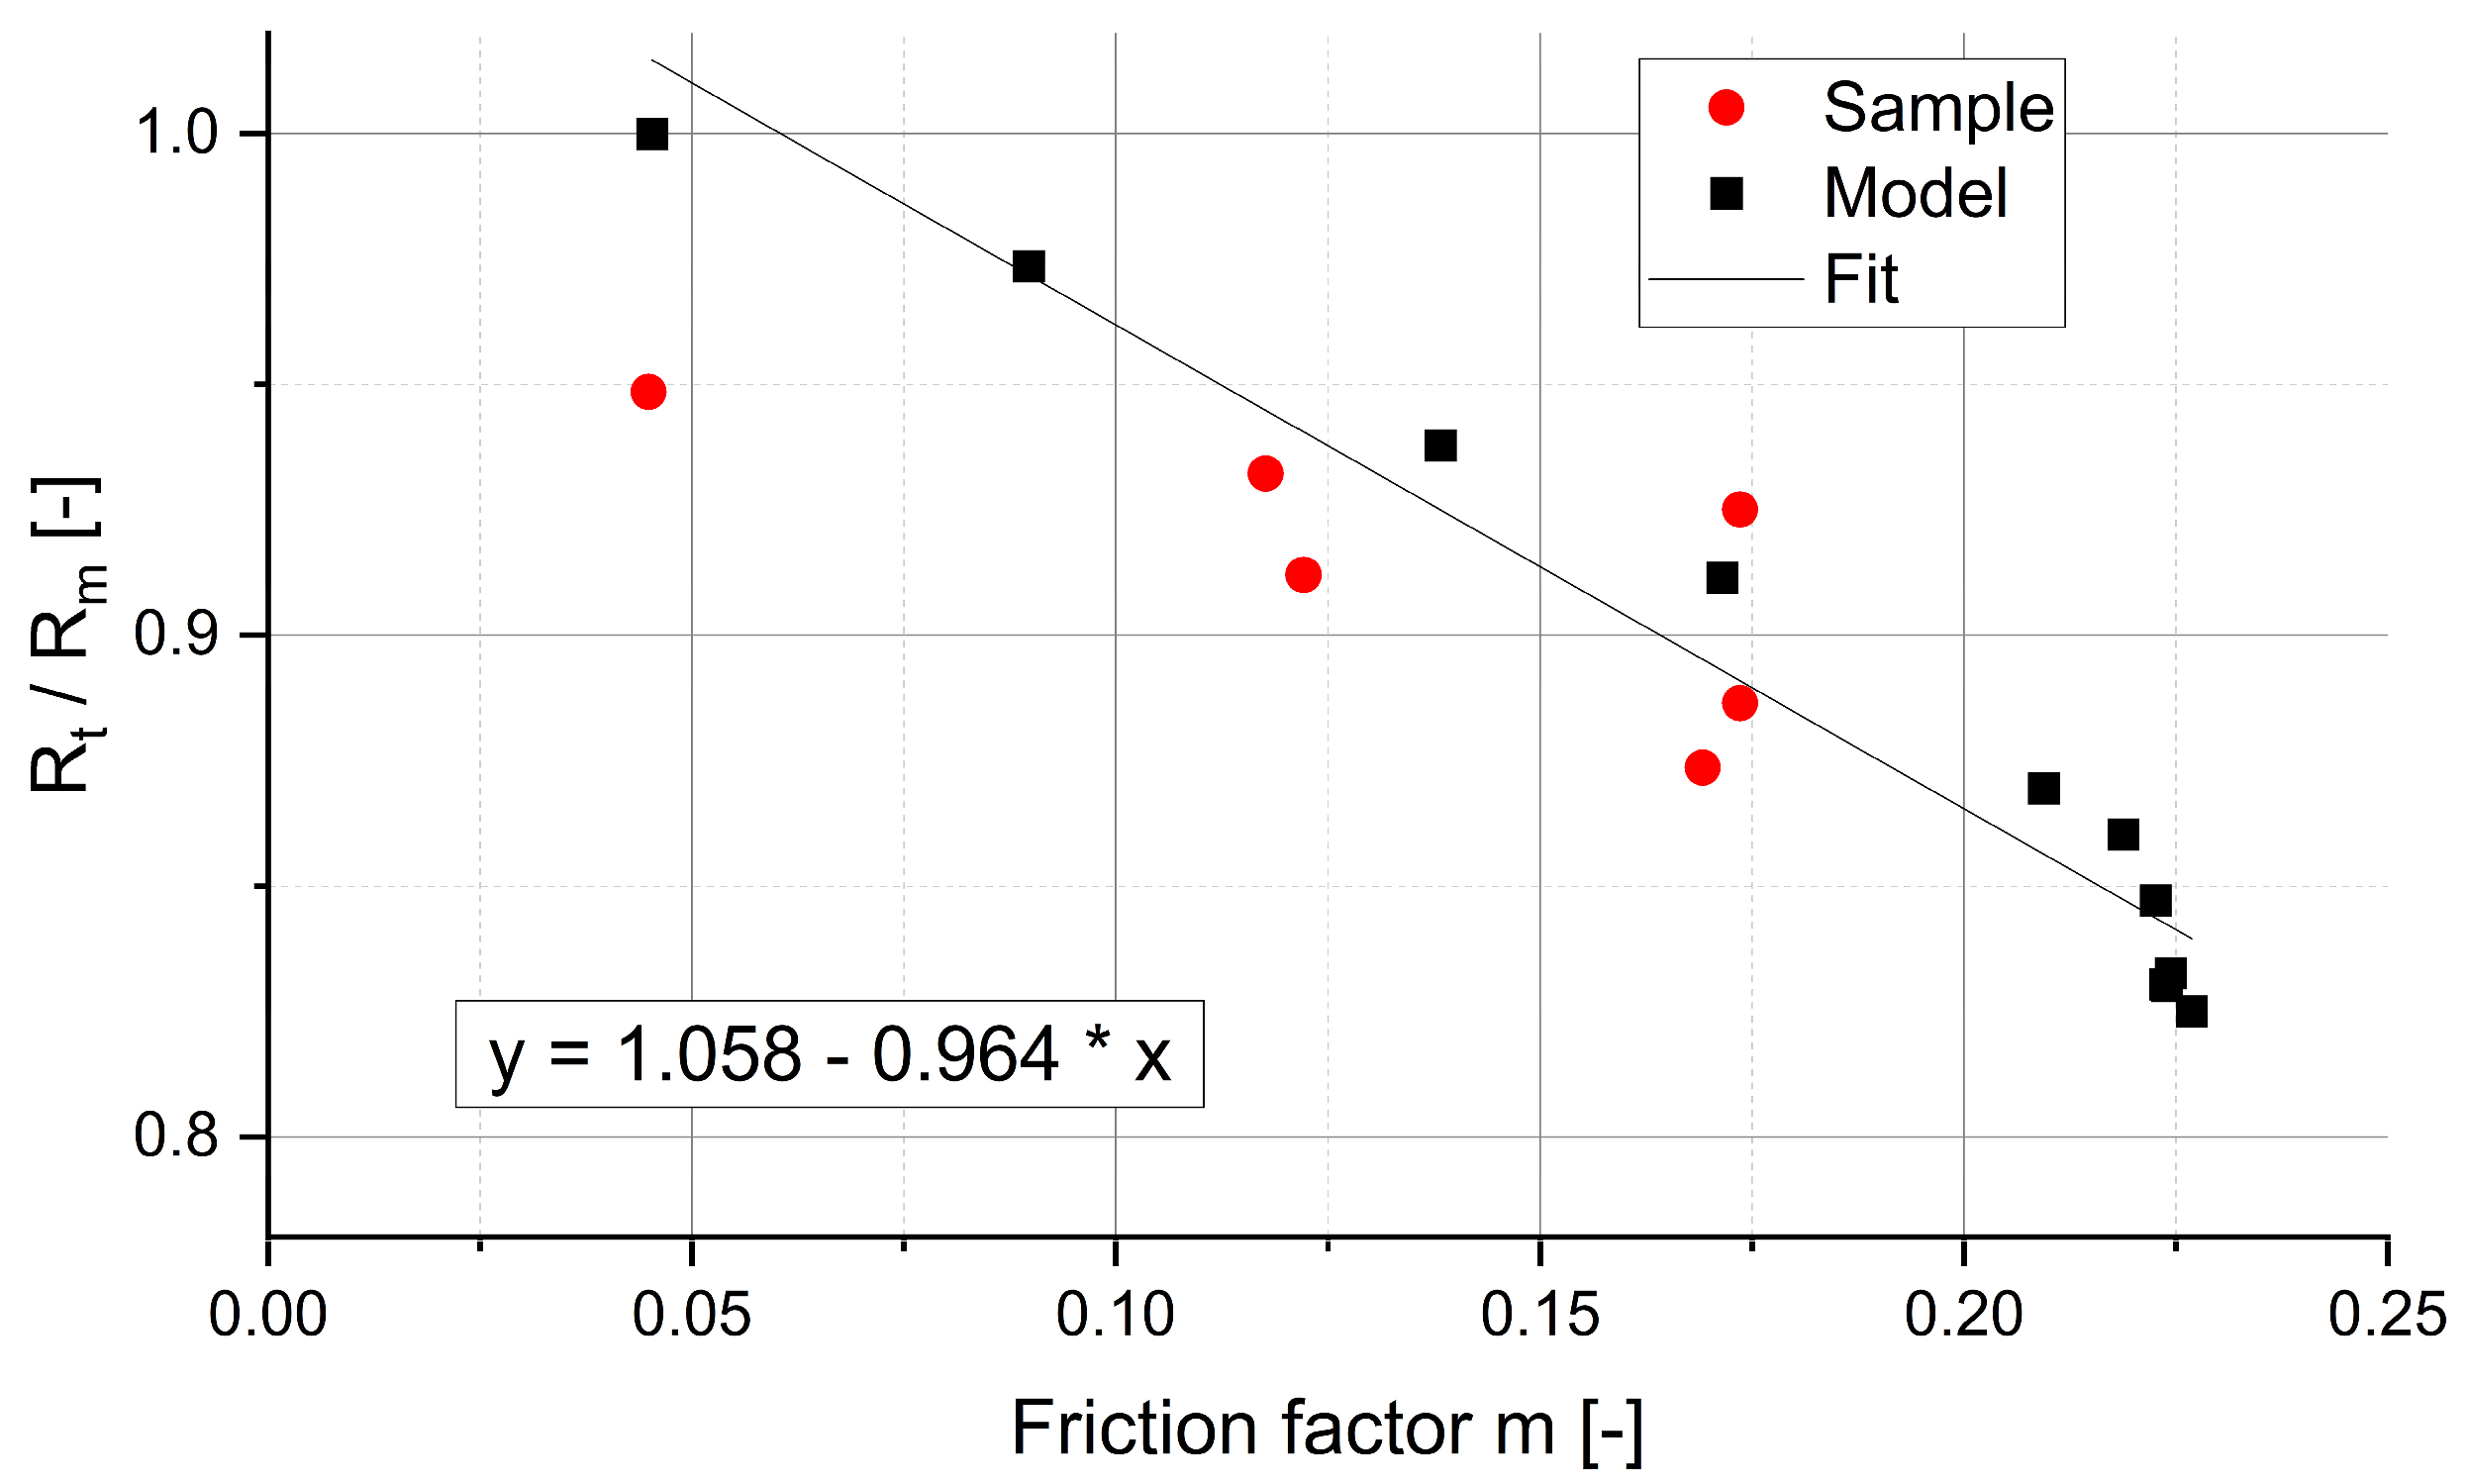
To validate the model, the friction factor m (Equation (4)) is calculated for the varied model and for all samples. When plotting the values from the model logarithmically, a nearly straight line (Equation (8)) is found; see the black squares and fitted line in
Figure 5.
The red circles indicate the friction factor values calculated for the samples and found within the model in black squares. They are in good agreement with the linear fit of the model. Due to the good correlation, the model is seen to be validated.
All results for the samples are found in
Table 5. The ratio Rt/Rm was calculated from the measured quantities of the samples, while the friction factor m was calculated from the mathematical description. For the friction coefficient µ, an inverse approach was necessary.
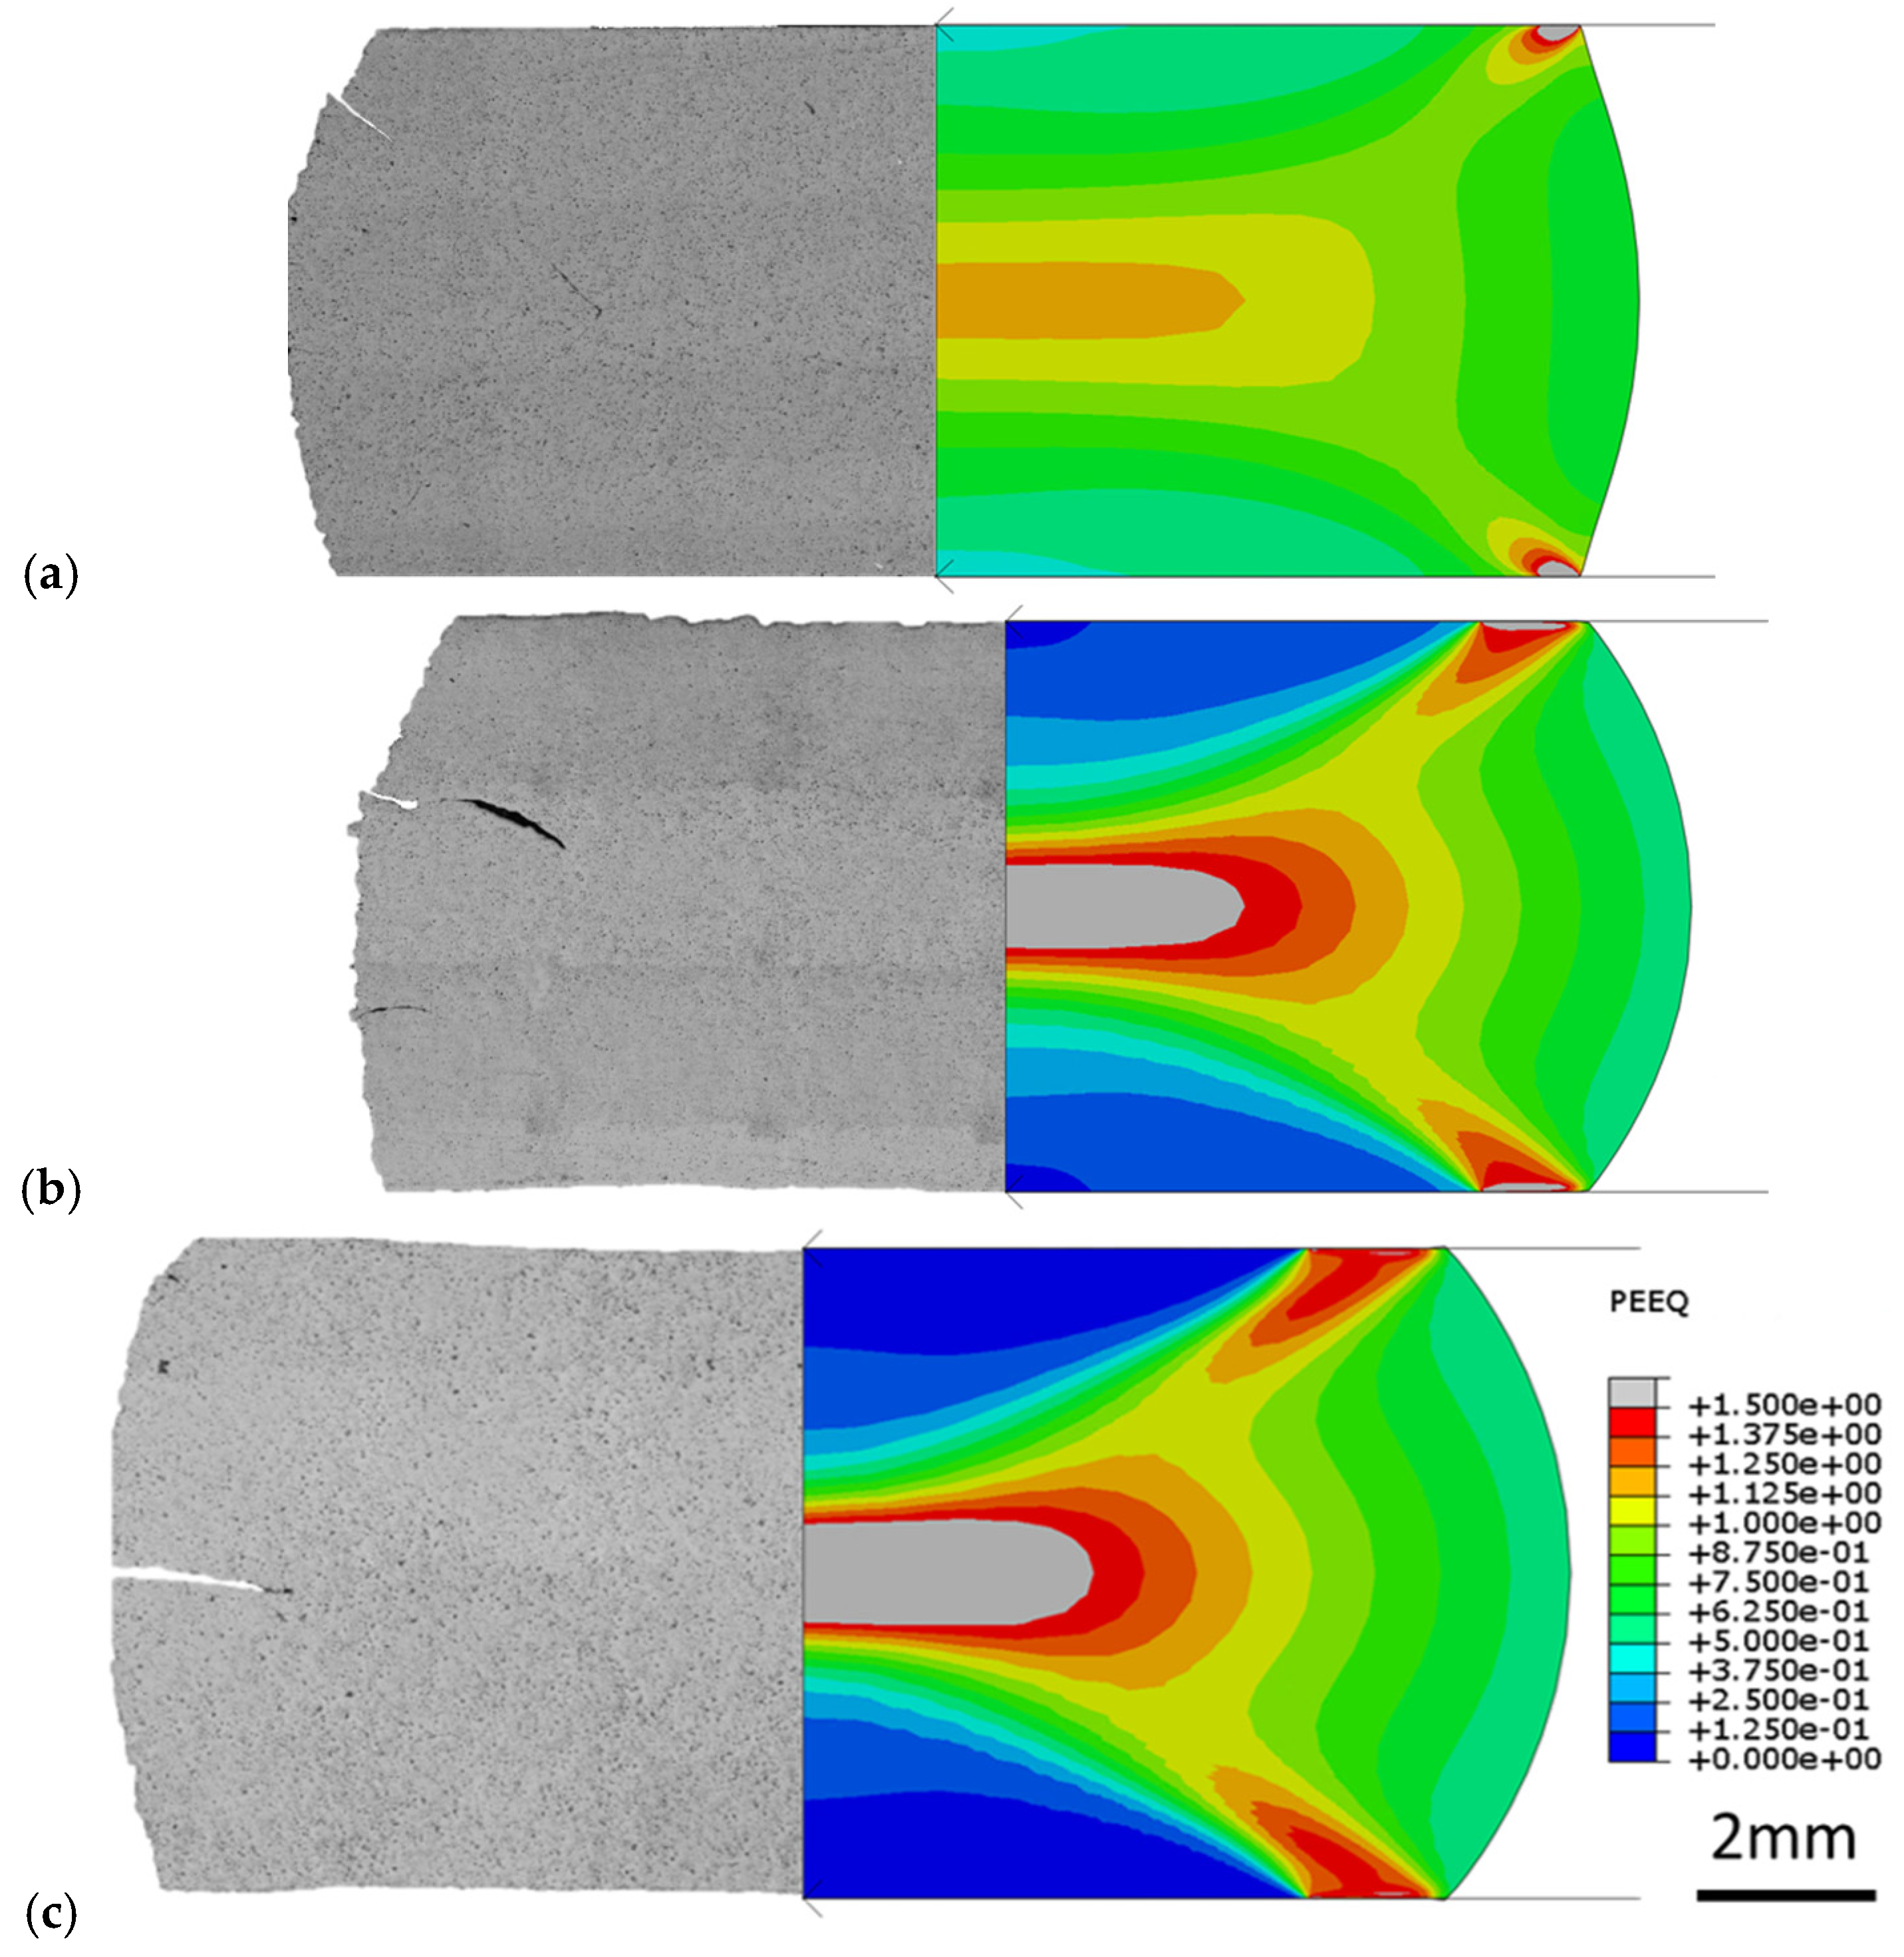
The FE model can be used to investigate different states that occur during deformation and would not be measurable during the testing. This leads to the possibility of gaining time-dependent information about the deformation behaviour, such as local strain, local strain rate and the barrelling effect. A further benefit is the possibility of correlating the experimental data with the model to gain clearer insights into the contact conditions, such as friction. Micrographs can be compared with the model output, which is shown in
Figure 6. Three different friction conditions are modelled due to the samples measuring the barrelling and according to
Figure 4. When applying the same friction on both clamps, a symmetrical local plastic strain is found in the model. Due to the friction conditions, the barrelling of the samples occurs, which matches the modelled results. The geometrical aspects in the micrographs and FE models are in good agreement. In
Figure 6a, the sample with the lowest friction of 4.49 × 10
−2 shows a rather homogeneous plastic strain (PEEQ) distribution. The lower the friction, the more homogeneous the stress distribution becomes. In (b), with a higher friction (1.22 × 10
−1), and in (c), with the highest friction, local plastic strain localises in the sample’s centre, while large regions with minor plastic deformation can be found. For higher friction, the barrelling effect becomes more pronounced.
Cracking during the room-temperature deformation of LPBF-fabricated A20X stems from the limited ductility of the as-built microstructure. The fine cellular solidification morphology, together with solute-enriched boundaries, yields high strength but poor cold formability. Directional solidification and columnar grain growth introduce pronounced anisotropy and local strain incompatibilities, whilst residual stresses and process-induced defects (e.g., lack-of-fusion porosity and oxide films) act as preferential crack initiation sites. Although the global stress state is compressive, friction-induced barrelling generates localised surface tensile stresses. Moreover, the imposed high strain could exceed the cold-forming capability of as-built LPBF aluminium alloys in the absence of recovery or recrystallisation.
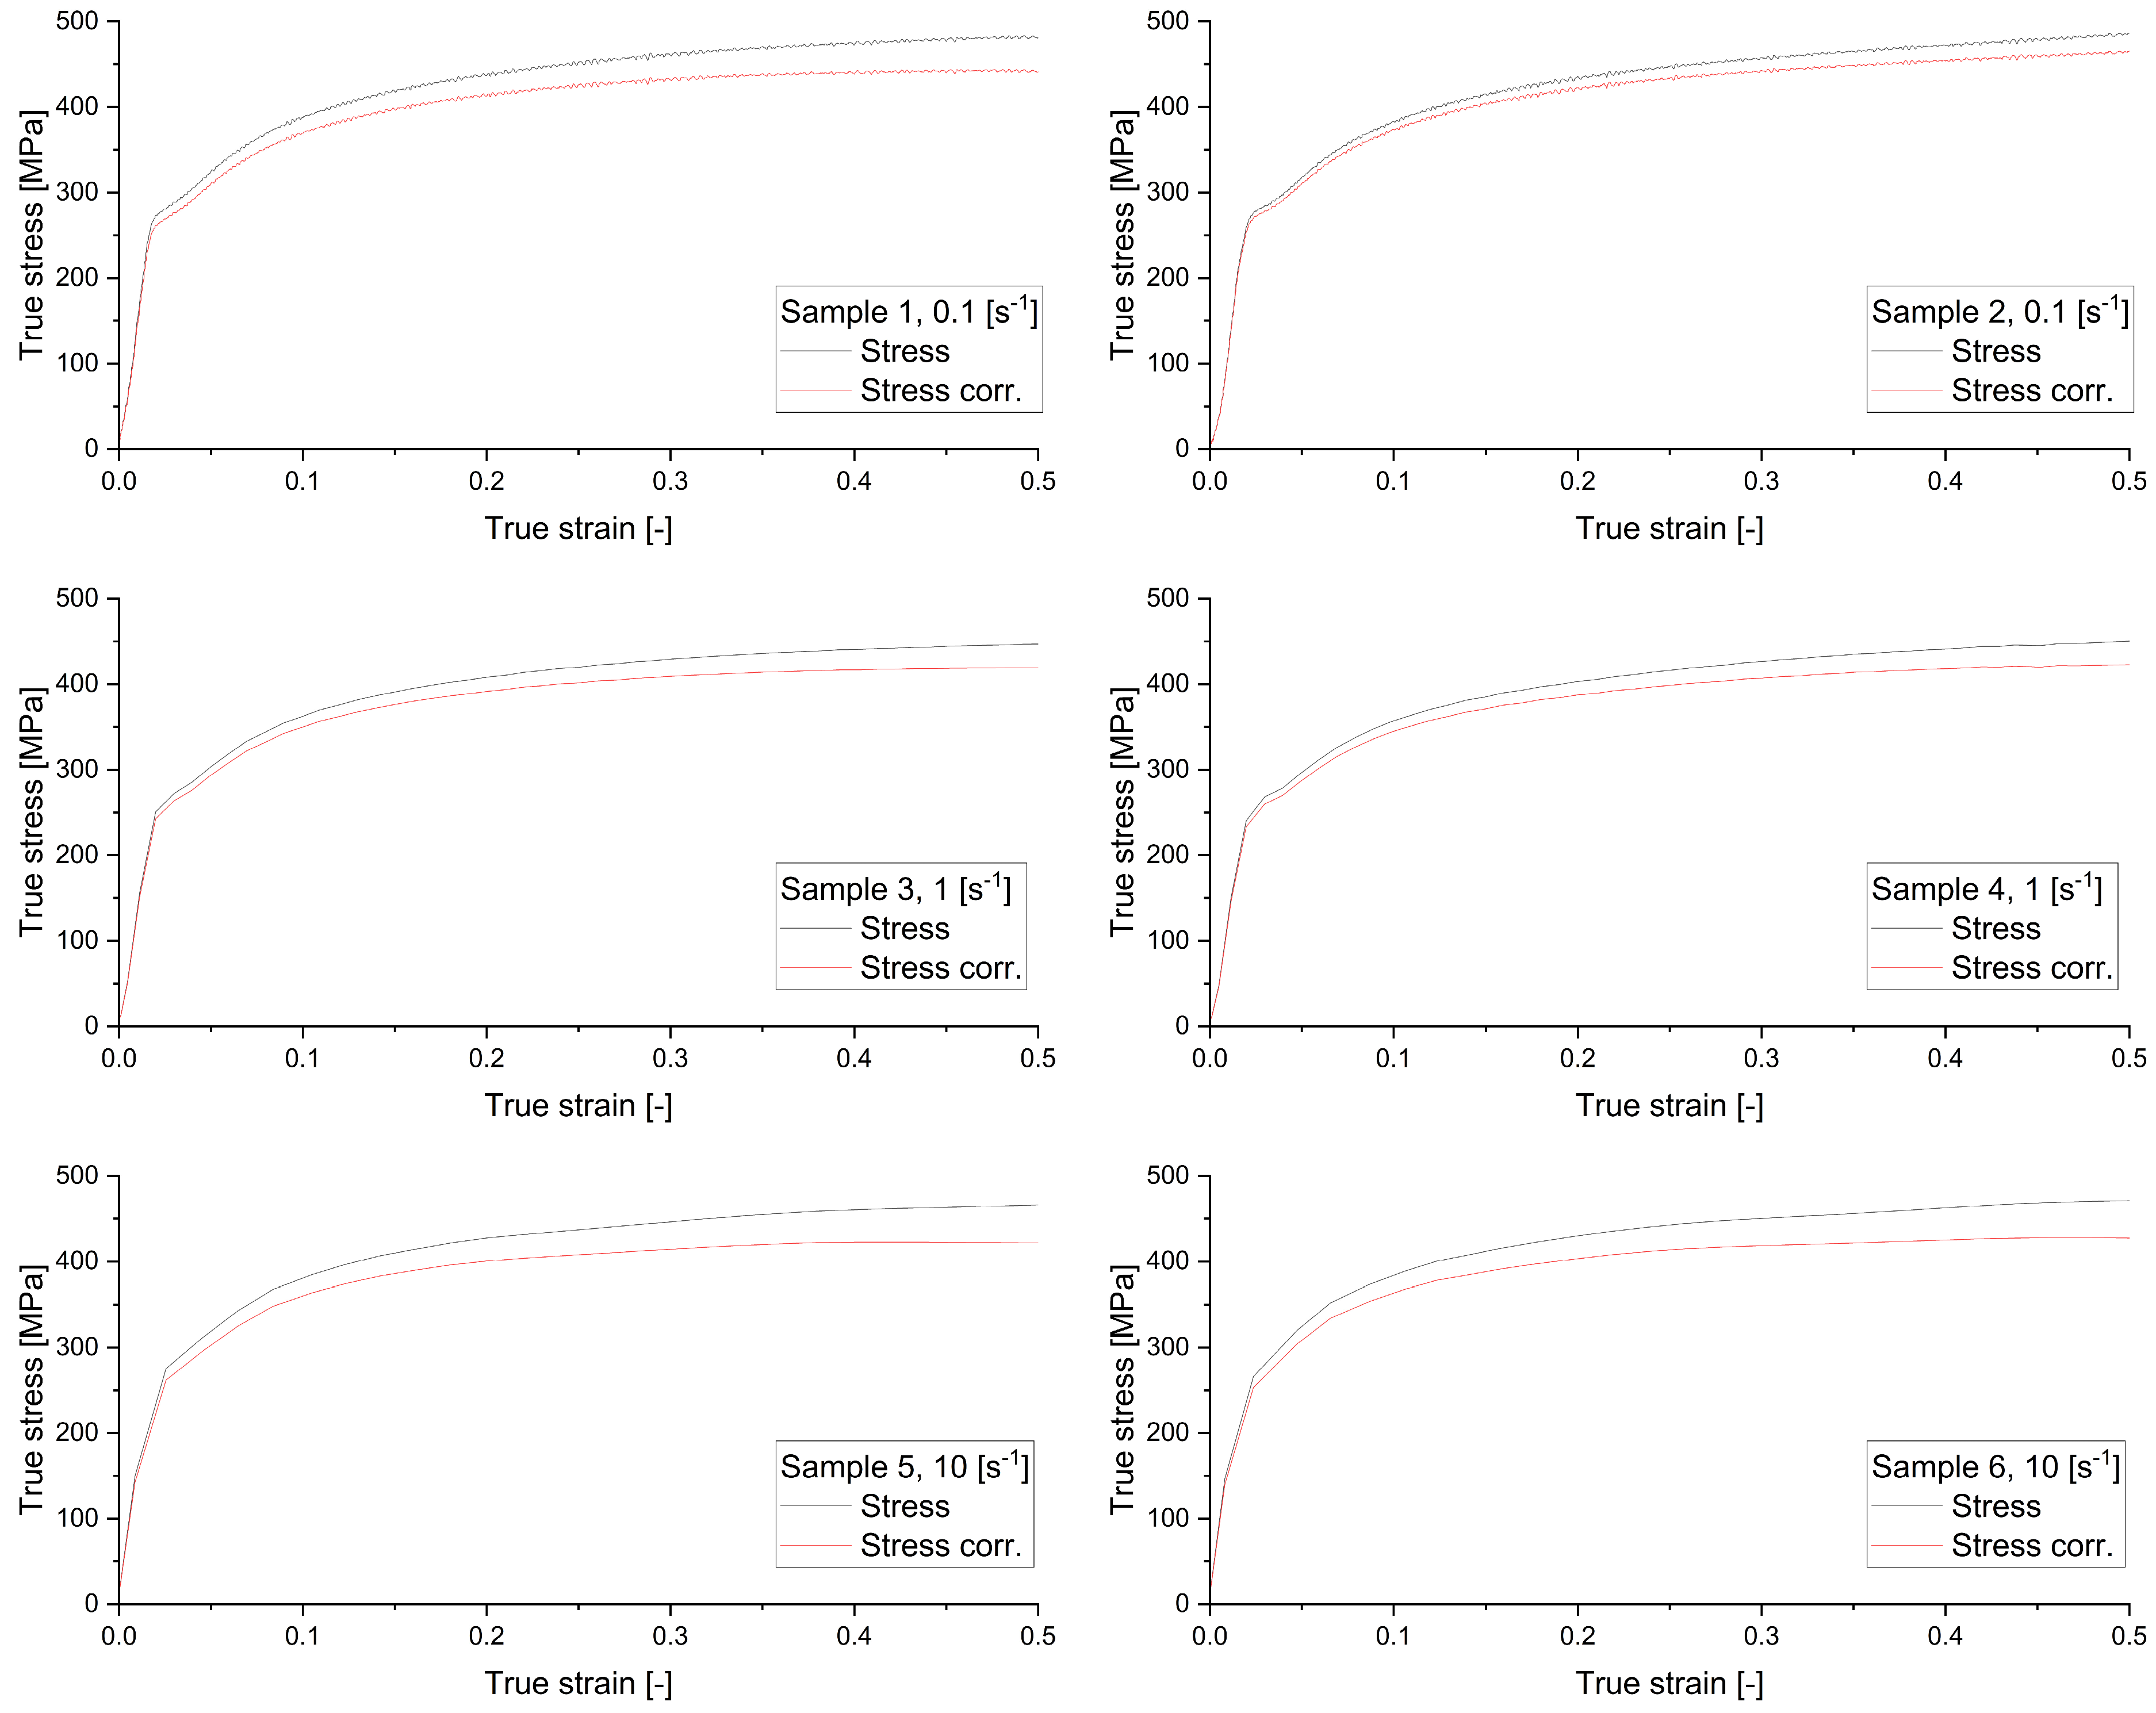
The true stress–strain curves for the samples studied are displayed in the following figure,
Figure 7. In the study, two samples were tested for each strain rate, which were 0.1 s
−1, 1 s
−1 and 10 s
−1. Whereas the black curves display the original (uncorrected) stress–strain data, the red curves represent stress–strain curves after the corrections were applied, where the stress was corrected in a series of equations, as outlined in Equations (1)–(6).
In the proposed correction, the true axial measures are calculated from the load–displacement data (true axial stress from instantaneous area; logarithmic axial strain from height change). The barrelling/friction correction (Equations (1)–(6)) adjusts the axial true stress to a homogenised flow stress and leaves the strain as the logarithmic axial strain based on height. For axisymmetric incompressible uniaxial deformation, the von Mises equivalent stress equals the axial stress, and the equivalent plastic strain equals the magnitude of the axial plastic strain; therefore, the corrected “flow stress” can be interpreted as equivalent (von Mises) flow stress, and the reported strain as equivalent plastic strain. All stress–strain curves shown are the corrected true flow stress versus logarithmic (equivalent) strain.
For samples 1 and 2, there seems to be a distinct edge right after the elastic region, suggestive of material behaviour changing during testing. In all the samples, once it passed the elastic region, they had a fairly consistent response, meaning the material behaved consistently in plastic deformations, concerning the conditions under which the plastic tests were conducted.
The corrected stress values lie much lower than the measured (uncorrected) strain values, which signifies the importance of applying the correction to consider critical aspects of the experiment, such as friction and barrelling. When performing material tests, obtaining correct stress–strain data is valuable because it provides a path to the mechanical behaviour of the material and ensures confidence in the animation of the results perceived in the application and review processes.
4. Conclusions
Within this framework, a method from the literature to compensate for the barrelling effect and the deviation of the stress–strain curves during compressive testing is evaluated. A new method to calculate not only the friction factor but also the friction coefficient is shown.
A mathematical model was developed and used in order to characterise the barrelling effect and the differences in the stress–strain curve. The corrected stress values were significantly lower than the measured stress values, confirming that the correction was a valid exercise.
An equation was developed to relate the primary geometric parameters of the deformed samples with their mathematical representation, which also correlates with the results from a 2D finite element model, showing that the finite element model could reliably predict plastic strain and deformation.
The mathematical model was also validated by comparing the friction factor from the deformed samples to the experimental data, and the results agreed well, further confirming the applicability of the model.
The friction coefficient was calculated in an efficient and reliable way using the model. Microstructural analysis and micrography of the samples also showed good agreement with the values predicted for plastic strain distributions, further supporting the model.
A unified workflow linking geometric barrelling metrics (e.g., Rt/Rm), mathematical correction, and FE-calibrated friction parameters delivers consistent, lower-bias flow curves and validated strain/shape predictions, providing reliable inputs for process and tool design and a clear path to non-isothermal Gleeble conditions.
Barrelling in cylinder compression arises from die–specimen friction, producing non-uniform deformation and inflating the apparent flow stress. By extracting a barrelling descriptor from post-test geometry and estimating the friction factor m and coefficient μ, the measured curves are corrected, shifting stresses to lower, more realistic values. A 2D FE model, calibrated to final radii and heights and cross-checked with microstructural strain indicators, reproduces the observed bulging and plastic strain distributions. The FE-supported Rt/Rm-to-μ mapping enables efficient friction identification per test, while m computed from the barrelling model agrees with experiments, validating the approach. Together, these elements yield trustworthy flow curves and contact parameters for A20X at room temperature and establish a transferable framework for future non-isothermal testing.
The model was built for room temperature. To investigate the conditions at higher temperatures, the non-isothermal condition in the Gleeble samples should be implemented in the model. The thermal gradient in the sample additionally influences the sample’s final shape.