Article

Al-RHEA Particulates MMCs by PM Route: Mechanical Properties and Sliding Wear Response

by
Elias Anastasios Ananiadis
*,
Alexander Efstathios Karantzalis
,
Dimitrios A. Exarchos
* and
Theodore E. Matikas
*
Department of Materials Science & Engineering, University of Ioannina, 45110 Ioannina, Greece
*
Authors to whom correspondence should be addressed.
Appl. Mech. 2022, 3(3), 1145-1162; https://doi.org/10.3390/applmech3030065
Submission received: 25 July 2022 / Revised: 31 August 2022 / Accepted: 4 September 2022 / Published: 15 September 2022
(This article belongs to the Special Issue Feature Papers in Applied Mechanics)

Abstract

:
New particle reinforced aluminum matrix composites with the addition of refractory High Entropy Alloy, MoTaNbVW, fabricated via powder metallurgy process were assessed for their properties. Basic mechanical properties (modulus of elasticity, hardness) for the aluminum matrix, the pure aluminum and the reinforcement phase were assessed by means of dynamic nano-indentation technique. Nano-indentation based creep response was also evaluated in these three areas of interest. Hardness shows an increase with the addition of the particulates and so does the elastic moduli and the ratio of the energy absorbed in the elastic region. The creep response was approached in terms of dislocation mobility and critical volume for their nucleation. The produced Al–HEA composites were also studied for their sliding wear behavior and showed that with the increase in percentage of RHEA particulates the wear resistance increases. Microstructural considerations, wear track morphologies, and debris characteristics were used for the assessment of the involved wear mechanisms.

1. Introduction

Particle Reinforced Aluminum Matrix Composites (PRAMCs) involve two or more distinct phases, chemical and physical, one is the matrix and the other the reinforcement. Different reinforcements either metallic, non–metallic or ceramic are used into these metallic matrix composites to obtain certain properties, mechanical and/or physical [1]. Poor interfacial wettability, large thermal expansion coefficient between matrix, and ceramic particles leading to agglomeration, porosity forming, and fragmentation of particles result in poor plasticity and toughness of these composites [2,3,4,5]. To overcome this main problem, ceramic particles can be replaced with metallic particles due to their natural good interface bonding [3,6]. Although these types of materials showed very good weight saving use, they also must be cost efficient, so the most suitable and common matrix is aluminum [7]. Due to their properties such as low density, high specific strength and stiffness, wear resistance and others, aluminum matrix composites (AMCs) are widely used for structural, functional, and high-tech applications such as tools, automotive, aerospace, marine, defense, and many others [1,8,9,10]. These composites are fabricated via various routes such as, powder metallurgy, mechanical alloying, stir casting, spray deposition [8].
A different/novel approach of PRAMCs is the addition of high entropy alloys (HEAs) particulates as reinforcement due to their exceptional properties. High entropy alloys are a novel type of metallic materials which consist of at least five different elements with composition ranging from 5 to 35 at.%. These new types of alloys showed exceptional mechanical and anti-corrosive properties. These properties derived from four main key elements of HEAs such as (a) high entropy, (b) severe lattice distortion, (c) sluggish diffusion, and (d) cocktail effect [11,12]. HEAs through different systems and compositions along with proper designing, exhibit better specific strength, hardness, ductility, toughness, wear, and corrosive behavior and other properties that conventional alloys cannot have in general.
Even though these PRAMCs are quite new, some works have already been performed by different researchers using HEAs as the reinforcing phase [3,4,5,6,13,14,15]. Yuan et al. [3] showed that the addition of HEA particles into aluminum matrix, made by Spark plasma sintering (SPS), increased the hardness by 63.7% compared with Al matrix. Luo et al. [15] used aluminum AA1050 reinforced with Al0.5CoCrFeNi with stir casting method and subsequent rolling. The composites exhibited increase in ultimate tensile strength (UTS) by 74.3% and 32.1% in elongation compared with pure aluminum. Wear improvement was also reported with the addition of HEA particles, as in the case of the AlCoCrCuFe addition that significantly decreased the wear rate and increased the hardness with respect to aluminum matrix [6] and composites made with laser melt injection (LMI) technique on AZ91D substrate [16,17].
Nano indentation is a technique suitable for hardness and elastic moduli, as well as creep examination in nanoscale for different materials. Since in metal composites the distances between particle and interface are in micrometers, conventional methods are not capable/suitable for determination of gradients in mechanical properties around the particle. Therefore, the micro range of these gradients in mechanical behavior may be indicated by nanoindentation because it can measure the resistance of plastic deformation in small volumes [18].
Creep resistance, among all mechanical properties, may be the most significant and crucial for applications in industry. For years, tensile methods were used evaluate creep assessment in different materials, but the use of nanoindentation techniques were eventually used with success. Li et al. [19] first used nanoindentation methods for creep behavior in different materials and they systematically approached the different creep mechanisms during nanoindentation in relation to various testing parameters. It must be noticed at this point, however, that research of nanoindentation in aluminum metal matrix composites is very limited, and even more in the cases of HEA particle addition in aluminum matrix.
The sliding wear response of PRAMCs has been significantly examined during the last there decades and crucial testing and material parameters such as matrix nature, reinforcing particles characteristics, externally applied load, testing temperature, sliding speed and distance, and lubrication were identified as those that can impose an important effect. Review works such as those of Sannino and Rack [20], Deuis et al. [21], and Kumar et al. [22] are very explanatory on the role of each one of these factors and the reader is strongly advised to read them in order to gain a more thorough view of the sliding wear phenomena of PRAMCs. Despite the fact that the contribution of each individual factor is well-assessed and explained, no single and simple unified theory for the sliding wear response of PRAMCs has been established and formulated. On the contrary, many different wear mechanisms have been proposed, making researchers worldwide accept that the evaluation of the wear response is, most of the times, a combination of more than one sliding wear mechanism [20,21,22]. The most unified postulated of all these years of research is that the sliding wear response of PRAMCs is governed by a transition between three modes, i.e., ‘‘light’’, ‘‘mild’’, and ‘‘severe’’ [20,21,22]. Among the most predominant wear mechanisms, one can find (a) the classic Archard theory where material removal is cumulative and repeated adhesion—decohesion sequence between the two counter bodies, (b) the delamination theory of Suh [23] where the material loss is due to crack/flaw formation and propagation due to plastic deformation, and (c) the tribolayer approach according to which, oxides phases that are formed on the surface are mechanically mixed with the metallic matrix forming a dynamic in stability terms surface layer which is continuously subjected to a comminution—consolidation action, the stability of which controls the severity of the degradation phenomena [21,24,25].
The scope of the present effort is based on three fundamental pillars: (a) to assess, perhaps for the first time, the creep response of new Al matrix composites reinforced by Refractory High Entropy Alloy particles along with other mechanical properties with the use of nano-indentation technique; (b) to primary assess the sliding wear response of these new systems; and (c) to identify the effect the different reinforcing particle size may have on these properties, if any.

2. Materials and Methods

The specimens were fabricated via the powder metallurgy route and hot press sintering. Powder of AA-1050, pure aluminum powder (purity 99.5%) and powder of the MoTaNbVW refractory HEA were blended to achieve three different compositions (1, 3, and 5 vol.%. These volumes fractions refer to the RHEAs particles which are the reinforcing phase, leaving the rest of the vol.% as the matrix material, i.e., the Al phase). As reference, pure aluminum specimens were also manufactured with the same route. The RHEA was produced via Vacuum Arc Melting method, followed by 5 remeltings. As a next step, Fritsch Pulverisette 7 PL planetary mill was used to turn the MoTaNbVW into powder. A more detailed explanation about the fabrication of the specimens is referred in a previous work [26].

2.1. Nanoindentation Testing

For the nanoindentation and creep measurements Shimadzu DUH—211S was used. The applied load was 196.13 mN, the depth of indentation was 1000 nm, and two loading speeds were selected, 2.2207 and 13.3240 mN/s. The same conditions, instead having a holding time of 30 s for the applied load, were also used for creep experiments. Measurements were taken from HEA particulates as well as from the aluminum matrix. More specifically, the measurements for both the basic mechanical properties and the creep response were conducted on (a) a pure Al PM processed sample as a reference material, (b) on bulk/coarse RHEA reinforcing particles of the 5 vol.% reinforced system and (c) on the matrix phase of the 5 vol.% reinforced composite (this matrix phase practically consists of Al and fine sized dispersed RHEA particles). The calculations of the properties acquired were based on the Pharr [27] approach for nanoindentation testing and they were provided from Shimdazu’s software (SHIMADZU DUH menu application Version 2.40).

2.2. Wear Testing

The wear experiments were conducted on a ball on disc set up, using a CSM Instruments tribometer and as a counter body steel ball (100Cr6). The sliding distance set for 1000 m, interrupted every 200 m, and the specimens were weighted for the mass loss calculations. The rotating speed was set at 10 m/s. At least three measurements of each composition were made for better repeatability.
Wear tracks and debris from the worn surfaces were examined through scanning electron microscopy (JEOL 6510 LV) and EDX analysis.

3. Results and Discussion

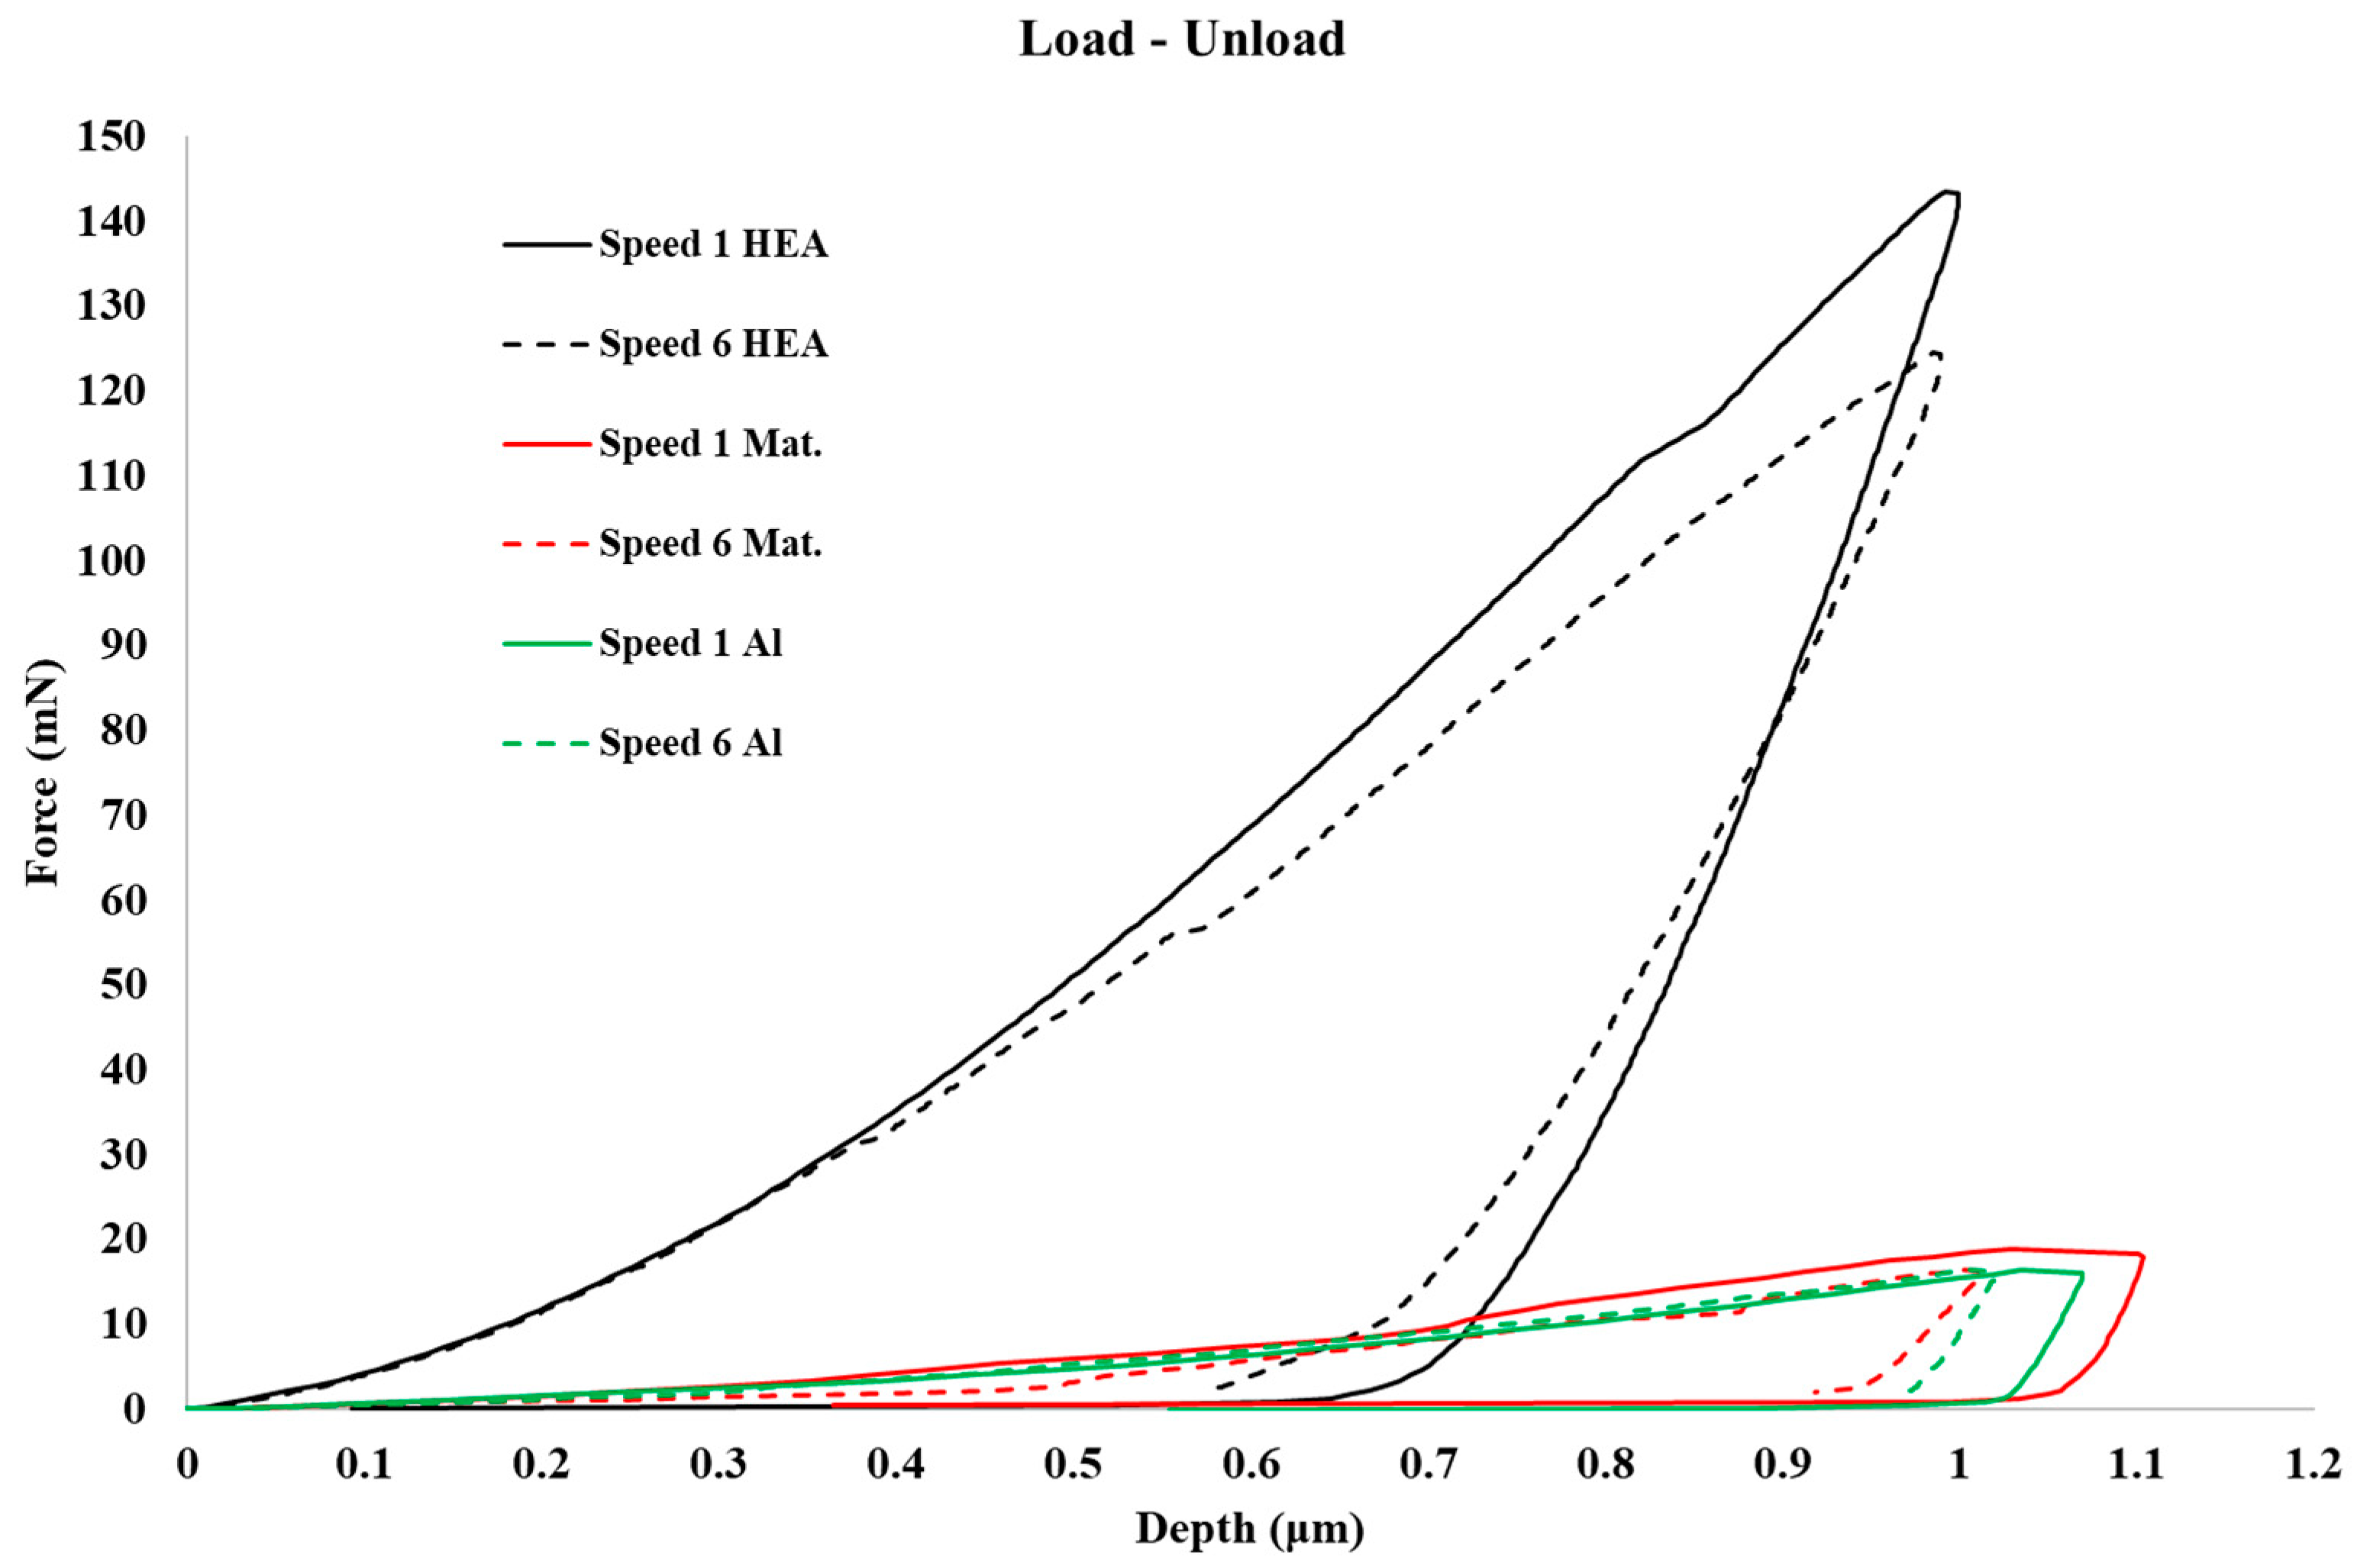
3.1. Nanoindentation and Creep

Basic Mechanical Property Assessment

Figure 1 presents indicative loading—unloading nano-indentation curves (no creep stage) upon which the basic nano-indentation mechanical properties were calculated.
Table 1 and Table 2 (speed 1 and speed 6 respectively) shows the values obtained from nanoindentation testing for the standard mechanical properties, i.e., Eit the modulus of elasticity by nanoindentation, nit the absorbed energy in the elastic region versus the overall absorbed energy and the hardness of the material HV.
Based on the data of Table 1 and Table 2 the following points can be addressed:
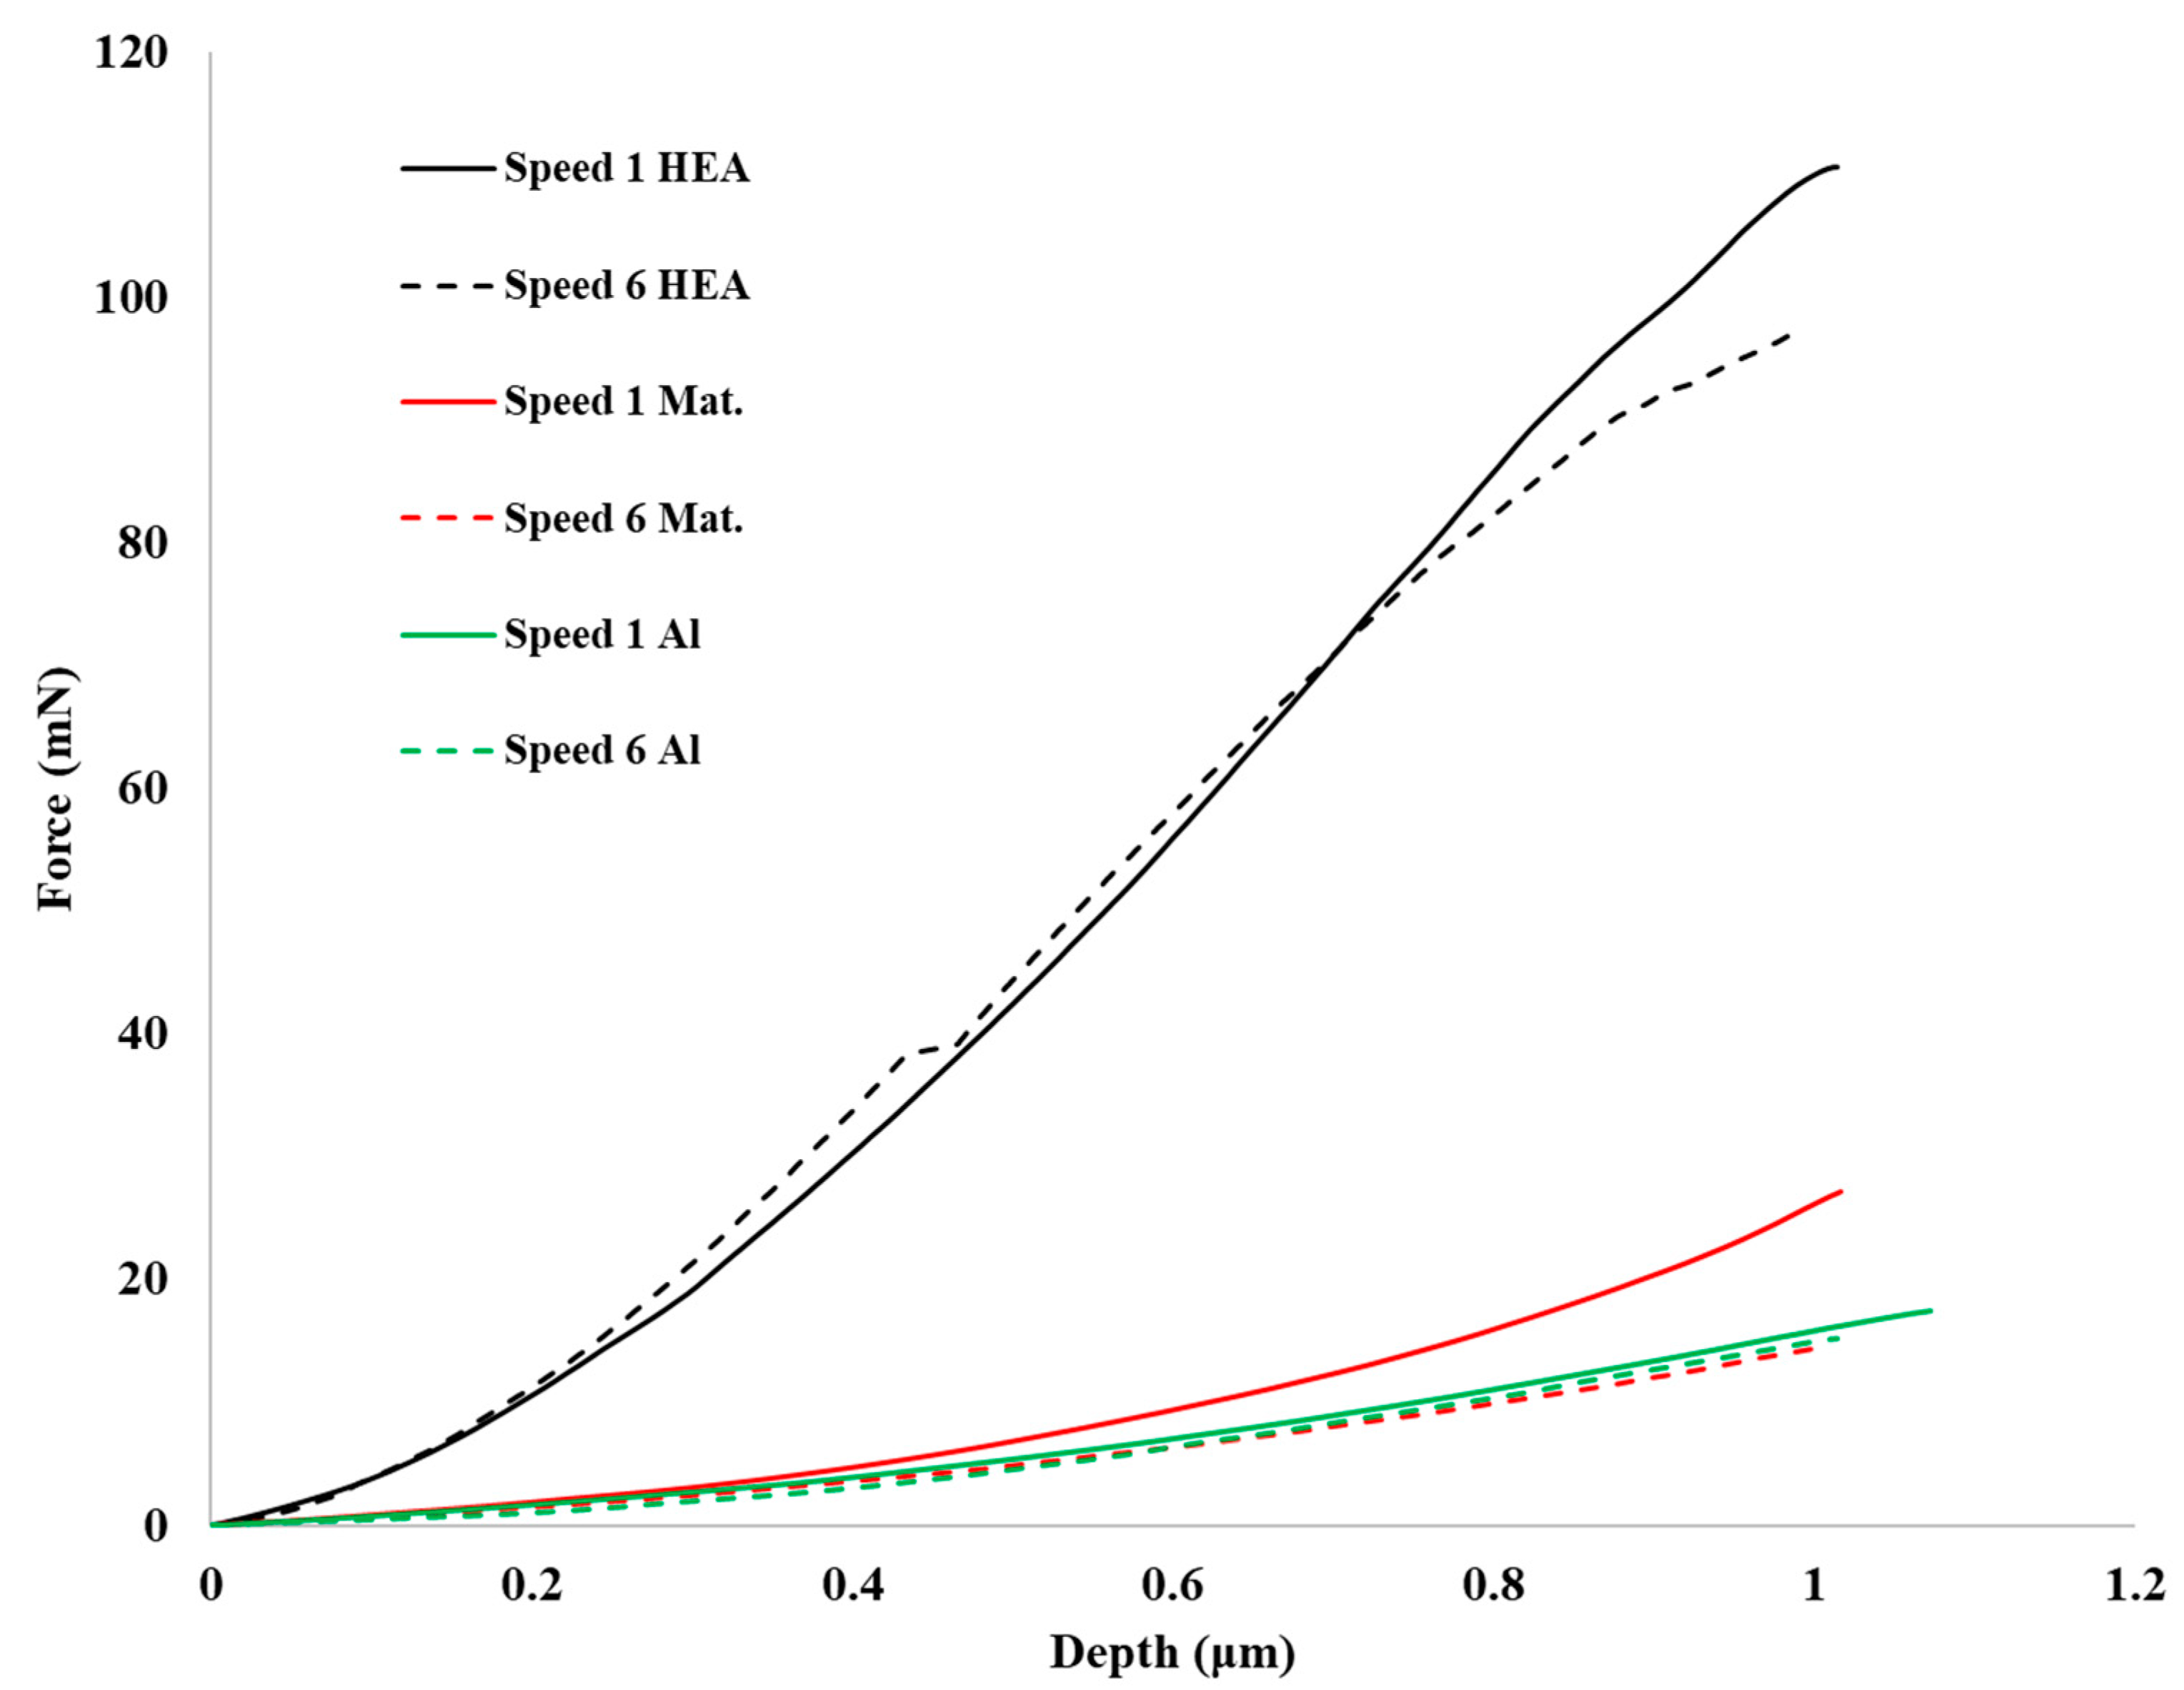
  • Nanoindentation hardness, HV: The hardness values seem to follow an ordinary trend. More specifically, the reinforcing phase shows the higher hardness values, significantly higher than pure Al and the composite’s matrix phase, which is expected since it is a hard refractory high entropy alloy. The composite’s matrix phase appears to be slightly higher than pure Al. This difference arises from the fact that in the case of the matrix phase, it was observed form the composite microstructure as it was seen in previous work [26] a significant amount of fine-sized reinforcing particles is dispersed within the matrix region. The presence of such fine particles inhibits the matrix plastic deformation by restricting the mobility of dislocations. This phenomenon is typical in the mechanical response of metal matrix composites [28]. Since the ease of plastic deformation is retarded, and by recalling the hardness it is practically the resistance to the later (plastic deformation), this increase in the matrix hardness compared with that of pure Al is easily explained. The different loading speeds do not seem to have any significant effect of the hardness of the different phases.
  • Modulus of elasticity in nanoindentation, Eit: As in the case of hardness, it can be observed that the Eit values increase form the pure Al, to the composite matrix and the reinforcing phase. This trend is also expected. The reinforcing phase, firstly, is a BCC solid solution of refractory elements that establishes strong interatomic bonds and intense elastic stress fields within the lattice, due to the intensive lattice distortion effect caused by the presence of the multiple, different in size elements [11,29]. These factors explain the high modulus of elasticity values for the reinforcing phase. The Eit values of the composite’s matrix phase, on the other hand, seems to be significantly higher than that of pure Al. This fact is also associated with presence of fine reinforcing phase particles homogeneously distributed within the matrix. If we recall the microstructure of the composites [26], it can be seen that the very fine size of the reinforcing particles leads to a particle distribution where the inter-particle spacing is low. This practically means that during the indentation testing, the indenter is facing and measuring the combined effect of both Al and reinforcing particles. It measures, hence, a mixed Eit which resembles the modulus of elasticity measured in a particulate reinforced metal matrix composite, where the values obtained are a combination of both phases and usually estimated by a rule of mixture approach [30]. It is, therefore, expected that the contribution of the hard and of high Eit fine reinforcing particles increase the Eit values of the matrix phase. Another issue to be addressed is the effect of the different loading speed on the Eit values.
  • Ratio of the energy absorbed in the elastic region over the total absorbed energy, nit: The nit ratio, usually follows the same trend with hardness. If we take into consideration that hardness is the resistance to plastic deformation, an increased hardness results in an increase in the energy absorbed in the elastic region, i.e., an increase in the nit ratio.

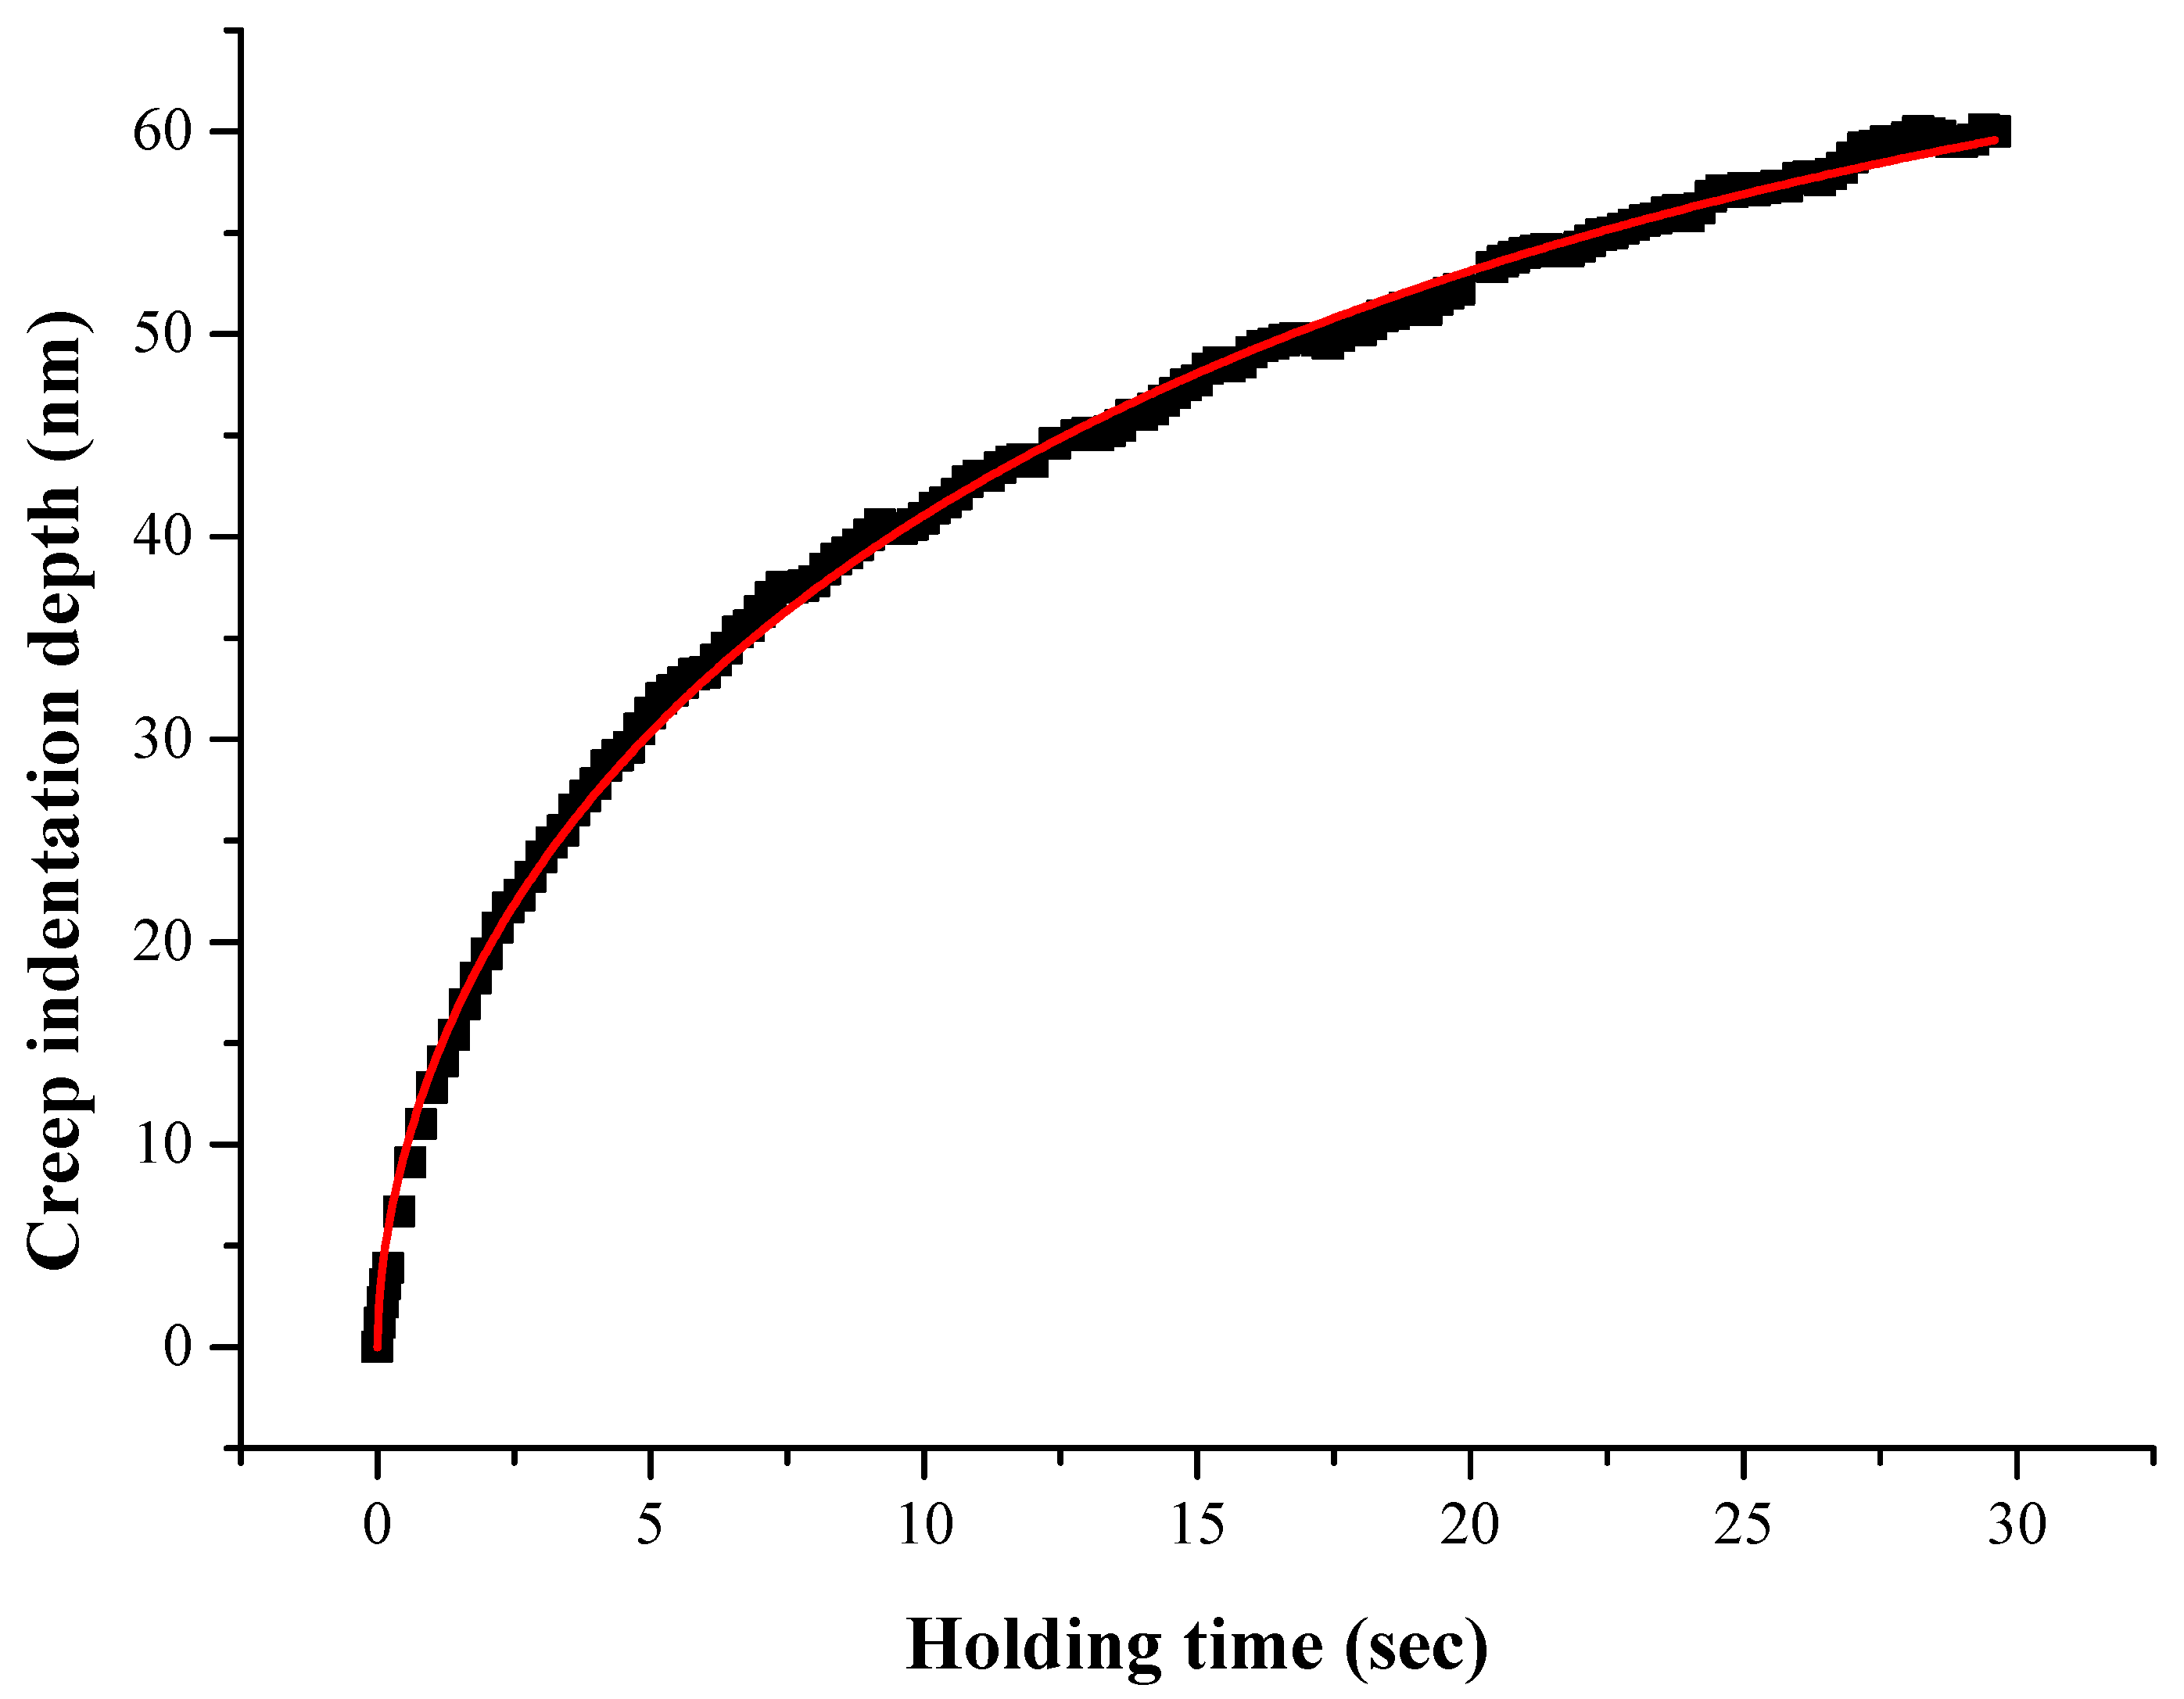
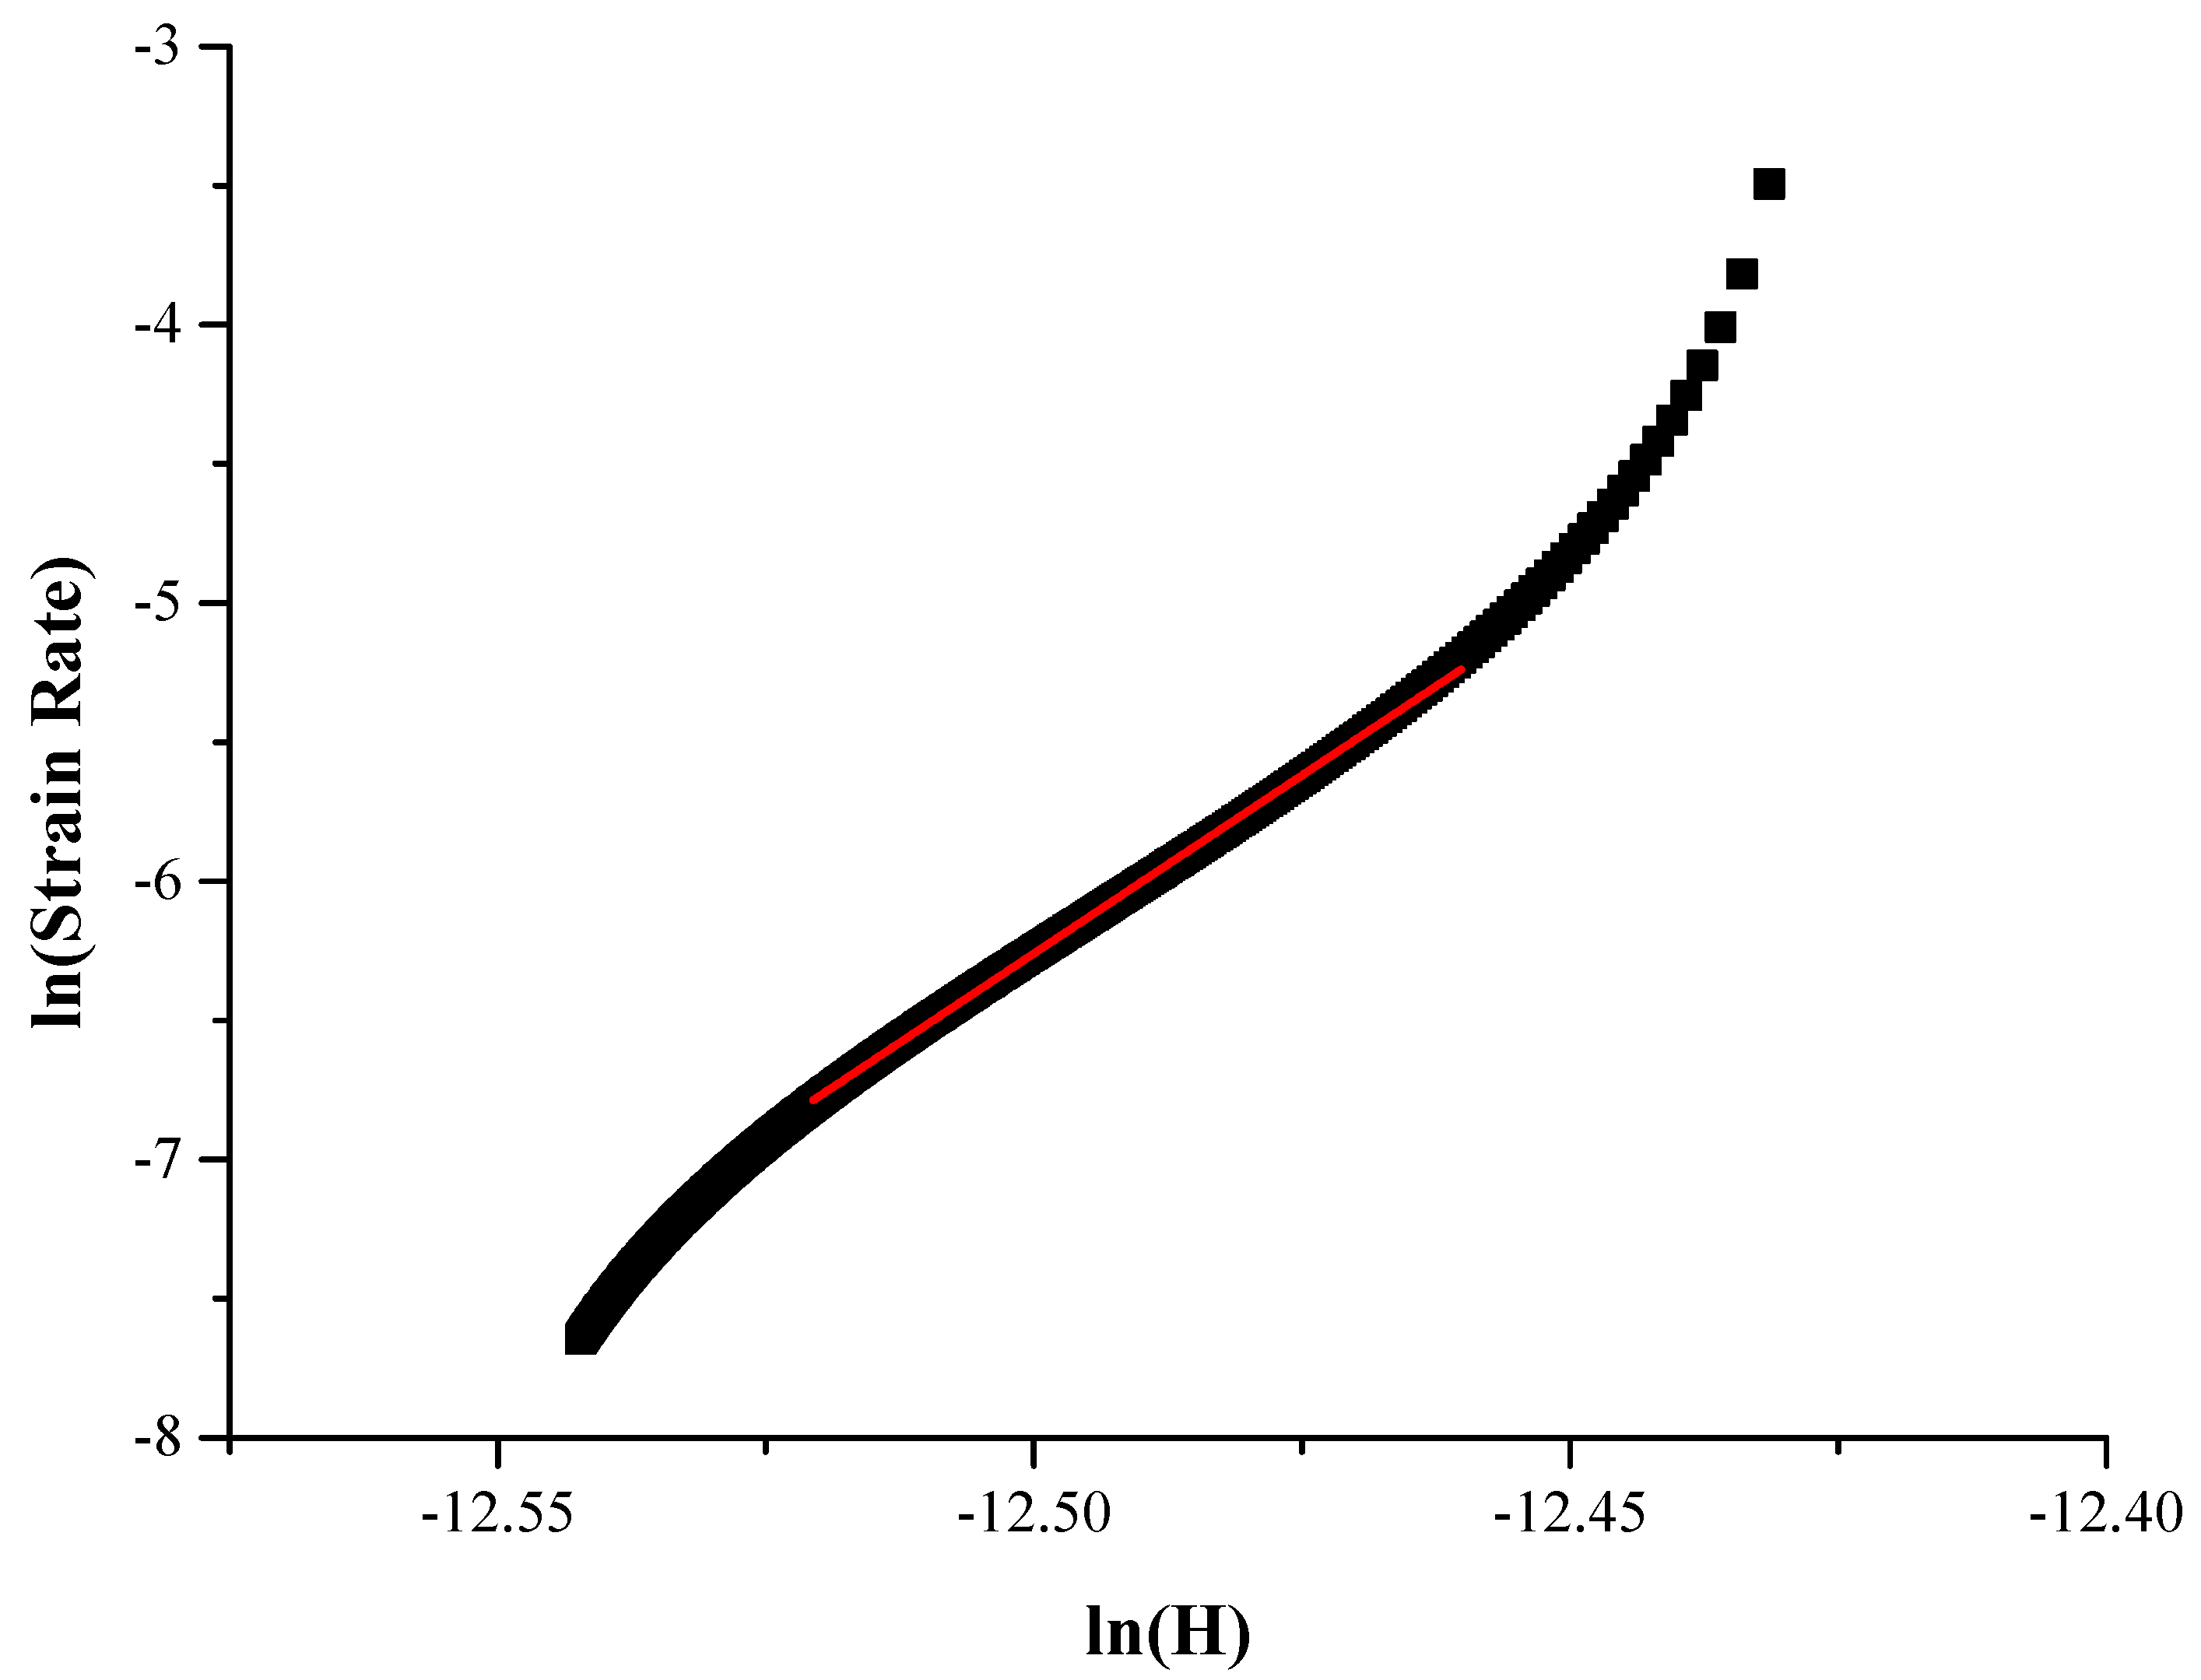
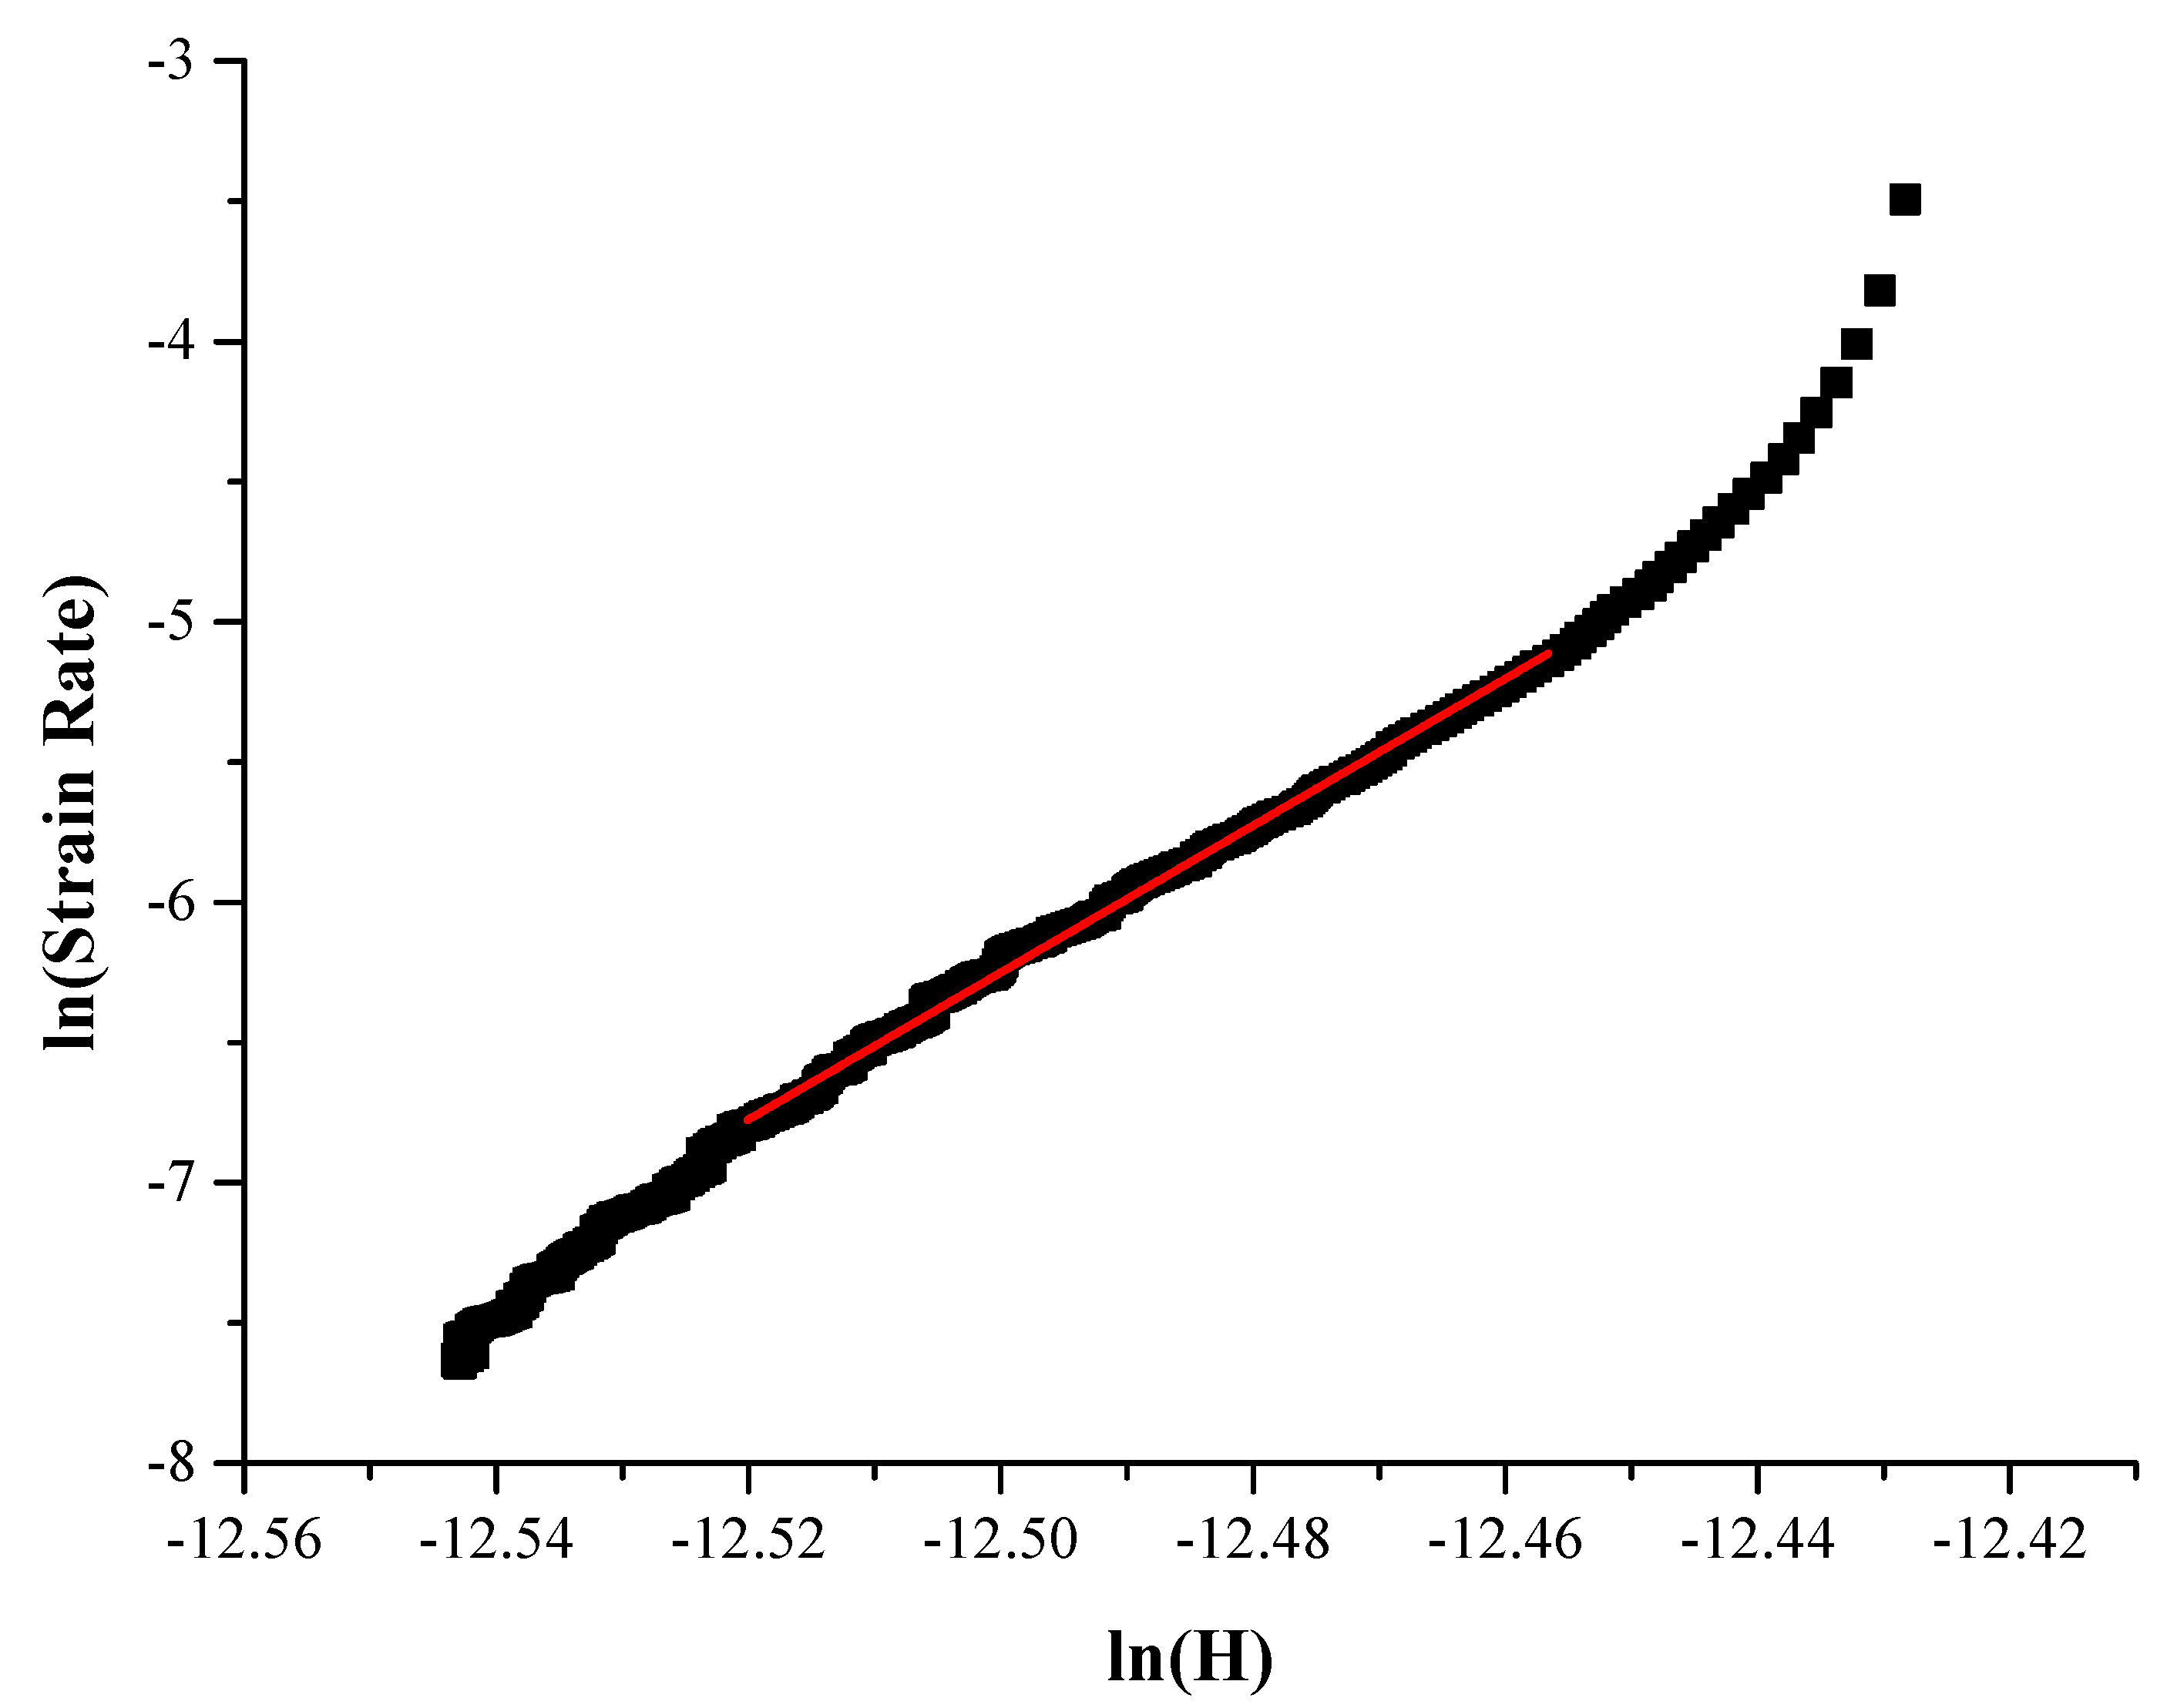
3.2. Creep Assessment

3.2.1. Calculations

For the necessary calculations to be conducted, the approach of Zhang et al. [31] was adopted, with certain modifications performed when requested as it was carried out by Karantzalis et al. [32].
For nanoindentation tests, a Berkovitch diamond indenter usually is used and the values that measurements provide are the strain rate and the hardness as function of the depth of indentation. The equations that provide the previous values are the following:
  ε ˙ = 1 h dh dt =   h ˙ h
and
H = P 24.5 h 2
where ε is the strain rate, h is the indentation depth as function of time, H represents the hardness, and P the applied load as function of time.
Due to creep, the displacement of indentation during the holding time can be approached by the protocol proposed by Wang et al. [33]. A slight modification of this protocol is used for obtaining a fitting curve:
Δ h t = h t h 0 = at p + kt
where h(t) is the depth of indentation as a function of the holding time, h0 is the initial depth at the start of the holding time, t is the holding time, and Δh(t) is the net creep indentation depth. A, p, and k are the fitting parameters.
In the present effort creep stage starts when 1000 nm depth is reached. Once in this specific depth the holding stage for 30 s takes places at maximum load (Pmax). The pure depth due creep can from Equation (3) is:
h t creep = at p + kt
and the overall indentation depth is:
h total = h 0 + at p + kt
where h0 is the indentation depth at the onset of the creep stage and is close to 1000 nm which is the selected indentation depth.
Other researchers [19,34] proposed that creep in indentation obeys an empirical law of the form:
  ε ˙ = A σ n exp Q RT ,
where A is a constant, n the creep stress exponent, σ the applied stress, and Q the activation energy. R is the gas constant. All the experiments were conducted at room temperature and we can assume that the exponential factor of Equation (6) be a constant and so it can be rewritten as:
  ε ˙ = λ σ n
Applying logarithmic function on both sides of the previous equation we have:
ln   ε ˙ = ln λ + nln σ
Also, by applying logarithmic function on both sides of Equation (1) it becomes:
ln   ε ˙ = ln 1 h dh dt
Another useful equation for the overall approach proposed by Zhang et al. [31] is:
σ = kH
where k is a parameter related to the material that is being tested. Plotting ln   ε ˙ , i.e., ln 1 h dh dt with ln H stress exponent n can be calculated with this way. From stress exponent can be also calculated and strain rate sensitivity, m:
m = 1 n
The other mechanical properties also calculated in the present work, such as hardness and modulus of elasticity, were calculated by the adopting the approach of Oliver and Pharr [27].
An example of fitting curve with the fitting parameters is shown in Figure 2, Figure 3 and Figure 4, which present an example of logarithm of strain rate versus the logarithm of hardness curve along the linear fitting that provides the exponent n.
Once stress exponent n is calculated and m (strain rate sensitivity), the critical volume for dislocation nucleation Vcr can be also calculated [35,36].
V cr = kT τ max m
where k is the Boltzman constant, T the temperature in Kelvin degrees, m the strain sensitivity, and τmax the maximum shear stress during the creep stage. According to Wang et al. [35].
τ max = H max 3 3
and
H max = P max 24.5 h 0 2
Hmax is calculated from Equation (14) using as Pmax the maximum load when the indenter is reached at the creep indentation depth (in this case 1000 nm) and h0 is close to this value (~1000 nm).

3.2.2. Assessment

Prior to any effort to evaluate the response of the different composite phases at the actual creep stage, it is very important to examine the pre-creep loading stage. Figure 5 shows indicative load-depth curves of the different composite phases along with pure Al. It can be observed that the loading curves are, in all cases, smooth without any load—depth fluctuations. The presence of load depth fluctuations at the loading stage during nano-identation testing, is often met in different alloy systems and it known as “serrations” [36,37,38]. Serrations play an important role on the assessment of the creep behavior by nano-indentation techniques, since their presence indicate creep deformation phenomena occurred prior to the net creep stage. If such phenomena occur before the actual creep stage, they affect significant the creep response of the examined material. In the present effort, no significant evidence for the occurrence of serrations can be observed. This means that the dislocations present in the various phases from the production stage and/or the dislocations generated during the loading stage, do not exhibit any, even limited, mobility that can provide marginal creep deformation during the loading stage. This type of possible limited creep deformation usually take place at low loading rates since the low loading speeds provide adequate time or stress relaxation due to dislocation movements. It seems that both speed 1 (13.3240 mN/s) and speed 6 (2.2207 mN/s) adopted in the present effort do not provide such creep phenomena at the loading stage.
Figure 5 provides information on the load required to reach the preset depth. Clearly, the RHEA reinforcing phase requires the highest loads due to its hard refractory nature. This necessary load is considerably lower in the case of the matrix phase, which is expected due to its soft and ductile nature. It is important, however, to mention that this load is slightly higher than that of pure Al (especially in the case of the higher loading speed) which is also expected since we recall that the matrix material contains uniformly dispersed fine reinforcing particles which act as dislocation movement obstacles, hindering in such manner the plastic deformation and increasing, and in turn the necessary for the preset depth required load. What is also evident form Figure 5 is the fact that this load is always slightly lower at the lower loading speeds. This is due to the fact that at the lower loading speeds the time for dislocation movement is extended and the rate of dislocation entanglement that can inhibit their mobility is considerably suppressed and therefore the preset depth can be approached more easily in terms of applied stresses.
Figure 6 presents some indicative curves of the full load–creep–unload cycles for the different phases examined in the present effort. The overall behavior observed also verifies the previous comments concerning the effect of the different loading speeds on the necessary load to reach the preset depth.
Table 3 summarizes all the necessary for the assessment of the creep behavior data. Various important observations can be derived by the different parameters measured and/or calculated during the creep stage. It is necessary to recall at this point that the creep tests were conducted at a provided settled form the beginning indentation depth (1000 nm) and not at a provided preset applied load which is the common practice in other experimental efforts. Based on the data of Table 3, Figure 7 presents indicative hcreep time curves of the various systems and Figure 8 shows the Vcr values for the different phases examined in the present effort.
As far as the actual creep depth (indicative hcreep time curves are shown in Figure 7) is concerned (hcreep) it can be observed that in all case the creep depth lays roughly within the range 44–51 nm, with the only exemption being that of the matrix behavior at the low loading speed. This observation of almost the same creep depths might cause a misleading conclusion that all the different phases have the same creep behavior which is not the case as is discussed in the following paragraphs.
More specifically, let us compare the RHEA reinforcing phase with pure Al. As mentioned previously, both of them have almost the same pure creep indentation depths. The RHEA phase is a hard BCC type system, whereas pure Al is a soft FCC phase. Their net creep depth may be similar, yet the stress exponent in the case of RHEA is 44.7 for the high loading speed and 41.7 for the low speed, whereas for pure Al these values are 38.1 and 18.1, respectively. The stress exponent mirrors directly the ease or difficulty of the creep deformation behavior: the higher its value the more difficult the creep events to occur. Under this frame it seems that it is easier for pure Al to creep and to provide these indentation depths. There is however a significant reduction in the stress exponent for the low loading speed in the case of pure Al. This significant drop indicates that the creep deformation takes place much easier. This behavior can be explained in terms of dislocation mobility. By recalling that during the loading stage, no creep phenomena (serrations) are observed, it can be postulated that at the high loading speeds the dislocations that are generated are mostly entangled and as such the number of free dislocation and/or the overall dislocation mobility at the creep stage is restricted. This is also depicted at the maximum hardness (Hmax) or the τmax at the onset of the creep stage. The higher the Hmax, or τmax, the more difficult for the system to reach the preset indentation depth. At the low loading speed, the number of generated dislocations may be less than the higher speed, yet their entanglement is not that severe and as such freer mobile dislocations are available for contributing during the creep stage.
In the case of RHEA, on the other hand, it can be seen that the stress exponent is higher than that of pure Al, which indicates that creep deformation is more difficult to happen. However, similar creep depths have been reached. The obvious question is why? The reason comes from the very high Hmax or τmax this phase showed compared with that of pure Al. As a hard brittle phase of BBC type, RHEA needs high stress to reach the preset depth. During the loading stage, due to the nature of the RHEA phase, dislocation generation is more difficult and so is their entanglement. Their mobility is also more difficult since for BCC structures dislocation climb mechanisms that can ensure the continuance of deformation events are also restricted [35,36,39]. As such, there may be less dislocations available at the creep stage, yet they are free and the actual stress under which they move is very high (τmax). Therefore, despite the obstacles the nature of RHEA poses, dislocation moves under this high τmax, and provides the creep deformations observed. The overall picture of the creep response between these two phases (RHEA and pure Al) can be further enlightened by the data concerning the critical for dislocation nucleation volume, Vcr. It can be seen, from Table 3, that for the RHEA phase this parameter possesses values of 0.181 nm3 and 0.182 nm3. In conjunction with the stress exponent values, it is observed that the loading speed does not play a significant role on Vcr. Vcr is the necessary threshold volume required to be activated in order for dislocations, that accommodates the creep deformation, to be generated [32,34,35,39]. These Vcr values are lower than those of pure Al (1.311 nm3 and 0.606 nm3 for the high and the low loading speed, respectively). The RHEA values are significantly lower, and this is due to the fact that independently on whether the actual dislocation number is low or not, τmax is significantly high so that it can cause dislocation generation at such relatively small critical volume. It must be mentioned, however, that Vcr is calculated on the actual creep stage and does not take into account the pre-creep history of the system. The fact that free, even low at number, to move dislocations formed at the loading stage, also contributes to the creep deformation phenomena, and is somehow indirectly mirrored in the obtained Vcr values.
Pure Al on the other hand has higher Vcr values. The first point to be addressed is the significant reduction in Vcr at the lower loading speed. This behavior is a good example to rise the effect of the pre-creep loading stage influence. At high loading speeds, numerous dislocations are generated, which are, however, mainly entangled causing a significant strain hardening effect. As such, the number of free dislocations to move and/or the overall dislocation mobility is considerably restricted. Therefore, these dislocations cannot contribute their maximum during the creep stage: practically more dislocations must be generated upon creep to provide the obtained creep deformation. The τmax value is not that high and as such a larger volume must be activated in order to produce the necessary for the creep deformation dislocations. When the loading speed is low the behavior alters dramatically. During which, the loading stage dislocations are generated which are not entangled and free to move. These dislocations contribute to the creep deformation during the creep stage and as such less additional dislocations are required to express the overall creep character which can be provided by a smaller activation volume (0.606 nm3 for the low speed compared with 1.311 nm3 for the high speed).
Comparing the two systems, RHEA has lower Vcr values as already stated. This is because the τmax values are extremely high compared with the τmax values of pure Al and therefore these high values can cause generation of dislocations within a low material volume and they, additionally, sustain considerable dislocation mobility, providing the obtained creep indentation depths. Pure Al on the other hand has, apart from what was addressed for the dislocation mobility, lower τmax values and as such dislocations must be born form a larger volume. Nevertheless, the FCC structure with the energetically enhanced slip systems it possesses sustain dislocation mobility and as such the obtained creep depths are reached.
Last but not least, the composite matrix behavior is quite remarkable and needs to be further approached. At the high loading speed, the behavior is more or less similar to that of the pure Al at the high loading speed as well. The stress exponent, the τmax, and the Vcr values are all slightly higher than that of pure Al. Based on the previous discussion, all these slightly increased values are indications of a slightly increased difficulty in the dislocation mobility. It is clear that this extra difficulty is due to presence of the very fine reinforcing particles dispersed with the matrix that consists of obstacles to the dislocation movement. What is really remarkable, however, is the response of the matrix phase as the low loading speed. It can be observed (Table 3) that the stress exponent is significantly increased, the τmax is reduced, and the Vcr is also significantly increased. All these observations suggest an increased difficulty for creep deformation and this difficulty is directly mirrored at the actual obtained creep depth (27.8 nm) which is significantly lower compared with all the other systems and conditions. This behavior can be related to the following reasons: (a) the dislocations generated at the loading stage are less mobile because the τmax under which they move to provide creep deformation at the creep stage is reduced, (b) and the critical volume for nucleation of dislocations is very high so that new dislocations that can accommodate creep deformation are more difficult to be generated. Despite these reasons, the authors recognize that further experimentation is required in order to have a more thorough view of this behavior.

3.3. Sliding Wear Response

For volume loss, the densities for each composition were calculated, 2700 Kg/m3 for the pure aluminum matrix, 2789 Kg/m3 for 1 vol.% composite, 2967 Kg/m3 for 3 vol.%, and 3145 Kg/m3 for 5 vol.% were adopted. The densities were calculated using the Archimedes principle, as Equation (15) states:
ρ = m 1 m 1 m 2 × ρ m
where m1 is the mass of the specimen in weighted in air, m2 the mass of the specimen weighted in a fluid, and ρm the density of the fluid that it is using, in this case water (ρm = 1000 Kg/m3).
Figure 9 shows the volume loss versus sliding distance of the different composites and Figure 10 the wear rates for each composition. As it is shown, for the first 200 m the wear seems to be very intense and after that is seems to have a more linear approach. For this reason, wear rates are broken down to three different values. From the start of the experiments until the first 200 m, from the first stop until the end of the experiment (200 m to 1000 m), and the overall value of the wear rates that occurs from mass—sliding distance diagram.
The monolithic alloy and the composites do not follow the approach that with the addition of reinforcement the wear rates should be lower. This approach is observed in the three composites with a different percentage of reinforcement. The more the percentage of the reinforcement, the better the wear response of the materials [40,41,42,43,44,45,46].
The beneficial act of the reinforcement particles in wear rate is: (a) the absorption of the load that transfers through the aluminum matrix delaying/blocking with that way the formation of cracks due to plastic deformation, (b) the reduction in the contact area between the matrix and the counter body leading to delay to crack and defects due to extensive plastic deformation, and (c) to the provided thermal stability into the matrix (postponing softening phenomena owing to heating) especially in severe wear conditions [20,21,22].
According to the wear tracks of SEM images (Figure 11), important information is acquired. All four specimens present intense wear with hill—valley morphology and delamination of the surface. Abrasive wear is also visible at some areas. The composites (instead the pure aluminum matrix) exhibit the following results: The higher the reinforcement, the more reduced the intensive hill—valley landscape. The reinforcement particles are visible on each specimen’s surface in Figure 11b–d as the bright spots dispersed in it. This reduction in the landscape leads to expanded uniformity over the wear trace of the oxidized area. As the oxidized area is expanding, the lubrication action of the present oxides is higher, thus having a significant decrease in the wear rate. Additionally, to the previous statements, higher magnification of the wear tracks shows that, as the oxidized areas become more uniformly distributed, the presence of the extensive cracks/flaws at the matrix-reinforcement interfacial area seems to decrease, as it is shown in Figure 12. This decrease results in reduced capacity of the delamination process/material removal. Such reduced capacity also contributes to the reduction in the wear rate.
The only discrepancy is the behavior of the monolithic alloy which appears to have moderately lower wear rate especially for the 200–1000 m sliding distance. The authors believe that this behavior can be attributed to reasons as the following: (a) it has been reported in the literature [47] that for very ductile materials, during the initial stage of sliding wear, significant ploughing and material migration sideways occur. This practically leads to an immediate expansion of the wear track. This expansion leads to reduced shear stresses that develop on the surface of the wear track by the counter body, i.e., reduced stresses that can lead to eventually to material detachment and removal. (b) It is also known and observed in the present work as well that highly ductile materials lead to the formation of extensive hill—valley morphology. It can be seen that due to this intensive landscape (Figure 11a) the oxidation phenomena are mostly located at the hill areas. If we take into consideration that the material removal is associated with the development of cracks/flaws at the oxide layer, the less the oxidized area the less material removal.
Figure 13 shows images of the debris acquired from each specimen in backscatter mode. The white inclusions that can be seen are RHEA fragments dispersed into the debris from the aluminum matrix. Based on the overall morphology of the debris, it seems that there may be a slight reduction/refinement of their size as the reinforcing phase content increases. This refinement of debris is possibly due to the abrasive action of the hard HEAs particles, which crash and pulverize the oxide layers that constitute the initial basis of debris formation [40,48].
Another reason the iron presence from the steel counter body is possible is that in severe wear, the iron percentage decreases because in extreme conditions the aluminum matrix suffers less due to low endurance limit [49].

4. Conclusions

  • Al matrix composites reinforced by RHEA particulates were assessed as far as their mechanical properties and creep response are concerned based on nanoindentation testing. Their sliding wear response was also evaluated;
  • The addition of RHEA particulates enhanced hardness, elastic moduli, and ratio of energy absorbed in elastic region of the matrix phase in the 5 vol.% reinforced system compared with the pure aluminum specimen;
  • The three areas of interest showed no serrations during the loading stage prior to creep for the two different loading speeds, i.e., no creep phenomena were expressed during the loading stage;
  • The creep response of the three different constitutes (pure Al, matrix of the 5 vol.% system and coarse RHEA particulates of the 5 vol.% composite) seem to be highly affected by the maximum shear stress upon which creep is initiated (τmax) which is directly mirrored in the values of the critical for nucleation volume (Vcr) which, in turn, directly affects the necessary dislocation density and mobility for creep;
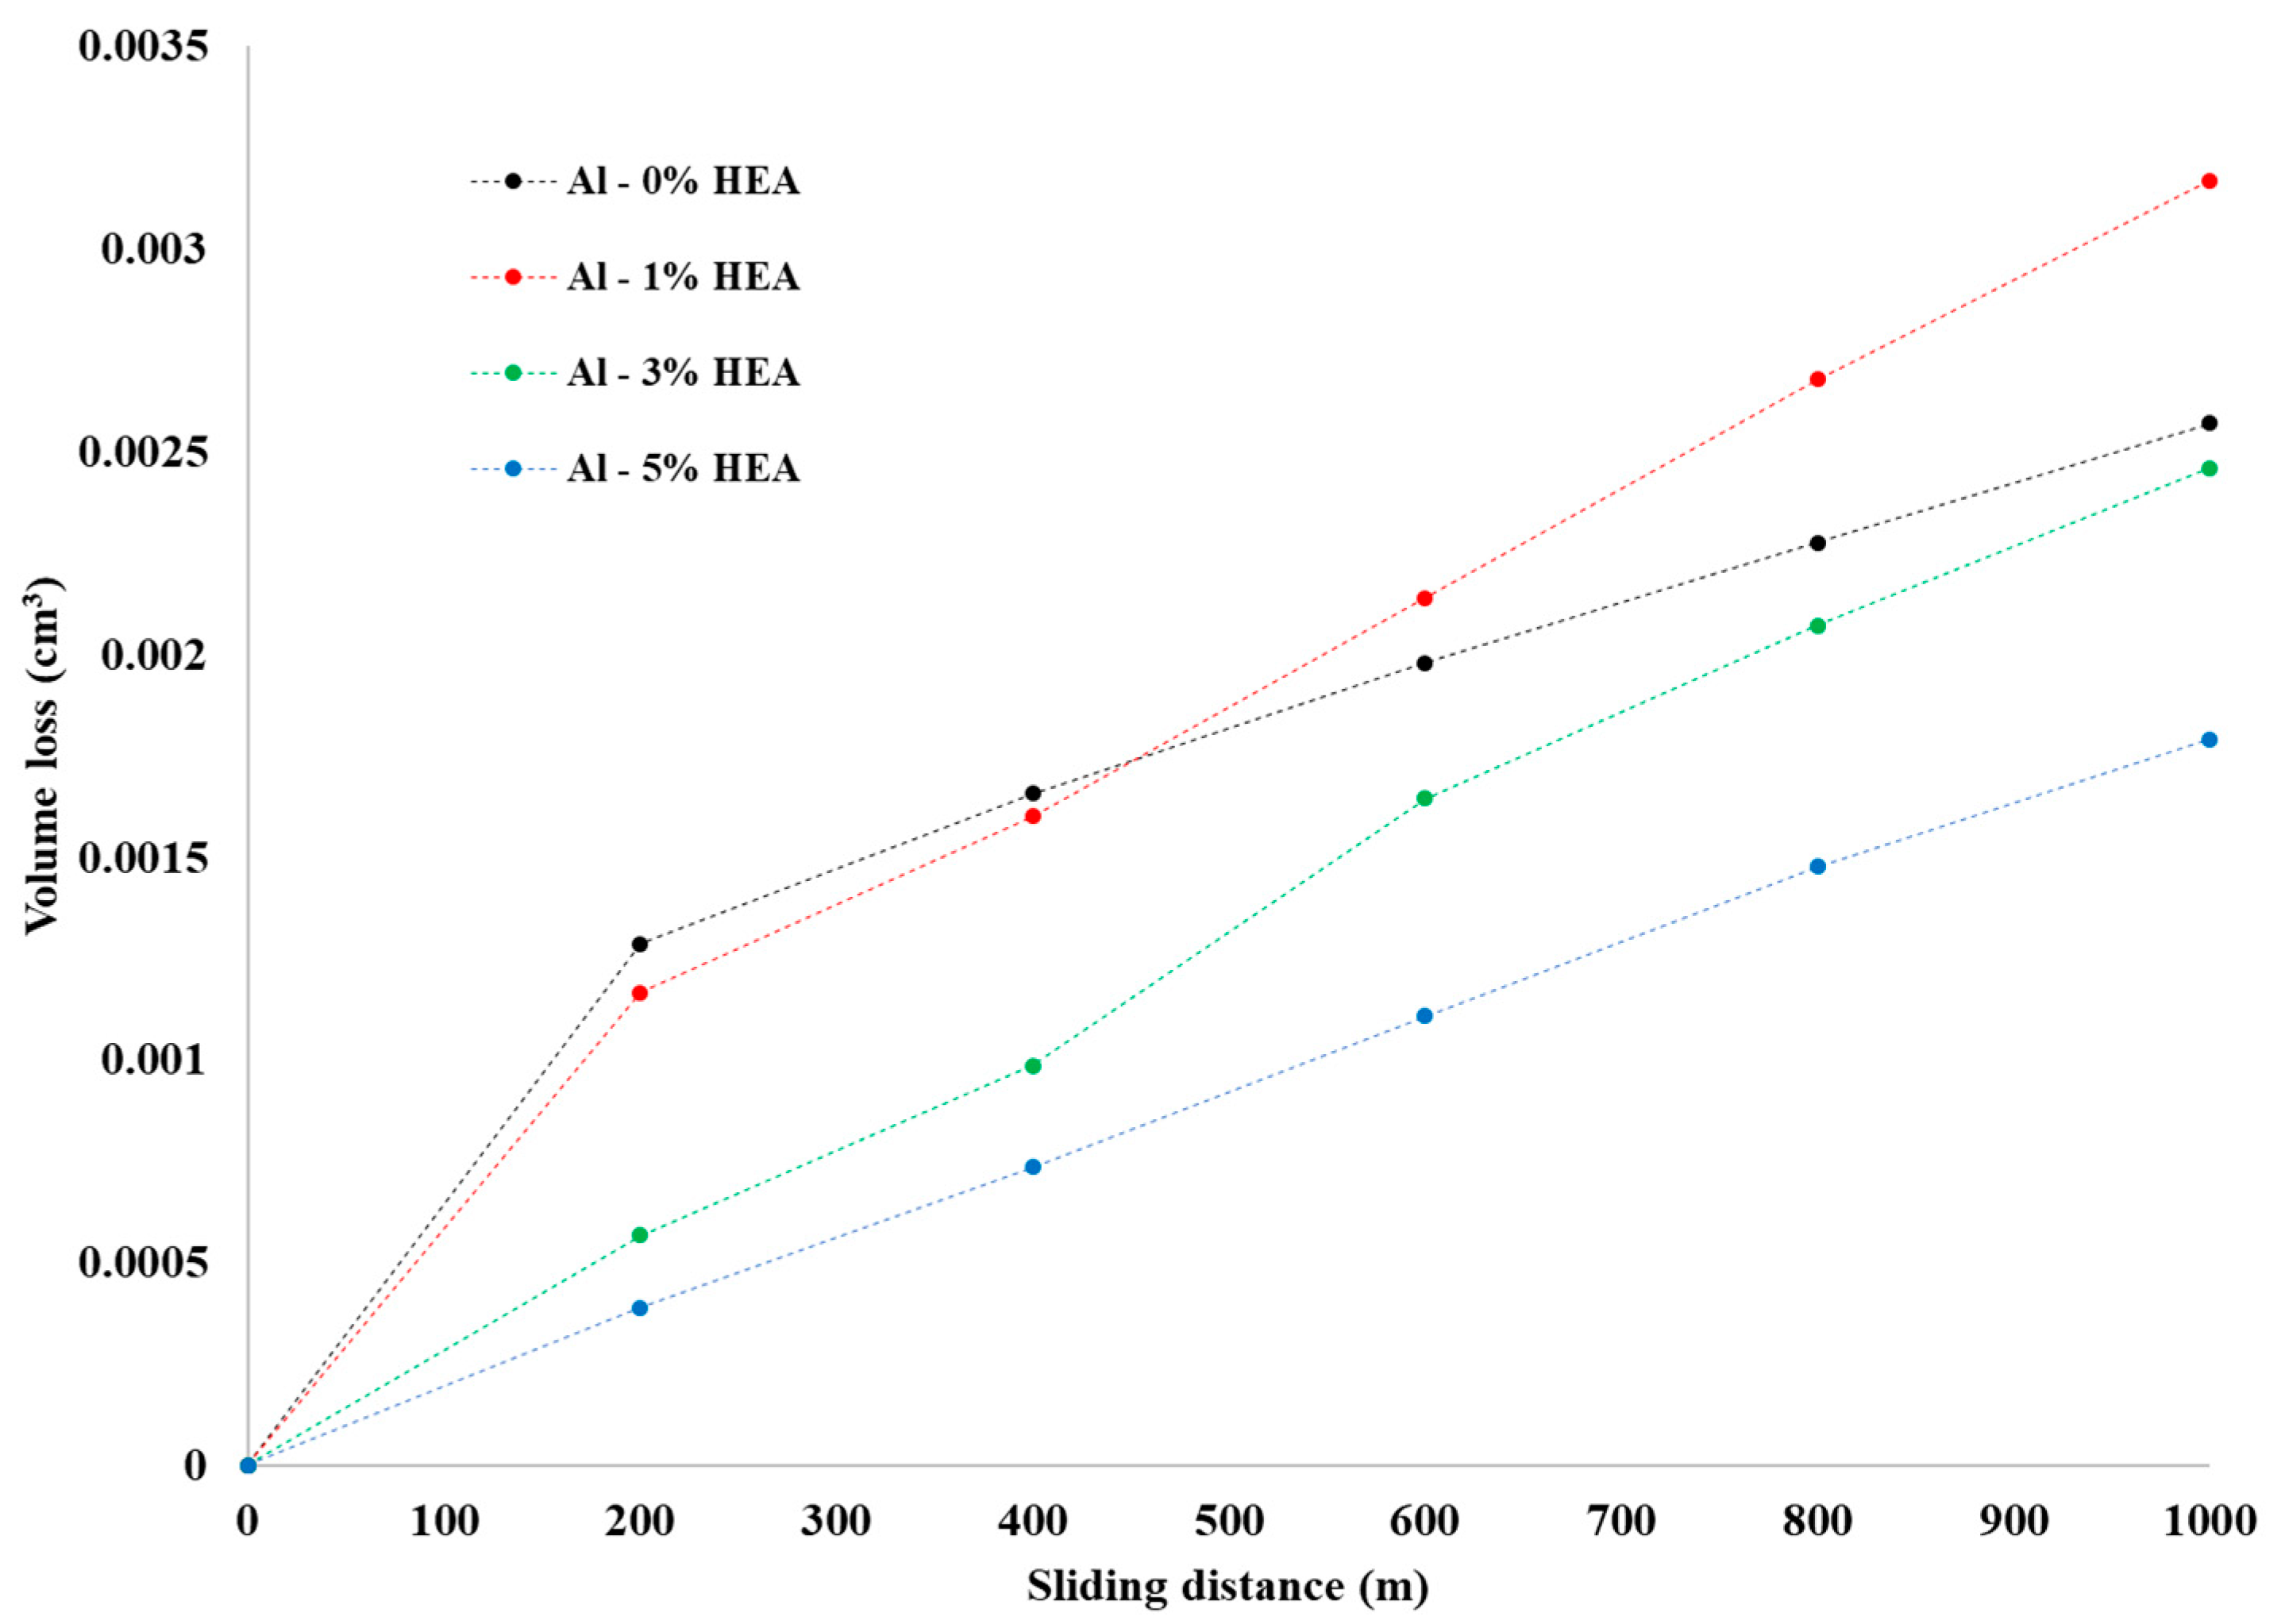
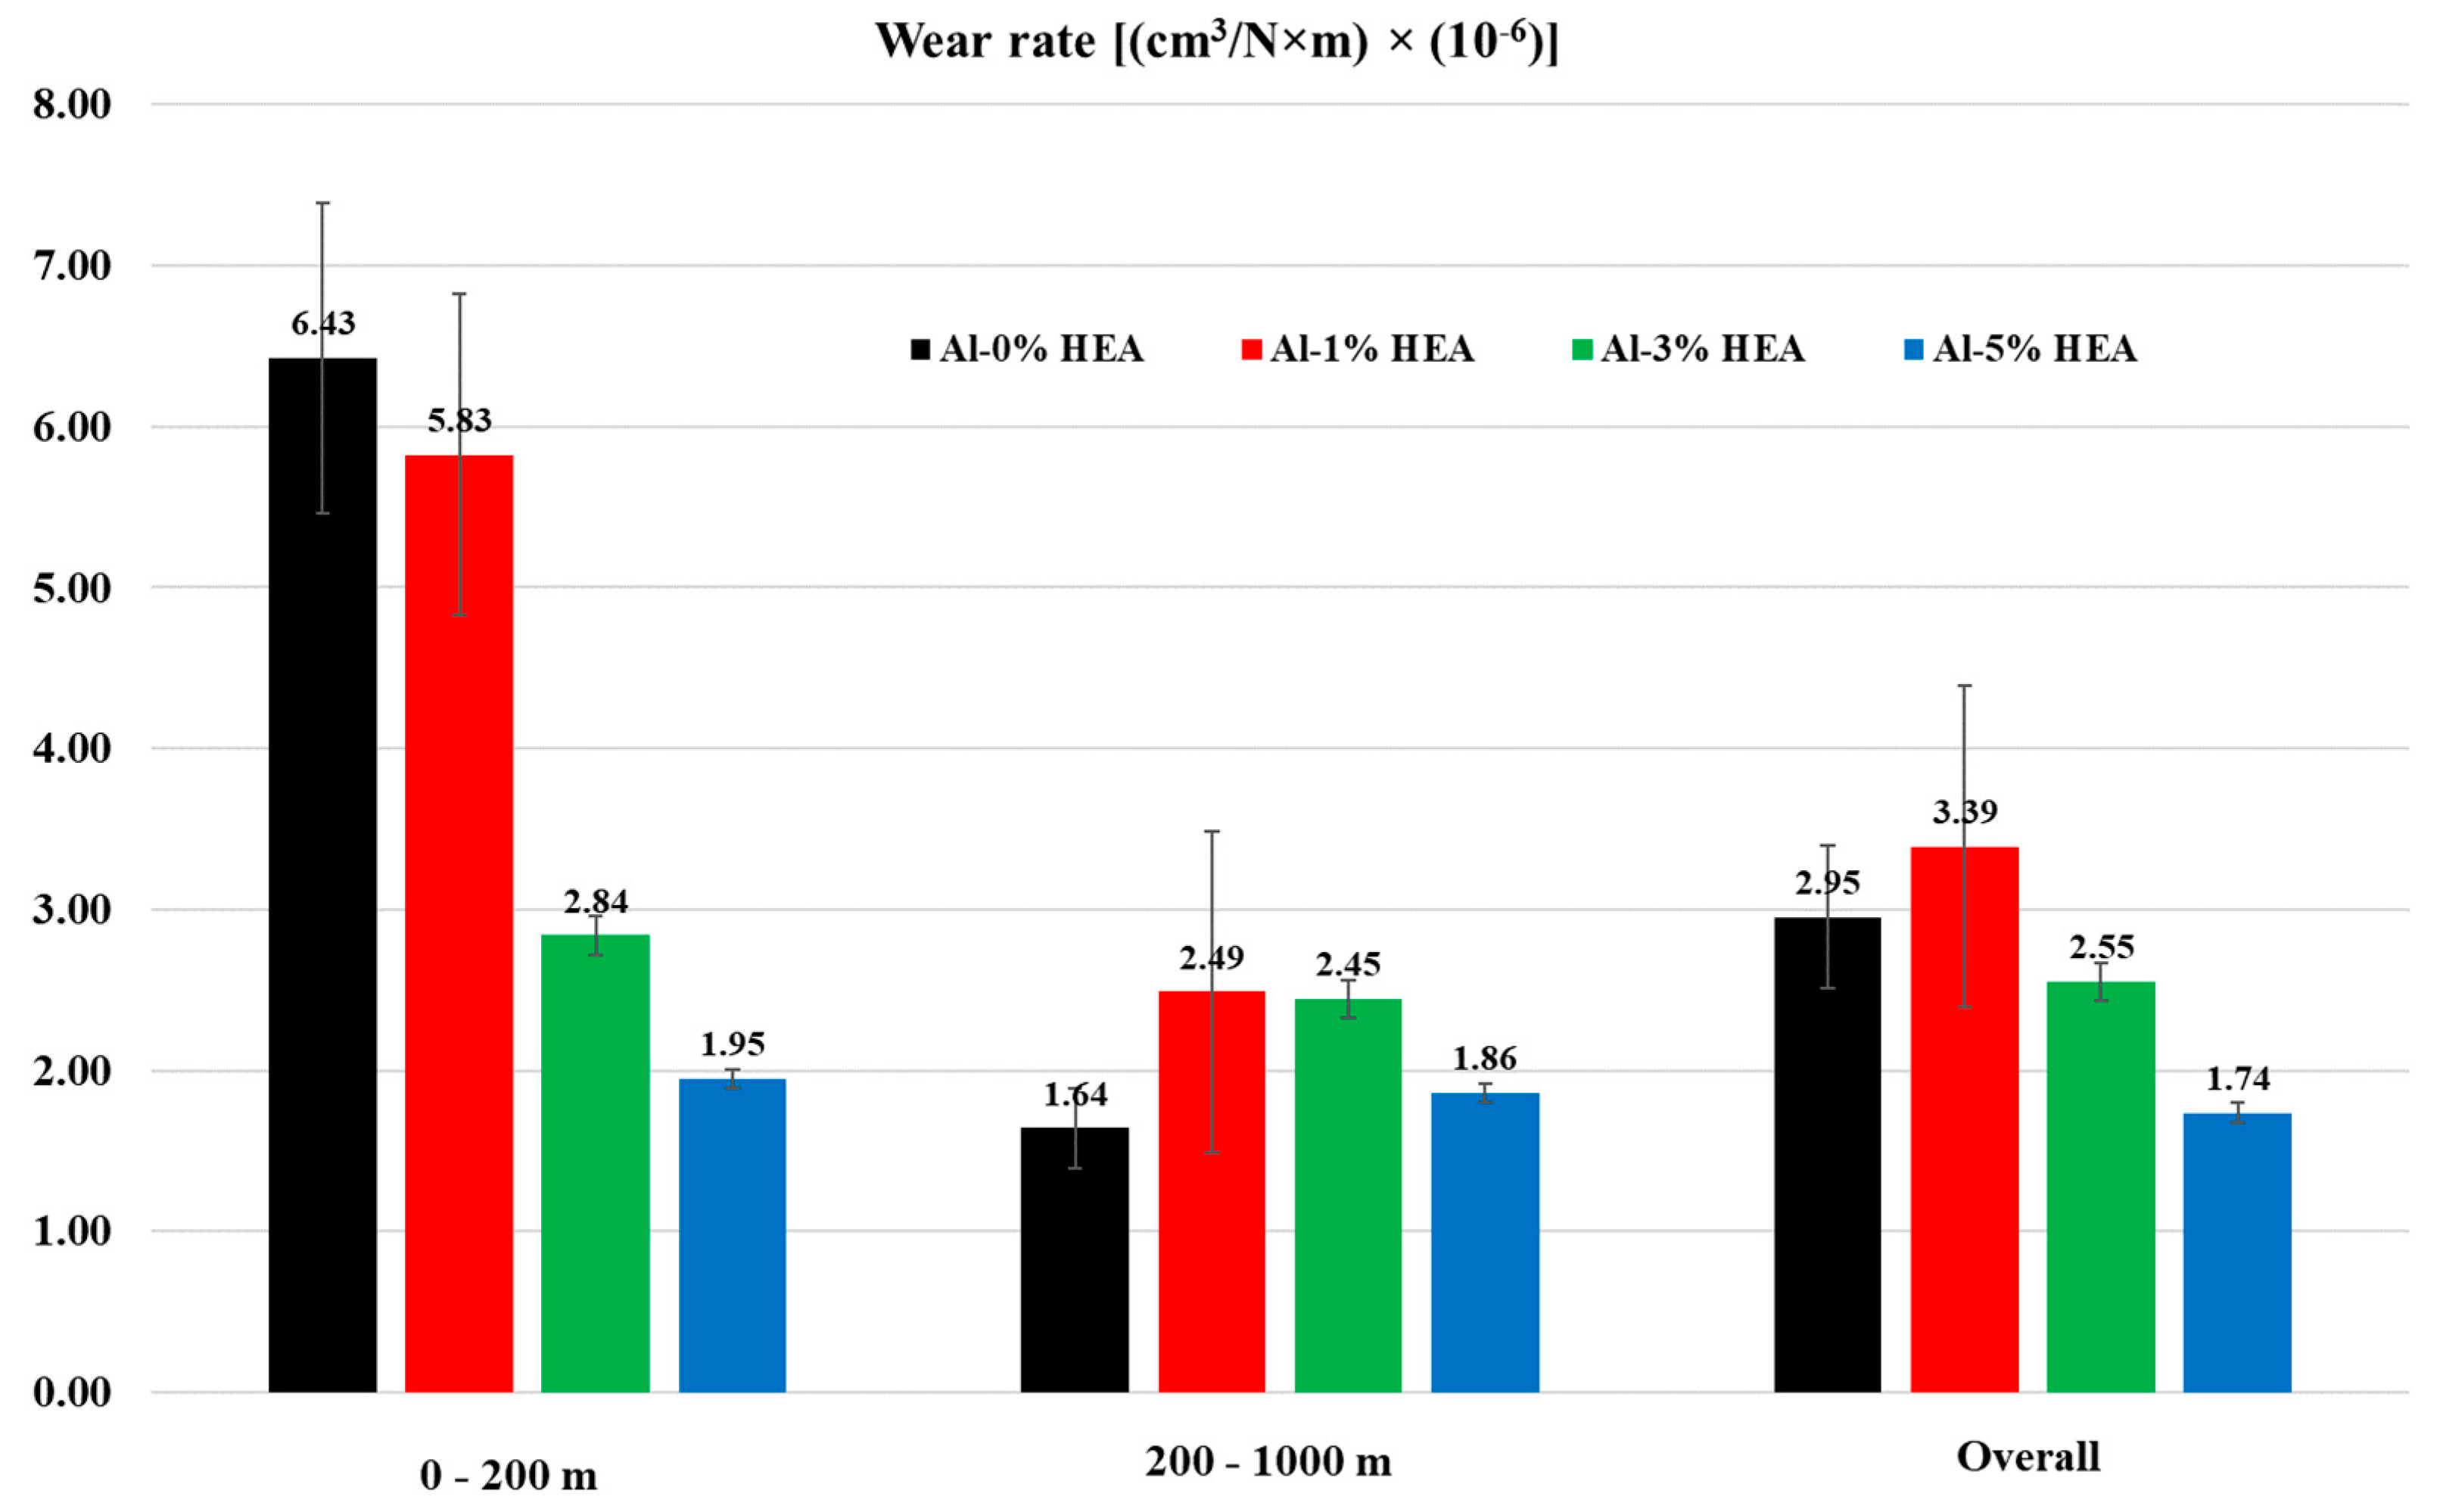
  • As far as the wear response is concerned, the increase in the reinforcement percentage lowers the wear rates;
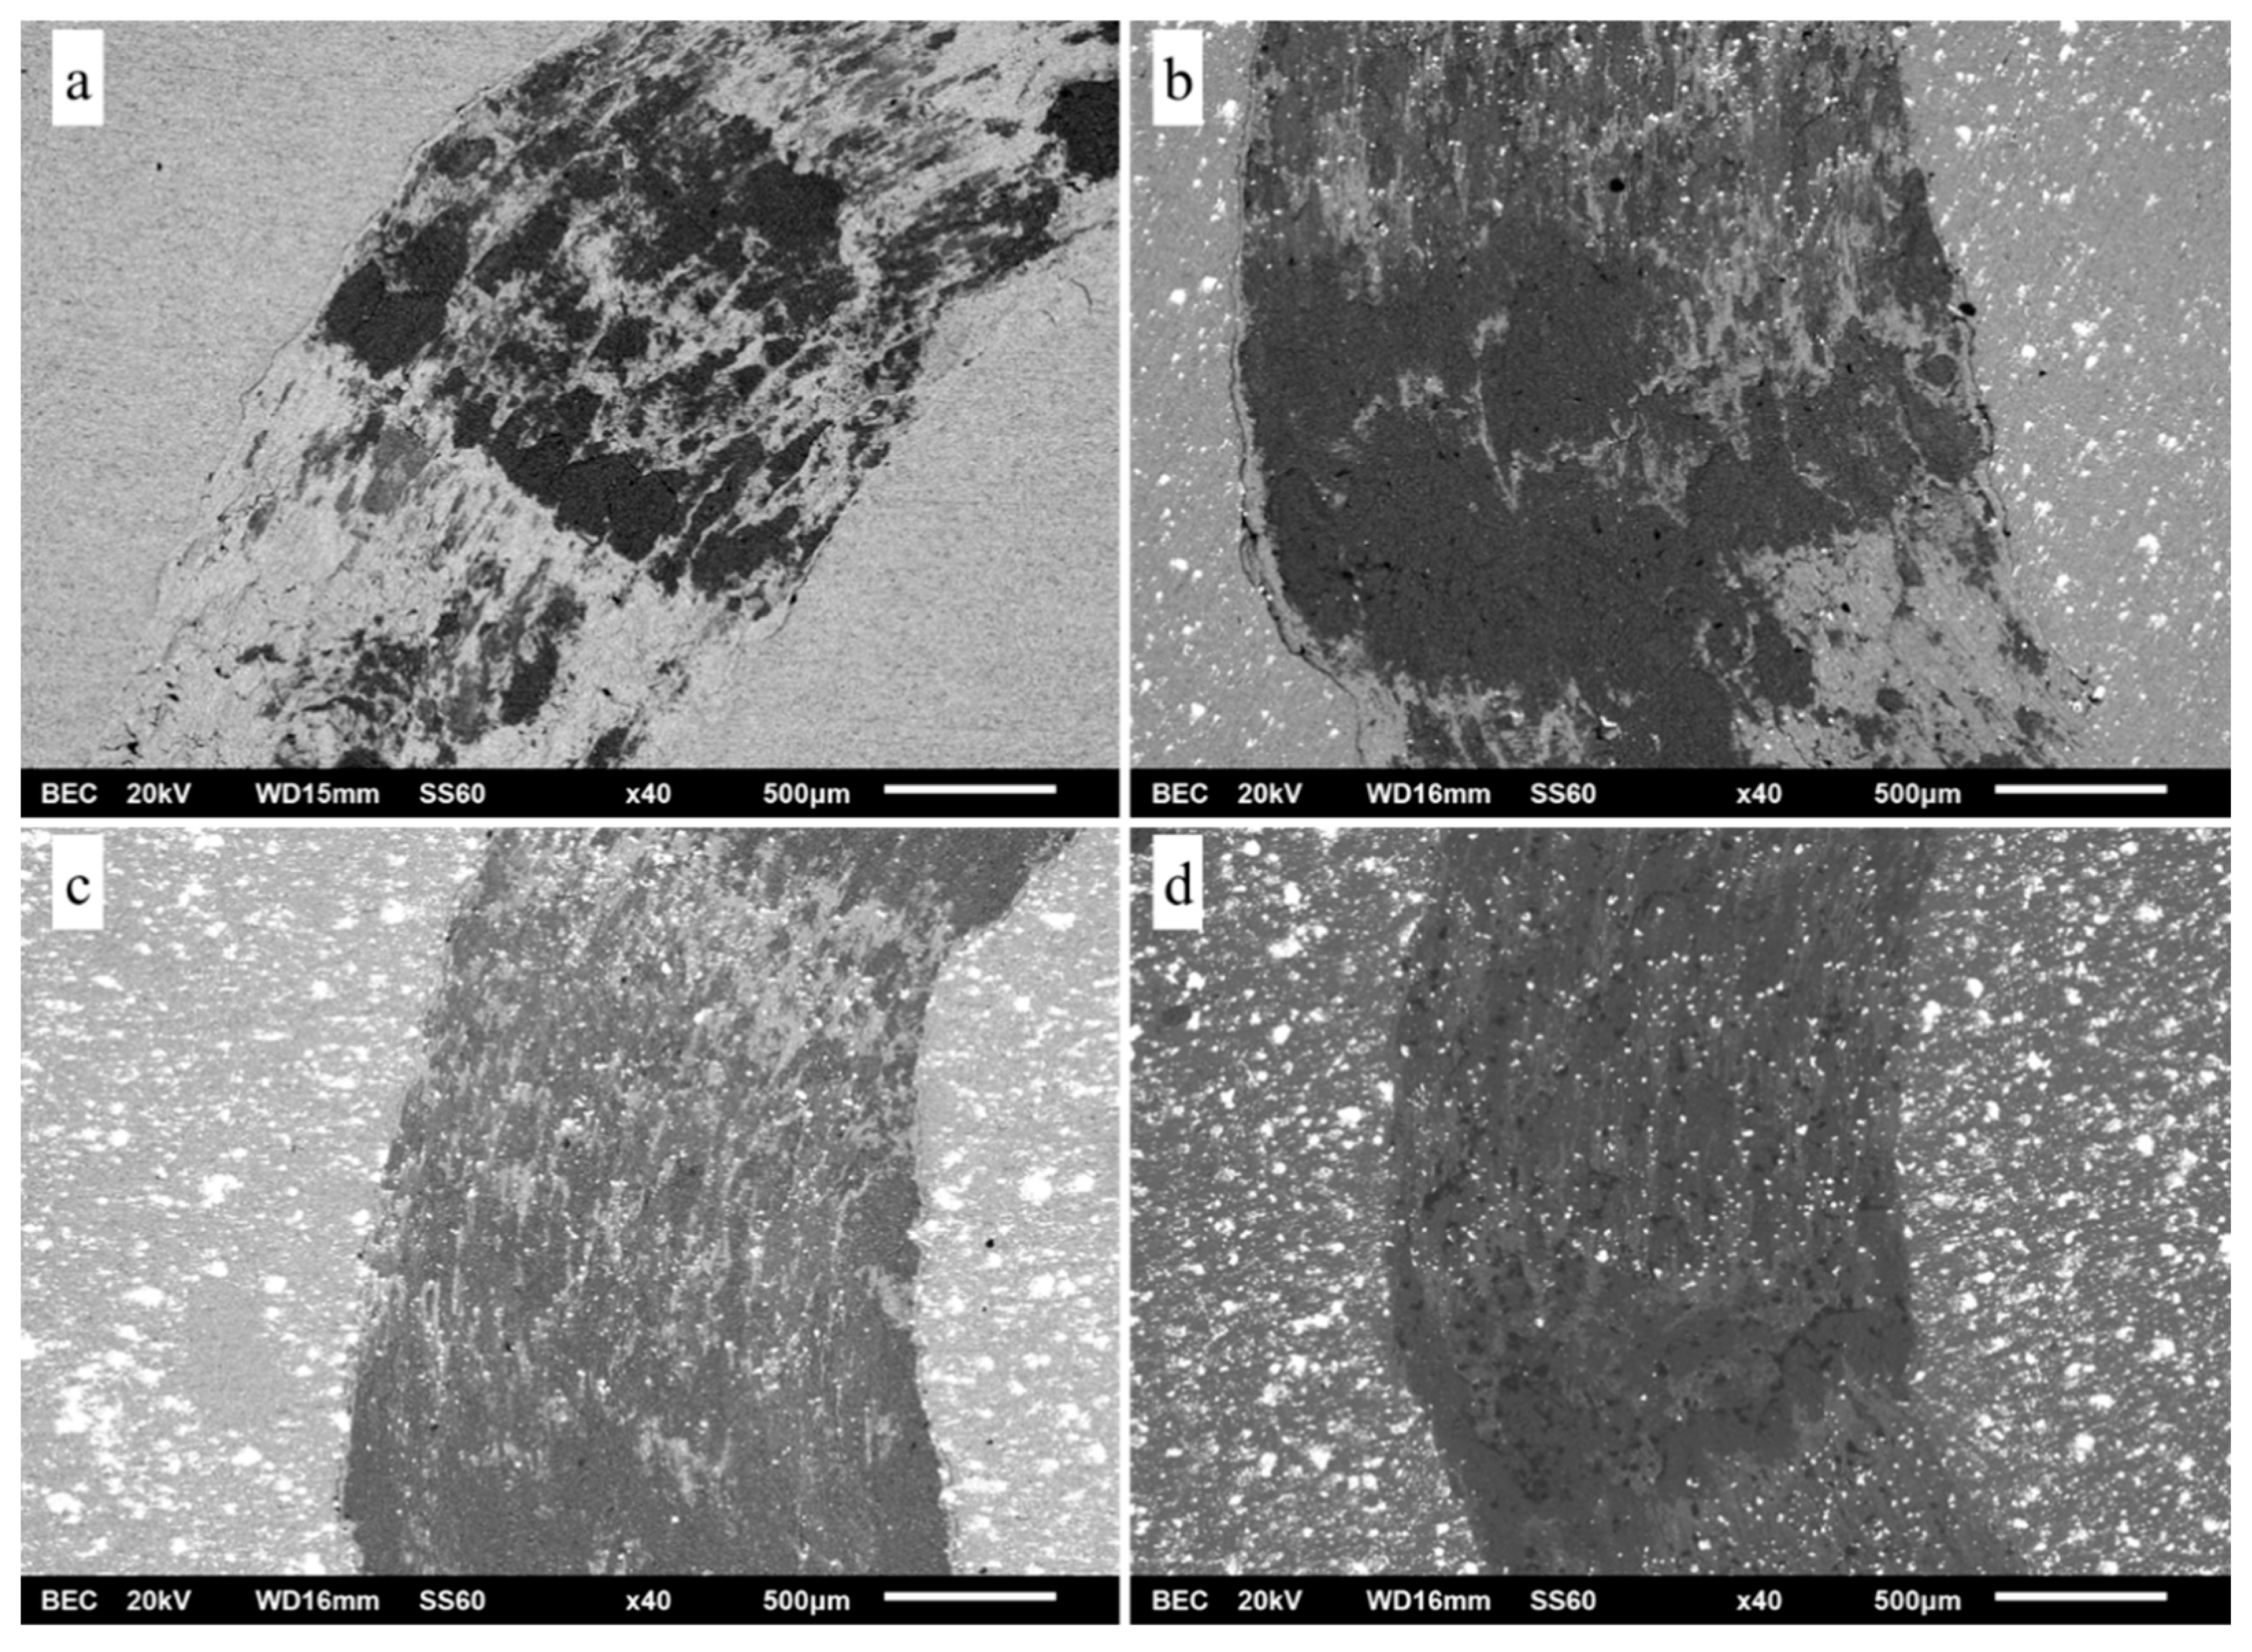
  • Intense wear with hill—valley morphology was evident in all specimens;
  • Oxidation—delamination was identified as the main wear mechanism accompanied by the contribution of an abrasive wear mode;
  • Conclusively, it is evident that the presence of the fine size particulates enhanced the creep response of the produced composites, where the coarse particles were mainly contributed to the enhancement of their sliding wear resistance.

Author Contributions

Conceptualization, E.A.A. and A.E.K.; methodology, E.A.A.; validation, T.E.M.; investigation, E.A.A. and A.E.K.; resources, T.E.M.; data curation, E.A.A.; writing—original draft preparation, E.A.A. and A.E.K.; writing—review and editing, E.A.A., A.E.K. and D.A.E.; visualization, E.A.A. and A.E.K.; supervision, T.E.M.; project administration, T.E.M. All authors have read and agreed to the published version of the manuscript.

Funding

This research received no external funding.

Conflicts of Interest

The authors declare no conflict of interest.

References

  1. Verma, V.; Khvan, A. A short review on Al MMC with reinforcement addition effect on their mechanical and wear behaviour. In Advances in Composite Materials Development; IntechOpen: London, UK, 2019. [Google Scholar]
  2. Hu, Q.; Zhao, H.; Li, F. Microstructures and properties of SiC particles reinforced aluminum-matrix composites fabricated by vacuum-assisted high pressure die casting. Mater. Sci. Eng. A 2017, 680, 270–277. [Google Scholar] [CrossRef]
  3. Yuan, Z.; Tian, W.; Li, F.; Fu, Q.; Hu, Y.; Wang, X. Microstructure and properties of high-entropy alloy reinforced aluminum matrix composites by spark plasma sintering. J. Alloys Compd. 2019, 806, 901–908. [Google Scholar] [CrossRef]
  4. Chen, J.; Niu, P.; Wei, T.; Hao, L.; Liu, Y.; Wang, X.; Peng, Y. Fabrication and mechanical properties of AlCoNiCrFe high-entropy alloy particle reinforced Cu matrix composites. J. Alloys Compd. 2015, 649, 630–634. [Google Scholar] [CrossRef]
  5. Liu, Y.; Chen, J.; Li, Z.; Wang, X.; Fan, X.; Liu, J. Formation of transition layer and its effect on mechanical properties of AlCoCrFeNi high-entropy alloy/Al composites. J. Alloys Compd. 2019, 780, 558–564. [Google Scholar] [CrossRef]
  6. Soorya Prakash, K.; Gopal, P.M.; Purusothaman, M.; Sasikumar, M. Fabrication and characterization of metal-high entropy alloy composites. Int. J. Met. 2020, 14, 547–555. [Google Scholar] [CrossRef]
  7. Vijayakumar, S.; Karunamoorthy, L. Wear characterization of aluminium metal matrix composites. Adv. Compos. Lett. 2013, 22, 096369351302200401. [Google Scholar] [CrossRef]
  8. Gousia, V.; Tsioukis, A.; Lekatou, A.; Karantzalis, A.E. Al-MoSi2 Composite Materials: Analysis of Microstructure, Sliding Wear, Solid Particle Erosion, and Aqueous Corrosion. J. Mater. Eng. Perform. 2016, 25, 3107–3120. [Google Scholar] [CrossRef]
  9. Clyne, T.; Withers, P. An Introduction to Metal Matrix Composites; Cambridge University Press: Cambridge, UK, 1995. [Google Scholar]
  10. Brown, K.R.; Venie, M.S.; Woods, R.A. The Increasing Use of Aluminum in Automotive Applications; Springer: Berlin/Heidelberg, Germany, 1995. [Google Scholar]
  11. Yeh, J.W.; Chen, S.K.; Lin, S.J.; Gan, J.Y.; Chin, T.S.; Shun, T.T.; Tsau, C.H.; Chang, S.Y. Nanostructured high-entropy alloys with multiple principal elements: Novel alloy design concepts and outcomes. Adv. Eng. Mater. 2004, 6, 299–303. [Google Scholar] [CrossRef]
  12. Jien-Wei, Y. Recent progress in high entropy alloys. Ann. Chim. Sci. Mat. 2006, 31, 633–648. [Google Scholar]
  13. Prabakaran, R.; Sait, A.N.; Sentilkumar, V. Synthesis and characteristization of high entropy alloy (CrMnFeNiCu) reinforced AA6061 aluminium matrix composite. J. Mech. Mech. Eng. 2017, 21, 415–424. [Google Scholar]
  14. Chinababu, M.; Krishna, N.N.; Sivaprasad, K.; Prashanth, K.G.; Rao, E.B. Evolution of Microstructure and Mechanical Properties of LM25–HEA Composite Processed through Stir Casting with a Bottom Pouring System. Materials 2022, 15, 230. [Google Scholar] [CrossRef] [PubMed]
  15. Luo, K.; Xiong, H.; Zhang, Y.; Gu, H.; Li, Z.; Kong, C.; Yu, H. AA1050 metal matrix composites reinforced by high-entropy alloy particles via stir casting and subsequent rolling. J. Alloys Compd. 2022, 893, 162370. [Google Scholar] [CrossRef]
  16. Meng, G.; Yue, T.M.; Lin, X.; Yang, H.; Xie, H.; Ding, X. Laser surface forming of AlCoCrCuFeNi particle reinforced AZ91D matrix composites. Opt. Laser Technol. 2015, 70, 119–127. [Google Scholar] [CrossRef]
  17. Meng, G.; Lin, X.; Xie, H.; Wang, C.; Wang, S.; Ding, X. Reinforcement and substrate interaction in laser surface forming of AlCoCrCuFeNi particle reinforced AZ91D matrix composites. J. Alloys Compd. 2016, 672, 660–667. [Google Scholar] [CrossRef]
  18. Mussert, K.M.; Vellinga, W.P.; Bakker, A.; Van Der Zwaag, S. A nano-indentation study on the mechanical behaviour of the matrix material in an AA6061-Al2O3 MMC. J. Mater. Sci. 2002, 37, 789–794. [Google Scholar] [CrossRef]
  19. Li, W.B.; Henshall, J.L.; Hooper, R.M.; Easterling, K.E. The mechanisms of indentation creep. Acta Metall. Et Mater. 1991, 39, 3099–3110. [Google Scholar] [CrossRef]
  20. Sannino, A.; Rack, H. Dry sliding wear of discontinuously reinforced aluminum composites: Review and discussion. Wear 1995, 189, 1–19. [Google Scholar] [CrossRef]
  21. Deuis, R.; Subramanian, C.; Yellup, J. Dry sliding wear of aluminium composites—A review. Compos. Sci. Technol. 1997, 57, 415–435. [Google Scholar] [CrossRef]
  22. Kumar, G.V.; Rao, C.; Selvaraj, N. Mechanical and tribological behavior of particulate reinforced aluminum metal matrix composites–a review. J. Miner. Mater. Charact. Eng. 2011, 10, 59. [Google Scholar] [CrossRef]
  23. Suh, N.P. The delamination theory of wear. Wear 1973, 25, 111–124. [Google Scholar] [CrossRef]
  24. Jiang, J.; Stott, F.; Stack, M. A mathematical model for sliding wear of metals at elevated temperatures. Wear 1995, 181, 20–31. [Google Scholar] [CrossRef]
  25. Heilmann, P.; Don, J.; Sun, T.C.; Rigney, D.A.; Glaeser, W.A. Sliding wear and transfer. Wear 1983, 91, 171–190. [Google Scholar] [CrossRef]
  26. Ananiadis, E.; Argyris, K.T.; Matikas, T.E.; Sfikas, A.K.; Karantzalis, A.E. Microstructure and Corrosion Performance of Aluminium Matrix Composites Reinforced with Refractory High-Entropy Alloy Particulates. Appl. Sci. 2021, 11, 1300. [Google Scholar] [CrossRef]
  27. Oliver, W.C.; Pharr, G.M. Measurement of hardness and elastic modulus by instrumented indentation: Advances in understanding and refinements to methodology. J. Mater. Res. 2004, 19, 3–20. [Google Scholar] [CrossRef]
  28. Rohatgi, P.; Asthana, R.; Das, S. Solidification, structures, and properties of cast metal-ceramic particle composites. Int. Met. Rev. 1986, 31, 115–139. [Google Scholar] [CrossRef]
  29. Cantor, B.; Chang, I.T.; Knight, P.; Vincent, A.J. Microstructural development in equiatomic multicomponent alloys. Mater. Sci. Eng. A 2004, 375, 213–218. [Google Scholar] [CrossRef]
  30. Mortensen, A.; Jin, I. Solidification processing of metal matrix composites. Int. Mater. Rev. 1992, 37, 101–128. [Google Scholar] [CrossRef]
  31. Zhang, L.; Yu, P.; Cheng, H.; Zhang, H.; Diao, H.; Shi, Y.; Chen, B.; Chen, P.; Feng, R.; Bai, J.; et al. Nanoindentation creep behavior of an Al 0.3 CoCrFeNi high-entropy alloy. Metall. Mater. Trans. A 2016, 47, 5871–5875. [Google Scholar] [CrossRef]
  32. Karantzalis, A.E.; Sioulas, D.; Poulia, A.; Mathiou, C.; Georgatis, E. A first approach on the assessment of the creep behavior of MoTaNbVxTi high entropy alloys by indentation testing. SN Appl. Sci. 2020, 2, 950. [Google Scholar] [CrossRef]
  33. Wang, Z.; Guo, S.; Wang, Q.; Liu, Z.; Wang, J.; Yang, Y.; Liu, C.T. Nanoindentation characterized initial creep behavior of a high-entropy-based alloy CoFeNi. Intermetallics 2014, 53, 183–186. [Google Scholar] [CrossRef]
  34. Yu, P.F.; Feng, S.D.; Xu, G.S.; Guo, X.L.; Wang, Y.Y.; Zhao, W.; Qi, L.; Li, G.; Liaw, P.K.; Liu, R.P. Room-temperature creep resistance of Co-based metallic glasses. Scr. Mater. 2014, 90, 45–48. [Google Scholar] [CrossRef]
  35. Wang, D.; Tan, J.; Li, C.J.; Qin, X.M.; Guo, S.F. Enhanced creep resistance of Ti30Al25Zr25Nb20 high-entropy alloy at room temperature. J. Alloys Compd. 2021, 885, 161038. [Google Scholar] [CrossRef]
  36. Ma, Y.; Feng, Y.H.; Debela, T.T.; Peng, G.J.; Zhang, T.H. Nanoindentation study on the creep characteristics of high-entropy alloy films: Fcc versus bcc structures. Int. J. Refract. Met. Hard Mater. 2016, 54, 395–400. [Google Scholar] [CrossRef]
  37. Ma, Z.S.; Long, S.G.; Zhou, Y.C.; Pan, Y. Indentation scale dependence of tip-in creep behavior in Ni thin films. Scr. Mater. 2008, 59, 195–198. [Google Scholar] [CrossRef]
  38. Choi, I.C.; Yoo, B.G.; Kim, Y.J.; Jang, J.I. Indentation creep revisited. J. Mater. Res. 2012, 27, 3–11. [Google Scholar] [CrossRef]
  39. Karantzalis, A.E.; Poulia, A.; Kamnis, S.; Sfikas, A.; Fotsis, A.; Georgatis, E. Modification of Cantor High Entropy Alloy by the Addition of Mo and Nb: Microstructure Evaluation, Nanoindentation-Based Mechanical Properties, and Sliding Wear Response Assessment. Alloys 2022, 1, 70–92. [Google Scholar] [CrossRef]
  40. Mandal, A.; Murty, B.; Chakraborty, M. Sliding wear behaviour of T6 treated A356–TiB2 in-situ composites. Wear 2009, 266, 865–872. [Google Scholar] [CrossRef]
  41. Hamid, A.A.; Ghosh, P.K.; Jain, S.; Ray, S. The influence of porosity and particles content on dry sliding wear of cast in situ Al (Ti)–Al2O3 (TiO2) composite. Wear 2008, 265, 14–26. [Google Scholar] [CrossRef]
  42. Shipway, P.; Kennedy, A.; Wilkes, A. Sliding wear behaviour of aluminium-based metal matrix composites produced by a novel liquid route. Wear 1998, 216, 160–171. [Google Scholar] [CrossRef]
  43. Basavarajappa, S.; Chandramohan, G.; Mahadevan, A.; Thangavelu, M.; Subramanian, R.; Gopalakrishnan, P. Influence of sliding speed on the dry sliding wear behaviour and the subsurface deformation on hybrid metal matrix composite. Wear 2007, 262, 1007–1012. [Google Scholar] [CrossRef]
  44. Yang, L. The effect of nominal specimen contact area on the wear coefficient of A6061 aluminium matrix composite reinforced with alumina particles. Wear 2007, 263, 939–948. [Google Scholar] [CrossRef]
  45. Chung, S.; Hwang, B.H. A microstructural study of the wear behaviour of SiCp/Al composites. Tribol. Int. 1994, 27, 307–314. [Google Scholar] [CrossRef]
  46. Tesfay, A.W.; Nath, S.; Ray, S. Effect of transfer layer on dry sliding wear behaviour of cast Al-based composites synthesized by addition of TiO2 and MoO3. Wear 2009, 266, 1082–1090. [Google Scholar] [CrossRef]
  47. Hutchings, I.; Shipway, P. Tribology: Friction and Wear of Engineering Materials; Butterworth-Heinemann: Oxford, UK, 2017. [Google Scholar]
  48. Mandal, A.; Chakraborty, M.; Murty, B. Effect of TiB2 particles on sliding wear behaviour of Al–4Cu alloy. Wear 2007, 262, 160–166. [Google Scholar] [CrossRef]
  49. Gómez-del Río, T.; Rico, A.; Garrido, M.A.; Poza, P.; Rodríguez, J. Temperature and velocity transitions in dry sliding wear of Al–Li/SiC composites. Wear 2010, 268, 700–707. [Google Scholar]
Figure 1. Nanoindentation load—unload cycle curves for pure Al, matrix, and HEA reinforcement.
Applmech 03 00065 g001
Figure 2. Power law fitting on actual creep depth versus time curve.
Applmech 03 00065 g002
Figure 3. Linear fitting on steady creep area for extrapolated stress exponent (n) slope calculation.
Applmech 03 00065 g003
Figure 4. Linear fitting on steady creep area for actual stress exponent (n) slope calculation.
Applmech 03 00065 g004
Figure 5. Loading stages for HEA, matrix, and pure aluminum at two different speeds.
Applmech 03 00065 g005
Figure 6. Creep indentation load—unload cycle curves for pure Al, matrix, and HEA reinforcement.
Applmech 03 00065 g006
Figure 7. Actual depth of creep indentation as a function of holding time.
Applmech 03 00065 g007
Figure 8. Vcr comparison for the three areas of interest at two different creep speeds for actual and extrapolated values.
Applmech 03 00065 g008
Figure 9. Volume loss versus sliding distance for each composition.
Applmech 03 00065 g009
Figure 10. Wear rates for the initial 200 m, 200 to 1000 m and overall distance of each composition.
Applmech 03 00065 g010
Figure 11. Wear tracks as acquired from SEM for the monolithic specimen (a) and for the reinforced specimens with 1 vol.% (b), 3 vol.% (c), and 5 vol.% (d) RHEA additions, respectively.
Applmech 03 00065 g011
Figure 12. Wear tracks as acquired from SEM in higher magnification. Cracks flow is visible in monolithic specimen (a), and in 1 vol.% reinforced specimen (b). In 3 vol.% (c) and 5 vol.% (d) specimens cracks are fewer and less visible.
Applmech 03 00065 g012
Figure 13. SEM images for debris from the monolithic matrix (a) and 1% (b), 3% (c), and 5% (d) vol. reinforced systems, respectively.
Applmech 03 00065 g013
Table 1. Nanoindentation based fundamental mechanical properties (loading speed 1).
Speed 1 (13.3240 mN/s)
Hardness (HV)Eit (GPa)nit (%)
Pure Al50.88 ± 1.7368.95 ± 1.176.58 ± 0.66
Matrix59.14 ± 10.3393.22 ± 5.413.51 ± 1.76
HEA653.24 ± 113.63129.04 ± 19.2231.16 ± 3.6
Table 2. Nanoindentation based fundamental mechanical properties (loading speed 6).
Speed 6 (2.2207 mN/s)
Hardness (HV)Eit (GPa)nit (%)
Pure Al56.29 ± 2.1162.69 ± 66.03 ± 0.59
Matrix60.26 ± 5.8780.83 ± 217.57 ± 3.96
HEA685.95 ± 137.14112.13 ± 23.4833.12 ± 4.53
Table 3. Creep response assessment data.
PhaseLoading Speed (mN/s)hcreep (nm)n actualn Extrapolatedm Actualm ExtrapolatedHmax (GPa)τmax
(GPa)
Vcr Actual (nm3)Vcr Extrapolated (nm3)
RHEA13.324050.444.744.90.0260.0275.181.000.1810.175
2.220743.741.741.50.0310.0314.800.920.1820.182
Matrix13.324043.851.649.70.0280.0270.700.1331.8211.744
2.220727.886.0101.40.0120.00980.570.1093.2473.778
Pure Al13.324049.438.135.30.0330.0410.620.1191.3111.218
2.220746.718.117.70.0650.0670.320.1210.6060.591
n actual, m actual, Vcr actual: Parameter values calculated based on the actual h creep depth as a function of time received during testing; n extra, m extra, Vcr extra: Parameter values calculated based on the extrapolated values of the h creep as a function of time after fitting by Equation (4).
Publisher’s Note: MDPI stays neutral with regard to jurisdictional claims in published maps and institutional affiliations.

