1. Introduction
The operation of rotating machinery such as turbomachinery requires nonintrusive monitoring due to economic and accessibility reasons. A set of control parameters is updated in an iterative manner to detect possible changes in the operational behaviour. This in turn, is defined as structural health monitoring (SHM), which should prevent possible damages and failures from happening. SHM tools usually depend on some kind of analytical and most often purely linear model. More and more often, neural networks are used for the decision-making process of the systems’ structural condition as they offer a high reliability when trained with a big data set according to Sohn et al. [
1]. The authors further explain in their literature review that many insights of monitoring processes are gained under laboratory conditions and need to be transferred to real applications.
There are different ways and techniques to monitor turbomachinery. Mevissen and Meo [
2] reviewed different SHM technologies for the control of gas turbines with the general assumption that SHM approaches need to take processing noise and ambient conditions into account. It is necessary to differentiate between deviations due to structural change and those caused by a shift of the ambient conditions. To overcome the ambient influence, the ambient conditions can be considered as part of the model. An alternative can be provided by the selection of analysis parameter, which are less sensitive to the changing ambient conditions [
3].
Different probe types such as tip timing or inductive sensors are presented by Mevissen and Meo [
2]. Tip timing can observe the blades’ dynamic behaviour as well as the tip gap; unfortunately changes in the starting and stopping process of turbomachinery can change the blade position and lead to false detections. Witoš et al. [
4] presented a holistic approach using, among others, contactless tip-timing measurements to control the rotating components. Inductive sensors can measure the tip clearance but are limited to low temperature and nonferrous casing materials [
2]. Different online and offline methods for temperature monitoring were reviewed by Yule et al. [
5]. In addition, Shiryayev et al. [
6] studied the fatigue detection of disks using harmonic responses caused by the crack nonlinearity.
Vibrational monitoring is described as the most common approach by Mevissen and Meo [
2], who used rotor information captured at the bearings and casing information, which is usually obtained by accelerometers on the structure. A combination of this information can lead to a first estimation of the system behaviour. Although this approach is most often restricted to the detection of severe damages rather than small changes, such as small damages on the blades, it has nevertheless proven to be a reliable and cost-effective method. Since the overall vibration level in a system is often related to a change in system behaviour, Goyal and Pabla [
7] proposed the use of vibration data for SHM purposes. Once again, the authors point out that natural frequencies and modal parameters, in general, are not very sensitive to structural damages, but the changes in mode shape curvature can nevertheless provide valuable insight to determine the cause of a defect. Other examples for the monitoring of vibrational behaviour are given by Burdzik et al. [
8], who considered vibroacoustic methods for SHM in manufacturing processes or Varanj et al. [
9], who introduced a noncontact data acquisition system for condition monitoring of gearboxes in rotating machinery.
It is generally accepted that operational modal analysis (OMA) can be an important tool for the online identification of modal parameters and that the results of such an OMA can be used to identify changes in the behaviour of a system and sometimes even to identify changes in parameters or in the integrity of a system. OMA is used broadly in the civil engineering domain such as for the vibrational investigation of bridges, wind turbines or high-rise buildings. It uses random natural excitation to investigate the structure of interest. Kim et al. [
10] proposed an approach for SHM of an offshore wind turbine using OMA with numerical sensors—the numerical sensor signals were gained from a time-domain computer simulation of the coupled wind turbine and underwater structure system. Deraemaeker et al. [
3] compared the stochastic subspace identification (SSI) with a novel approach for automation and the computation of peak indicators for the modal identification. The authors studied different methods to handle the influence of the environment and tested the presented approaches on a numerical model of a bridge. As mentioned previously, eigenfrequencies are not ideally suited for damage detection as they might be sensitive to changes in the ambient conditions if the environment is not included in the system definition. Therefore, the authors introduced peak indicators (the output of modal filters) as a substitute analysis parameter. Reynders et al. [
11] extended the investigation of the ambient influence to nonlinear behaviour. Di Lorenzo et al. [
12] used OMA for damage detection on a 10 MW wind turbine, where the measurement data from the damaged structure were gained from a virtual model. Uhl et al. [
13] presented an OMA application for the SHM of a rotating test rig, corresponding to a small model setup.
For rotating machinery, the random excitation assumed for OMA is superposed by an additional periodic signal, which is synchronous to rotation, and might cause disturbances when performing OMA [
14]. There are several methods to eliminate the periodic signal from the measured vibration data, such as statistical driven identification, pre-processing techniques, modification to existing identification techniques, and input spectrum independent techniques, see Motte et al. [
15]. Brincker et al. [
16] also dealt with the separation of structural and harmonic modes based on statistical characteristics. Mohanty and Rixen [
17,
18,
19] presented different modified methods analysing operational data by incorporating the harmonic excitation.
Most presented cases in the literature consider civil engineering applications such as bridges, but there is a lack of OMA applications for SHM purposes in mechanical engineering, especially for real applications of rotating machinery. An example of a real mechanical engineering application is given in the following section using the axial compressor test rig at the Institute of Turbomachinery and Fluid-Dynamics (TFD) of Leibniz Universität Hannover. An analysis of the supposed structure was already performed by the authors of this work using experimental modal analysis (EMA) and standstill conditions to determine the casing influence on rotordynamics [
20]. Since accessibility is not necessarily guaranteed on a big structure such as the axial compressor, the use and further qualification of OMA as an SHM tool is of great relevance. Firstly, the modal identification of a turbomachinery is associated with several challenges, such as the influence of rotation on the modal parameters and the realisation of a targeted excitation in case an EMA shall be performed. For this purpose the OMA represents a suitable alternative, which is studied in this research work. Secondly, vibrational data have proven to be a reliable measure for monitoring problems and OMA offers a possibility to make use of this type of data. Again, this fact reinforces the importance of the following investigations. Additionally, OMA represents a nonintrusive method and can be operated remotely, which facilitates the execution and handling of the monitoring.
The long-term objective of our research is to deduce the rotor condition from the casing vibration signature during operation. As a first step, it is aimed to describe the vibrational behaviour of an axial compressor by means of the OMA. This should serve as the basis for an online monitoring approach of the whole structure.
2. Methods
For the following investigation, the axial compressor at TFD with a single stage rotor was analysed. It consists further of an inlet guide vane, as well as a stator downstream of the rotor, which have an adjustable angle of attack, see
Figure 1.
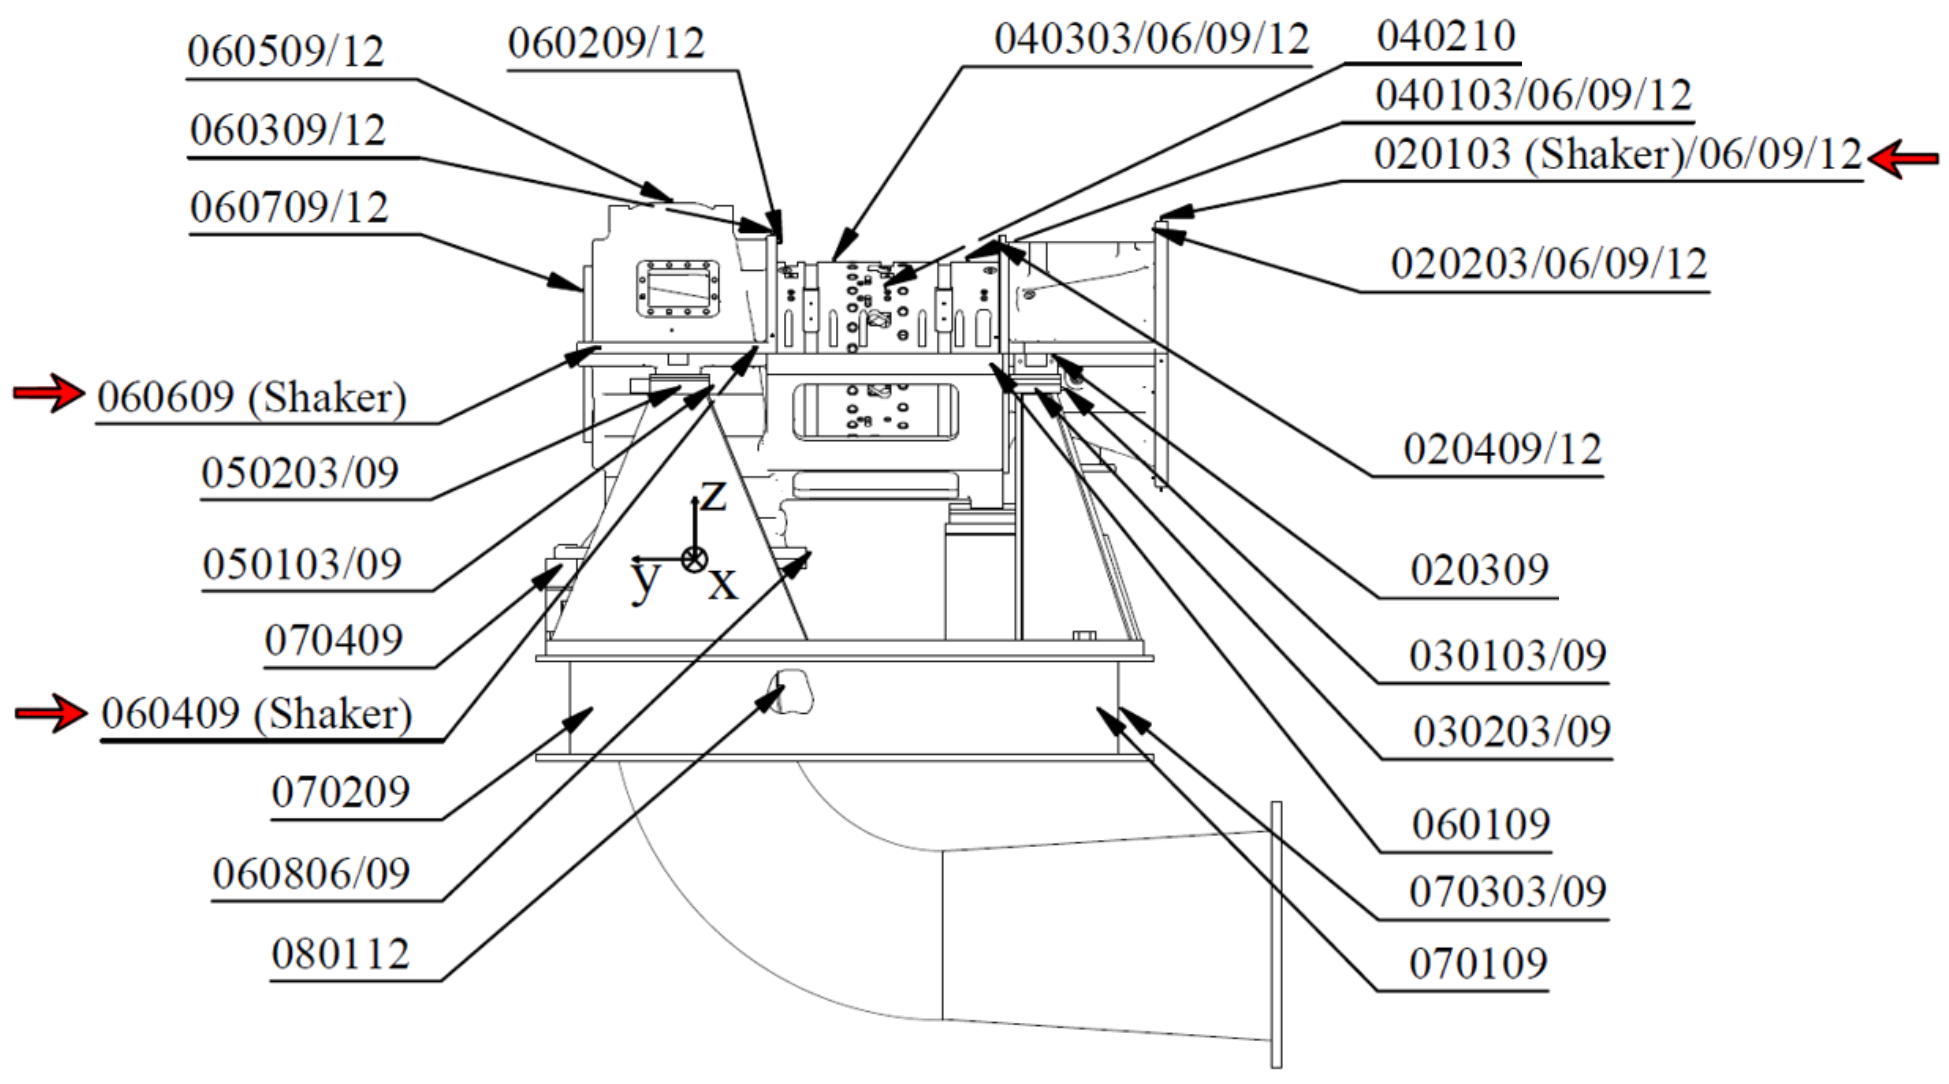
For the experiments, the axial compressor casing was equipped with 49 acceleration sensors in total, which served to identify the system behaviour.
Figure 2 shows the sensor setup on the structure.
The test rig was operated under varying operating conditions and thus changing loads. The machine was started and slowly run up until its nominal speed of 17,100 rpm. Afterwards it was operated at different speeds. The test compressor was usually operated 8 h straight, and then remained shut down until the next testing day.
For the application of OMA techniques, four conditions need to be fulfilled:
Linear structural behaviour;
Time invariant behaviour;
Observability of the system, and
Excitation by white Gaussian noise.
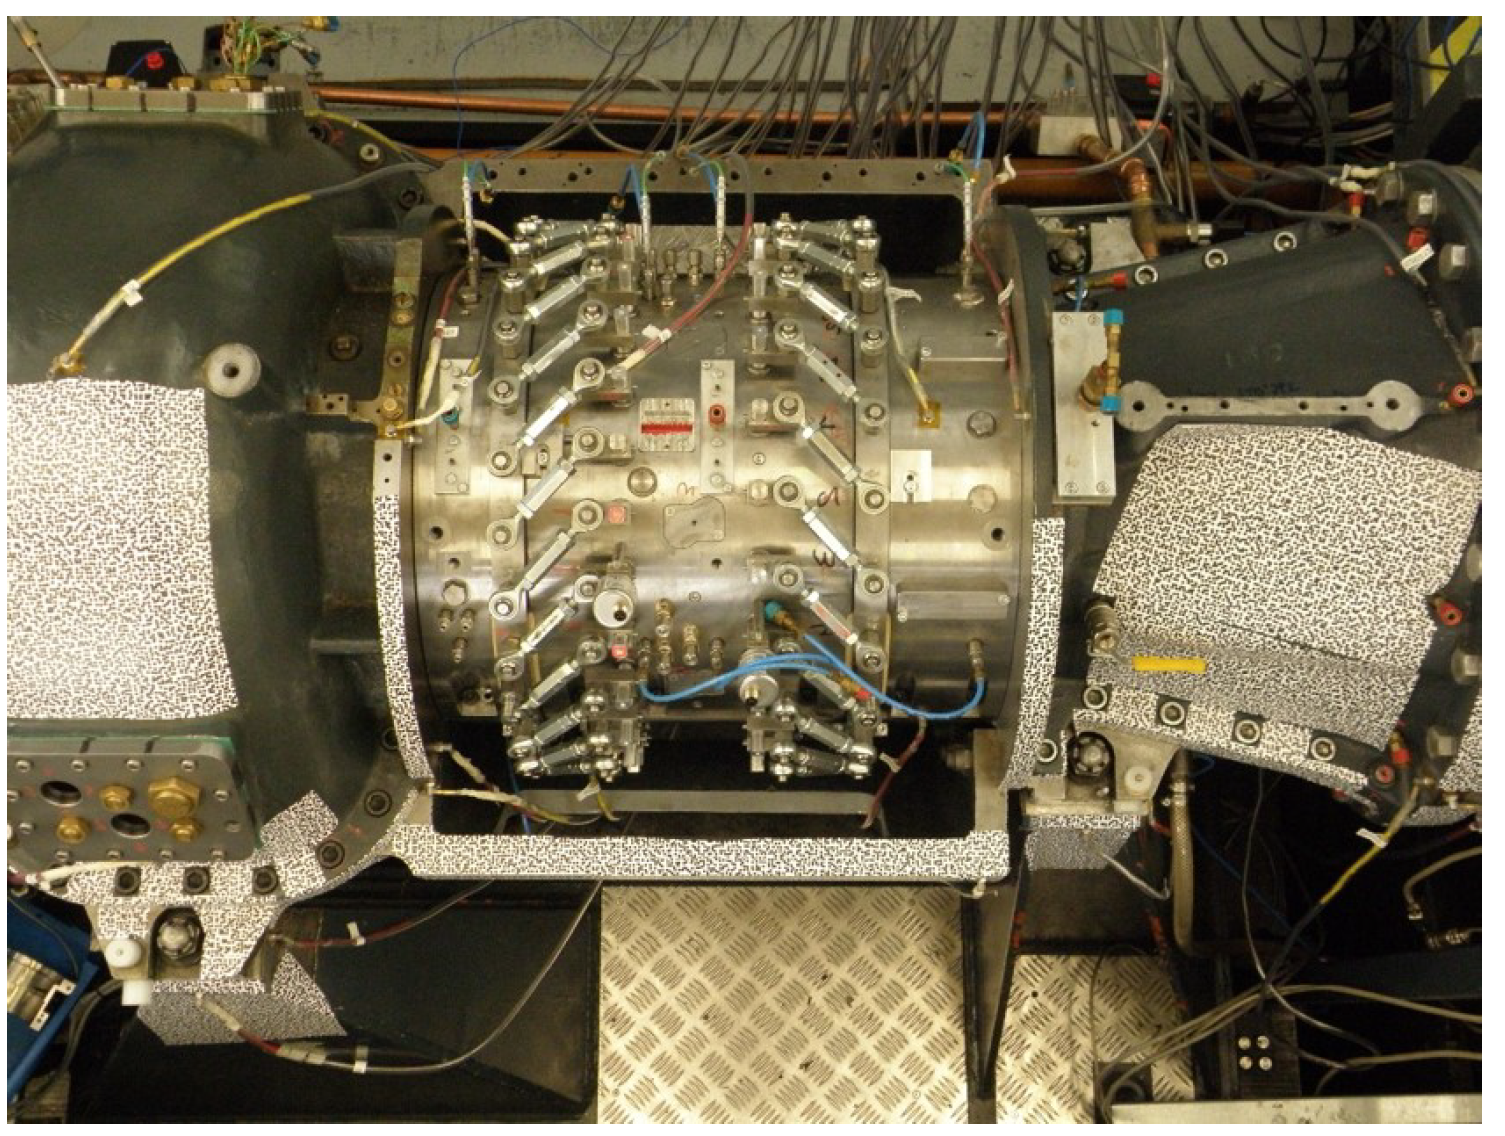
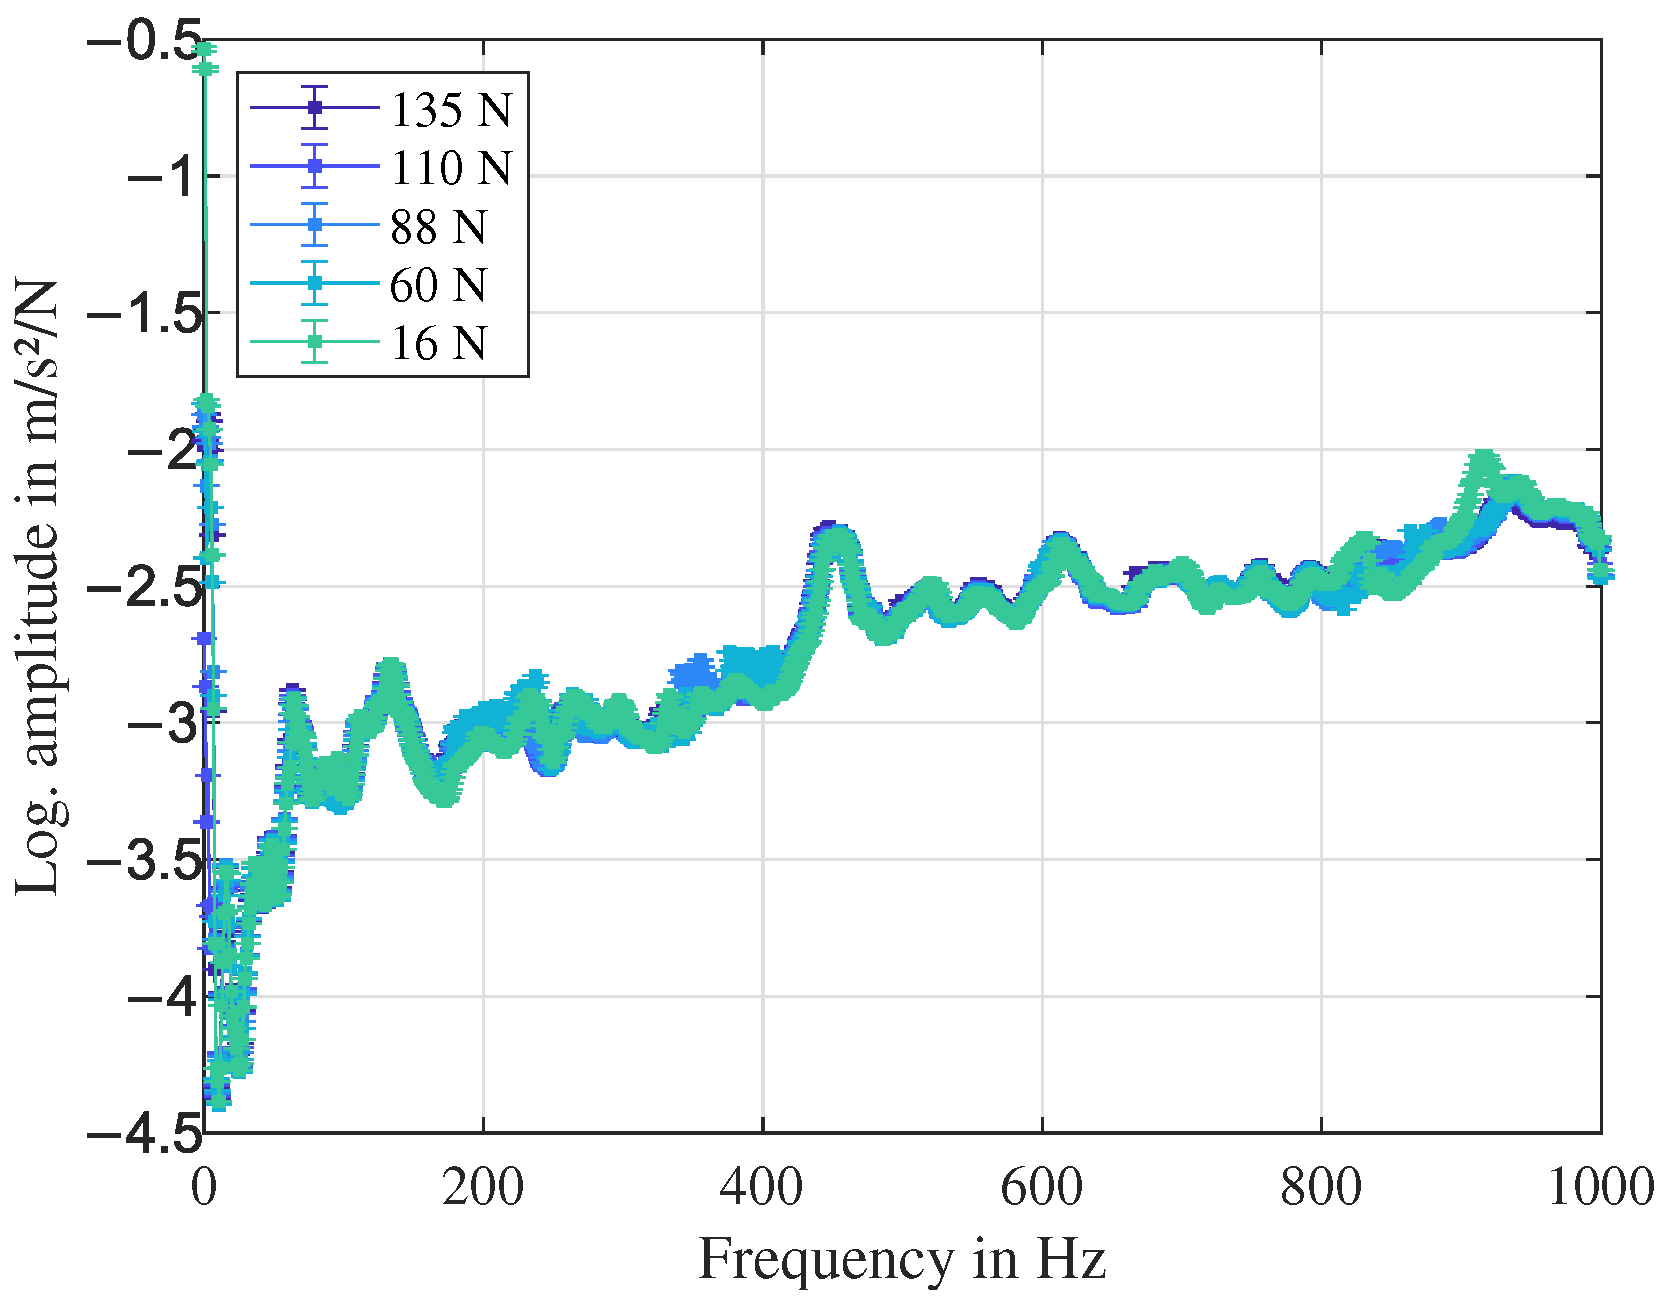
A largely linear behaviour of the compressor casing was observed while exciting the structure in standstill conditions with a shaker using different excitation levels, see
Figure 3. For this measurement the compressor was fully assembled and excited by a shaker with a maximum force of 350 N. A sine sweep from 10 to 1000 Hz was performed as excitation source. Throughout the whole analysis, three different excitation positions were included, two on the upper outlet casing component and one on the upper inlet casing component. The results shown in
Figure 3 were gained from an excitation position of the shaker at the outlet casing. The outlet casing component is depicted in
Figure 1 on the left side. The shaker was connected by a thin rod to the structure—a so-called stinger, which is responsible for eliminating shear forces. The different force levels were reached by adjusting the output voltage, which can reach a maximum of 5V.
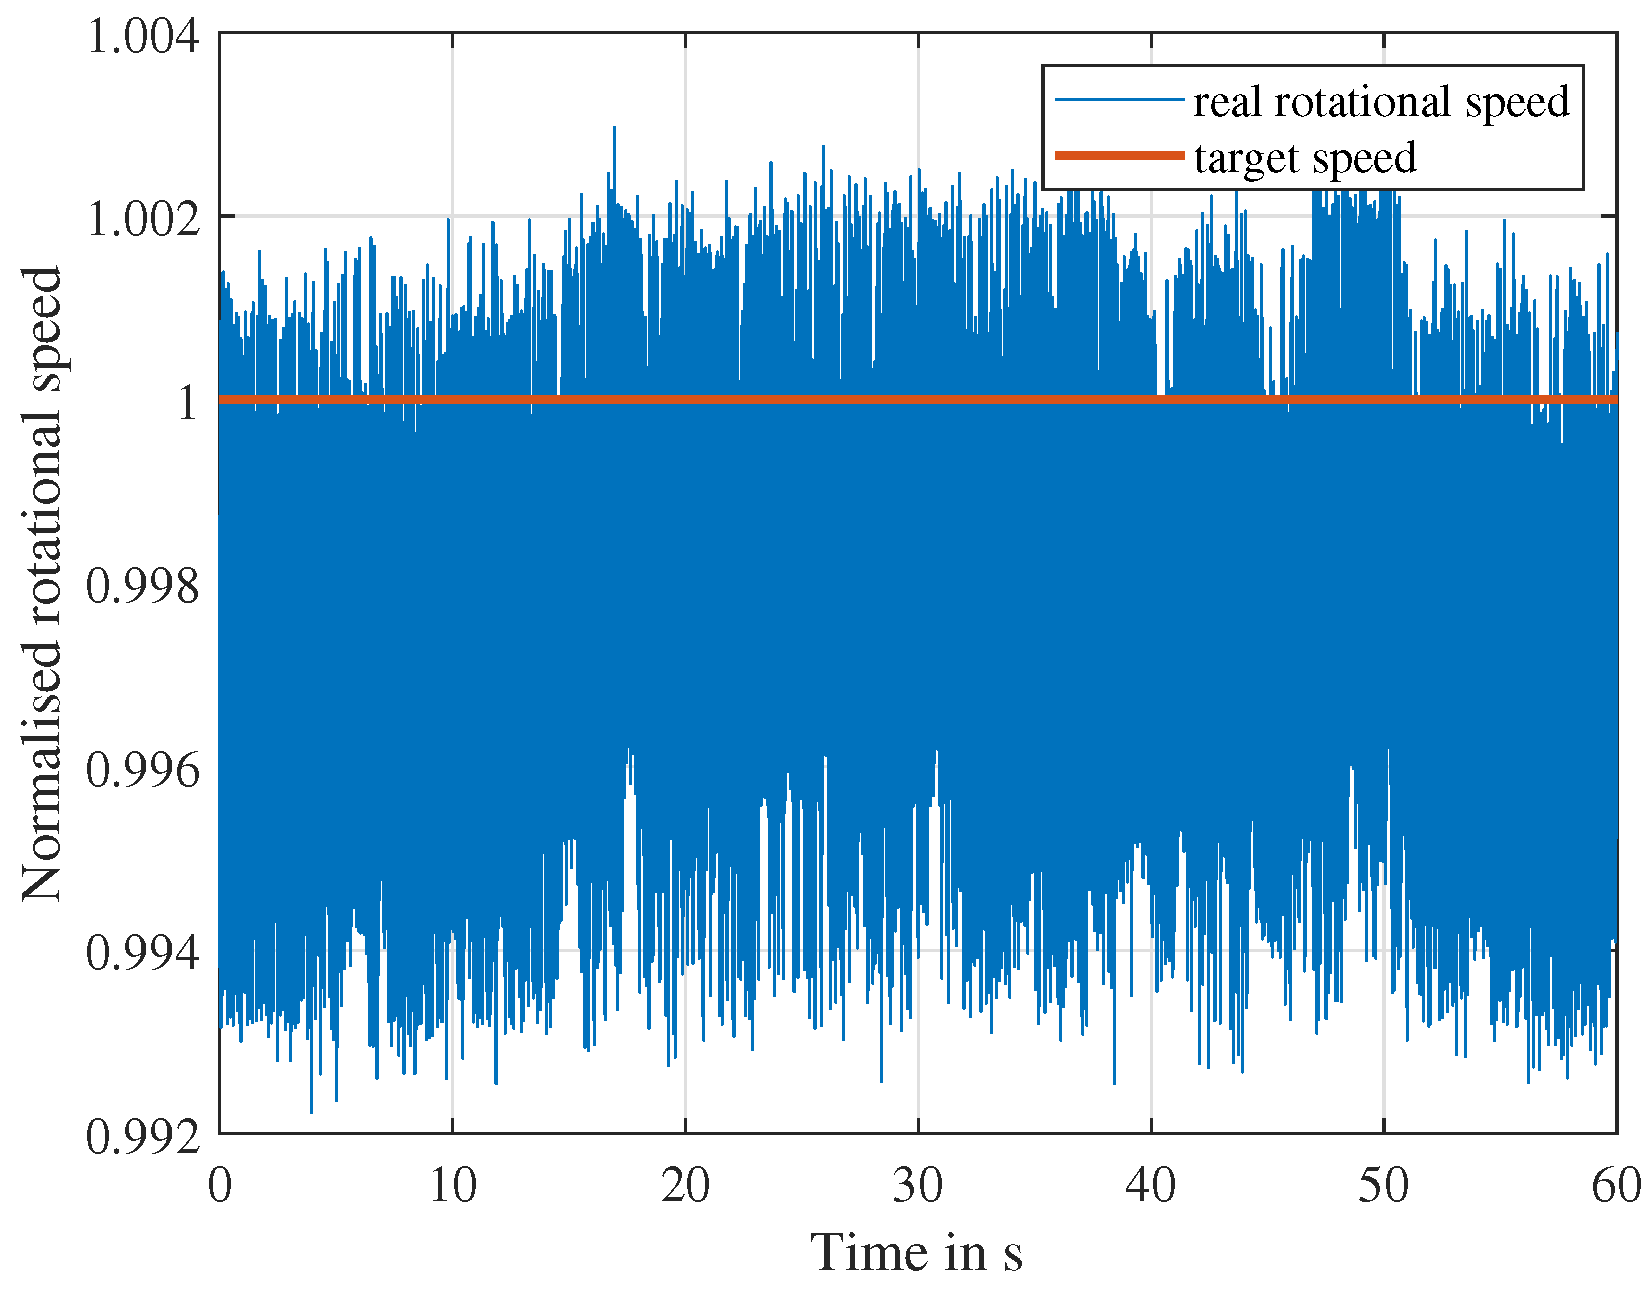
Stationary operational points were achieved using a speed regulation, which kept the rotational speed as constant as possible. An example of the deviation of the rotational speed is shown in
Figure 4.
The rotational speed varies within a range of less than 1%.
The white noise excitation was checked by applying the first four statistical moments, and it was found to be approximated quite well by the model of a white noise Gaussian random process, as shown in the Results section. Thus, the conditions for OMA application were fulfilled.
The definition of the system boundary is essential. The rotor, which will most likely be the source of any defects, e.g., due to unbalance or misalignment [
21], is not detached from its casing and support structures. For this reason, the casing needs to be part of the SHM approach either modelled completely or as intersection between rotor and the environment. In the following analysis, the approach is pursued to consider a combination of rotor and casing on which the sensors are mounted as shown in
Figure 2, capturing the overall dynamic behaviour.
To perform an OMA, different methods can be considered such as procedures in frequency and time domain. Next, the focus is on OMA in the time domain using the SSI, which again is divided into covariance-driven and data-driven approaches. For the following section a nomenclature can be found in the Abbreviations section.
The SSI is based on the discretised state-space representation of a dynamic system without a deterministic input
with the state vector
, the output vector
, and the measurement uncertainties and noise represented by
and
. The system matrix
, containing the modal information, needs to be determined [
22].
The measured output data—displacement, velocity, and acceleration—is divided and structured into a past matrix
and a future matrix
[
3]
The system order
N is set by the user of the software tool; for such a complex structure a number between 80 and 100 is recommended. The number of columns
M in these two matrices should ideally be
. As this is numerically not feasible, it is set to
using the model order and number of data points
d. The matrix definitions in Equation (
3) can be used for the covariance-based approach, to construct the
Toeplitz matrix
as follows
The SSI is based on the assumption that the system considered in the analysis can be observed by the
Kalman filter and the observability matrix
can be calculated [
23] as
which contains the system matrix
. The principle of observability is based on the fact that not all state variables can be measured and the output vector is captured. Accordingly, a system is called observable if the initial state can be derived by the development of the input and output. Therefore, the observability principle can be described by Equations (
1) and (2) and thus the observability matrix is dependent on
and
.
The
Toeplitz matrix can then also be expressed by the multiplication of the observability matrix and the pseudo-controllability matrix
In order to separate the observability matrix
, containing the sought-after results, from the pseudo-controllability matrix
, a singular value decomposition (SVD) is performed
with
a diagonal matrix with singlar values,
a unitary matrix and
an adjoint matrix. Using Equation (
7), both matrices from Equation (
6) can be derived
and subsequently the system matrix
can be extracted. Therefore, the pseudo-inverse
is calculated using the shifted observability matrix, once shifted a block upwards and once one block downwards,
so that the final equation is:
For the data-driven approach, the future and past matrix are arranged in the so-called
Hankel matrix
as follows:
A projection of the future matrix onto the past matrix is performed
in order to reduce the matrix dimension. The projection in Equation (
12) can also be expressed by the
Toeplitz matrix
which contains the observability matrix according to Equation (
6).
The
Hankel matrix can be expressed by a QR-decomposition
being a triangular matrix and
being an orthogonal matrix, which facilitates the implementation. Inserting the definitions
in Equation (
12) leads to
and the calculation of the projection can be performed in a time-efficient manner. A more detailed derivation is not provided here. Similar to the covariance-based method, an SVD is applied to the projection matrix as shown in Equation (
7). The steps from Equations (
8)–(
10) are subsequently executed in order to obtain the system matrix
[
24].
The data-driven approach can be more accurate, but at the same time more time- and data-consuming because of the large matrix size, which needs to be calculated. For this reason, the first data analysis in this work was performed using the covariance-driven method. In a sample analysis, the evaluation with the data-driven approach took approximately 10 times longer than the covariance-driven procedure.
The data in this investigation were sampled at 25.6 kHz as they need a high resolution for the trigger signal of the rotational speed. For the analysis, the data were downsampled by a factor of 10, as only the frequency range up to 1000 Hz is of relevance (maximum operating range up to 285 Hz).
The random excitation by white noise through the environment was superposed with a periodic rotation-synchronous signal caused by the rotational speed. It can be distinguished from structural modes as it results in high, thin peaks with a very low damping, close to zero. There are several ways to address the disturbing signal such as filtering or taking it as an additional excitation source into account. In the following investigation, the periodic signal is eliminated from the results as it is known from the measurement settings, having a predefined rotational speed during the experiments. It can also be identified looking at its damping values.
3. Results
Firstly, the measurement uncertainty had to be considered in order to classify the results correctly. The acceleration sensors used for the analysis implied a linearity error of 1%. The signal processing system had an amplification error of 1.158%, which led to a total measurement uncertainty
u of
of approximately 2.2%. The standard deviation
of the measurement values was also considered by taking three measurements under the same conditions into account within a confidence interval of 95%. The total measurement uncertainty is given by
,
n being the number of repeated measurements
n = 3. The standard deviation is supposed to be t-distributed and the measurement uncertainty of the equipment is supposed to be rectangular-distributed. The factor
k = 1.97 stands for the 95% confidence interval. The overall measurement uncertainty is also shown by error bars in
Figure 3.
For the comparison of the results from the application of the OMA techniques, data from an EMA were used. Experiments in standstill conditions were performed, where the rotor was at rest in the bearings of the axial compressor. Then, the rotor was removed from the bearings to obtain the pure casing modes without the uncertainty caused by the bearing parameters and the unknown position of the rotor in the bearings. Once fully assembled, the compressor casing was excited by a shaker. The identified modal parameters from EMA are displayed in
Table 1. More details can be found in [
20].
The lower modes seem not to be strongly influenced by the rotor as the mass ratio between rotor and casing is approximately 1:17.
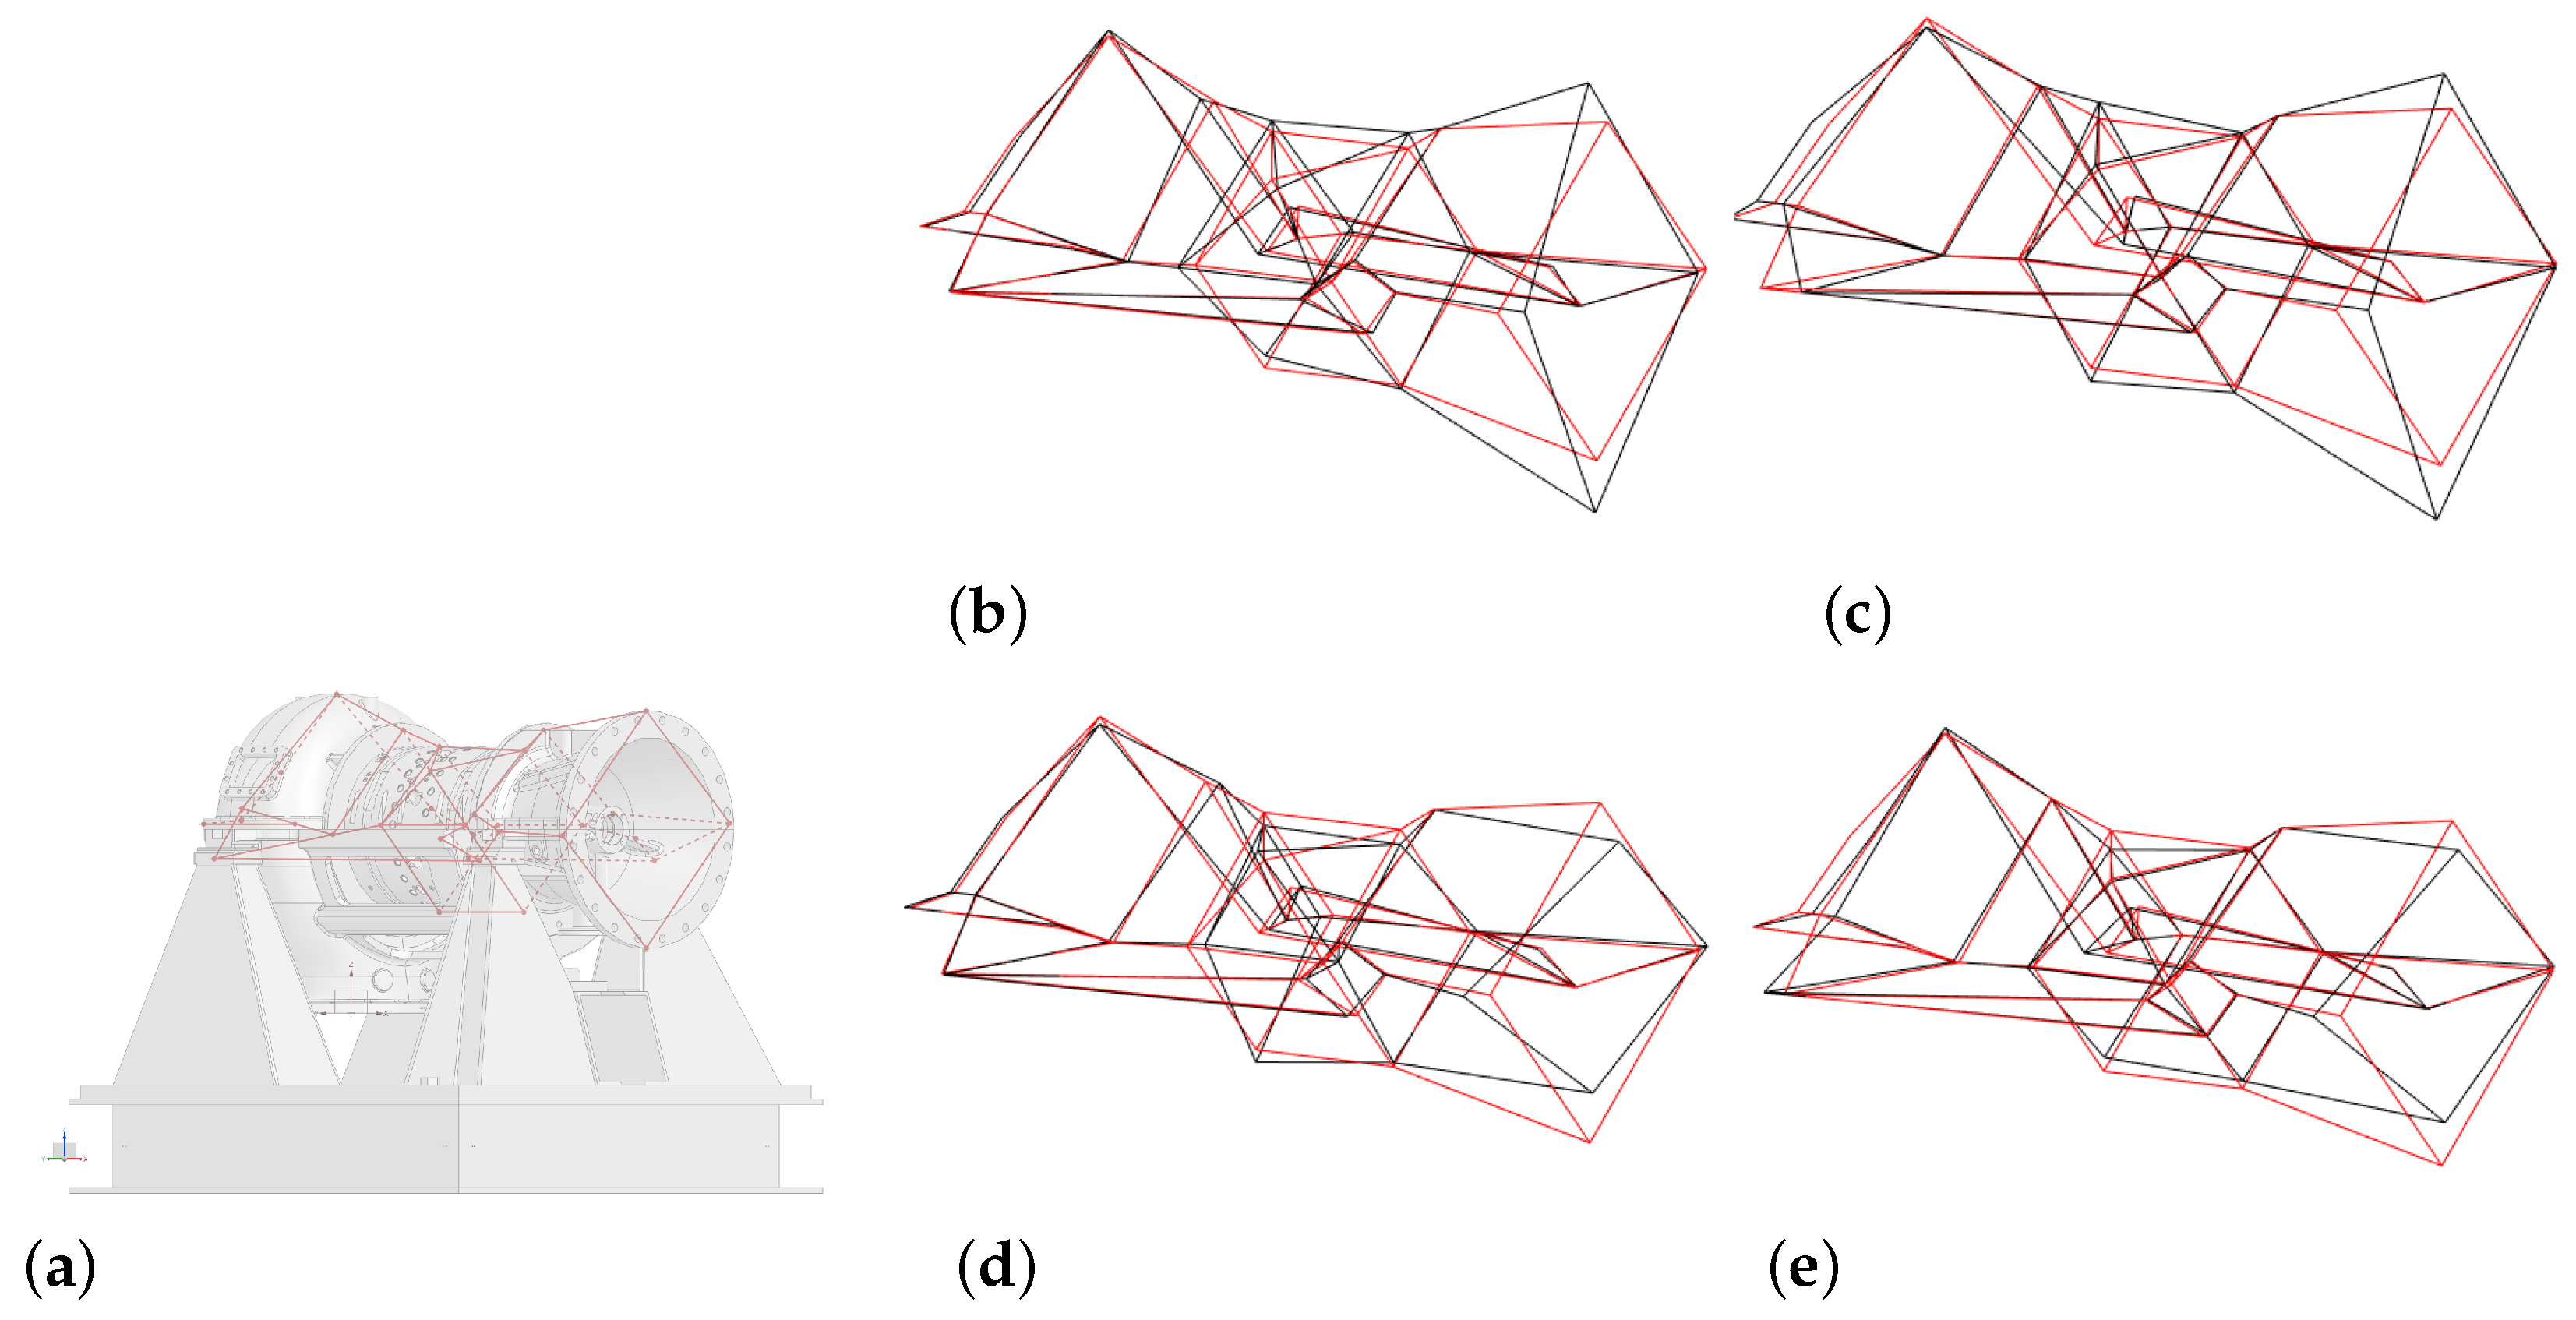
Table 1 only depicts selected frequencies, which were found in both measurement setups. The first mode belongs to the horizontal rigid body mode of the casing, where all components move simultaneously parallel to the rotor axis, the second one belongs to the axial rigid body mode. The third frequency belongs to the first bending mode of the casing, where a strong displacement or bending of the inlet casing in the horizontal direction can be observed. Mode shapes 1–3 are shown in
Figure 5.
The fourth mode shape characterises a torsion around the rotor axis. The higher modes belong to more complex bending mode shapes of the casing, which include ovalisation effects among others. The displayed frequencies all belong to the mode shapes of the completely assembled casing structure and the damping values correspond to the damping ratio , being the identified eigenvalue from the analysis.
A key problem for the SHM investigation is the selection of modes, which are sensitive to structural changes and damages, while at the same time they should be found reliably in the data. There are many influences such as thermal loads and others, which change the operating conditions. The specific consideration of these unknown loads was neglected in the analysis as they are incorporated in the variation of rotational speeds. As the test rig was operated inside a test cell without strong ambient changes, this simplification is admissible. Thus, in this analysis, modes that are specifically robust towards the changing rotational speeds of the compressor rotor were required.
At the beginning of each analysis, the first four statistical moments were checked to verify the assumption of white Gaussian noise excitation. The data had an expected value of 0, a constant variance, a skewness of 0, and a kurtosis of 3 and were therefore qualified for the application of OMA as these results correspond to the values associated with white noise.
The analysis of the operation data was performed for three rotational speeds: 285 Hz (nominal speed, speed 1), 256.5 Hz (90% nominal speed, speed 2), and 65 Hz (first rigid body mode of the casing in standstill condition, speed 3). The reproducibility of the analysis was tested with data sets derived from three different measurement days—reference (Ref), assembly 1 (Asb1), after disassembling and reassembling all compressor components, assembly 2 (Asb2), after disassembling and reassembling the test rig components once again.
Eigenfrequencies and eigenvectors were used for the investigation of OMA as an approach for the SHM of rotating machinery. Although eigenfrequencies are more sensitive to ambient changes [
3] and the literature makes it clear that they are not the best choice for SHM, their use turned out to be suitable in this study due to the reduced influence of ambient conditions, as explained earlier. Besides, this investigation served as a first qualification for the OMA on rotating machines. It did not pursue the objective to find the ideal analysis parameter for SHM.
Two robust eigenfrequencies, which were found in all data sets when varying the rotational speed and for the three different measurements (Ref, Asb1, and Asb2), were studied in detail. Their consistency was checked by applying the Modal Assurance Criterion (MAC) on the eigenvectors associated with the identified frequencies. The MAC
calculates values between 0 and 1 indicating the linear independence of the eigenvectors
. Two eigenvectors with a MAC value close to 1 belong most likely to the same mode shape and should not be treated as two different eigenvectors. For this reason, it was checked that the selected, robust frequencies have MAC values close to 0, when compared to each other.
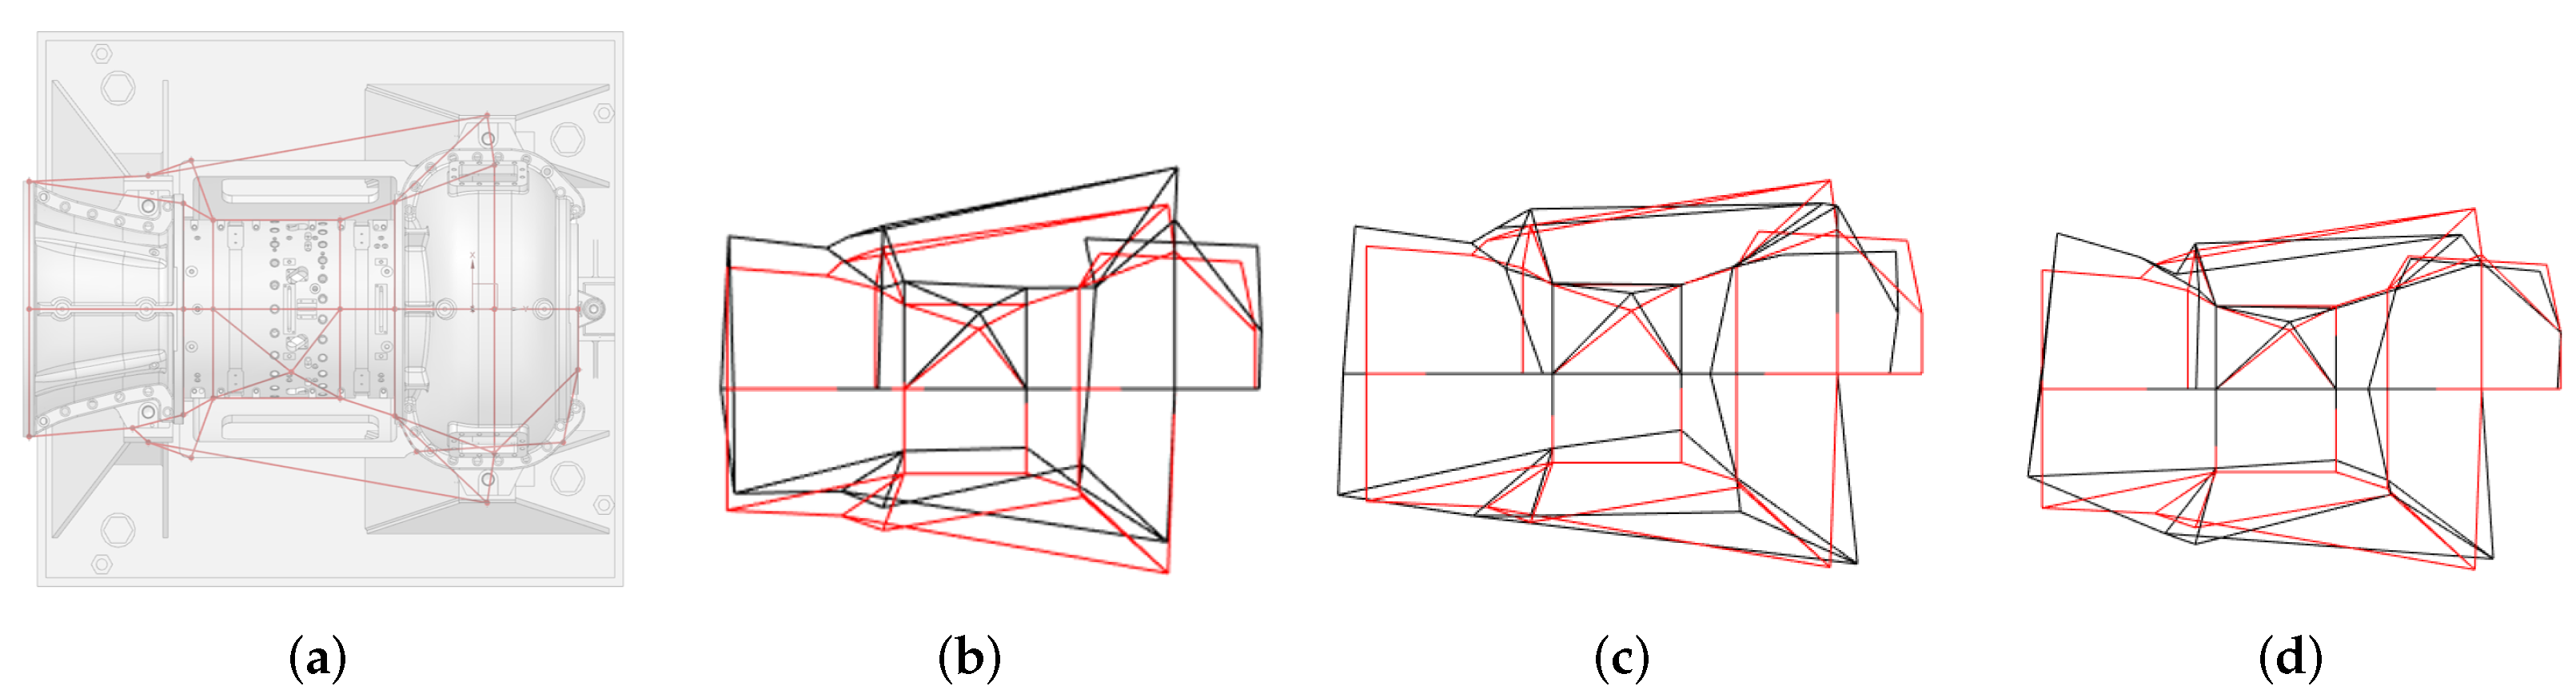
Table 2 displays the selected frequencies and their corresponding damping values for the reference measurement (Ref). Again, frequencies belong to the mode shapes of the complete casing assembly and the damping values represent the damping ratio. The mode shapes for the two selected frequencies are shown in
Figure 6.
As all identified frequencies for the different cases Ref, Asb1, and Asb2 as well as speeds 1–3, see
Table 2,
Table 3 and
Table 4, lead to the same mode shapes, the visualisation of the mode shapes gained from the measurement for speed 1 and the reference case Ref are depicted as an example in
Figure 6. Mode shape 1 is characterised by an ovalisation primarily of the inlet casing superposed with an axial component, however, mode shape 2 results in the ovalisation of all casing components without any axial movement.
Whereas the frequency deviation for the first selected mode between speed 1/2 and speed 3 is 1%, the deviation is higher for mode 2 reaching a value of approximately 2%. The deviation of the frequencies for each rotational speed when varying the measurement day (Asb1, Asb2) reaches a maximum of approximately 1%. The results of Asb1 and Asb2 are presented in
Table 3 and
Table 4.
Whereas the second selected mode can be found in the EMA data with a deviation of approximately 1%, the first chosen eigenfrequency could not be covered by the standstill experiments and thus, the comparison between EMA and OMA results needs further analysis. The damping values identified in operation were lower than the ones found for the EMA analysis, which could be caused by the differing behaviour of the fluid-film bearings in operation. The bearings were oil lubricated in contrast to the standstill conditions and caused a different damping behaviour. In addition, the response amplitudes of the casing were higher in operation compared to the response gained from the shaker excitation in standstill condition.
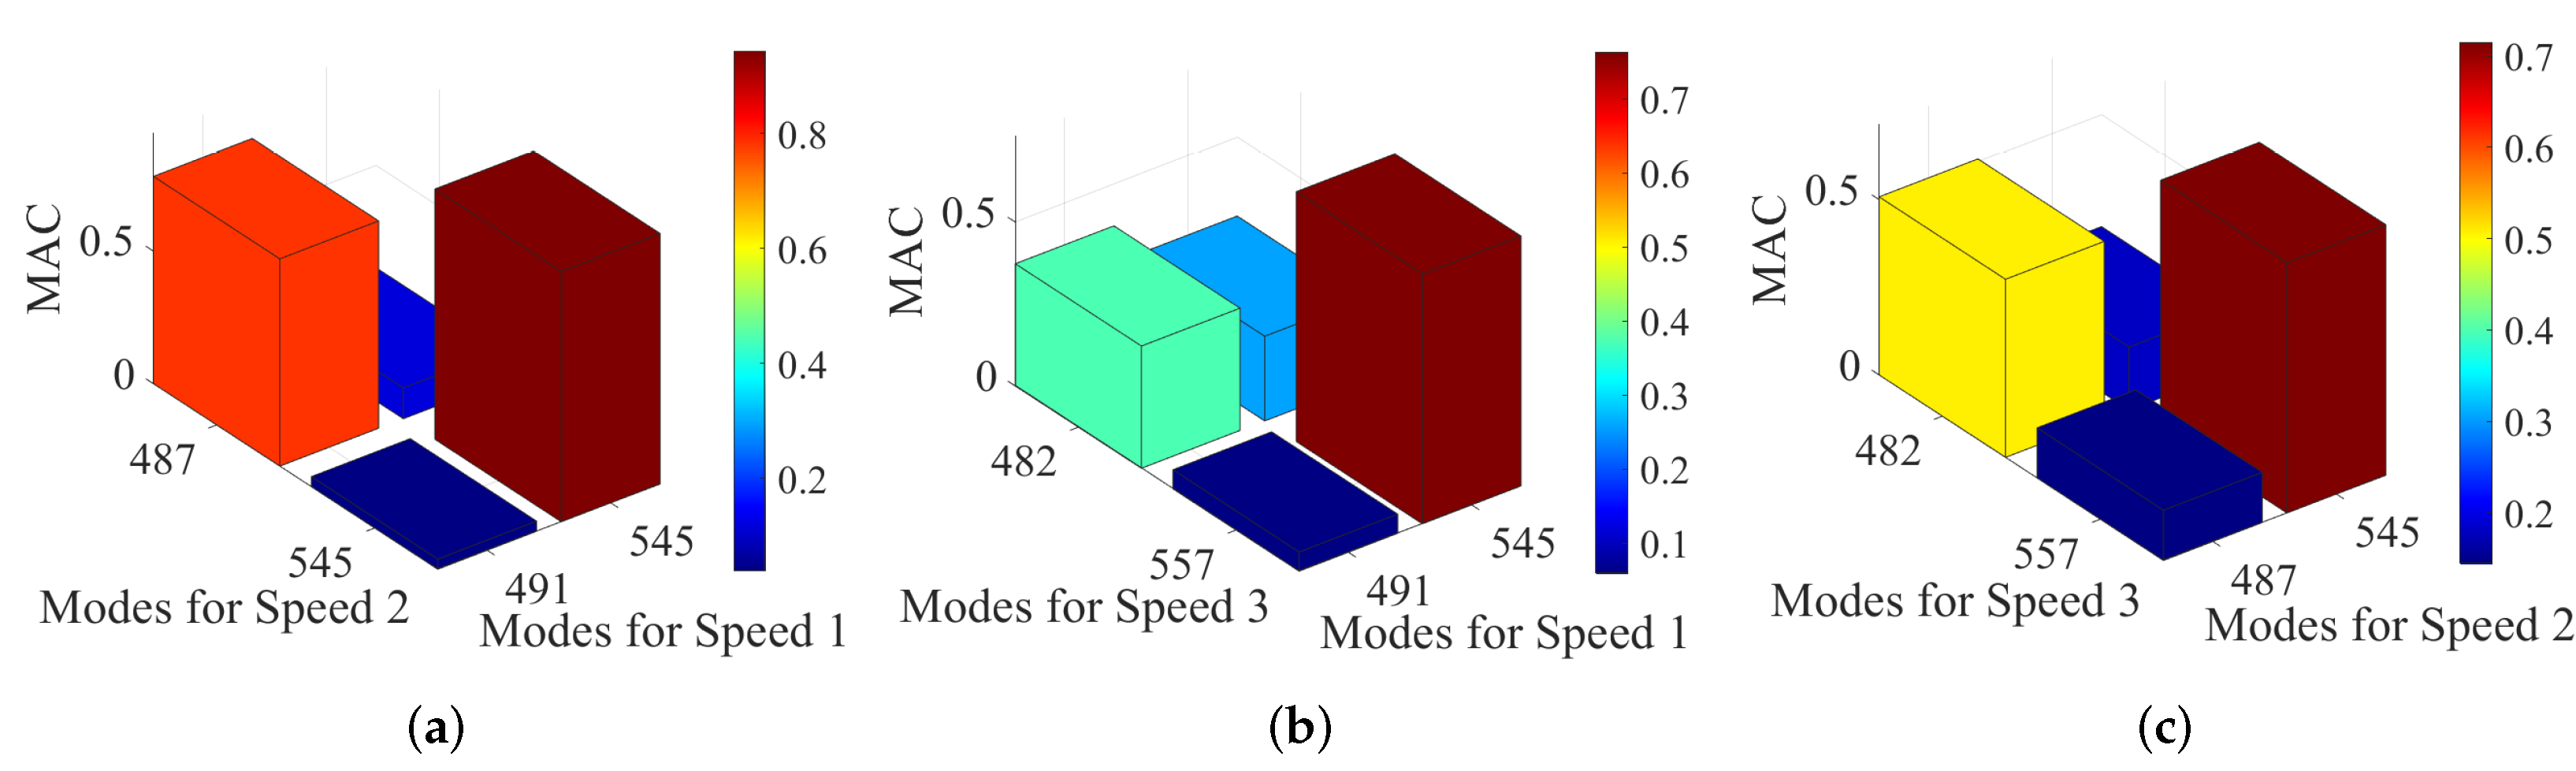
Figure 7 displays the MAC values comparing the selected modes for speeds 1–3 from
Table 2 to prove that they are robust against the influence of rotational speed. The comparison was performed for the reference measurement Ref. A high correlation of 80–90% between the selected modes for speeds 1 and 2 can be concluded from
Figure 7a. The correlation decreases when comparing these modes to the ones identified for speed 3, as the maximum correlation is approximately 75% for the second mode and reaches a minimum of approximately 40% for the first mode when comparing speeds 1 and 3. Hence, these results indicate that the rotational speed and associated parameters that are influenced by the rotation, such as temperature, play a non-negligible role in the modal parameter estimation. The values for the modal parameters can shift within the operating range. A long-term stationary operation is therefore recommended, as it is usually the case for industrial applications, in order to eliminate changes in the estimated modal parameters, especially when looking at eigenvectors. However, experience has shown that the identification of eigenvectors is subject to a higher uncertainty than eigenfrequencies, which needs to be taken into consideration.
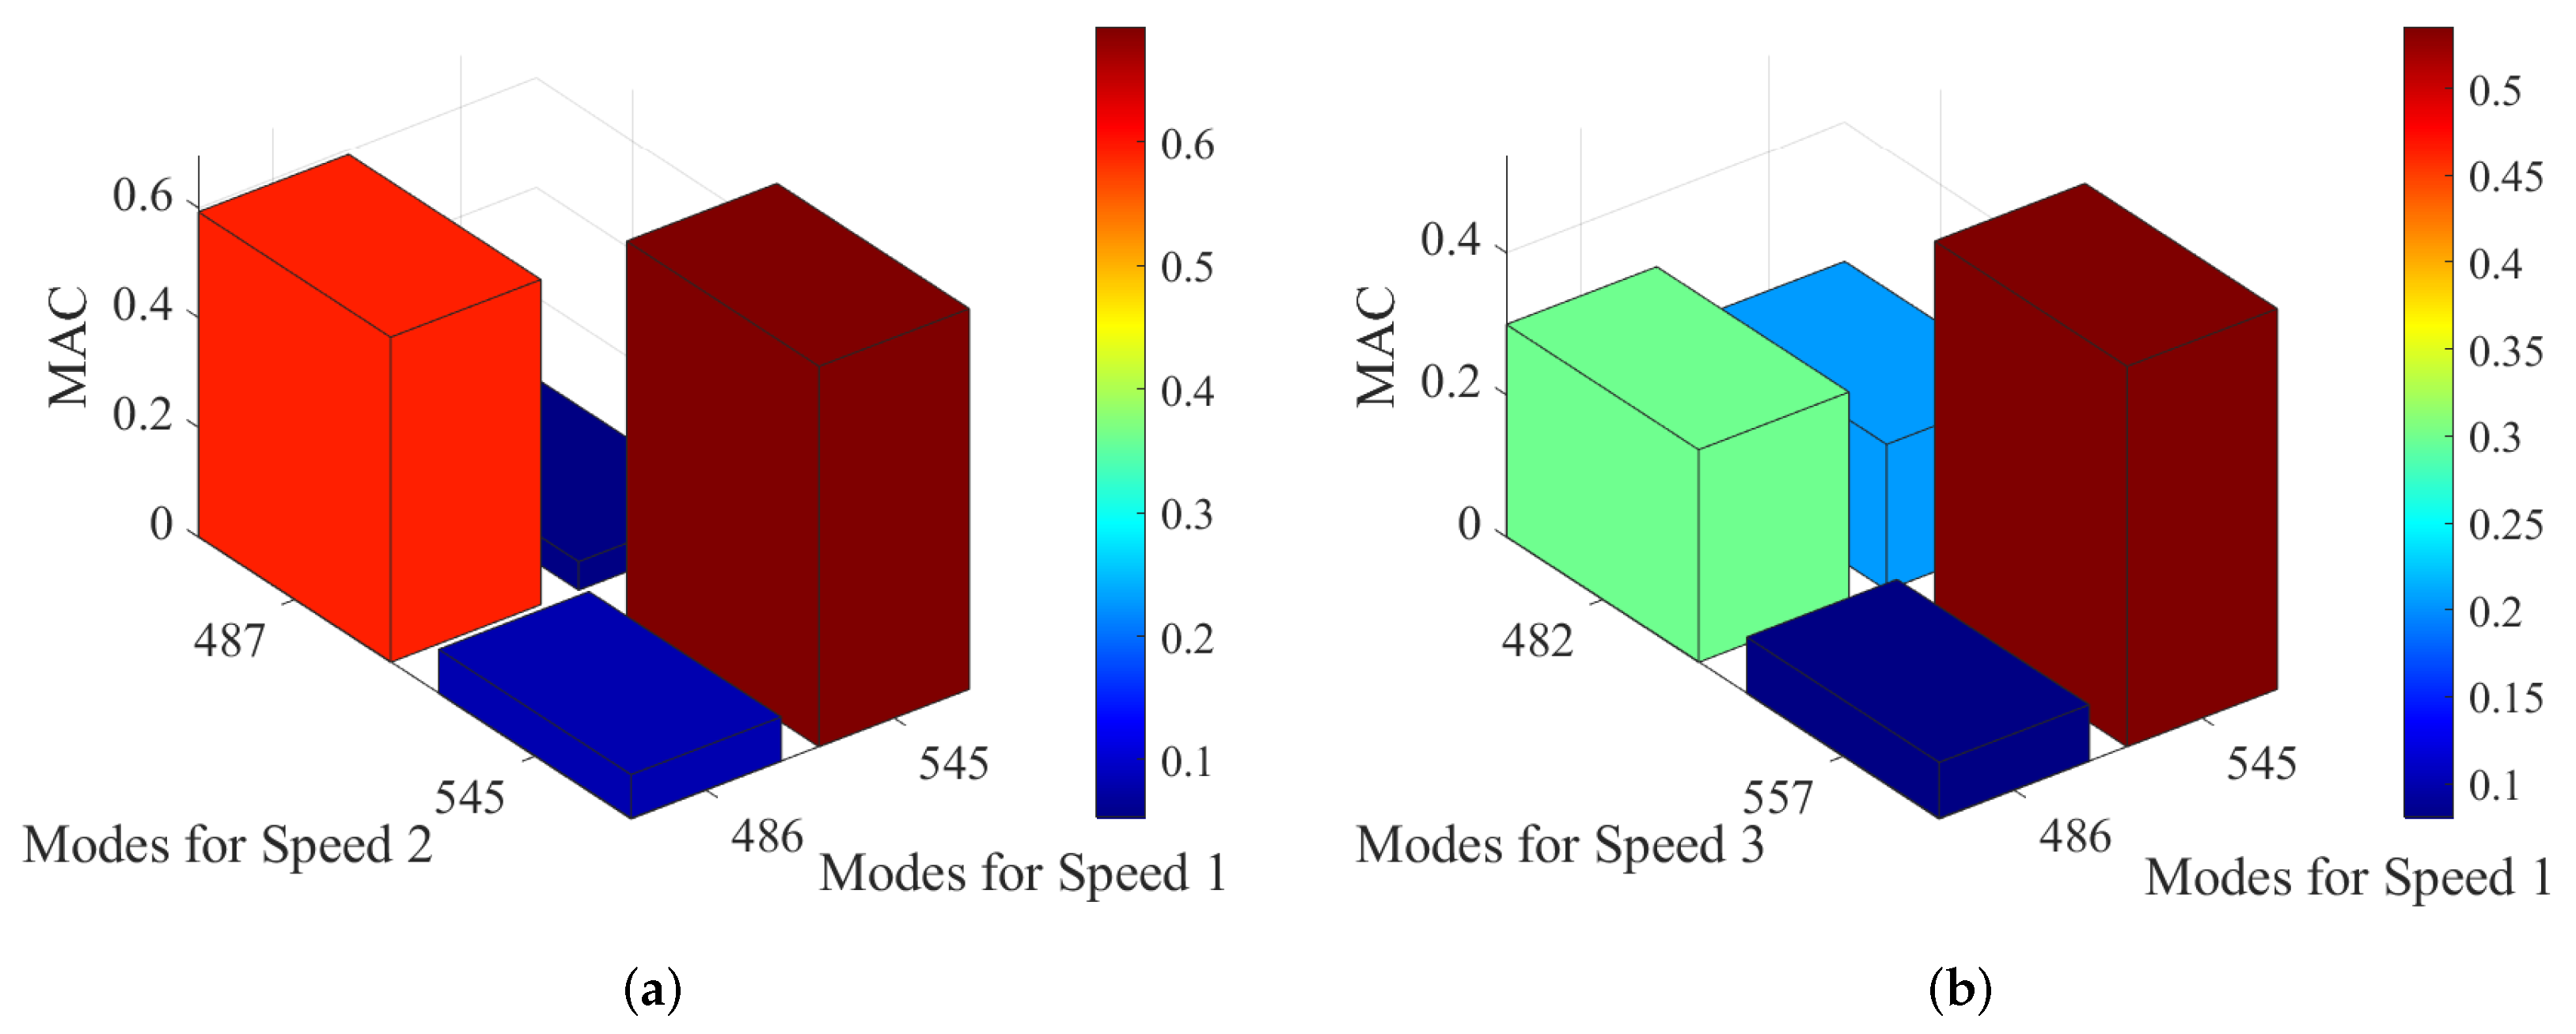
The comparison of the eigenvectors was extended taking into account a different measurement day Asb1 for speed 1.
The correlation further decreased, as shown in
Figure 8. Thus, the reproducibility of the eigenvectors throughout a long operating period and different conditions caused by multiple assembly steps has not yet reached a sufficient accuracy according to the results shown in this analysis. Other potential robust frequencies were found in all data sets, which could as well be suitable for SHM applications. Nevertheless, the comparison of their eigenvectors and MAC values needs a further detailed investigation.
5. Conclusions
A study on an axial compressor test rig was conducted to qualify the application of operational modal analysis for structural health monitoring purposes on rotating machinery, explicitly turbomachinery. Data sets from three different rotational speeds of the compressor’s operation, as well as three measurement days each representing another assembly process, were studied for the qualification of operational modal analysis as a monitoring tool. The studied method was found to be a suitable approach to detect modal parameters such as eigenfrequencies and eigenvectors in operation. These parameters can be tracked over the desired operating time to perform structural health monitoring. Whereas frequencies were found to be robust analysis parameters, eigenvectors, which are more sensitive to changes of the machinery conditions, as well as other possible analysis parameters need to be further investigated.
The two modes, 491 Hz and 545 Hz (specifications apply to nominal speed/speed 1 and reference case Ref), were identified as robust eigenfrequencies throughout the complete analysis representing an ovalisation mainly of the inlet casing superposed with axial movement (mode 1) and an ovalisation of all casing components (mode 2). The identified damping values in operation were orders of magnitude smaller than at standstill and are therefore subjects for follow-up research. The identified eigenvectors showed a high correlation (80–90%), when comparing the two higher speeds (speeds 1 and 2), but it decreased when taking into account the low speed (speed 3), as the minimum correlation was 40%. The consideration of other measurement days (Asb1) led to a decreasing correlation of the eigenvectors by a maximum of 65%. Assembly processes therefore have a large influence on the identification of eigenvectors. The mode shapes could be identified but the interpretation of the visualisation requires a lot of experience and is thus time consuming, which is not suitable for structural health monitoring applications.
A full automation of the modal parameter identification process and tracking of changes throughout the operating time is necessary and shall be addressed in a next step. In future work, a coupled reduced-order model consisting of an analytical rotordynamics model and a reduced model of the compressor casing will be implemented, which should allow to draw conclusions on the rotor conditions by analysing the casing’s vibration signature. This will serve as a model-based monitoring approach, which contributes to the long-term objective of establishing a digital twin for turbomachinery.


