1. Introduction
The advancement of technology in new rubber-like elastomer materials, exhibiting strong nonlinear stress–strain relations under large deformations, has increased in recent years and gained the attention of researchers in the area of continuum mechanics, leading to the development of products and applications implemented in various industrial mechanical systems and engineering problems involving shock and vibration absorbers. An elastomer is a type of material that can elastically recover to its initial state and shape after deforming from tension or compression. Elastomers that exhibit large reversible strains in response to a compression or tension stress belong to the family of polymers [
1,
2,
3]. Elastomers, being theoretically perfect polymers, along with great abrasion and chemical resistance as well as air and water impermeability, present viscoelastic properties and great resistance under static or dynamic stresses, under various climatic conditions and temperature range. These properties of elastomers render its use suitable for damping mechanisms such as vibration and shock absorption applications [
2,
4,
5,
6].
The property characteristics of elastomers highly depend on the composition of the compound, characterized by the type and amount of rubber chemicals and additives used, as well as its chemical and mechanical treatment during production, which influences hardness, elasticity and strength. Thus, elastomer compound material properties are inherently sensitive to the rubber selection, the composition of the compound and the manufacturing process as well as the final geometrical shape and design of the final product. Moreover, the type of loading affects the elastomer properties, presenting different behavior under static, quasi-static or dynamic excitation. Due to its material variability and broad implementation, elastomer applications and products strongly require certification results through numerical or combined numerical and experimental validation [
7,
8,
9].
Thus, it is of high importance to fully understand and increase confidence about the mechanical behavior and loading capacity of each elastomer product. Moreover, as most engineering applications require multi-axial loading strength, their behavior in specific loading conditions also needs to be examined. Combined experimental measurements, conducted in and out of a laboratory, and numerical Finite Element (FE) model simulations are employed in order to investigate the macroscopic mechanical characteristics and material properties of an elastomer application [
9,
10].
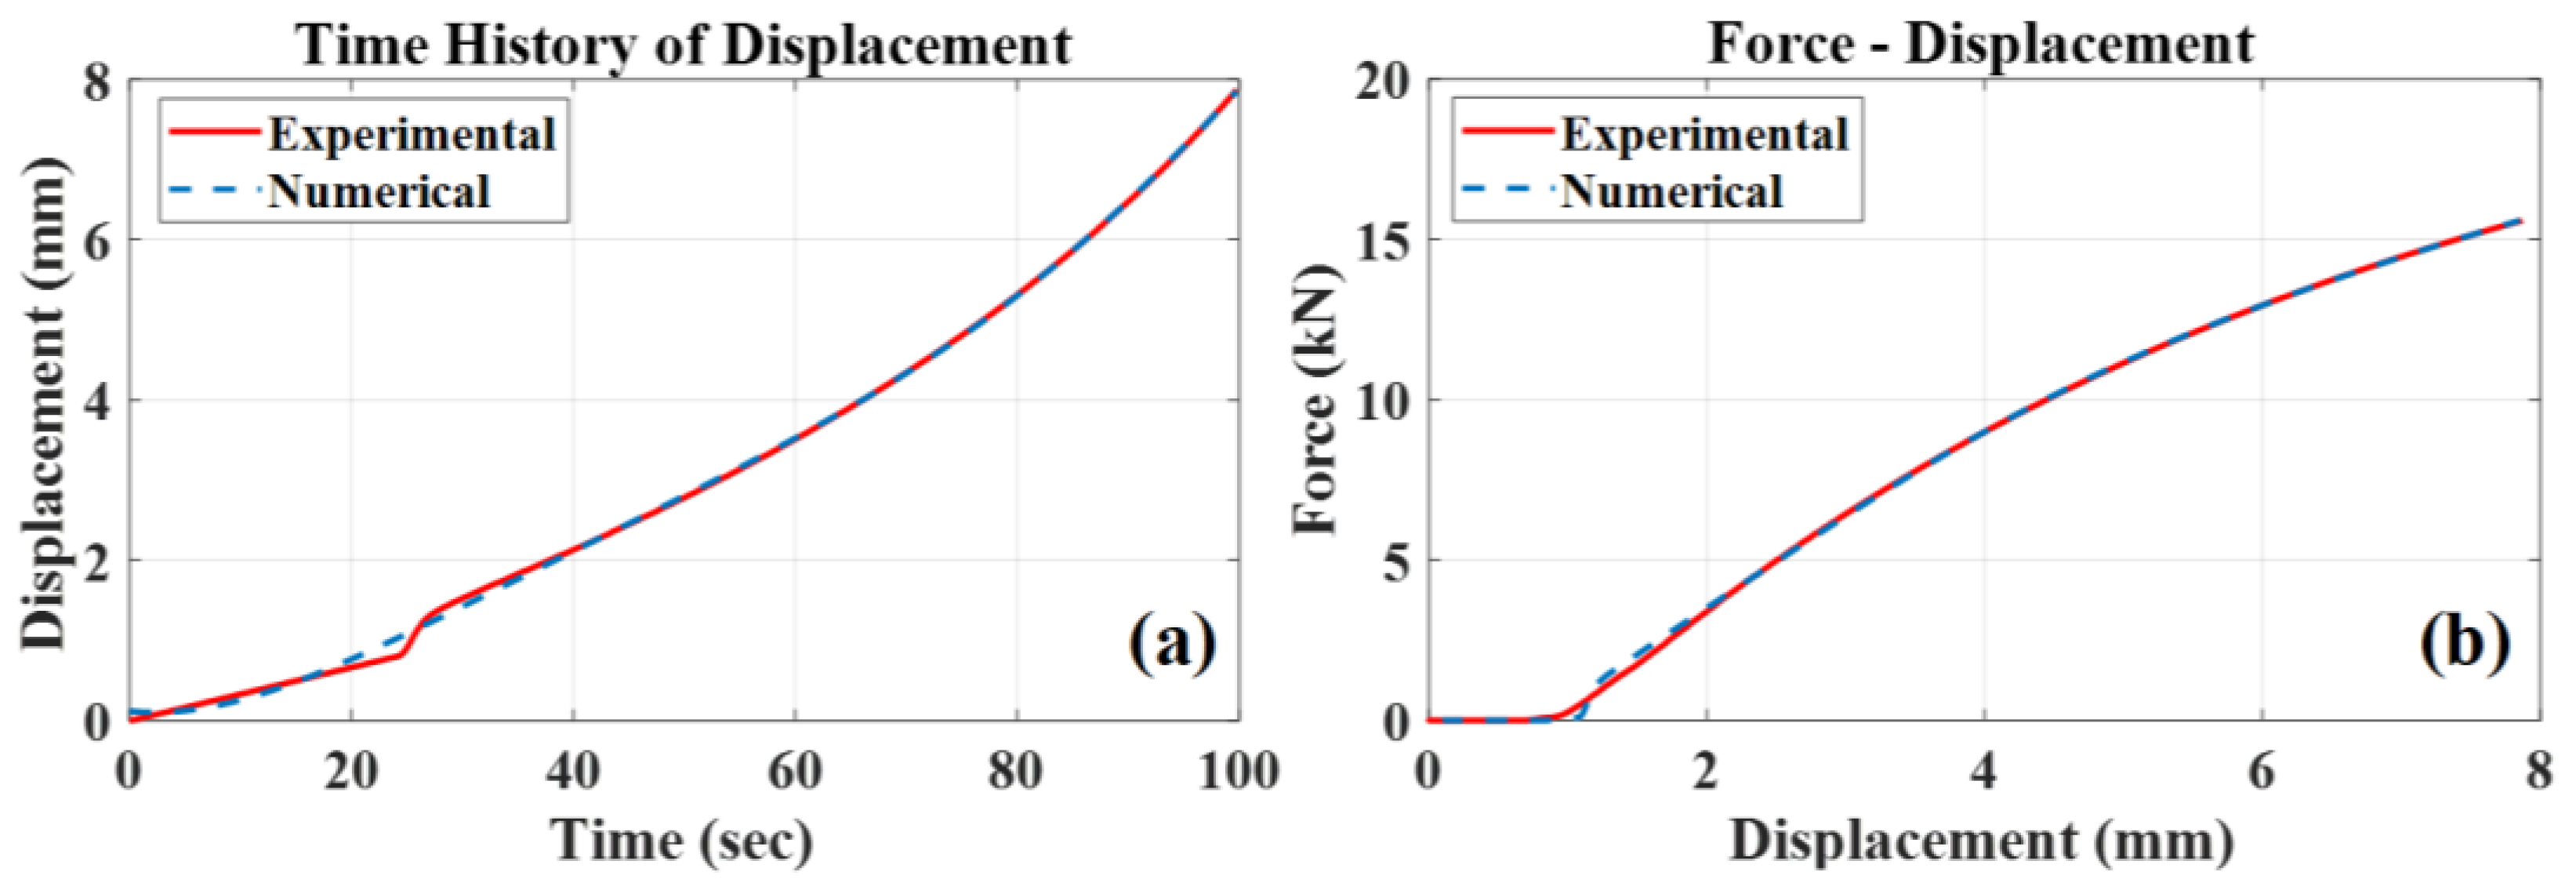
In this work, an optimal design procedure of an elevator chassis crashing on a highly elastic cellular polyurethane elastomer shock absorber in a fail scenario is presented. At first, specimens of the real rubber-like absorber were tested under uniaxial compression deformations in a loading machine, extracting experimental force-displacement curves. A discrete (FE) model of the examined absorber was developed and a compressible Mooney–Rivlin material model was assigned. The material properties of the specific polyurethane elastomer shock absorber structure are classified and tuned reconciling experimental data to equivalent numerical (FE) model computations. This is achieved using residuals based on the experimental and numerical time histories of displacements [
11,
12].
Structural model parameter updates, based on an experimentally measured model and response data, are usually formulated as weighted least-squares estimation residuals. Although prone to local optima entrapment, conventional gradient-based optimization techniques are then used to find the optimal values that minimize the single-objective residual. Alternatively, evolutionary strategies (ES) [
13] are more effective in guaranteeing convergence to a global optimum, coming short of convergence rates. In this work, a non-gradient state-of-the-art optimization algorithm, i.e., Covariance Matrix Adaptation—Evolution Strategy (CMA-ES) [
14,
15,
16], coupled to a commercial FEA solver is applied in a parallel computing scheme to solve the single-objective optimization problem, updating model parameters without the need for model reduction or sub-structuring techniques [
17].
Using the updated material properties and characterizing the nonlinear hyperelastic behavior of the elastomer absorber, an explicit nonlinear analysis of a test-case elevator system crashing on the buffer absorber was carried out followed by a series of full-scale in situ experimental trials, representing the crash scenario of the elevator chassis on the buffer absorber system after a controlled free fall. The hyperelastic behavior of the shock absorber was validated under uniaxial large deformation, and a new-design elevator chassis was redesigned and optimized in order to achieve minimum design stresses and deformations.
The novelty of the presented procedure in its wholeness includes both computational and engineering novel aspects. From a computational point of view, contribution is attributed to the integration of a state-of-the-art optimization algorithm, CMA-ES, applied in parallel computing and coupled to a robust (FE) model analysis solver in order to produce an optimal design for a real industrial engineering problem. Aiming at a reliable simulation of a fail scenario of a flexible elevator chassis crashing on a highly elastic cellular polyurethane elastomer shock absorber of unknown mechanical and material behavior, characterization and validation of its material model and parameters needed to be addressed accurately and effectively. Thus, novel computational aspects pertain to the applicability of the CMA-ES optimization algorithm in order to finely tune the unknown material properties, resulting in the characterization of its mechanical behavior through a FEM update procedure devoid of model reduction or data expansion techniques. From an engineering point of view, the applied procedure in total is the major contribution in applications of engineering science. Combining results from an in-lab experimental arrangement involving the unknown part, along with the implementation of the above computational tool, the mechanical characteristics and material properties of the applied elastomer were tuned and validated, developing a high-fidelity FEM model of the shock absorber. Furthermore, the elastomer behavior was adequately validated from the subsequent in situ experimental trials of a full-scale high-rigidity test-case elevator system falling freely on the examined absorber. The validated results concluded to confidently introduce the FEM of the shock absorber using the characterized material model and parameters in order to fulfill the main engineering target of the optimal design of the final industrial product of a flexible elevator chassis for further commercial trade.
The presentation in this work is organized as follows. The theoretical formulation of the Finite Element model updated based on time histories of displacements is briefly presented in
Section 2, whereas
Section 3 summarizes the applied FE model updating framework.
Section 4 presents the in-lab experimental application and the development of the equivalent FE model of a polyurethane elastomer shock absorber under quasi-static excitation in a tension-compression machine.
Section 5 presents the FE model updating parameterization and the validation results of the hyperelastic material characterization. Next,
Section 6 presents the in situ validation of the updated characterized hyperelastic material using a test-case elevator chassis under a crash scenario. Finally, in
Section 7 the updated and in situ validated hyperelastic material properties are utilized for the optimal design and verification of a full-scale new-design elevator system crashing on the buffer absorber. Conclusions are summarized in the final
Section 8.
2. Finite Element Model Updating Formulation based on Displacement Response Time Histories
Let be a parameterized class of structural dynamic models, which simulates the structural system and will be used to estimate desired quantities of interest. Consider the set of free structural model parameters to be adjusted using the measured data and let be the model predictions given the values of the parameter set . In this work, parameter estimation is based on response time history measurements of displacements. This formulation has the advantage of applicability over both linear and non-linear systems; it compares the measured raw data of the experimental arrangement to the equivalent predictions of the numerical model. In this way, all available information is preserved, and systematic errors of the identification procedure are alleviated.
The difference between the measured response time histories and the model predicted response time histories take the following form [
18]:
where
is the numerical time history of the introduced FE model and
is the respective experimental signal. Subscript
corresponds to the sensor location and measurement direction, and
corresponds to the time-step instant.
is the total number of measured sensor locations and directions, whereas
is the total number of measured time-steps (number of observations).
The measure of fit introduced in Equation (1) consists of displacements equally weighted, expanding to the following Equation (2), where
is the numerical time histories of displacements of the introduced FE model and
is the respective experimental displacement signal. Additionally, responses from all locations and components are included in the produced measure of fit in order to maximize the fidelity of the updated model resulting in Equation (2).
It is worthwhile to mention that during the experimental measurements, the loading under which the buffer is excited is recorded, and the displacement responses and the measured force is introduced as excitation in the FE model.
3. Applied FE Model Updating Framework
The examined deterministic model is not a simple analytical model where the dependence on the parameters is explicit. Thus, a stochastic black-box search algorithm, where provided inputs produce equivalent outputs, needs to be used. Covariance Matrix Adaptation Evolution Strategy (CMA-ES) [
15,
16] is used to this end due to the following advantages. CMA-ES is a randomized black box search algorithm that uses multivariate normal distributions to sample new search points. The covariance matrix of the distribution is not restricted a priori, in contrast to many continuous domain evolutionary algorithms that use a single normal search distribution. Compared to computationally faster gradient-free local optimizers such as Nelder-Mead simplex direct search algorithm available in MATLAB fminsearch function, CMA-ES is suitable in finding the global optimum, avoiding being trapped at local optima, and has demonstrated rapid convergence capabilities, particularly when searching for a global optimum compared to other evolution algorithms. Furthermore, it is a general purpose method which has been applied successfully to linear and non-linear FE updating problems [
19,
20], involving large and complex models and cases. Last but not least, it is fully parallelizable, compensating for computational time to convergence when compared to other sequential iterative gradient-free techniques such as the MATLAB fminsearch algorithm.
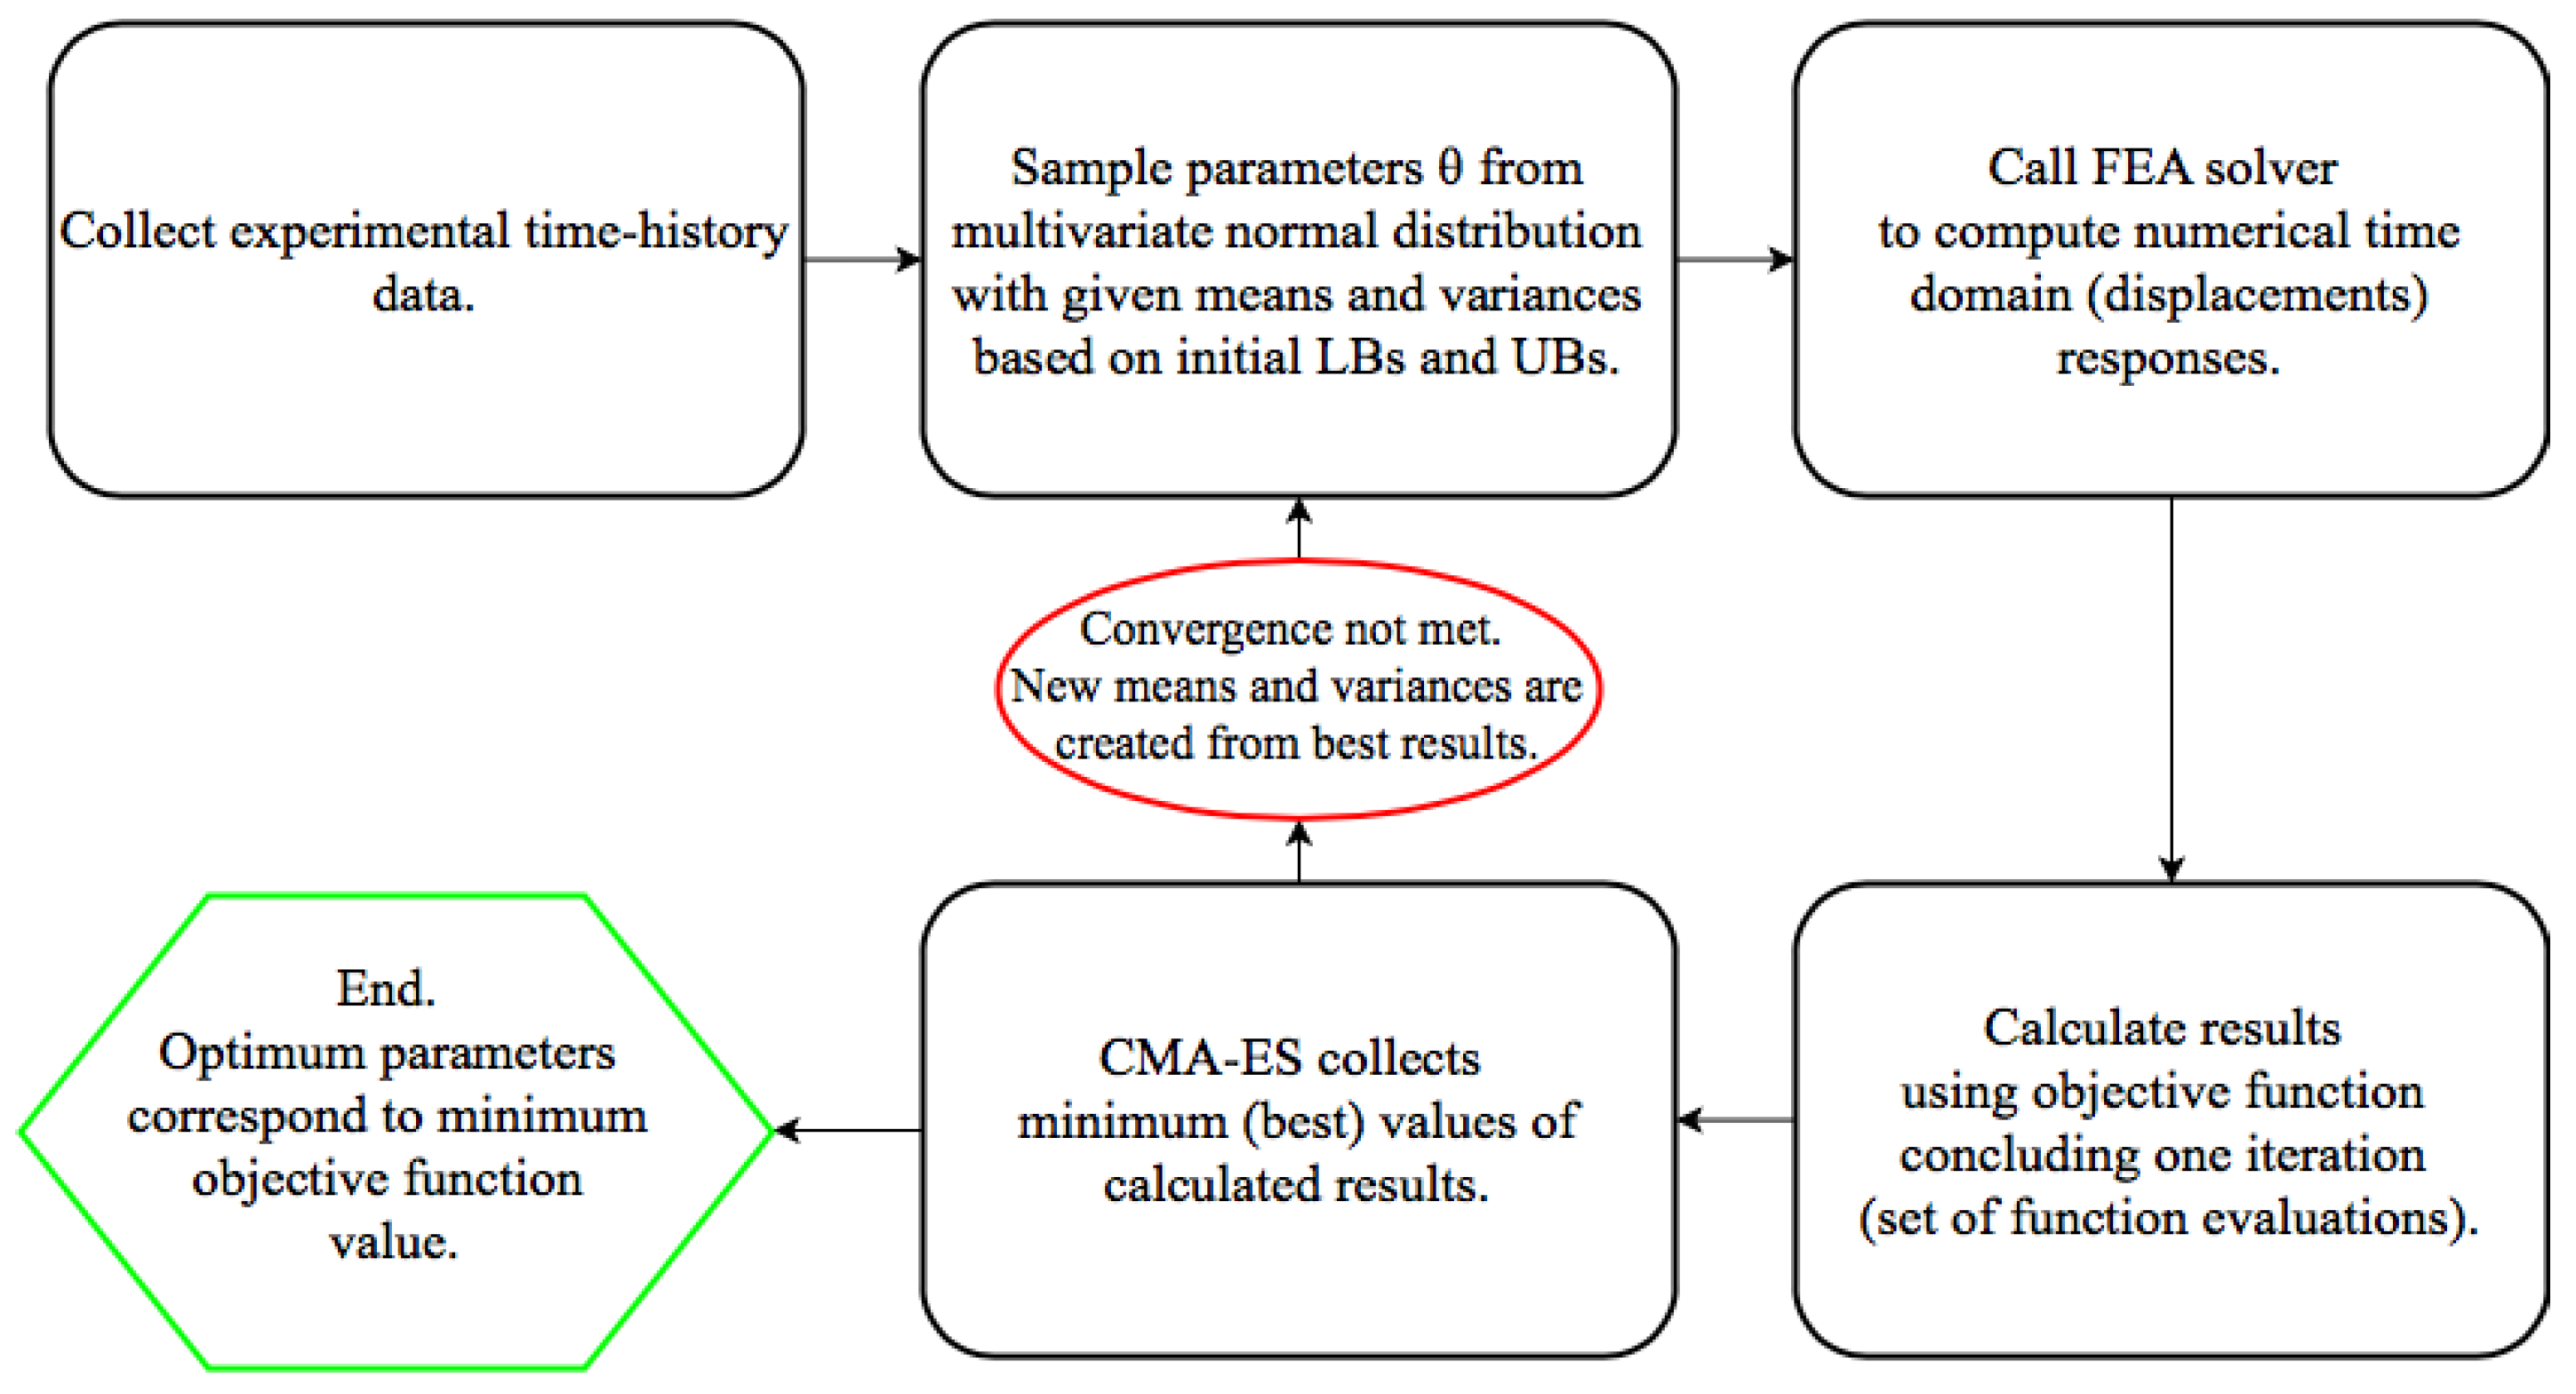
The computational framework applied in this work [
17] involves an iterative process, during which the solution is being sought by randomly sampling a search space. Sampling the best weighting residuals found in each set of iterations (function evaluation) to update the initial chosen statistical values (mean, covariance matrix), the global minimum of the applied objective function is iteratively approached.
As CMA-ES is fully parallelizable, in this work a C programming language free distribution of the CMA-ES algorithm is applied in parallel computing to solve the single-objective optimization problem, arising from the deterministic model formulation. Robust and accurate FE Analysis software DYNAMIS [
21] is employed, in combination with the parallelized strategy, in order to produce results of the proposed objective function residual simultaneously and populate the algorithm’s o springs.
The following diagram in
Figure 1 presents the flow of a single iteration (complete set of function evaluations), beginning from the collection of experimental time history data, including both response time histories and measured excitations. Next, a Multivariate Normal Search Distribution, having the largest entropy of all distributions in
given all variances and covariances, is employed in order to produce a new parameter set
. FE Analysis software coupled to CMA Evolution Strategy is invoked in order to compute the equivalent numerical (predicted) time domain displacement
responses. Next, the selected deterministic objective function is calculated and a single offspring of the chosen population
is produced.
The described framework runs in parallel, i.e., it takes advantage of the Hyper-Threading Technology of the working CPUs, in order to sample the population simultaneously so as to complete a total iteration (set of function evaluation). The CMA-ES algorithm, upon collecting the prescribed amount of offsprings calculated in the above function evaluation, checks if convergence criteria are met. Various criteria were introduced in order to take control and affect the speed of the optimization process. Firstly, a given threshold of the objective function is used. This criterion is practically inapplicable, as in experimental cases, with many uncertainties and model errors, the minimum is unknown beforehand and . Alternatively, two similar criteria, regarding standard deviations and the difference of the best values of two consecutive function evaluations are used. Moreover, in order to prevent the process of running indefinitely, a given limit of the number of iterations is also being introduced, namely . If none of the convergence criteria are met, the process recommences.
The proposed framework surpasses model reduction or data expansion techniques. Due to the significantly large number of system runs required, the computationally expensive simulations of CMA-ES are managed by a parallelized version using the non-intrusive adaptive Parallel Numerical Differentiation Library (PNDL) [
22]. The framework is implemented within Π4U framework [
13] based on a state-of-the-art task-parallel library for clusters, called TORC [
23], which is designed to provide unified programming and runtime support for computing platforms that range from single-core systems to hybrid multicore-GPU clusters and heterogeneous grid-based supercomputers.
A C programming language version of the CMA-ES algorithm, and FE Analysis software DYNAMIS [
21,
24], were coupled through MATLAB [
25], having the framework compiled and run independently in parallelization. The computer that was used hosts two (2) Intel
® Xeon
® Processors E5-2630 v3 (20 M Cache, 2.40 GHz) with 8-cores and 16-threads, resulting in a total number of thirty-two (32) logical (virtual) cores and 64 GB of RAM on a Linux Ubuntu 16.04 Operating System.
6. In Situ Validation of Characterized Hyperelastic Material Model
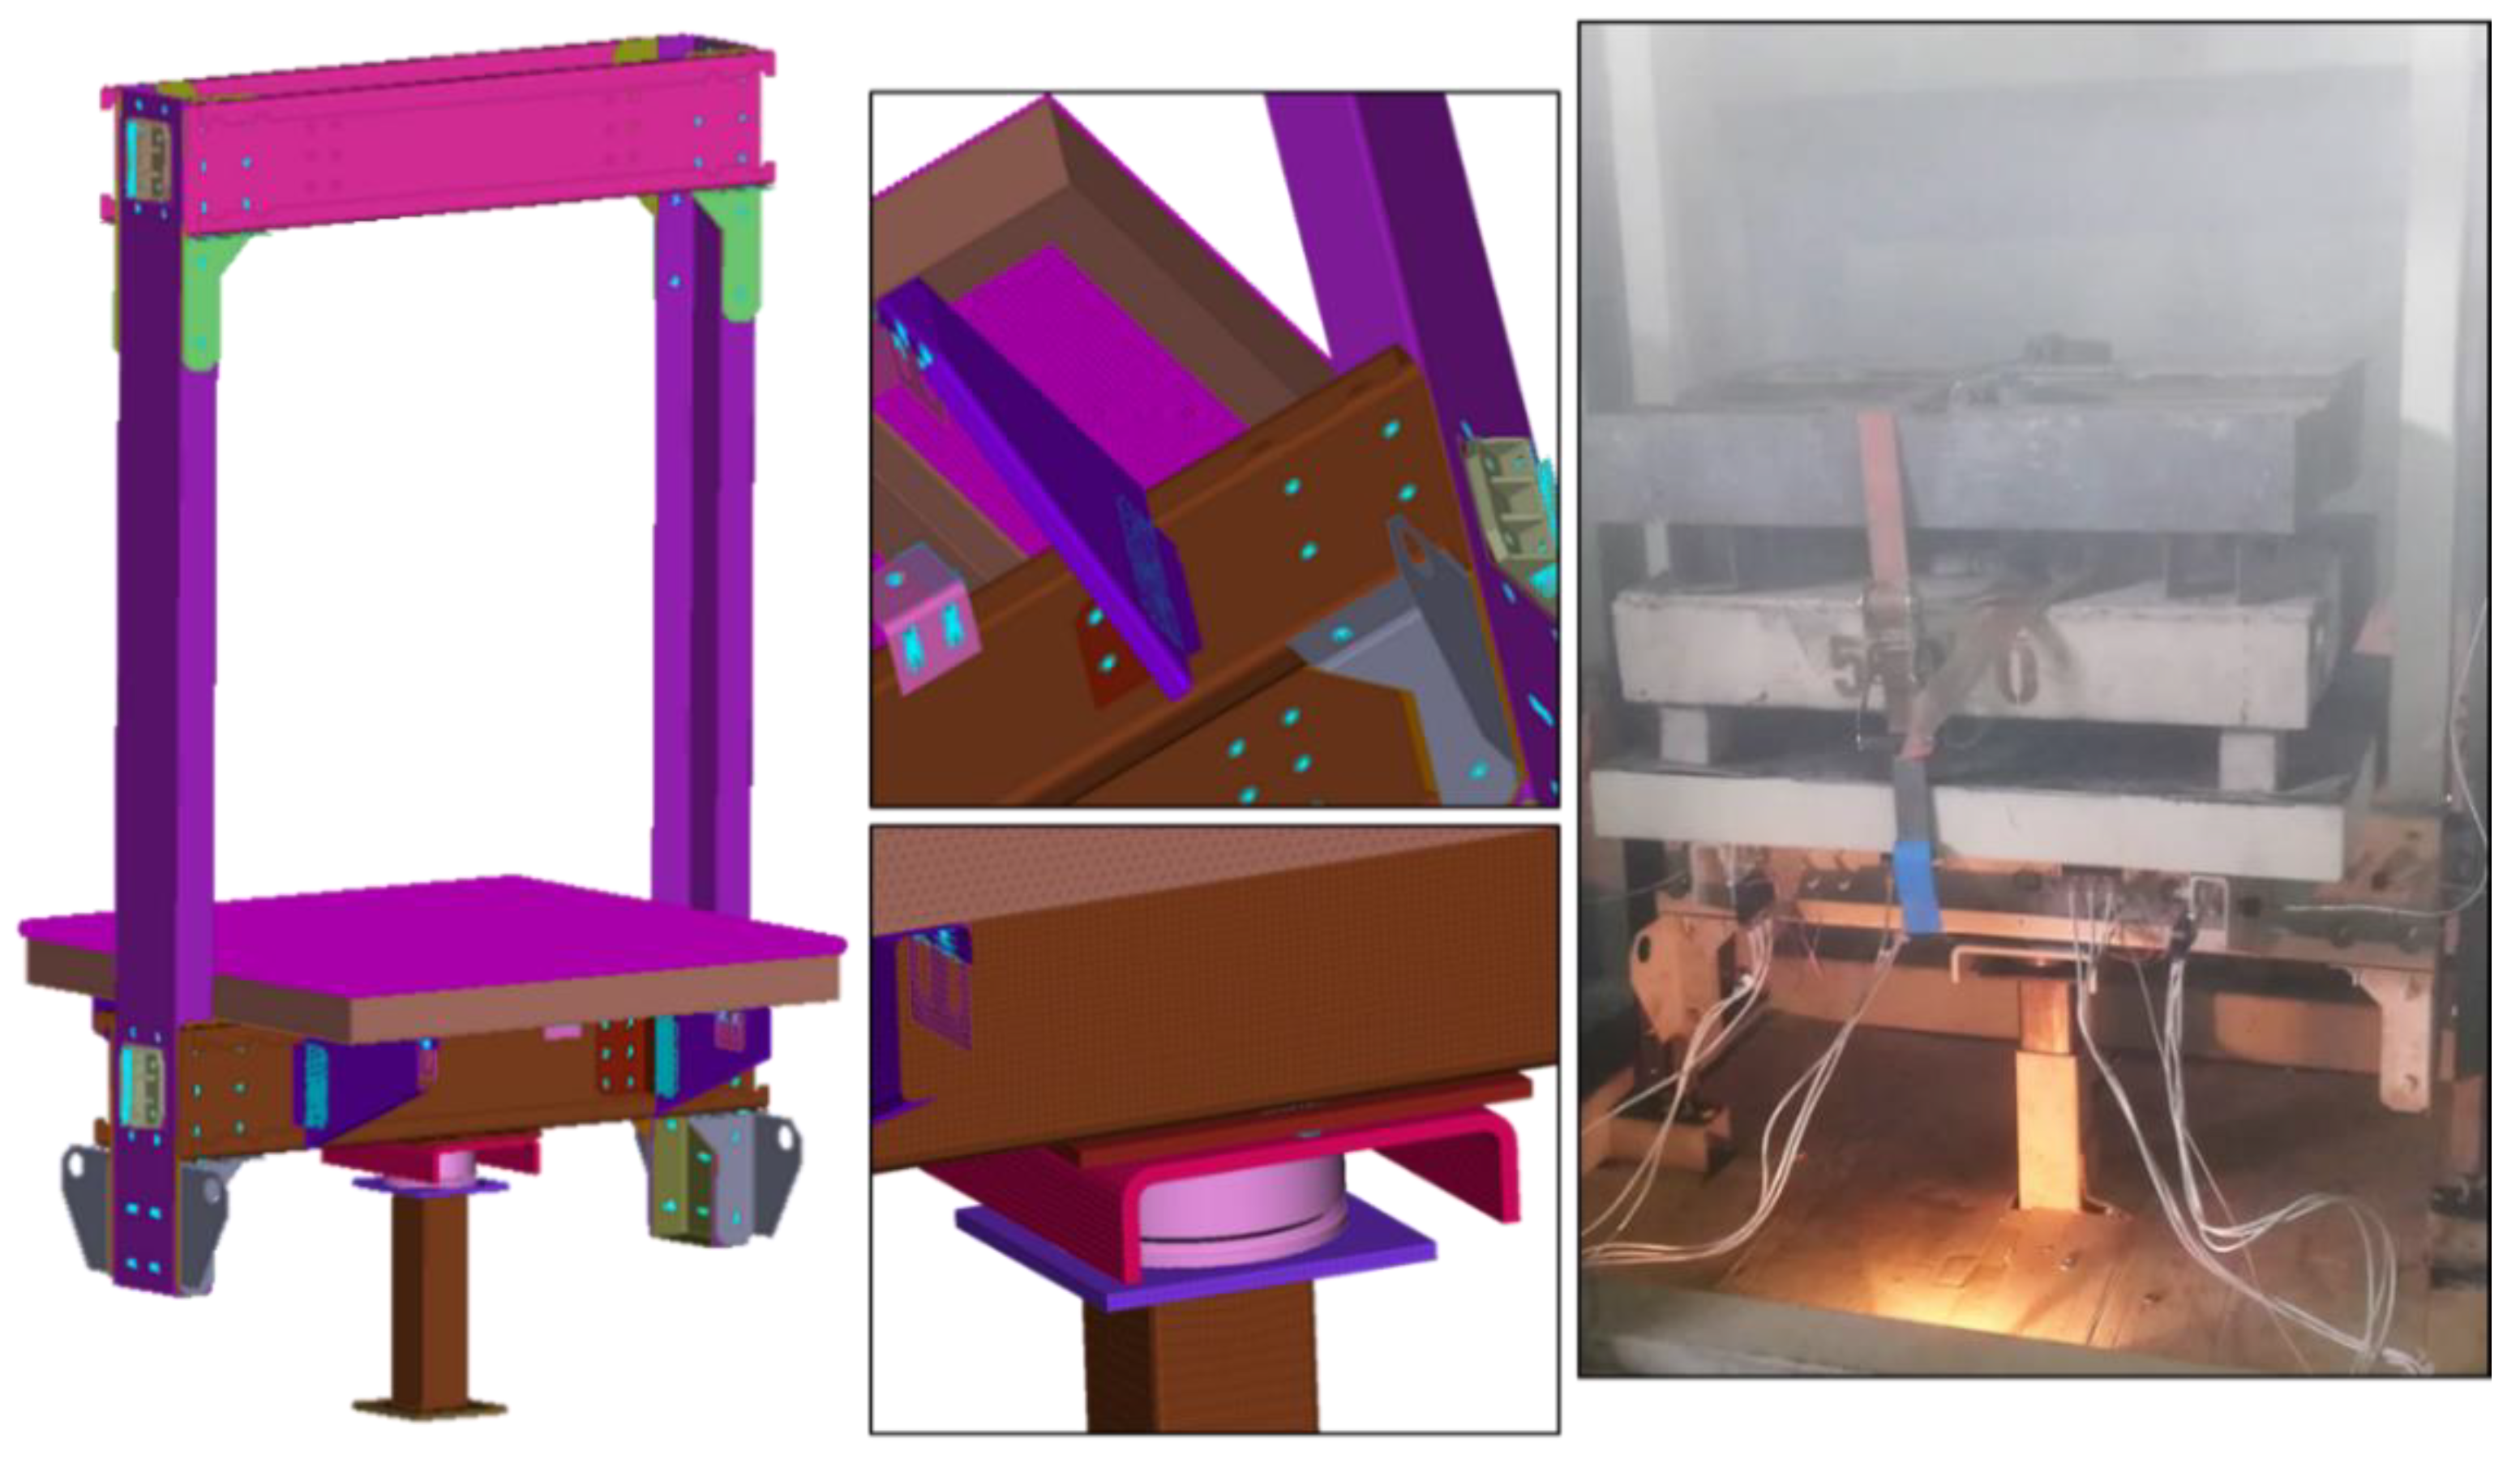
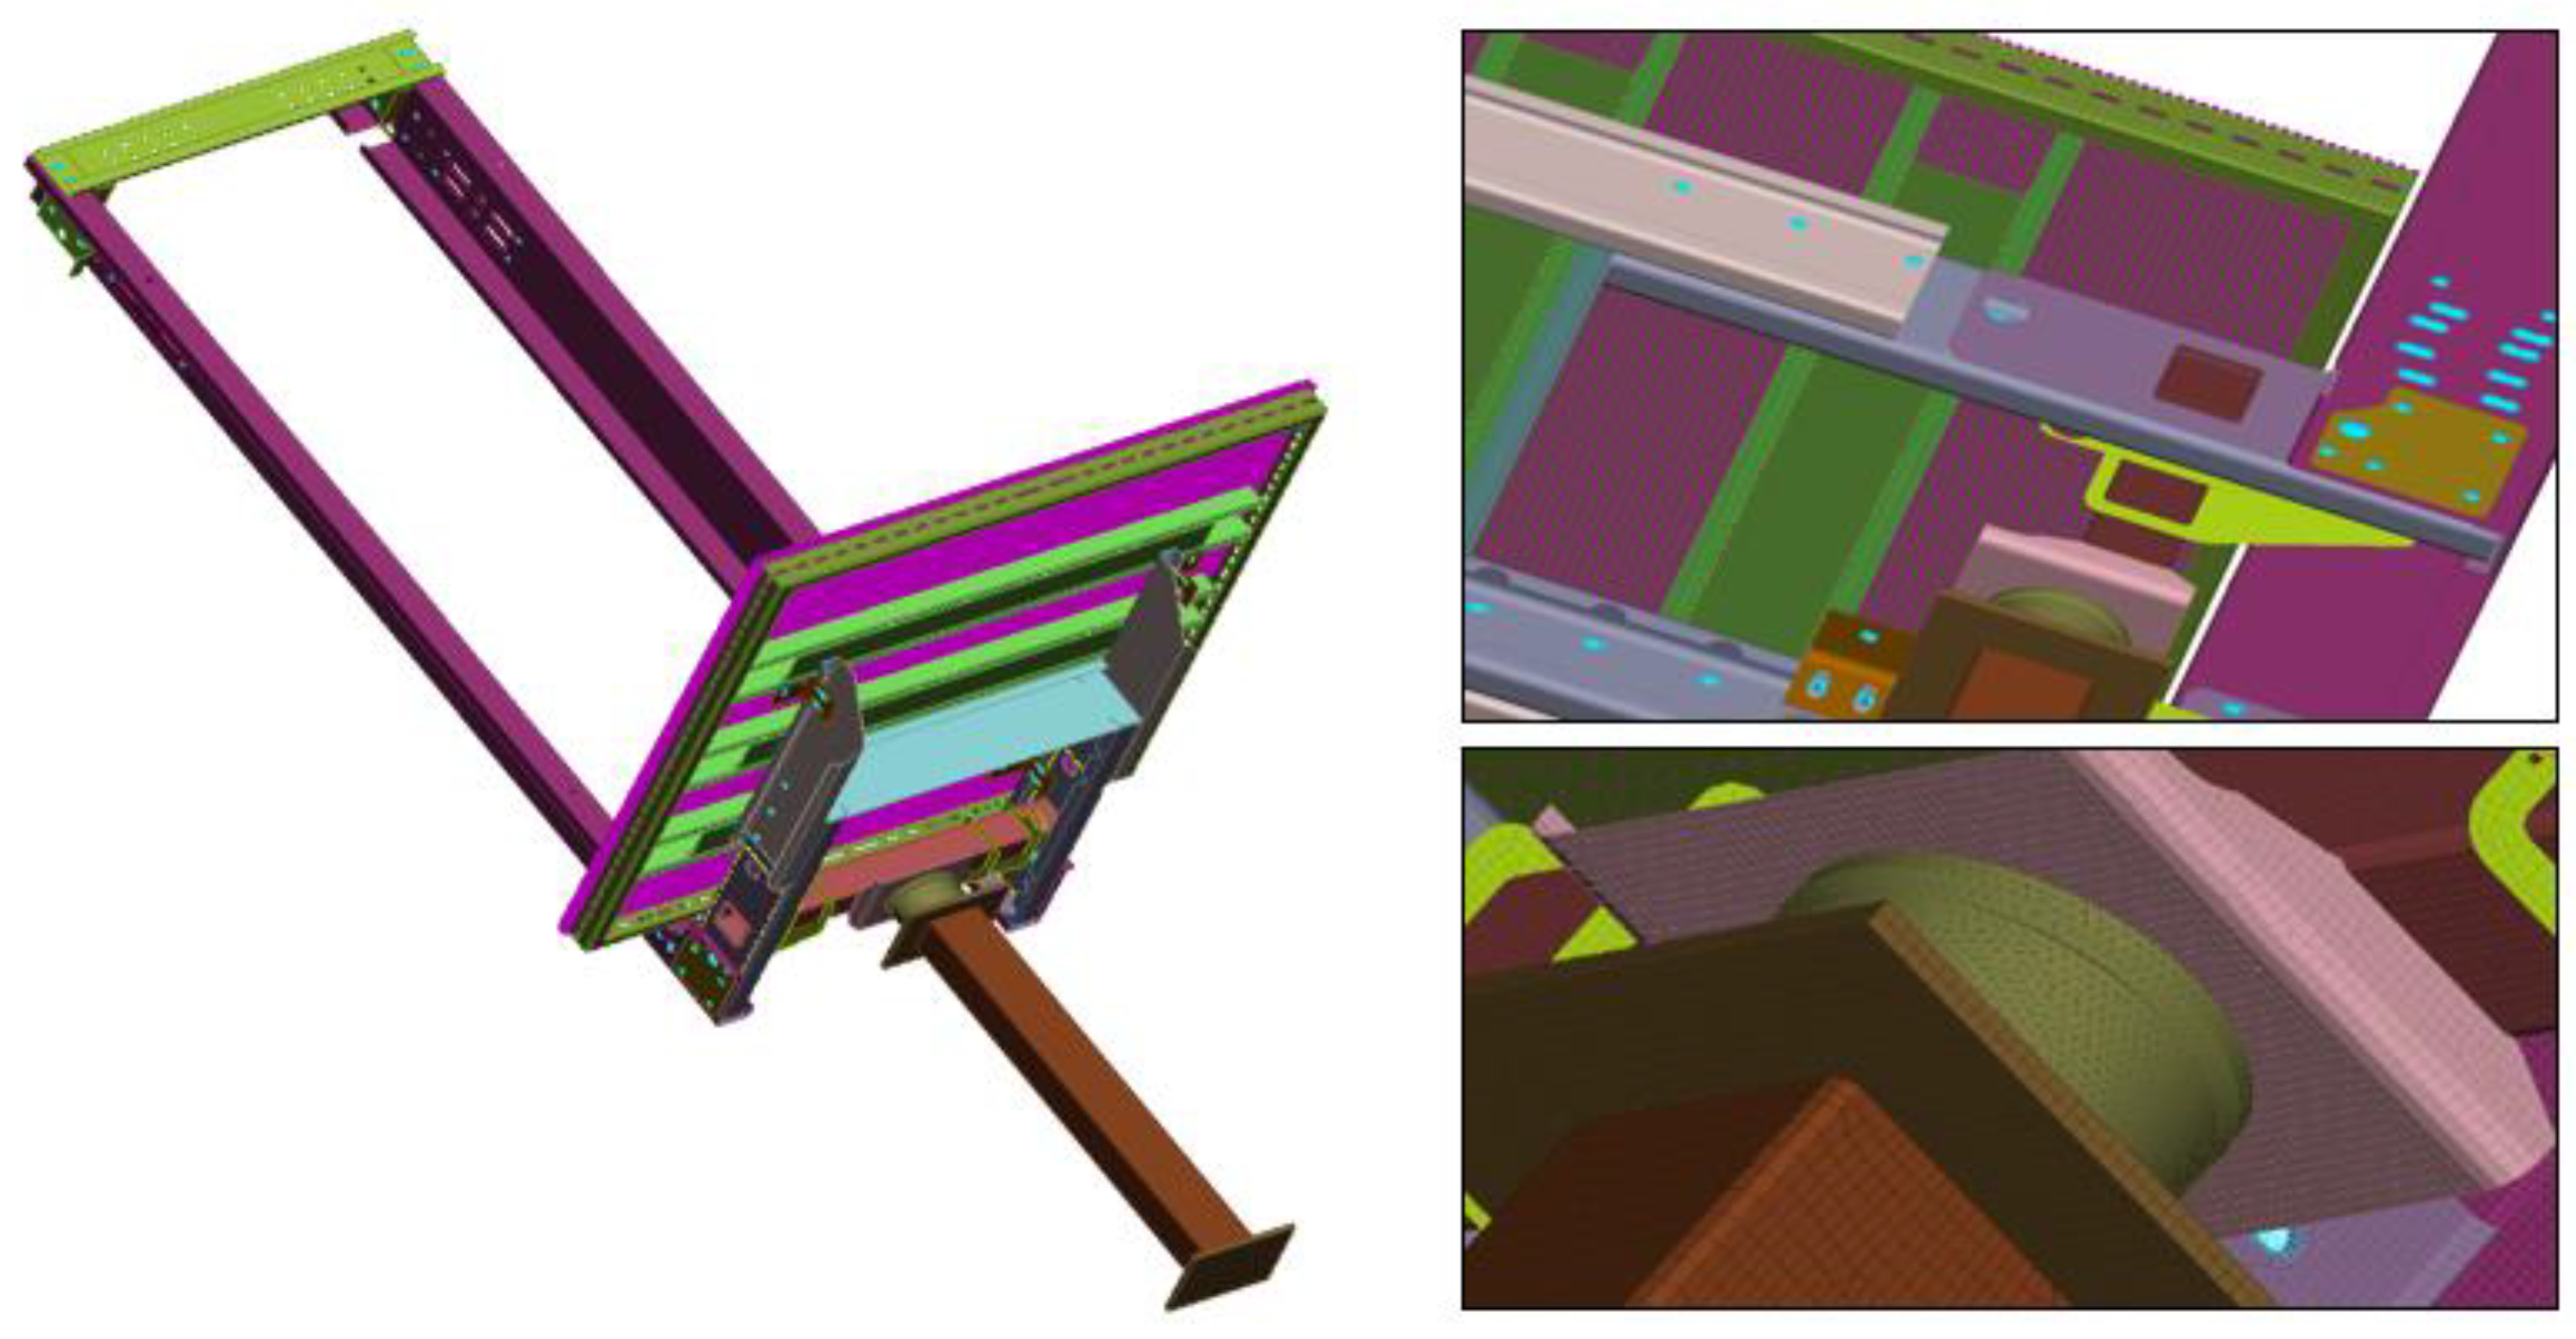
The complete elevator system (test-case chassis), used in the in situ experiment is shown in
Figure 6 with the corresponding Finite Element model. The geometry of the chassis was discretized using mainly rectangular and triangular shell finite elements. Additionally, solid (hexahedral) elements, rigid body elements and some other special elements are used. The total number of degrees of freedom in the resulting FE model is about 2,500,000.
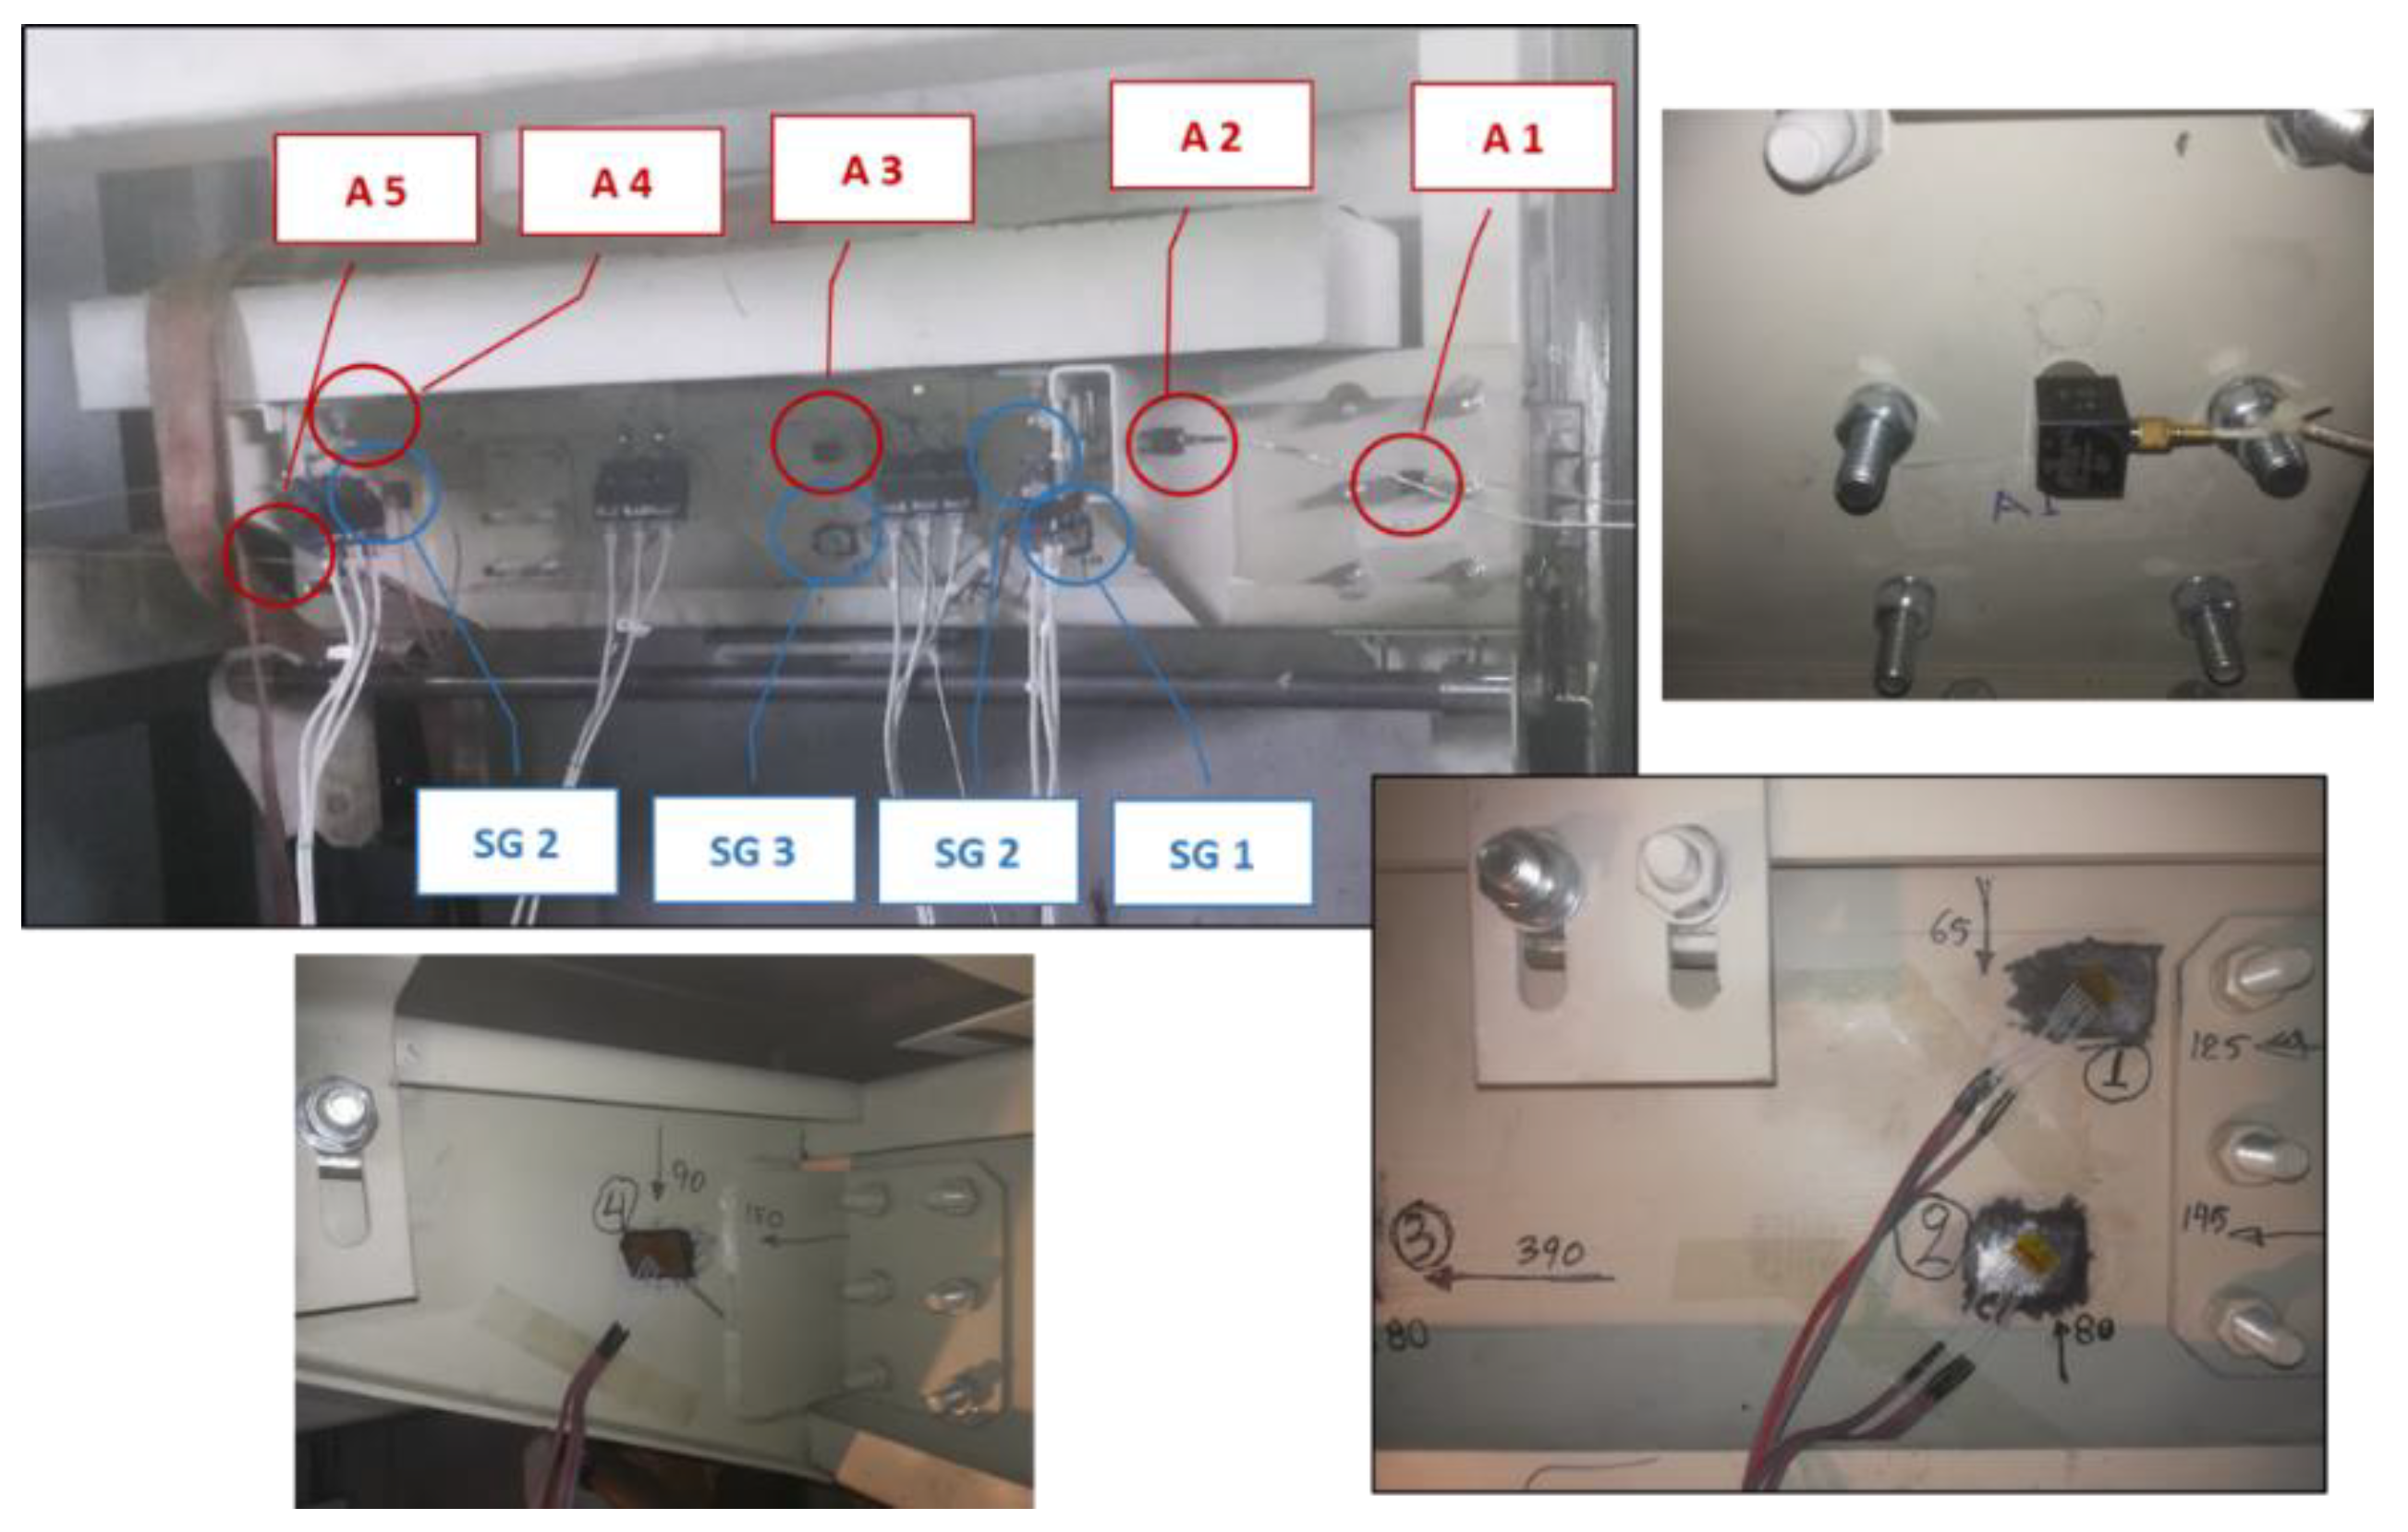
In order to test the reliability of the applied FE model update methodology, four (4) strain gauges (HBM) and five (5) ±50 g triaxial accelerometers (BK 4535-B-001 type with frequency range of 0.3–10,000 Hz) are placed at selected positions of the chassis and a set of measurements is carried out under real dynamic loading conditions—a crash scenario with impact velocity of the chassis to the absorber 1.3278 m/s, using a data acquisition system of National Instruments (cDAQ 9178, with modules 9234 and 9237). The sensor locations are presented in
Figure 7 and include the strain gauge locations (SG1, SG2, SG3 and SG4) and the accelerometer locations (A1, A2, A3, A4 and A5). For a complete monitoring of the stress state, three bridges with a 90 o angle rosette were placed at each of these locations. At each measurement location, the stresses calculated are the normal stresses
and
, the shear stress
and the maximum equivalent von Mises stress.
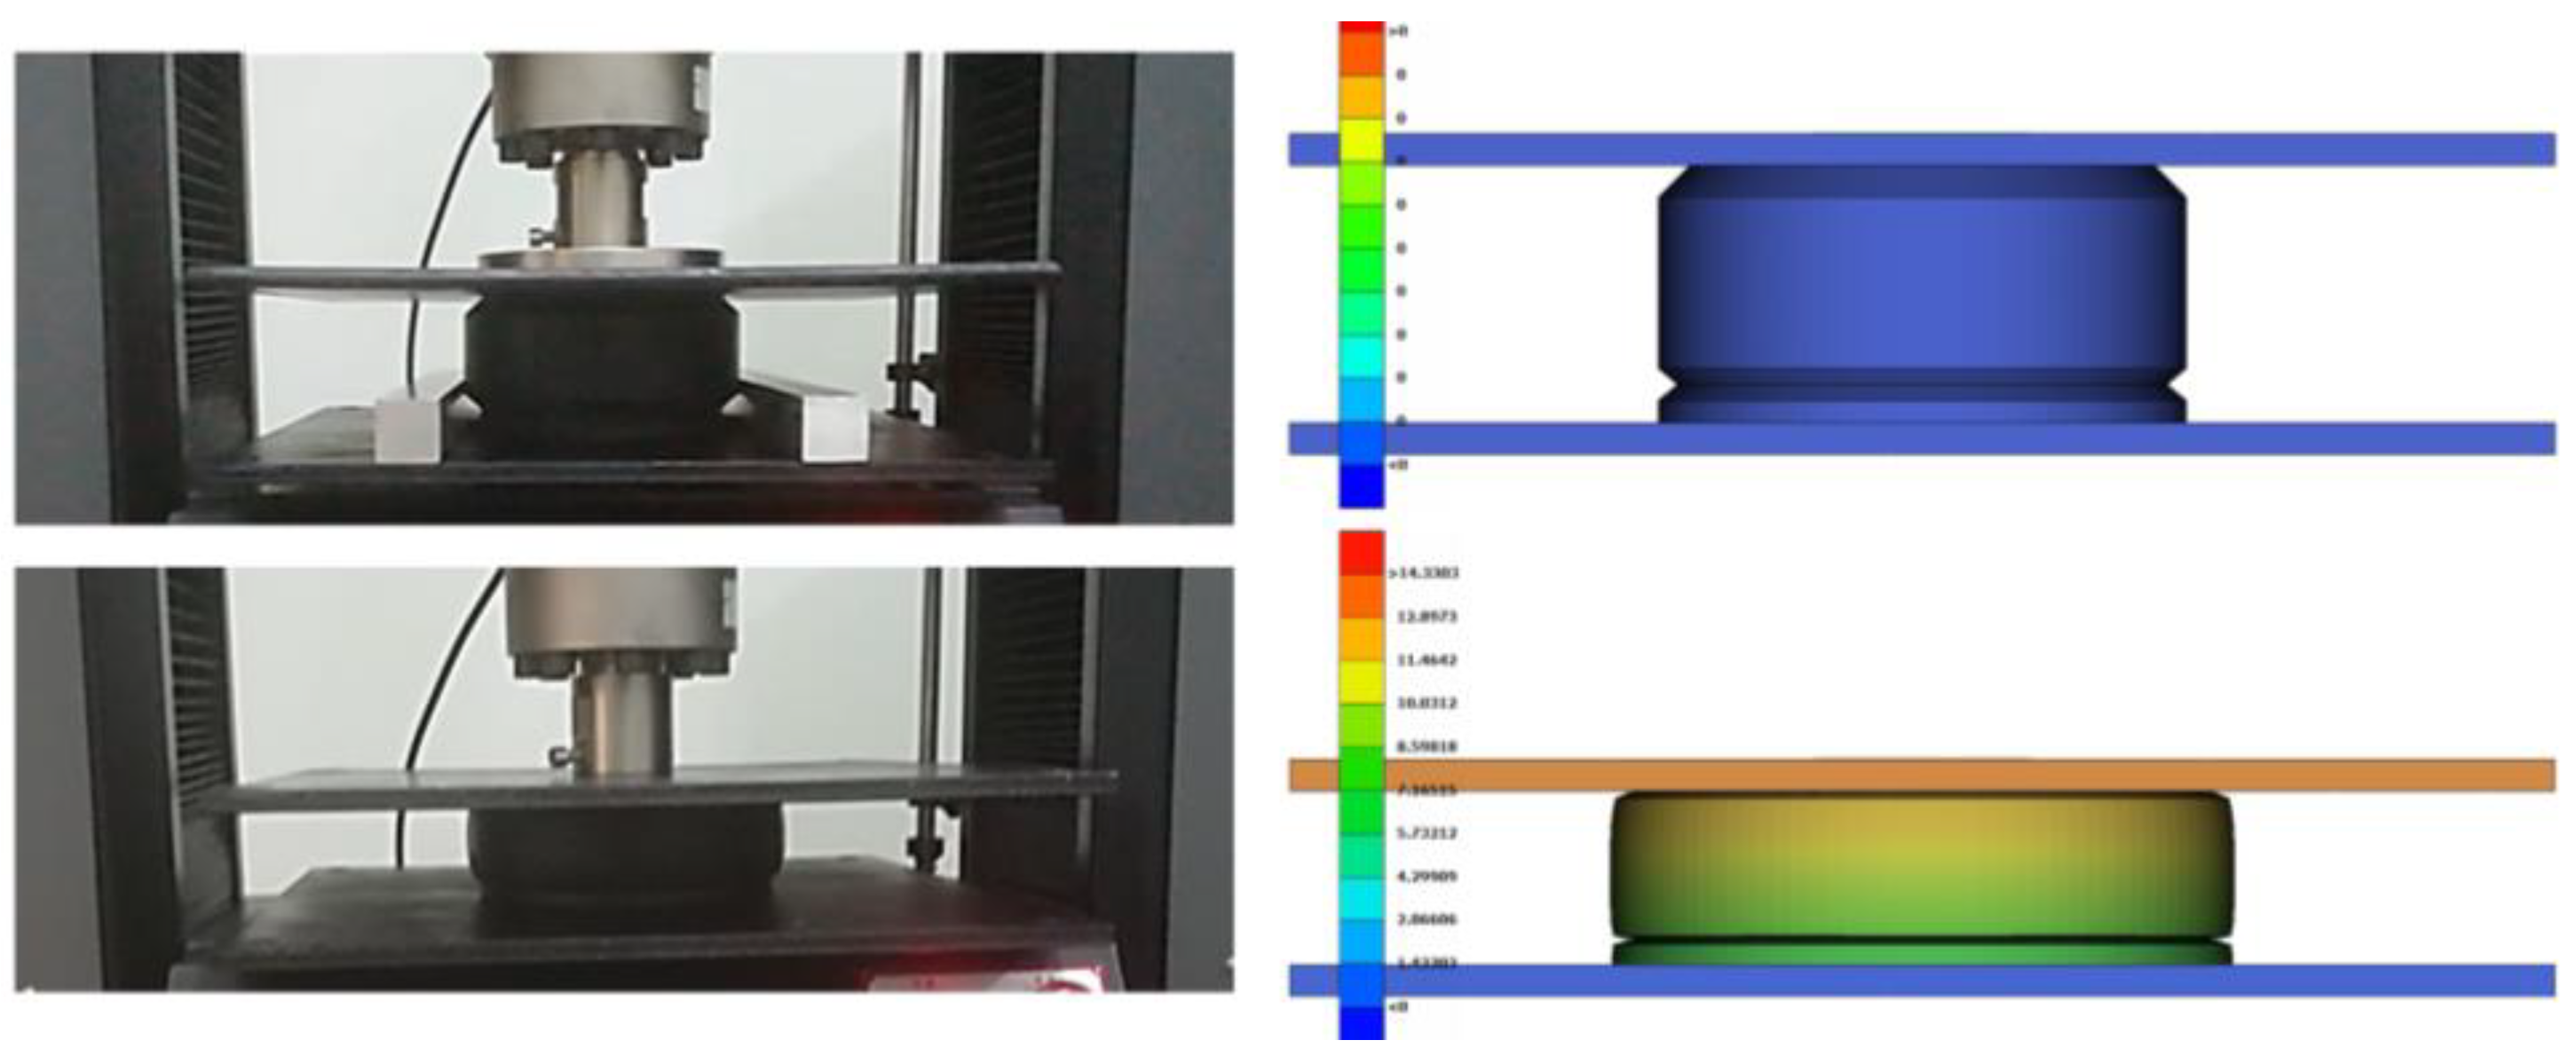
For the equivalent FE simulation, an explicit nonlinear response analysis was performed using nominal material properties for the steel chassis of the elevator components where Young’s modulus is
, Poisson’s ratio
and density
. An elastoplastic, elastic-full plastic material behavior was selected for the steel material, having a yield stress at
, meaning that the behavior of the steel is perfectly elastic, up to the yield stress limit. If yield stress is reached, deformation is progressing with no further stress development on the material. Respectively, the updated parameters of the hyperelastic Mooney–Rivlin material model were assigned to the polyurethane elastomer shock absorber. An explicit nonlinear transient response analysis was carried out within DYNAMIS at a time step of
. The time-step size chosen for stability of the analysis was selected based on the Courant–Friedrichs–Lewy (CFL) condition, considering the smallest element characteristic length and an approximation for the longitudinal wave speed. It is worth mentioning that although the elastomer absorber is deformed at maximum levels, the Mullins effect [
28,
29] does not apply to this specific arrangement. The reason is that the shock absorber part is rendered useless and replaced after each crash test.
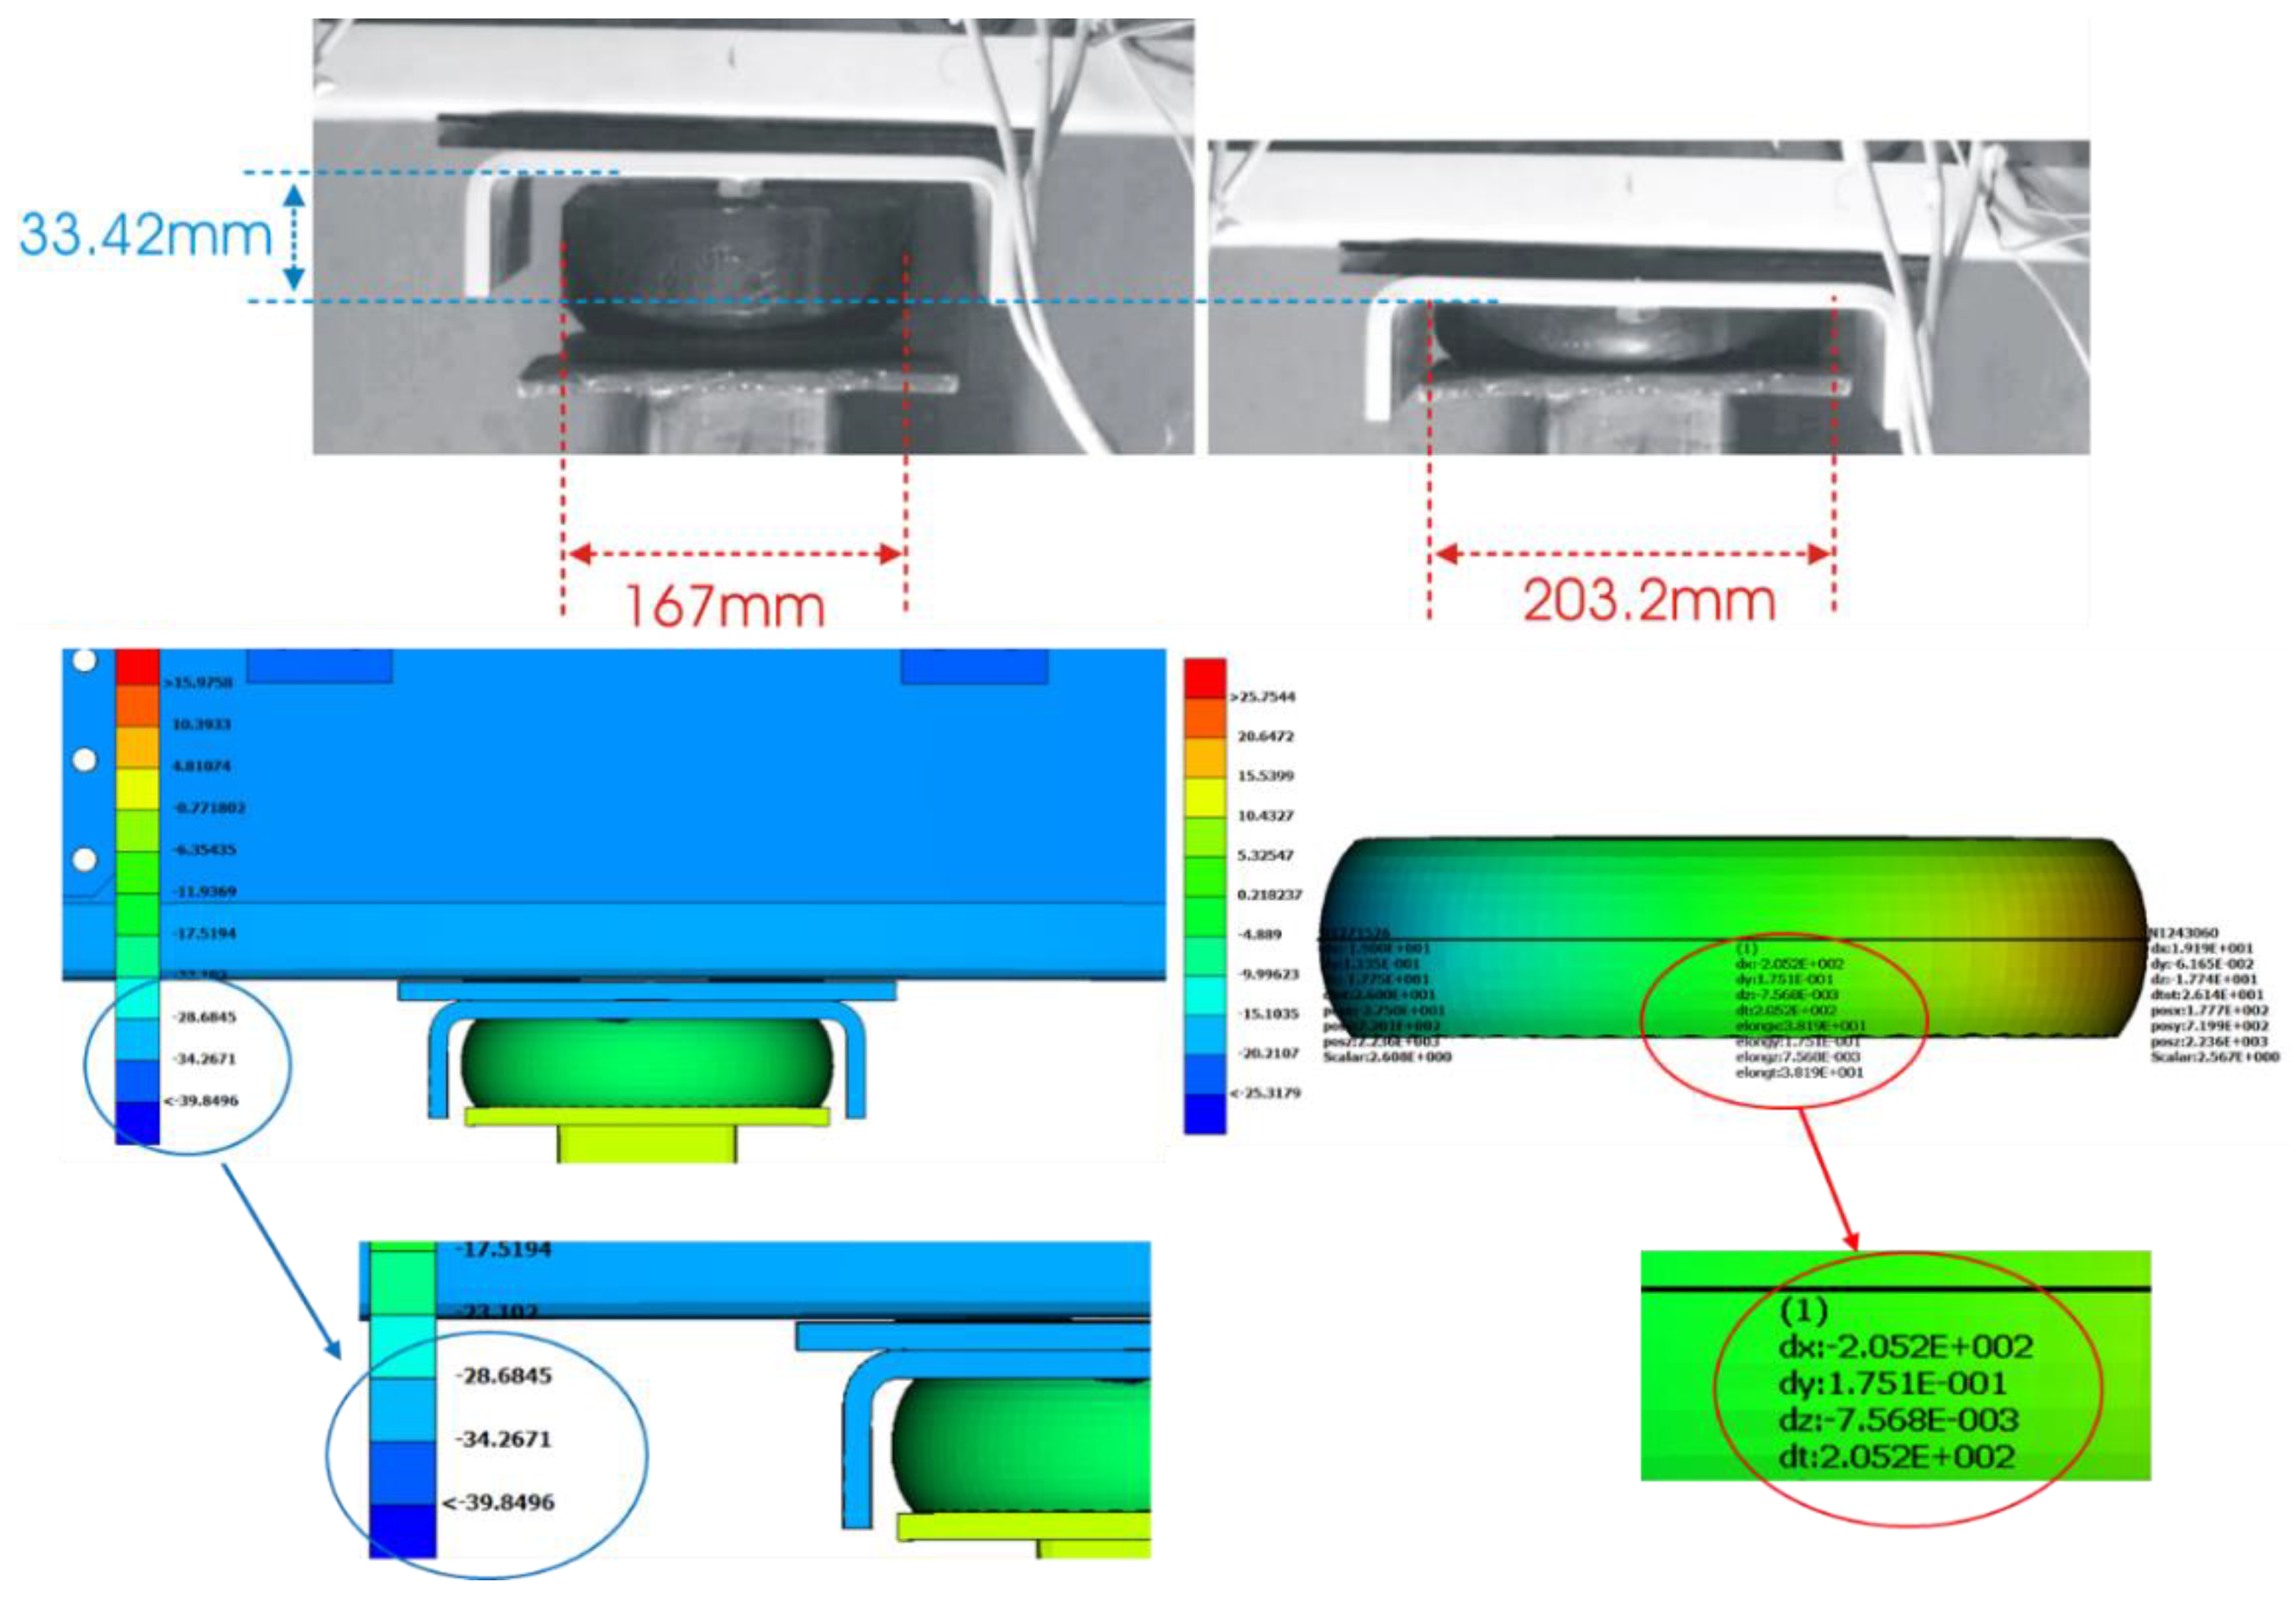
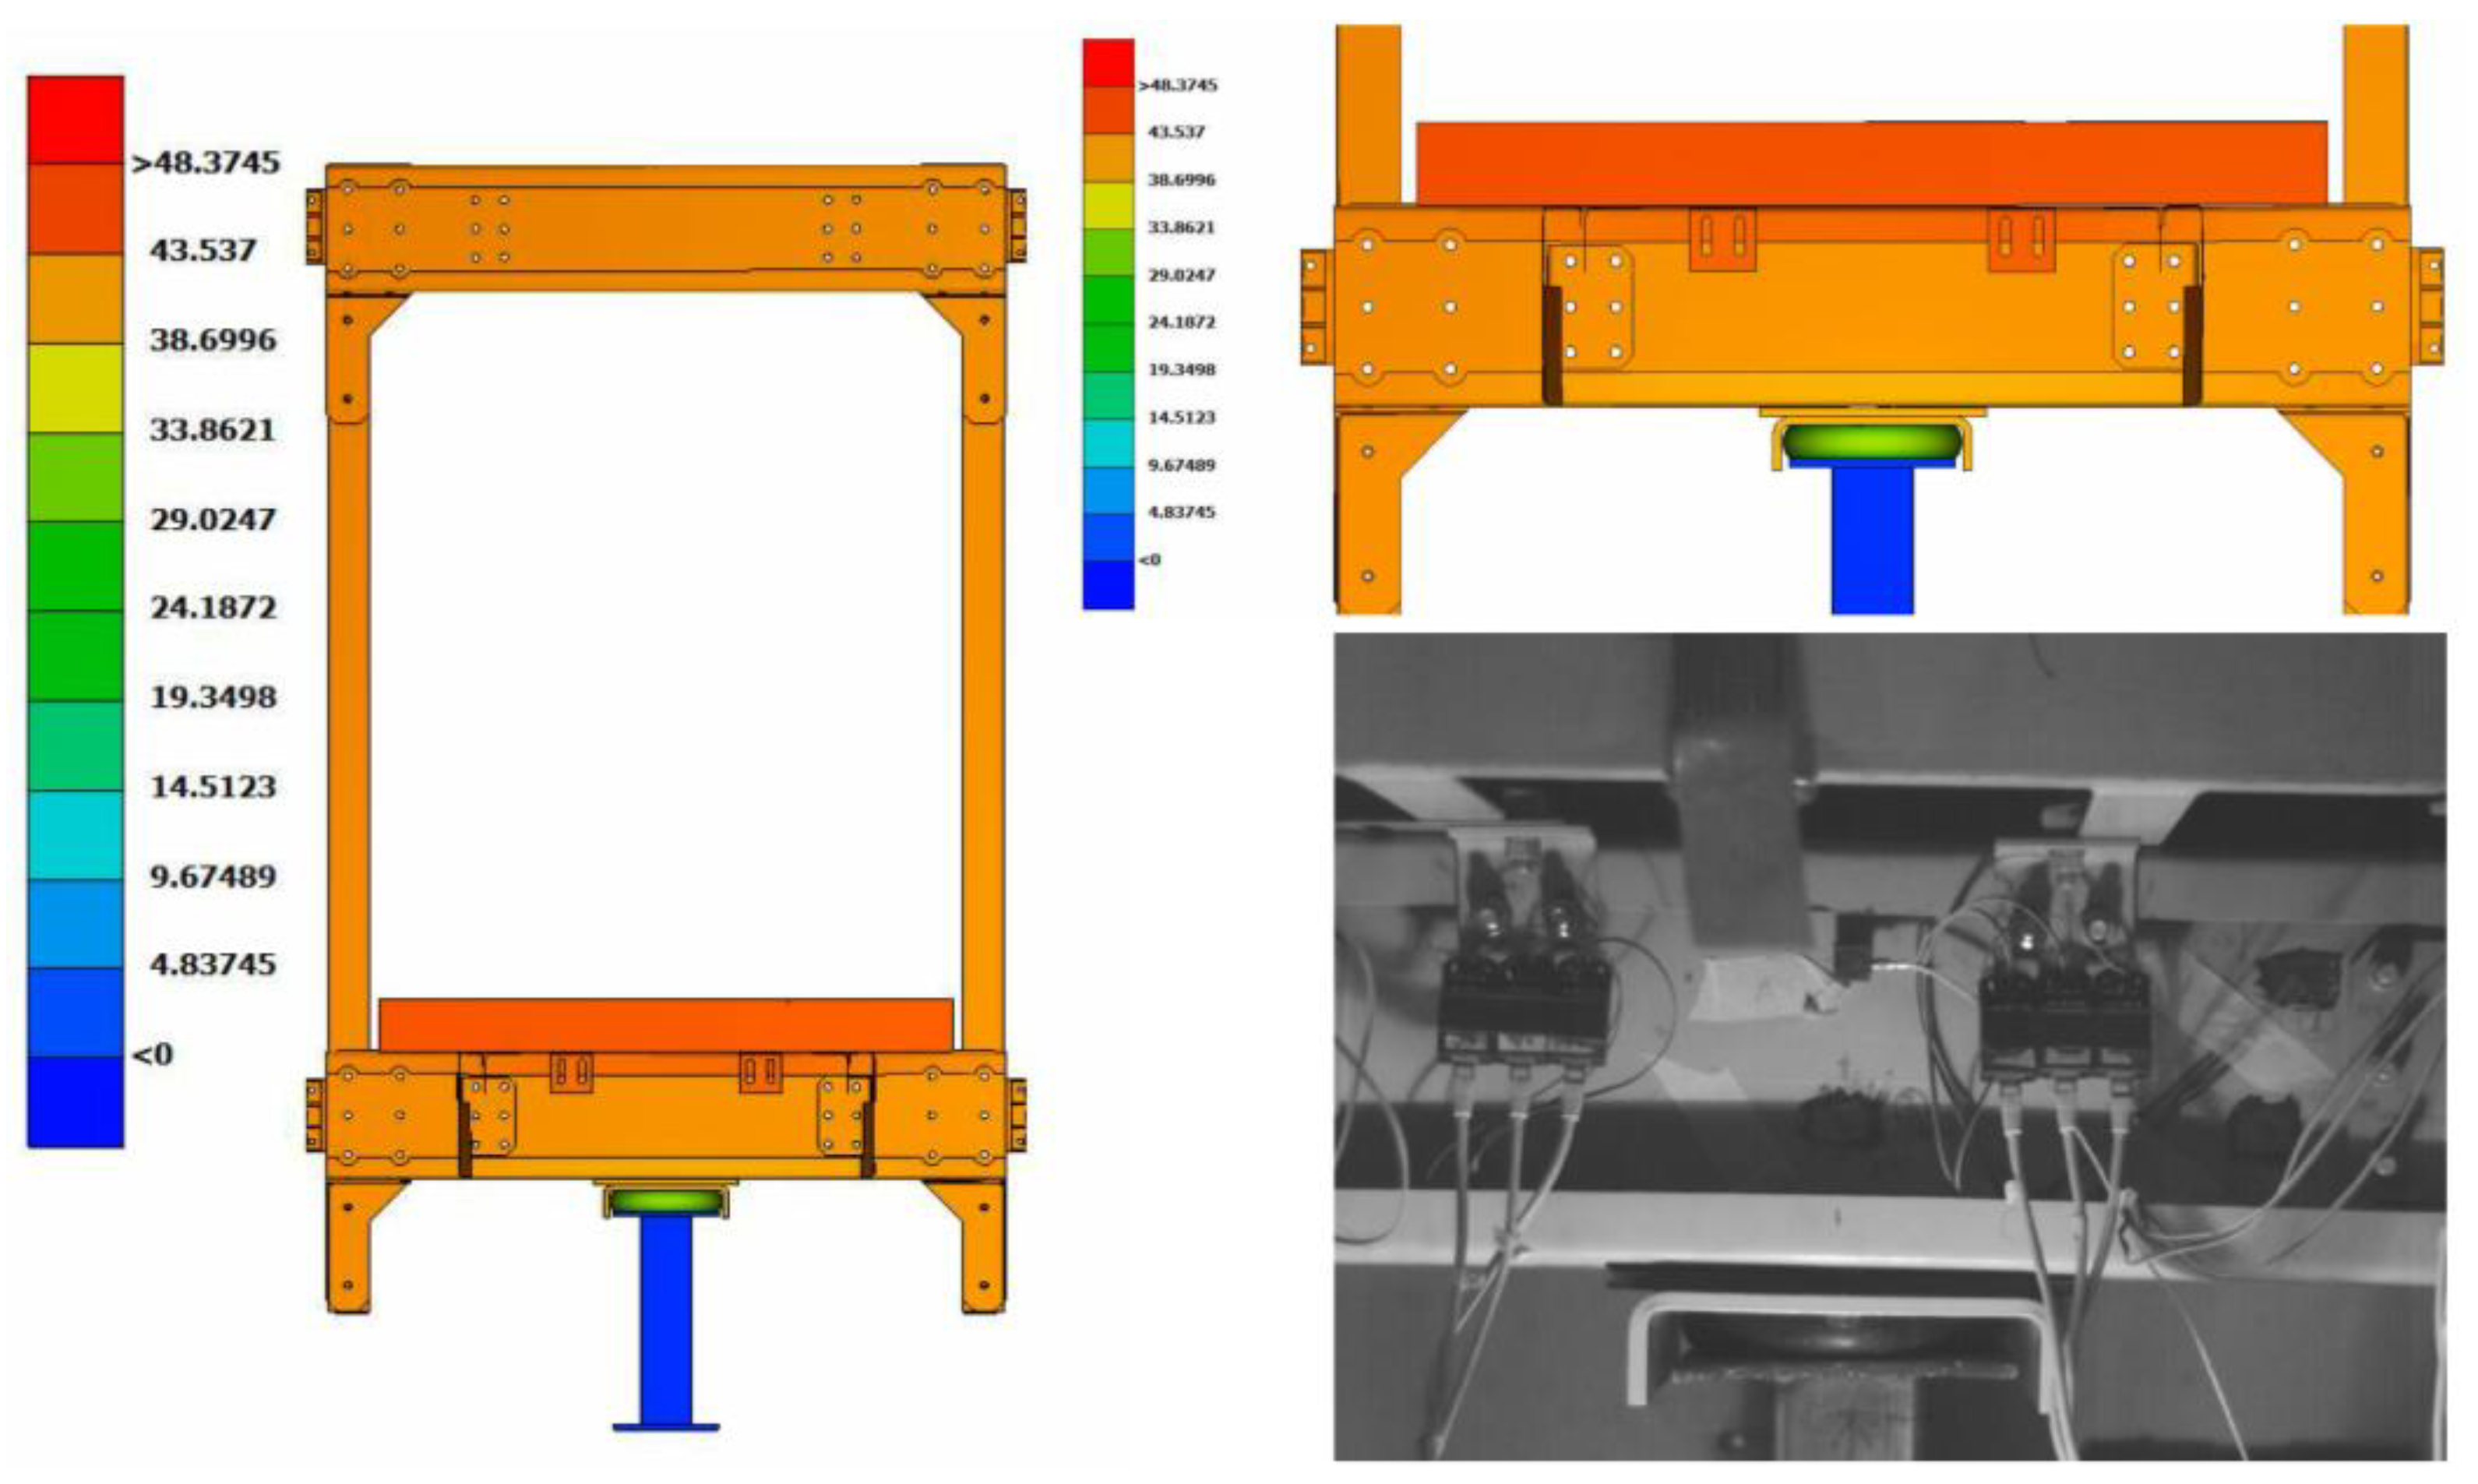
Figure 8 presents the results of the displacements from the numerical analysis of the Finite Element model. Specifically, an instant in time of the test-case elevator chassis colored by contours of displacements is presented in the right part of
Figure 8, whereas the right part compares the deformation of the buffer at the instant of maximum displacement between the numerical analysis results and the experimentally measured data from a high-speed camera. It is worth mentioning that the strain-rate effect is insignificant for this test and therefore not examined.
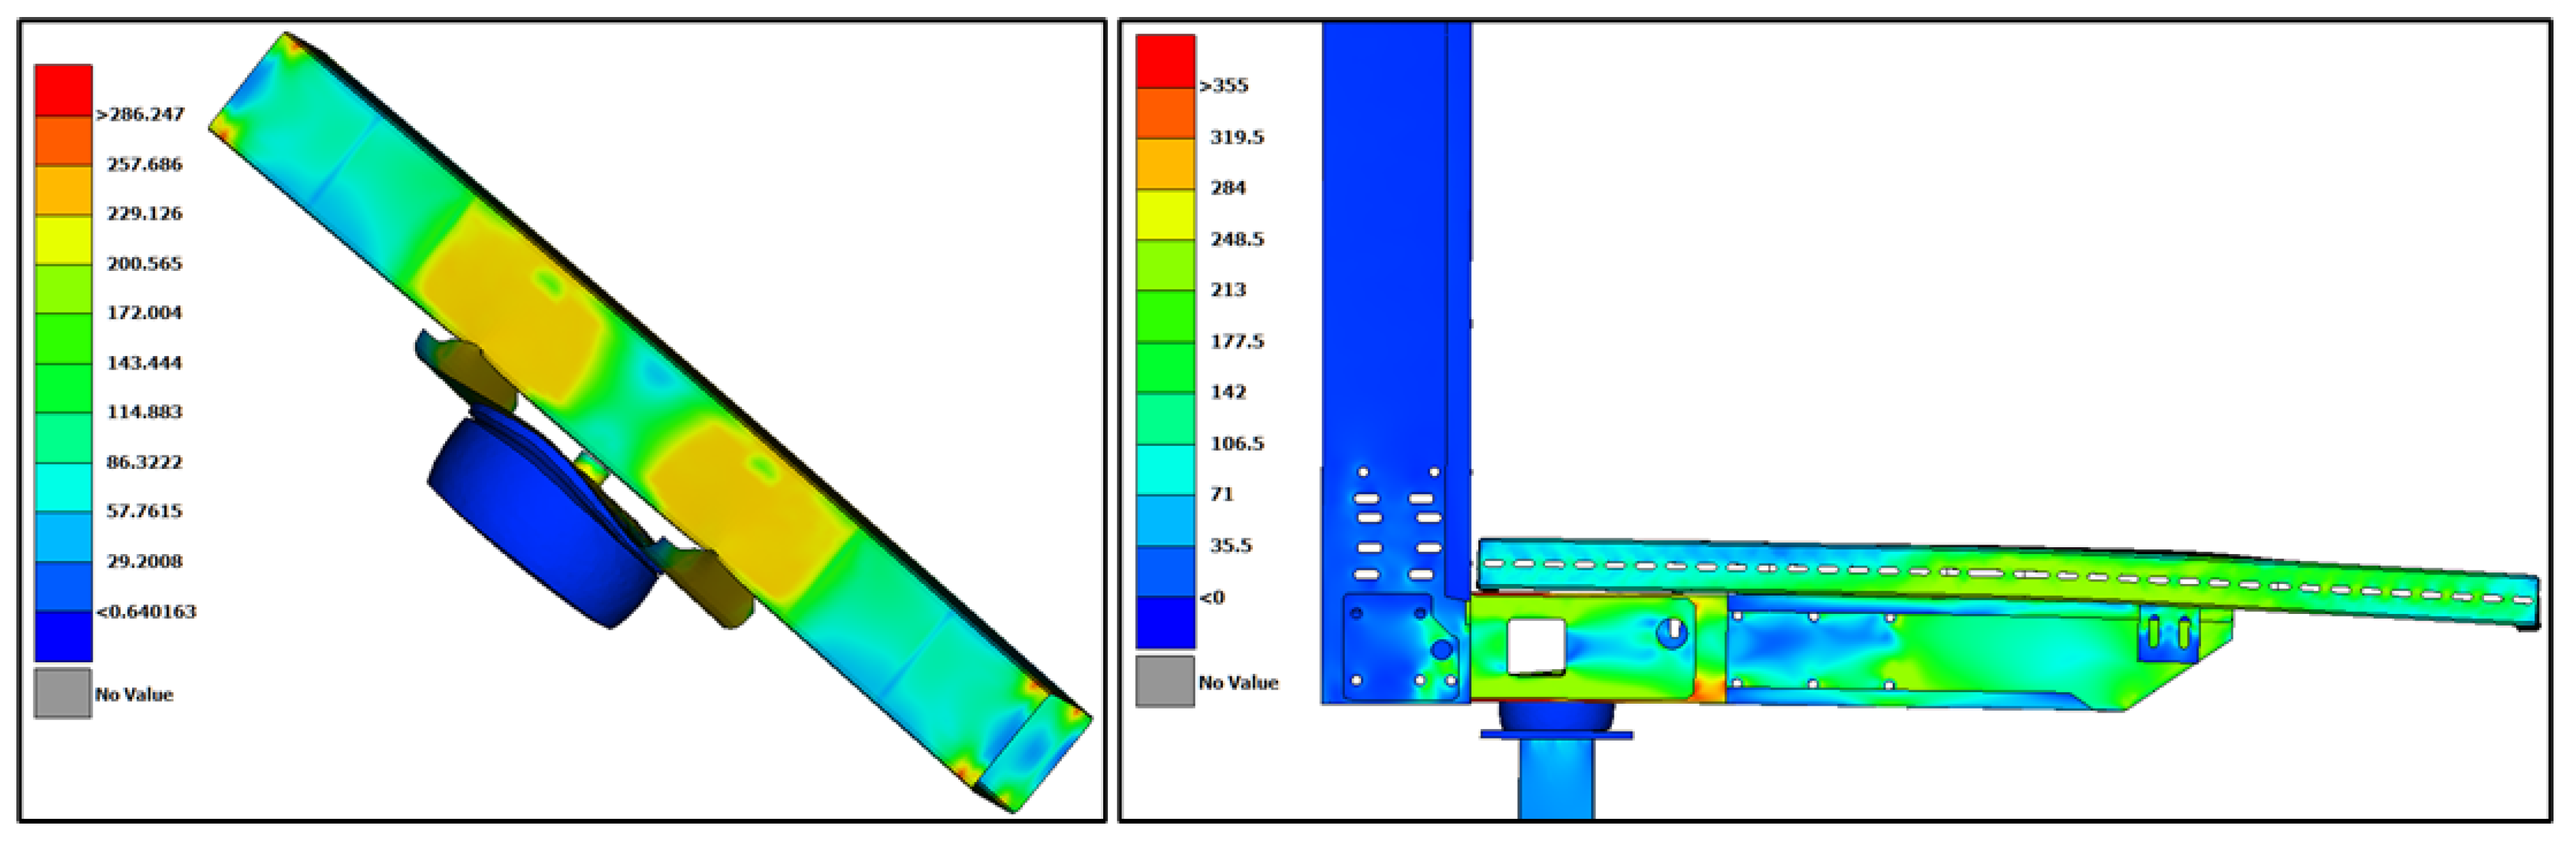
Moreover,
Figure 9 details the comparison between the numerical results and the experimental measurements, for the lateral and vertical deformation of the buffer at the maximum displacement position. The experimental results were obtained from high-speed camera images. Specifically, at maximum displacement the lateral deformation of the buffer results in a total diameter of
from the high-speed camera images, compared to a total diameter of
predicted by the numerical analysis, validating the characterization of the hyperelastic material model of the shock absorber and its behavior in the lateral direction. Additionally, at maximum displacement the vertical deformation of the buffer resulted in
from the high-speed camera images, compared to approximately
predicted by the numerical analysis, validating also the shock absorber behavior in the vertical direction.
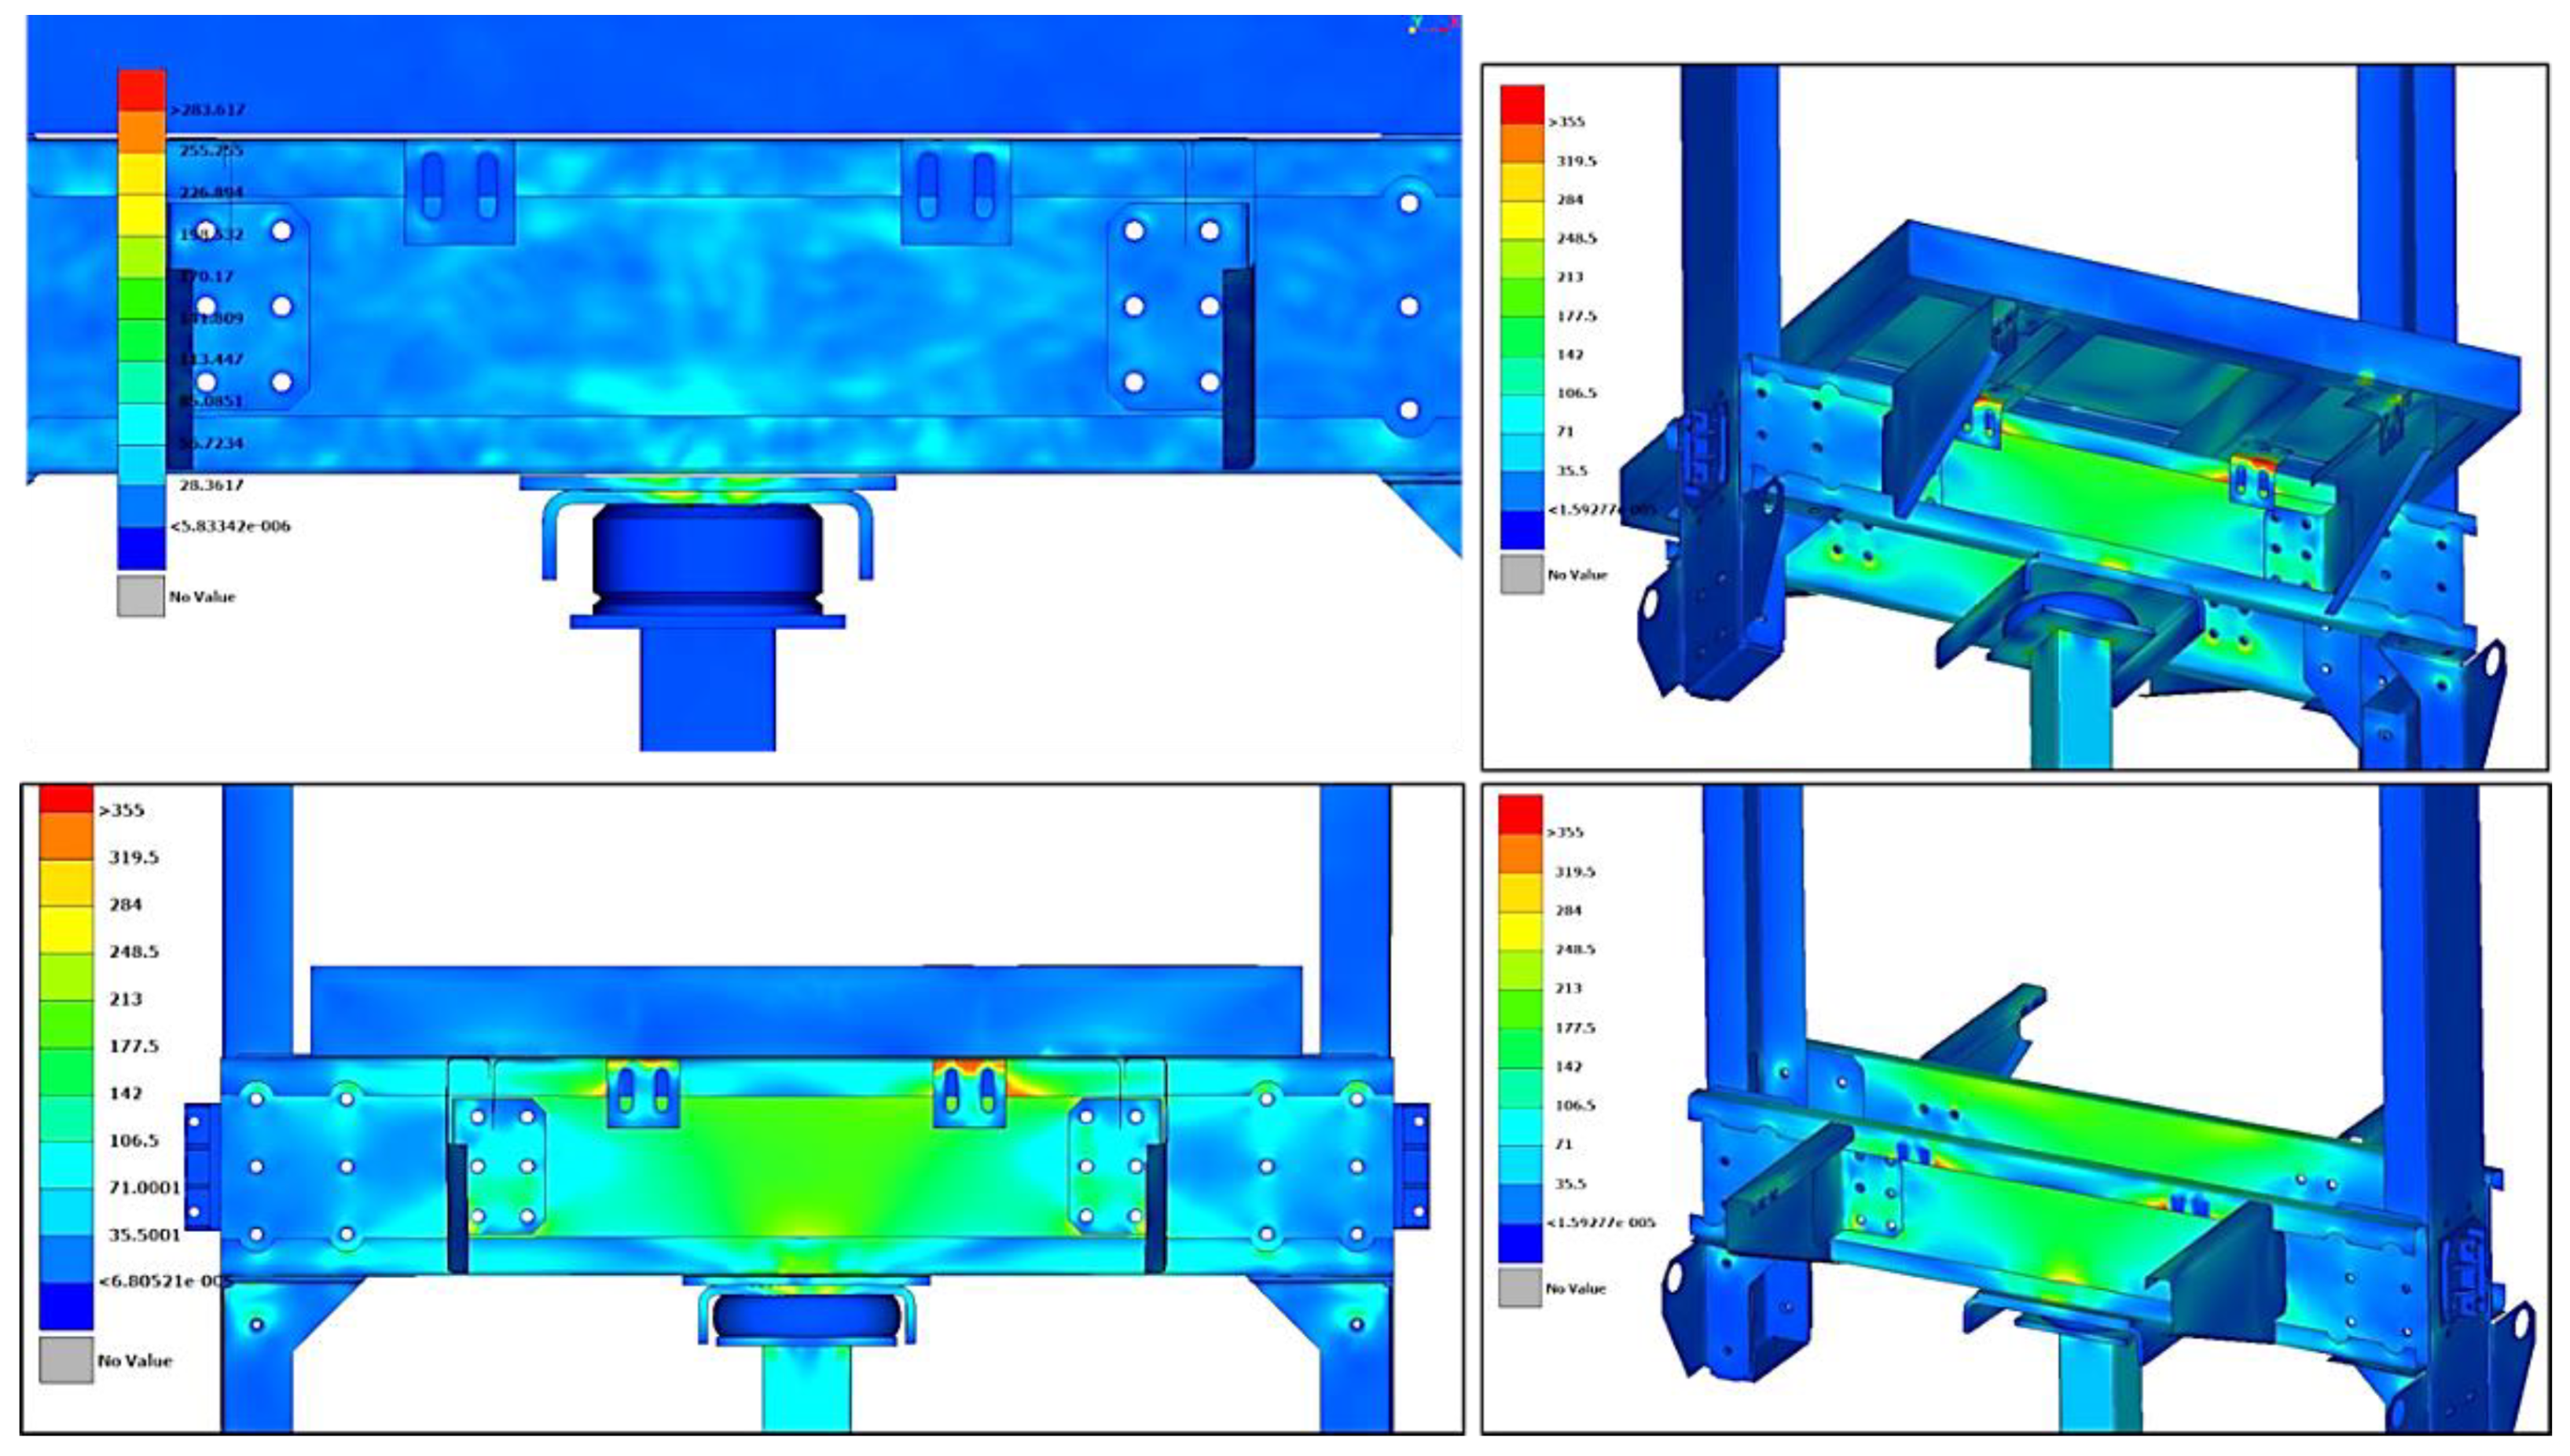
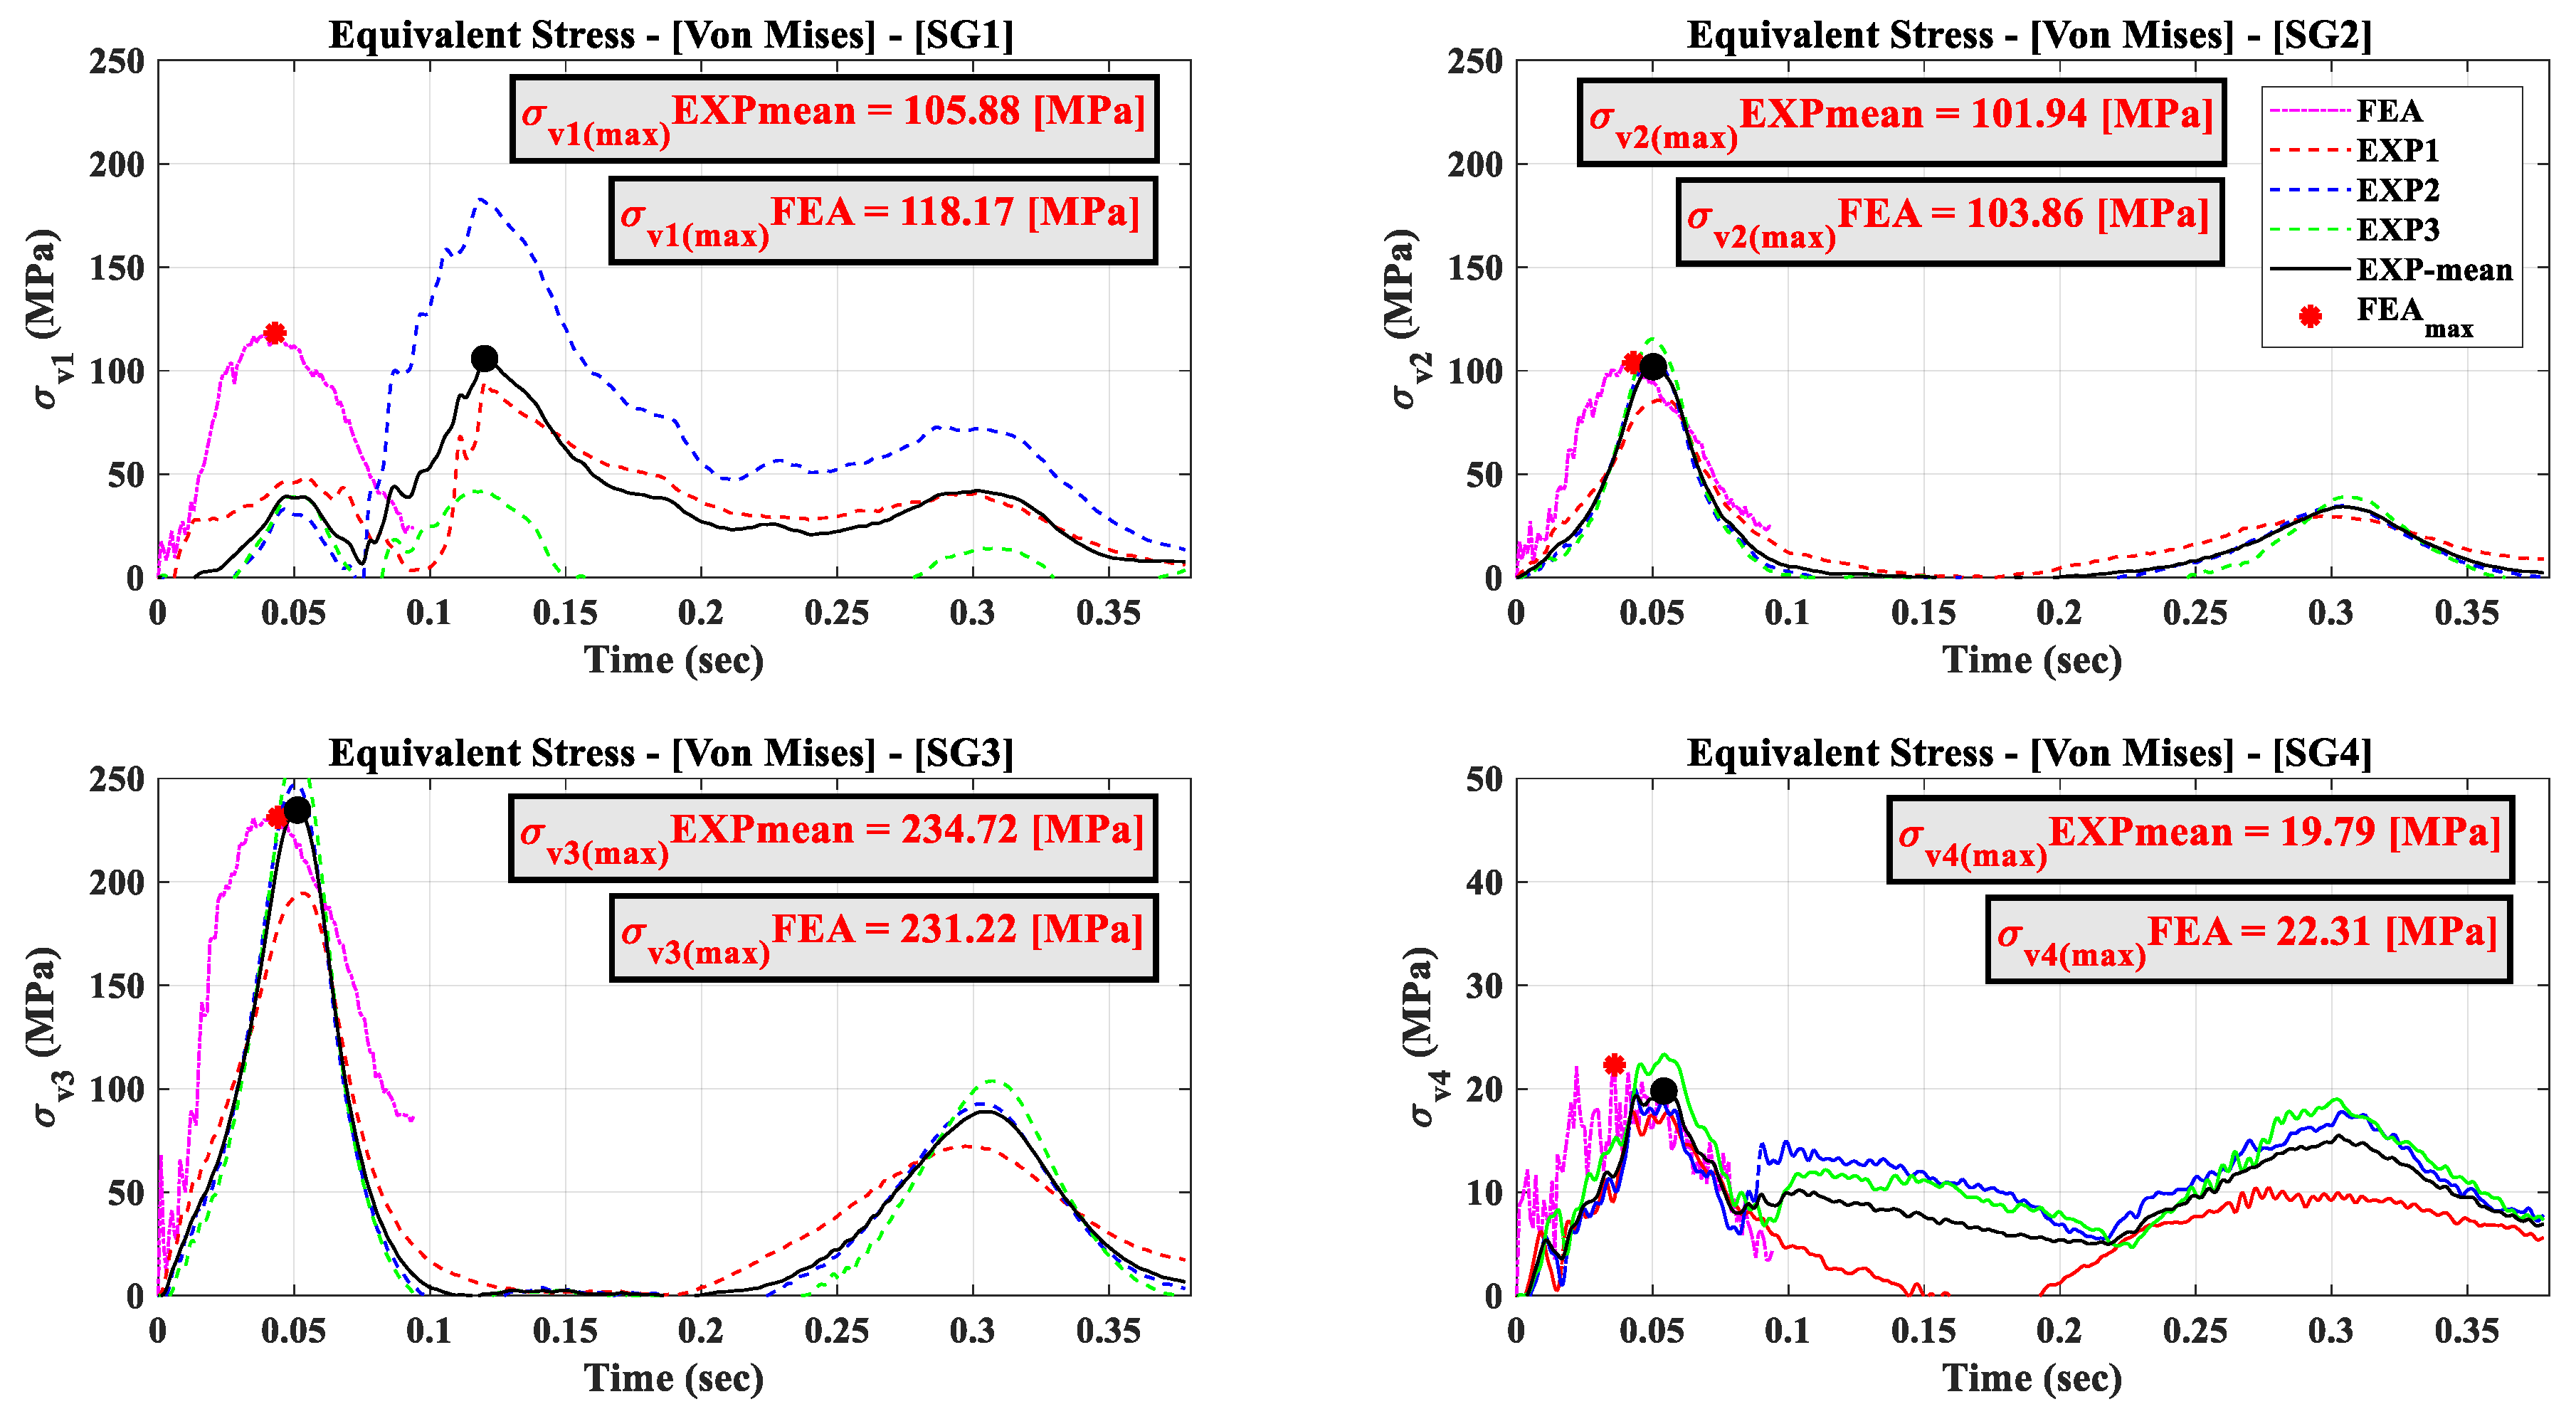
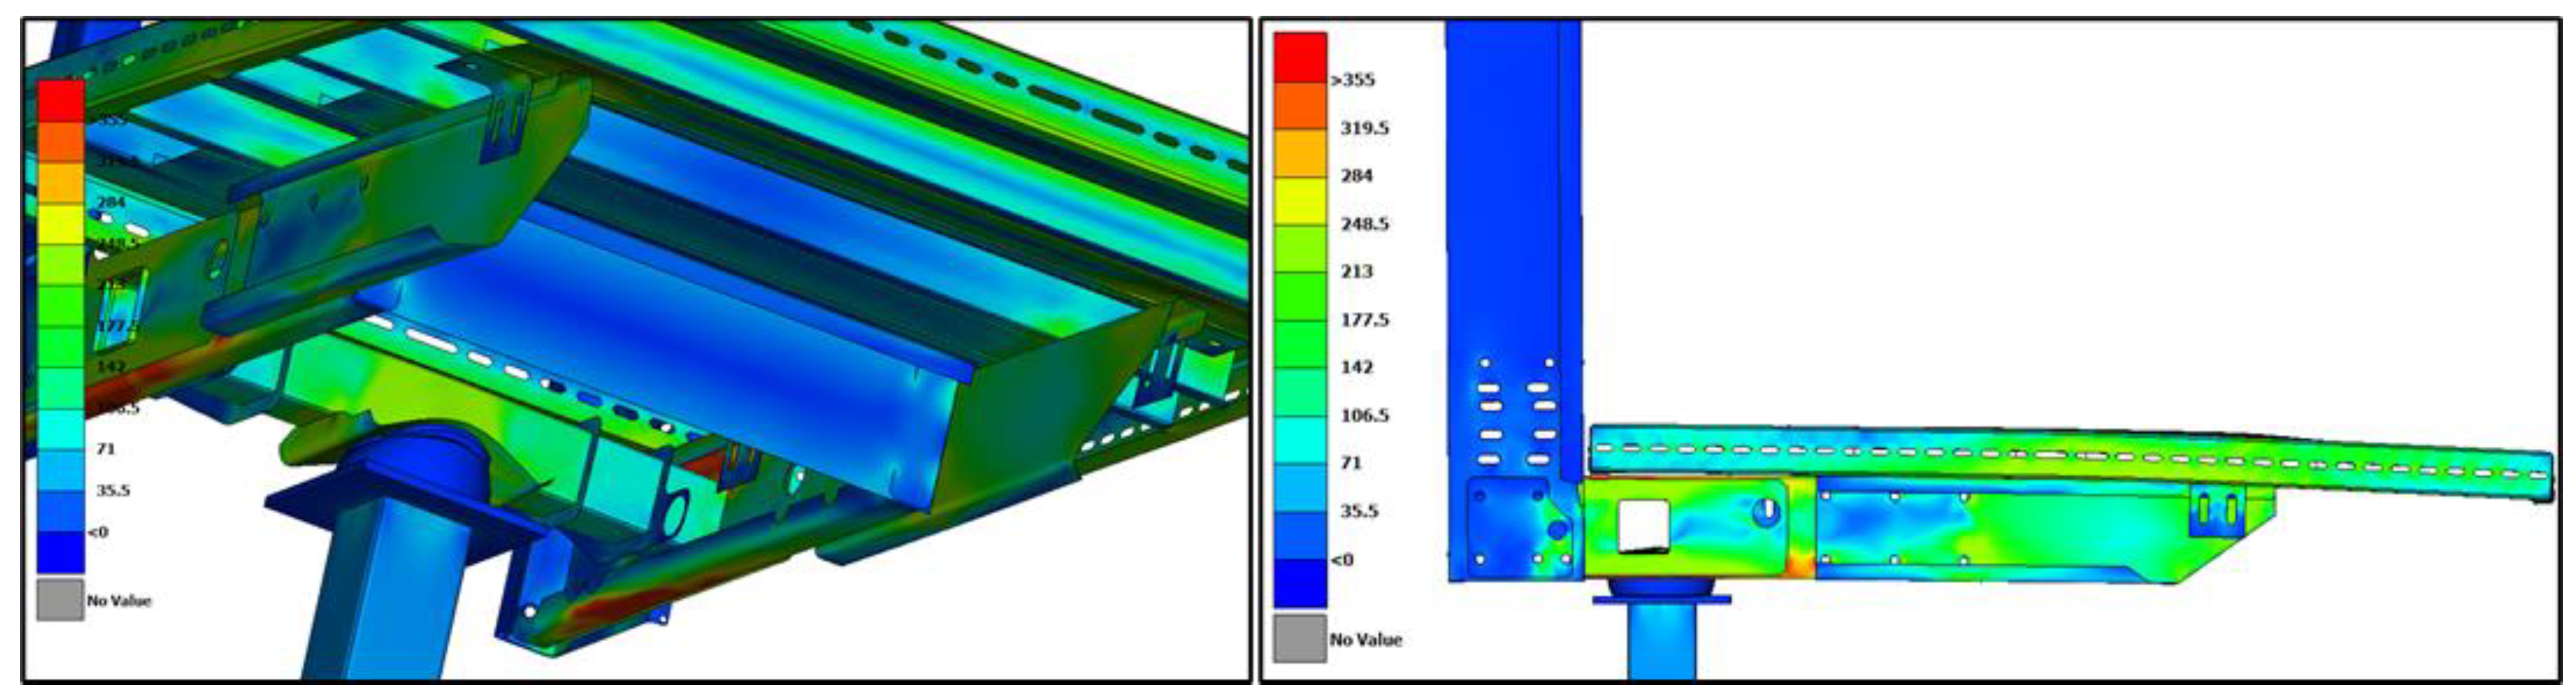
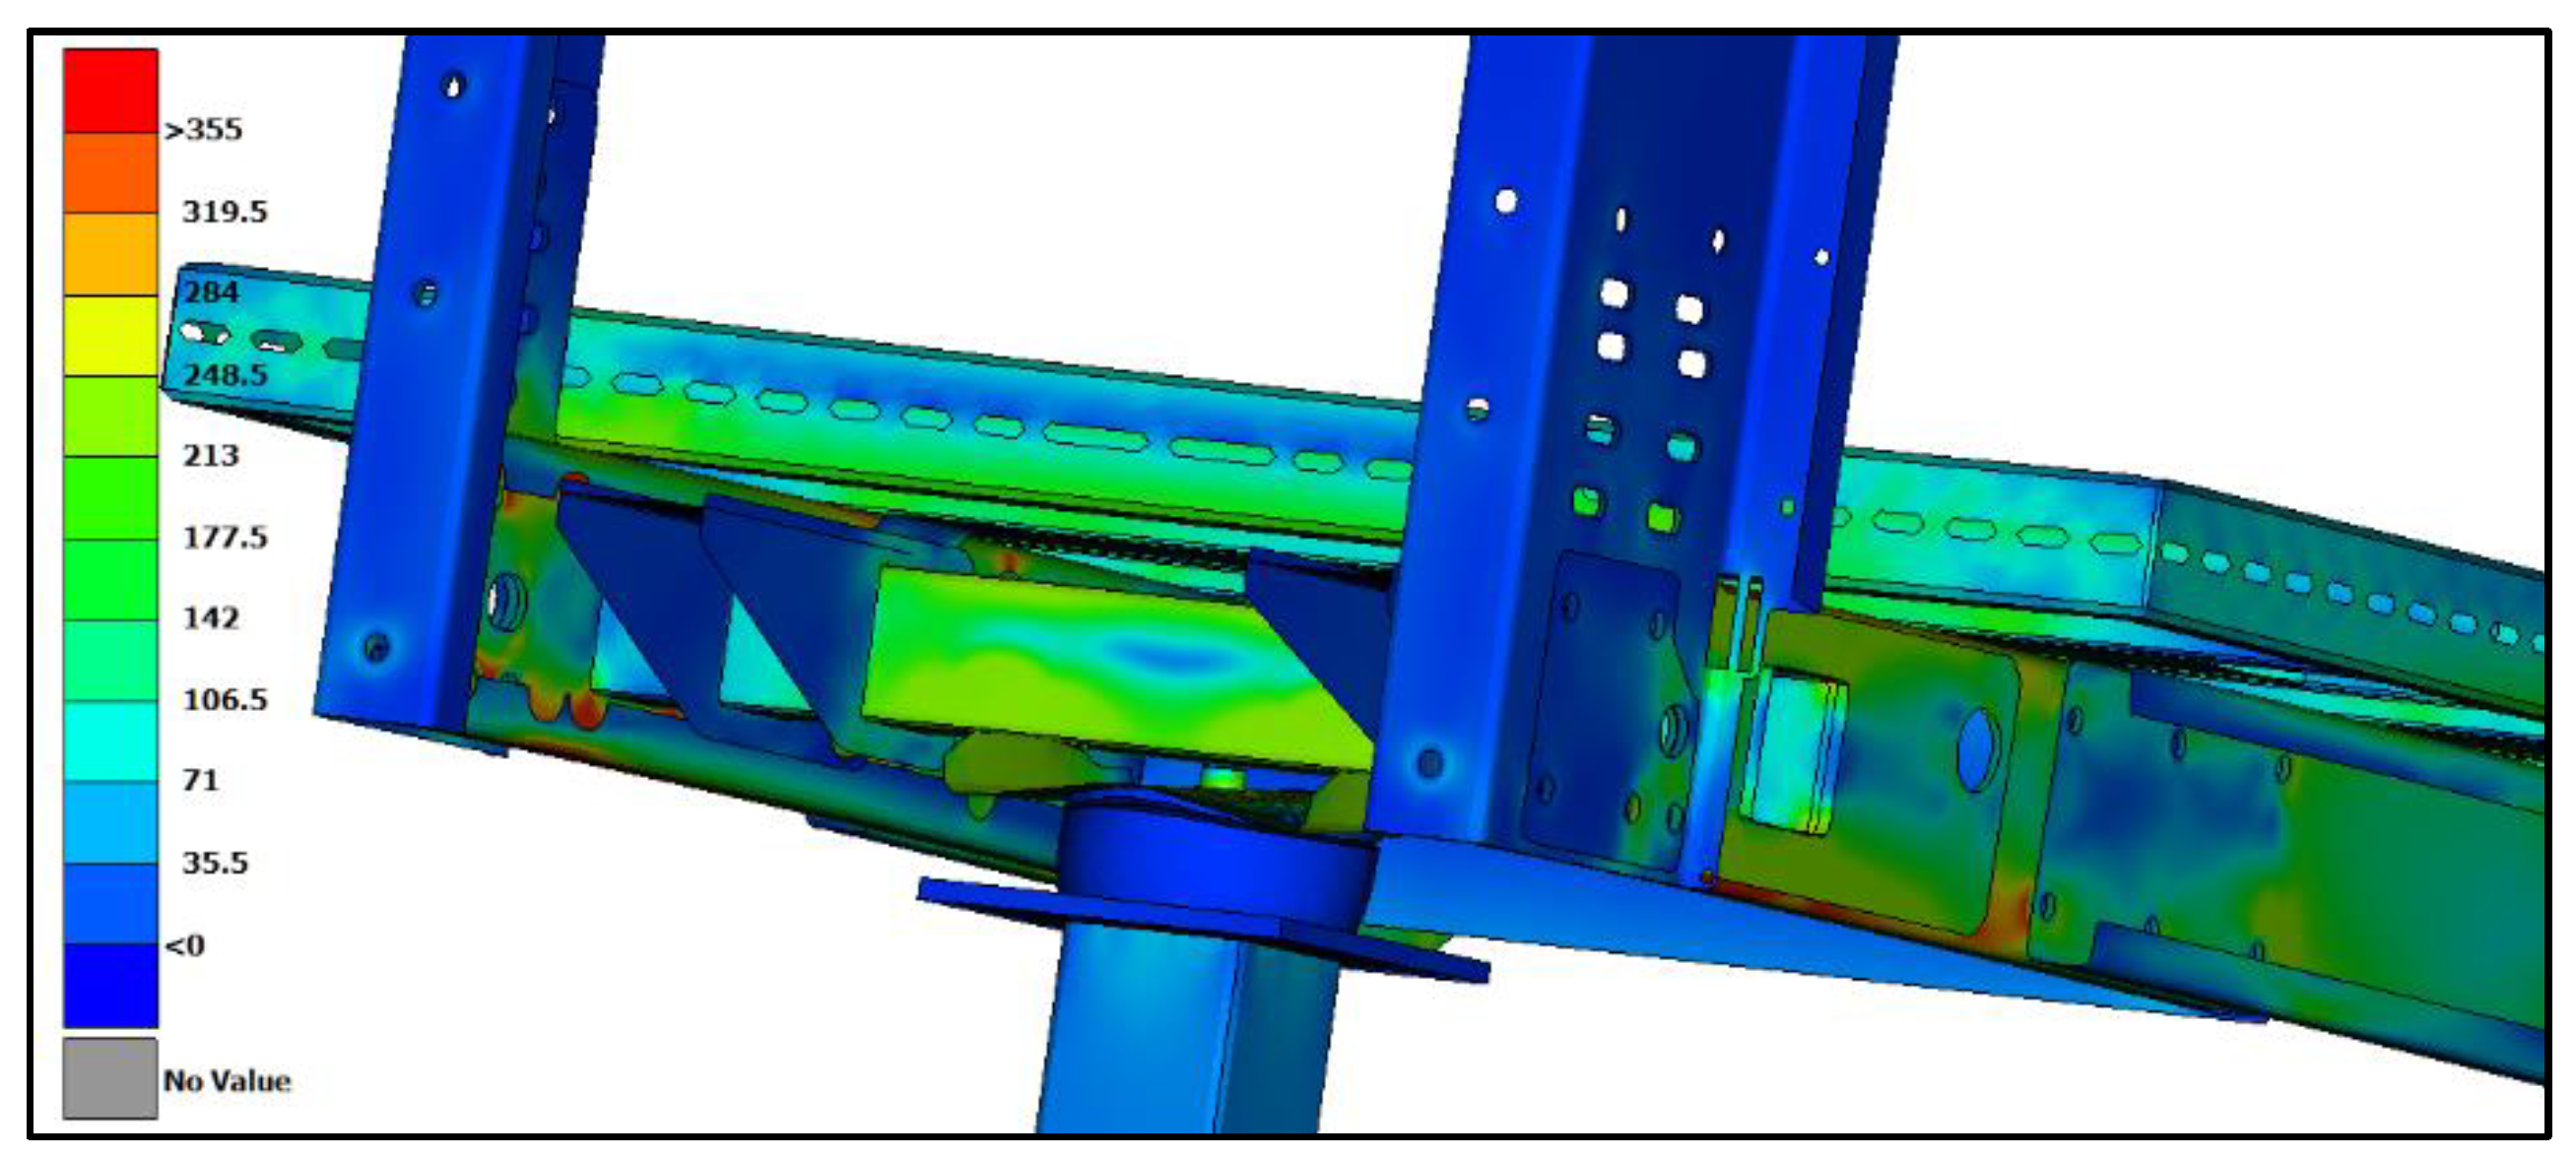
Figure 10 shows the distribution of equivalent von-Mises stresses on the test-case chassis at various instants of time where the red colored areas denote plastic deformations, as the stress is equal to the yield stress of steel. Finally,
Figure 11 comparatively gives the time histories of equivalent von-Mises stress. Specifically, the measured values at positions SG1–SG4, with the numerically calculated stresses (FE analysis) compared at matching response locations. A direct comparison of these results confirms that the maximum values of the experimentally measured stresses are very close to those computed numerically. More closely, the magenta dashes-dotted line presents the time history of the equivalent von-Mises stresses computed from the analysis of the FE model. Red, blue and green dashed lines present the time histories of von-Mises stresses from the three conducted experimental trials, whereas the black continuous line represents the mean time history of the three trials. Lastly, the red asterisk denoted the maximum value in time from the numerical analysis and the black dot the respective maximum value of the mean time history of measured stresses. A closer examination of this graph clearly validates numerical analysis from the in situ measured data at locations SG2, SG3 and SG4 both in time and in maximum equivalent von-Mises stress. However, although SG1 measurement and location matches in maximum stress value, it presents an inconsistency in the time domain variation attributed to faulty location mismatch between experimental set-up and FE model or uncertainties arisen from simplifications during the development of the FE model.
The above results, both in maximum displacement, vertical and lateral deformation and in equivalent von-Mises stress, clearly increase confidence of the characterized material model of the shock absorber, producing a high-fidelity FE model of the buffer. Specifically, in order to evaluate and judge the results presented in
Figure 9 and
Figure 11 one should take into consideration the numerous inevitable approximations and simplifications made in order to develop the large-scale FE model of the test-case elevator chassis and set-up the explicit nonlinear transient response analysis of the crash test scenario, compared to the physical experimental arrangement and free fall phenomenon. In detail, regarding
Figure 9 the maximum vertical displacement along with lateral deformation of the absorber as measured using the high-speed camera, was perfectly validated by the numerical predictions despite the above conventions. Furthermore, regarding graphs in
Figure 11 matching both maximum stress values and instant of time they appear in three (3) out of four (4) measured locations, i.e., missing one location, is justified by the simplifications of the numerical model as well as the unmodelled but measured environmental interactions. A difference in duration of the analysis (0.11 s) and the experimental data (0.35 s) is detected. The only reason is that the main interest is focused in the first impact of the elevator chassis on the shock absorber and not in the following bouncing that occurs until it stops moving, whereas measurements during the experiment were being recorded until the elevator chassis stopped bouncing. The presented results create confidence in relation to the detail and accuracy of the results of the FE model of the elevator chassis, as well as with the FEM fidelity of the updated absorber. Thus, the conclusion of this comparison is that for the size and complexity of the system examined, the differences are considered reasonable, and what is important is that the real structure and numerical model exhibit similar dynamic behavior, which is the goal of this work.
7. Analysis and Optimal Design of the New-Design Elevator Chassis
Finally, the detailed FE model of a new-design elevator chassis was developed using nominal steel material properties, where Young’s modulus is
, Poisson’s ratio
and density
with an elastic-full plastic behavior having a yield stress at
. Respectively, the updated parameters of the hyperelastic Mooney–Rivlin material model were assigned to the polyurethane elastomer shock absorber and an explicit nonlinear transient response analysis was carried out within DYNAMIS at a time step of
. The geometry of the chassis is discretized using mainly rectangular and triangular shell finite elements. Additionally, solid (hexahedral) elements, rigid body elements and some other special elements are used. The total number of degrees of freedom in the resulting FE models (for the chassis and the cabin) is about 1,600,000. Appropriate computational method [
31], was used in order to estimate the dynamic response of the system, where in the final dynamic analysis set-up, the chassis is fully loaded and is accelerated downwards by gravity (1 g) in order to simulate accurately the free fall experiment. FE Analysis solver DYNAMIS [
21,
24] directly uses gravity information in the equations of motion, partitioning and integrating them in accordance with the type of motion specified. The model was then solved numerically in explicit nonlinear transient response analysis in order to calculate displacements, accelerations and maximum stresses developed during the crash on the buffer system.
Based on the results of this analysis the elevator chassis was redesigned and optimized, in order to satisfy ultimate and service limit states, achieving the minimum design stresses and minimum displacements on its flexible parts at an incident of a free-fall crash scenario. As a final step, the new-design elevator chassis was designed and developed, to experimentally validate in real operating conditions the accuracy of the numerical results.
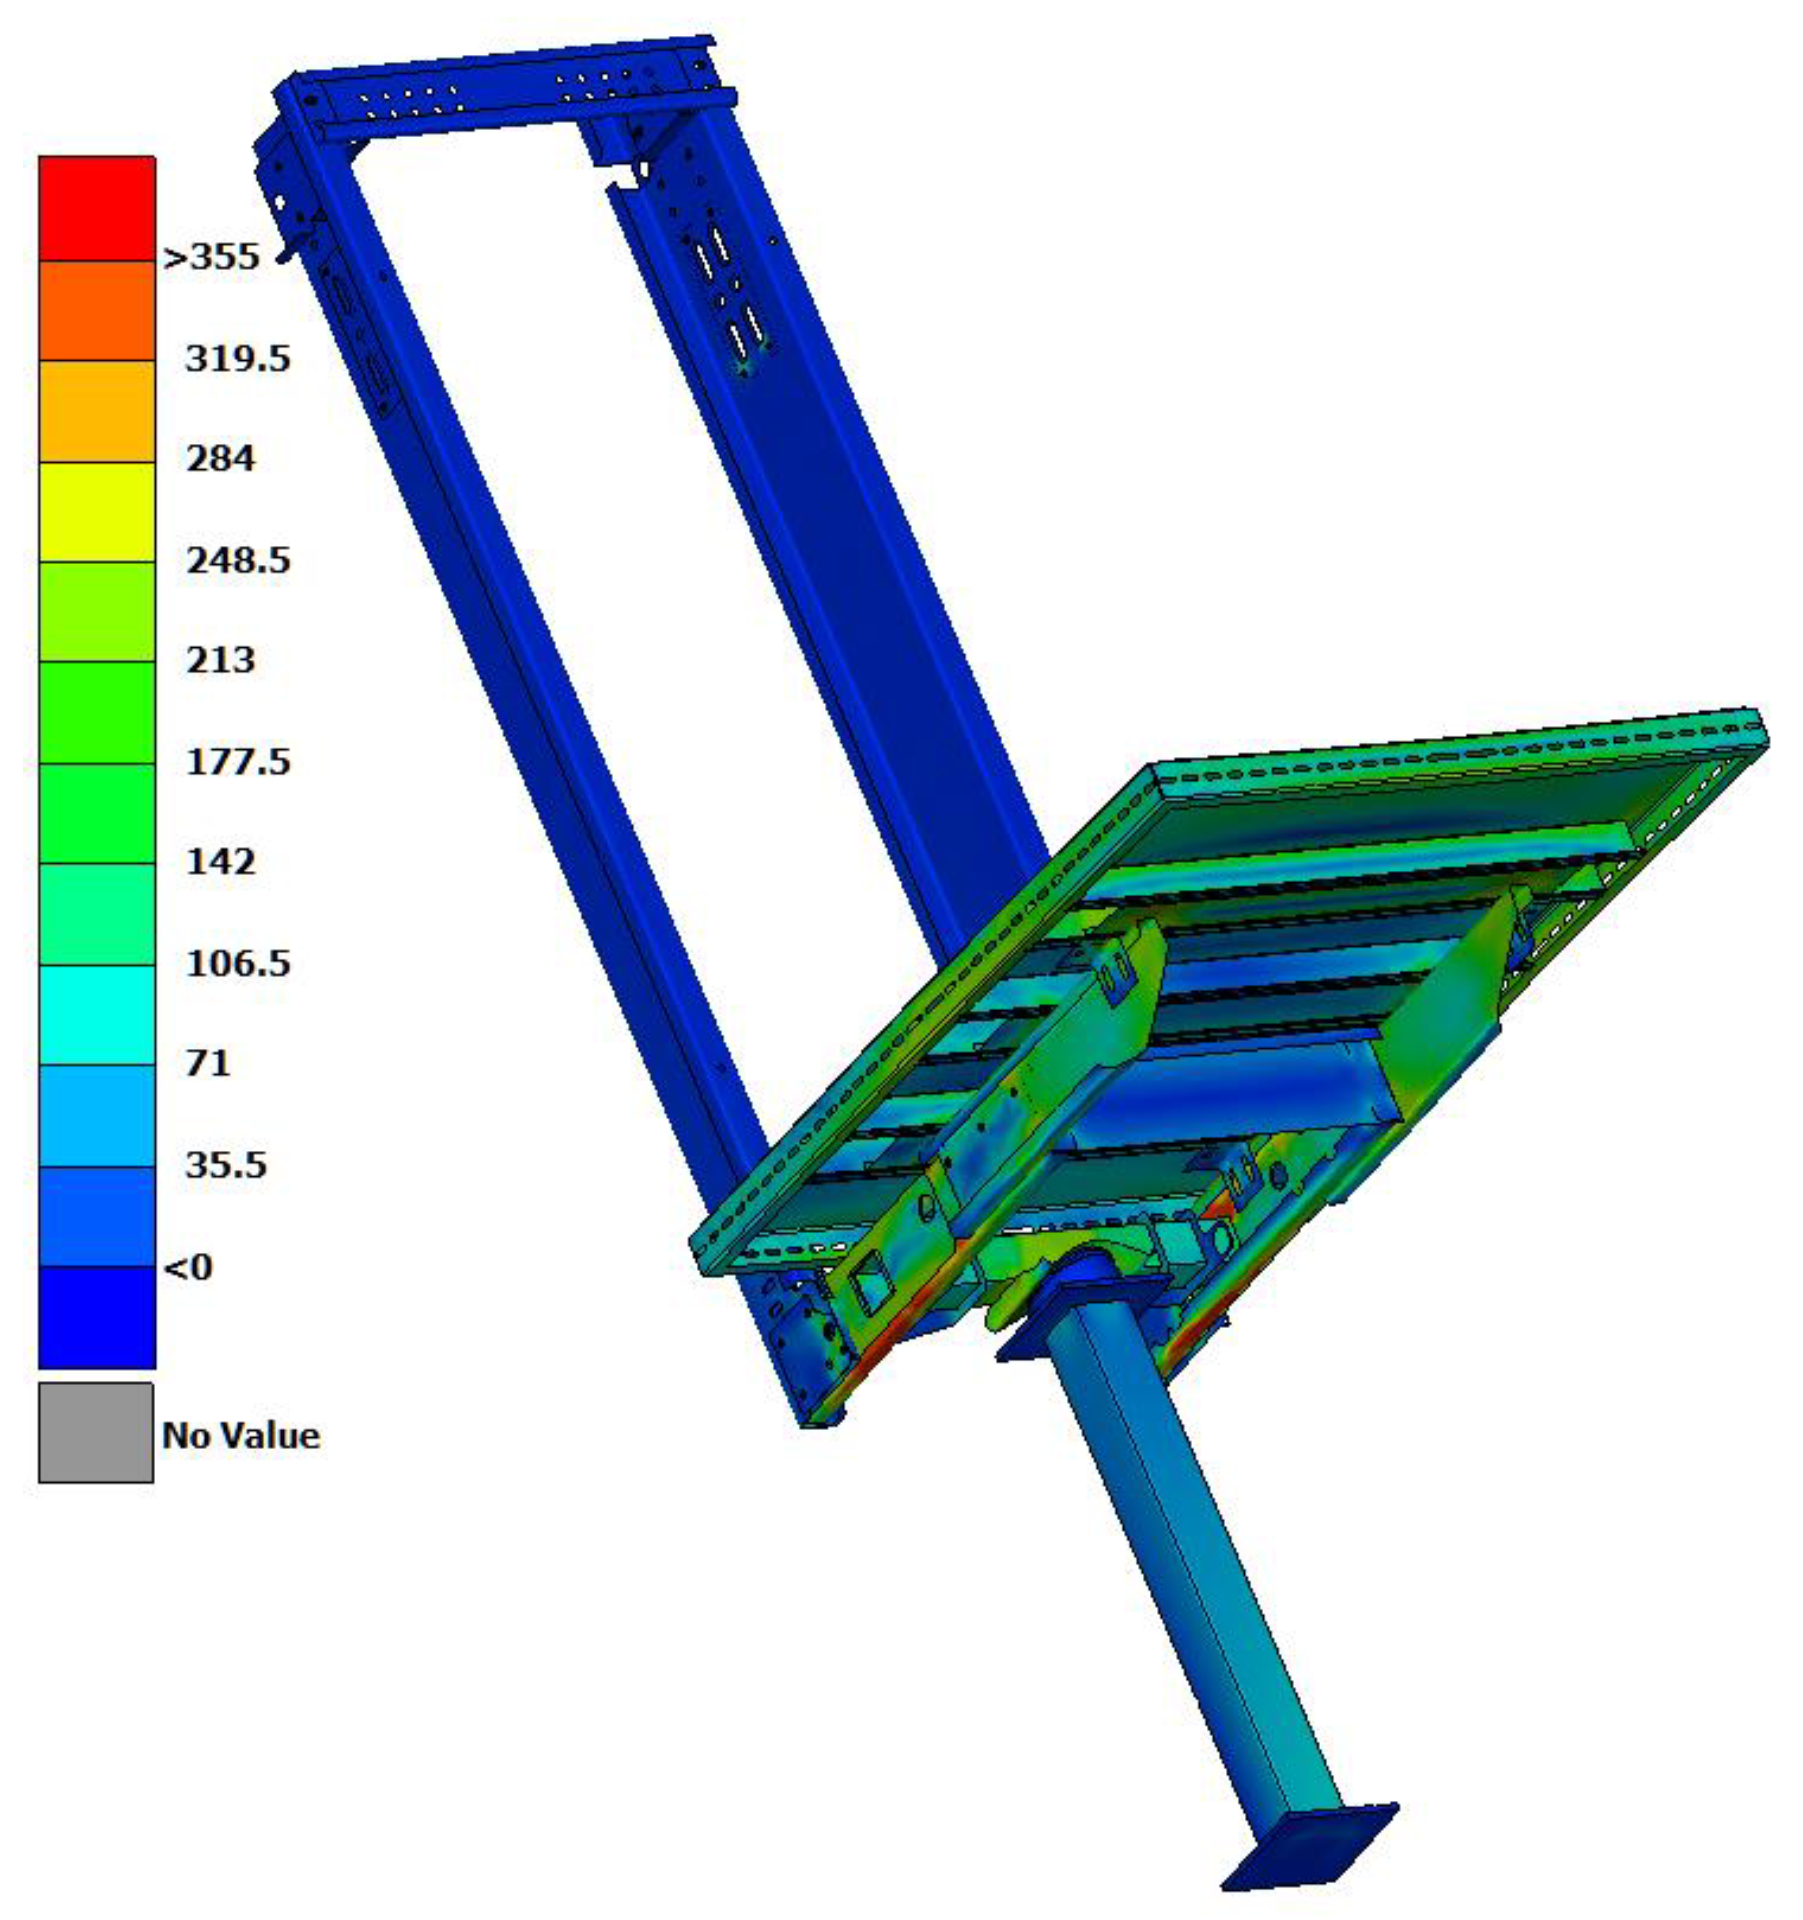
Figure 12 presents the FE model of the new-design elevator chassis as it was finally designed before construction.
Following that, two cases were examined with different thicknesses for the settlement plate, meaning the plate of the new chassis that comes first in contact with the shock absorber. The first case was a settlement plate of thickness and the second case was .
At first,
Figure 13 presents the whole new-design chassis colored by contours of the equivalent von-Mises stress distribution for the
settlement plate thickness. From these results, a plastic deformation of the settlement plate propagated deformation at the suspension beam of the new-design chassis and compromises serviceability with large deformation of the cantilever flexible parts, as presented in
Figure 14.
Figure 15 presents the new-design chassis colored by contours of the equivalent von-Mises stress distribution for the
settlement plate thickness. From these results an elastic deformation of the settlement plate is predicted and no touching on the suspension beam of the new-design chassis is detected, as presented in
Figure 15. Finally, serviceability limit state is satisfied as the deformation of the cantilever flexible parts were decreased, as presented also in
Figure 16.
8. Conclusions
An optimal design procedure of an elevator chassis crashing on a hyperelastic shock absorber in a fail scenario is presented in this work. At first, specimens of the real rubber-like absorber were tested under uniaxial compression deformations, in a loading machine, extracting experimental stress–strain curves. A discrete Finite Element (FE) model of the examined absorber was developed and a Mooney–Rivlin material model was assigned. Applying a fully parallelizable state-of-the-art stochastic model updating methodology, coupled with robust, accurate and efficient Finite Element Analysis (FEA) software, the hyperelastic behavior of the shock absorber was validated under uniaxial quasi-static loading conditions, in order to tune the material parameters and develop a high-fidelity FE model of the buffer system. Next, triaxial accelerometers and strain gauges were placed at selected critical points of a test-case elevator chassis and a series of experimental measurements was carried out under a real crash scenario, in order to experimentally validate the stress levels developed. Using the updated hyperelastic material properties, defining the nonlinear hyperelastic behavior of the buffer, an explicit nonlinear analysis of the test-case elevator system crashing on the buffer absorber was carried out. Based on the results of this analysis a new-design elevator chassis was redesigned and optimized in order to achieve minimum design stresses and deformations. A direct comparison of the numerical and experimental data validated the reliability and accuracy of the methodology applied.


