Article

Highly Accurate and Fully Automated Bone Mineral Density Prediction from Spine Radiographs Using Artificial Intelligence

by
Prin Twinprai
1,
Nattaphon Twinprai
2,
Aditap Khongjun
3,
Daris Theerakulpisut
4,
Dueanchonnee Sribenjalak
5,
Ong-art Phruetthiphat
6,
Puripong Suthisopapan
3 and
Chatlert Pongchaiyakul
5,*
1
Musculoskeletal Unit, Department of Radiology, Srinagarind Hospital, Khon Kaen University, Khon Kaen 40002, Thailand
2
Trauma Unit, Department of Orthopedics, Srinagarind Hospital, Khon Kaen University, Khon Kaen 40002, Thailand
3
INDIE-CT Laboratory, Department of Electrical Engineering, Faculty of Engineering, Khon Kaen University, Khon Kaen 40002, Thailand
4
Division of Nuclear Medicine, Department of Radiology, Faculty of Medicine, Khon Kaen University, Khon Kaen 40002, Thailand
5
Division of Endocrinology and Metabolism, Department of Medicine, Faculty of Medicine, Khon Kaen University, Khon Kaen 40002, Thailand
6
Department of Orthopaedics, Phramongkutklao Hospital, Bangkok 10400, Thailand
*
Author to whom correspondence should be addressed.
Submission received: 11 December 2025 / Revised: 15 February 2026 / Accepted: 16 February 2026 / Published: 23 February 2026
(This article belongs to the Special Issue AI-Driven Innovations in Medical Computer Engineering and Healthcare)

Abstract

Background: Bone Mineral Density (BMD) plays a crucial role in diagnosing osteoporosis, and early detection is essential to preventing complications such as osteoporotic fractures. However, access to dual-energy X-ray absorptiometry (DXA) screening remains limited in many healthcare settings. Objective: This study presents a fully automated artificial intelligence pipeline for BMD prediction from lumbar spine radiographs to enable opportunistic osteoporosis screening. Methods: The proposed system integrates automatic vertebral segmentation and a machine learning-based regression model for BMD prediction. A YOLO-based instance segmentation model was trained to automatically segment four lumbar vertebrae, achieving a high Intersection over Union (IoU) of 0.9. Radiomic features were extracted from the segmented vertebrae to capture advanced image characteristics and combined with clinical features from 2875 female patients. An eXtreme Gradient Boosting (XGBoost) regressor was trained to provide opportunistic BMD estimation. Results: The model achieved a mean absolute percentage error (MAPE) of 6% for BMD prediction. A classification model built from segmented vertebrae distinguished between osteoporosis, osteopenia, and normal bone with approximately 90% accuracy. Strong agreement between predicted and ground-truth BMD values was confirmed using Pearson correlation coefficient and Bland–Altman analysis. Conclusions: The proposed fully automated system demonstrates strong agreement with DXA measurements and potential for opportunistic osteoporosis screening in settings with limited DXA access. Further validation and refinement are needed to achieve clinical-grade precision for diagnostic applications.

1. Introduction

Osteoporosis is characterized by decreased bone mineral density (BMD), deterioration of bone microarchitecture, and increased skeletal fragility, leading to elevated fracture risk [1]. Pathologically, the condition results from an imbalance between osteoblastic bone formation and osteoclastic bone resorption, with net bone loss occurring when resorption exceeds formation. This imbalance is accelerated in postmenopausal women due to estrogen deficiency, but also affects aging men and individuals with secondary causes including glucocorticoid use, chronic kidney disease, and endocrine disorders [2].
Globally, osteoporosis poses a substantial public health burden. According to the International Osteoporosis Foundation (IOF), osteoporosis affects an estimated 200 million women worldwide, with one in three women over age 50 experiencing osteoporotic fractures [3]. The condition is responsible for over 8.9 million fractures annually, resulting in significant morbidity, mortality (20–24% excess mortality in hip fracture patients within one year), and healthcare costs exceeding USD 17 billion annually in the United States alone [4,5]. The World Health Organization (WHO) recognizes osteoporosis as a major global health priority, with prevalence projected to increase dramatically as populations age, particularly in Asia, Africa, and Latin America [6]. Therefore, early identification and preventive strategies are critical to mitigating the risk of osteoporosis-related fractures and reducing the associated socio-economic and healthcare burdens [7].
The current gold standard for diagnosing osteoporosis is BMD testing using axial dual-energy X-ray absorptiometry (DXA). This approach of measuring BMD in combination with the FRAX score helps in the identification of individuals at high risk of fractures [8]. However, despite its usefulness, BMD testing is frequently overlooked, particularly in rural areas due to limited equipment availability, high operational costs, and scarcity of specialized personnel [9]. Radiographs, however, are widely available in most clinical settings. Therefore, the development of radiograph-based techniques to compensate for the lack of DXA is particularly interesting.
AI is rapidly being explored in the field of osteoporosis to improve diagnostic accuracy and prognostic capability. Evidence from the systematic review and meta-analysis underscores the robust performance of AI classification model in osteoporosis screening, i.e., distinguishing osteoporosis or osteopenia from normal bone. The sensitivity ranged between 0.72 (95% CI: 0.67–0.76) and 0.90 (95% CI: 0.80–0.96), while specificity values ranged between 0.74 (95% CI: 0.60–0.77) and 0.95 (95% CI: 0.94–0.96), respectively (pooled analysis of 6 studies, n = 75,049). The approach demonstrates substantial clinical potential for large-scale diagnostic implementation [10]. Unlike classification models that provide only discrete diagnostic categories, precise BMD prediction is particularly important, as it aligns more closely with clinical diagnostics and mimics the real-world use of DXA. In recent years, a number of studies have explored the use of AI and machine learning techniques for achieving accurate BMD estimation, as summarized in Table 1. The findings of these studies highlight several critical points. First, the model demonstrated satisfactory performance in predicting BMD values. Second, since predicted BMD can be directly converted into T-scores, the model inherently supports patient classification. Third, it is noteworthy that only a single study utilized CT scans for BMD prediction and its performance is quite superior to models based on X-rays. Finally, despite its importance for model generalizability, only a single study has conducted external validation so far.
This study addresses the following specific research question: Can vertebra-level bone mineral density be accurately estimated from anteroposterior (AP) lumbar radiographs using a hybrid model that integrates patient clinical characteristics, vertebral morphometric features, and radiomics texture features, and does this multi-domain integration provide superior predictive performance compared to single-domain approaches? Furthermore, we investigate whether this approach generalizes across different clinical settings through external validation. Our study introduces several novel contributions to the development of AI-based BMD prediction models:
  • An automated vertebral segmentation method based on the deep learning YOLO framework, capable of delivering high-performance L1–L4 vertebral segmentation, is developed.
  • A classification model capable of distinguishing between osteoporosis, osteopenia, and normal bone density is presented. The classification output is then converted into numerical features for integration into the subsequent BMD prediction model.
  • A hybrid feature formulation for BMD prediction, combining features derived from a classification model, radiomic analysis, and clinical data.
  • The incorporation of multiple vertebral levels in the analysis enables highly accurate vertebra-specific BMD prediction system.
  • The external validation using an independent dataset from another tertiary clinical hospitals.
Based on the aforementioned contributions, we introduce a highly accurate and fully automated BMD prediction system from AP spine radiographs using artificial intelligence. The proposed system offers several practical advantages and paves the way for scalable, cost-effective, and reliable BMD screening tools, particularly in settings with limited access to DXA technology.

2. Materials and Methods

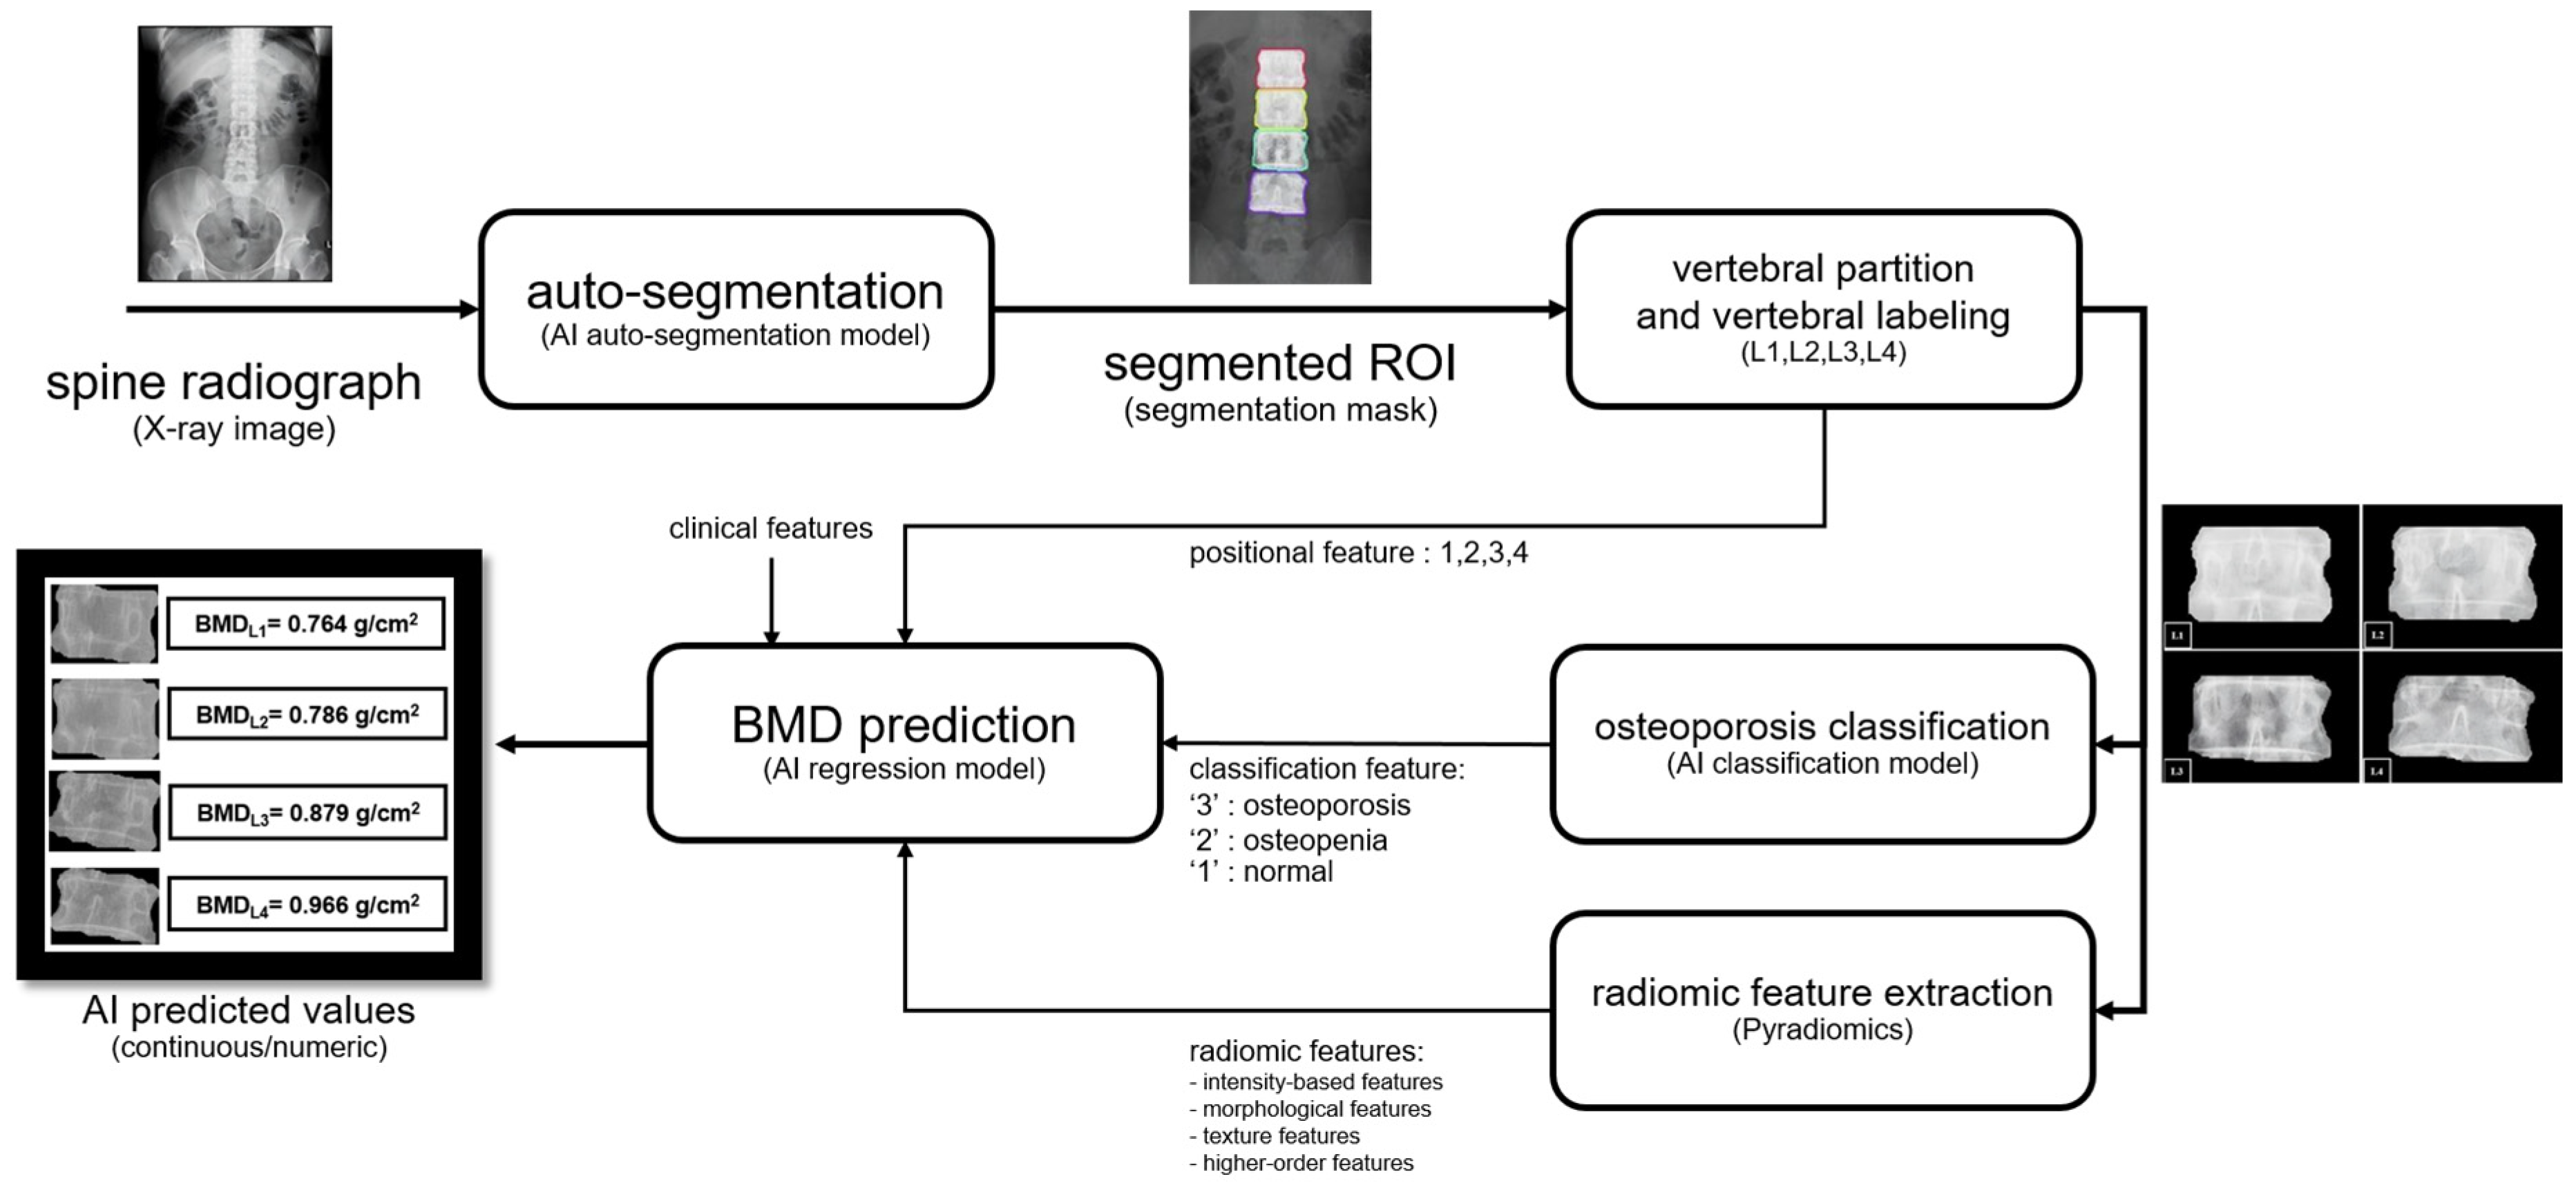
Figure 1 illustrates the overall workflow of the proposed AI-based BMD prediction system, which is organized into five sequential stages. In Stage 1, anteroposterior lumbar spine radiographs are acquired as the primary input data. Stage 2 employs a YOLOv11-based instance segmentation model to automatically detect and delineate the boundaries of the L1–L4 vertebrae. Stage 3 encodes the positions of vertebrae into numeric features. Stage 4 applies a YOLOv11 classification model to label and categorize each segmented vertebral image. Stage 4 involves the extraction of high-dimensional radiomics features from the segmented regions of interest to capture structural patterns. Finally, Stage 5 integrates these features to construct a robust BMD prediction model for automated bone density assessment. All experiments in this work were implemented using the PyTorch framework (version 2.9.1) and executed on a workstation equipped with a 13th Gen Intel® Core™ i7-13700 processor (2.10 GHz), an NVIDIA GeForce RTX 4060 GPU with 8 GB GDDR6 memory, and 32 GB of RAM. The subsequent sections present detailed descriptions of each component.

2.1. Data Preparation

2.1.1. Study Population and Data Collection

Between 2003 and 2023, a retrospective review was conducted using the medical record database of Srinagarind Hospital in Khon Kaen, Thailand. The review focused on bone mineral density (BMD) tests of consecutive community-dwelling individuals aged 40 years and older. The database initially contained 41,349 BMD studies from individuals over the age of 40, with 33,426 of these being conducted on females. For this study, cases were selected based on the availability of complete data, including BMD measurements and a corresponding plain lumbar spine radiograph taken within 6 months of DXA scan. To ensure the reliability of the results, cases with moderate to severe lumbar vertebral fractures, which were identified using Genant visual semi-quantitative assessment [19], were excluded. Additionally, patients with suspected spinal tumors or infections were also excluded. These criteria were applied to focus the analysis only on non-pathological vertebral conditions. After applying all inclusion and exclusion criteria, a total of 2875 patients were included in the final analysis. Table 2 presents the demographic characteristics of all the patients included in the development of the AI-based BMD prediction system.

2.1.2. Study Measurements

Spine radiographs for the internal dataset were acquired primarily using the Samsung GC85A radiography system (Samsung, Republic of Korea). Additional radiography systems, including Siemens Healthineers AF (Forchheim, Germany), were used in some cases. For the external dataset, imaging was performed using Carestream radiography systems (New York, NY, USA). Key radiographic acquisition parameters, including peak tube voltage (kVp), tube current-time product (mAs), and detector type, were standardized according to institutional protocols for lumbar spine imaging. These essential technical specifications are summarized in Table 3. Individual BMD values were obtained for each lumbar vertebra, specifically L1, L2, L3, and L4.

2.1.3. Image Acquisition and Pre-Processing

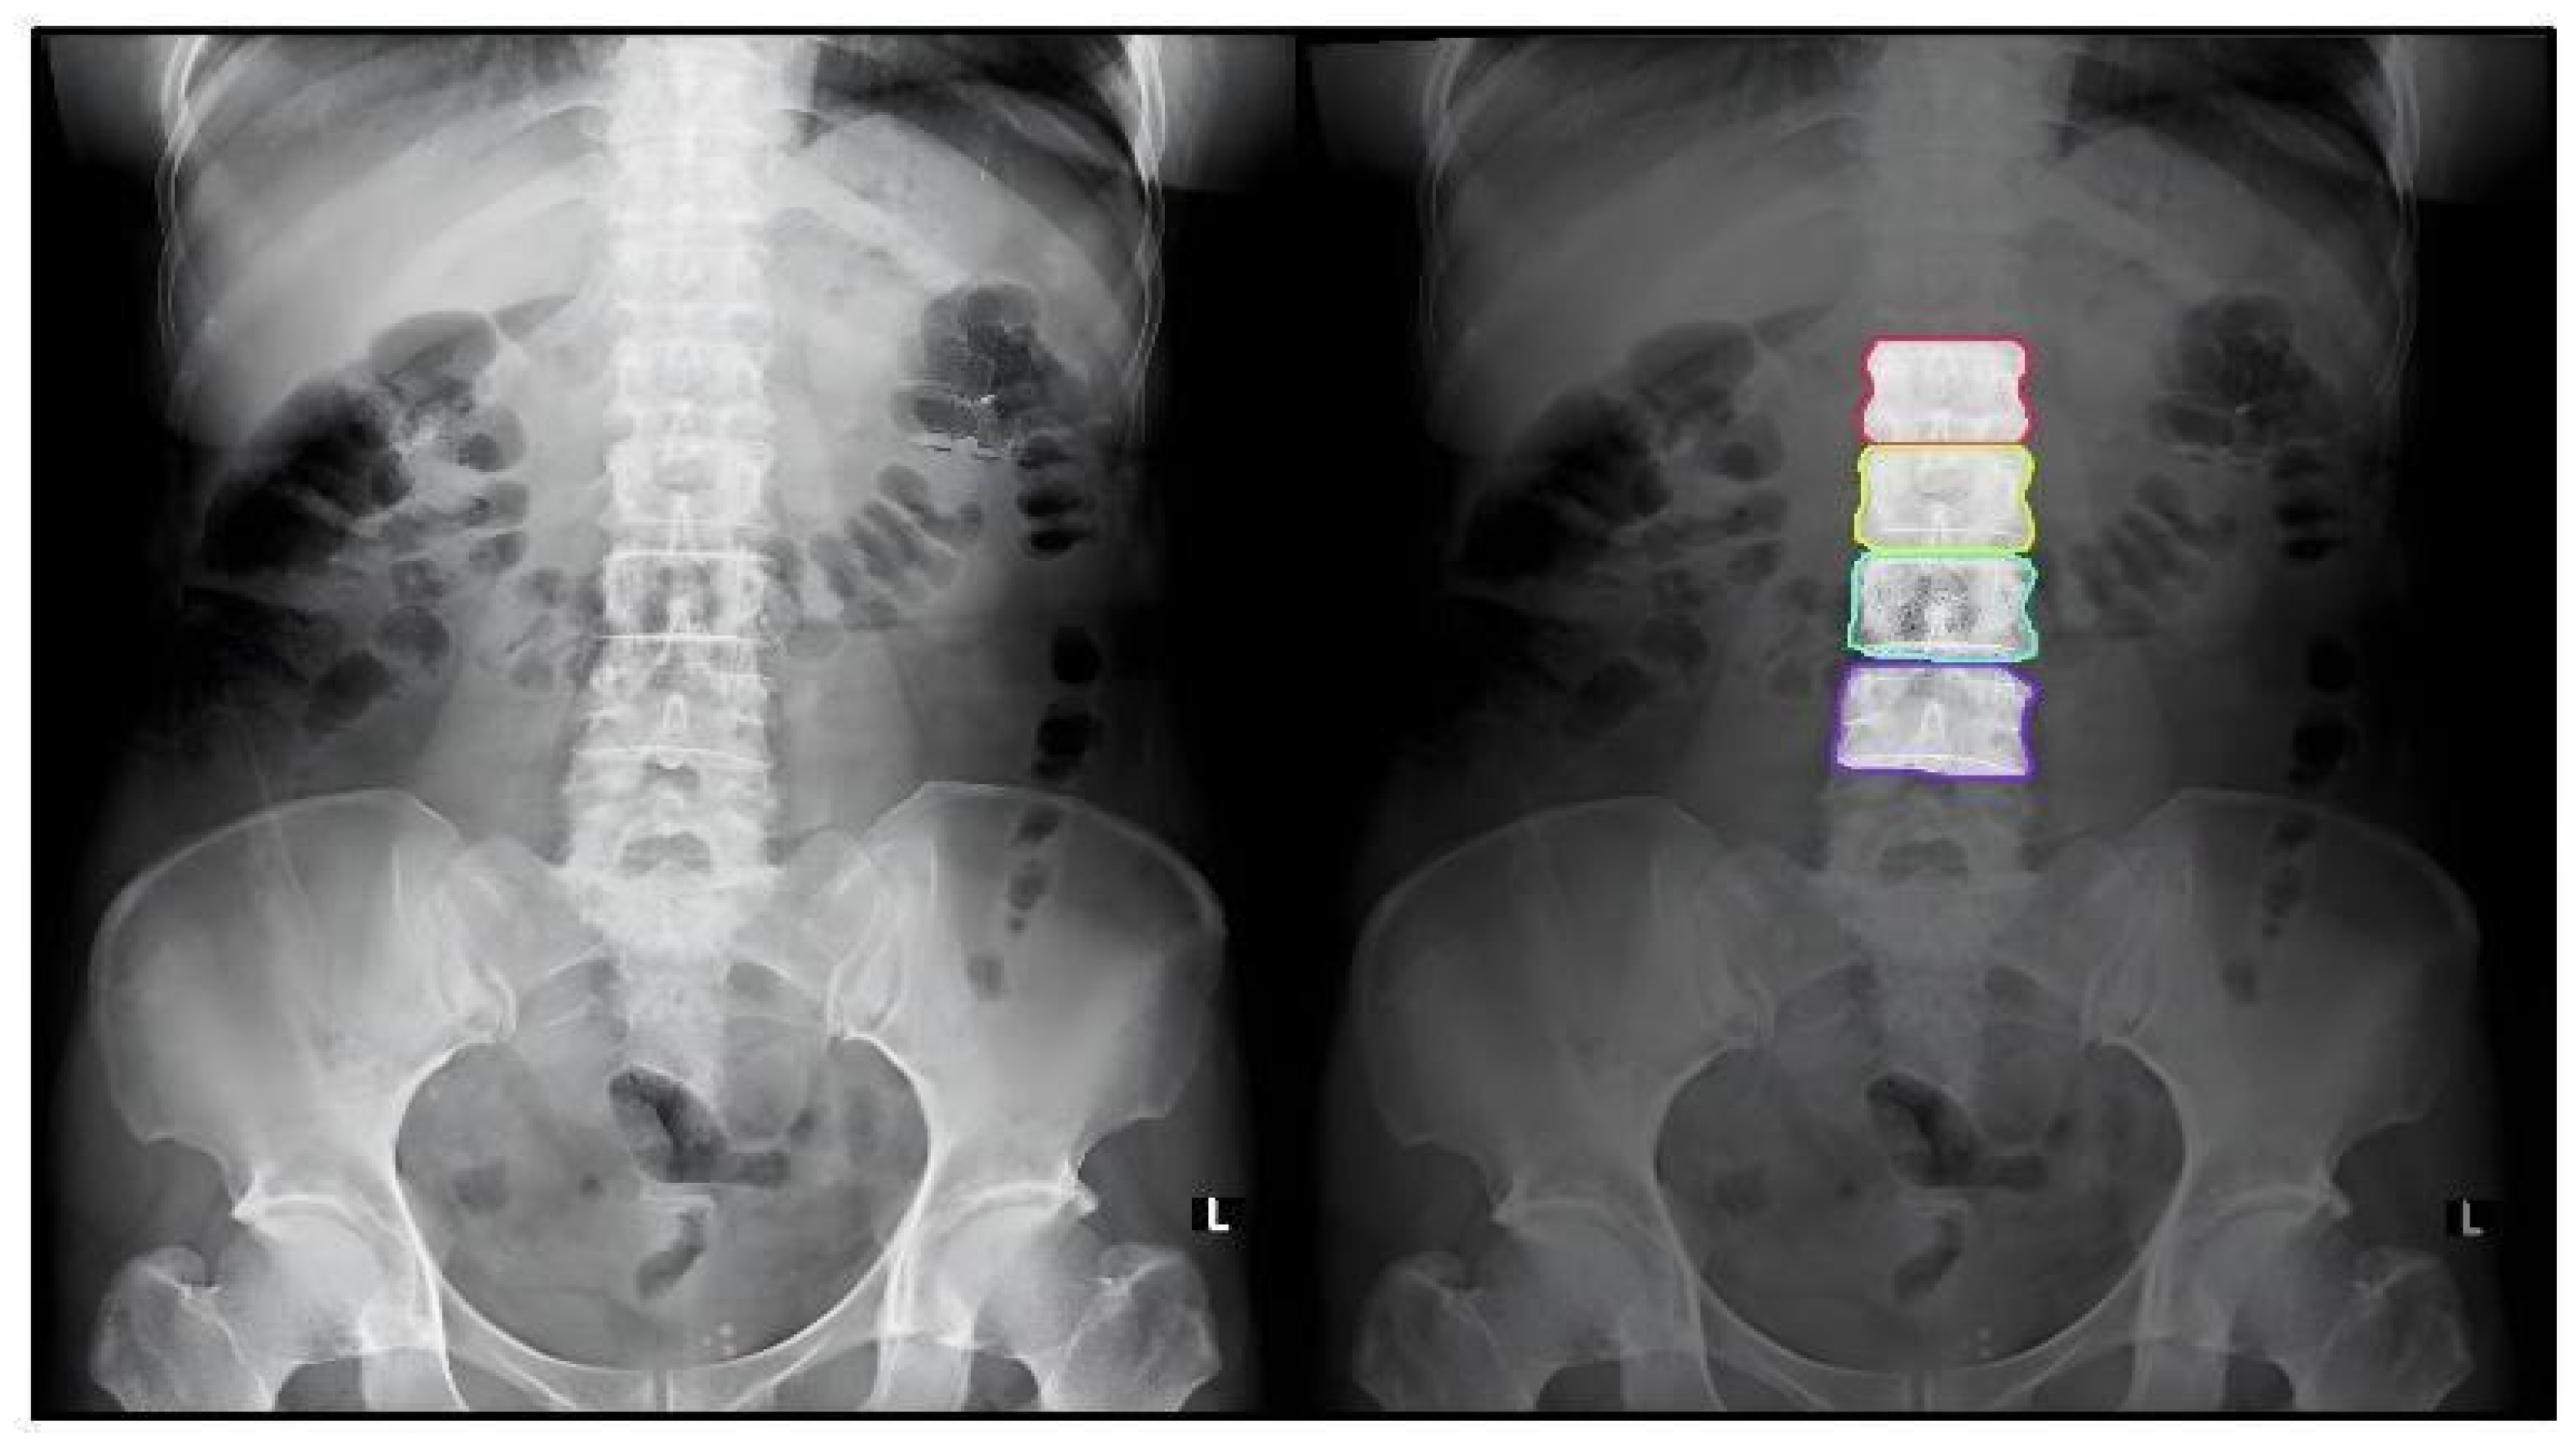
Spine radiographs in the anteroposterior (AP) view were obtained from the Picture Archiving and Communication System (PACS) using its built-in retrieval and anonymization functions. This ensured that all patient information was properly de-identified before analysis, ensuring compliance with privacy requirements. All spine radiographs were converted from DICOM to JPEG format at a resolution of 2048 pixels or greater. This conversion process ensured that the photos were high-quality and acceptable for examination. An example of AP view lumbar spine image used in this study is shown on the left side of Figure 2.
The use of AP radiographs for BMD estimation is supported by several geometric and anatomical considerations. First, standard DXA scanning of the lumbar spine is performed in the posteroanterior (PA) projection, which shares the same imaging plane as AP radiographs, merely reversed [20,21]. Second, vertebral trabecular bone, the primary determinant of BMD measured by DXA, is optimally visualized in the AP/PA projection compared to lateral views [22]. Third, prior validation studies have demonstrated moderate-to-strong correlations (r = 0.65–0.82) between radiographic features extracted from AP lumbar radiographs and DXA-measured BMD [23,24].

2.2. AI Models

The AI-based framework in this study consists of 3 related models. Each serves a distinct role in the vertebra-level BMD prediction pipeline. First, an automated lumbar vertebrae segmentation model (segmentation model) is developed to extract individual lumbar vertebrae (L1, L2, L3, or L4) from AP-view lumbar spine radiographs. Second, an osteoporosis classification model (classification model) is trained to categorize each vertebra into clinically relevant diagnostic groups, i.e., normal, osteopenia, or osteoporosis. Finally, a regression-based BMD prediction model (prediction model) is constructed to estimate the bone mineral density of each vertebra using a combination of numerical features. Together, these models form an integrated AI system capable of producing vertebra-specific BMD predictions from radiographic images. The following subsections detail, step by step, the development and integration of these components into a unified AI system.

2.2.1. Manual Annotation of Lumbar Vertebrae

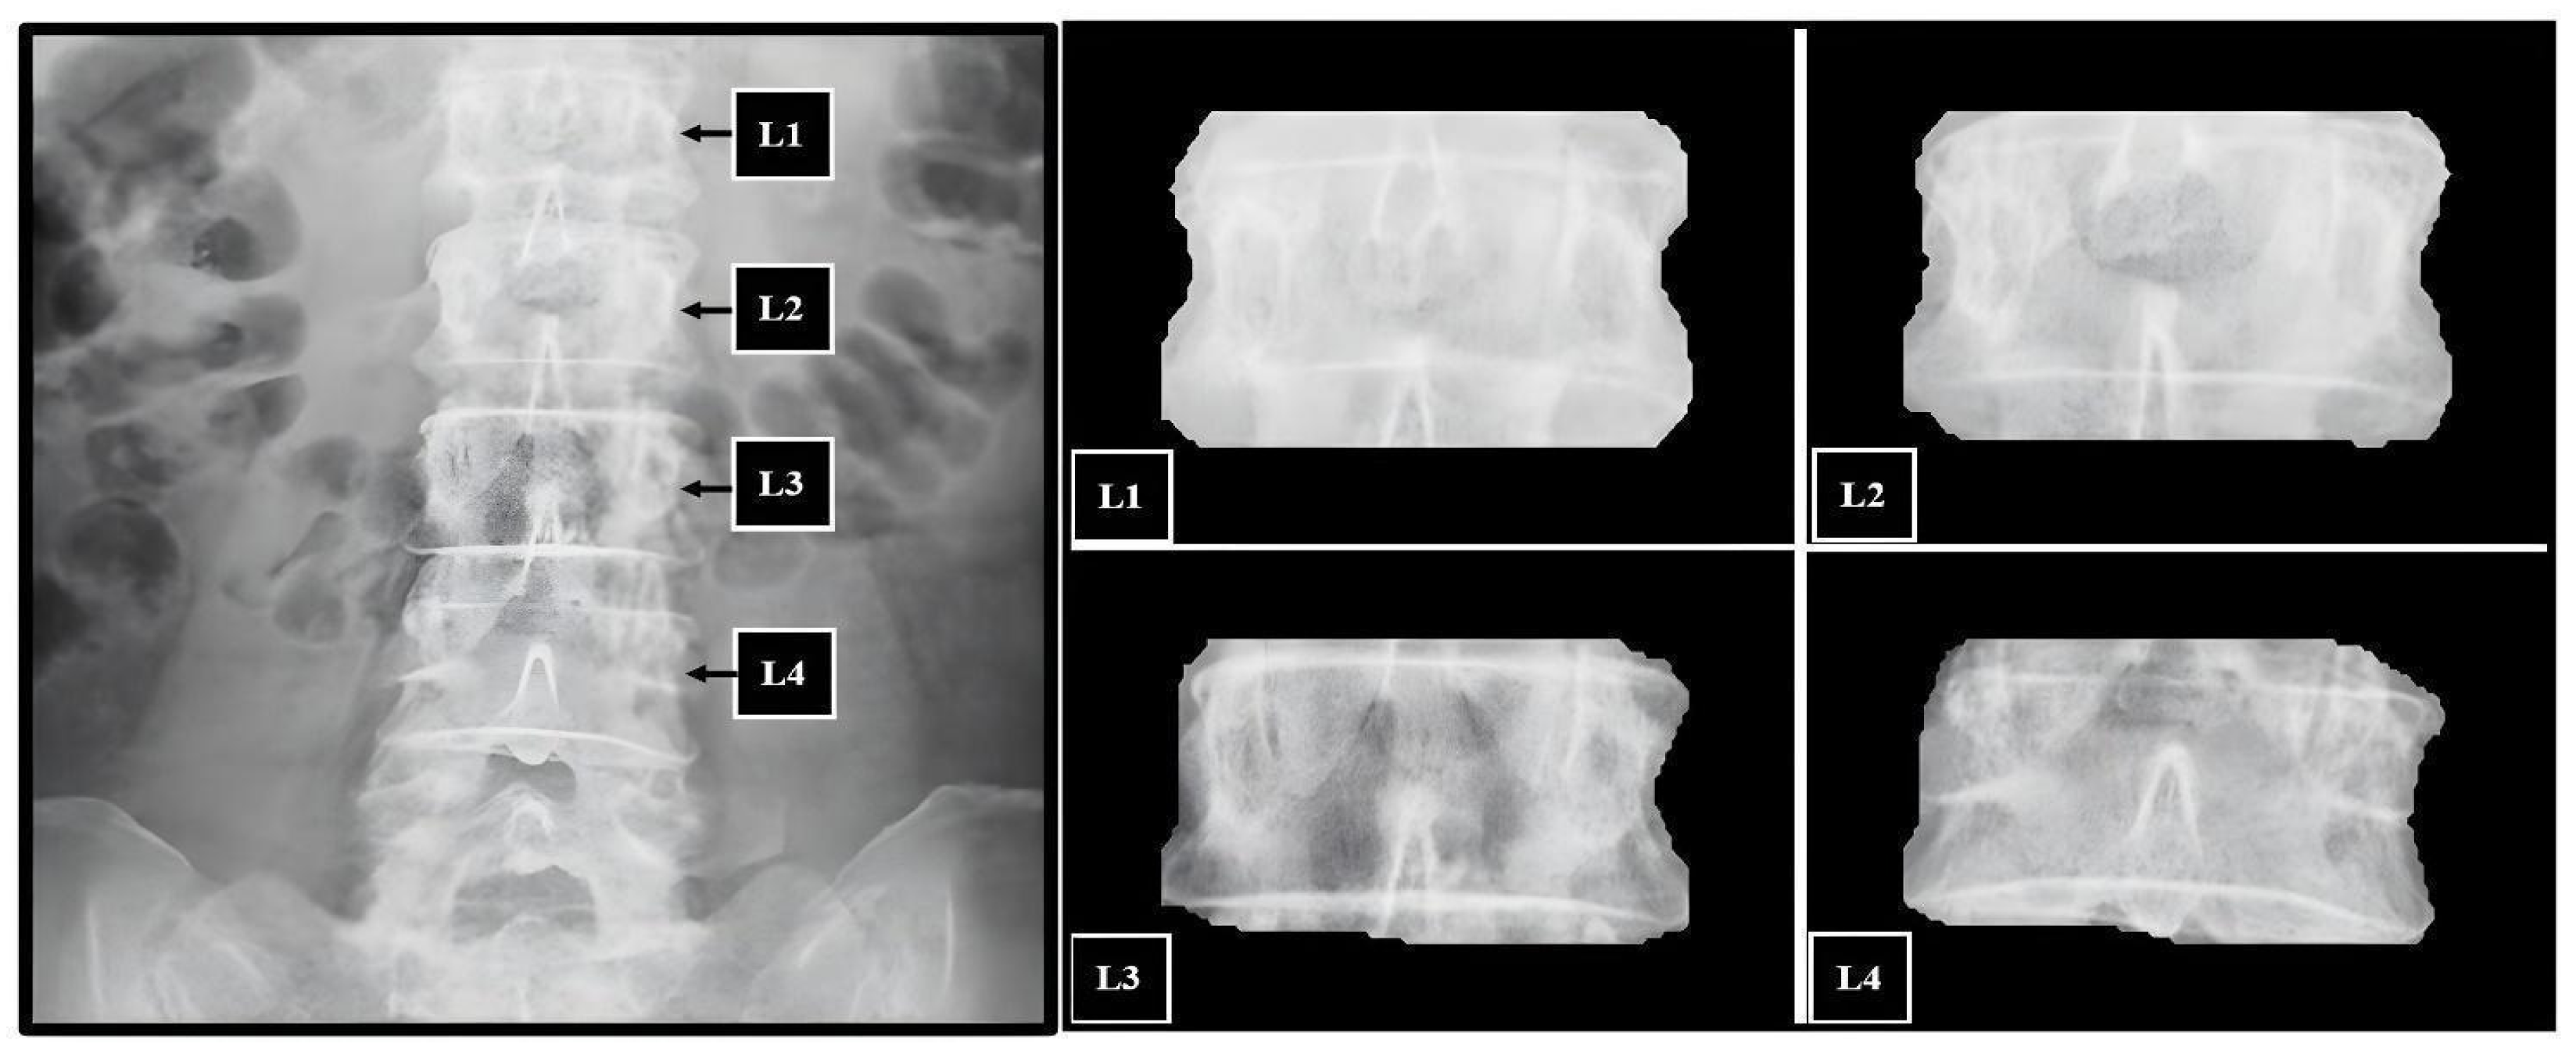
After obtaining the radiograph images, and given our aim to predict BMD at the vertebral level, we planned to develop a segmentation model to extract the four lumbar vertebrae from the AP view lumbar spine radiograph. To achieve this in the context of supervised machine learning, a radiologist (P.T.) manually segmented each vertebra to create the training dataset required for developing such a model. All manual annotations were performed by one board-certified musculoskeletal radiologist with 10 years of experience. To minimize intra-observer variability, each vertebra was segmented using at least 40 points, including a minimum of 10 points on each side of the vertebral body, and labeled as L1, L2, L3, or L4. These manually segmented images serve as ground truth for training the model to automatically identify and segment the four lumbar vertebrae. The segmentation process was conducted on the Roboflow platform, where the polygon tool was selected to precisely delineate vertebral boundaries. An example of segmented AP view lumbar spine image is shown on the right side of Figure 2. For each segmented vertebra, a cropped polygonal mask was generated to retain only the pixels within the segmented area, ensuring the cropped image matched the mask dimensions and eliminating unnecessary empty space. Each lumbar vertebra was saved individually (Figure 3), with its positional index (1, 2, 3, or 4) recorded as a positional feature for subsequent prediction model training. Finally, a training dataset consisting of 1441 cases was assembled for developing the segmentation model.
To assess annotation reliability, a post hoc inter- and intra-observer variability study was conducted. A subset of 100 randomly selected radiographs (totaling 500 vertebrae) was independently annotated by the original radiologist (Radiologist P.T., 10 years of experience) and a second radiologist (12 years of experience). Results showed substantial consistency, with Dice coefficients of 0.94 ± 0.03 (inter-observer) and 0.96 ± 0.02 (intra-observer), alongside a mean boundary displacement of 2.1 ± 0.8 mm. While these metrics confirm reliable annotation, we recognize the use of a single observer for the main dataset as a notable limitation.

2.2.2. Automated Lumbar Vertebrae Segmentation Model

To create the automatic segmentation of lumbar spine radiographs, the dataset was partitioned into training, validation, and test subsets in an 80:10:10 ratio, resulting in 1157, 142, and 142 images, respectively. Extensive augmentation was applied to increase model robustness to variations in patient positioning, exposure settings, and imaging equipment. Augmentation included: horizontal flipping (×2), brightness adjustment in 7 levels (±10–30%), contrast adjustment in 7 levels (±10–30%), and rotations at 7 angles (±3–15°). These augmentations were performed cumulatively, resulting in an expanded dataset totaling 793,702 images. The YOLO framework (version 11) was selected to develop the segmentation model. The medium pre-trained variant (‘yolo11m-seg’) was used as the initialization model. The model was trained under an exhaustive hyperparameter configuration search, including variations in learning rate and batch size, to optimize performance. Once the mask segmentation training loss reached a low and stable value, indicating convergence, this configuration was adopted as the final model for the automated segmentation task. Finally, the segmentation model was trained using the YOLO architecture for 300 epochs with an initial learning rate of 0.001 and a batch size of 16. We utilized the AdamW optimizer to manage weight decay and ensure stable convergence. Input images were resized to 640 × 640 pixels to maintain spatial resolution. To prevent overfitting, an early stopping mechanism was implemented with a patience of 50 epochs, terminating training if the validation loss failed to improve.
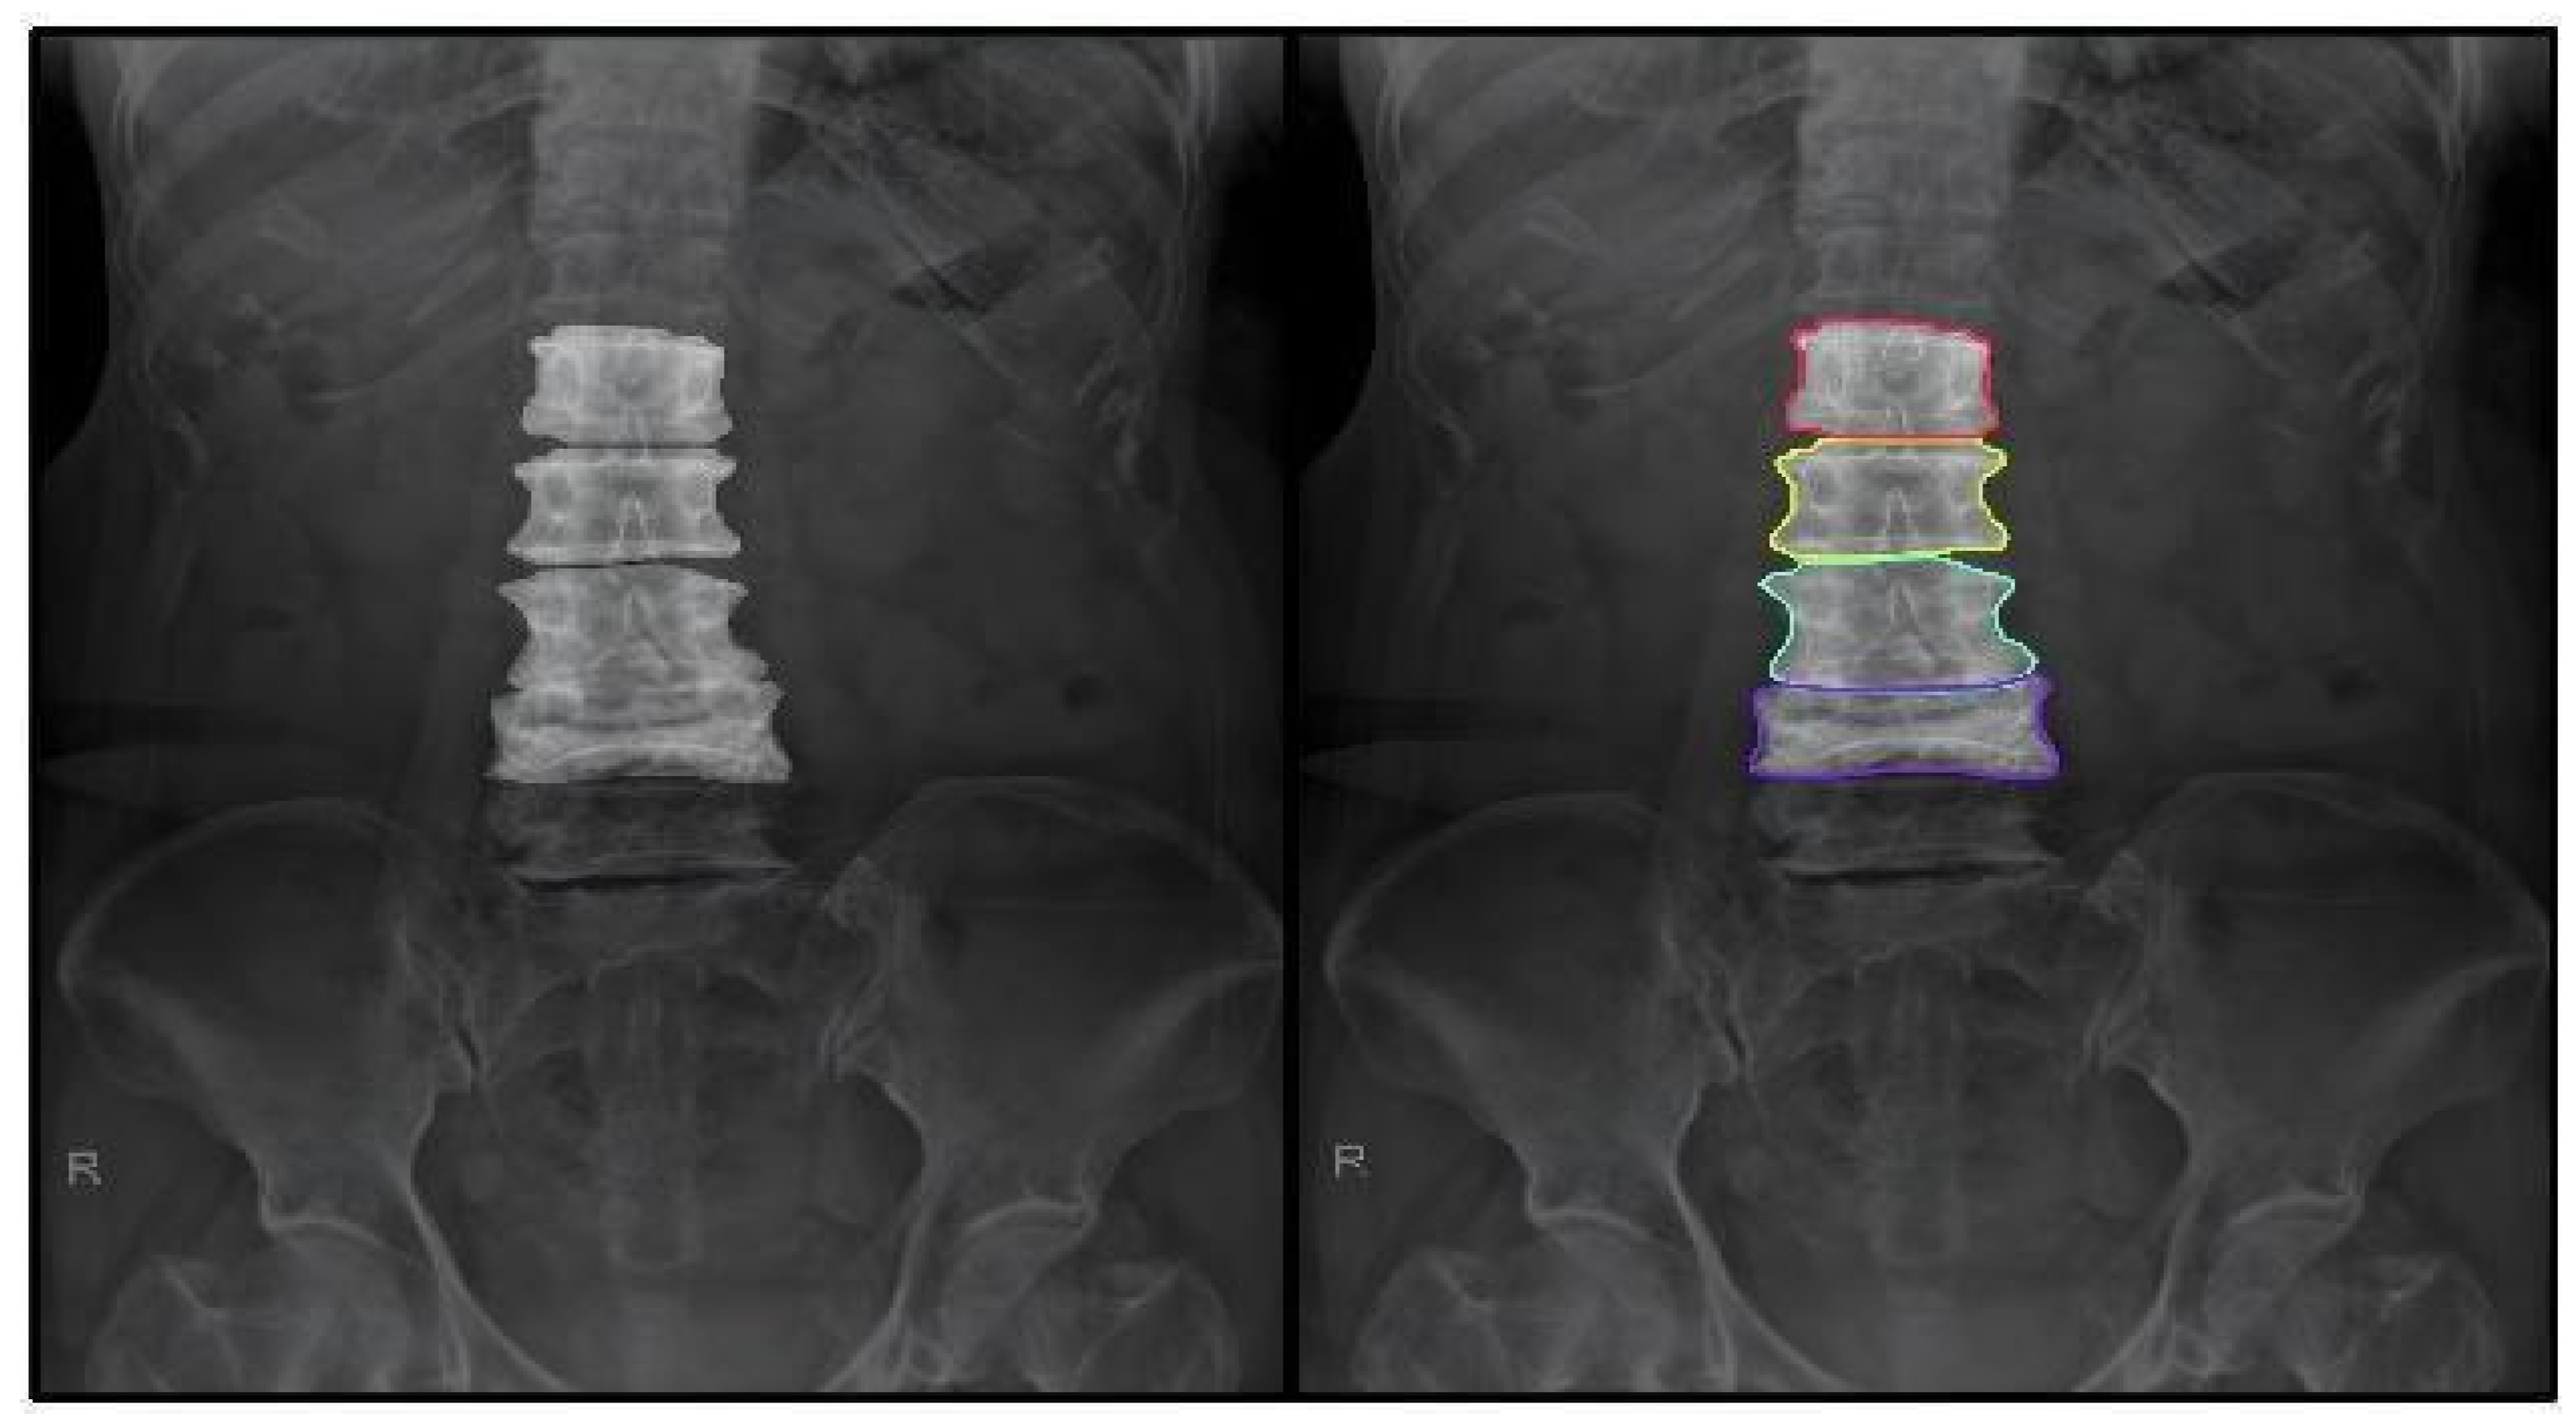
The proposed well trained segmentation model was applied to lumbar spine radiographs from 2875 patients, producing four segmented vertebrae (L1–L4) per radiograph. This process yielded a total of 11,500 vertebral segments (2875 × 4). Since vertebrae with fractures may introduce noise into BMD prediction, these must be identified and excluded. Fracture severity was determined by visually inspecting the extent of vertebral height decrease and morphologic alteration. Moderately deformed vertebrae were those with a height loss of 26–40%, whereas severely deformed vertebrae (grade 3) had a height reduction of more than 40%. All grade 3 vertebrae were excluded from the analysis. After this exclusion, 10,612 non-fractured vertebrae constituted the final image dataset for developing the prediction model. Figure 4 illustrates an example of a grade 3 L4 vertebra excluded from the study.

2.2.3. Osteoporosis Classification Model

Following vertebral segmentation, an image dataset of 10,612 non-fractured vertebral images was utilized to create a classification model. This dataset was partitioned into training, validation, and test sets using the same 80:10:10 ratio applied in the segmentation stage, yielding 8490, 1061, and 1061 images, respectively. The classification model was trained to classify each vertebra into one of three diagnostic categories based on T-score criteria (as stated in Table 1): osteoporosis, osteopenia, or normal. To ensure consistency within the image analysis pipeline, the vertebral classification was performed using the YOLOv11 framework. Training was initialized with a pretrained model variant, i.e., yolo11n-cls, to leverage existing learned features, facilitating faster convergence and improved performance. The classification model was trained for 200 epochs using a batch size of 32 and an input resolution of 224 × 224 pixels. Optimization was performed using Stochastic Gradient Descent (SGD) with a momentum of 0.9 and a conservative initial learning rate of 0.0001. The final classification model output was encoded into numerical class labels for subsequent processing, with osteoporosis mapped to 3, osteopenia mapped to 2, and normal mapped to 1. These encoded outputs, hereafter referred to as classification features, are incorporated as input variables in the subsequent BMD regression training stage.

2.2.4. Feature Engineering

After completing the development of the segmentation and classification models, the next step is to construct the prediction model, which can be formulated as a regression task. Prior to this model construction, it is necessary to prepare a set of numerical features to serve as input variables. In this study, four distinct categories of features were utilized: (1) clinical features, representing basic patient information, (2) classification features, derived from the classification model outputs, (3) positional features, indicating the anatomical location of each vertebra and (4) radiomics features, quantifying texture and intensity-based characteristics extracted from the segmented vertebrae. Together, these four feature categories formed the complete dataset for training the prediction model.
Clinical features in this study represent key anthropometric characteristics of the patients. The parameters included body weight (kg), height (cm), body mass index (BMI, kg/m2), and age (years). Only female patients were included to eliminate sex-related variability in BMD, given established differences in bone metabolism, peak bone mass, and age-related bone loss patterns between males and females. This approach ensured a more homogeneous study population for initial model development. The clinical parameters were obtained from DXA scans performed on the same patients from whom the lumbar spine radiographs were collected for the segmentation model.
Classification features were derived from the output of the classification model, in which each diagnostic category was mapped to a numeric value: normal = 1, osteopenia = 2, and osteoporosis = 3. These numeric labels served as categorical indicators of vertebral bone health status. Positional features were obtained as an additional output of the automated segmentation process, representing the anatomical position of each vertebra within the lumbar spine (L1 = 1, L2 = 2, L3 = 3, L4 = 4). This positional information was incorporated to account for vertebra-specific variations in BMD.
Radiomic features, such as first-order statistical descriptors and gray-level run-length matrix metrics, are quantitative measures capable of capturing image information not readily visible to the human eye [25]. A comprehensive set of radiomic features was extracted from each segmented lumbar spine image using the PyRadiomics library in Py thon (version 3.12.0). Specifically, radiomic feature extraction was performed using PyRadiomics v3.0.1 with the following configuration: (1) Image preprocessing: intensity normalization to μ = 0, σ = 1; resampling to 1 × 1 mm2 spacing using B-spline interpolation; (2) Feature classes: First-order statistics (19 features), GLCM (24 features), GLRLM (16 features), GLSZM (16 features), GLDM (14 features), NGTDM (5 features); (3) Wavelet decomposition: Applied to 8 wavelet sub-bands (LLL, LLH, LHL, LHH, HLL, HLH, HHL, HHH), multiplying feature count by 9; (4) Total features: 94 original + 94 × 8 wavelet = 788 features per vertebra. This radiomic feature extraction was carried out separately for each lumbar vertebral level obtained from the automated segmentation step. This process converts medical images into high-dimensional feature vectors, potentially revealing latent patterns associated with bone health and BMD levels. The PyRadiomics extraction was performed with basic preprocessing enabled, including image normalization, to ensure intensity standardization across cases. Alongside radiomic descriptors, basic image characteristics such as contrast, luminance, and sharpness were computed for each vertebra. Additionally, the wavelet decomposition option was activated, allowing multi-scale texture analysis. Specifically, 788 radiomic features were generated for each vertebra, providing a rich set of real-valued variables to be integrated with the clinical, classification, and positional features in the subsequent modeling stage.
To evaluate the impact of image compression on feature integrity [26], we conducted an information preservation analysis on 200 randomly selected samples. By comparing radiomics features extracted from original 16-bit DICOM and 8-bit JPEG formats, we found that the conversion did not significantly alter the clinical features relevant to our model. As shown in Table 4, the high ICC values (overall mean = 0.95) confirm that the systematic information loss was minimal.

2.2.5. Dataset Formation for Regression-Based BMD Prediction Model

The complete feature set for BMD regression modeling comprised a total of 794 variables: four clinical features (weight, height, BMI, and age), one positional feature derived from the vertebral index, one classification feature obtained by mapping the categorical outputs of the classification model, and 788 radiomic features extracted from each segmented vertebra. This feature set forms the dataset for training the prediction model. Notably, the utilization of radiomics, positional and classification features, developed in this study, have not been previously reported in the literature. We hypothesize that incorporating these novel features will enhance the predictive accuracy and robustness of the prediction model.
Prior to model construction, feature selection was performed to achieve dimensionality reduction, optimize performance and reduce overfitting. To ensure a robust and comprehensive radiomics feature set, we employed a multi-criteria feature selection strategy using four feature selection statistical frameworks including correlation, mutual information, LASSO and PCA. Each method was governed by specific rigorous thresholds designed to capture different underlying data structures.
Correlation: A threshold of |r| > 0.6 with statistical significance (p < 0.001) was enforced to prioritize strong linear relationships.
Mutual Information: An Information gain threshold was applied to identify critical non-linear dependencies that simple correlation might overlook.
LASSO: Features were filtered based on non-zero coefficients at the optimal λ identified through cross-validation, inherently performing automated feature contraction.
PCA: We utilized an eigenvalue > 1 criterion and ensured a cumulative explained variance > 80%, selecting features with the highest component loadings.
Instead of relying on top radiomics features from each technique, we implemented a rank-based consensus thresholding strategy. We selected the top 2 features from each of the four diverse methods. Therefore, from the initial 788 radiomic features, we selected the top 2 features from each of four selection methods, yielding 8 radiomic features. This ensures that the final radiomics feature set captures a broad spectrum of data characteristics, including linear relationships, non-linear dependencies, and maximum variance, while minimizing the risk of multi-collinearity. Combined with 4 clinical, 1 positional, and 1 classification feature, the final model used 14 input features. Finally, for building prediction model, the dataset was partitioned into training, validation, and test sets in a 70:15:15 ratio. This ratio was chosen to ensure that the majority of the data was available for model training, while still reserving sufficient samples for validation to fine-tune hyperparameters and for testing to provide an unbiased evaluation.

2.2.6. Regression-Based BMD Prediction Model

In this study, we employed XGBoost [27] as the core predictive engine for vertebra-level BMD estimation. The choice of XGBoost is justified by several key technical advantages. First, XGBoost is exceptionally effective at capturing non-linear relationships while maintaining a high degree of computational efficiency. Second, its built-in regularization parameters provide superior control over model complexity, which is important for mitigating overfitting, a common challenge when working with high-dimensional feature sets. Although alternative machine learning or deep learning methods [11,12,13,14,15,16,17,18] could be applied to this task, we prioritized optimizing XGBoost due to its proven adaptability to similar data structures and our expectation that, with appropriate tuning, it would deliver state-of-the-art performance for this specific problem.
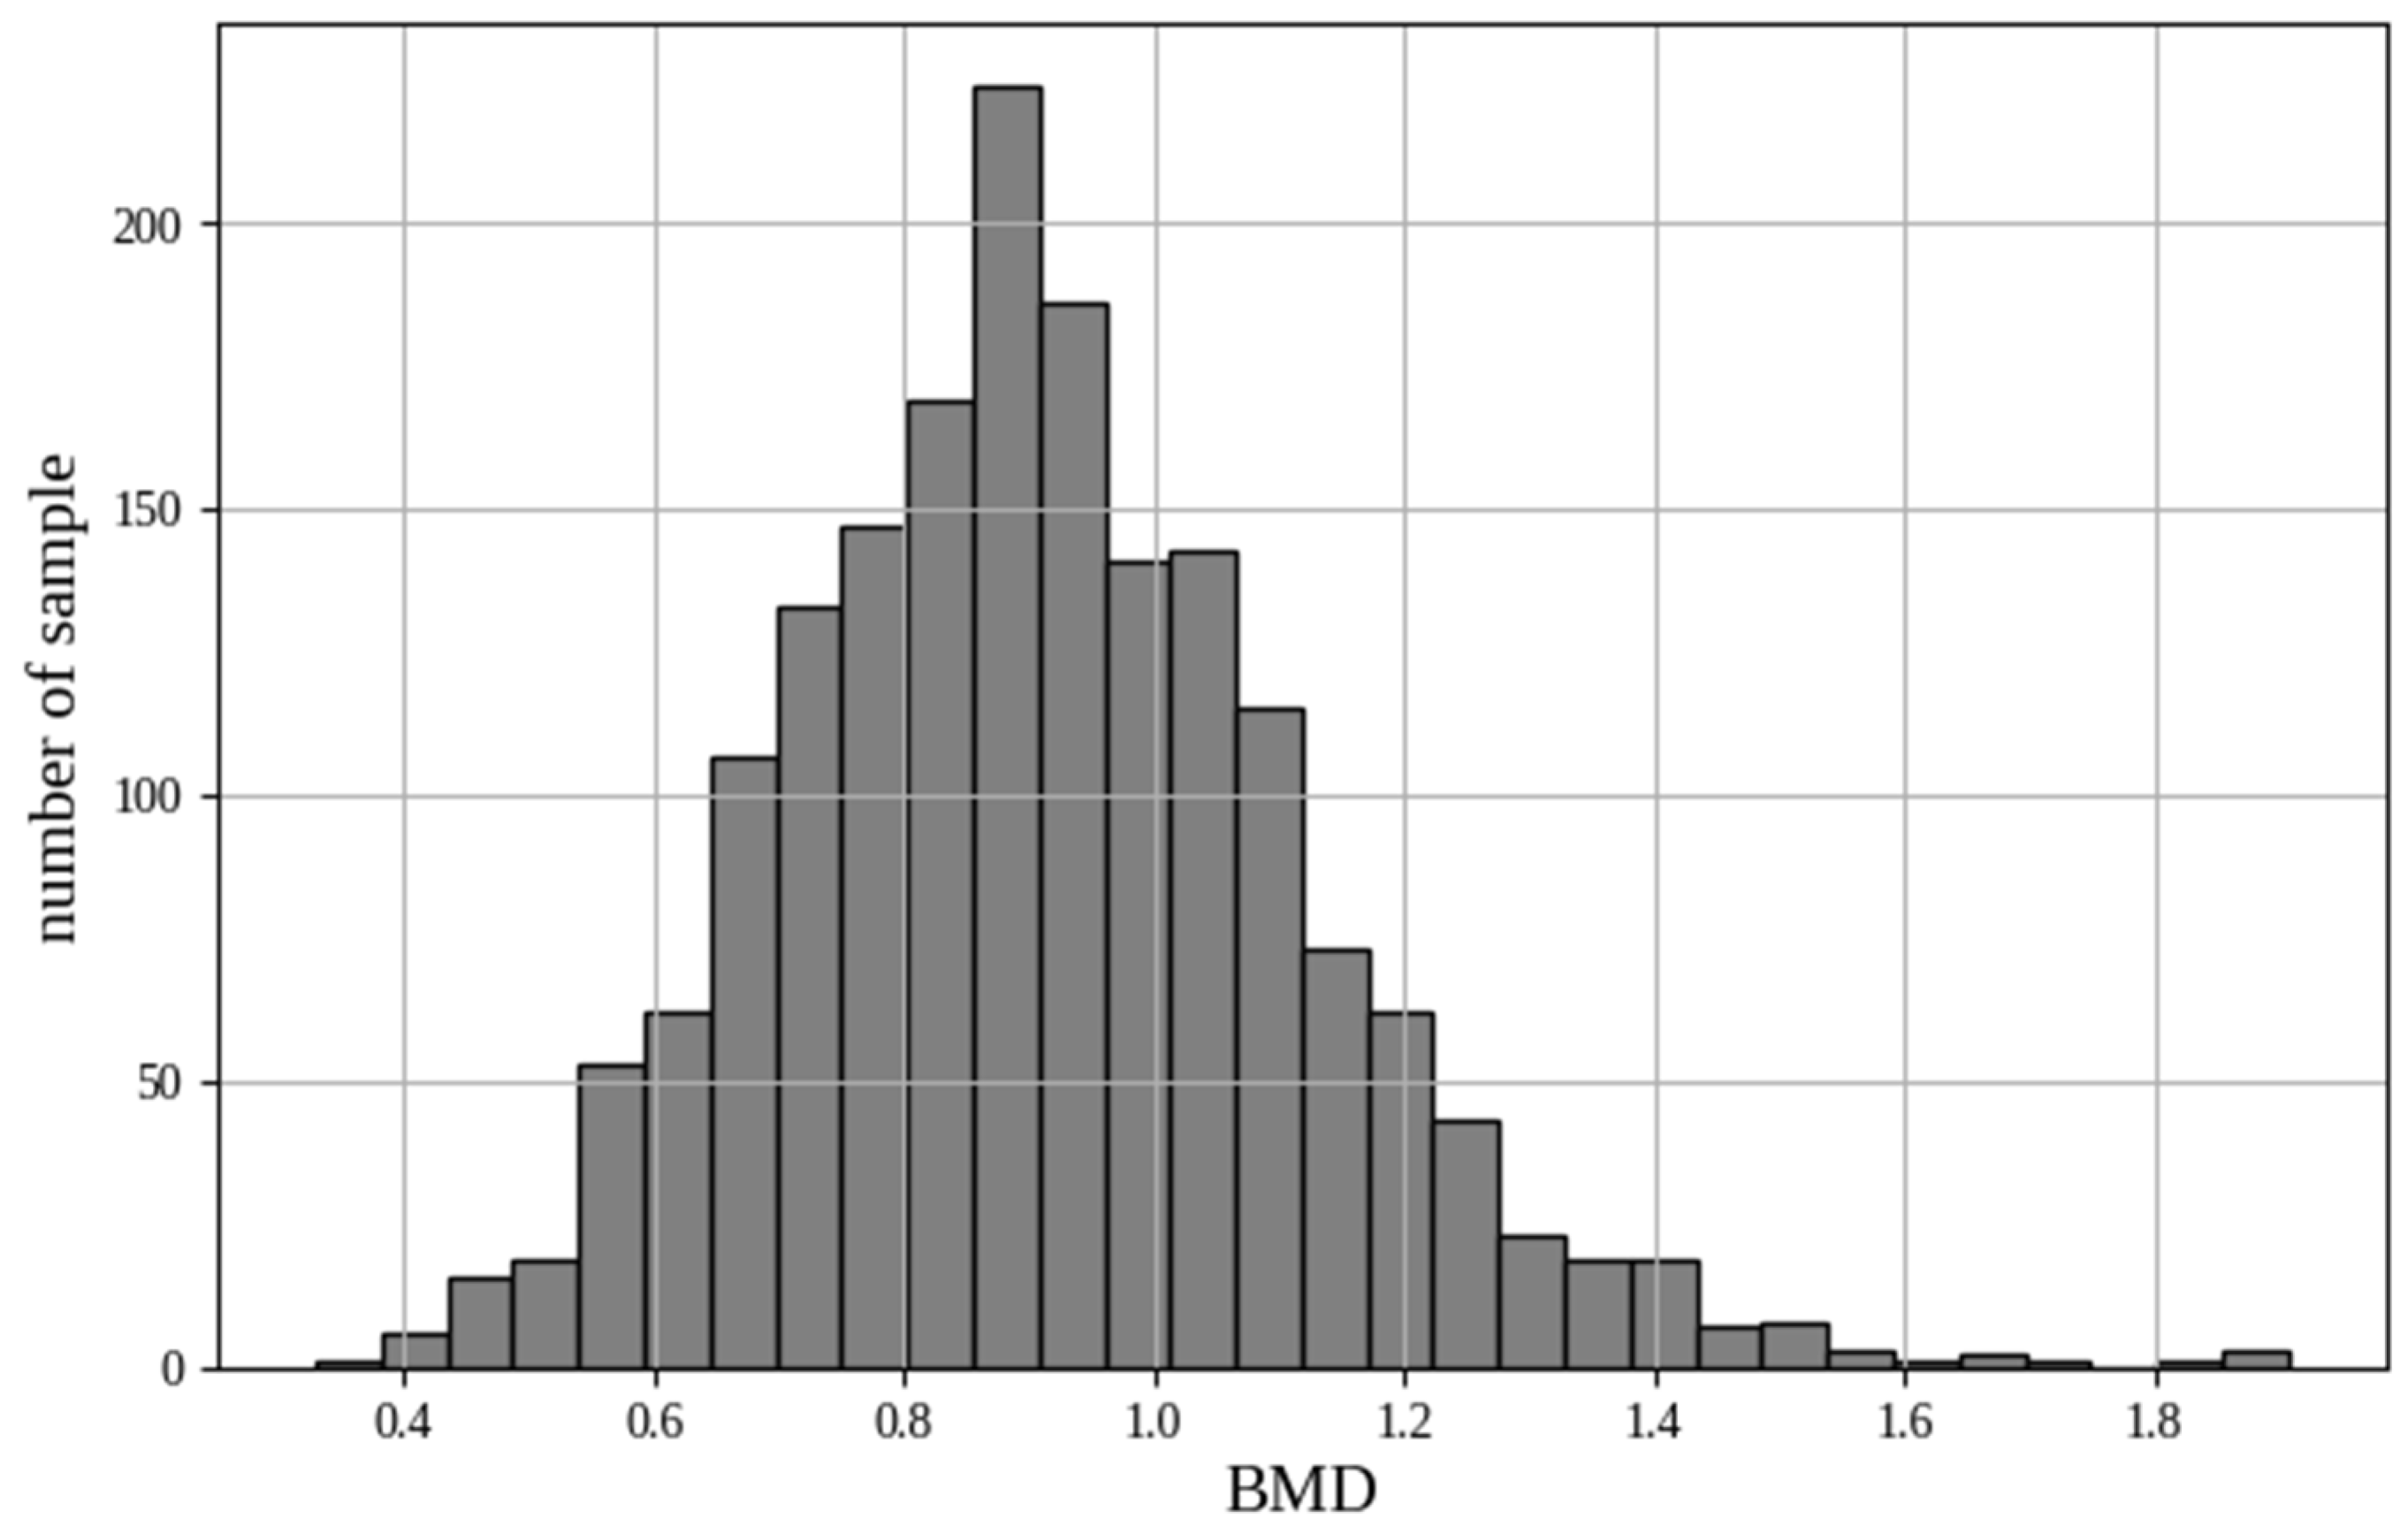
Figure 5 presents a histogram of the BMD values used in this study, with a bin size of 0.1. It is evident that the BMD distribution is uneven. As a result, the Huber loss function was selected for training XGBoost model since this function can better handle this BMD imbalance and reduce the influence of outliers.
In order to train predictive model via XGBoost algorithm, the following libraries were used: XGBoost (v1.7.6), scikit-learn (v1.3.0), numpy (v1.24.3), pandas (v1.5.3) and Optuna for hyperparameter optimization. Since XGBoost is tree-based, explicit feature standardization was not required. To maximize predictive performance, hyperparameter tuning was performed using Optuna, an automated hyperparameter optimization framework [28]. The search space included key XGBoost parameters such as learning_rate, max_depth, n_estimators, subsample, colsample_bytree, gamma, reg_alpha, and reg_lambda. For each Optuna trial, the model was trained on the training partition and validated on the validation partition. The optimization objective was to minimize the validation error (i.e., percentage absolute error or root mean square error). To avoid information leakage, all hyperparameter selection and early-stopping decisions were based exclusively on the validation set. The test set remained untouched until final evaluation. The best performing hyperparameter configuration on the validation set was selected and is reported in Table 5. Following hyperparameter optimization, the final XGBoost model was retrained to produce the prediction model, representing the final stage of our proposed AI-based BMD prediction system.

2.3. Performance Evaluation

Model performance was assessed separately for each stage of the proposed AI-based BMD prediction system. For segmentation model, performance was evaluated using the Dice Similarity Coefficient (DSC) and Intersection over Union (IoU), which are widely used to assess the spatial overlap between predicted and ground truth segmentation masks [20]. The test set, detailed in segmentation model, are used as ground truth. Regarding classification model, standard classification metrics, including accuracy, precision, recall, and F1-score, were calculated to evaluate the ability of model to distinguish between osteoporosis, osteopenia, and normal vertebrae. Continuous prediction performance for prediction model was quantified using the Pearson correlation coefficient (r), root mean square error (RMSE), and mean absolute percentage error (MAPE). To further characterize the prediction model agreement with reference BMD values, correlation analyses were conducted. Bland–Altman analysis was also performed to assess systematic bias and limits of agreement between predicted and ground truth BMD measurements. Furthermore, an ablation study to verify the impact of four feature categories was also conducted.
For internal validation, internal evaluation was performed using the independent test subset (15% of the total dataset), comprising approximately 1592 vertebrae (10,612 × 0.15). For external validation, independent datasets were obtained from Phramongkutklao Hospital, comprising 70 patient radiographs. Absolute prevention of information leakage between the training and test sets was ensured for both categorical labels and BMD values. To ensure data independence, splitting was strictly performed at the patient level, meaning all vertebral images (L1–L4) from a single patient were assigned exclusively to either the training or test set, with no data shared across splits. During testing, the model operates via a sequential inference pipeline where AP spine X-ray images are processed as independent inputs. Notably, the categorical labels used in the regression stage were generated internally by the classification model rather than being fed from ground-truth DXA reports. This ensures a realistic and unbiased prediction environment.

3. Results

This section presents the comprehensive performance evaluation of our proposed AI-based BMD prediction system. We first report the effectiveness of the segmentation model. Subsequently, the classification model performance is assessed. Finally, we evaluate the prediction model.
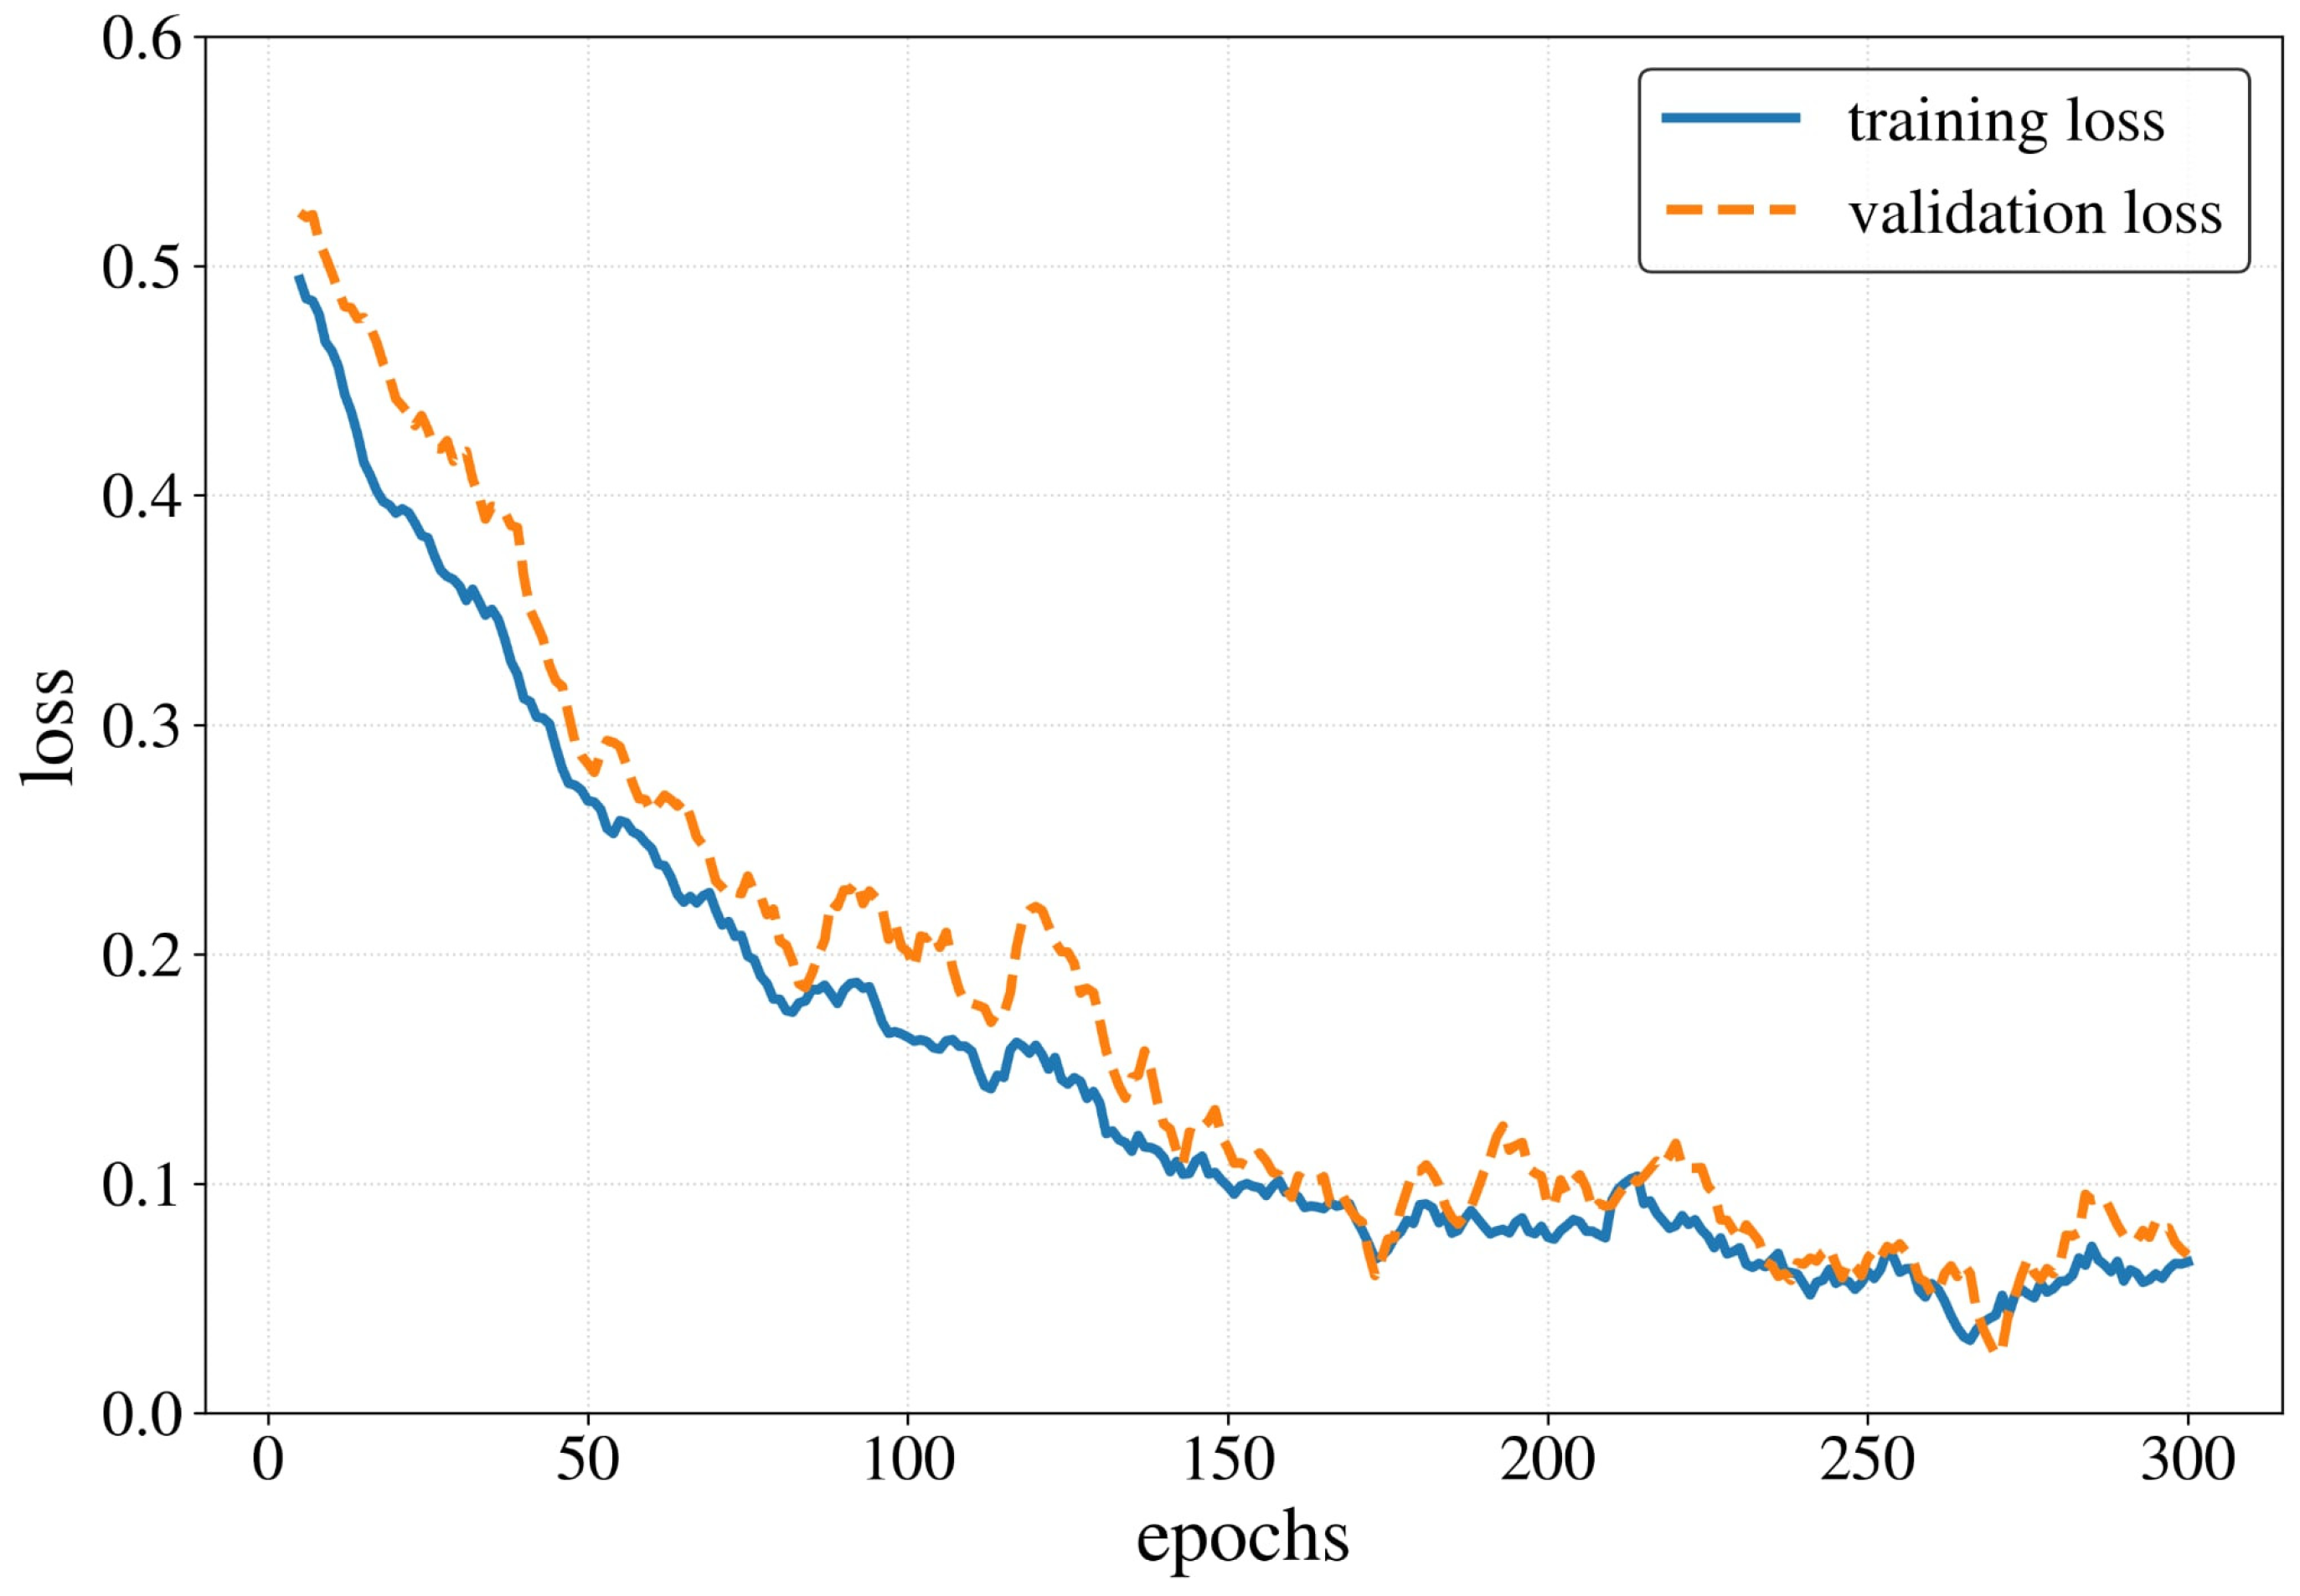
As illustrated in Table 6, the segmentation model trained using the comprehensive augmentation strategy (as detailed in Section 2.2.2) demonstrated robust performance across both internal and external datasets. On the internal test set, the model achieved a high IoU of 0.896 and a DSC of 0.943, indicating excellent overlap with manual annotations. Figure 6 displays the learning dynamics of the segmentation model. Both training and validation loss curves demonstrated smooth convergence without evidence of divergence. This implies that the model effectively captured generalizable morphological features rather than memorizing augmented variants. To investigate the impact of our data augmentation strategy, we trained a parallel model using minimal augmentation (horizontal flipping and minor rotation ±5°), resulting in approximately 14,000 samples. The significant performance gap between the fully augmented model (DSC 0.943) and the minimal-augmentation model (DSC 0.911) confirms that extensive augmentation was a key factor in improving generalization rather than causing overfitting.
When evaluated on the external dataset from Phramongkutklao Hospital, the model maintained robust performance with an IoU of 0.809 and DSC of 0.884. While these high metrics might initially raise overfitting concerns, vertebral segmentation is a relatively constrained task characterized by high structural consistency across patients, which contributes to such strong performance.
Table 7 summarizes the top ten features identified by each of the four feature selection methods. Following the strategy described in Section 2.2.5, only the top two features from each method were incorporated into the final model. By limiting the selection to these eight high-impact variables, we aimed to maximize predictive accuracy while reducing the risk of overfitting.
The classification model demonstrated exceptional performance in categorizing vertebral images, achieving an overall accuracy of 92.4% and a macro-average F1-score of 0.910, as shown in Table 8 and Table 9. Detailed class-wise analysis confirms high sensitivity, particularly for the osteoporosis group (88.9% recall), with minimal misclassification between non-adjacent categories. The classification model demonstrated consistent performance across various validation scenarios. The external validation yielded a classification accuracy of 86.4%, illustrating strong generalizability.
Table 10 summarizes the prediction performance across different lumbar vertebrae (L1–L4) using r, RMSE, and MAPE. The AI-predicted BMD demonstrated strong correlation with DXA-measured BMD at all levels, with r ranging from 0.93 to 0.96. The highest correlation was observed at L1 (r = 0.96), followed by L2 (r = 0.95). The lowest MAPE (5.36%) occurred at L2. Although L4 showed slightly higher error (MAPE = 6.91%), the correlation remained strong (r = 0.93). For the average BMD across L1–L4, the model achieved r = 0.94, RMSE = 0.07, and MAPE = 6.15%, indicating consistent and reliable performance when predicting the composite lumbar BMD. These results demonstrate that the AI model can effectively and accurately estimate BMD values from radiographic images, closely aligning with gold-standard DXA measurements.
Furthermore, Table 11 provides an error stratification analysis based on clinical categories. The results indicate that the prediction of osteoporosis presents the greatest challenge, yielding the highest error rate (MAPE = 9.80%). This performance is primarily attributed to the inherently low absolute BMD values in osteoporotic vertebrae, where even a minor numerical deviation results in a disproportionately large percentage error.
To specifically investigate the impact of radiomics features on model performance, we developed a prediction model trained exclusively on a combination of clinical and radiomics variables. We then conducted a sensitivity analysis by systematically varying the number of included radiomics features to identify the optimal feature subset. Our results, summarized in Table 12, demonstrate that utilizing the top 1 feature from each method (4 features in total) yielded the MAPE of 13.18%. Increasing the input to the top 2 features from each method (8 features) improved the model accuracy, reducing the MAPE to 12.23%. Further expanding the feature set to the top 3 features (12 features) resulted in a negligible improvement, with the MAPE plateauing at 12.21%. This indicates that the predictive power of the model saturates at 8 features. Therefore, we selected the top 2 configuration as our final model. This choice also provides the optimal balance between high diagnostic accuracy and model complexity.
Table 13 presents the ablation study results, illustrating the performance gains achieved by integrating multiple feature categories. While a simple age and BMI baseline yielded a high MAPE of 18.01%, our proposed full model achieved a superior MAPE of 6.15%. The transition from clinical data (14.15% MAPE) to include positional and radiomic features (8.41% MAPE) suggests that radiomics effectively captures intrinsic bone micro-architecture invisible to demographic factors. Furthermore, incorporating automated classification labels as high-level priors further refined the predictions to 6.15%. This synergy demonstrates that combining all feature categories is essential for achieving high performance BMD prediction.
Table 14 presents the predictive performance of the AI-based BMD estimation model on the external test set from Phramongkutklao Hospital. The model demonstrated robust correlation with DXA-measured BMD across individual lumbar vertebrae, with r values ranging from 0.87 to 0.92. The strongest correlation was observed at L3 (r = 0.92), followed closely by L4 (r = 0.91). At L2, the model achieved the lowest error (MAPE = 4.35%). Although L3 exhibited a slightly higher error (MAPE = 9.24%), the correlation remained strong, reflecting stable performance across different lumbar levels. For the averaged lumbar BMD (L1–L4), the model achieved r = 0.89, RMSE = 0.08, and MAPE = 6.44%. These results are highly comparable to the internal validation set, where the model achieved r = 0.94 and MAPE = 6.15%. Importantly, the mean age of this external dataset was approximately 80 years, which is substantially higher than that of the internal dataset. Despite this age difference and the expected dataset shift, the performance degradation was minimal. This result underscores the robustness and generalizability of the proposed model across different patient populations.
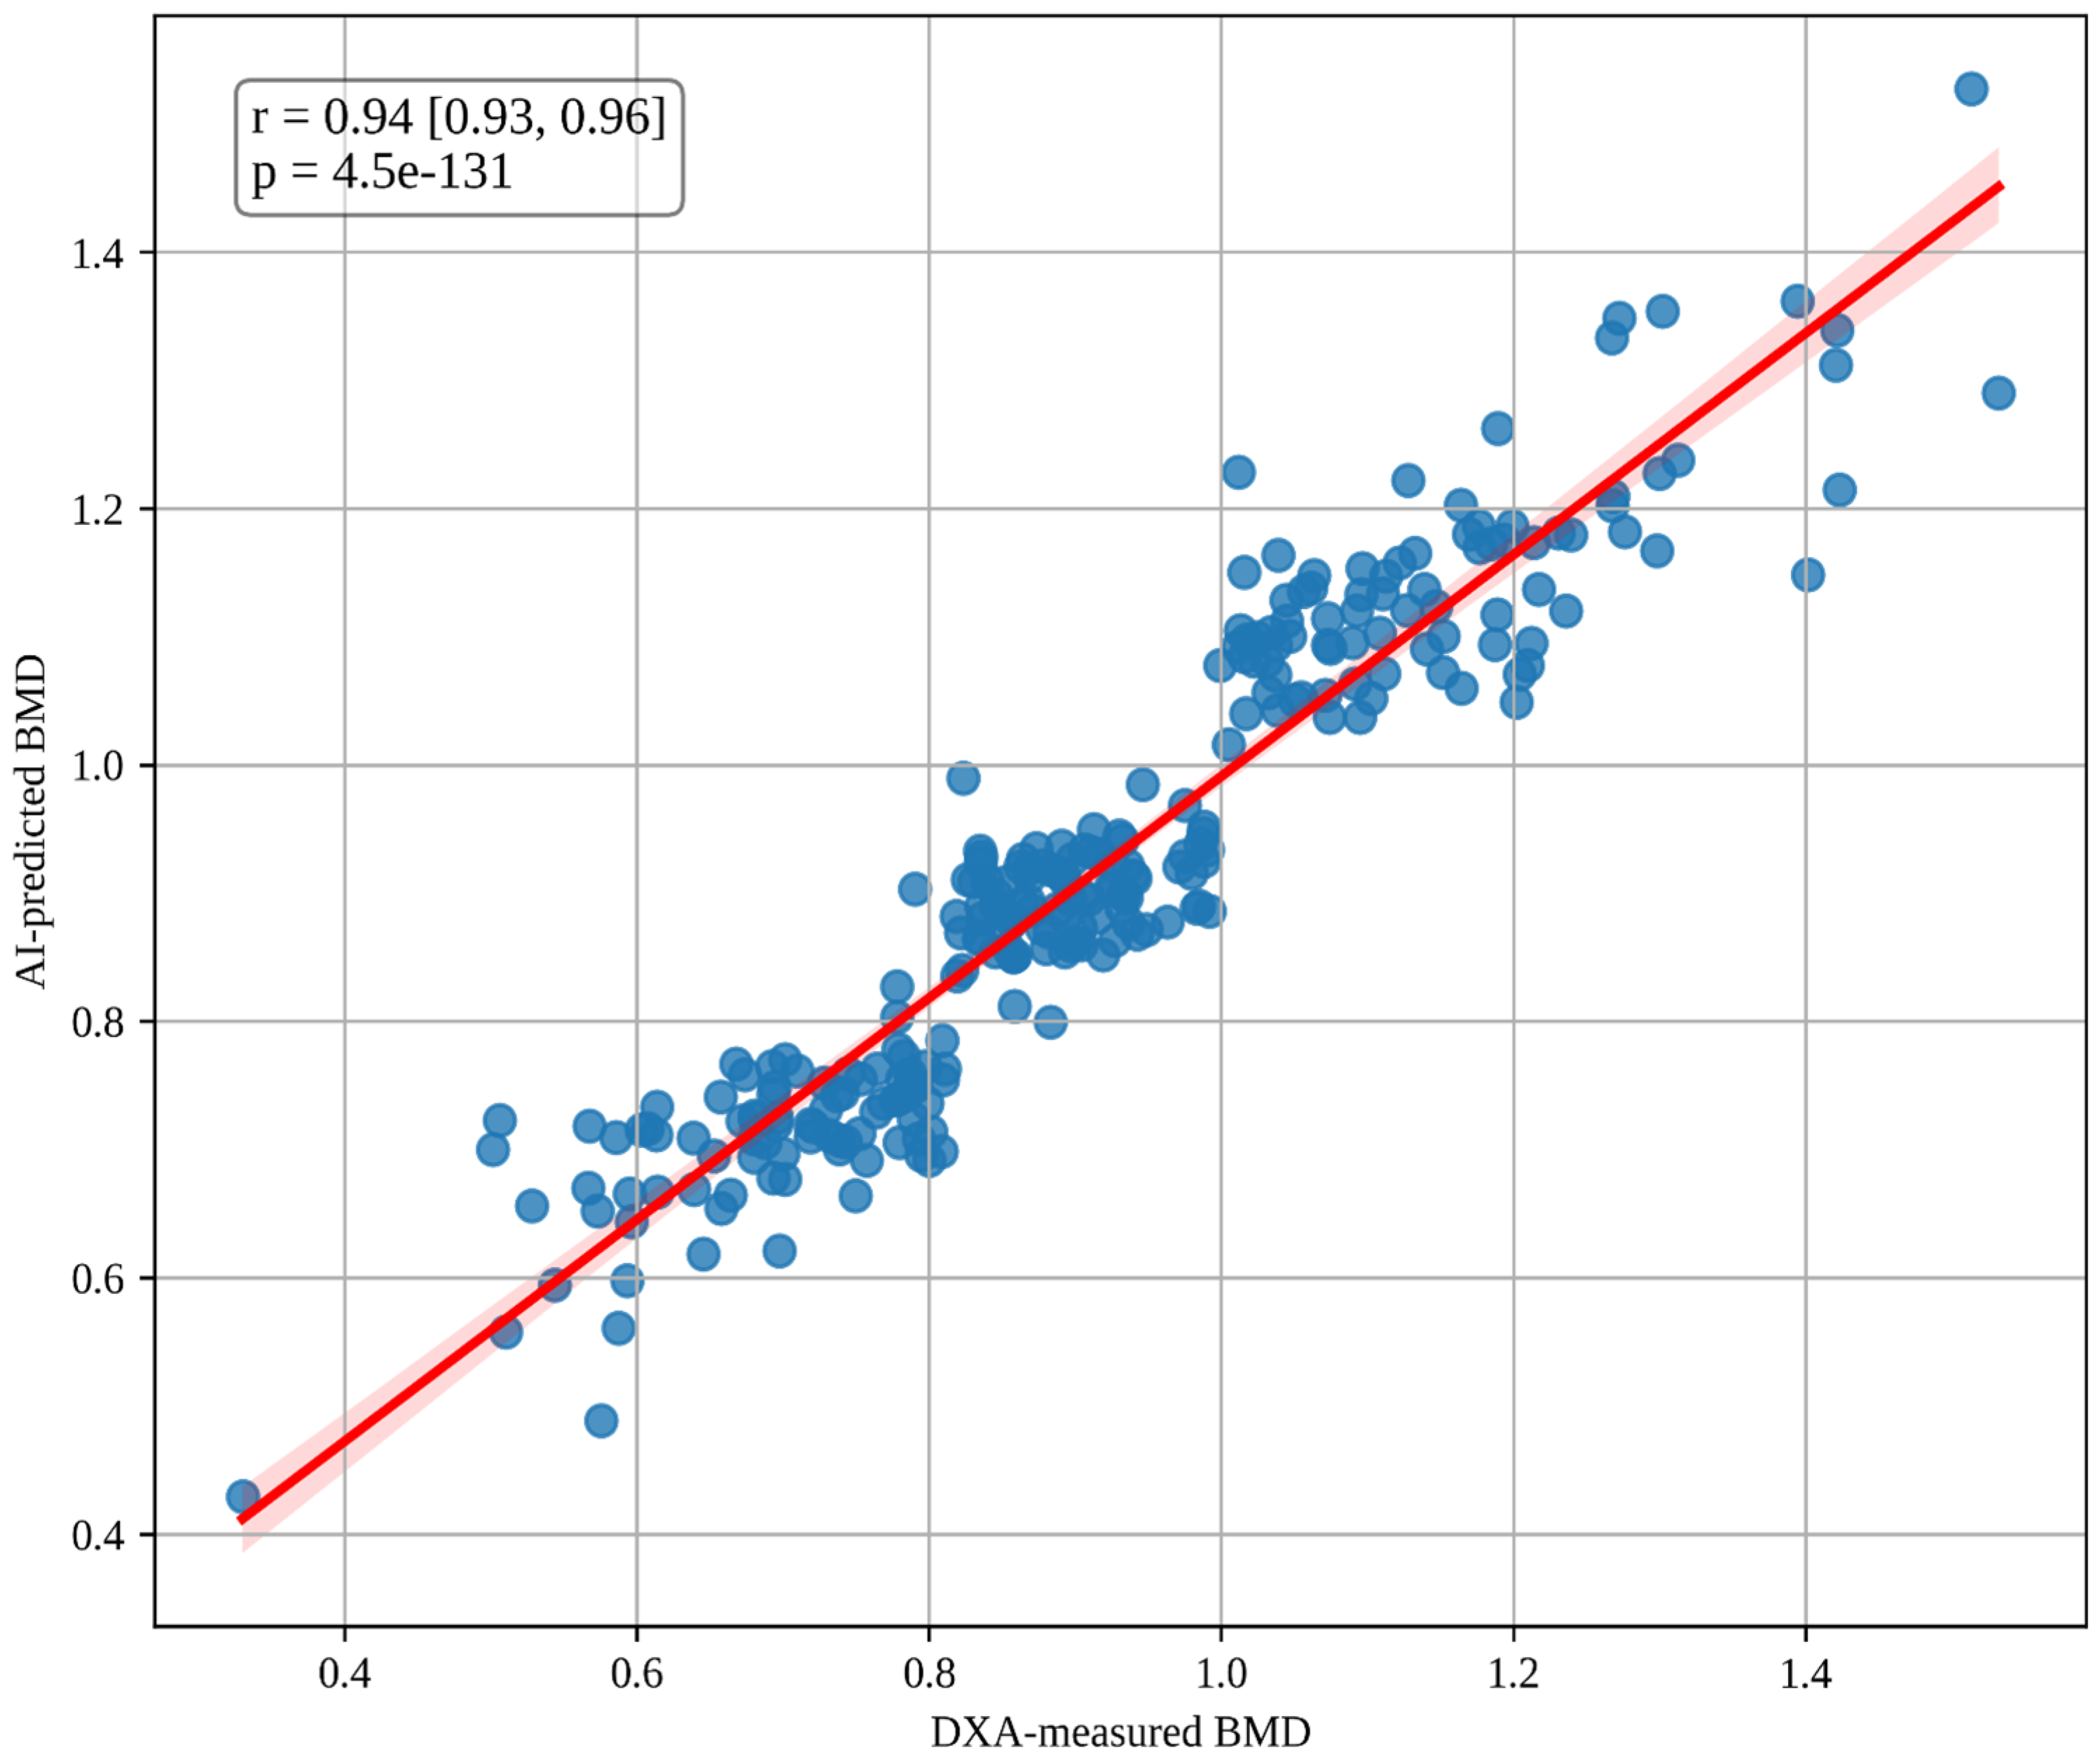
We further analyzed the correlation between AI-predicted BMD and DXA-measured BMD using scatter plots, as shown in Figure 7. Each plot presents the AI-predicted BMD values plotted against the corresponding reference DXA values. The red diagonal line represents the line of perfect agreement, serving as a visual reference to assess the degree of deviation or bias in the predictions. The fitted regression line closely follows the ideal diagonal, indicating strong agreement between the predicted and DXA-measured BMD values. The 95% confidence interval (CI) for the correlation coefficient was narrow (0.93–0.96), reflecting the robustness and consistency of the models performance. In addition, the p-value was found to be extremely low (p < 0.001), which strongly suggests that the observed correlation is statistically significant. This further supports the reliability of the proposed AI model in accurately predicting BMD from spinal radiographs.
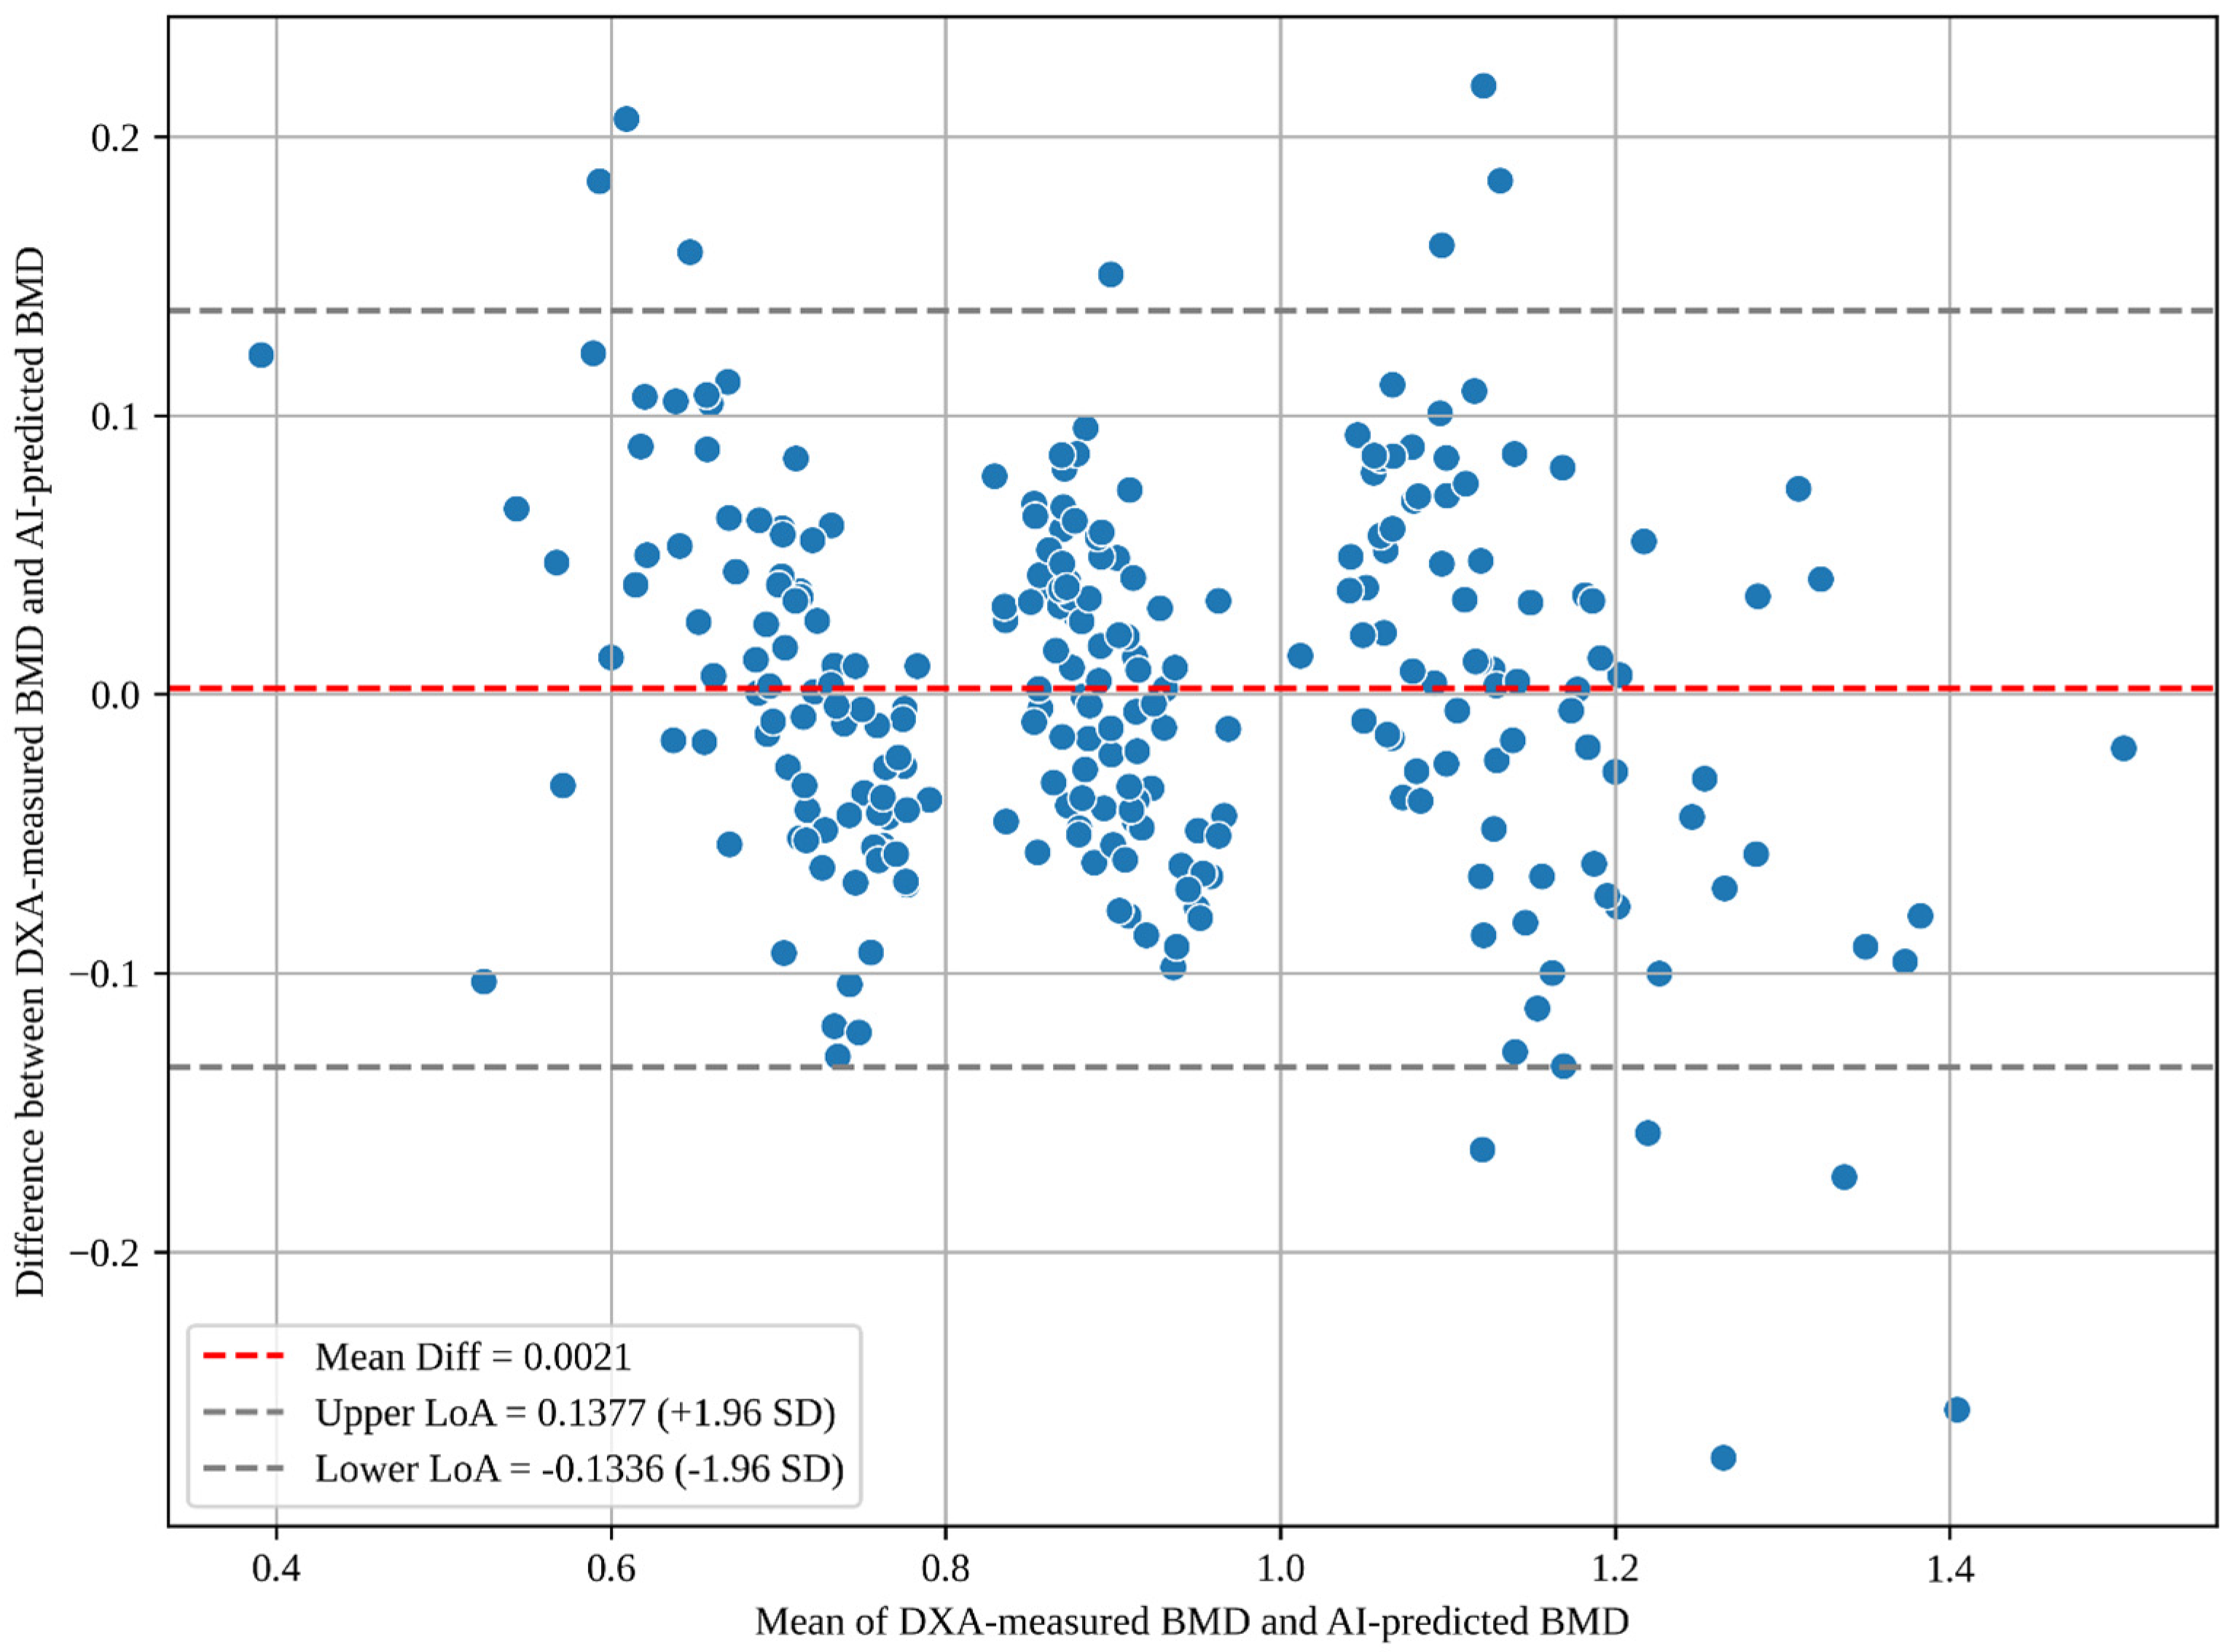
Figure 8 depicts the Bland–Altman plot that shows an agreement between the AI-predicted BMD and the DXA-measured BMD by plotting the difference (error) against the average of the two measurements. The mean difference (bias) is 0.0021, which is very close to zero. This suggests minimal bias in the XGBoost-based prediction model. The limits of agreement (LoA) range from −0.1336 to 0.1377. This indicates that 95% of the differences between predicted and DXA-measured BMD values fall within this interval. The narrow range of these limits suggests good agreement between the two measurement methods.
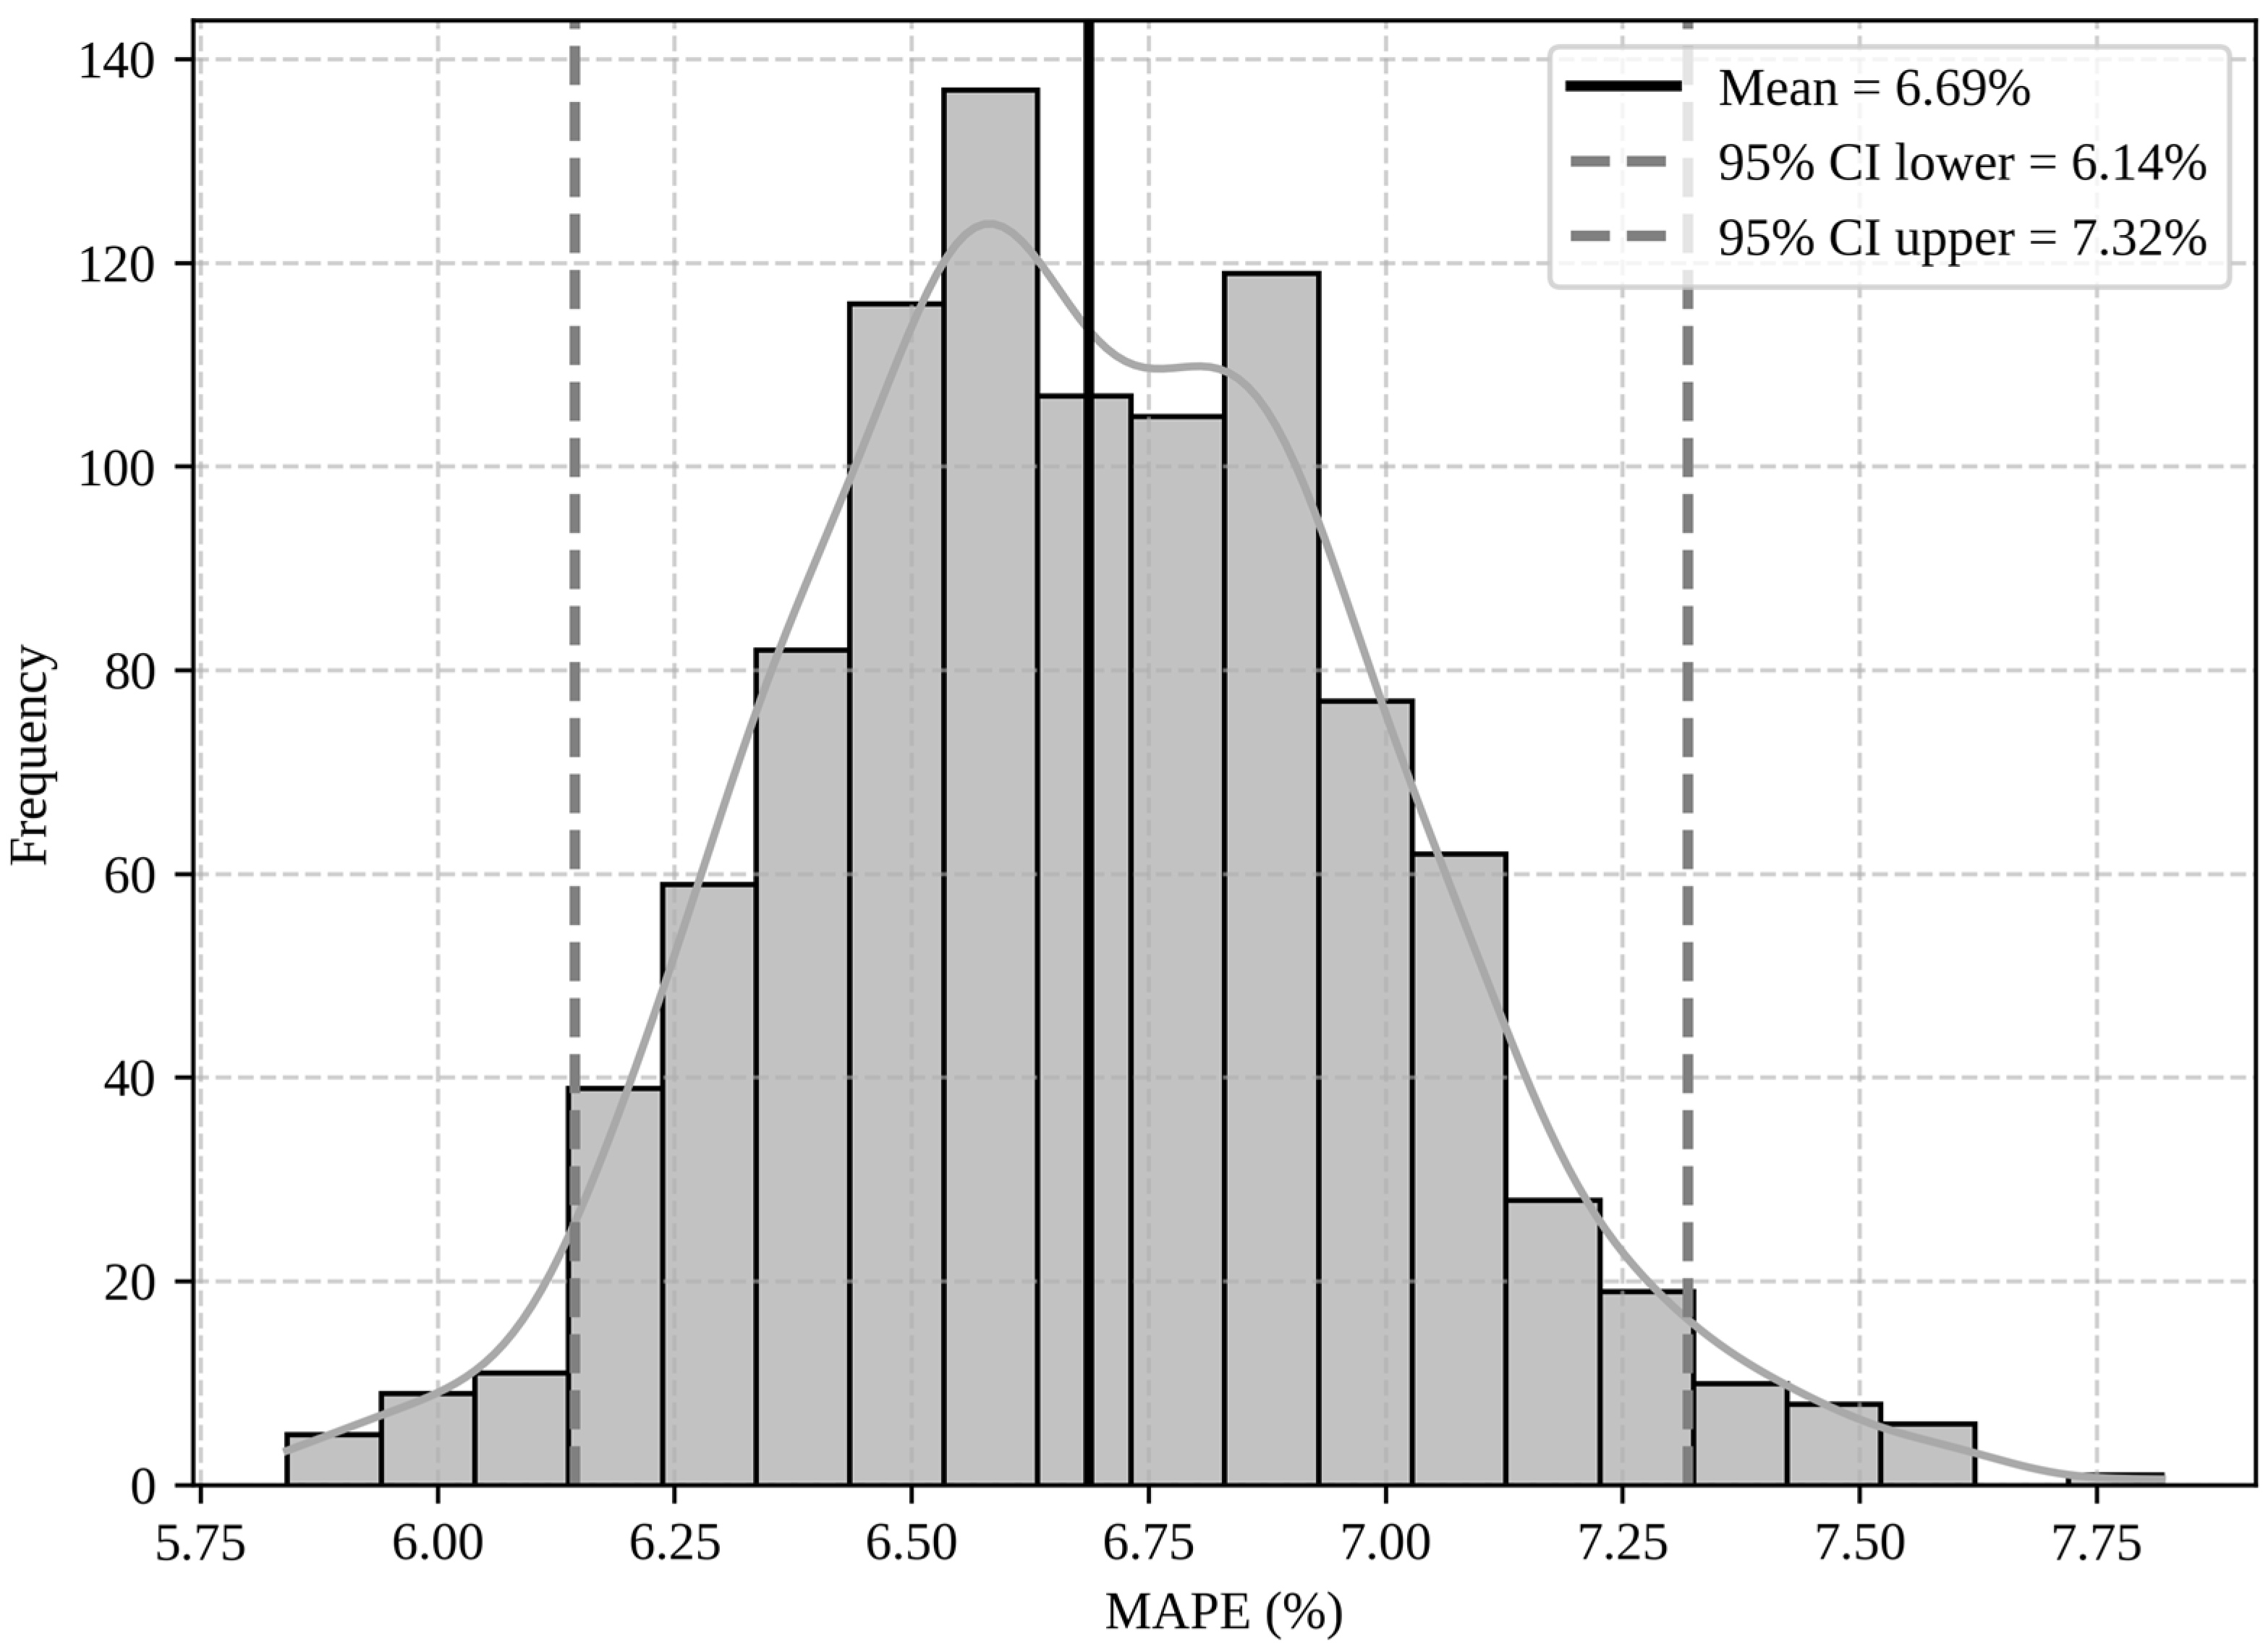
To further assess the robustness of our XGBoost model for BMD prediction, we applied a bootstrap resampling strategy with 1000 iterations, which can be considered to be statistically sufficient. Bootstrapping involves repeatedly resampling the training data with replacement and retraining the model. This method allows us to evaluate how sensitive the predictions are to variations in the training set. Therefore, this method provides a statistical estimate of the variability and confidence in the model predictive performance. For each bootstrap iteration, we used the fine-tuned hyperparameters obtained from Optuna, reported in Table 5, to optimize model performance. The MAPE distribution in Figure 9 shows a mean MAPE of 6.69%, with a 95% confidence interval ranging from 6.14% to 7.32%. The narrow confidence interval confirms that the model is robust and reliable, as performance remains stable despite variations in the training data. Furthermore, the narrow width of the distribution indicates that the model consistently produces similar prediction errors across bootstrap samples. The peak of KDE curve represents the typical MAPE that can be obtained from the model. Although the peak of the distribution is around 6.60%, which is slightly lower than the prediction performance reported in Table 5 (obtained without bootstrap), the two results are consistent and related. Overall, the bootstrap-based MAPE analysis demonstrates that our model achieves both great MAPE and low variability.
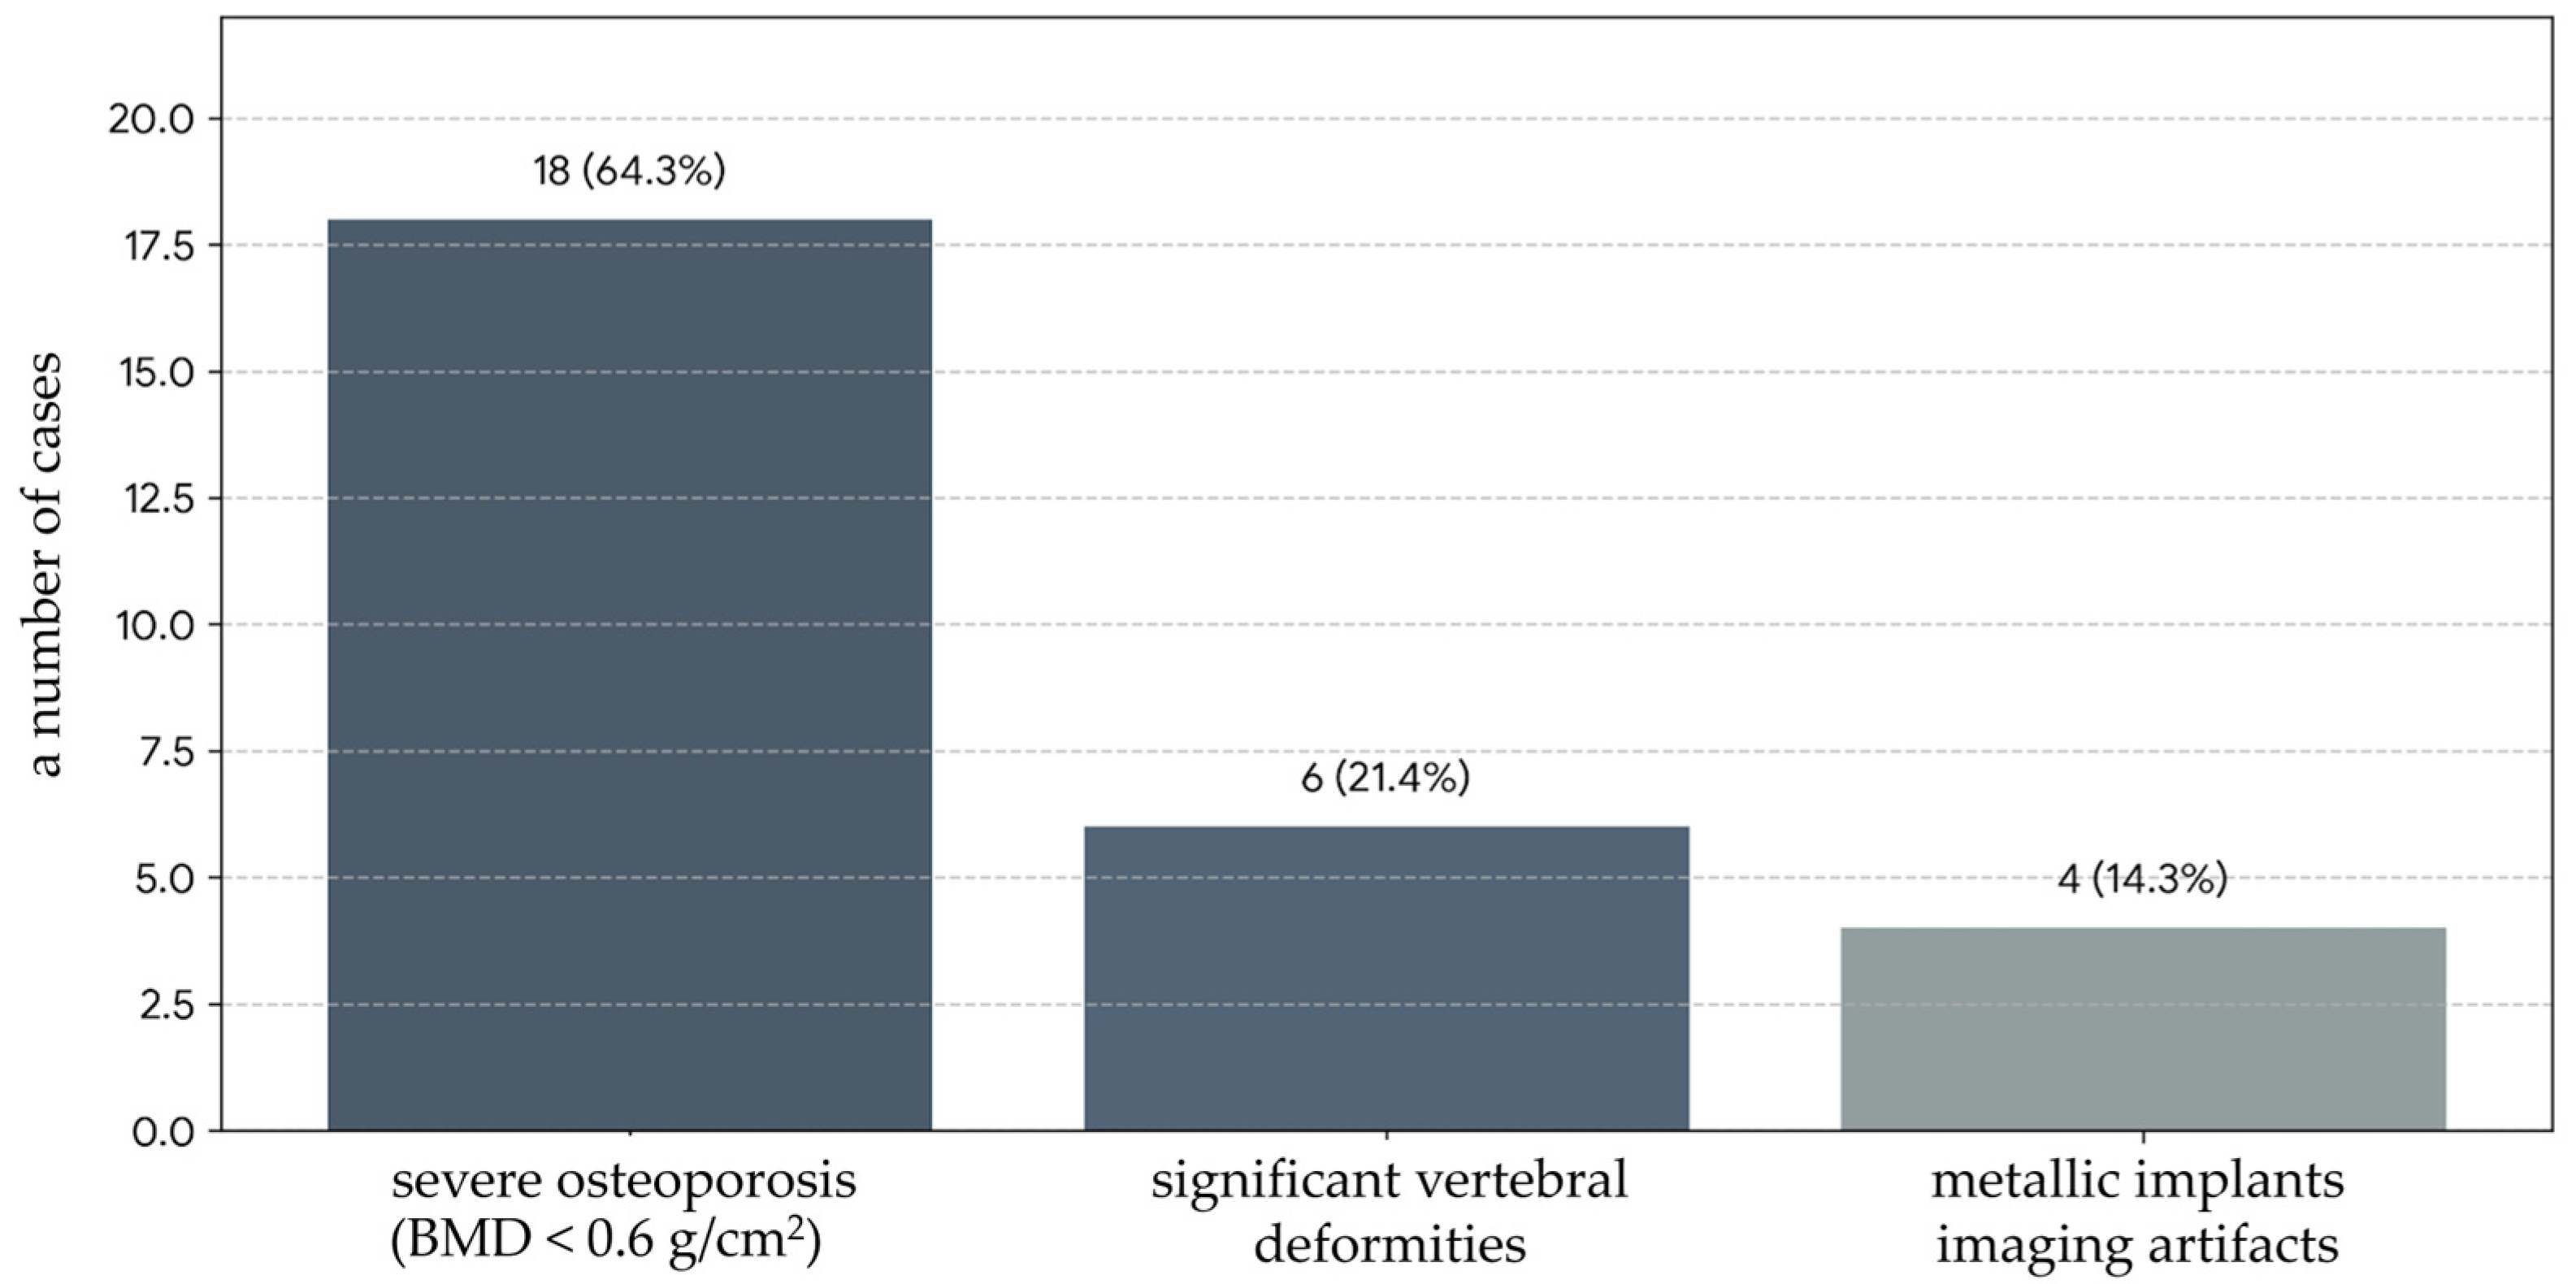
To better understand the operational boundaries of our model, a failure case analysis was performed and shown Figure 10. We identified 28 cases (1.8% of test set) where absolute prediction error exceeded 15%. Manual review revealed that 18 cases (64%) had severe osteoporosis (BMD < 0.6 g/cm2), 6 cases (21%) had significant vertebral deformities not classified as grade 3 fractures, and 4 cases (14%) had metallic implants causing imaging artifacts. Specifically, the model showed reduced performance in extreme BMD ranges and in the presence of anatomical abnormalities.

4. Discussion

The high predictive accuracy of our AI-based system (MAPE = 6.15%) demonstrates its potential as a powerful opportunistic screening tool, particularly in resource-limited or rural areas where DXA access is restricted. By leveraging cost-effective plain radiographs and heterogeneous features, this approach enables early osteoporosis detection and addresses healthcare disparities in an aging global population. Ultimately, this AI-driven solution is intended to enhance diagnostic reach and improve patient outcomes, serving as a vital clinical adjunct rather than a replacement for the gold-standard DXA measurement.
The performance of the segmentation model demonstrates both high accuracy and robustness, which are essential for reliable downstream analysis. The strong internal test set results (IoU 0.896, DSC 0.943) confirm that the model is capable of precise vertebral localization and delineation when applied to data drawn from the same distribution as its training set. Importantly, the external validation results (IoU 0.809, DSC 0.884) indicate that the model retains substantial segmentation accuracy even when confronted with differences in imaging protocols, equipment, and patient demographics. The observed performance drop is modest and aligns with expectations for cross-institutional deployment, where heterogeneity in data quality and acquisition parameters is inevitable. Accurate segmentation is a critical prerequisite for subsequent radiomic feature extraction, classification, and regression-based BMD prediction.
One of the strengths of this study is the input data, which consists of specifically segmented vertebrae with at least 40 points (10 points per side of each vertebra). In contrast, Hsieh et al. [11] used only 6 points per vertebra. Zhang et al. [29] focused primarily on segmenting the trabecular bone of the spine without explaining how the segmented region was produced, whereas Lin et al. [30] did not segment the images at all, even when employing chest X-rays with other organs. Additionally, we developed a new code for the cropped segmentation area, ensuring that the pixel input accurately represents the specific regions of interest.
The integration of diverse data types significantly enhanced the model accuracy. Clinical features, including age, weight, and height, played a crucial role in the performance of the XGBoost model, as these factors are known to influence BMD. One key discovery in this study was the importance of radiomic features which provided valuable insights into the textural and geometric properties of the vertebrae. We identified a concise set of eight variables that capture a broad spectrum of bone quality indicators, ranging from linear mineral density trends to complex non-linear architectural patterns. Biologically, these selected features directly manifest the pathophysiological changes associated with bone loss. Specifically, Entropy-based metrics (such as Run and Dependence Entropy) reflect the increased structural chaos and micro-architectural deterioration inherent in osteoporotic bone, while First-order statistics (like Interquartile Range and Robust Mean Absolute Deviation) quantify the non-uniformity of mineral distribution and increased porosity. By focusing on these biological textures and bone shapes instead of simple indirect signals, our model proves it can truly understand bone health from X-ray patterns. This shows that the AI is not just re-calculating density numbers, but is actually identifying the complex structural changes that happen in bone disease.
Additionally, the positional feature, which accounts for variations in BMD across different spinal regions (L1 to L4), proved to be a valuable addition. This improvement may be attributed to the distinct load-bearing characteristics of each vertebra. For instance, the uppermost vertebra (L1) bears the least load, while L4 bears the highest load. As a result, the shape of the spine varies, with lower vertebrae being larger. This variation likely influences the microarchitecture of bone at different spinal levels. The inclusion of this positional feature allowed the model to account for the inherent variability in bone density across lumbar spine segments, thereby improving its ability to predict BMD more accurately for each vertebral region. Furthermore, the classification feature, derived from the preceding diagnostic stage that categorized vertebrae into osteoporosis, osteopenia, or normal, provided an additional high-level summary of bone health status. This categorical input likely guided the regression model by anchoring predictions within clinically relevant diagnostic boundaries, enabling more precise BMD estimation for vertebrae that shared similar classification profiles.
To account for acquisition variability, we applied intensity normalization using z-score standardization within each image ROI before feature extraction [31]. However, we acknowledge that differences in detector technology and acquisition protocols between institutions represent a potential confounding factor that may affect radiomics feature reproducibility [32,33]. The fact that our model maintained reasonable performance in external validation (MAPE = 6.44%) despite these differences suggests some degree of robustness, though this should be confirmed in multi-center prospective studies with standardized protocols.
Regarding the model architecture, we utilized ordinal numeric encoding (1, 2, and 3) to represent the stages of bone loss. This encoding was adopted for its computational efficiency and its direct alignment with clinical grading systems, such as the WHO classification, which establishes an ordered categorical structure for osteoporosis diagnosis. While this framework provided a practical and robust basis for our regression-based analysis, we recognize that biological disease progression is inherently continuous rather than stepwise. Consequently, future iterations of this model will investigate continuous output layers and non-linear mapping functions to better reflect biological variability and provide a more nuanced representation of bone density changes.
From a clinical perspective, the Bland–Altman analysis, shown in Figure 8, demonstrates excellent agreement between the AI model and DXA measurements, with a negligible mean bias of 0.0021 g/cm2. This bias is substantially lower than the typical Least Significant Change (LSC) of DXA scanners (0.03–0.05 g/cm2). This indicates that the model average systematic error falls well within the precision limits of gold-standard instruments. While the 95% limits of agreement (−0.1336 to 0.1377 g/cm2) are broader than the LSC, the tight clustering of data points near the mean difference line suggests that the model provides sufficient accuracy for opportunistic screening.
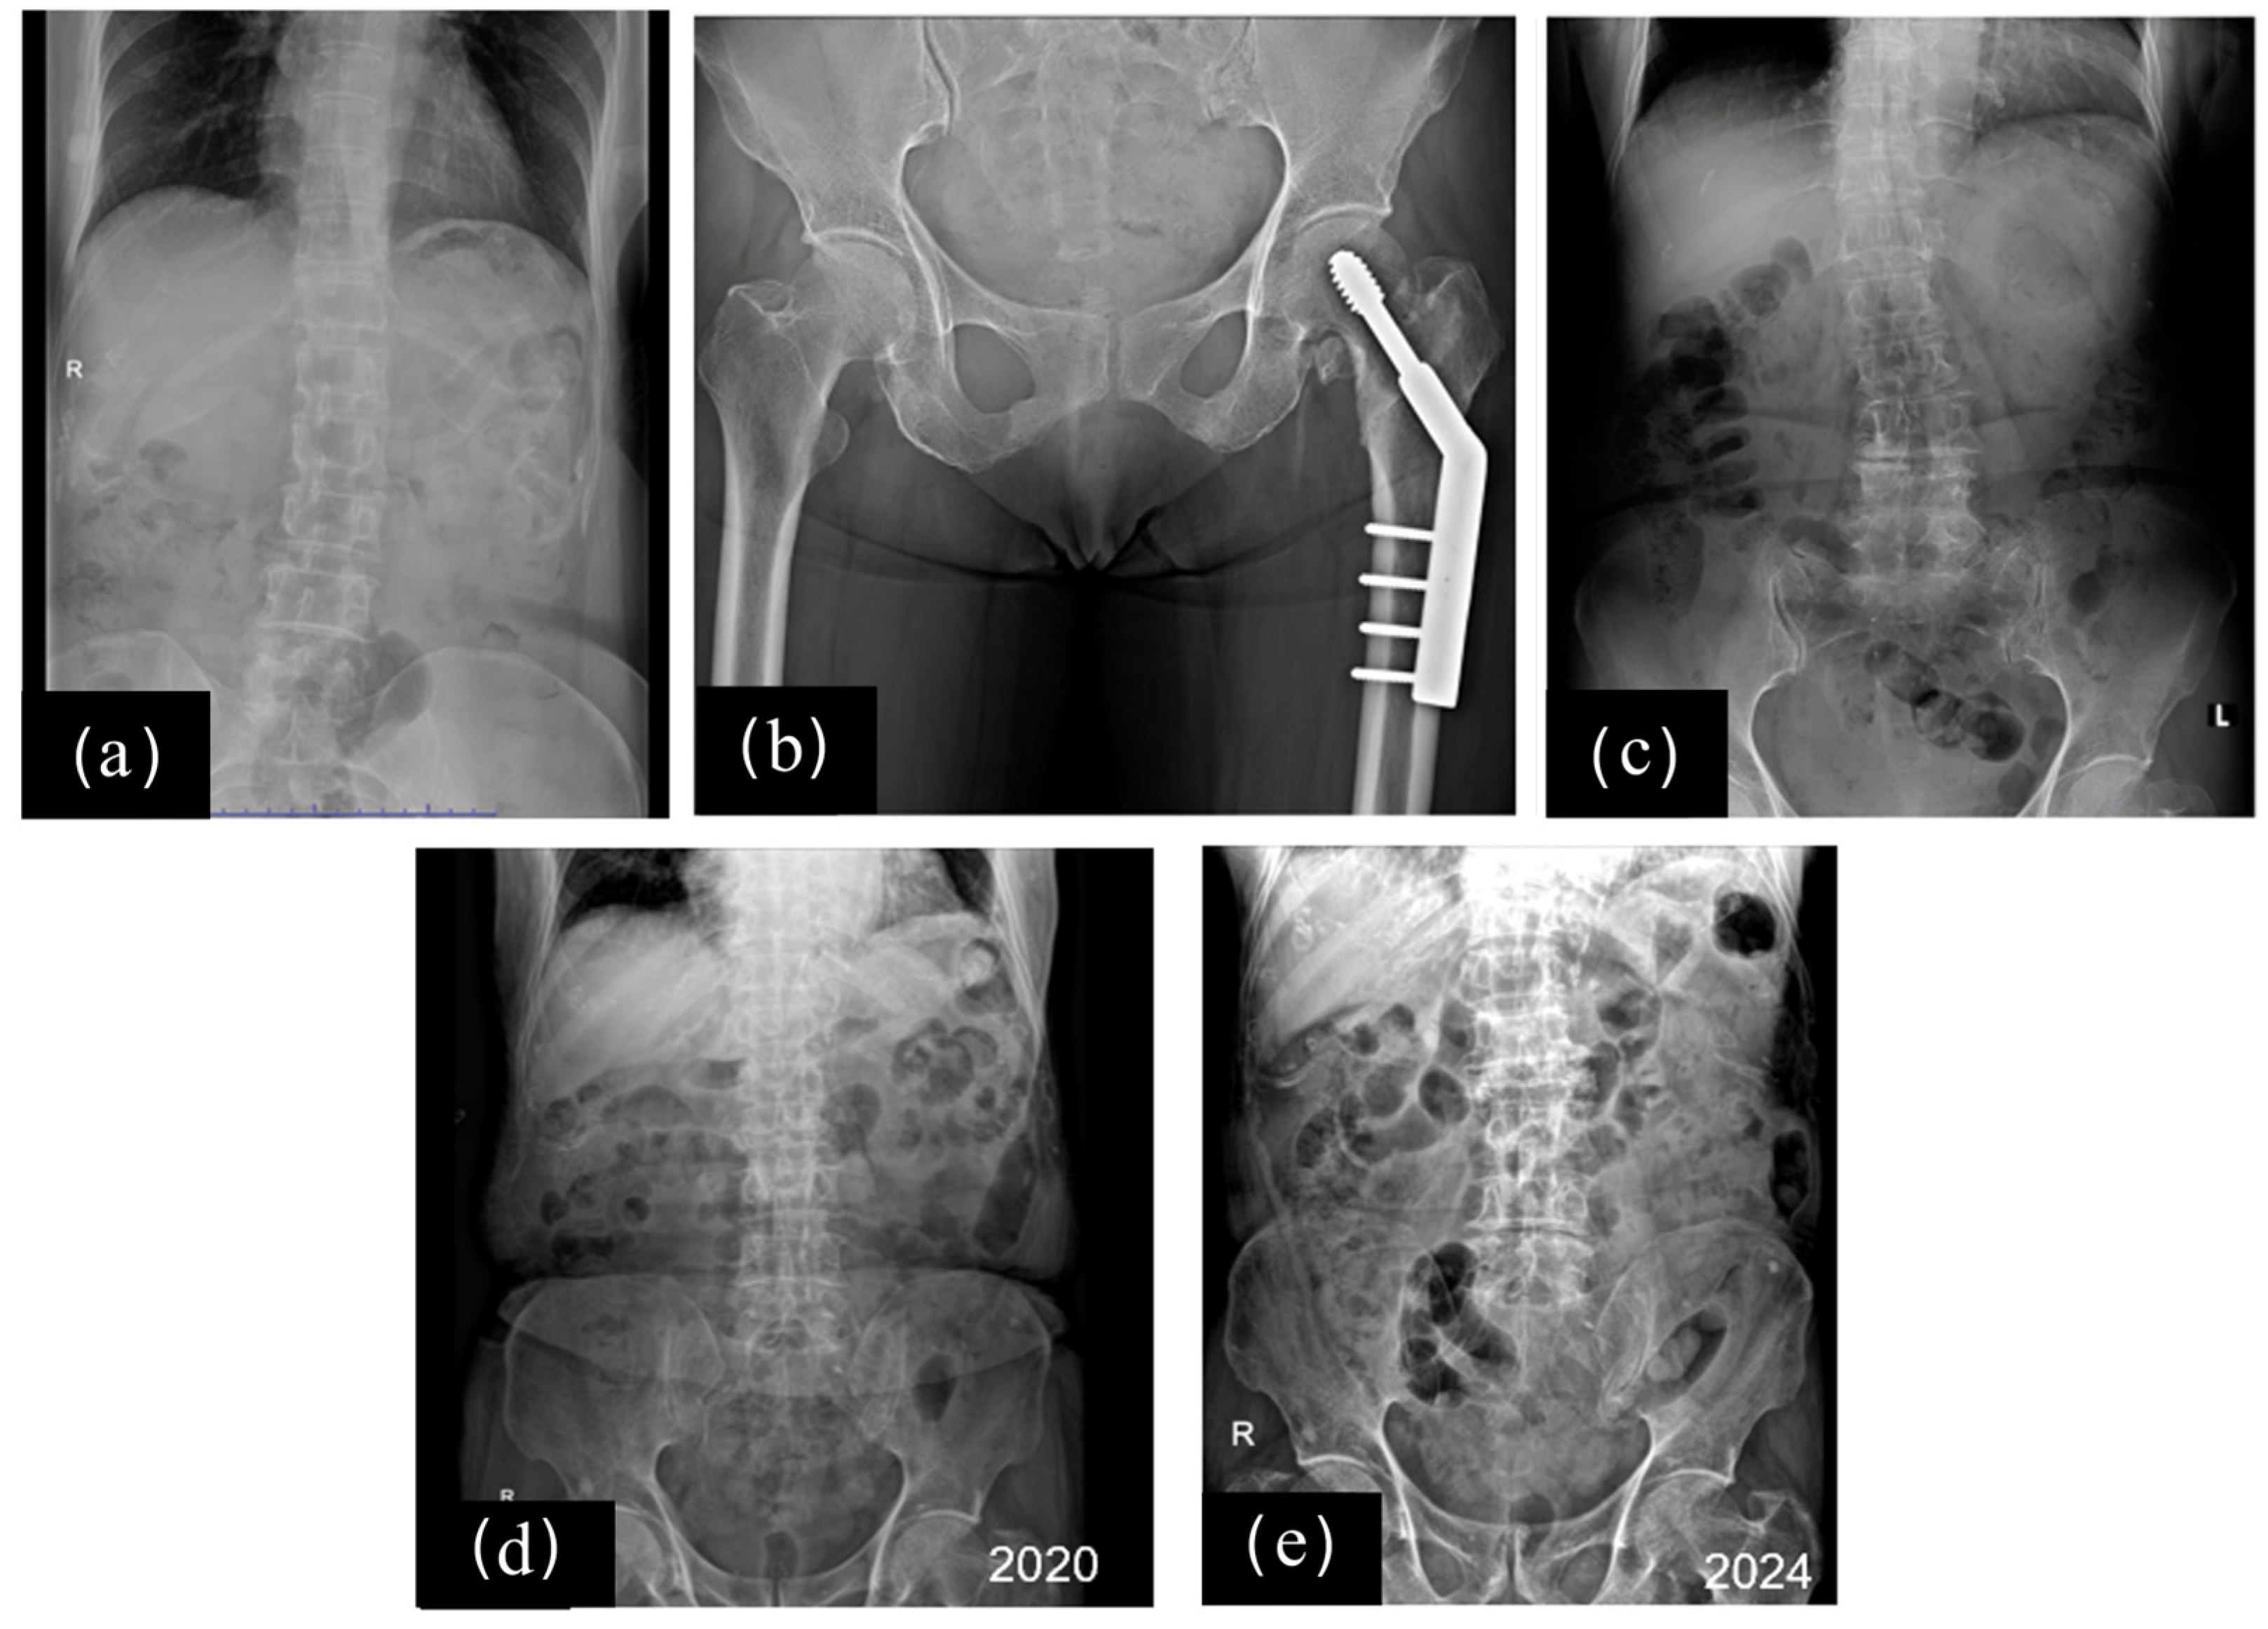
Developing an AI model that can be reliably applied in real-world clinical settings remains a significant challenge, and only a limited number of models have successfully transitioned from research to practice. The model proposed in this study was designed with clinical applicability in mind, aiming to deliver robust performance across diverse patient populations and imaging conditions. Its potential for real-life use is demonstrated in the illustrative examples presented below. The first case involves a 62-year-old female who presented to the orthopedic outpatient department with complaints of back pain and for osteoporosis screening. Following clinical evaluation and X-ray assessment, the physician suspected mild-grade spondylosis and muscle strain. Using our AI model to predict BMD from her lumbar plain radiograph (Figure 11a), the model estimated a BMD of 0.776 g/cm2. In contrast, the DXA-measured BMD measured by DXA scan for L1–L4 was 0.750 g/cm2, resulting in an absolute percentage error of 3.46%, as shown in Table 15. For clinical relevance, we calculated the T-score from the predicted BMD, which yielded an AI-predicted T-score of −2.8 for the L1–L4 region. In comparison, the T-score from the DXA scan was −3.0, showing a close correspondence with the AI prediction. This case illustrates the potential of AI in aiding the initial diagnosis of osteoporosis.
The second case involves a 77-year-old female who sustained an intertrochanteric fracture of the left femur due to low-energy trauma (Figure 11b). She was referred to as a lumbar plain radiograph (Figure 11c) to evaluate associated lower back and buttock injuries. The radiograph was used to predict her BMD and calculate the T-score for the L1–L4 spine using the AI model. The AI predicted a BMD of 0.770 g/cm2 for L1–L4, whereas the DXA-measured BMD measured by DXA scan was 0.808 g/cm2, resulting in an absolute percentage error of 4.7%, as shown in Table 16. The AI-derived T-score from the predicted BMD was −2.8 for the L1–L4 region. In comparison, the T-score obtained from the DXA scan was −2.5, indicating a very high fracture risk according to the Endocrine Society Global Updated 2020 Guidelines. These guidelines recommend treatment with anabolic agents, such as Teriparatide, Abaloparatide, or Romosozumab, for such high-risk patients. In clinical practice, the patient was prescribed Teriparatide as part of her anti-osteoporotic treatment regimen. The fracture subsequently healed, and the patient returned to her normal functional status within four months.
In this final case, we demonstrate the application of AI-predicted BMD for patient follow-up. The subject is a 92-year-old female who presented with back pain due to an osteoporotic vertebral compression fracture (OVCF) at the L2 vertebra, as shown in Figure 11d. The AI-predicted BMD was in close agreement with the DXA-measured BMD, showing an absolute percentage error of 5.19%. The AI-predicted T-score was −2.7, compared to the actual T-score of −3.0, confirming a diagnosis of severe osteoporosis. The patient had been receiving anti-osteoporotic therapy for four years and was attending the outpatient clinic for routine follow-up. A lumbar spine radiograph (Figure 11e) was taken, and the AI-predicted BMD indicated an increase in bone density, which was consistent with the DXA-measured BMD, which also showed an increase, as demonstrated in Table 17. The absolute percentage error between the AI-predicted and DXA-measured BMD was 8.13%. These findings highlight the potential of AI in monitoring longitudinal changes in bone density, providing valuable insight into the effectiveness of treatment and supporting clinical decision-making. It is important to note that the external validation cohort comprised only 70 patients with a mean age of approximately 80 years, which is substantially older than our internal dataset (mean age 64.6 years). This small sample size and age skew limit the generalizability of our findings. The modest performance degradation (MAPE 6.43% vs. 6.15% internal) suggests reasonable robustness, but larger, more diverse external cohorts are needed to confirm cross-institutional performance.
The slightly higher MAPE observed in the external validation set (6.44%) compared with the internal set (6.15%) can be attributed to the following factors. Despite this minor difference, the model demonstrates strong generalizability across diverse datasets. (1) Image dimensional differences: the external dataset contains images with varying resolutions or dimensions compared to the training dataset. Although appropriate normalization or standardization of image characteristics was applied, such differences can introduce subtle variations in model performance. (2) Inter-machine variability: images in the external dataset were acquired from different X-ray machines or vendors. Variations in hardware, acquisition protocols, and calibration can create minor distribution shifts that the model was not fully exposed to during training, yet the close performance metrics highlight the model robustness. Although formal DXA (±1.5–2% precision) remains the superior gold standard for diagnosis [34], our proposed model approaches this clinical threshold with a performance of 6.15% MAPE. This level of accuracy supports its role as a robust tool for opportunistic screening, facilitating the identification of at-risk patients during routine imaging without intending to serve as a diagnostic replacement for DXA.
Our study has several limitations. Firstly, the dataset used in this study is relatively small, primarily due to the lack of available plain films within six months of the BMD assessment. This limitation may impact the generalizability of our findings and the performance of the model. Such gaps likely arise from the unavailability of DXA scan appointments at the time when patients underwent radiographs. Consequently, this work aims to address scenarios where DXA scans are not readily accessible. While this study included an external validation phase, we acknowledge that the external dataset was limited in scale, consisting of a relatively small cohort (70 patients). Furthermore, this dataset was skewed toward an elderly population and obtained from a single institution, which may limit the generalizability of our findings across broader clinical settings and diverse demographics. Future studies involving larger, multi-center, and more age-diverse cohorts are warranted to further establish the robustness and cross-institutional reliability of the proposed model. Despite this, our hospital, as a tertiary care center, serves a broad patient population ranging from healthy individuals undergoing routine check-ups to those with chronic conditions, making the dataset relatively diverse. Secondly, according to Figure 5 (Histogram of BMD), the representation of very low BMD cases in the training set is limited. This data imbalance likely contributed to the reduced accuracy in this range. To address this issue, future work should focus on collecting more training cases with low BMD values or applying data augmentation techniques to better capture the characteristics of this subgroup. These efforts would enhance the robustness of the model, particularly for patients at the highest risk of osteoporosis-related fractures. Thirdly, vertebral segmentation was performed by only two experienced radiologists without inter-observer agreement analysis. This raises the possibility of annotation bias being learned by the segmentation model. Future work should include multi-reader annotations with inter-observer reliability assessment to ensure annotation robustness. Fourthly, a significant limitation is the restriction to female subjects. Extension to male populations will require retraining with sex-specific normative data, as T-score calculations and fracture risk thresholds differ by sex. Future work should develop and validate sex-stratified or unified models. Finally, the reliance on manual visual inspection to exclude severe vertebral fractures is a limitation of this work. Therefore, future work will integrate an automated fracture detection module to transition this quality control step into a fully automated pipeline. Clinical features can be seamlessly integrated through image metadata tags or electronic health record (EHR) systems. While this integration is planned for future development, the current system remains fully autonomous, maintaining its high performance even in the absence of external clinical data.

5. Conclusions

Our study demonstrates the feasibility of a multi stage AI-based BMD prediction system, integrating automated vertebral segmentation, vertebra-level osteoporosis classification, and regression-based BMD prediction, to estimate BMD in postmenopausal and elderly female populations from plain lumbar spine radiographs. By combining clinical factors, positional information, classification outputs, and radiomics features, the proposed prediction model yielded a mean absolute percentage error (MAPE) of approximately 6%, with strong and consistent predictive performance across the L1–L4 spinal segments. Our proposed system has the potential for integration into routine clinical workflows for early identification of at-risk patients who should be referred for confirmatory DXA scanning. Our future work will aim to reach a clinical-grade MAPE of 3–4% by integrating more advanced imaging features. Prospective multi-center validation studies with balanced age distributions and larger sample sizes are planned to establish the model’s generalizability across diverse clinical populations and imaging protocol.

Author Contributions

All authors designed the protocol, read, and approved the final manuscript. P.T. Conceptualization, Data curation, Formal analysis, Funding acquisition, Investigation, Methodology, Project administration, Writing—original draft. N.T. Conceptualization, Formal analysis, Investigation, Methodology, Project administration, Writing—review and editing. A.K. and O.-a.P. Data curation. D.T., O.-a.P. and D.S. Resource and software. P.S. Investigation, Methodology, Project administration, and Writing—original draft. C.P. Conceptualization, Formal analysis, Funding acquisition, Methodology, Project administration, Resources, Supervision, Writing—original draft, Writing—review and editing. All authors have read and agreed to the published version of the manuscript.

Funding

Faculty of Medicine, Khon Kaen University and Khon Kaen University’s Research and Graduate grant number RP68-5-001.

Institutional Review Board Statement

The study was conducted in accordance with the Declaration of Helsinki and the Good Clinical Practice (ISO14155:2020) guidelines [35]. The protocol was approved by the Ethics Committee in Human Research, Khon Kaen University (Approval Code: 660301.6.2.11/744/68; Approval Date: 16 September 2025).

Informed Consent Statement

This study utilized retrospective data that has been fully anonymized, ensuring that individual participants cannot be identified directly or indirectly. As such, no explicit consent to publish was obtained from participants. The research was conducted in accordance with ethical guidelines and received approval from the relevant institutional review board (IRB)/ethics committee, which granted a waiver of consent due to the nature of the anonymized data used.

Data Availability Statement

The datasets used and/or analyzed during the current study are available from the corresponding author on reasonable request.

Acknowledgments

The authors would like to express their sincere gratitude to the Department of Electrical Engineering, Faculty of Engineering, Khon Kaen University, for providing access to the high-performance computing facilities. This support greatly contributed to the successful completion of this research.

Conflicts of Interest

The authors declare that they have no competing interests.

References

  1. Asavamongkolkul, A.; Adulkasem, N.; Chotiyarnwong, P.; Vanitcharoenkul, E.; Chandhanayingyong, C.; Laohaprasitiporn, P.; Soparat, K.; Unnanuntana, A. Prevalence of osteoporosis, sarcopenia, and high falls risk in healthy community-dwelling Thai older adults: A nationwide cross-sectional study. JBMR Plus 2024, 8, ziad020. [Google Scholar] [CrossRef] [PubMed]
  2. Khosla, S.; Hofbauer, L.C. Osteoporosis treatment: Recent developments and ongoing challenges. Lancet Diabetes Endocrinol. 2017, 5, 898–907. [Google Scholar] [CrossRef] [PubMed]
  3. International Osteoporosis Foundation. Epidemiology of Osteoporosis and Fragility Fractures; IOF: Nyon, Switzerland, 2021. [Google Scholar]
  4. Burge, R.; Dawson-Hughes, B.; Solomon, D.H.; Wong, J.B.; King, A.; Tosteson, A. Incidence and economic burden of osteoporosis-related fractures in the United States, 2005–2025. J. Bone Miner. Res. 2007, 22, 465–475. [Google Scholar] [CrossRef] [PubMed]
  5. Johnell, O.; Kanis, J.A. An estimate of the worldwide prevalence and disability associated with osteoporotic fractures. Osteoporos. Int. 2006, 17, 1726–1733. [Google Scholar] [CrossRef]
  6. World Health Organization. WHO Scientific Group on the Assessment of Osteoporosis at Primary Health Care Level; Summary Meeting Report; World Health Organization: Geneva, Switzerland, 2007. [Google Scholar]
  7. Tucci, J.R. Importance of early diagnosis and treatment of osteoporosis to prevent fractures. Am. J. Manag. Care 2006, 12, S181–S190. [Google Scholar]
  8. Schini, M.; Johansson, H.; Harvey, N.C.; Lorentzon, M.; Kanis, J.A.; McCloskey, E.V. An overview of the use of the fracture risk assessment tool (FRAX) in osteoporosis. J. Endocrinol. Investig. 2024, 47, 501–511. [Google Scholar] [CrossRef]
  9. Matsuzaki, M.; Pant, R.; Kulkarni, B.; Kinra, S. Comparison of bone mineral density between urban and rural areas: Systematic review and meta-analysis. PLoS ONE 2015, 10, e0132239. [Google Scholar] [CrossRef]
  10. Yen, T.Y.; Ho, C.S.; Chen, Y.P.; Pei, Y.C. Diagnostic accuracy of deep learning for the prediction of osteoporosis using plain X-rays: A systematic review and meta-analysis. Diagnostics 2024, 14, 207. [Google Scholar] [CrossRef]
  11. Hsieh, C.I.; Zheng, K.; Lin, C.; Mei, L.; Lu, L.; Li, W.; Chen, F.-P.; Wang, Y.; Zhou, X.; Wang, F.; et al. Automated bone mineral density prediction and fracture risk assessment using plain radiographs via deep learning. Nat. Commun. 2021, 12, 5472. [Google Scholar] [CrossRef]
  12. Wu, Q.; Nasoz, F.; Jung, J.; Bhattarai, B.; Han, M.V.; Greenes, R.A.; Saag, K.G. Machine learning approaches for the prediction of bone mineral density using genomic and phenotypic data. Sci. Rep. 2021, 11, 4482. [Google Scholar] [CrossRef]
  13. Sato, Y.; Yamamoto, N.; Inagaki, N.; Iesaki, Y.; Asamoto, T.; Suzuki, T.; Takahara, S. Deep learning for bone mineral density and T-score prediction from chest X-rays: A multicenter study. Biomedicines 2022, 10, 2323. [Google Scholar] [CrossRef] [PubMed]
  14. Kang, J.W.; Park, C.; Lee, D.-E.; Yoo, J.-H.; Kim, M. Prediction of bone mineral density in CT using deep learning with explainability. Front. Physiol. 2023, 13, 1061911. [Google Scholar] [CrossRef] [PubMed]
  15. Nema, A.A.; Siraskar, G.D.; Jagtap, A.; Gholap, P.; Wanjale, K.; Dharmadhikari, D.D.; Kurhade, A.S. Predictive modelling of bone mineral density: An ANN and regression-based approach. J. Sci. Ind. Res. 2025, 84, 862–870. [Google Scholar] [CrossRef]
  16. Iwao, Y.; Park, C.; Lee, D.-E.; Yoo, J.-H.; Kim, M. An exploratory study of explainable deep learning for predicting bone mineral density using clavicle features on chest radiographs. J. Appl. Clin. Med. Phys. 2025, 26, e70336. [Google Scholar] [CrossRef]
  17. Yoshida, A.; Sato, Y.; Kai, C.; Hirono, Y.; Sato, I.; Kasai, S. Utility of osteoporosis screening based on estimation of bone mineral density using bidirectional chest radiographs with deep learning models. Front. Med. 2025, 12, 1499670. [Google Scholar] [CrossRef]
  18. Nguyen, H.G.; Nguyen, D.-T.; Tran, T.S.; Ling, S.H.; Ho-Pham, L.T.; Van Nguyen, T. Artificial intelligence system for predicting areal bone mineral density from plain X-rays. Osteoporos. Int. 2025, 36, 2167–2176. [Google Scholar] [CrossRef]
  19. Panda, A.; Das, C.J.; Baruah, U. Imaging of vertebral fractures. Indian J. Endocrinol. Metab. 2014, 18, 295–303. [Google Scholar] [CrossRef]
  20. Blake, G.M.; Fogelman, I. Technical principles of dual-energy X-ray absorptiometry. Semin. Nucl. Med. 1997, 27, 210–228. [Google Scholar] [CrossRef]
  21. Shepherd, J.A.; Schousboe, J.T.; Broy, S.B.; Engelke, K.; Leslie, W.D. Executive summary of the 2015 ISCD Position Development Conference on advanced measures from DXA and QCT. J. Clin. Densitom. 2015, 18, 274–286. [Google Scholar] [CrossRef]
  22. Link, T.M. Radiology of osteoporosis. Can. Assoc. Radiol. J. 2016, 67, 28–40. [Google Scholar] [CrossRef]
  23. Kavitha, M.S.; An, S.-Y.; An, C.-H.; Huh, K.-H.; Yi, W.-J.; Heo, M.-S.; Lee, S.-S.; Choi, S.-C. Texture analysis of mandibular cortical bone on digital panoramic radiographs for the diagnosis of osteoporosis. Oral Surg. Oral Med. Oral Pathol. Oral Radiol. 2015, 119, 346–356. [Google Scholar] [CrossRef] [PubMed]
  24. Moro, T.; Yoshimura, N.; Saito, T.; Oka, H.; Muraki, S.; Iidaka, T.; Tanaka, T.; Ono, K.; Ishikura, H.; Wada, N.; et al. Development of artificial intelligence-assisted lumbar and femoral BMD estimation system using anteroposterior lumbar X-ray images. J. Orthop. Res. 2025, 43, 1619–1631. [Google Scholar] [CrossRef] [PubMed]
  25. Mayerhoefer, M.E.; Materka, A.; Langs, G.; Häggström, I.; Szczypiński, P.; Gibbs, P.; Cook, G. Introduction to radiomics. J. Nucl. Med. 2020, 61, 488–495. [Google Scholar] [CrossRef] [PubMed]
  26. Berenguer, R.; del Rosario Pastor-Juan, M.; Canales-Vazquez, J.; Castro-García, M.; Villas, M.V.; Masilla Legorburo, F.; Sabater, S. Radiomics of CT features may be nonreproducible and redundant. Radiology 2018, 288, 407–415. [Google Scholar] [CrossRef]
  27. Moore, A.; Bell, M. XGBoost, a novel explainable AI technique in myocardial infarction prediction. Clin. Med. Insights Cardiol. 2022, 16, 11795468221133611. [Google Scholar] [CrossRef]
  28. Lai, L.-H.; Lin, Y.-L.; Liu, Y.-H.; Lai, J.-P.; Yang, W.-C.; Hou, H.-P.; Pai, P.-F. The use of machine learning models with Optuna in disease prediction. Electronics 2024, 13, 4775. [Google Scholar] [CrossRef]
  29. Zhang, B.; Yu, K.; Ning, Z.; Wang, K.; Dong, Y.; Liu, X.; Liu, S.; Wang, J.; Zhu, C.; Yu, Q.; et al. Deep learning of lumbar spine X-ray for osteopenia and osteoporosis screening: A multicenter retrospective cohort study. Bone 2020, 140, 115561. [Google Scholar] [CrossRef]
  30. Lin, C.; Tsai, D.J.; Wang, C.C.; Chao, Y.P.; Huang, J.W.; Lin, C.S.; Fang, W.H. Osteoporotic precise screening using chest radiography and artificial neural network: The OPSCAN randomized controlled trial. Radiology 2024, 311, e231. [Google Scholar] [CrossRef]
  31. Fornacon-Wood, I.; Faivre-Finn, C.; O’cOnnor, J.P.; Price, G.J. Radiomics as a personalized medicine tool in lung cancer: Separating the hope from the hype. Lung Cancer 2020, 146, 197–208. [Google Scholar] [CrossRef]
  32. Mackin, D.; Fave, X.B.; Zhang, L.; Fried, D.B.; Yang, J.; Taylor, B.; Rodriguez-Rivera, E.; Dodge, C.; Jones, A.K.; Court, L. Measuring computed tomography scanner variability of radiomics features. Investig. Radiol. 2015, 50, 757–765. [Google Scholar] [CrossRef]
  33. Shafiq-Ul-Hassan, M.; Zhang, G.G.; Latifi, K.; Ullah, G.; Hunt, D.C.; Balagurunathan, Y.; Abdalah, M.A.; Schabath, M.B.; Goldgof, D.G.; Mackin, D.; et al. Intrinsic dependencies of CT radiomic features on voxel size and number of gray levels. Med. Phys. 2017, 44, 1050–1062. [Google Scholar] [CrossRef]
  34. Slart, R.H.; Punda, M.; Ali, D.S.; Bazzocchi, A.; Bock, O.; Camacho, P.; Carey, J.J.; Colquhoun, A.; Compston, J.; Engelke, K.; et al. Updated practice guideline for dual-energy X-ray absorptiometry (DXA). Eur. J. Nucl. Med. Mol. Imaging 2025, 52, 2. [Google Scholar] [CrossRef]
  35. ISO 14155:2020; Clinical Investigation of Medical Devices for Human Subjects—Good Clinical Practice. ISO: Geneva, Switzerland, 2020.
Figure 1. Workflow of AI-based BMD prediction system development.
Ai 07 00079 g001
Figure 2. Lumbar spine radiograph with segmented masks of vertebrae L1–L4.
Ai 07 00079 g002
Figure 3. Illustrated example of cropped polygonal masks for the regions of interest in L1–L4.
Ai 07 00079 g003
Figure 4. A severe vertebral fracture (grade 3) of the L4 vertebra was excluded from the study. Lumbar vertebrae L1, L2, and L3 were retained.
Ai 07 00079 g004
Figure 5. Histogram of BMD.
Ai 07 00079 g005
Figure 6. Training and validation loss curves for segmentation model over 300 epochs.
Ai 07 00079 g006
Figure 7. Correlation between AI-predicted BMD and DXA-measured BMD.
Ai 07 00079 g007
Figure 8. Bland–Altman plot for AI-predicted BMD and DXA-measured BMD.
Ai 07 00079 g008
Figure 9. Distribution of MAPE across 1000 bootstrap iterations for the prediction model.
Ai 07 00079 g009
Figure 10. Examples of high-error predictions with analysis of contributing factors.
Ai 07 00079 g010
Figure 11. Radiographs of three example cases. (a): Lumbar spine radiograph of Case 1. (b): Hip radiograph showing pathological fracture of the left hip (Case 2). (c): Lumbar spine radiograph of Case 2. (d): Lumbar spine radiograph of Case 3 from 2020. (e): Lumbar spine radiograph of Case 3 from 2024.
Ai 07 00079 g011
Table 1. Comparative analysis of prior AI-based BMD estimation studies.
Authors (Year)Input/
Image Modality
Approach/
AI Algorithm
Performance Evaluation
Hsieh et al. (2021) [11]pelvic X-ray and spine X-rayconvolutional neural network, graph convolutional network r = 0.90, r2 = 0.81, RMSE = 0.081
(internal + external validations)
Wu et al. (2021) [12]genomic and phenotypic datagradient boosting, random forest, artificial neural network MSE = 0.04, MAE = 0.15
(internal validation)
Sato et al. (2022) [13]chest X-ray
(multicenter study)
convolutional neural network r = 0.63, r2 = 0.40, MAE = 0.12
(internal validation)
Kang et al. (2023) [14]CTconvolutional neural network r = 0.905, MAPE = 5.66
(internal validation)
Nema et al. (2025) [15]clinical dataartificial neural network r2 = 0.8823, MSE = 0.00188
(internal validation)
Iwao et al. (2025) [16]chest X-ray (Clavicle area)convolutional neural network r = 0.769, MAE = 0.092
(internal validation)
Yoshida et al. (2025) [17]bidirectional chest X-ray convolutional neural network r = 0.766, MAPE = 10.6
(internal validation)
Nguyen et al. (2025) [18]X-ray (frontal pelvis and lateral spine)ensemble deep neural networks r = 0.87, MAE = 0.05
(internal validation)
Table 2. Demographic and clinical characteristics of the study population.
age, years64.60 ± 10.21
age group
40–49209 (7.27%)
50–59668 (33.43%)
60+1998 (59%)
weight, kg56.58 ± 10.33
height, cm153.72 ± 6.41
BMI, kg/m224.08 ± 10.54
BMI category 1
underweight185 (6.44%)
normal1665 (57.91%)
overweight817 (28.42%)
obese208 (7.23%)
BMD, g/cm20.96 ± 0.18
T-score category 2
 Normal1186 (41.25%)
 Osteopenia1143 (39.75%)
 Osteoporosis546 (19.00%)
1 Body Mass Index (BMI) and T-score categories were classified according to the World Health Organization (WHO) criteria. Individuals with a BMI less than 18.5 were categorized as underweight, those with a BMI between 18.5 and less than 25 were considered normal weight, those with a BMI between 25 and less than 30 were classified as overweight, and individuals with a BMI of 30 or greater were considered obese. 2 T-score categories were defined as follows: a T-score of −1.0 or higher was considered normal, a T-score between −1.0 and −2.5 indicated osteopenia, and a T-score of −2.5 or lower was classified as osteoporosis.
Table 3. Image Acquisition Parameters.
Internal cohort
(Srinagarind Hospital)
External cohort
(Phramongkutklao Hospital)
X-ray systemSamsung GC85ACarestream VX3733-SYS
detector typeDigital radiography (DR)Digital radiography (DR)
tube voltage75–85 kVp90–120 kVp
tube current-time product20–40 mAs2–5 mAs
source-to-image distance110–120 cm100–130 cm
field of view35 × 43 cm35 × 43 cm or 43 × 43 cm
Table 4. Comparison of radiomics feature stability across image formats (DICOM vs. JPEG) using ICC values.
Radiomics Feature CategoryICC (Mean [95% CI])
first-order statistics 0.94 [0.91–0.97]
shape-based features (2D)0.99 [0.98–1.00]
gray level co-occurrence matrix (GLCM)0.96 [0.94–0.98]
gray level run length matrix (GLRLM)0.95 [0.93–0.97]
gray level size zone matrix (GLSZM)0.93 [0.91–0.95]
gray level dependence matrix (GLDM)0.94 [0.92–0.96]
overall 0.95 [0.93–0.97]
Table 5. Hyperparameter setting for XGBoost Model.
learning rate0.05611763060831174
number of estimators2954
maximum depth34
subsample0.6789740666210001
the fraction of features (columns)
to be randomly sampled for each tree
0.5893331708339755
gamma0.0020750123433471808
L1 regularization term on weights0.21793818448493946
L2 regularization term on weights0.32180351712510646
Table 6. Evaluation of automated lumbar vertebrae segmentation.
DatasetIoUDSC
internal (full augmentation)0.8960.943
internal (minimal augmentation)0.8470.911
external (full augmentation)0.8090.884
external (minimal augmentation)0.7890.823
Table 7. Feature selection results across multiple methods.
CorrelationMutual Information
wavelet-LL_firstorder_InterquartileRangewavelet-LL_firstorder_RobustMeanAbsoluteDeviation
original_firstorder_InterquartileRangewavelet-LL_glcm_Correlation
wavelet-LL_firstorder_RobustMeanAbsoluteDeviationwavelet-LL_glcm_Imc2
original_firstorder_RobustMeanAbsoluteDeviationoriginal_firstorder_InterquartileRange
wavelet-LL_firstorder_MeanAbsoluteDeviationoriginal_glcm_Correlation
original_firstorder_MeanAbsoluteDeviationoriginal_glcm_Idn
wavelet-LL_glrlm_RunEntropywavelet-LL_glcm_Imc1
wavelet-LL_glcm_ClusterTendencywavelet-LL_firstorder_InterquartileRange
wavelet-LL_gldm_GrayLevelVariancewavelet-LL_glcm_Autocorrelation
wavelet-LL_firstorder_Variancewavelet-LL_glrlm_HighGrayLevelRunEmphasis
PCALASSO
wavelet-HH_glrlm_RunEntropywavelet-LL_glcm_DifferenceEntropy
wavelet-HH_gldm_DependenceEntropywavelet-LL_ngtdm_Complexity
wavelet-LH_glcm_JointEntropywavelet-LL_glcm_Imc1
original_gldm_DependenceNonUniformityNormalizedwavelet-LL_gldm_LargeDependenceHighGrayLevelEmphasis
wavelet-LH_glcm_DifferenceEntropywavelet-LL_glszm_HighGrayLevelZoneEmphasis
wavelet-HH_glcm_MaximumProbabilityoriginal_glszm_GrayLevelVariance
wavelet-LH_glszm_ZonePercentagewavelet-LL_glcm_Contrast
wavelet-LH_firstorder_Entropywavelet-LL_ngtdm_Coarseness
wavelet-LH_glcm_Idoriginal_glcm_MaximumProbability
wavelet-LH_glcm_Idmwavelet-LL_glcm_Idmn
Table 8. Multi-class confusion matrix showing the diagnostic performance across normal, osteopenia, and osteoporosis categories (total vertebrae = 10,612).
Actual\PredictedNormalOsteopeniaOsteoporosisTotal (Actual)
normal4183185264394
osteopenia24134221783841
osteoporosis2124321132377
total (predicted)44453850231710,612
overall accuracy0.924
Table 9. Class-wise performance metrics.
ClassPrecisionRecall F1-ScoreSupport
normal0.9410.9520.9464394
osteopenia0.8870.8910.8893841
osteoporosis0.9130.8890.9012377
macro average0.9140.9110.91010,612
Table 10. Predictive performance metrics for AI-based BMD estimation across individual lumbar vertebrae and averaged L1–L4 values. Pearson r indicates correlation between predicted and DXA-measured BMD. RMSE quantifies absolute error in g/cm2. MAPE expresses percentage error. All metrics evaluated on internal test set (1592 vertebrae).
Regression Metrics
Pearson (r) [95% CI]RMSE (g/cm2) [95% CI]MAPE (%) [95% CI]
L1–L40.94 [0.92, 0.96]0.07 [0.06, 0.08]6.15 [5.54, 6.76]
L10.96 [0.94, 0.98]0.06 [0.05, 0.07]6.01 [5.40, 6.62]
L20.95 [0.93, 0.97]0.05 [0.04, 0.06]5.36 [4.82, 5.90]
L30.93 [0.90, 0.96]0.08 [0.06, 0.10]6.32 [5.68, 6.96]
L40.93 [0.90, 0.96]0.09 [0.07, 0.11]6.91 [6.22, 7.60]
Table 11. Error stratification using MAPE across normal, osteopenia, and osteoporosis groups.
Sample SizeMAPE (%) [95% CI]
normal6594.20 [3.55, 4.85]
osteopenia5766.10 [5.25, 6.95]
osteoporosis3579.80 [8.45, 11.15]
Table 12. Sensitivity analysis of radiomics features on prediction model performance (training with only clinical and radiomics features).
Radiomics Feature Set ConfigurationTotal Radiomics FeaturesMAPE (%)
top 1 from each of the 4 methods413.18
top 2 from each of the 4 methods812.23
top 3 from each of the 4 methods1212.21
Table 13. Ablation study results of the proposed prediction model.
Regression Metrics
Pearson (r)RMSE (g/cm2)MAPE (%)
baseline (age + BMI)0.330.2018.01
clinical features only0.660.1614.15
clinical + positional feature0.720.1412.96
clinical + radiomics features0.730.1412.23
clinical + classification feature0.780.1211.50
clinical + positional + radiomics feature0.880.18.41
full model (proposed)0.940.076.15
Table 14. Predictive performance of AI-Based BMD estimation: external test set from Phramongkutklao Hospital.
Regression Metrics
Pearson (r) [95% CI]RMSE (g/cm2) [95% CI]MAPE (%) [95% CI]
L1–L40.89 [0.86, 0.92]0.08 [0.07, 0.09]6.44 [5.80, 7.08]
L10.87 [0.83, 0.91]0.08 [0.06, 0.10]6.43 [5.72, 7.14]
L20.88 [0.84, 0.92]0.05 [0.04, 0.06]4.35 [3.90, 4.80]
L30.92 [0.89, 0.95]0.09 [0.07, 0.11]9.24 [8.15, 10.33]
L40.91 [0.88, 0.94]0.06 [0.05, 0.07]5.76 [5.12, 6.40]
Table 15. BMD results and AI predicted values for the first example case.
DXA-Measured ValuesAI Predicted Values
L1 (g/cm2)0.7090.696
L2 (g/cm2)0.7420.740
L3 (g/cm2)0.7640.834
L4 (g/cm2)0.7810.836
L1–L4 (g/cm2)0.7500.776
T score L1–L4−3.0−2.8
Table 16. BMD results and AI predicted values for the second example case.
DXA-Measured ValuesAI Predicted Values
L1 (g/cm2)0.6170.682
L2 (g/cm2)0.6780.757
L3 (g/cm2)0.8370.761
L4 (g/cm2)1.0090.881
L1–L4 (g/cm2)0.8080.770
T score L1–L4−2.5−2.8
Table 17. BMD Results and AI-Predicted Values for the Third Example Case (Data from 2022 and Follow-Up in 2024).
2020 2024
DXA-Measured ValuesAI Predicted ValuesDXA-Measured ValuesAI Predicted Values
L10.6460.6790.7720.865
L30.8200.8560.8920.924
L40.7870.8350.8800.964
L1–L3–L40.7510.790
(error 5.19%)
0.8480.917
(error 8.13%)
T score
L1–L3–L4
−3.0−2.7−2.1−1.7
Delta 2024–2020
(change vs. previous)
0.0970.127
Disclaimer/Publisher’s Note: The statements, opinions and data contained in all publications are solely those of the individual author(s) and contributor(s) and not of MDPI and/or the editor(s). MDPI and/or the editor(s) disclaim responsibility for any injury to people or property resulting from any ideas, methods, instructions or products referred to in the content.