Article

Noise Mitigation in Quantum-Enhanced Fiber Optic Gyroscopes

Naval Information Warfare Center Pacific, San Diego, CA 92152, USA
*
Author to whom correspondence should be addressed.
Quantum Rep. 2026, 8(2), 43; https://doi.org/10.3390/quantum8020043
Submission received: 27 March 2026 / Revised: 24 April 2026 / Accepted: 26 April 2026 / Published: 1 May 2026

Abstract

We analyze noise in a quantum-enhanced fiber optic gyroscope (FOG), focusing on one of the leading sources of phase uncertainty—uncorrelated photon saturation. Taking a squeezed state input as a source for N00N states, we compute the uncorrelated false coincidence counts at the optimal phase bias and determine an upper limit to the squeezed amplitude ξ which allows for sub-shot noise precision. As examples, we apply parameters of present-day quantum FOG experiments and determine the maximum possible precision enhancement based on their respective ξ and optimal phase bias points. With the aim of supporting future FOG setups with higher N00N state fluxes, our result highlights the need to transition to multimode states to bypass the ξ limitation, such as photon pairs generated by the dynamical Casimir effect.

1. Introduction

The super-resolution of entangled photonic N00N states [1] offers an improved phase sensitivity over classical optical instruments. Originally posed as a photonic analogy to the de Broglie wavelength [2], in which the effective wavelength governing interference is reduced by the entangled photon order, the N00N state interference exhibits resolutions which are inaccessible from the classical lens. A notable example is the photon deposition resolution exploited for lithography [3].
Our focus is the fiber optic gyroscope (FOG) [4,5]. Building upon approaches to a quantum-enhanced Sagnac interferometer [6,7], recent experiments applied polarization and path-entangled N = 2 photon order N00N states to FOGs, demonstrating the sought-after Sagnac phase super-resolution. The enhanced resolution permits sub-shot noise precision, which improves with the entangled photon number.
Sub-shot noise precision means that quantum FOGs surpass their classical counterparts when operating at the same photon flux. However, there remains a sizable gap between the quantum and classical FOG fluxes (MHz vs. 10 13 /s). Among the obstacles that prevent higher flux N = 2 N00N states from being reached is the saturation of the signal with uncorrelated photons. Alternatively, higher N > 2 N00N state orders as high as N = 6 [8,9] have been accomplished, although here too there remains the complication of low fluxes in such post-selected combinations of quantum and classical light.
In this work, we analyze the noise arising from uncorrelated photon saturation, extracting a nontrivial dependence on the squeezed amplitude. This allows us to improve the phase uncertainty estimation and refine the optimal domains of phase bias for which sub-shot noise precision is possible.
We give a brief overview of the N00N state FOG in Section 2. In Section 3.1, we look at the phase uncertainty and insert a squeezed state to determine false coincidence counts and the resulting upper limit to the squeezed amplitude in Section 3.2. In Section 3.3, we apply the parameters of today’s experimental quantum FOGs [10,11]. As an outlook, we discuss an upcoming quantum FOG experiment, along with prospects for higher-order and flux photonic N00N states.

2. Sub-Shot Noise Resolution

We recall the Sagnac–Laue phase phase acquired between two counter-propagating beams in a fiber coil [5]
ϕ SL = 4 π Ω L r λ c ,
with L representing fiber length, r representing the coil radius, and Ω representing the angular velocity. Classical FOG measurements of Equation (1) are limited to (Poissonian) shot noise precision
Δ ϕ SN = 1 / M ,
where M is the number of photons measured.
Recently, a polarization-entangled N00N state FOG experiment surpassed the shot noise limit by exploiting photon-number dependent phase resolution [10]:
ψ N 00 N = 1 2 ( N 0 e i N ( ϕ SL + ϕ bias ) 0 N ) .
The photon order N enhancement of the Sagnac phase sensitivity enters the coincidence count as [10,11]
M cc ( ϕ SL + ϕ bias ) = M N 00 N 2 1 + cos ( N ( ϕ SL + ϕ bias ) ) ,
where M cc is the number of coincident counts and M N 00 N is the number of N00N state pairs delivered to detectors within a time window to be specified below. Throughout this work, total photon number M and coincidence counts M cc and M N 00 N label unitless quantities i.e., flux times measurement time.
The N N00N state order gives an effective enhancement to the total photon number which reduces the shot noise phase uncertainty:
Δ ϕ QM = Δ ϕ SN / N = 1 / N M ,
where ‘QM’ labels the quantum-enhanced shot noise resolution. Equation (5) possesses a factor N smaller phase uncertainty compared to the classical case Equation (2).
Considering the angular velocity at which the phase uncertainty is equal to the Sagnac phase: Ω min = Ω ( ϕ SL = Δ ϕ QM ) is
Ω min = λ c 4 π L r N M .
This sets an order of magnitude regime for the lower limits to angular rotation sensitivity. Taking for example a 1 km fiber loop with 40 cm radius, a wavelength of λ = 1550 nm, M = 10 6 photons measured in a given time interval, and an N = 2 order N00N state, we have Ω min = 6.5 × 10 5 rad/s. It is in this low-intensity regime that the N00N state enhancement makes a decisive difference—we recall e.g., Earth’s rotation rate of 7.29 × 10 5 rad/s. Transitioning to higher intensities however requires that we revisit noise sources—in the next section we look at uncorrelated photon signals.

3. Uncorrelated Photon Noise

3.1. Phase Uncertainty

We consider the uncertainty in a N00N state-enhanced phase measurement. As an addition to the variance in the desired signal coincidence counts in Equation (4), we have spurious coincidences due to uncorrelated photons which produce a Sagnac + bias phase-dependent uncertainty. From here on, we write ϕ SL , implicitly labeling the full phase including the bias ( ϕ SL + ϕ bias ) .
We consider an experiment run time t meas spanning many detection time windows ( τ detector ). The number of false counts scales with the probability P cc false of a single spurious count within τ detector :
M cc false = P cc false t meas τ detector ,
and similarly the signal N00N state pairs delivered
M N 00 N = P N 00 N t meas τ detector .
Combining the two, we have a spurious count which adds to Equation (4): M cc ( ϕ SL ) M cc ( ϕ SL ) + M cc false . The false count contribution can be extracted from the dark fringes ( N ϕ SL = ± π , ± 3 π , ) of coincidence count fitting functions and modeled by a limited visibility [10,11,12].
The object of interest is the deviation in the number of photons delivered during t meas , which was shown in [12] to produce a nontrivial optimization of the phase bias angle. The deviation combines the signal photons in Equation (4) and false coincidences: for P N 00 N , P cc false 1 ,
Δ M cc ( ϕ SL ) = M cc ( ϕ SL ) + M cc false .
Δ M cc can be recast as a phase uncertainty Δ ϕ c c accompanying the Sagnac–Laue phase in the coincidence count expression Equation (4):
Δ M cc ( ϕ SL ) = M cc ( ϕ SL + Δ ϕ c c ) M cc ( ϕ SL ) .
We solve for Δ ϕ c c exactly without expanding, as is usually done to first-order derivatives:
Δ ϕ c c = ± 1 N acos 2 Δ M cc M N 00 N + cos ( N ϕ SL ) + 2 π n N ϕ SL ,
where n = 0 , ± 1 , ± 2 , corresponds to the range N ϕ SL = [ ( 2 n 1 ) π , ( 2 n + 1 ) π ] . Accounting for symmetry, the Δ ϕ c c + solutions are positive valued and valid within N ϕ SL = [ ( 2 n 1 ) π , 2 n π ] , while Δ ϕ c c are negative and valid within N ϕ SL = [ 2 n π , ( 2 n + 1 ) π ] . We also note that Δ ϕ cc 2 provides the Fischer information [12].
We recall that Δ M cc describes the distribution of coincidence counts which one needs to average over. For completeness, we note that deviations in counts on the order of Δ M cc take on both signs. We thus consider absolute values Δ ϕ c c = | Δ ϕ c c | , accounting for the sgn ( Δ M cc ) dependence in Δ ϕ c c by using the sign which produces the larger noise contribution at the optimal bias point.
We evaluate phase uncertainty in the well-defined phase regions where Δ ϕ c c as defined in Equation (11) is real: | 2 Δ M cc M N 00 N + cos ( N ϕ SL ) | < 1 . Within the range ( 0 , π / N ) , this condition implies
ϕ max < ϕ SL < π / N ϕ min ,
where ϕ max is the offset from the maxima ( N ϕ SL = 2 π n ) and ϕ min from the minima ( N ϕ SL = π ( 2 n + 1 ) ) at which the phase uncertainty becomes well defined. For ϕ min 1 and ϕ max 1 , the nested solutions reduce to N ϕ min ( 1 / M N 00 N ) 4 M cc false + 1 + 1 and N ϕ max = 2 / M N 00 N . The undefined regions repeat periodically at the maxima ( | N ϕ SL 2 π n | < ϕ max ) and minima ( | N ϕ SL π ( 2 n + 1 ) | < ϕ min ) of the coincidence count expression Equation (4), corresponding to the divergent uncertainties in the first-order derivative expansion of Equation (10) ([12]). With an exact solution, however, a conveniently chosen fitting where the fringe visibility is slightly exaggerated can provide a well-defined phase uncertainty—we do not consider this here, since it comes at the cost of phase measurement precision.
The phase uncertainties near the divergent points are well above the shot noise limit. Near the minima, where uncorrelated counts M cc false provide the dominant contribution, Δ ϕ c c ( π / N ϕ min ) = ( 2 1 ) ϕ min . This is a substantially larger phase uncertainty than the shot noise Equation (2): ϕ min / ϕ SN = 2 / N ( M cc false ) 1 / 4 (unless N 2 , a point we return to in Appendix B). We are thus interested in the uncertainty at the optimal phase bias between the singular points, which we now determine as a function of squeezed amplitude and experimental parameters.

3.2. Squeezed State Input

Squeezed states are the prevalent source of N00N states in quantum sensing experiments. We focus here on N = 2 N00N state interferometry, evaluating the noise due to random in-phase false coincidence counts arising from 4 and higher photon number states generated in the down-conversion process. Extensions to N > 2 -order N00N states are discussed in Appendix B.
We consider for simplicity the squeezed vacuum state
ξ = e ( ξ * a ^ 2 ξ a ^ 2 ) / 2 0 = m = 0 ( 2 m ) ! 2 m m ! ( e i   arg ( ξ ) tanh | ξ | ) m cosh | ξ | 2 m ,
where the photon number probability
P 2 m ξ = | 2 m | ξ | 2 = ( 2 m ) ! ( 2 m m ! ) 2 ( tanh | ξ | ) 2 m cosh | ξ | ,
and the average photon number
n ¯ = ξ a ^ a ^ ξ = sinh 2 | ξ | .
Since today’s SPDC sources produce two-photon-state fluxes on the order of 10 6 pairs per second, we consider the regime where two-photon states dominate the SPDC output. The resulting average photon number is n ¯ 10 4 ( | ξ | 0.01 ) over a typical single-photon counter time resolution window of τ detector = O ( 100 ps ) , where we consider coherence times τ detector . Comparing the four-photon and two-photon probabilities,
P 4 ξ P 2 ξ = 3 4 tanh 2 | ξ | 7.5 × 10 5 ,
and similarly P 6 ξ / P 4 ξ = ( 5 / 6 ) tanh 2 | ξ | . Given that, in general, P 2 m ξ P 2 m + 2 ξ for this perturbative in the ξ regime, we focus on P 4 ξ and neglect P 6 ξ and higher orders.
The | 4 state produces predominantly spurious coincident counts with random phase at the detection. Due to loss, a negligible amount of four-photon N00N states with well-defined phase relations survive. The majority of loss occurs after the optical elements used to generate the N00N states, e.g., in the Sagnac interferometer, producing uncorrelated two- and three-photon states responsible for false coincidence counts. For a discussion of loss at earlier stages in the experiment, see Appendix C.
To estimate the false coincidence probability, we consider the four-photon state undergoing loss via beamsplitting with the vacuum environment. The probability of a two- or three-photon byproduct is
P cc false = 6 T 2 ( 1 T ) 2 + 4 T 3 ( 1 T ) P 4 ξ ,
where T labels the transmission coefficient. The two-photon contribution (the first term in parenthesis) dominates for a transmission of T 0.1 relevant to FOG setups. In comparison, we show the probability of the desired N = 2 N00N state reaching the detector scales with transmission squared:
P N 00 N = T 2 P 2 ξ .
Applying the above probabilities to Equations (7) and (8) gives the uncorrelated and signal coincidence counts.
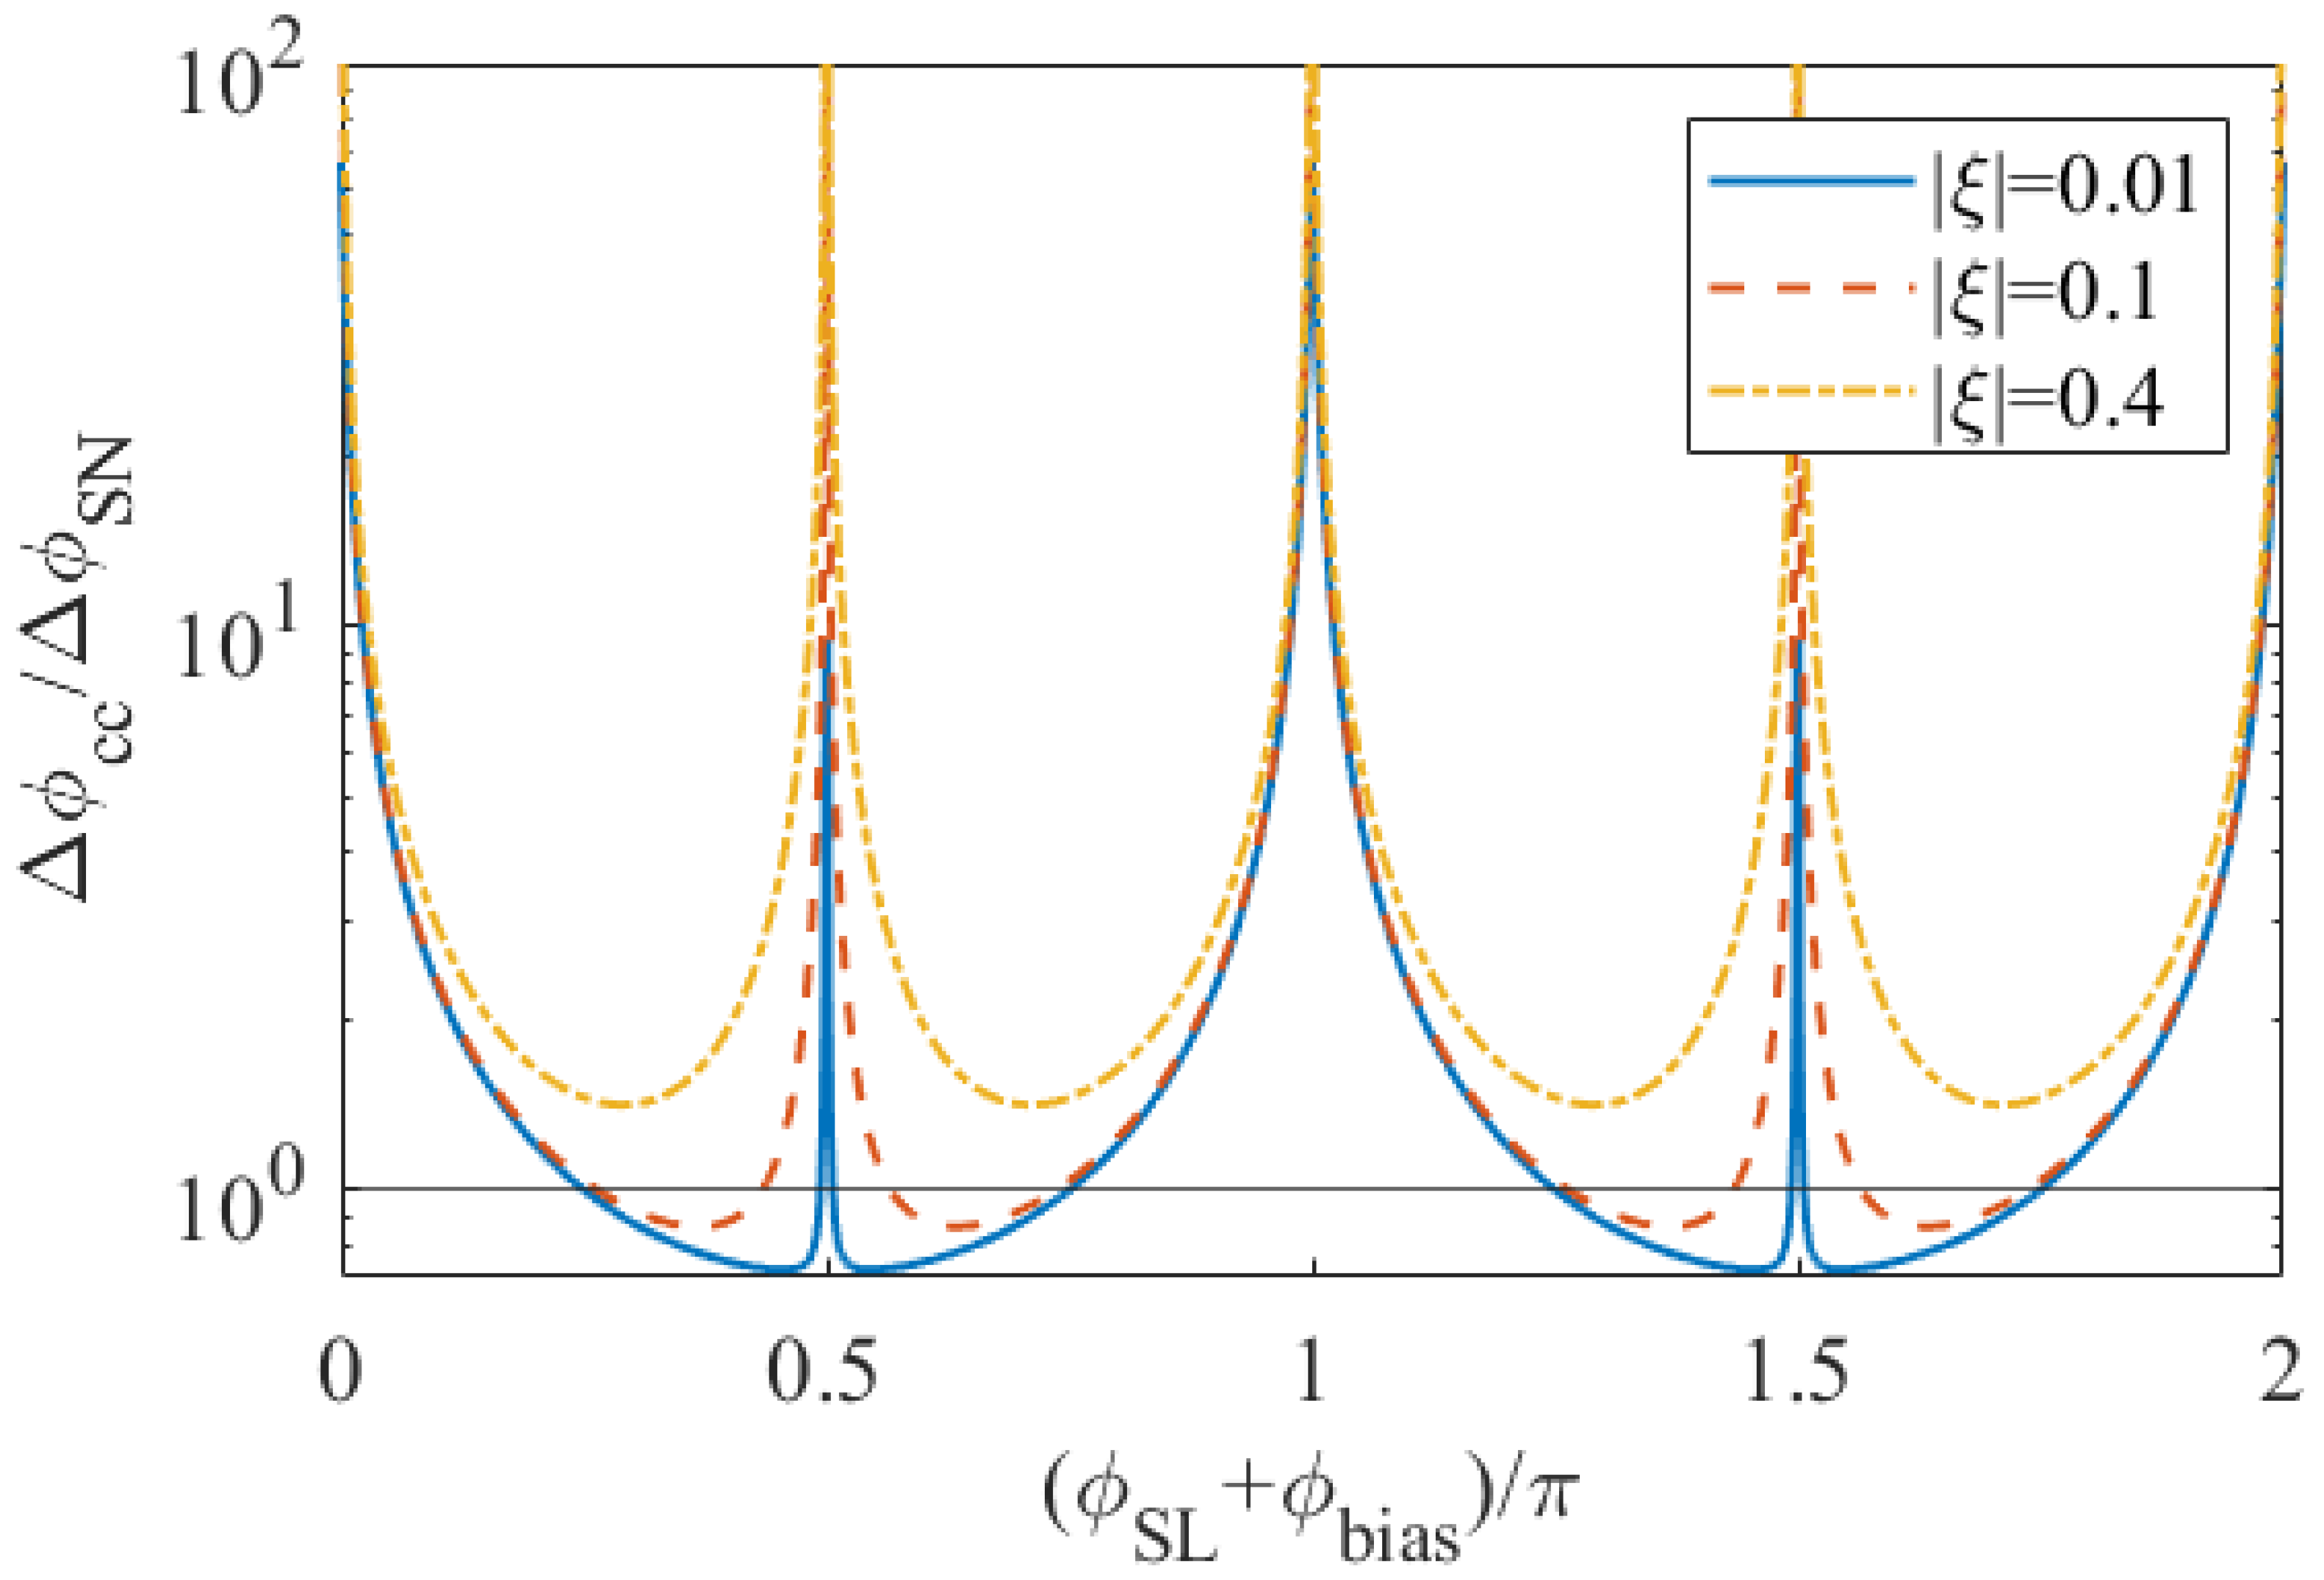
Following the steps in Section 3.1, we evaluate the phase uncertainty in Equation (11) for different squeezed amplitudes, transmission coefficients, and measurement times. We find in Figure 1 that the minimum uncertainties at the optimal phase bias points grow with the squeezed amplitude. Note that we consider transmission coefficients stemming from optical loss, and not single-photon detector quantum efficiencies, which we assume are large (e.g., >95%, as is the case in superconducting nanowires).
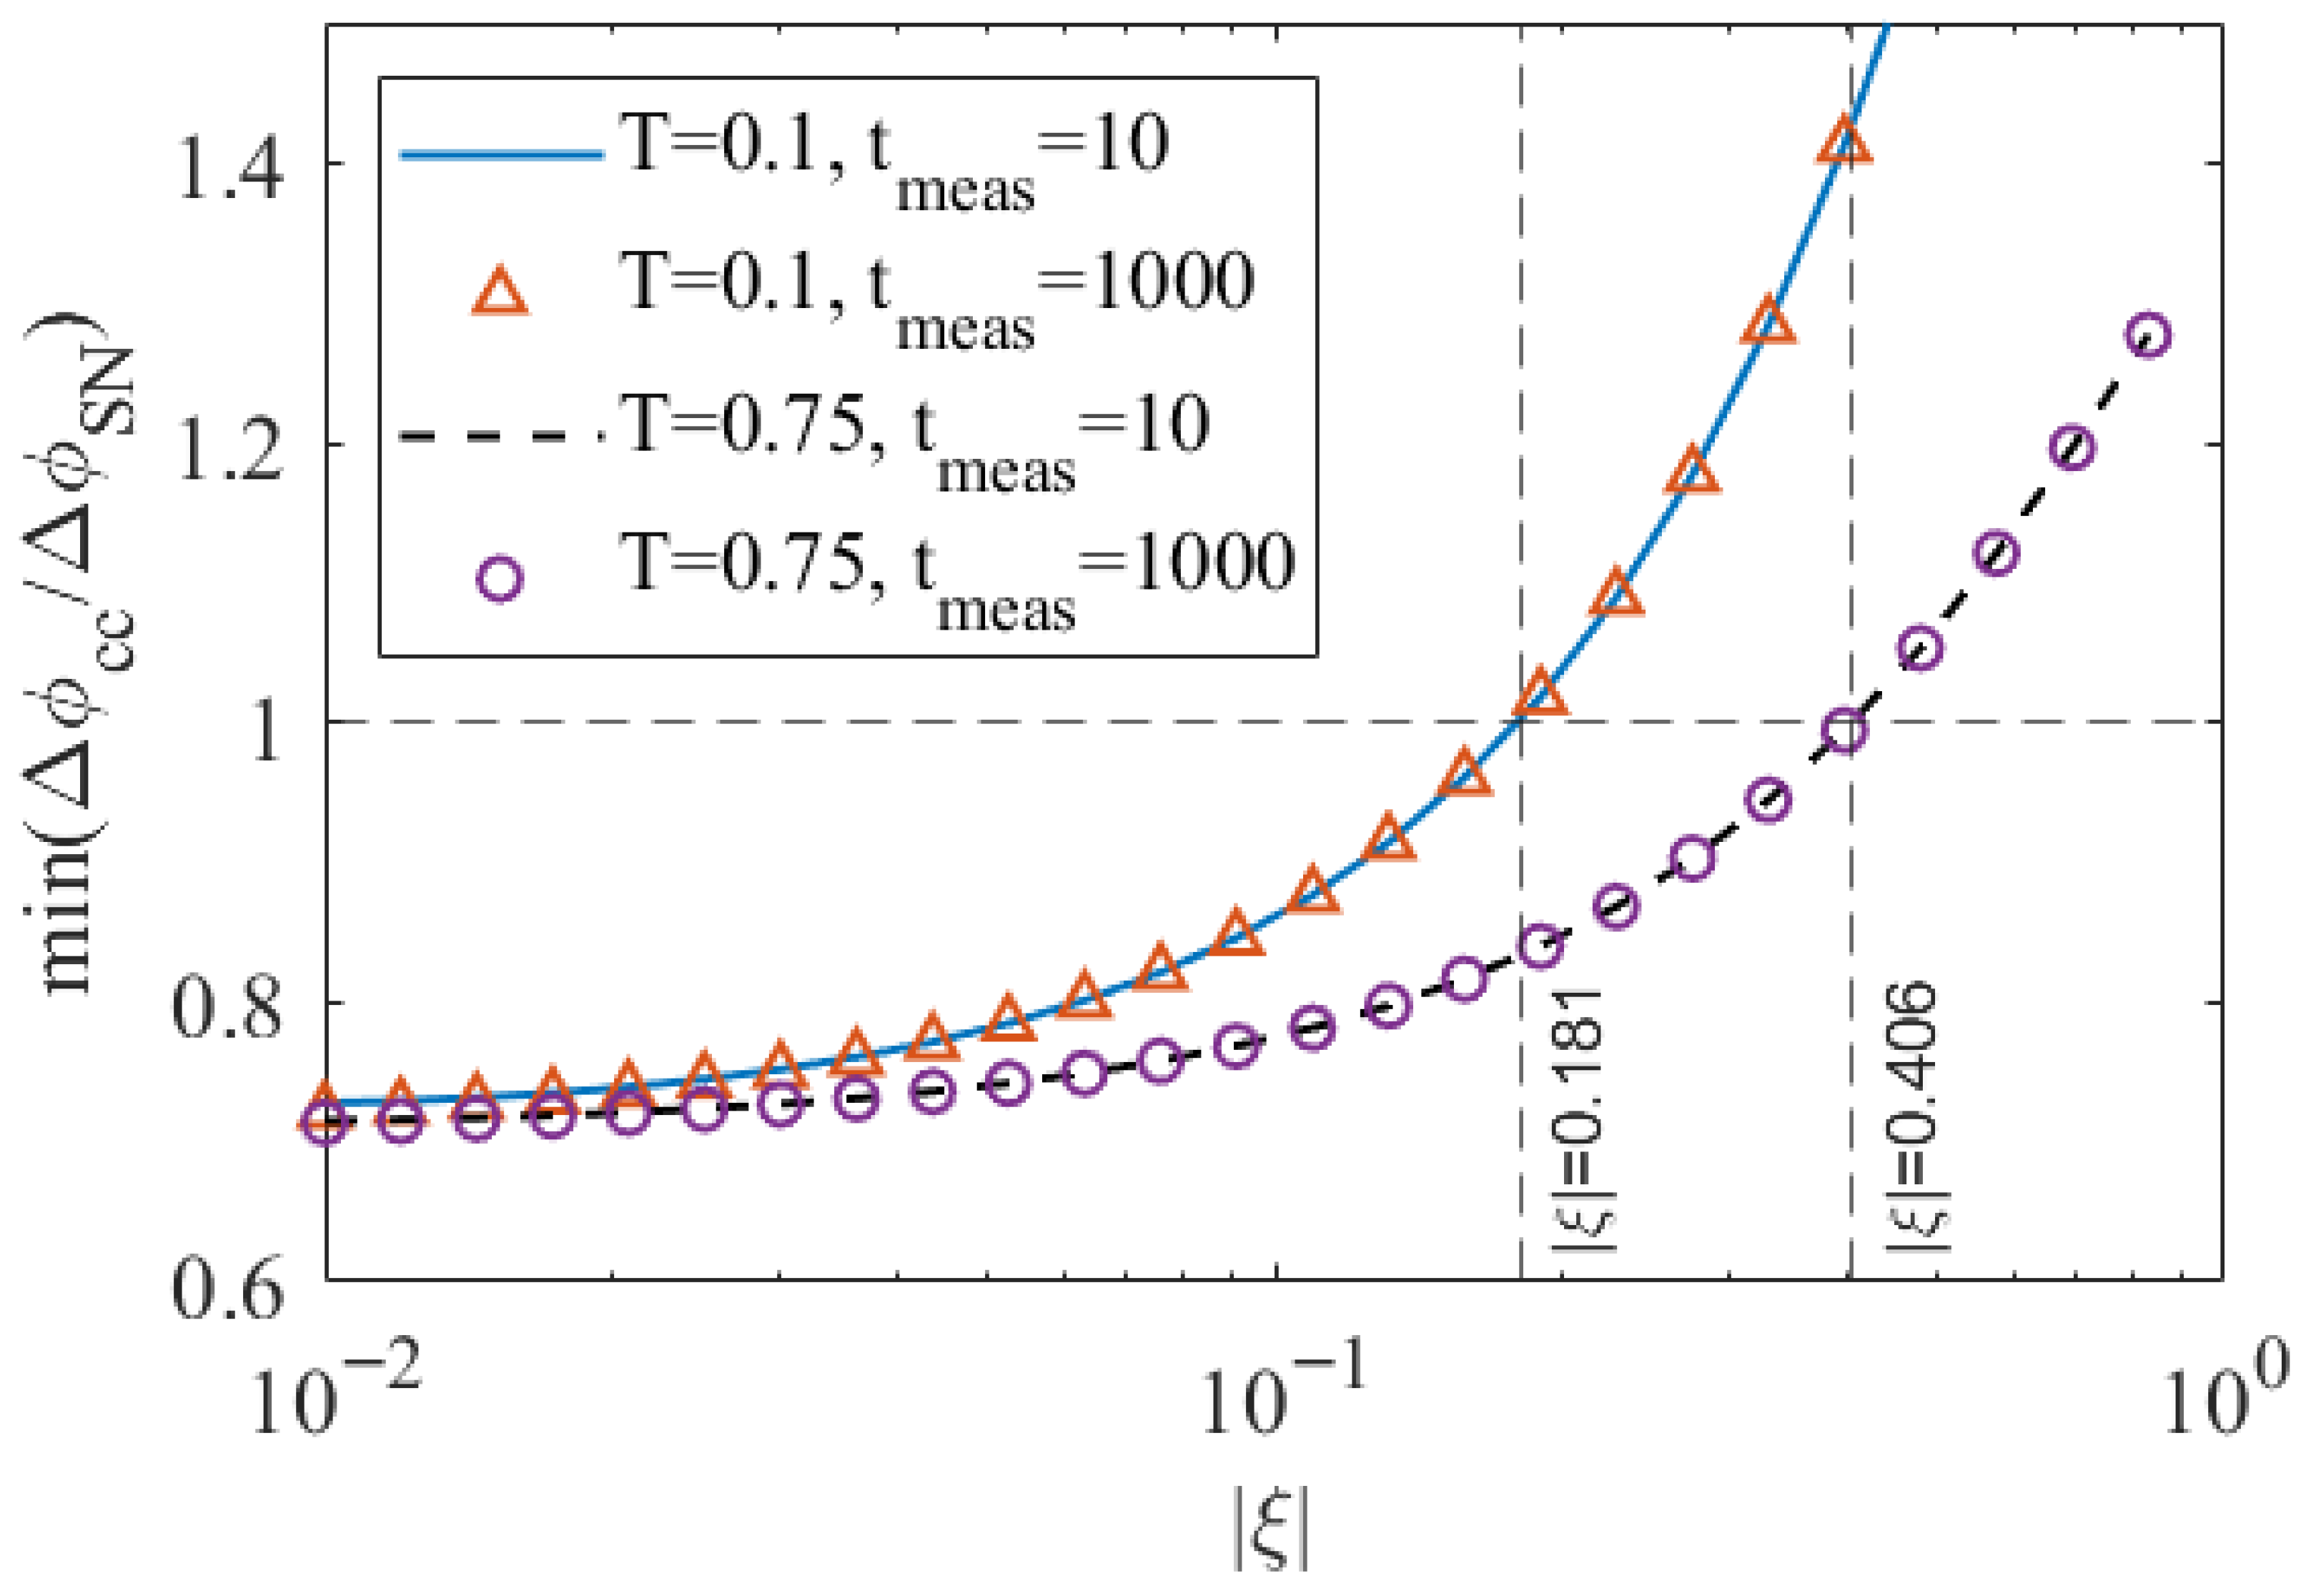
We find an upper limit to squeezed amplitude for which sub-shot noise precision is possible. To show this in more detail, we plot the minima in uncertainty as a function of | ξ | in Figure 2. This limit grows with transmission ( | ξ | = 0.181 at T = 0.1 , and | ξ | = 0.406 at T = 0.75 ), yet is largely independent of the measurement time and detection time window. Note that at larger transmissions we approach values of | ξ | , where higher photon number contributions (>4) to the false coincidence counts start to matter. These contributions further decrease the permissible | ξ | range, making this result a conservative noise saturation estimate. A similar estimate can be derived for coherent state setups which rely on post-selection schemes; see Appendix A.
As an alternative to solving for optimal bias points numerically as in the above examples, one may also obtain an analytic expression via perturbative expansion of Equation (11); see [12]. We plug Equations (4) and (9) into the phase uncertainty Δ ϕ c c 2 Δ M cc 2 ( ϕ SL ) / ( M cc ( ϕ SL ) ) 2 , and differentiate with respect to ϕ SL to find the minima: within ( 0 , π / N ) we have ϕ SL min N 1 acos ( B / 2 + B 2 / 4 1 ) , where B = 4 M cc false / M N 00 N + 2 . This is nearly identical to the numerical result at T = 0.1 , and accurate on the percent order at T = 0.75 .

3.3. Experimental Implications

We apply the above phase uncertainty considerations to recent quantum FOG experiments. We consider first the N = 2 N00N state FOG setup in [11], the first path entanglement-based FOG to resolve angular velocities below Earth’s rotation rate. This setup reported a transmission of T = 0.1 , 4000 N00N state coincidence counts per second amounting to M N 00 N = 7.2 × 10 6 over t meas = 1800 s, and a detector timing resolution τ detector = 156 ps.
Following the steps in Section 3, these experimental parameters amount to a squeezed amplitude of | ξ | = 0.011 . Applying the results of Figure 1, this is within the range of squeezed amplitudes for which sub-shot noise phase uncertainty is possible. Additional dark photon counts beyond the higher-photon-number sourced flux considered above (e.g., sub kHz count per second thermal background) produce a negligible number of false coincidence counts and are easily mitigated by edgepass or bandpass filters.
Recalling that phase super-resolution with a factor N = 2 enhancement was achieved in [11], sub-shot noise precision is also possible for these experimental parameters. We find Δ ϕ cc / Δ ϕ SN < 1 to be accessible within the (periodically repeating) range π / 4 < ϕ SL + ϕ bias < 0.493 π . At the optimal point ϕ SL + ϕ bias = 0.453 π , we have Δ ϕ cc / Δ ϕ SN = 0.723 , close to the ideal ( N = 2 N00N state-enhanced) shot noise reduction factor of 1 / 2 = 0.707 .
We turn to an earlier experiment [10] which pursued a similar N = 2 N00N state FOG measurement. Here, t meas = 20 ms data points were reported, each collecting 1956 photons, and a similar transmission of T 0.1 . We assume that we have the same 156 ps detection timing window as in the above example.
These experimental parameters give | ξ | = 0.039 , also within the range of squeezed state amplitude for which sub-shot noise precision is possible. In this case, Δ ϕ cc / Δ ϕ SN < 1 is accessible within π / 4 < ϕ SL + ϕ bias < 0.467 π . At the optimal point ϕ SL + ϕ bias = 0.403 π , we have Δ ϕ cc / Δ ϕ SN = 0.786 . Impressively, a factor 0.87 reduction in the shot noise was achieved in [10] at the optimal phase bias point, close to the smallest achievable uncertainty ratio of 0.786 at this | ξ | .

4. Conclusions

We have computed the N00N state-based phase measurement uncertainty as a function of an input squeezed state amplitude ξ . We found an upper limit to | ξ | allowing for sub-shot noise precision. The crucial component is the uncorrelated photon flux as a function of ξ —without this contribution, an optimal phase bias point and achievable precision cannot be established theoretically, potentially leading one to overestimate the accessible quantum enhancement to the shot noise resolution.
We applied this analysis to two recent N = 2 N00N state FOG experiments. In one case [10], we determined the minimum phase uncertainty to be larger than the expected (ideal) factor 2 shot noise reduction. We found this corrected form to be close to the measured sub-shot noise resolution achieved in [10]. In the second experiment [11], a similar bound to precision was obtained. Our result thus serves to refine the analysis of both prior and upcoming experimental measurements, allowing one to quantify the achievable sub-shot noise precision and select the suitable bias angle to exploit it.
We recall that the analysis here is based on the assumption that all loss byproducts of the higher (than 2) photon number states have uncorrelated phase, since most loss occurs after the N00N states are generated. However, a fraction of loss still occurs in between the SPDC squeezed state source and the N00N state generation, in which case some residual phase bias dependence may remain—this is discussed in Appendix C.
Our analysis will be applied to an upcoming quantum FOG experiment detailed in [13], building on the work of [10,11]. The projected 6.65 dB loss ( T = 0.216 , noting a typo in Table 3 of [13]), provides a competitive upper bound on | ξ | , allowing for sub-shot noise precision angular velocity measurements below Earth’s rotation rate.
In future experiments one will in principle need higher N = 2 N00N state fluxes than the bounds on the | ξ | permit for an SPDC source. A candidate for bypassing this limit is a multi-mode squeezed state [14]. Overcoming system complexity, e.g., due to coupling losses with multiple fibers, the continuous variable entanglement over multiple spatial modes can reduce shot noise beyond the 2 enhancement via N = 2 N00N states.
One may also consider the dynamical Casimir effect [15,16]. In this case the 4-photon and higher order states, which are otherwise detrimental in the SPDC-based setup, possess frequencies which sum to the medium modulation rate (or mechanical motion frequency). The resulting false coincidences can be easily filtered out, since there is negligible overlap with the two-photon sector frequencies. Overcoming the challenge of achieving high photon pair fluxes in the optical or infrared domain at room temperature, a path to quantum advantage is possible.

Author Contributions

Conceptualization, S.E. and J.N.P.; methodology, S.E. and J.N.P.; formal analysis, S.E. and J.N.P.; writing—original draft preparation, S.E. and J.N.P.; writing—review and editing, S.E. and J.N.P. All authors have read and agreed to the published version of the manuscript.

Funding

This work was supported by the Naval Information Warfare Center Pacific In-house Innovation Program.

Data Availability Statement

The original contributions presented in this study are included in the article. Further inquiries can be directed to the corresponding author.

Conflicts of Interest

The authors declare no conflicts of interest.

Appendix A. Coherent State Input

The squeezed state analysis in Section 3.2 can also be applied to a coherent state—in this case, N00N states are extracted via post-selection [17]. The average photon number α a ^ a ^ α = | α | 2 and the Poisson distribution of photon number probabilities
P n α = | n | α | 2 = e | α | 2 | α | 2 n n ! .
We consider N = 2 N00N state phase measurements in the perturbative in the | α | regime. Here, the dominant contribution to uncorrelated coincidence counts is the three-photon state which undergoes loss of one photon. The resulting false count probability
P cc false = 3 T 2 ( 1 T ) P 3 α ,
while the N = 2 N00N state probability follows Equation (18).
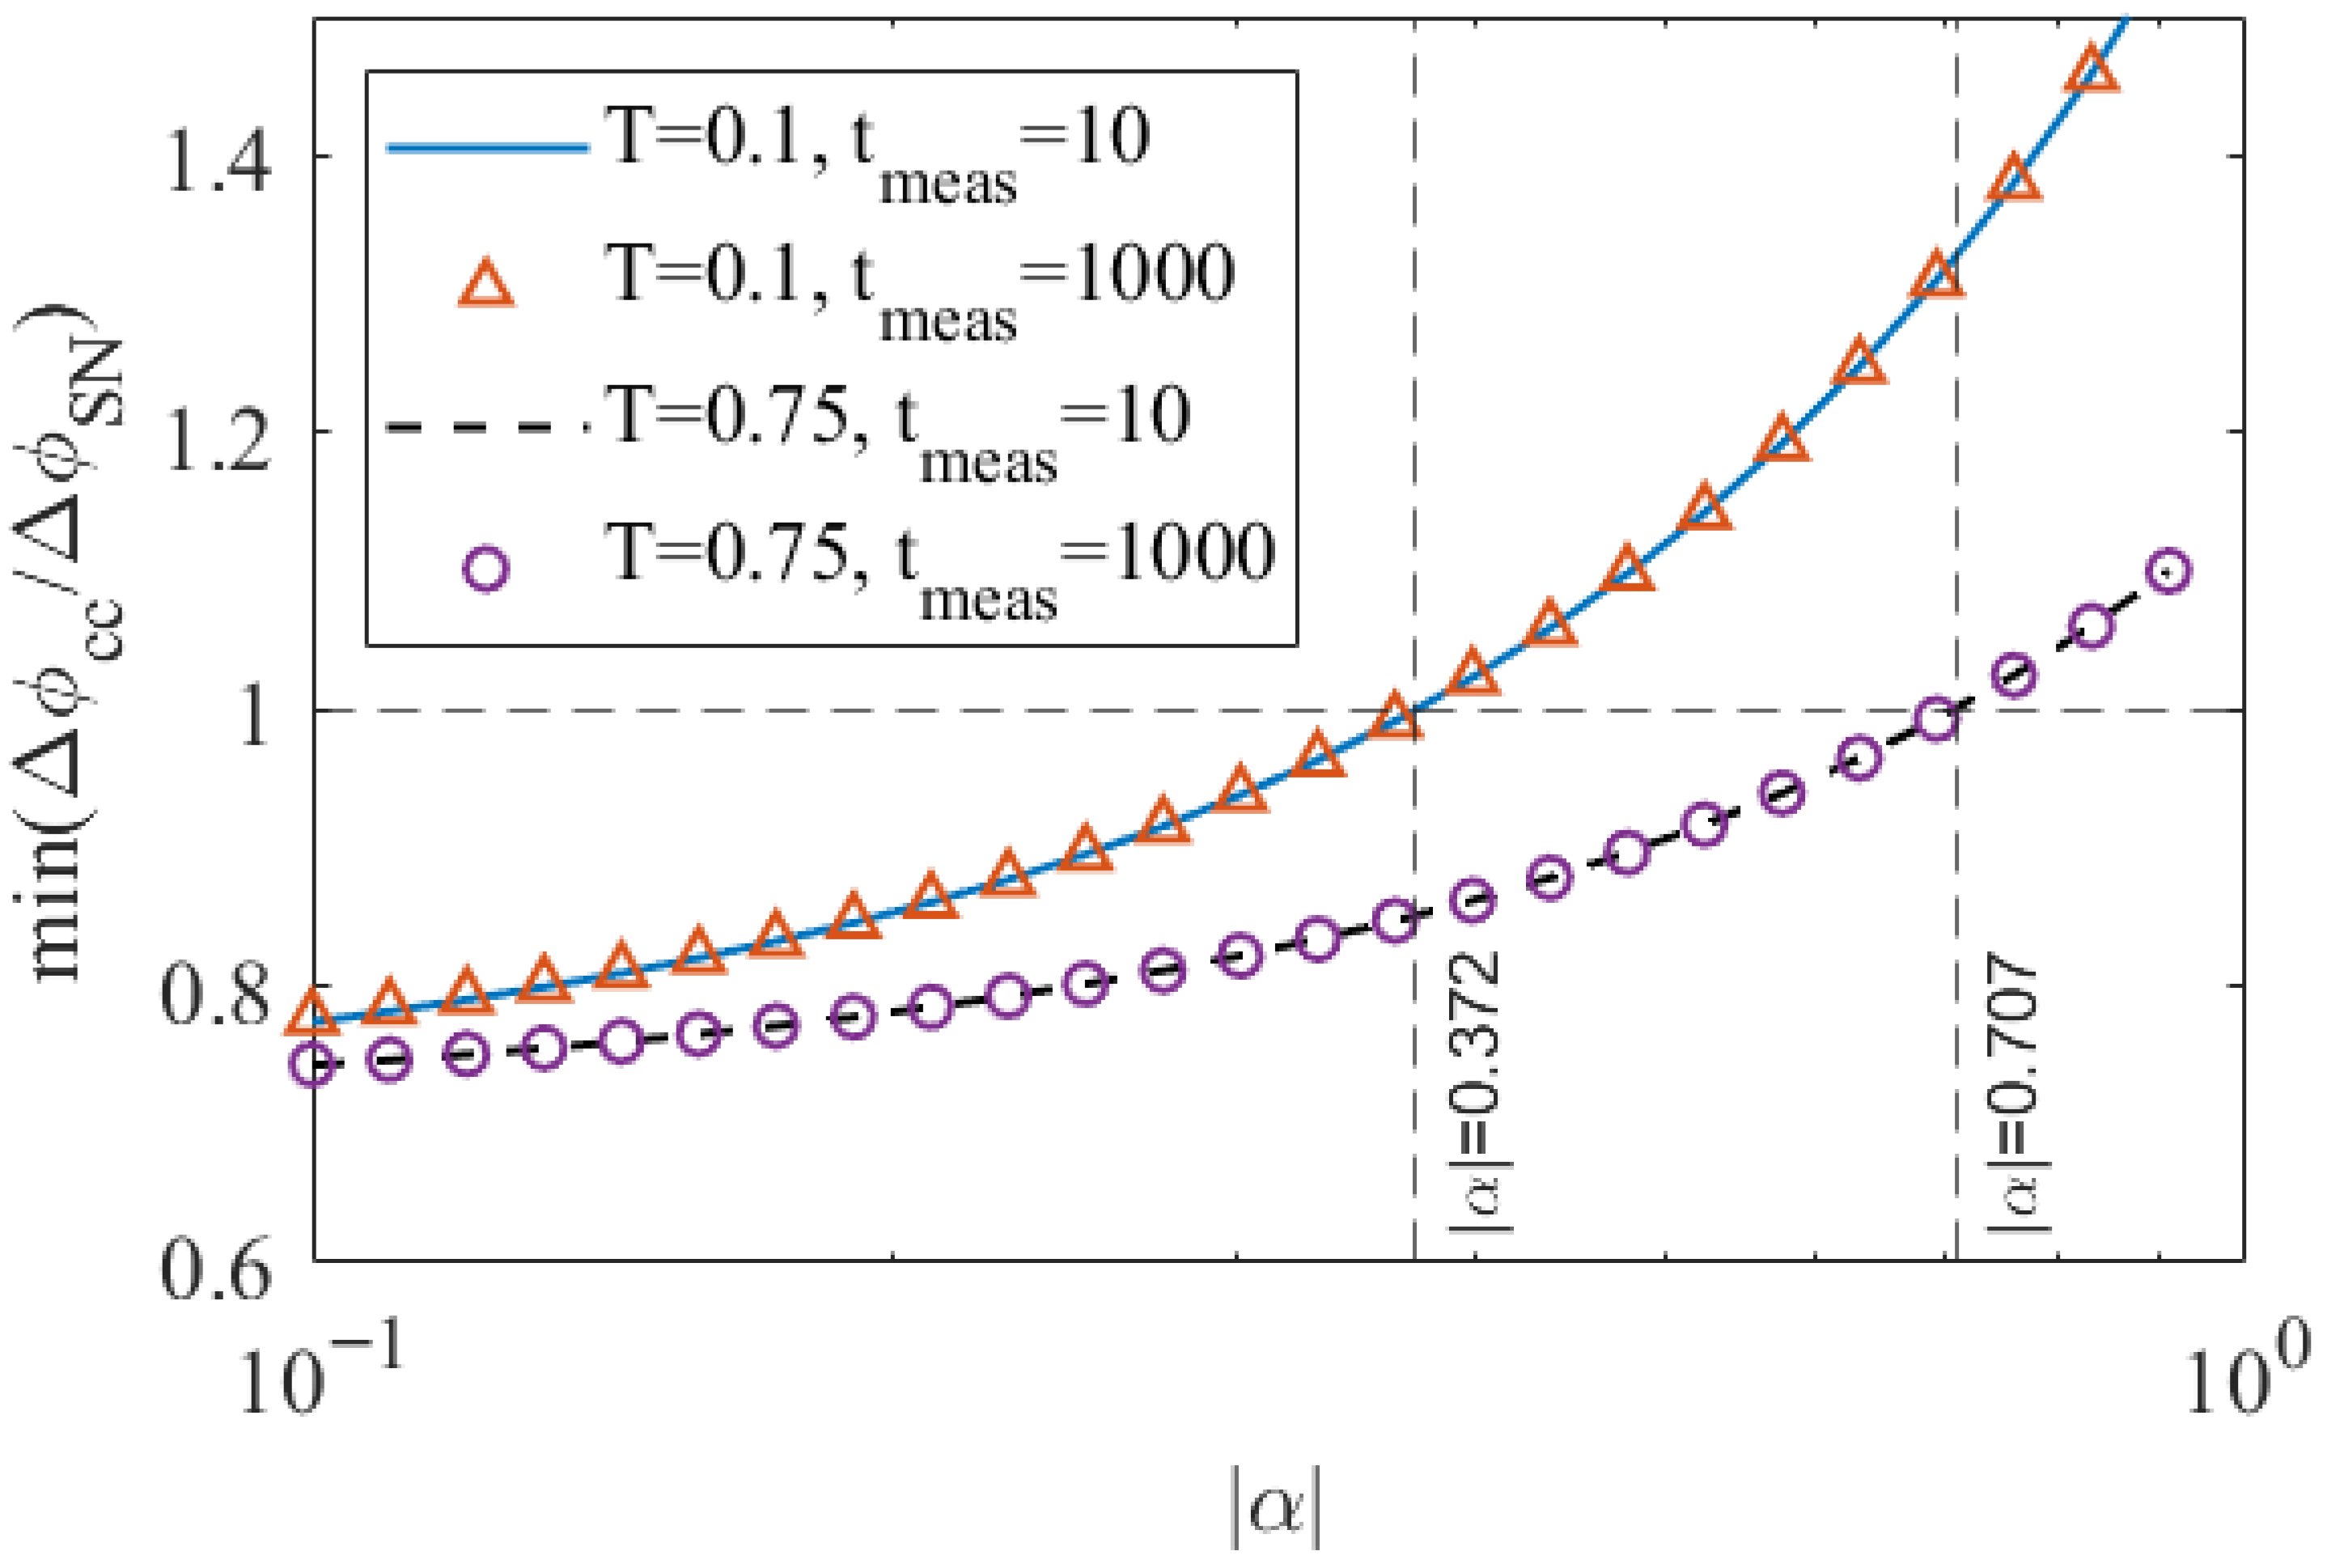
We plot the resulting phase uncertainty Equation (11) at optimal bias as a function of coherent state amplitude in Figure A1. A similar dependence on transmission follows as in the squeezed state case. We do not consider the added effect of one-photon states which can saturate either of the two detectors, effectively reducing the quantum efficiency of the coincidence counting. This further reduces the upper bound to | α | seen in Figure A1.
Figure A1. Plot of spurious count phase uncertainty Δ ϕ c c over the shot noise as a function of coherent amplitude. As in Figure 2, the detection time window τ detector = 100 ps in each case.
Quantumrep 08 00043 g0a1

Appendix B. Higher N00N State Orders

Higher-order ( N > 2 ) N00N state phase measurements have been performed using a combination of classical and squeezed light [9,18]. In this case, one must optimize the combined squeezed and coherent state amplitudes.
We sum the probabilities of different coherent and squeezed state combinations, which results in a total of N photons:
P N m = 0 N / 2 P N 2 m α P 2 m ξ ,
using the coherent (Equation (A1)) and squeezed (Equation (14)) photon number probabilities. This allows us to make an order-of-magnitude estimate of the uncorrelated coincidence count saturation. It is important to note that for application to a specific experimental setup, one must sum the loss for each optical element, which typically includes coherent and squeezed-state inputs at separate input arms of a beamsplitter, followed by a phase shift in one output arm, and a series of additional beamsplitters for the multi-photon detection scheme [9,18].
To determine the false coincidences, we take Equation (A3) and apply it to Equation (8) and Equation (18), generalizing to N photons. The N00N state budget within t meas (up to a prefactor dependent on the beamsplitting) is
M N 00 N P N T N t meas τ detector .
As for the false coincidences in the perturbative | ξ | and | α | regimes, we estimate the uncorrelated coincidence by the P N + 1 contribution after the loss of a single photon and P N + 2 after losing two photons. Beamsplitting each state with the vacuum and taking the reduced density matrix, the fraction of the mixed state population in the two-photon sector is
M cc false ( N + 1 ) T N ( 1 T ) t meas τ detector × P N + 1 + N 2 P N + 2 ( 1 T ) .
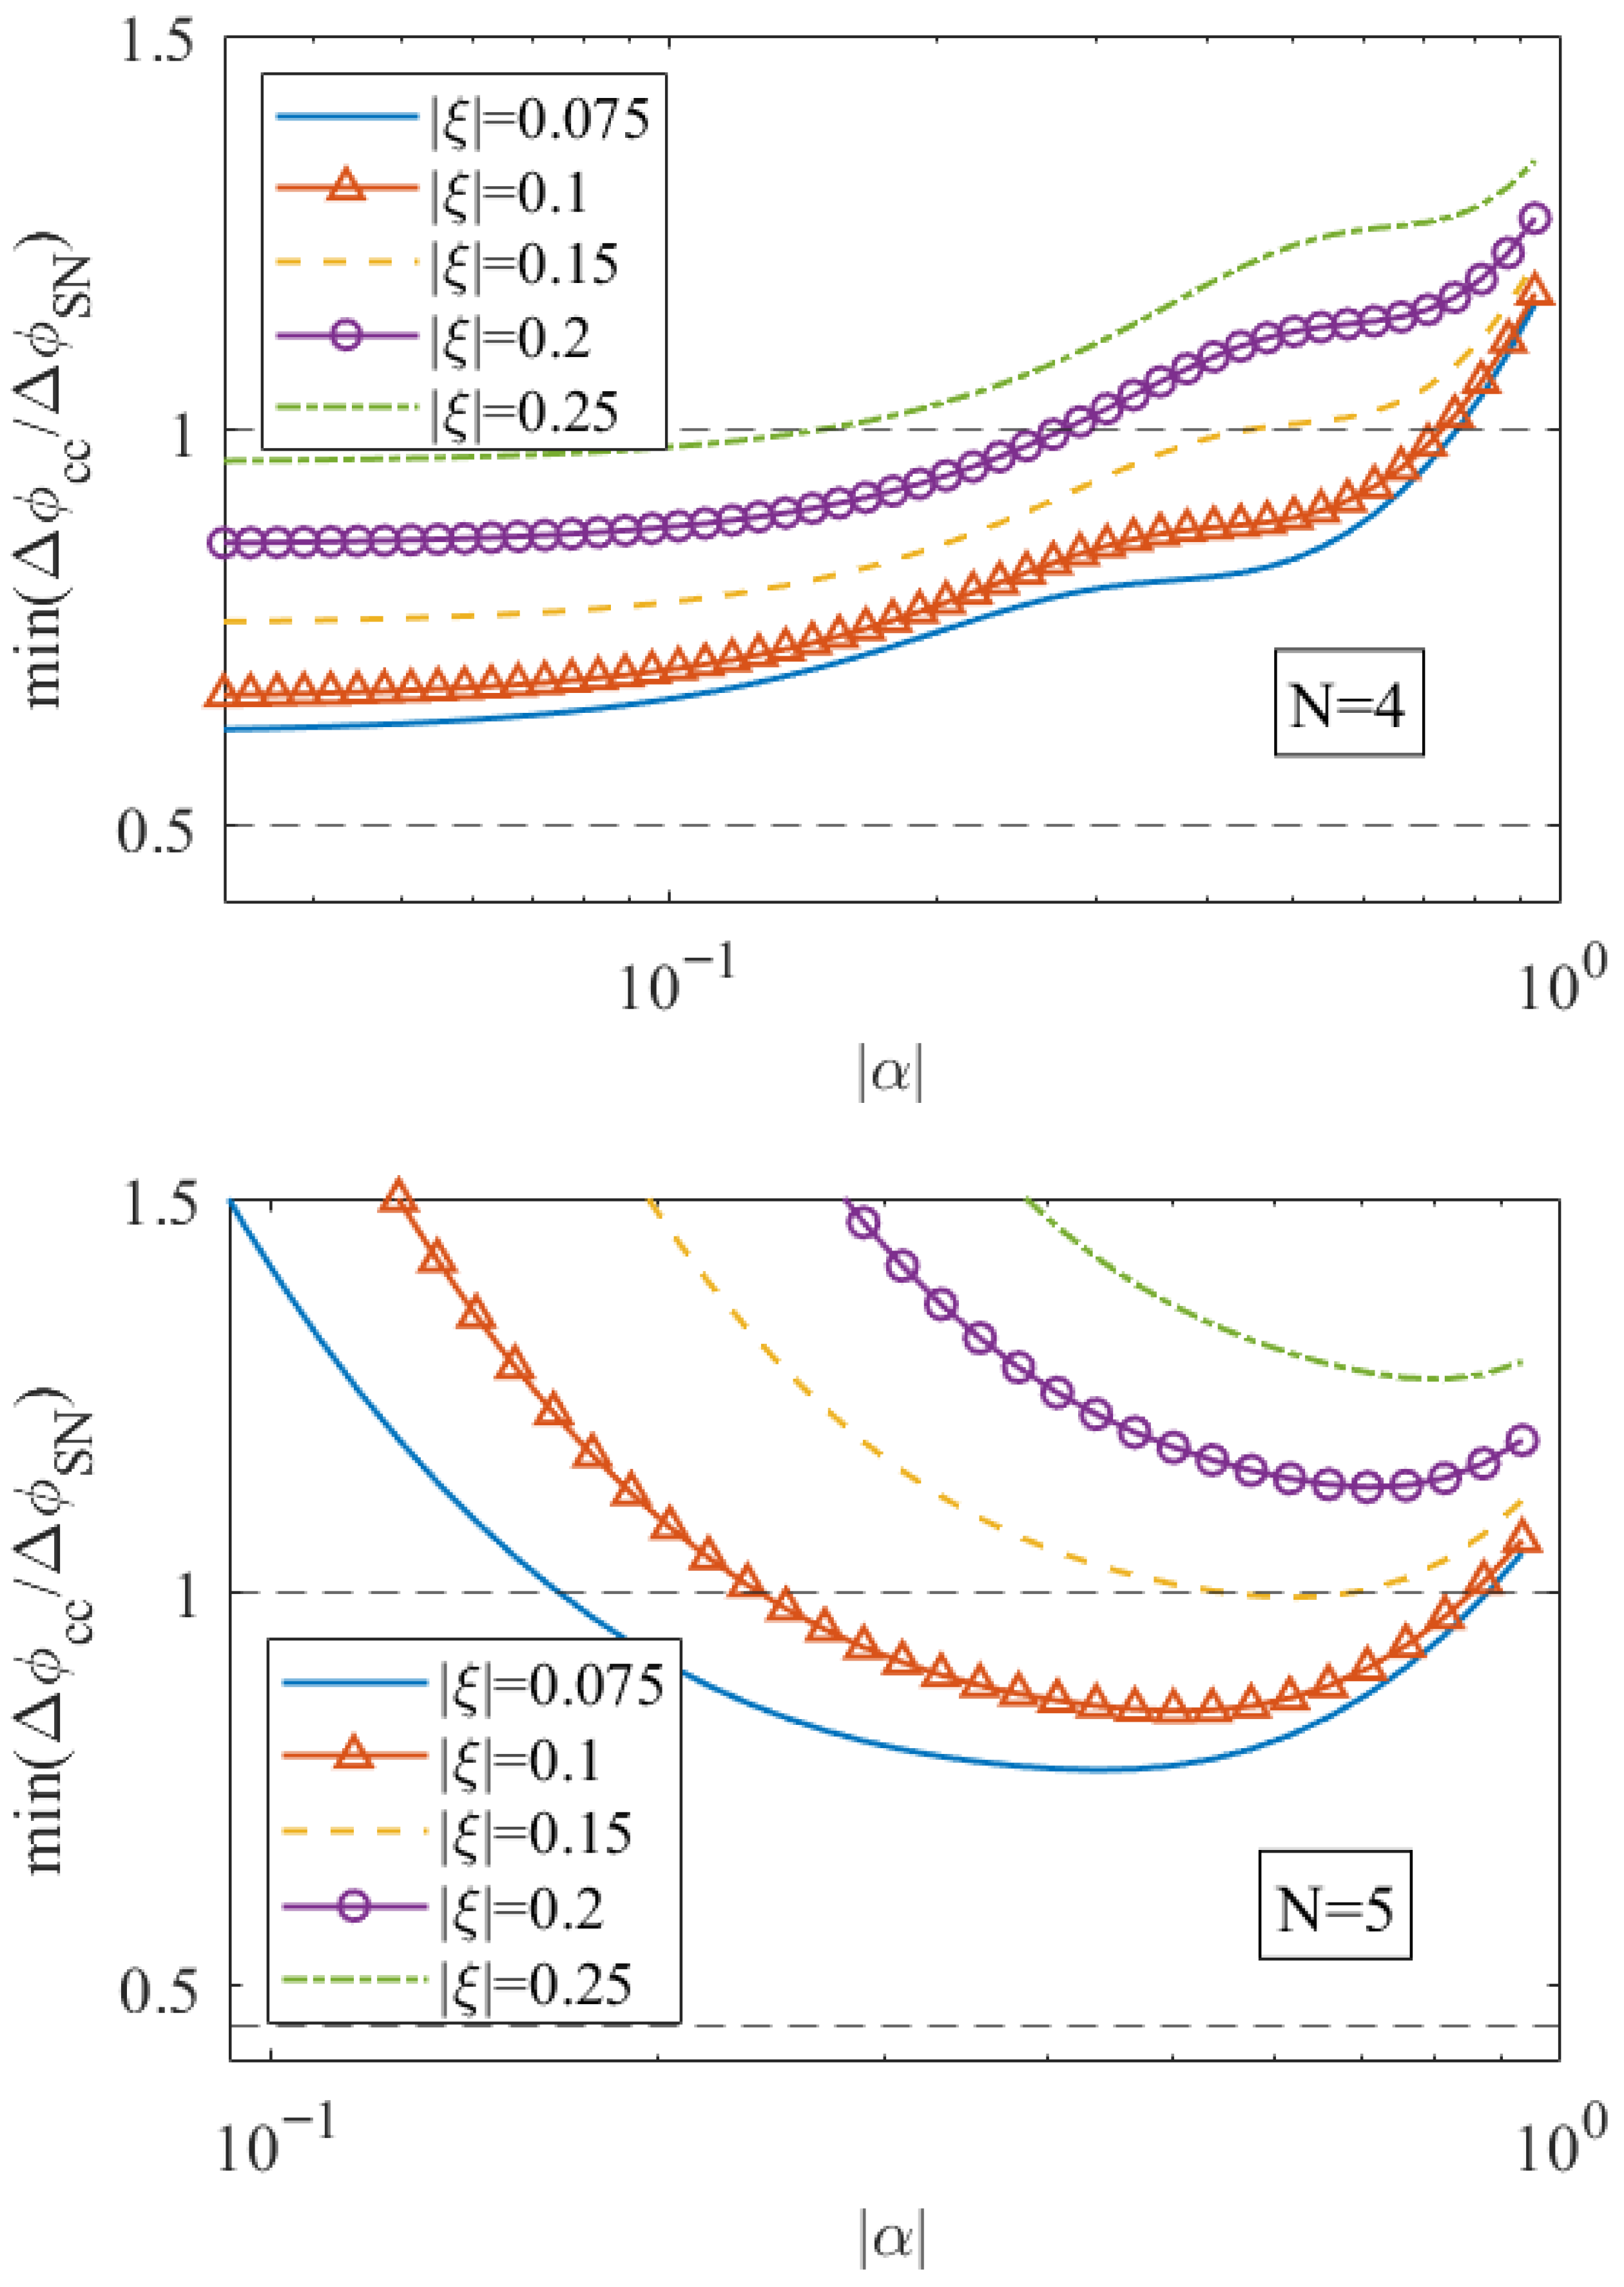
We plug Equation (A5) into Equation (11) and plot the resulting phase uncertainty for the N = 4 and N = 5 cases in Figure A2. As expected, it is advantageous to have a larger contribution of photons from the coherent state. Interestingly, the odd N N00N state phase uncertainties do not monotonically increase with | α | (at fixed squeezed amplitudes), but instead reach minima at finite | α | . Considering the squeezed state-dominated case | ξ | | α | , the odd N signal contribution scales with | α | 2 (squeezed state N 1 probability, plus one photon from the coherent state). On the other hand, the dominant noise contribution originates from the squeezed state N + 1 probability (independent of | α | ), which undergoes the loss of one photon. As a result, false coincidence counts dominate the signal in the small | α | limit.
Figure A2. Plot of N = 4 (top) and N = 5 (bottom) N00N state spurious count phase uncertainty Δ ϕ c c over the shot noise vs. coherent amplitude. Different fixed squeezed-state amplitudes are plotted, and in each case τ detector = 100   ps , T = 0.3 and t meas = 1000 . Dashed horizontal lines mark the boundaries of the sub-shot noise regime (1, 1 / N ).
Quantumrep 08 00043 g0a2

Appendix C. Lossy States with Correlations

The main results of this paper are derived on the assumption that the majority of loss occurs after the generation of the N00N state. However, a fraction of mixed states originating from loss between the SPDC output and the N00N state generation remain. When the subsequent N00N state generating beamsplitting operation acts on these mixed states, newly correlated (Sagnac phase-dependent) states emerge with a different phase bias dependence than the signal in Equation (4).
To ensure that one is not overestimating the noise floor and underestimating the allowable squeezed amplitude regime, we consider the loss for typical optical elements encountered prior to N00N state generation in a quantum FOG setup [10,13]. With coupling from fiber to free space (or collimating free space optics), chromatic filters and beamsplitting, we expect 1 dB of loss from these components. In comparison, we have nearly 9 dB loss after N00N state generation. We can thus rewrite our above T 0.1 transmission example as a product of T 1 0.8 and T 2 0.125 .
Taking into account losses which convert 4-photon signals to 2-photon mixed states via Equation (17), approximately 0.15 P 4 states in the two-photon sector are capable of retaining correlations. At the beamsplitter output, half of the photons are in a N00N state (as opposed to the | 11 state, which remains uncorrelated) with a different phase bias than the signal photons, yet the same Sagnac phase dependence. Applying T 2 , the surviving two-photon states can produce a coincidence count with O ( 10 3 P 4 ) probability.
In comparison, our uncorrelated coincidence estimate based on squeezed states in Section 3.2 amounts to a probability of O ( 5 × 10 2 P 4 ) . Thus, the additional correlated states originating from losses early on in the setup produce a correction (reduction) to the uncorrelated counts of a few percent. While this is negligible for the FOG setups we considered in this paper, future experiments with reduced T 2 will need to take this correction into account and include an additional phase bias-shifted contribution to the signal portion of coincidence counts (Equation (4)).

Appendix D. Additional Noise Effects

Appendix D.1. Dispersion

We return to the expression for Sagnac output power Equation (4) and introduce a finite linewidth:
M cc = M N 00 N 2 1 + C cos ( N ϕ SL ) ,
which is accounted for in the coherence function [5]
C = e 3.5 Δ t 2 / τ 2 ,
where Δ t is the arrival time difference between the two light paths, and coherence time τ = 1 / Δ ν = λ 2 / c Δ λ . A large linewidth does not compromise FOGs due to reciprocity (order fs arrival time differences Δ t τ ).
Nonreciprocal effects can also be minimized: we recall that due to the polarization-dependent refractive index n ( λ ) , we note a difference in broadening between polarizations along the fast and slow axes of the PM fiber:
Δ t chr Δ τ Δ τ 0 ,
where Δ t chr labels the chromatic broadening—this is nonreciprocal, as it grows with fiber length, where typical PM fibers exhibit Δ t chr / L Δ λ 0.01 ps/km·nm [19]. This adds a factor to the coherence function in Equation (A7): C C e 3.5 Δ t chr 2 / τ 2 , up to a constant in the exponential. Given a coherence time of τ 8 ps ( Δ λ = 1 nm, λ = 1550 nm), this is represents a very small reduction in the coherence function. Using a twisted fiber approach [11,20] where the two input beams share the same fiber axis, this dispersion can be further reduced.
Turning to polarization, the broadening effect from polarization mode dispersion (sub ps / km ) is also below the coherence time, leading to a small reduction in the coherence function [21], which can be combined with the spurious coincidence count analysis in the main text. We expect this effect to be sub-leading for the fiber lengths we consider; the absence of significant polarization nonreciprocities in PM fibers nearing 5 km was demonstrated [22] in a classical FOG.

Appendix D.2. Pump Laser and SPDC Source Instabilities

We briefly summarize some additional noise sources that are well documented for classical FOG experiments. We reiterate the prevalent effects which were adapted to the quantum FOG in [13]. One source of noise is the wavelength instability in the pump field (distinguishing the center wavelength variance from the linewidth) driving the SPDC source. Another source of uncertainty arises due to the intensity variance of the pump field. When combined, these two effects can produce large phase errors. However, they can be mitigated via signal processing of the pump beam and by adjusting the predicted Sagnac phase shift.
In the case of nonlinear N00N state generation methods, the temperature dependence of the nonlinear crystal is also important. Considering a change in output SPDC wavelength of, e.g., ∼0.2 nm/°C, and a temperature control stability of 0.01 °C, the resulting phase uncertainty is on the order of 10 6 of the Sagnac Laue phase. This accommodates signal-to-noise ratios nearing the classical domain, i.e., the shot noise at ∼ 10 12 photon counts per second.

References

  1. Dowling, J.P. Quantum optical metrology–the lowdown on high-N00N states. Contemp. Phys. 2008, 49, 125–143. [Google Scholar] [CrossRef]
  2. Jacobson, J.; Björk, G.; Chuang, I.; Yamamoto, Y. Photonic de Broglie Waves. Phys. Rev. Lett. 1995, 74, 4835–4838. [Google Scholar] [CrossRef] [PubMed]
  3. Boto, A.N.; Kok, P.; Abrams, D.S.; Braunstein, S.L.; Williams, C.P.; Dowling, J.P. Quantum Interferometric Optical Lithography: Exploiting Entanglement to Beat the Diffraction Limit. Phys. Rev. Lett. 2000, 85, 2733–2736. [Google Scholar] [CrossRef] [PubMed]
  4. Culshaw, B. The optical fibre Sagnac interferometer: An overview of its principles and applications. Meas. Sci. Technol. 2006, 17, R1. [Google Scholar] [CrossRef]
  5. Lefévre, H.C. The Fiber-Optic Gyroscope; Artech House: Boston, MA, USA, 2022. [Google Scholar]
  6. Mehmet, M.; Eberle, T.; Steinlechner, S.; Vahlbruch, H.; Schnabel, R. Demonstration of a quantum-enhanced fiber Sagnac interferometer. Opt. Lett. 2010, 35, 1665–1667. [Google Scholar] [CrossRef] [PubMed]
  7. Restuccia, S.; Toroš, M.; Gibson, G.M.; Ulbricht, H.; Faccio, D.; Padgett, M.J. Photon Bunching in a Rotating Reference Frame. Phys. Rev. Lett. 2019, 123, 110401. [Google Scholar] [CrossRef]
  8. Resch, K.J.; Pregnell, K.L.; Prevedel, R.; Gilchrist, A.; Pryde, G.J.; O’Brien, J.L.; White, A.G. Time-reversal and super-resolving phase measurements. Phys. Rev. Lett. 2007, 98, 223601. [Google Scholar] [CrossRef]
  9. Afek, I.; Ambar, O.; Silberberg, Y. High-NOON States by Mixing Quantum and Classical Light. Science 2010, 328, 879–881. [Google Scholar] [CrossRef]
  10. Fink, M.; Steinlechner, F.; Handsteiner, J.; Dowling, J.P.; Scheidl, T.; Ursin, R. Entanglement-enhanced optical gyroscope. New J. Phys. 2019, 21, 053010. [Google Scholar] [CrossRef]
  11. Silvestri, R.; Yu, H.; Strömberg, T.; Hilweg, C.; Peterson, R.W.; Walther, P. Experimental observation of Earth’s rotation with quantum entanglement. Sci. Adv. 2024, 10, eado0215. [Google Scholar] [CrossRef] [PubMed]
  12. Okamoto, R.; Hofmann, H.F.; Nagata, T.; O’Brien, J.L.; Sasaki, K.; Takeuchi, S. Beating the standard quantum limit: Phase super-sensitivity of N-photon interferometers. New J. Phys. 2008, 10, 073033. [Google Scholar] [CrossRef]
  13. Evans, S.; Ptasinski, J. Enhancing fiber optic gyroscope precision using polarization-entangled two-photon states. In Quantum Communications and Quantum Imaging XXIII; SPIE: Bellingham, WA, USA, 2025; Volume 13618, pp. 115–123. [Google Scholar]
  14. Grace, M.R.; Gagatsos, C.N.; Zhuang, Q.; Guha, S. Quantum-Enhanced Fiber-Optic Gyroscopes Using Quadrature Squeezing and Continuous-Variable Entanglement. Phys. Rev. Appl. 2020, 14, 034065. [Google Scholar] [CrossRef]
  15. Kort-Kamp, W.J.M.; Azad, A.K.; Dalvit, D.A.R. Space-Time Quantum Metasurfaces. Phys. Rev. Lett. 2021, 127, 043603. [Google Scholar] [CrossRef] [PubMed]
  16. Dalvit, D.A.R.; Kort-Kamp, W.J.M. Shaping Dynamical Casimir Photons. Universe 2021, 7, 189. [Google Scholar] [CrossRef]
  17. Kim, H.; Kwon, O.; Moon, H.S. Two-photon interferences of weak coherent lights. Sci. Rep. 2021, 11, 20555. [Google Scholar] [CrossRef] [PubMed]
  18. Hofmann, H.F.; Ono, T. High-photon-number path entanglement in the interference of spontaneously down-converted photon pairs with coherent laser light. Phys. Rev. A 2007, 76, 031806. [Google Scholar] [CrossRef]
  19. Tang, F.; Wang, X.; Zhang, Y.; Jing, W. Distributed measurement of birefringence dispersion in polarization-maintaining fibers. Opt. Lett. 2006, 31, 3411–3413. [Google Scholar] [CrossRef] [PubMed]
  20. Doerr, C.R.; Tamura, K.; Shirasaki, M.; Haus, H.A.; Ippen, E.P. Orthogonal polarization fiber gyroscope with increased stability and resolution. Appl. Opt. 1994, 33, 8062–8068. [Google Scholar] [CrossRef] [PubMed]
  21. Chamoun, J.N.; Digonnet, M.J.F. Noise and Bias Error Due to Polarization Coupling in a Fiber Optic Gyroscope. J. Light. Technol. 2015, 33, 2839–2847. [Google Scholar] [CrossRef]
  22. Takei, N.; Miranda, M.; Miyazawa, Y.; Kozuma, M. Simultaneous Suppression of Thermal Phase Noise and Relative Intensity Noise in a Fiber Optic Gyroscope. IEEE Sens. J. 2023, 23, 2249–2254. [Google Scholar] [CrossRef]
Figure 1. Plot of phase uncertainty from Equation (11) over shot noise Equation (2), as a function of Sagnac–Laue and bias phase. For each squeezed amplitude shown, the detection timing window τ detector = 100 ps , transmission T = 0.1 and count collection time t meas = 1000 s.
Quantumrep 08 00043 g001
Figure 2. Plot of spurious count phase uncertainty Δ ϕ c c over the shot noise as a function of squeezed amplitude. The detection time window τ detector = 100 ps in each plot.
Quantumrep 08 00043 g002
Disclaimer/Publisher’s Note: The statements, opinions and data contained in all publications are solely those of the individual author(s) and contributor(s) and not of MDPI and/or the editor(s). MDPI and/or the editor(s) disclaim responsibility for any injury to people or property resulting from any ideas, methods, instructions or products referred to in the content.