Article

A Comparative Study on Situation Awareness While Reading in a Highly Automated Vehicle

by
Alexander G. Mirnig
1,2,*,
Sandra Trösterer
2,3 and
Mark Colley
4
1
AIT Austrian Institute of Technology, 1210 Vienna, Austria
2
Department of Artificial Intelligence and Human Interfaces Salzburg, University of Salzburg, 5020 Salzburg, Austria
3
Virtual Vehicle Research GmbH, 8010 Graz, Austria
4
Department of Computer Science, University College London, London WC1E 6BT, UK
*
Author to whom correspondence should be addressed.
Vehicles 2026, 8(5), 108; https://doi.org/10.3390/vehicles8050108
Submission received: 12 March 2026 / Revised: 16 April 2026 / Accepted: 7 May 2026 / Published: 12 May 2026

Abstract

When driving a partially automated vehicle, maintaining situation awareness is essential for users to be better prepared to take over. A primary challenge is maintaining awareness while the user is occupied with another task without tunneling attention towards individual elements. To investigate this, we conducted an experimental study in our driving simulator (n = 20) comparing an indirect LED (light-emitting diode) visualization of relevant objects in the driver’s field of view with a combined condition of an indirect LED + direct HUD (head-up display) visualization. The participants’ situation awareness scores were higher under the combined condition. However, the scores dropped significantly for objects outside the LED + HUD visualization. We conclude that the indirect object indication is not effective in countering tunneling effects from the HUD, and neither does it provide a satisfactory trade-off when deployed on its own, i.e., without direct indication in addition.

1. Introduction

According to the 2020 National Highway Traffic Safety Administration (NHTSA) report, 14% of all police-reported motor vehicle traffic crashes in the United States in 2018 were caused or affected by distraction. In-vehicle distraction is a major contributor to decreased situation awareness (SA). If a driver’s SA is insufficient, said driver can no longer be expected to react in time to anomalies or unexpected behaviors of other road users. As a result, situations that would still be resolvable by attentive drivers can lead to accidents when the driver is inattentive.
Distraction is a relevant potential hazard across all road users and vehicle types. Moreover, increasing vehicle automation capabilities bears an even greater risk of driver distraction potential. This is because they free up driver resources, increasing the opportunities for performing non-driving-related activities (e.g., messaging or reading). To counteract such distraction potentials, in-vehicle distraction mitigation systems and SA-fostering interfaces or indicators [1,2,3,4,5] are being pursued to increase driver SA in general or accelerate the re-engagement times in vehicles of SAE levels 2 or 3 [6].
Such displays or indicators can highlight elements of the traffic environment that are in close proximity or otherwise detected as potential hazards to guide the driver’s attention to wherever it needs to be to assess correctly—and then respond to—the situation. Such an approach could, however, just as well be an SA-reducing factor. SA is the awareness and understanding of a given situation with regard to the relevant actors in it, their planned or most probable actions, and the consequences of these actions. If an indicator intended to foster SA is too narrow or has too high of an affordance, then it might well induce tunnel vision by drawing too much attention to the individual element that is identified as the main hazard or focus of attention, drawing away attention from (and understanding of) the situation as a whole. As a result, fostering SA via dedicated displays or indicators in vehicles is a balancing act of affording just enough of the driver’s attention without cognitively tunneling them into paying attention to only the indicator and losing SA again.
Contribution Statement: In this paper, we present the results from a study in which we explored the potential of such SA indicators to capture the driver’s attention while avoiding tunneling simultaneously. The study was video-based and conducted in a simulator environment. We tested two designs: an LED (light-emitting diode) stripe mounted at the bottom of the windshield and rectangular colored overlays on the windshield. In the following, we outline related work regarding SA and in-vehicle SA interfaces, present the methodology and study setup, and then report and discuss the results.

2. Related Work

This work builds on previous work in defining SA and user interfaces, increasing it in the automotive context.

2.1. Situation Awareness Definition and Measurement

There are three different levels of SA: perception, comprehension, and projection level [7,8].
Several methods can be used to measure it. The SAGAT (situation awareness assessment technique) is the most commonly used one. In the SAGAT, simulations are frozen at randomly selected times. Participants are then asked questions about the previously visible environment while the display is blanked [4,9,10,11,12,13,14]. Therefore, SAGAT queries allow for detailed information about subject SA to be collected on an element-by-element basis that can be evaluated against reality, thus providing an objective assessment of operator SA (p. 1, [15]). Another technique is the SART (situation awareness rating technique), a 10-dimensional post-trial subjective rating technique [4,13]. The SPAM (situation present awareness method) could be seen as a variation of the SAGAT. Here, the simulation is also paused randomly, but the display is still visible to the participant when they are asked questions about the scenario [14]. Apart from these, there are several other post-trial questionnaires for assessing SA [11,12]. Defining the appropriate or base-level SA necessary for safe driving on a general level is difficult, as visual complexity of an interaction scenario was found to have a significant impact on driver SA [16], meaning that SA predictions are likely to be impacted by environmental factors even before any interface interaction aspects are considered.

2.2. User Interfaces to Improve Situation Awareness: Standard Interfaces and Indicators

Techniques to foster in-vehicle driver SA include enhancing standard in-vehicle displays (such as navigation displays) with SA-relevant information or indicators. Alcazar et al. [17] proposed three solutions to improve SA in driving simulator environments: a radar-positioning view, a GPS-styled navigation display (similar to standard navigational information in existing vehicles), and vertical rear-view mirrors. Other solutions include displaying additional information (location about potentially essential elements, such as other vehicles or road signs) about the road environment to the driver via an on-screen visualization [18]. Warning systems integrated into the navigation system have also been proposed to increase SA, where warnings are emitted in case of an accident or other hazard on the road [11,12]. SA is of particular importance before and during takeover procedures in AV, especially on SAE level 3. Commonly, this is pursued via visualizations on screens within the cabin (see, e.g., Köhn et al. [19]).

2.3. User Interfaces to Improve Situation Awareness: Auditory and Haptic Feedback

Sound and haptic feedback have also been investigated as potential methods to increase SA in the vehicle context. Borojeni et al. [3] used visual and auditory indicators (via speakers and an LED light in the back of the seat) to support takeover requests in AV. Petersen et al. [4] used auditory messages with information to help participants recognize obstacles on the road to improve SA. Harrington and Narayanaswami [20] used haptic feedback via a vibrating wristwatch to signal external events; Md. Yusof et al. [21] pursued a similar approach, but used a vibrating bracelet instead to signal the car’s movement to the driver. The results also showed a difference between SA in a real environment and SA in a simulated or VR environment. In a real situation, the level of risk that the participants are willing to take is lower than during a simulated drive [22]. In a study on haptic feedback during automated driving, Wang et al. [23] measured gaze behavior and steering performance. They concluded that the gaze behavior and steering performance could be used to analyze the driver’s interaction with the automation. Navarro et al. [24] showed that gaze behavior is different between manual and highly automated driving. Furthermore, gaze behavior can be used as an indicator to infer a user’s trust in a system [25]. Thus, gaze and gaze behavior play an important role in in-vehicle SA.

2.4. User Interfaces to Improve Situation Awareness: Lights

Light and LEDs have been used and proposed as design solutions to improve SA or driver experience inside vehicles [26,27]. Most setups consist of lights mounted to the inside of the vehicle (e.g., [27,28,29]), although there are also alternative approaches, e.g., where the lights are attached to wearables [26]. Wang et al. [5] investigated the use of ambient light to communicate SA-relevant information to the drive to prepare for takeovers specifically. Löcken et al. [30] investigated the use of ambient light displays inside the vehicle to support drivers during lane-change operations. While a constant light pattern did not appear to improve the task performance, a pattern that adapted brightness based on the drivers’ uncertainty level was found to have a positive impact on performance, resulting in fewer traffic rule violations than the control condition.
Yang et al. [31] proposed an LED ambient light HMI concept positioned at the bottom of the windscreen, aiming to increase situational awareness and improve the takeover quality while minimizing distraction. A study with 50 participants in a static driving simulator found significant improvements in gaze behavior and takeover quality when using the new HMI, which also demonstrated a high acceptance and increased trust in automation without promoting overtrust. Gao et al. [32] conducted an in-person experiment with 20 participants using an AR-based interface where they showed that the effects of highlighting potential hazards varied by traffic density, object location, and object type. Highlighting has a positive effect on SA when the traffic density is low and the object being highlighted has low visual saliency. However, it may sometimes reduce SA when the object is already highly salient without highlighting, particularly in dense traffic situations.
Feierle et al. [33], in a study with 52 participants, found that augmented-reality head-up displays (AR-HUDs) significantly reduced takeover times and crashes compared to a baseline concept during simulated malfunctions. While AR-HUDs also showed higher trust and usability ratings, no differences were found in the acceptance, subjective workload, or takeover quality, emphasizing the need for fallback options in partially automated urban driving. Hecht et al. [34] found in a driving simulator study with 21 participants that an ambient light display (ALD) concept using traffic light color-coding improved usability ratings and reduced workload levels compared to a baseline interface without an ALD. A subsequent study with 32 participants comparing two ALD concepts found no significant differences in subjective ratings, but the traffic light concept was more intuitive and provided a higher level of support for users.

2.5. Fostering Situation Awareness vs. Tunneling Effects

Tunnel vision or cognitive tunneling can be artificially induced when the driver’s attention is focused too strongly on a single object or area within the field of view. Pullukat et al. [35] found cognitive tunneling effects to be stronger the closer the interface elements are to the field of view of the driver, which is a particular issue for AR-HUDs. Karar et al. found HUDs to induce tunnel vision in aircraft pilots and a resulting decreased level of attention to events outside the HUD area [36,37]. Zheng et al. [38] found similar effects for in-vehicle HUDs, which can improve the driving performance at the cost of increased reaction and break times. Haeuslschmid et al. [39] reported a decreased peripheral workload caused by a low level of road environment details in the simulation, resulting in a lower and increased focus on the direct line of sight. In summary, fostering SA in automated vehicles is not only a question of visualizing the correct information at the correct time. It is also a balancing act to not induce tunnel vision on the interface element(s) and lose SA as a result.

3. Methods

Based on the identified state of the art, we decided to investigate the potential of ambient light interfaces to avoid or reduce tunneling effects in SA-fostering interfaces. Specifically, we investigated a combination of direct object indication in the driver’s field of view together with an ambient light indicator outside the direct field of view. We conducted an experimental driving simulator study in our driving simulator to answer the following research questions (RQs):

3.1. Research Questions

  • RQ1: How does the indication of relevant objects in the environment while the driver is immersed in a non-driving activity affect in-vehicle SA?
  • RQ2: How does a combination of object indication within the direct field of view and in the peripheral field of view via ambient lighting affect tunneling effects?
We hypothesized that the indication of relevant objects in the environment would affect in-vehicle SA in a positive manner. We further assumed that precise highlighting of objects in the environment would achieve better overall SA than an indication at a higher level of abstraction (i.e., to simply look up or pay attention or direct one’s gaze towards a certain area of the field of view). We then also hypothesized that an indication at such a higher level of abstraction could be used to avoid tunneling effects by making the driver pay attention without funneling them onto specific objects.

3.2. Experimental Design and Participants

The study was realized as a counter-balanced within-design experiment with visualization as the independent variable. We compared three conditions: (1) no visualization (i.e., baseline condition), (2) an LED visualization shown on an LED stripe mounted at the bottom of the windshield of our car mockup, and (3) an LED + HUD visualization. Under this condition, LEDs were used to draw the participants’ attention to the scenery, and within the scenery, an object was highlighted with a rectangular frame in the driver’s direct field of view (we use ‘HUD’ as a shorthand to refer to augmentation in the windshield, similar to an augmented-reality (AR) HUD). In total, n = 20 people participated in the study. We had to dismiss three datasets because of damaged log files. The mean age of the participants was 30.06 years (SD = 11.05). Nine subjects were female, and eight subjects were male. All the participants possessed a driving license. Their mean mileage was 5019 km/year (SD = 4672).

3.3. Measurements

As dependent variables, we were interested in the number of correct answers regarding SA using the SAGAT method [15]. Furthermore, we captured how distracted participants felt while reading the text. This had to be rated on a 10-point rating scale with 1 = not distracted at all and 10 = totally distracted. As a control variable, we also captured text comprehension, i.e., the number of correct responses given to questions about the respective text that the participants had to read under each condition. The three texts were taken from pocketstory.com (https://web.archive.org/web/20230602083111/https://www.pocketstory.com/technology-review/intelligenz-neu-gedacht, accessed on 12 April 2023) and www.spiegel.de (https://www.spiegel.de/wissenschaft/kein-titel-a-5e4517e4-0002-0001-0000-000153615497, accessed on 12 April 2023). Each text was long enough to ensure that the participant would be occupied with reading throughout a trial.

3.4. Procedure

Each participant was greeted and informed about the purpose of the study. Afterwards, they were asked to sign an informed consent form and fill in a pre-questionnaire. The participant was then accompanied to the car mock-up and asked to sit in the driver’s seat. The participant received the following instructions regarding their tasks: They were told that they did not have to drive themselves and that their task was to read a text during the drive. They were informed that reading the text had a high importance and that there would be questions about the text subsequent to the drive. They were told that the drive would be interrupted at times and questions about the driving situation would be shown on-screen. They should answer these questions verbally.
Under the baseline condition without visualization, the participants were informed that there would be no hints about what was going on in the surroundings and that it was up to them if and when they wanted to look at the environment. Under the LED condition, they were informed that an LED light would give a hint that there was something noteworthy in the environment. Finally, under the LED + HUD condition, they were told that there would be an LED light and an additional visualization shown on-screen. The order of the conditions was permutated for each participant. Each trial lasted 10 min.
During the trial, the experimenter sat in an adjacent room and was connected via audio. Participants’ verbal answers to the questions shown on-screen were noted by the experimenter. After each drive, the participants were asked questions about the text and how distracted they felt while reading it. After the simulator task, a semi-structured interview was conducted. The participants received compensation and were thanked for their participation. The duration of one trial was about one hour.

3.5. Materials and Apparatus

The shown drives were videos of real drives on a highway around Salzburg, Europe, captured with a GoPro Hero6 camera. The videos were shown on a 3.28 × 1.85 m screen with a 1920 × 1080 pixel resolution. We had videos of three different drives. The videos were assigned to the three different conditions (baseline, HUD, LED + HUD) in permutated order for each subject. Within each video, we defined six different objects of relevance in the scenery. These objects were different for each drive and consisted of a combination of six of the following: the distance to a [destination] city (different distance variations, road signs, overhead or to the right), motorway exit (road sign, overhead or to the right), speed limit (different speed variations, road sign, to the right or to the left), merging lanes (road sign, to the right) (i.e., speed and information signs), and an electronic display with misc. info (e.g., dry weather, road conditions, general speeding warning; overhead). The signs were highlighted to the left, right, or overhead depending on which lane the driver was in at the time (e.g., the speed limit sign was on both sides, the driver in the leftmost lane, and the left sign was highlighted).
We then defined a set of questions, consistent with previous studies on SA in automated vehicles [40,41], about the road environment tied to the points at which the previously defined objects occurred on the track. In order to account for possible tunneling effects by SA-fostering indicators, we defined two sets of questions: one for low and one for high SA. In this context, ‘low’ refers to awareness related to object(s) on the track that are highlighted in the HUD and indicated by the LED, whereas ‘high’ refers to awareness beyond the scope of the indicated object(s) only. Both the low- and high-SA questions encompassed SA levels 1 to 3 (perception, comprehension, projection). Low SA indicates appropriate attention towards and awareness of the indicated objects on the road, but under the potential effects of tunneling due to the attention being focused on the indicated object(s). Awareness on the high-SA end indicates attention towards and awareness of the traffic environment beyond the indicated object(s) and, thus, not being subjected to tunneling effects (either not at all or to a substantially lesser degree).
The low-SA questions were formulated to directly relate to the objects on the track (e.g., “What is the distance to the [destination] city?”, “How many meters until the lanes will be merged?”, “What is the current speed limit?”, etc.). For higher SA, the following questions were defined:
  • Which lane are you currently in [indicate from leftmost or rightmost lane]?
  • What is the vehicle in front of you carrying [vehicle with open/visible cargo]?
  • Which color is the vehicle in front of you?
  • Which color is the vehicle that just overtook you/that you just overtook?
The higher-SA questions were defined such so that none of them could be answered by focusing only on the highlighted objects. The first two were defined to be immediately safety-relevant (lane and loaded cargo), and the other two to not be immediately safety-relevant. The participants were asked six questions during each condition: four of the lower-SA questions and two from the higher-SA questions, of which one was immediately safety-relevant and the other not. The intervals between questions varied differently in each drive. Each drive lasted ten minutes. A comprehensive overview of all questions in both English and German can be found in the Appendix A, Table A1 and Table A2.

3.6. Visualization Conditions

We used an LED stripe mounted at the bottom of the windshield for the LED visualization. LEDs were illuminated in a blue color to draw participants’ attention. The appropriate LED brightness and duration of the visualization (1200 ms) were determined in pretests. The lit LED segment corresponded approximately to the position of each relevant object on the horizontal axis as it appeared in the field of view. The LED was animated as an illuminated bar that filled towards the direction of interest (to the left, right, or center of the field of view) of the driver, modeled after the “specific hazard” indication condition proposed in Yang et al. [31]. See Figure 1, second panel, for an example visualization. Since the road was straight, the LED segment, once lit, could remain stationary as the object drew closer and shifted slightly on the horizontal axis.
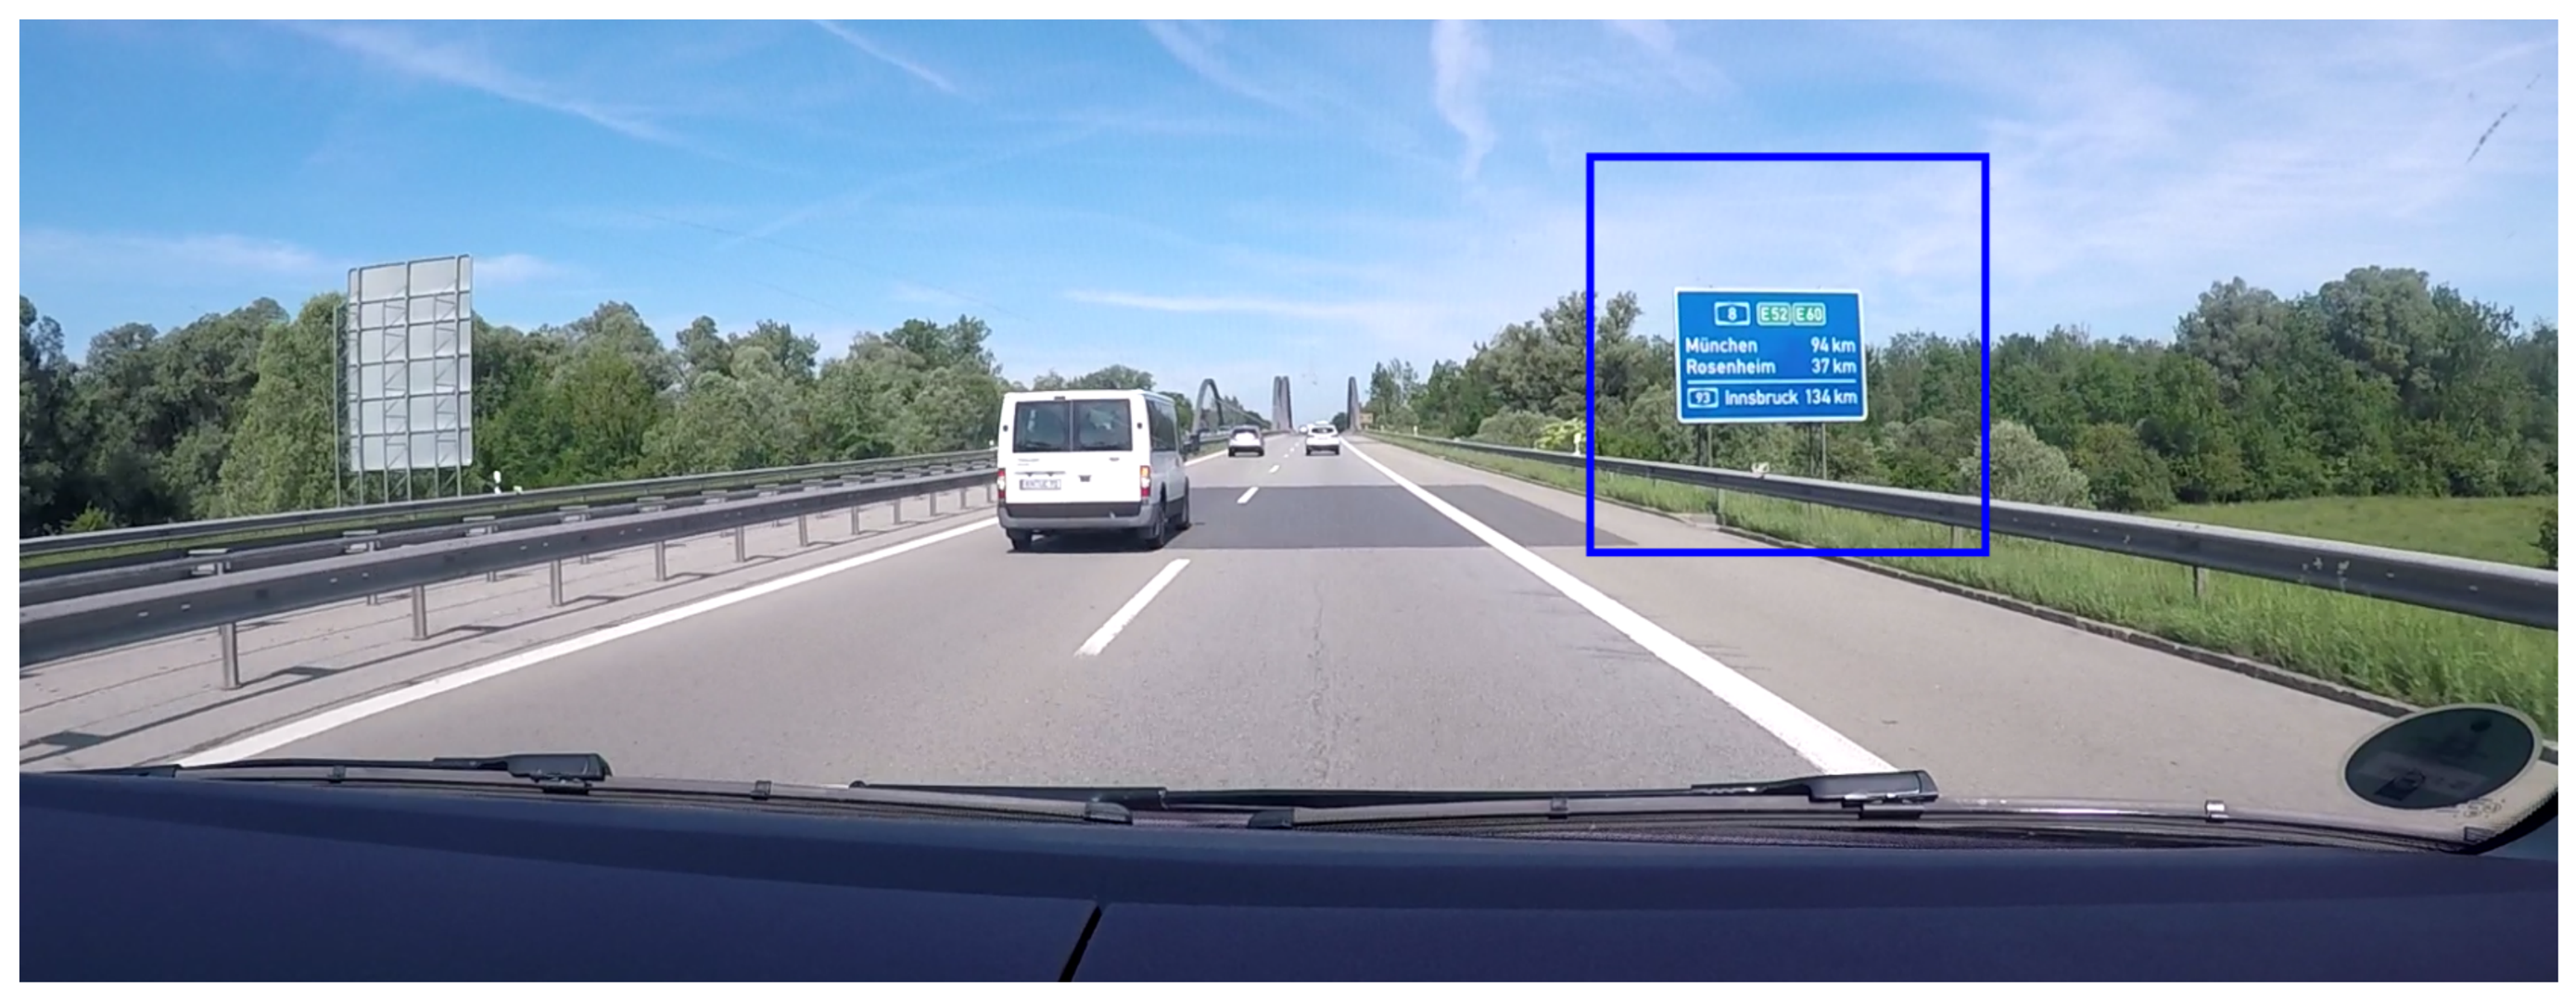
In the LED + HUD condition, the LED visualization was combined with a visualization of a rectangle within the video (see also [42]), drawing a frame around the relevant objects. The purpose of the combined LED + HUD condition was first to draw the driver’s attention towards the outside via the LED and then provide specific SA-relevant information via the HUD. Therefore, the rectangle was shown after the LED visualization and as long as the object was visible within the video (see Figure 2). The rectangle changed its size and position along with the object as it drew closer. Figure 1 shows the sequence of events under the LED + HUD condition, from driving and reading, to the LED visualization for 1.2 s, to the HUD-highlighting for 15 +/− 5 s, and finally to the SA-related question. For the baseline condition, the LEDs remained unlit and no rectangle overlays were shown in the HUD at any time. The SA-related question prompts were shown at the same point in time across all conditions.

3.7. Situation Awareness

Regarding RQ1, we determined the number of correct responses for the SA questions. We differentiated between questions that required a lower level versus those that required a higher level of SA. Questions with a lower SA requirement were concerned with what was highlighted under the LED + HUD condition (e.g., a speed sign), whereas higher-level SA questions concerned the wider driving environment (e.g., on which lane one is currently driving). Those that required higher SA were related to the driving situation, but not to an object that was directly highlighted in the interface.
We calculated a two-factorial ANOVA for repeated measures to identify how the visualization and difficulty (low vs. high SA) of the questions impacted the SA scores. We found a significant main effect for the condition (F2,32 = 6.880, p < 0.01) and for the difficulty (F1,16 = 37.806, p < 0.001), and a significant interaction of both factors (F2,32 = 4.804, p < 0.05).
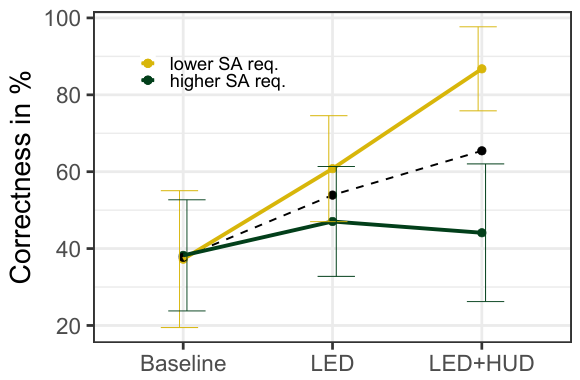
The ART found a significant main effect of the condition on the correct percentage ( F ( 2 , 32 ) = 9.01 , p < 0.001). The ART also found a significant main effect of the difficulty on the correct percentage ( F ( 1 , 16 ) = 45.78 , p < 0.001). Furthermore, the ART found a significant interaction effect of condition × difficulty on the correct percentage ( F ( 2 , 32 ) = 6.78 , p = 0.004; see Figure 3). In the baseline, the correctness was almost equal for low- and high-SA questions. The correctness increased for both conditions with an intervention; however, it was much higher with a simple difficulty (which is to be expected). Interestingly, for the low-SA questions, it was highest under the LED + HUD condition, while it was highest under the LED condition for high-SA questions.
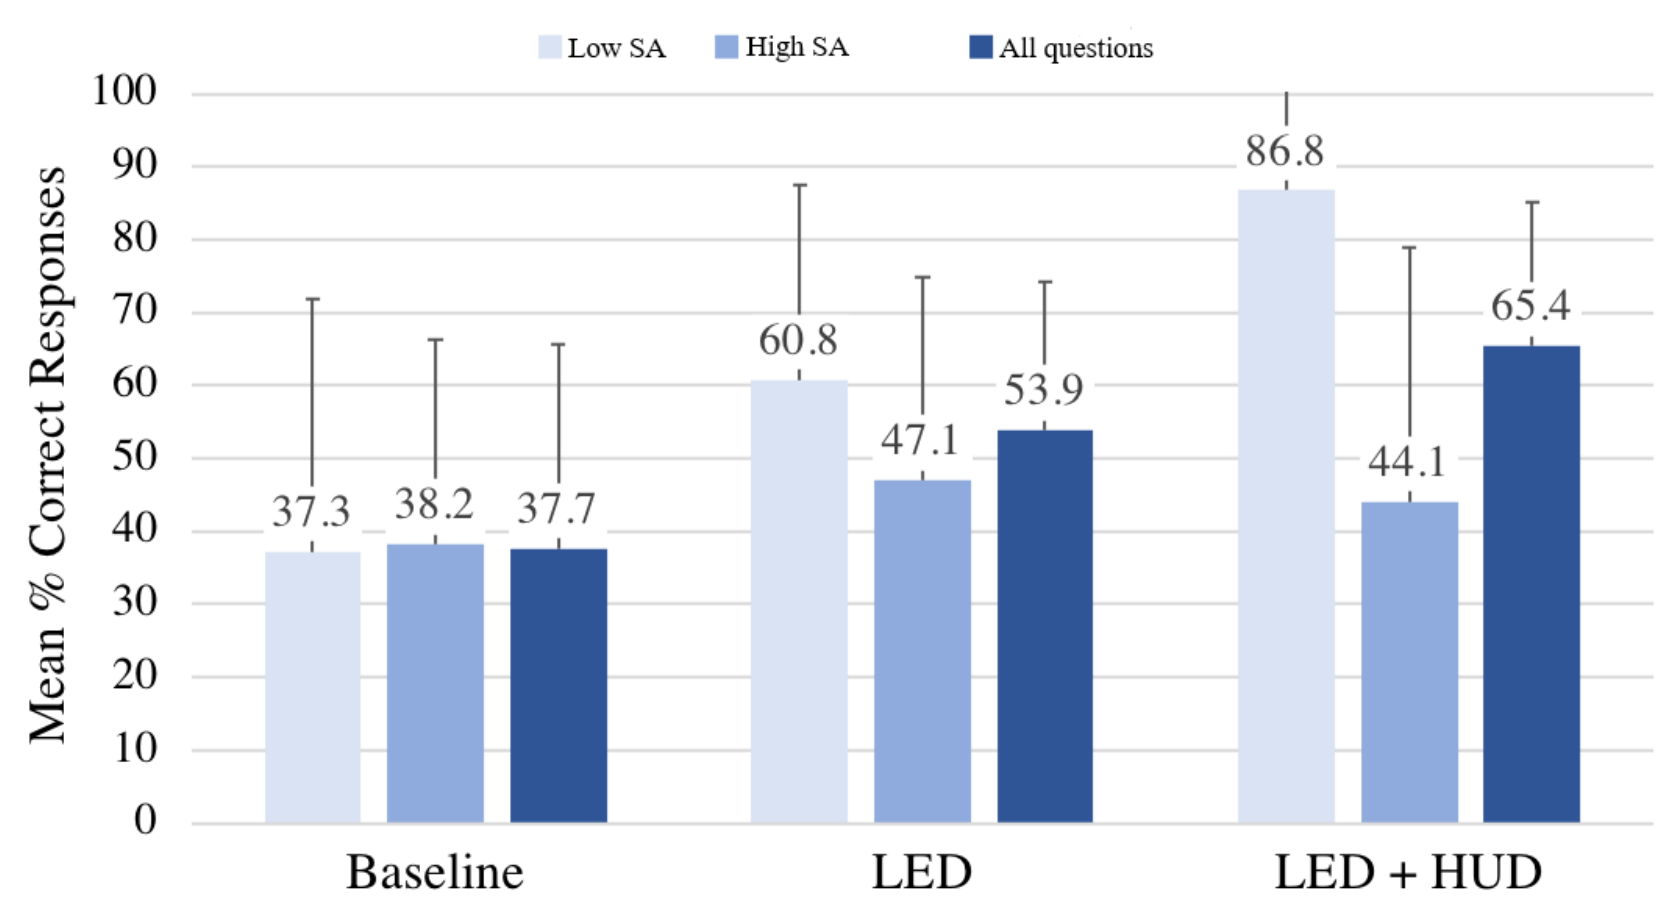
For the factor condition, Bonferroni-corrected post-tests revealed a significant difference in the mean SA scores (see Figure 4) between the LED + HUD and the baseline condition (p < 0.01); i.e., under the LED + HUD condition, the participants had a significantly higher SA score (M = 65.4%) than under the baseline condition (M = 37.7%). However, we found no significant difference between the LED and the LED + HUD or the LED and the baseline condition (both n.s.).
For the difficulty of the questions, we generally found a highly significant difference (p < 0.001) between simple (M = 61.6%) and difficult (M = 43.1%) questions, with the latter resulting in lower SA scores. However, when analyzing the data with regard to the interaction of the factors, we found that there was no significant difference in the SA scores between simple and difficult questions for the baseline (n.s.), as well as under the LED condition (n.s.). In contrast, for the LED + HUD condition, there was a highly significant difference (p < 0.001), i.e., the SA scores were much higher (86.8%) if the questions focused on what was highlighted by the LED + HUD compared to questions focusing on something outside the visualization (44.1%).
We could not find a significant difference in the SA scores among the three conditions for difficult questions (F2,32 = 0.305; n.s.). When focusing on simple questions only (F2,32 = 14.810, p < 0.001), the LED + HUD condition led to significantly higher SA scores compared to the LED (p < 0.05) and the baseline (p < 0.001) conditions. Again, we could not find a significant difference between the LED and the baseline condition (n.s.).

3.8. Text Comprehension and Distraction

Regarding the participants’ text comprehension, we first looked at how much text the participants had read under different conditions. To this end, we compared the number of text lines that participants had read under each condition. We found no significant difference among the conditions ( F ( 2 , 32 ) = 0.378 , n.s.). On average, the participants were able to read about 104 lines of printed A4 text with a font size of 10pt within each 10-min drive.
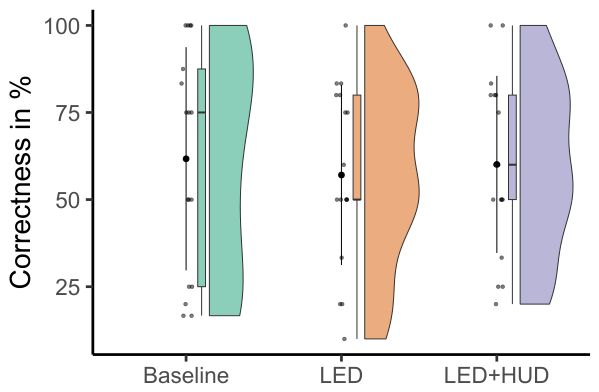
Text comprehension was determined by asking the participants open questions about the text and then calculating the percent of correct responses in relation to the number of answered questions. Again, we could not find significant differences among the conditions regarding the text comprehension scores ( F ( 2 , 32 ) = 0.127 , n.s.). Figure 5 provides an overview of the mean text comprehension scores for the three conditions.
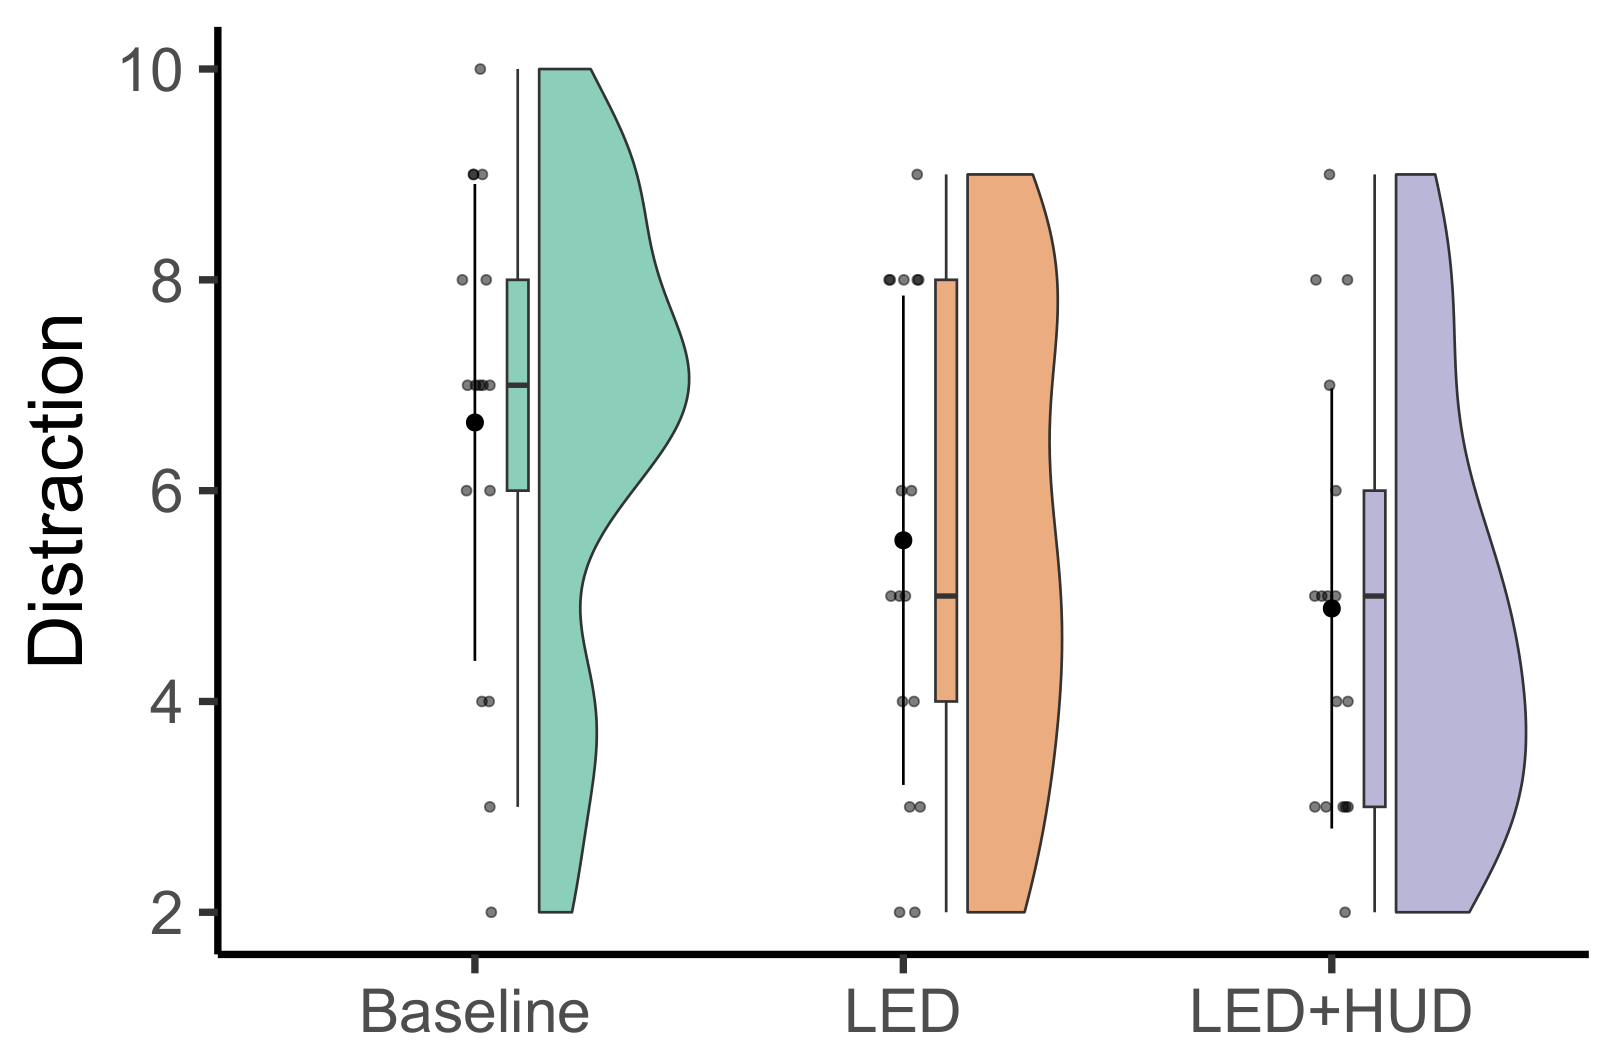
After each trial, we asked the participants how distracted they felt while reading the text (see Figure 6). A one-factorial ANOVA for repeated measures revealed significant differences among the conditions ( F ( 2 , 32 ) = 7.278 , p = 0.002). Holm-corrected post-tests showed no significant differences.

3.9. Interviews

After all the drives, we conducted a semi-structured interview with the participants. As a first question, we asked them how they experienced the different visualization alternatives and what they thought about their advantages and disadvantages. Eleven participants (64.7%) stated that they thought the LED + HUD visualization was beneficial because it directed their attention to the relevant information. In addition, seven participants (41.2%) perceived the LED + HUD as easier and more relaxed because “you knew where to direct your attention.” (P5). Regarding the LED visualization, six participants (35.3%) stated that the LEDs were more helpful in getting an overview of the situation and that they were a necessary means to direct the attention to the outside for the LED + HUD.
However, seven participants (41.2%) also stated some disadvantages of the LED + HUD visualization, with the primary issue being that the LED + HUD led to targeted attention only, i.e., “The attention was targeted to rectangle only—you did not have an overview of the environment.” (P12); “You just looked at the rectangles—everything else remained unnoticed.” (P8). Two participants also mentioned that the shown rectangle sometimes needed to be searched for and was not salient enough. Regarding the LED visualization, five participants (29.4%) stated that they experienced it as confusing: “You had to search the whole environment.” (P3); “I did not know exactly where to look at.” (P5) Furthermore, two participants experienced the LEDs as too glaring.
We then asked the participants which visualization alternative they preferred. Twelve participants (70.6%) stated that they preferred the LED + HUD visualization because it was perceived as easier and more helpful as the attention was targeted: “You immediately knew what to consider.” (P19). Five participants (29.4%) preferred the LEDs because they criticized that, with the LED + HUD, attention was only paid to what was in the rectangle, whereas with the LED, more things were looked at in the scenery: “You look at and concentrate on more things than with the HUD” (P10). Also, the LED + HUD was perceived as more stressful because it sometimes required more concentration by the participant.
We further asked the participants if they had suggestions for improving the different visualization alternatives. Ten participants (58.8%) were fine with the visualization. However, seven participants (41.2%) made comments about contrast, color, and brightness. It was mentioned for the LED + HUD condition that the contrast of the rectangles should be better and adaptive to the environment; also, the rectangles should be larger and shown for longer. For the LEDs, five participants (29.4%) mentioned that they found the running light confusing and not a clear indicator of the direction: “I did not perceive that the LED indicated the direction” (P18). Here, it was suggested to better indicate the position of the relevant information in the scene by statically illuminating LEDs on either the left or right side. Two participants also outlined that the break between the LED illumination and LED + HUD visualization should have been shorter, and that any jittering of the rectangles should be avoided.
We also asked the participants if they could think of completely different alternatives. Six participants (35.3%) had no suggestion, while eight participants (47.1%) mentioned sound or sound in combination with a visualization. Here, it was outlined that sound could be used instead of the LEDs to draw attention, especially if the visual field is limited. However, it was also pointed out that sound could be irritating when listening to music. Other suggestions were a vibration of the seat or steering wheel (n = 3), LEDs in the steering wheel or seat (n = 1), a display with the relevant information (n = 2), or blinking LEDs to direct attention (n = 2).
Finally, we asked the participants how they felt when reading the text under the different conditions and whether the visualizations were perceived as distracting. Eleven participants (64.7%) stated that they felt the most distracted when reading the text under the baseline condition, since they felt the need to regularly check the environment: “You had the feeling you should observe the screen all the time” (P8). In contrast, four participants outlined that the baseline condition was the least distracting for them when reading the text “because you were not really required to look at the road” (P19). For the conditions with visualization, eight participants (47.1%) stated that they felt distracted and had difficulties concentrating on reading the text, primarily due to the general setup and assignment (“I was only distracted by the setting—you never knew when something was going to happen” (P20)) or because they felt that the text was difficult per se. Thirteen participants (76.5%) outlined that they did not feel distracted by the visualizations, with four of them outlining some advantage of the HUD since this allowed even simpler focusing on what is relevant in the scene, while the rest experienced no difference between the visualizations. It was also outlined by five participants that it was particularly difficult to get into the text again after an interruption: “After looking at the screen, you had to find back to the line where you left off—that was sometimes difficult” (P1).

4. Discussion

We investigated the potential of increasing in-vehicle SA by highlighting relevant objects in the environment (RQ1) and avoiding tunneling effects by combining two different indication methods at different levels of granularity (RQ2).
We did not find any persistent, significant differences regarding the reading comprehension task across all conditions. From this, we conclude that immersion in the non-driving task and the setup-induced levels of distraction were constant through all conditions. We subsequently excluded effects due to participants not having performed the non-driving task (either at all or due to an insufficient degree of immersion). With this in mind, we now discuss our findings in relation to the two main RQs.

4.1. Effects of Object Highlighting on In-Vehicle Situation Awareness

Beyond general cues that signal events that might require the driver to respond [3,20,21], we found that indicating specific driving-relevant objects in the environment increased SA in relation to the objects highlighted. Drivers generally paid attention and processed the information contained in the highlighted contents, resulting in improved SA over the baseline.
We found support via visual cues alone to be sufficient to see increased effects on SA. As expected, the indirect indication via LED alone achieved an improved performance over the baseline regarding the low-SA-requirement questions, but not to the extent of the LED + HUD condition, which performed better due to the direct highlighting. We conclude that combining visual SA-fostering cues with other modalities, e.g., audio [4], might not be essential and that the combination of two different levels of indication can further increase SA even when both use the same modality.
We do not, however, exclude the idea that multi-modal SA cues could lead to an improved performance, especially regarding higher SA requirements, where we could not find any significant differences among the conditions. Based on our findings, we assume that the main benefit of a combined interface is brought in by the presence of different cues for the same events or objects at different levels of abstraction and detail. That way, a driver can calibrate their attention and/or response with regard to their current level of distraction or non-driving immersion. In light of the finding that the positive SA performance increase was present only for the low-SA questions, we cannot exclude the idea that multi-modality is what is needed in order to enhance SA towards more complex or difficult-to-perceive SA-related aspects.

4.2. Avoiding Tunneling via a Combination of Indication Modes?

We measured SA using the SAGAT technique and via questions related to safety-relevant information as well as related to the current driving situation. This means that all questions had to be answered via the driver’s memory and adequately reflected an actual driving situation. While the study afforded them additional time to answer the questions, this is a necessary constraint of any SAGAT setup, as verbal responses are slower than manual driving responses (e.g., pushing the brakes or turning the wheel.). The low-SA questions could be answered via knowledge of the highlighted objects and their immediate environment alone; the high-SA questions could not. The LED + HUD condition yielded the best performance regarding low SA and no significant difference regarding high SA. This suggests that the performance increase is a result of tunneling toward the indicated objects.
We were not able to confirm our hypothesis that indicating at a higher level of abstraction could avoid tunneling effects. In order to confirm that hypothesis, the performance regarding high-SA questions under the LED condition would have had to be higher than under the LED + HUD condition. As it was, however, the LED condition performed equally well compared to the baseline and the LED + HUD condition. This means that the decrease in the low-SA performance did not bring about an increase in the high-SA performance. As a result, using indirect indication via LEDs alone does not yield an acceptable trade-off between high and low SA compared to direct object indication.
While we did not observe the performance under the LED + HUD condition to be worse than in the baseline, this does not mean that negative tunneling effects, i.e., a decrease in the attention paid to objects and events outside of what is highlighted [35], did not occur. The driver in our experiment was immersed in a reading task and, therefore, not representative of a driver primarily occupied with the driving task (e.g., as was the case with the pilots investigated by Karar et al. [36,37]). The resulting baseline performance was subsequently very low. It is still surprising that the use of direct object indication in the HUD yielded no performance increase at all when it came to questions with a high SA demand. In other words, it does seem as if the tunneling of the HUD indication was such that SA towards any relevant events or objects in the environment that were not highlighted was at an equal level to that of a non-driving and fully distracted driver.

4.3. Practical Implications

Additional interface elements can cause a higher cognitive load, adjusted focus toward the interface itself, and, thus, reduced focus on the actual scenario. Therefore, the addition of interface elements, especially with the goal of enhancing SA, has to be discussed and evaluated critically. We did not find an indicator to support the improvement of SA via the additional HUD interface. While distraction was, on average, lower for the LED + HUD condition (see Figure 6), this difference was not significant. Therefore, we assume that the LEDs are sufficient for providing the user with increased SA.
While neither indirect (LED) nor direct (HUD) indication was able to have a significant positive effect on high-demand SA, the direct object indication still yielded the best overall performance by virtue of the high success rate regarding low-demand SA. One theoretical strategy for achieving an increased performance in high-demand SA could be to simply highlight a greater range of objects in the environment to cover an equally larger range of situation-relevant parameters. Such a strategy, however, would likely run into natural limits of cognition, where indication of too many objects at once dilutes the effect of direct object indication via overloading and diffusion of attention.
There might still be potential to combine direct with indirect approaches to an effective end by not highlighting objects directly, but instead highlighting relevant areas of interest within the field of view. These would then direct the driver’s attention toward a potential set of relevant objects in the environment and provide information at a lower level of abstraction than a purely indirect indication, as investigated in this study. Semantic segmentation of the entire view has already been shown to improve SA [43] and could be an interesting approach here, too.
A similar approach would be to focus on gaze patterns and timing of attention instead of dynamically reacting to objects in the environment. Safe driving is characterized by gaze behavior that allows a driver to quickly assess a driving situation and understand all relevant parameters. The interface can assist the driver in developing effective monitoring behavior. Tunneling could then be avoided by aiding a driver to steer their gaze towards all relevant areas (e.g., a moving point or area) within the field of view to gain a good understanding of the current driving situation without dynamically focusing on any specific objects in the scene.

4.4. Limitations

A moderate number of participants (n = 20) took part in the study. While this is sufficient to derive generalizable results, a higher participant number might have revealed additional effects. While we strove for a balanced sample, effects due to sample bias are stronger in smaller samples and cannot be fully excluded.
The study focused on non-driving-related tasks in a highly automated vehicle. The study was simulator-based with haptics limited to the physical cabin, seats and controls, and it did not feature an inertia simulation or any other form of haptic feedback. As the study was focused on the non-driving task and not the driving task, active vehicle control was not assessed. This means that the results directly encompass only the scope of performing non-driving-related tasks while not actively handling the controls. This was a conscious decision, as distraction while actively driving is a different, albeit related, topic requiring a different task setup, which would have resulted in additional conditions in an already lengthy study setup. While we do argue that findings re. tunneling can be extended towards active driving contexts, such interpretations should be treated with caution and verified in dedicated studies.
The setup did not include an HUD-only condition. This was a conscious decision based on prior pilots that had revealed that the HUD on its own was not sufficient to gain the participants’ attention within the specific study setup, which contained no active driving tasks, contrary to the LED. One option would have been to add additional indicators, e.g., acoustic signals, across all conditions to enable HUD-only as a separate condition. We chose not do so, since we wanted to focus exclusively on visuals within the study and limit the participants to interacting with visual information only. Furthermore, the study focused on potential tunneling effects of object indication and not on salience or attention-capturing potential of the different interface conditions. It would be incorrect to state that there is no relation between them, but we consider salience of the interface to be a necessary condition for potential tunneling effects to occur, not a sufficient one for explaining tunneling. Nonetheless, our decision does mean that an HUD-only setup was not assessed, though we do argue that, due to commercial availability of in-vehicle LEDs (e.g., see Mercedes Benz (https://mercedesblue.com/mercedes-models/sedans/b-class/b-class-ambient-lighting/, accessed on 17 April 2026) or GMC Super Cruise (https://www.gmc.com/connectivity-technology/super-cruise, accessed on 17 April 2026)), the setup reflects a valid spectrum of realistic application cases.
Our research environment limited the potential for simulating vection, an aspect known to impact interactions [44]. As a result, using simulation environments with vection simulation or even real vehicles equipped with systems like XR-OOM [45] or PassengXR [46] might yield additional insights and should be considered for future follow-up studies.

4.5. Future Work

Based on our results, we suggest future work to pursue alternative strategies and not focus on the driving situation and driving environment alone. One possibility would be to take the driver’s current state of awareness into account and, thus, to evaluate adaptive interfaces that leverage the possibility of adapting to the user state. For example, with included eye tracking and improved surrounding surveillance, it is possible to deduce what a driver has already perceived within a given situation. Consequently, only objects that the driver is unaware of can be highlighted, which would reduce the number of superfluous visual cues and diminish tunneling effects in this regards.
We further encourage replication in simulator environments with haptic simulation or in real vehicles to further extend and verify the ecological validity of our findings. Similarly, extention towards active driving and verification of tunneling effects during non-distracted and distracted driving would greatly enhance the applicability of the results and help design against tunneling effects for in-vehicle driving assistance displays.
We further suggest to pursue the strategies proposed in Section 4.3; investigate interfaces that highlight areas instead of objects; and employ techniques to provide further orientation within the highlighted areas that keep the cognitive workload low (such as semantic segmentation) or those that assist in training or maintaining gaze patterns instead of dynamically reacting to the driving environment. Finally, longitudinal implications should be evaluated along with whether tunneling effects persist or change during sustained use of indirect indication.

5. Conclusions

Overall, this work presented a comparative within-subject study with N = 20 participants exploring the effects of two interfaces (LED and LED + HUD) against a baseline without object indication. We investigated whether object indication could increase driver SA and, in particular, whether indirect object indication (LED) could counter the tunneling effects induced by direct object indication (highlighting objects via an HUD). The results showed that a combination of indirect and direct object indication yielded the best performance regarding low-demand SA. For high-demand SA, no differences could be identified among all the investigated conditions over the baseline. We conclude that the addition of an indirect indication via the LEDs investigated in this paper cannot counter the tunneling effects induced by direct object indication. We further conclude that indirect indication alone does not yield an increase in high-demand SA either. Therefore, a different strategy is required to foster in-vehicle SA without tunneling the driver towards select objects in the environment or a specific and narrow section of the driver’s field of view. Nonetheless, both the LED and the LED + HUD improved the low-demand SA, showing the possibility for interfaces to support safe assessment of environments.

Author Contributions

Conceptualization, A.G.M.; Methodology, S.T., A.G.M.; Analysis, S.T., M.C.; Writing, A.G.M., S.T., M.C.; Review and Editing, A.G.M. All authors have read and agreed to the published version of the manuscript.

Funding

This research was funded by the Austrian Science Fund (FWF), grant number I2126-N15, and the Fonds National de La Recherche Luxembourg (FNR), grant number CS14/IS/8301419.

Institutional Review Board Statement

The study was conducted in accordance with the Declaration of Helsinki. Ethical review and approval were waived for this study in accordance with the statutes of the University of Salzburg, Austria, regarding research involving humans for non-medical applications.

Informed Consent Statement

Informed consent was obtained from all the subjects involved in the study.

Data Availability Statement

The data presented in this study are available from the corresponding author upon request.

Conflicts of Interest

The authors declare no conflicts of interest. The funders had no role in the design of the study; in the collection, analyses, or interpretation of data; in the writing of the manuscript; or in the decision to publish the results.

Appendix A. Situation Awareness Questions

Table A1. List of SAGAT probes used. German version.
FrageLösungTrickyZeitObjektPosition
Wie weit ist es noch bis München?94 km 00:17blaues Schild (Distanzangaben)rechts
Zu welchen Orten führt die Abfahrt?Übersee, Grassau 01:10blaues Schild (Abfahrt)rechts
Was transportiert das Fahrzeug vor Ihnen?Roller/Motorrad×04:37blaues Schild (Raststätte)rechts
Max. Geschwindigkeit?Bild D rechts unten: 120 km/h 06:00Geschwindigkeitsbeschränkung 120links
Welche Farbe hat das Fahrzeug auf ihrer Spur?Schwarz×06:34Geschwindigkeitsbeschränkung 100links
In wie vielen Metern wird die Fahrbahn verengt?600 m 08:12Einfädeln lassenrechts
Wie schnell dürfen Sie aktuell fahren?120 km/h 02:08Geschwindigkeitsbeschränkung 120links
Max. Geschwindigkeit?Bild A links oben: 80 km/h 02:41Geschwindigkeitsbeschränkung 80links
Welche Farbe hat das Fahrzeug rechts vor Ihnen?schwarz×04:01blaues Schild (Abfahrt)rechts
Auf welcher Spur fahren Sie gerade?Rechte Spur×05:37blaues Schild (Abfahrt)rechts
Wie viele Kilometer ist München entfernt?55 km 06:37blaues Schild (Distanzangaben)rechts
Wie schnell dürfen Sie aktuell fahren?120 km/h 07:56elektronische Anzeigenoben
Wie schnell dürfen Sie aktuell fahren?80 km/h 00:57elektronische Anzeigenoben
Auf welcher Spur fahren Sie gerade?2. von rechts/3. von links×02:54blaues Schild (Distanzangaben)oben
Wie schnell dürfen Sie aktuell fahren?120 km/h 05:00elektronische Anzeigenoben
In wie vielen Metern wird die Fahrbahn verengt?in 200 m 05:41Einfädelnrechts
Zu welchem Ort führt die Abfahrt?Hohenbrunn 07:29blaues Schild (Abfahrt)oben
Welche Farbe hat das Fahrzeug, das Sie gerade überholt hat?Blau/Silber/Gelb (Polizei)×08:31elektronische Anzeigenoben
Table A2. List of SAGAT probes used. English version.
QuestionAnswerTrickyTimeObjectPosition
How far is it to Munich?94 km 00:17blue sign (distance information)right
Which places does the exit lead to?Übersee, Grassau 01:10blue sign (exit)right
What does the vehicle in front of you transport?Scooter/Motorcycle×04:37blue sign (rest area)right
Max. speed?Picture D bottom right: 120 km/h 06:00speed limit 120left
What color is the vehicle in your lane?Black×06:34speed limit 100left
In how many meters will the lane narrow?600 m 08:12mergeright
How fast are you currently allowed to drive?120 km/h 02:08speed limit 120left
Max. speed?Picture A top left: 80 km/h 02:41speed limit 80left
What color is the vehicle to your right in front of you?black×04:01blue sign (exit)right
In which lane are you currently driving?Right lane×05:37blue sign (exit)right
How many kilometers is Munich away?55 km 06:37blue sign (distance information)right
How fast are you currently allowed to drive?120 km/h 07:56electronic displaysabove
How fast are you currently allowed to drive?80 km/h 00:57electronic displaysabove
In which lane are you currently driving?2nd from the right/3rd from the left×02:54blue sign (distance information)above
How fast are you currently allowed to drive?120 km/h 05:00electronic displaysabove
In how many meters will the lane narrow?in 200 m 05:41mergingright
To which place does the exit lead?Hohenbrunn 07:29blue sign (exit)above
What color is the vehicle that just overtook you?Blue/Silver/Yellow (Police)×08:31electronic displaysup

References

  1. Mirnig, A.G.; Gärtner, M.; Wallner, V.; Demir, C.; Özkan, Y.D.; Sypniewski, J.; Meschtscherjakov, A. Enlightening mode awareness. Pers. Ubiquitous Comput. 2023, 27, 2307–2320. [Google Scholar] [CrossRef]
  2. Donmez, B.; Boyle, L.N.; Lee, J.D. The Impact of Distraction Mitigation Strategies on Driving Performance. Hum. Factors 2006, 48, 785–804. [Google Scholar] [CrossRef] [PubMed]
  3. Borojeni, S.S.; Weber, L.; Heuten, W.; Boll, S. From Reading to Driving: Priming Mobile Users for Take-over Situations in Highly Automated Driving. In Proceedings of the 20th International Conference on Human-Computer Interaction with Mobile Devices and Services, MobileHCI ’18, Barcelona, Spain, 3–6 September 2018; pp. 1–12. [Google Scholar]
  4. Petersen, L.; Robert, L.; Yang, X.J.; Tilbury, D.M. Situational Awareness, Drivers Trust in Automated Driving Systems and Secondary Task Performance. arXiv 2019, arXiv:1903.05251. [Google Scholar] [CrossRef]
  5. Wang, C.; Steeghs, S.; Chakraborty, D.; Gorle, A.; Dey, D.; van de Star, S.; Sudhakaran, A.; Terken, J.; Hu, J. Designing for Enhancing Situational Awareness of Semi-Autonomous Driving Vehicles. In Proceedings of the 9th International Conference on Automotive User Interfaces and Interactive Vehicular Applications Adjunct, AutomotiveUI’17, Oldenburg, Germany, 24–27 September 2017; pp. 228–229. [Google Scholar]
  6. J3016_201806; Taxonomy and Definitions for Terms Related to On-Road Motor Vehicle Automated Driving Systems. Society of Automotive Engineers International: Warrendale, PA, USA, 2018.
  7. Endsley, M.; Endsley, M.R. Toward a Theory of Situation Awareness in Dynamic Systems. Hum. Factors 1995, 37, 32–64. [Google Scholar] [CrossRef]
  8. Ratwani, R.M.; McCurry, J.M.; Trafton, J.G. Single operator, multiple robots: An eye movement based theoretic model of operator situation awareness. In Proceedings of the 5th ACM/IEEE International Conference on Human-Robot Interaction; IEEE Press: New York, NY, USA, 2010; pp. 235–242. [Google Scholar]
  9. Van Dam, J.; Kass, S.J.; VanWormer, L. The effects of passive mobile phone interaction on situation awareness and driving performance. J. Transp. Saf. Secur. 2019, 12, 1007–1024. [Google Scholar] [CrossRef]
  10. Ma, R.; Kaber, D.B. Situation awareness and workload in driving while using adaptive cruise control and a cell phone. Int. J. Ind. Ergon. 2005, 35, 939–953. [Google Scholar] [CrossRef]
  11. Martelaro, N.; Sirkin, D.; Ju, W. DAZE: A Real-Time Situation Awareness Measurement Tool for Driving. In Proceedings of the 7th International Conference on Automotive User Interfaces and Interactive Vehicular Applications, AutomotiveUI’15, New York, NY, USA, 1–3 September 2015; pp. 158–163. [Google Scholar] [CrossRef]
  12. Sirkin, D.; Martelaro, N.; Johns, M.; Ju, W. Toward Measurement of Situation Awareness in Autonomous Vehicles. In Proceedings of the 2017 CHI Conference on Human Factors in Computing Systems (CHI ’17); IEEE: New York, NY, USA, 2017; pp. 405–415. [Google Scholar]
  13. Salmon, P.M.; Stanton, N.A.; Walker, G.H.; Jenkins, D.; Ladva, D.; Rafferty, L.; Young, M. Measuring Situation Awareness in complex systems: Comparison of measures study. Int. J. Ind. Ergon. 2009, 39, 490–500. [Google Scholar] [CrossRef]
  14. Gugerty, L. Situation awareness in driving. In Handbook for Driving Simulation in Engineering, Medicine and Psychology; CRC Press: Boca Raton, FL, USA, 2011; Volume 1, pp. 265–272. [Google Scholar]
  15. Endsley, M.R. Direct measurement of situation awareness: Validity and use of SAGAT. In Situational Awareness; Routledge: London, UK, 2017; pp. 129–156. [Google Scholar]
  16. Park, S.; Xing, Y.; Akash, K.; Misu, T.; Boyle, L.N. The Impact of Environmental Complexity on Drivers’ Situation Awareness. In Proceedings of the 14th International Conference on Automotive User Interfaces and Interactive Vehicular Applications (AutomotiveUI’22); IEEE: New York, NY, USA, 2022; pp. 131–138. [Google Scholar] [CrossRef]
  17. Alcazar, H.; Martinez, J.; Pantoja, L.; Collazos, C.; Paz, A. Method for Incorporating Awareness Mechanisms in Driving Simulation Environments. IEEE Lat. Am. Trans. 2014, 12, 36–41. [Google Scholar] [CrossRef]
  18. Dunsmoir, J.W.; Jambunathan, S.; Kinstler, S.S.; Barnes, T.H.; Walton, C.S. Systems and Arrangements for Providing Situational Awareness to an Operator of a Vehicle. U.S. Patent No. 7,633,383, 15 December 2009. [Google Scholar]
  19. Köhn, T.; Gottlieb, M.; Schermann, M.; Krcmar, H. Improving Take-over Quality in Automated Driving by Interrupting Non-driving Tasks. In Proceedings of the 24th International Conference on Intelligent User Interfaces, IUI ’19, Rey, CA, USA, 16–20 March 2019; pp. 510–517. [Google Scholar]
  20. Harrington, N.J.; Narayanaswami, C. Method and System for Improving Driver Safety and Situational Awareness. U.S. Patent No. 7,692,552, 6 April 2010. [Google Scholar]
  21. Md. Yusof, N.; Karjanto, J.; Kapoor, S.; Terken, J.; Delbressine, F.; Rauterberg, M. Experimental Setup of Motion Sickness and Situation Awareness in Automated Vehicle Riding Experience. In Proceedings of the 9th International Conference on Automotive User Interfaces and Interactive Vehicular Applications Adjunct, AutomotiveUI ’17, Oldenburg, Germany, 24–27 September 2017; pp. 104–109. [Google Scholar]
  22. Read, J.M.; Saleem, J.J. Task performance and situation awareness with a virtual reality head-mounted display. In Proceedings of the Human Factors and Ergonomics Society Annual Meeting, Los Angeles, CA, USA, 30 March–2 April 2017; Volume 61, pp. 2105–2109. [Google Scholar]
  23. Wang, Z.; Zheng, R.; Kaizuka, T.; Nakano, K. Relationship Between Gaze Behavior and Steering Performance for Driver–Automation Shared Control: A Driving Simulator Study. IEEE Trans. Intell. Veh. 2019, 4, 154–166. [Google Scholar] [CrossRef]
  24. Navarro, J.; Osiurak, F.; Ovigue, M.; Charrier, L.; Reynaud, E. Highly Automated Driving Impact on Drivers’ Gaze Behaviors during a Car-Following Task. Int. J. Hum.-Comput. Interact. 2019, 35, 1008–1017. [Google Scholar] [CrossRef]
  25. Hergeth, S.; Lorenz, L.; Vilimek, R.; Krems, J. Keep Your Scanners Peeled: Gaze Behavior as a Measure of Automation Trust During Highly Automated Driving. Hum. Factors 2016, 58, 509–519. [Google Scholar] [CrossRef] [PubMed]
  26. van Veen, T.; Karjanto, J.; Terken, J. Situation Awareness in Automated Vehicles Through Proximal Peripheral Light Signals. In Proceedings of the 9th International Conference on Automotive User Interfaces and Interactive Vehicular Applications, AutomotiveUI ’17, Oldenburg, Germany, 24–27 September 2017; pp. 287–292. [Google Scholar]
  27. Bin Karjanto, J.; Md. Yusof, N.; Wang, C.; Delbressine, F.; Rauterberg, M.; Terken, J.; Martini, A. Situation Awareness and Motion Sickness in Automated Vehicle Driving Experience: A Preliminary Study of Peripheral Visual Information. In Proceedings of the 9th International Conference on Automotive User Interfaces and Interactive Vehicular Applications Adjunct, AutomotiveUI ’17, Oldenburg, Germany, 24–27 September 2017; pp. 57–61. [Google Scholar] [CrossRef]
  28. van Huysduynen, H.H.; Terken, J.; Meschtscherjakov, A.; Eggen, B.; Tscheligi, M. Ambient Light and Its Influence on Driving Experience. In Proceedings of the 9th International Conference on Automotive User Interfaces and Interactive Vehicular Applications, AutomotiveUI ’17, Oldenburg, Germany, 24–27 September 2017; pp. 293–301. [Google Scholar] [CrossRef]
  29. Löcken, A.; Frison, A.K.; Fahn, V.; Kreppold, D.; Götz, M.; Riener, A. Increasing User Experience and Trust in Automated Vehicles via an Ambient Light Display. In Proceedings of the 22nd International Conference on Human-Computer Interaction with Mobile Devices and Services, MobileHCI ’20, Oldenburg, Germany, 5–8 October 2020. [Google Scholar] [CrossRef]
  30. Löcken, A.; Heuten, W.; Boll, S. Supporting Lane Change Decisions with Ambient Light. In Proceedings of the 7th International Conference on Automotive User Interfaces and Interactive Vehicular Applications (AutomotiveUI ’15); IEEE: New York, NY, USA, 2015; pp. 204–211. [Google Scholar]
  31. Yang, Y.; Karakaya, B.; Dominioni, G.C.; Kawabe, K.; Bengler, K. An hmi concept to improve driver’s visual behavior and situation awareness in automated vehicle. In Proceedings of the 2018 21st International Conference on Intelligent Transportation Systems (ITSC); IEEE: New York, NY, USA, 2018; pp. 650–655. [Google Scholar]
  32. Gao, X.; Wu, X.; Ho, S.; Misu, T.; Akash, K. Effects of Augmented-Reality-Based Assisting Interfaces on Drivers’ Object-wise Situational Awareness in Highly Autonomous Vehicles. In Proceedings of the 2022 IEEE Intelligent Vehicles Symposium (IV); IEEE: New York, NY, USA, 2022; pp. 563–572. [Google Scholar]
  33. Feierle, A.; Schlichtherle, F.; Bengler, K. Augmented Reality Head-Up Display: A Visual Support During Malfunctions in Partially Automated Driving? IEEE Trans. Intell. Transp. Syst. 2021, 23, 4853–4865. [Google Scholar] [CrossRef]
  34. Hecht, T.; Weng, S.; Kick, L.F.; Bengler, K. How users of automated vehicles benefit from predictive ambient light displays. Appl. Ergon. 2022, 103, 103762. [Google Scholar] [CrossRef] [PubMed]
  35. Pullukat, J.; Tanaka, S.; Jiang, J. P-25: Effects of Image Distance on Cognitive Tunneling with Augmented Reality Head Up Displays. SID Symp. Dig. Tech. Pap. 2020, 51, 1427–1430. [Google Scholar] [CrossRef]
  36. Karar, V.; Ghosh, S. Soft computing based hud brightness switching system for mitigating tunneling effect. Int. J. Electron. Commun. Comput. Eng. 2012, 3, 919–925. [Google Scholar]
  37. Karar, V.; Ghosh, S. Attention Tunneling: Effects of Limiting Field of View Due to Beam Combiner Frame of Head-Up Display. J. Disp. Technol. 2014, 10, 582–589. [Google Scholar] [CrossRef]
  38. Zheng, Y.; Brown, M.; Herdman, C.; Bleichman, D. Lane Position Head-Up Displays in Automobiles: Further Evidence for Cognitive Tunneling. In Proceedings of the 2007 International Symposium on Aviation Psychology, Dayton, OH, USA, 23–26 April 2007; pp. 782–784. [Google Scholar]
  39. Haeuslschmid, R.; Schnurr, L.; Wagner, J.; Butz, A. Contact-Analog Warnings on Windshield Displays Promote Monitoring the Road Scene. In Proceedings of the 7th International Conference on Automotive User Interfaces and Interactive Vehicular Applications (AutomotiveUI ’15); IEEE: New York, NY, USA, 2015; pp. 64–71. [Google Scholar] [CrossRef]
  40. Liang, N.; Yang, J.; Yu, D.; Prakah-Asante, K.O.; Curry, R.; Blommer, M.; Swaminathan, R.; Pitts, B.J. Using eye-tracking to investigate the effects of pre-takeover visual engagement on situation awareness during automated driving. Accid. Anal. Prev. 2021, 157, 106143. [Google Scholar] [CrossRef] [PubMed]
  41. Franz, B.; Haccius, J.P.; Stelzig-Krombholz, D.; Pfromm, M.; Kauer, M.; Abendroth, B. Evaluation of the SAGAT method for highly automated driving. In Proceedings of the 19th Triennaial Congress of the IEA, Melbourne, VIC, Australia, 9–14 August 2015. [Google Scholar]
  42. Colley, M.; Askari, A.; Walch, M.; Woide, M.; Rukzio, E. ORIAS: On-The-Fly Object Identification and Action Selection for Highly Automated Vehicles. In Proceedings of the 13th International Conference on Automotive User Interfaces and Interactive Vehicular Applications, AutomotiveUI ’21, Leeds, UK, 9–14 September 2021; pp. 79–89. [Google Scholar] [CrossRef]
  43. Colley, M.; Eder, B.; Rixen, J.O.; Rukzio, E. Effects of Semantic Segmentation Visualization on Trust, Situation Awareness, and Cognitive Load in Highly Automated Vehicles. In Proceedings of the 2021 CHI Conference on Human Factors in Computing Systems, CHI ’21, Online Virtual, 8–13 May 2021. [Google Scholar] [CrossRef]
  44. Colley, M.; Jansen, P.; Rukzio, E.; Gugenheimer, J. SwiVR-Car-Seat: Exploring Vehicle Motion Effects on Interaction Quality in Virtual Reality Automated Driving Using a Motorized Swivel Seat. Proc. ACM Interact. Mob. Wearable Ubiquitous Technol. 2022, 5, 1–26. [Google Scholar] [CrossRef]
  45. Goedicke, D.; Bremers, A.W.; Lee, S.; Bu, F.; Yasuda, H.; Ju, W. XR-OOM: MiXed Reality Driving Simulation with Real Cars for Research and Design. In Proceedings of the 2022 CHI Conference on Human Factors in Computing Systems, CHI ’22, New Orleans, LA, USA, 30 April–5 May 2022. [Google Scholar] [CrossRef]
  46. McGill, M.; Wilson, G.; Medeiros, D.; Brewster, S.A. PassengXR: A Low Cost Platform for Any-Car, Multi-User, Motion-Based Passenger XR Experiences. In Proceedings of the 35th Annual ACM Symposium on User Interface Software and Technology (UIST ’22); IEEE: New York, NY, USA, 2022. [Google Scholar] [CrossRef]
Figure 1. Sequence of the events under the LED+HUD condition.
Vehicles 08 00108 g001
Figure 2. The direct objection indication via the HUD.
Vehicles 08 00108 g002
Figure 3. Interaction effect on the percent of correct responses for SA questions.
Vehicles 08 00108 g003
Figure 4. Mean percent of correct responses for SA questions (low-SA, high-SA, and all questions) under the three conditions.
Vehicles 08 00108 g004
Figure 5. Mean percent of correct text comprehension responses under the three conditions.
Vehicles 08 00108 g005
Figure 6. Mean ratings of experienced distraction while reading.
Vehicles 08 00108 g006
Disclaimer/Publisher’s Note: The statements, opinions and data contained in all publications are solely those of the individual author(s) and contributor(s) and not of MDPI and/or the editor(s). MDPI and/or the editor(s) disclaim responsibility for any injury to people or property resulting from any ideas, methods, instructions or products referred to in the content.