Functional Low-Fat Goat Feta Cheese Formulated with Dietary Fiber as a Fat Replacer: Physicochemical, Textural, and Sensory Interactions

 , , , , and
Abstract
1. Introduction
2. Materials and Methods
2.1. Materials
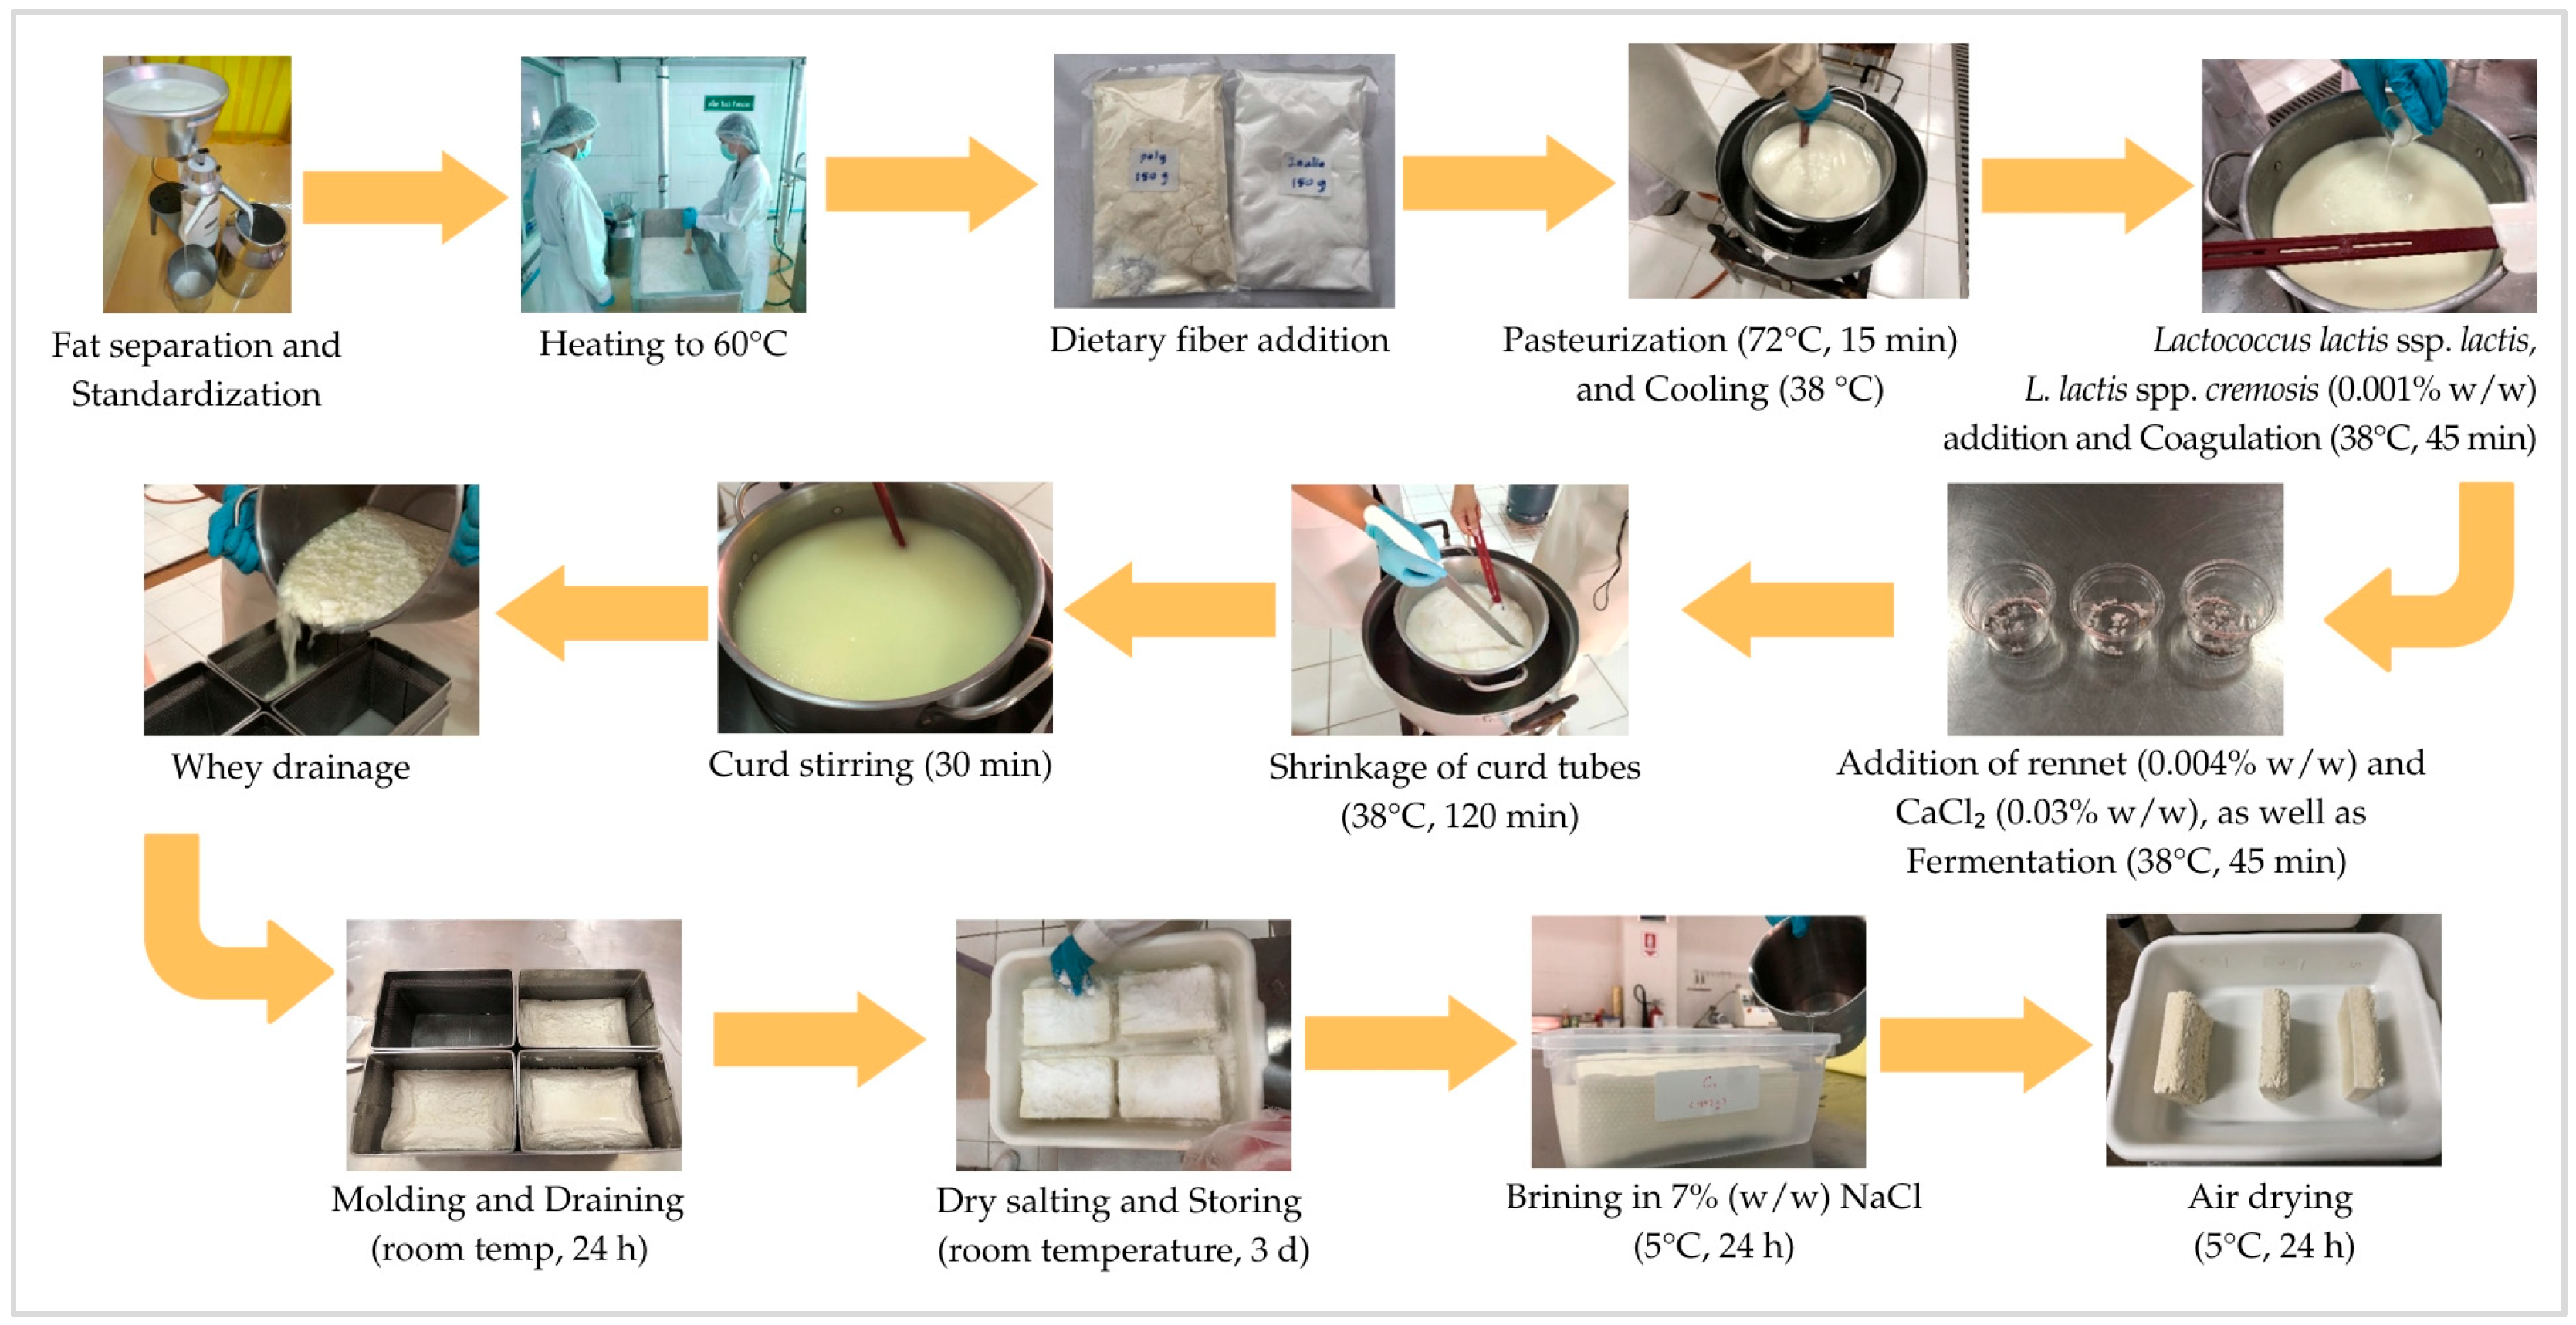
2.2. Optimization of Dietary Fiber Types and Goat Milk Fat Levels for Low-Fat Feta Cheese
2.3. Physicochemical Characterization
2.3.1. CIE Color
2.3.2. Moisture Content
2.3.3. Water Activity (aw)
2.3.4. pH Value
2.3.5. Lactic Acid Content
2.3.6. Lipid Content
2.4. Textural Profile Analysis
2.5. Microstructure
2.6. Sensory Evaluation
2.7. Statistical Analyses
3. Results and Discussion
3.1. Physicochemical Characteristics
3.1.1. Color, Moisture Content, and Water Activity
3.1.2. Chemical Composition
3.2. Textural Profile
3.3. Scanning Electron Microscopy
3.4. Sensory Attribute
4. Conclusions
Author Contributions
Funding
Institutional Review Board Statement
Informed Consent Statement
Data Availability Statement
Acknowledgments
Conflicts of Interest
References
- Hamdy, A.M.; Ahmed, M.E.; Mehta, D.; Elfaruk, M.S.; Hammam, A.R.A.; El-Derwy, Y.M.A. Enhancement of low-fat Feta cheese characteristics using probiotic bacteria. Food Sci. Nutr. 2021, 9, 62–70. [Google Scholar] [CrossRef] [PubMed]
- Michaelidou, A.; Katsiari, M.; Kondyli, E.; Voutsinas, L.; Alichanidis, E. Effect of a commercial adjunct culture on proteolysis in low-fat Feta-type cheese. Int. Dairy J. 2003, 13, 179–189. [Google Scholar] [CrossRef]
- Katsiari, M.C.; Voutsinas, L.P. Manufacture of low-fat Feta cheese. Food Chem. 1994, 49, 53–60. [Google Scholar] [CrossRef]
- Zonoubi, R.; Goli, M. The effect of complete replacing sodium with potassium, calcium, and magnesium brine on sodium-free ultrafiltration Feta cheese at the end of the 60-day ripening period: Physicochemical, proteolysis–lipolysis indices, microbial, colorimetric, and sensory evaluation. Food Sci. Nutr. 2021, 9, 866–874. [Google Scholar]
- Kamarinou, C.S.; Papadopoulou, O.S.; Doulgeraki, A.I.; Tassou, C.C.; Galanis, A.; Chorianopoulos, N.G.; Argyri, A.A. Application of multi-functional lactic acid bacteria strains in a pilot scale feta cheese production. Front. Microbiol. 2023, 14, 1254589. [Google Scholar] [CrossRef] [PubMed]
- Miocinovic, J.; Pudja, P.; Radulovic, Z.; Pavlovic, V.; Miloradovic, Z.; Radovanovic, M.; Dušanka, P. Development of low fat UF cheese technology. Mljekarstvo 2011, 61, 33–44. [Google Scholar]
- Koca, N.; Metin, M. Textural, melting and sensory properties of low-fat fresh kashar cheeses produced by using fat replacers. Int. Dairy J. 2004, 14, 365–373. [Google Scholar] [CrossRef]
- ME, A.; Hamdy, A.; El-Derway, Y.; El-Gazzar, F.; Abo El-Naga, I.G. Impact of Probiotic Bacteria on the Chemical Characteristics of Low-fat Soft White Cheese. Assiut J. Agric. Sci. 2020, 51, 1–10. [Google Scholar]
- Sánchez-Macías, D.; Fresno, M.; Moreno-Indias, I.; Castro, N.; Morales-delaNuez, A.; Álvarez, S.; Argüello, A. Physicochemical analysis of full-fat, reduced-fat, and low-fat artisan-style goat cheese1. J. Dairy Sci. 2010, 93, 3950–3956. [Google Scholar] [CrossRef]
- Fife, R.L.; McMahon, D.J.; Oberg, C.J. Functionality of Low Fat Mozzarella Cheese1. J. Dairy Sci. 1996, 79, 1903–1910. [Google Scholar] [CrossRef]
- Sipahioglu, O.; Alvarez, V.B.; Solano-Lopez, C. Structure, physico-chemical and sensory properties of feta cheese made with tapioca starch and lecithin as fat mimetics. Int. Dairy J. 1999, 9, 783–789. [Google Scholar] [CrossRef]
- Mistry, V.V. Low fat cheese technology. Int. Dairy J. 2001, 11, 413–422. [Google Scholar] [CrossRef]
- Romeih, E.A.; Michaelidou, A.; Biliaderis, C.G.; Zerfiridis, G.K. Low-fat white-brined cheese made from bovine milk and two commercial fat mimetics: Chemical, physical and sensory attributes. Int. Dairy J. 2002, 12, 525–540. [Google Scholar] [CrossRef]
- European Union. 1829/2002, C.R.E.N. amending the Annex to Regulation (EC) No 1107/96 with regard to the name ‘Feta’. In Official Journal of the European Communities L 277; European Union: Brussels, Belgium, 2002; pp. 10–14. [Google Scholar]
- Service UFA. Food Additives—Coloring Permitted in Thailand; Global Agricultural Information Network: Bangkok, Thailand, 2011; TH1010. [Google Scholar]
- Singh, A.; Zapata, R.C.; Pezeshki, A.; Reidelberger, R.D.; Chelikani, P.K. Inulin fiber dose-dependently modulates energy balance, glucose tolerance, gut microbiota, hormones and diet preference in high-fat-fed male rats. J. Nutr. Biochem. 2018, 59, 142–152. [Google Scholar] [CrossRef]
- Flood, M.T.; Auerbach, M.H.; Craig, S. A review of the clinical toleration studies of polydextrose in food. Food Chem. Toxicol. 2004, 42, 1531–1542. [Google Scholar] [CrossRef]
- Slavin, J.L. Carbohydrates, dietary fiber, and resistant starch in white vegetables: Links to health outcomes. Adv. Nutr. 2013, 4, 351S–355S. [Google Scholar] [CrossRef] [PubMed]
- Akalın, A.S.; Karagözlü, C.; Ünal, G. Rheological properties of reduced-fat and low-fat ice cream containing whey protein isolate and inulin. Eur. Food Res. Technol. 2008, 227, 889–895. [Google Scholar] [CrossRef]
- Srisuvor, N.; Chinprahast, N.; Prakitchaiwattana, C.; Subhimaros, S. Effects of inulin and polydextrose on physicochemical and sensory properties of low-fat set yoghurt with probiotic-cultured banana purée. LWT—Food Sci. Technol. 2013, 51, 30–36. [Google Scholar] [CrossRef]
- Akal, C. Using dietary fiber as stabilizer in dairy products: β-glucan and inulin-type fructans. J. Food Sci. Technol. 2023, 60, 2945–2954. [Google Scholar] [CrossRef]
- Roberfroid, M.B. Introducing inulin-type fructans. Br. J. Nutr. 2005, 93, S13–S25. [Google Scholar] [CrossRef]
- Lahtinen, S.J.; Knoblock, K.; Drakoularakou, A.; Jacob, M.; Stowell, J.; Gibson, G.R.; Ouwehand, A.C. Effect of molecule branching and glycosidic linkage on the degradation of polydextrose by gut microbiota. Biosci. Biotechnol. Biochem. 2010, 74, 2016–2021. [Google Scholar] [CrossRef] [PubMed]
- Holscher, H.D.; Caporaso, J.G.; Hooda, S.; Brulc, J.M.; Fahey, G.C., Jr.; Swanson, K.S. Fiber supplementation influences phylogenetic structure and functional capacity of the human intestinal microbiome: Follow-up of a randomized controlled trial. Am. J. Clin. Nutr. 2015, 101, 55–64. [Google Scholar] [CrossRef] [PubMed]
- Hooda, S.; Boler, B.M.V.; Serao, M.C.R.; Brulc, J.M.; Staeger, M.A.; Boileau, T.W.; Dowd, S.E.; Fahey, G.C., Jr.; Swanson, K.S. 454 pyrosequencing reveals a shift in fecal microbiota of healthy adult men consuming polydextrose or soluble corn fiber. J. Nutr. 2012, 142, 1259–1265. [Google Scholar] [CrossRef]
- Huang, L.; Mahmoud, A.-H.; Ehab, R.; Qing-Kun, Z.; Pan, Y.; Gavin, W.; Li, L. Textural and organoleptic properties of fat-free buffalo yogurt as affected by polydextrose. Int. J. Food Prop. 2020, 23, 1–8. [Google Scholar] [CrossRef]
- Abd Elmontaleb, H.; Hamdy, S.; Mabrouk, A.; Abbas, K. Physicochemical, viability, microstructure, and sensory properties of whole and skimmed buffalo set-yogurts containing different levels of polydextrose during refrigerated storage. J. Food Process. Preserv. 2022, 45, e15643. [Google Scholar]
- Nath, B.; Arora, S.; Nagaraj, V. Polydextrose as a functional ingredient and its food applications: A review. Indian J. Dairy Sci. 2015, 69, 239–251. [Google Scholar]
- Abbas, H.; El-Gawad, M.A.M.A.; Kassem, J.M.; Salama, M. Application of fat replacers in dairy products: A review. Foods Raw Mater. 2024, 12, 319–333. [Google Scholar] [CrossRef]
- Do Carmo, M.M.R.; Walker, J.C.L.; Novello, D.; Caselato, V.M.; Sgarbieri, V.C.; Ouwehand, A.C.; Andreollo, N.A.; Hiane, P.A.; Dos Santos, E.F. Polydextrose: Physiological Function, and Effects on Health. Nutrients 2016, 8, 553. [Google Scholar] [CrossRef]
- Craig, S.; Holden, J.; Troup, J.; Auerbach, M.; Frier, H. Polydextrose as soluble fiber and complex carbohydrate. In Complex Carbohydrates in Foods; CRC Press: Boca Raton, FL, USA, 1999; pp. 920–957. [Google Scholar]
- Jie, Z.; Bang-yao, L.; Ming-Jie, X.; Hai-wei, L.; Zu-kang, Z.; Ting-song, W.; Craig, S.A. Studies on the effects of polydextrose intake on physiologic functions in Chinese people. Am. J. Clin. Nutr. 2000, 72, 1503–1509. [Google Scholar] [CrossRef]
- Yahyavi, F.; Elham, S.; Kalajahi, M. A study of the possibility of low-fat Feta cheese production using dietary fiber. Adv. Environ. Biol. 2014, 8, 1245–1249. [Google Scholar]
- Tinpovong, B.; Sriwilai, K.; Prasongsap, R.; Wongkaew, M.; Inpramoon, A. Physical and biological factors on textural characteristics of Feta cheese from goat milk. J. Agric. Re-Search Commun. 2022, 38, 319–329. [Google Scholar]
- Wongkaew, M.; Sommano, S.R.; Tangpao, T.; Rachtanapun, P.; Jantanasakulwong, K. Mango Peel Pectin by Microwave-Assisted Extraction and Its Use as Fat Replacement in Dried Chinese Sausage. Foods 2020, 9, 450. [Google Scholar] [CrossRef]
- Bolumar, T.; Toepfl, S.; Heinz, V. Fat reduction and replacement in dry-cured fermented sausage by using high pressure processing meat as fat replacer and olive oil. Pol. J. Food Nutr. Sci. 2015, 65, 175–182. [Google Scholar] [CrossRef]
- Horwitz, W.; Latimer, G. AOAC Official Methods of Analysis of AOAC International; AOAC International: Gaithersburg, MD, USA, 2005. [Google Scholar]
- Kaczyński, Ł.K. Analysis of Water Activity and Gloss of Stored Goat Cheeses According to Consumer Preferences and Tastes. Foods 2024, 13, 3789. [Google Scholar] [CrossRef]
- Rani, K.; Jayani, N.; Feneke, F.; Melanda, S. Preparation and evaluation of gelatin and pectin-based Moringa oleifera chewable-gummy tablets. In IOP Conference Series: Earth and Environmental Science, Proceedings of the 4th International Conference on Bioscience and Biotechnology, Bogor, Indonesia (Virtual), 16–18 August 2021; IOP Publishing Ltd: Bristol, UK, 2021; Volume 913, p. 012082. [Google Scholar] [CrossRef]
- Subramanian, A.; Rodriguez-Saona, L. Chapter 5—Chemical and Instrumental Approaches to Cheese Analysis. In Advances in Food and Nutrition Research; Taylor, S.L., Ed.; Academic Press: Cambridge, MA, USA, 2010; Volume 59, pp. 167–213. [Google Scholar]
- Al-Mentafji, H.N. A.O.A.C 2005; AOAC International: Gaithersburg, MD, USA, 2016. [Google Scholar]
- Rashidi, H.; Mazaheri-Tehrani, M.; Razavi, M.; Ghods-Rohani, M. Improving textural and sensory characteristics of low-fat UF Feta cheese made with fat replacers. J. Agric. Sci. Technol. 2015, 17, 121–132. [Google Scholar]
- Omrani Khiabanian, N.; Motamedzadegan, A.; Naghizadeh Raisi, S.; Alimi, M. Chemical, textural, rheological, and sensorial properties of wheyless feta cheese as influenced by replacement of milk protein concentrate with pea protein isolate. J. Texture Stud. 2020, 51, 488–500. [Google Scholar] [CrossRef] [PubMed]
- Schädle, C.N.; Eisner, P.; Bader-Mittermaier, S. The combined effects of different fat replacers and rennet casein on the properties of reduced-fat processed cheese. J. Dairy Sci. 2020, 103, 3980–3993. [Google Scholar] [CrossRef]
- Guinee, T.P.; Carić, M.; Kaláb, M. Pasteurized processed cheese and substitute/imitation cheese products. In Cheese: Chemistry, Physics and Microbiology; Fox, P.F., McSweeney, P.L.H., Cogan, T.M., Guinee, T.P., Eds.; Academic Press: Cambridge, MA, USA, 2004; Volume 2, pp. 349–394. [Google Scholar]
- Karimi, R.; Azizi, M.H.; Ghasemlou, M.; Vaziri, M. Application of inulin in cheese as prebiotic, fat replacer and texturizer: A review. Carbohydr. Polym. 2015, 119, 85–100. [Google Scholar] [CrossRef]
- Liu, T.; Wu, J.; Aziz, T.; Xue, R.; Khowdiary, M.M.; Yang, Z. Changes of physicochemical and functional properties of processed cheese made with natural cheddar and mozzarella cheeses during refrigerated storage. Sci. Rep. 2024, 14, 3714. [Google Scholar] [CrossRef]
- Osorio-Arias, J.; Pérez-Martínez, A.; Vega-Castro, O.; Martínez-Monteagudo, S.I. Rheological, texture, structural, and functional properties of Greek-style yogurt fortified with cheese whey-spent coffee ground powder. LWT 2020, 129, 109523. [Google Scholar] [CrossRef]
- Garnier, L.; Valence, F.; Pawtowski, A.; Auhustsinava-Galerne, L.; Frotté, N.; Baroncelli, R.; Deniel, F.; Coton, E.; Mounier, J. Diversity of spoilage fungi associated with various French dairy products. Int. J. Food Microbiol. 2017, 241, 191–197. [Google Scholar] [CrossRef] [PubMed]
- Rolet-Répécaud, O.; Berthier, F.; Beuvier, E.; Gavoye, S.; Notz, E.; Roustel, S.; Gagnaire, V.; Achilleos, C. Characterization of the non-coagulating enzyme fraction of different milk-clotting preparations. LWT—Food Sci. Technol. 2013, 50, 459–468. [Google Scholar] [CrossRef]
- Ong, L.; Pax, A.P.; Ong, A.; Vongsvivut, J.; Tobin, M.J.; Kentish, S.E.; Gras, S.L. The effect of pH on the fat and protein within cream cheese and their influence on textural and rheological properties. Food Chem. 2020, 332, 127327. [Google Scholar] [CrossRef]
- McCarthy, C.M.; Wilkinson, M.G.; Kelly, P.M.; Guinee, T.P. Effect of salt and fat reduction on the composition, lactose metabolism, water activity and microbiology of Cheddar cheese. Dairy Sci. Technol. 2015, 95, 587–611. [Google Scholar] [CrossRef]
- Widyastuti, Y.; Rohmatussolihat, R.; Febrisiantosa, A. The Role of Lactic Acid Bacteria in Milk Fermentation. Food Nutr. Sci. 2014, 5, 435–442. [Google Scholar] [CrossRef]
- Biegalski, J.; Cais-Sokolińska, D. Production of Sensorily Acceptable Pasta Filata Cheese with Partial Substitution of Sheep’s Milk Powder in Different Forms. Foods 2023, 12, 1766. [Google Scholar] [CrossRef] [PubMed]
- Peediekal, N.N.; Malayanakath, M.S.; Chandran, A.; Suresh, A.; Nair, R.R.; James, S. Optimisation of brine concentration in feta type cheese made using malabari goat milk. Int. J. Vet. Sci. Anim. Husb. 2024, 9, 549–553. [Google Scholar]
- McSweeney, P.L.H. (Ed.) Salt in cheese. In Cheese Problems Solved; Woodhead Publishing: Sawston, UK, 2007; pp. 80–99. [Google Scholar]
- Rita, S.; Valéria, M.; Vidigal, M.; Silva, A.; Simiqueli, A.; Minim, L. Sensory and Instrumental Consistency of Processed Cheeses. J. Food Res. 2012, 1, 204. [Google Scholar] [CrossRef]
- Szczesniak, A.S. Texture is a sensory property. Food Qual. Prefer. 2002, 13, 215–225. [Google Scholar] [CrossRef]
- Cooke, D.R.; Khosrowshahi, A.; McSweeney, P.L.H. Effect of gum tragacanth on the rheological and functional properties of full-fat and half-fat Cheddar cheese. Dairy Sci. Technol. 2013, 93, 45–62. [Google Scholar] [CrossRef]
- O’Connor, T.; O’Brien, N. Butter and other milk fat products|fat replacers. In Encyclopedia of Dairy Sciences, 2nd ed.; Academic Press: Cambridge, MA, USA, 2011. [Google Scholar]
- Fox, P.F.; Guinee, T.P.; Cogan, T.M.; McSweeney, P.L. Fundamentals of Cheese Science; Springer: Berlin/Heidelberg, Germany, 2017. [Google Scholar]
- Papademas, P.; Bintsis, T. Global Cheesemaking Technology: Cheese Quality and Characteristics; Wiley: Hoboken, NJ, USA, 2017. [Google Scholar]
- Wadhwani, R. Investigating the Strategies to Improve the Quality of Low-Fat Mozzarella and Cheddar Cheeses. Ph.D. Thesis, Utah State University, Logan, UT, USA, 2011. [Google Scholar]
- Nikolić, I.; Šoronja-Simović, D.; Zahorec, J.; Dokić, L.; Lončarević, I.; Stožinić, M.; Petrović, J. Polysaccharide-Based Fat Replacers in the Functional Food Products. Processes 2024, 12, 2701. [Google Scholar] [CrossRef]
- Roberfroid, M.B. Inulin-type fructans: Functional food ingredients. J. Nutr. 2007, 137, 2493S–2502S. [Google Scholar] [CrossRef]
- Ünal, B.; Metin, S.; Işıklı, N.D. Use of response surface methodology to describe the combined effect of storage time, locust bean gum and dry matter of milk on the physical properties of low-fat set yoghurt. Int. Dairy J. 2003, 13, 909–916. [Google Scholar] [CrossRef]
- Rahman, M.; Al-Mahrouqi, A. Instrumental texture profile analysis of gelatin gel extracted from grouper skin and commercial (bovine and porcine) gelatin gels. Int. J. Food Sci. Nutr. 2009, 60 (Suppl. 7), 229–242. [Google Scholar] [CrossRef] [PubMed]
- Chandra, M.V.; Shamasundar, B.A. Texture Profile Analysis and Functional Properties of Gelatin from the Skin of Three Species of Fresh Water Fish. Int. J. Food Prop. 2015, 18, 572–584. [Google Scholar] [CrossRef]
- Rowney, M.K.; Roupas, P.; Hickey, M.W.; Everett, D.W. Salt-induced structural changes in 1-day old Mozzarella cheese and the impact upon free oil formation. Int. Dairy J. 2004, 14, 809–816. [Google Scholar] [CrossRef]
- Hickey, D.K.; Guinee, T.P.; Hou, J.; Wilkinson, M.G. Effects of variation in cheese composition and maturation on water activity in Cheddar cheese during ripening. Int. Dairy J. 2013, 30, 53–58. [Google Scholar] [CrossRef]
- Saurel, R.; Pajonk, A.; Andrieu, J. Modelling of French Emmental cheese water activity during salting and ripening periods. J. Food Eng. 2004, 63, 163–170. [Google Scholar] [CrossRef]
- Fox, P.F.; Guinee, T.P.; Cogan, T.M.; McSweeney, P.L.H. Cheese: Structure, Rheology and Texture. In Fundamentals of Cheese Science; Fox, P.F., Guinee, T.P., Cogan, T.M., McSweeney, P.L.H., Eds.; Springer US: Boston, MA, USA, 2017; pp. 475–532. [Google Scholar]
- Tunick, M. Cheese Rheology and Texture. In Handbook of Cheese Chemistry; Royal Society of Chemistry: London, UK, 2023; pp. 202–222. [Google Scholar]
- Mestani, M.; Ramadani, X.; Maloku-Gjergji, T.; Mehmeti, H.; Ademi, A.; Mehmeti, I. The effect of saline concentration and storage temperature in the quality of Sharri cheese. Food Agric. Environ. 2017, 15, 12–17. [Google Scholar]
- González, N.; Abarquero, D.; Combarros-Fuertes, P.; Prieto, B.; Jm, F.; Tornadijo, M. Influence of Salting on Physicochemical and Sensory Parameters of Blue-Veined Cheeses. Dairy 2024, 5, 93–105. [Google Scholar] [CrossRef]
- Lamichhane, P.; Kelly, A.L.; Sheehan, J.J. Symposium review: Structure-function relationships in cheese. J. Dairy Sci. 2018, 101, 2692–2709. [Google Scholar] [CrossRef]
- Murtaza, M.S.; Sameen, A.; Rehman, A.; Huma, N.; Hussain, F.; Hussain, S.; Cacciotti, I.; Korma, S.A.; Ibrahim, S.A.; Ma, Y.K. Physicochemical, techno-functional, and proteolytic effects of various hydrocolloids as fat replacers in low-fat cheddar cheese. Front. Sustain. Food Syst. 2024, 8, 1440310. [Google Scholar] [CrossRef]
- Islam, M.; Alharbi, M.A.; Alharbi, N.K.; Rafiq, S.; Shahbaz, M.; Murtaza, S.; Raza, N.; Farooq, U.; Ali, M.; Imran, M.; et al. Effect of Inulin on Organic Acids and Microstructure of Synbiotic Cheddar-Type Cheese Made from Buffalo Milk. Molecules 2022, 27, 5137. [Google Scholar] [CrossRef] [PubMed]
- Kip, P.; Meyer, D.; Jellema, R.H. Inulins improve sensoric and textural properties of low-fat yoghurts. Int. Dairy J. 2006, 16, 1098–1103. [Google Scholar] [CrossRef]
- Sarwar, A.; Aziz, T.; Al-Dalali, S.; Zhao, X.; Zhang, J.; ud Din, J.; Chen, C.; Cao, Y.; Yang, Z. Physicochemical and Microbiological Properties of Synbiotic Yogurt Made with Probiotic Yeast Saccharomyces boulardii in Combination with Inulin. Foods 2019, 8, 468. [Google Scholar] [CrossRef]
- Juan, B.; Zamora, A.; Quintana, F.; Guamis, B.; Trujillo, A.-J. Effect of inulin addition on the sensorial properties of reduced-fat fresh cheese. Int. J. Dairy Technol. 2013, 66, 478–483. [Google Scholar] [CrossRef]
- Ayyash, M.M.; Shah, N.P. Effect of partial substitution of NaCl with KCl on proteolysis of halloumi cheese. J. Food Sci. 2011, 76, C31–C37. [Google Scholar] [CrossRef]
- Miocinovic, J.; Miloradovic, Z.; Radovanovic, M.; Sredovic Ignjatovic, I.; Radulovic, A.; Nastaj, M.; Sołowiej, B.G.; Tomasevic, I. Sodium Reduction by Partial and Total Replacement of NaCl with KCl in Serbian White Brined Cheese. Foods 2022, 11, 374. [Google Scholar] [CrossRef]
- Guichard, E. Interactions between flavor compounds and food ingredients and their influence on flavor perception. Food Rev. Int. 2002, 18, 49–70. [Google Scholar] [CrossRef]


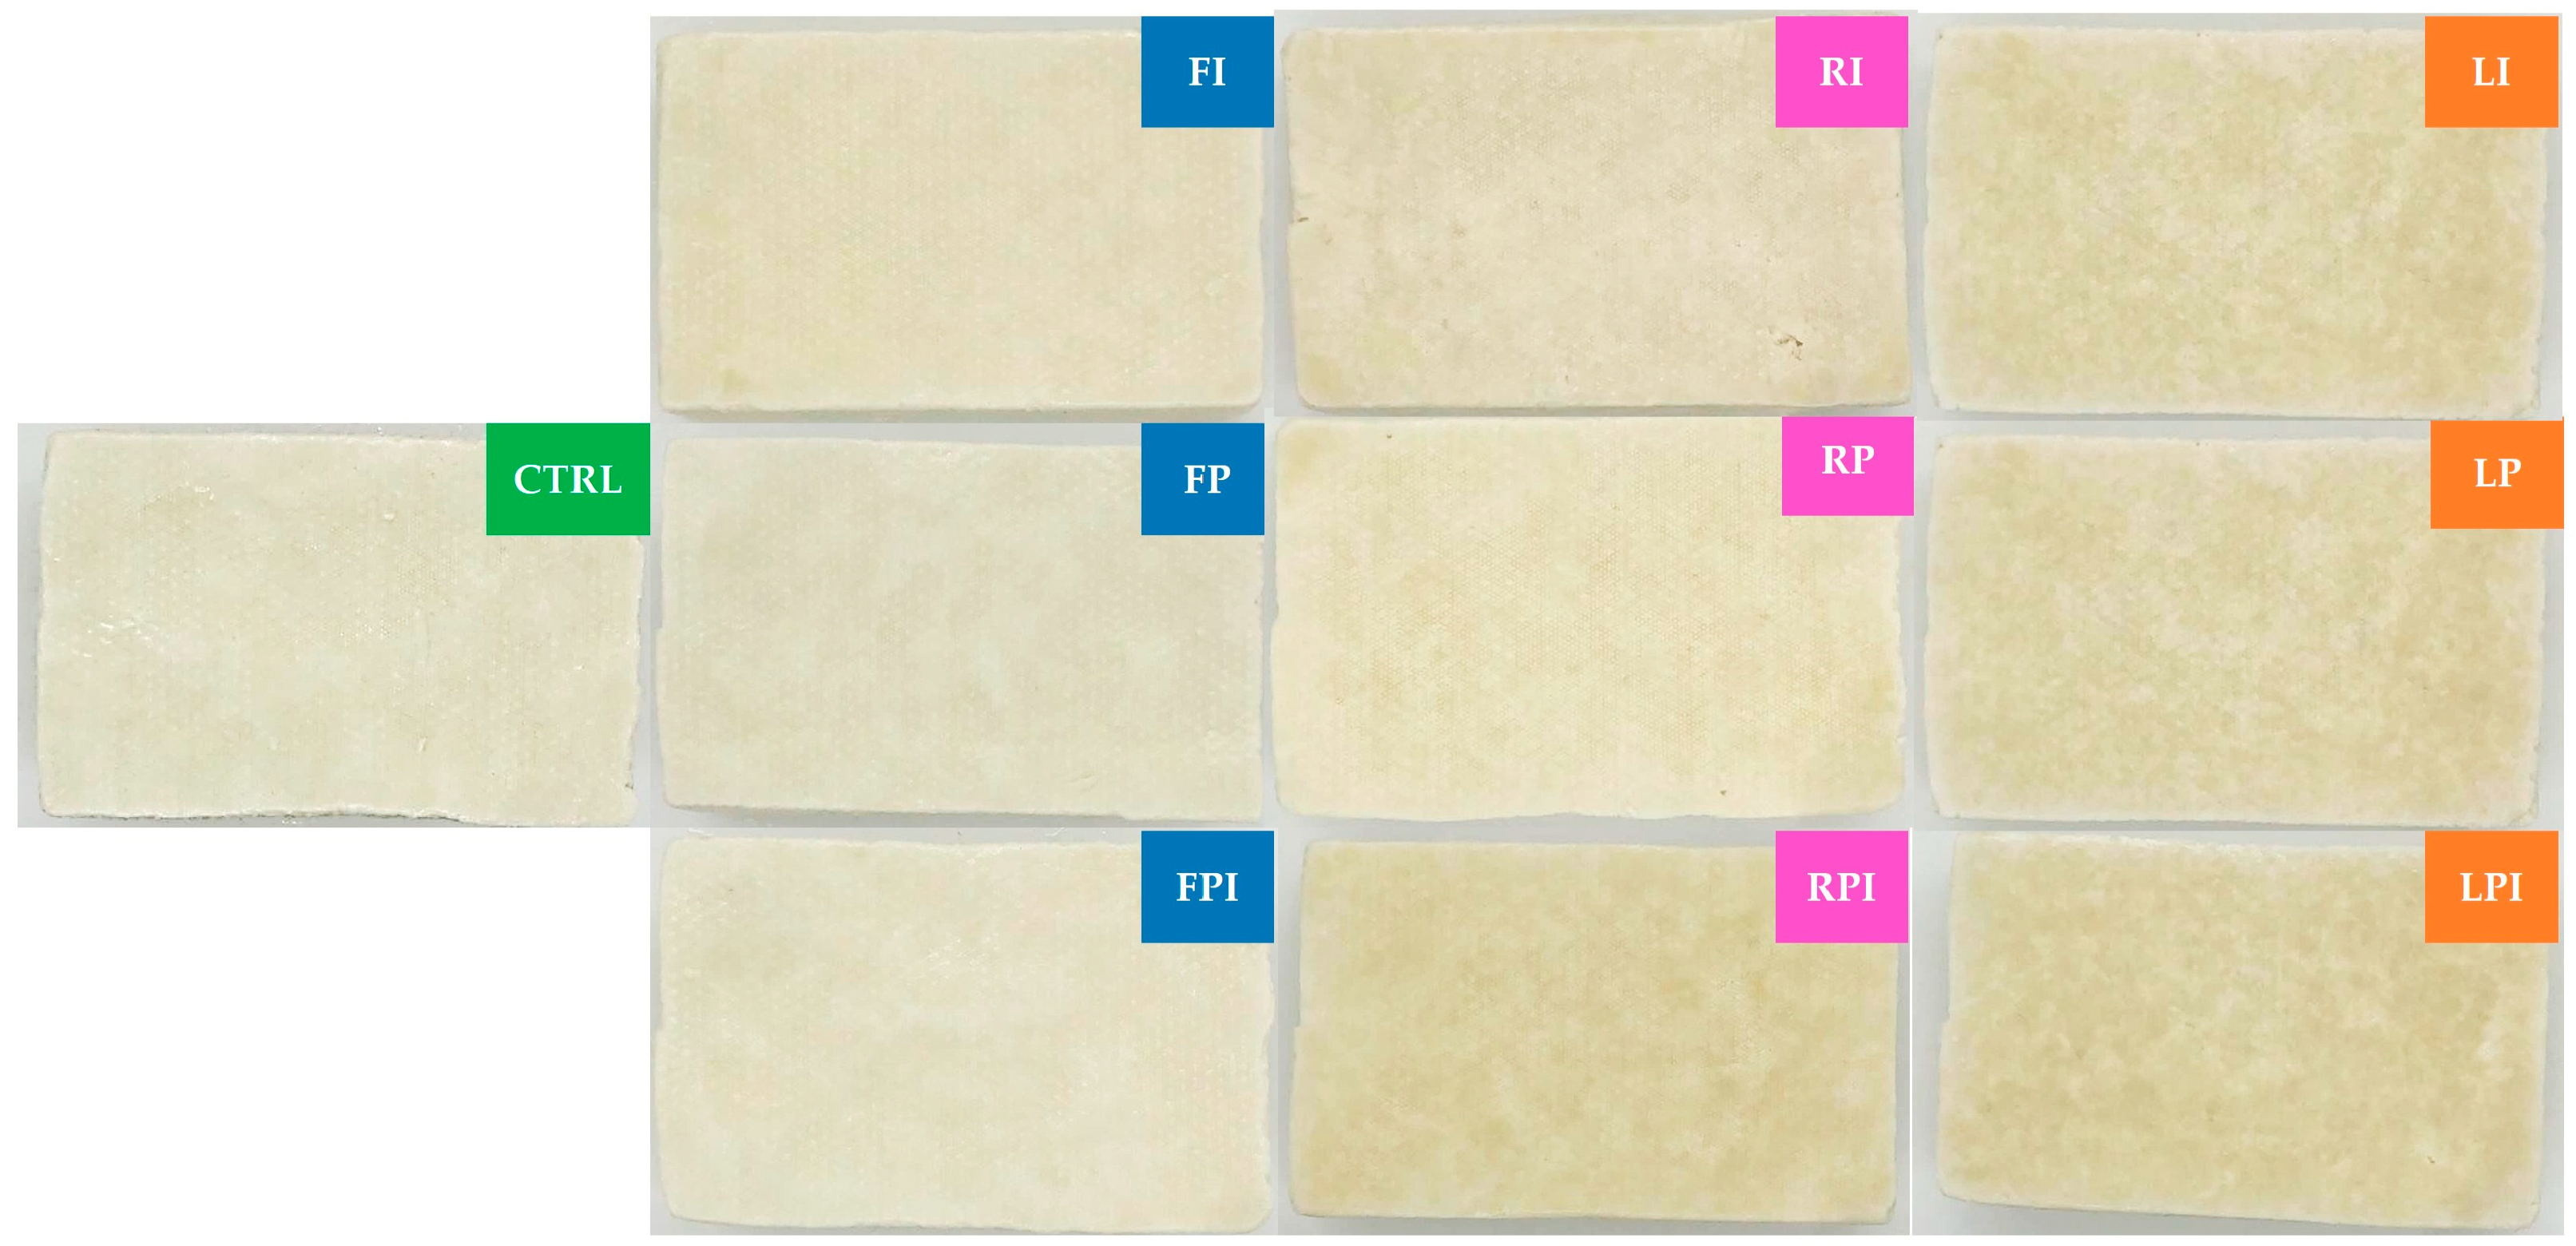
| Goat Milk Fat Levels | 1.0% PDX (P) | 1.0% Inulin (I) | 0.5% PDX + 0.5% Inulin (PI) |
|---|---|---|---|
| CTRL | - | - | - |
| Full-fat (FFC) | FP | FI | FPI |
| Reduced-fat (RFC) | RP | RI | RPI |
| Low-fat (LFC) | LP | LI | LPI |
| Treatments | Color | Moisture Content (%Dry Basis) | aw | |||
|---|---|---|---|---|---|---|
| L* | a* | b* | ΔE | |||
| Control | 90.57 ± 0.74 a | −1.76 ± 0.89 f | 11.76 ± 1.14 d | - | 65.13 ± 0.33 a | 0.8873 ± 0.0032 a |
| FP | 90.90 ± 0.65 bc | −0.74 ± 0.14 bcd | 12.64 ± 0.42 c | 2.07 ± 1.01 bc | 70.99 ± 0.35 c | 0.8935 ± 0.0005 a |
| FI | 90.50 ± 0.49 cd | −1.07 ± 0.21 de | 12.99 ± 0.73 abc | 2.33 ± 1.04 bcd | 74.07 ± 0.69 d | 0.8986 ± 0.0014 bc |
| FPI | 90.03 ± 0.36 d | −0.77 ± 0.09 bcd | 13.47 ± 0.57 a | 2.79 ± 1.25 bcd | 68.74 ± 0.50 b | 0.9009 ± 0.0003 cd |
| RP | 91.33 ± 0.29 ab | −0.28 ± 0.13 a | 11.81 ± 0.43 d | 2.13 ± 0.71 bc | 92.76 ± 0.23 f | 0.9099 ± 0.0008 d |
| RI | 91.63 ± 0.46 a | −0.38 ± 0.19 a | 11.70 ± 0.42 d | 1.88 ± 0.79 b | 107.28 ± 0.23 i | 0.9321 ± 0.0026 e |
| RPI | 90.33 ± 0.30 cd | −0.64 ± 0.08 abc | 12.82 ± 0.34 bc | 2.40 ± 0.92 bcd | 89.77 ± 0.53 e | 0.9523 ± 0.0077 f |
| LP | 88.46 ± 1.05 e | −0.59 ± 0.05 ab | 13.16 ± 0.64 abc | 3.83 ± 1.44 d | 103.24 ± 0.41 h | 0.8997 ± 0.0015 bcd |
| LI | 88.92 ± 0.57 e | −1.27 ± 0.15 e | 13.19 ± 0.27 abc | 3.30 ± 1.02 bcd | 101.06 ± 0.96 g | 0.8904 ± 0.0013 ab |
| LPI | 88.81 ± 0.46 e | −0.98 ± 0.15 cde | 13.35 ± 0.49 ab | 3.58 ± 0.89 cd | 103.10 ± 0.61 h | 0.8940 ± 0.0016 abc |
| Treatments | Lipid Content (%) | pH Value | Lactic Acid Content (%) | Salt Content (ppt) |
|---|---|---|---|---|
| Control | 26.94 ± 0.55 a | 5.70 ± 0.05 a | 0.5175 ± 0.056 a | 34.3 ± 0.94 ba |
| FP | 24.26 ± 0.84 b | 5.54 ± 0.09 ab | 0.5337 ± 0.009 a | 35.7 ± 0.47 ba |
| FI | 25.08 ± 0.11 ab | 5.53 ± 0.11 ab | 0.5472 ± 0.010 a | 33.7 ± 0.91 a |
| FPI | 26.42 ± 0.30 ab | 5.49 ± 0.07 ab | 0.5310 ± 0.015 a | 33.3 ± 1.25 a |
| RP | 12.57 ± 1.56 cd | 5.49 ± 0.13 ab | 0.7659 ± 0.020 d | 35.7 ± 0.47 ba |
| RI | 10.55 ± 0.80 d | 5.41 ± 0.09 b | 0.6534 ± 0.020 b | 35.7 ± 0.47 ba |
| RPI | 13.16± 0.20 c | 5.30 ± 0.04 b | 0.7245 ± 0.009 dc | 37.3 ± 1.25 cb |
| LP | 0.38 ± 0.06 e | 5.02 ± 0.02 c | 0.6856 ± 0.014 cb | 39.7 ± 0.47 dc |
| LI | 0.70 ± 0.44 e | 5.00 ± 0.02 c | 0.7038 ± 0.020 cb | 41.3 ± 1.25 d |
| LPI | 0.58 ± 0.06 e | 4.99 ± 0.02 c | 0.7218± 0.005 dc | 42.3 ± 0.47 d |
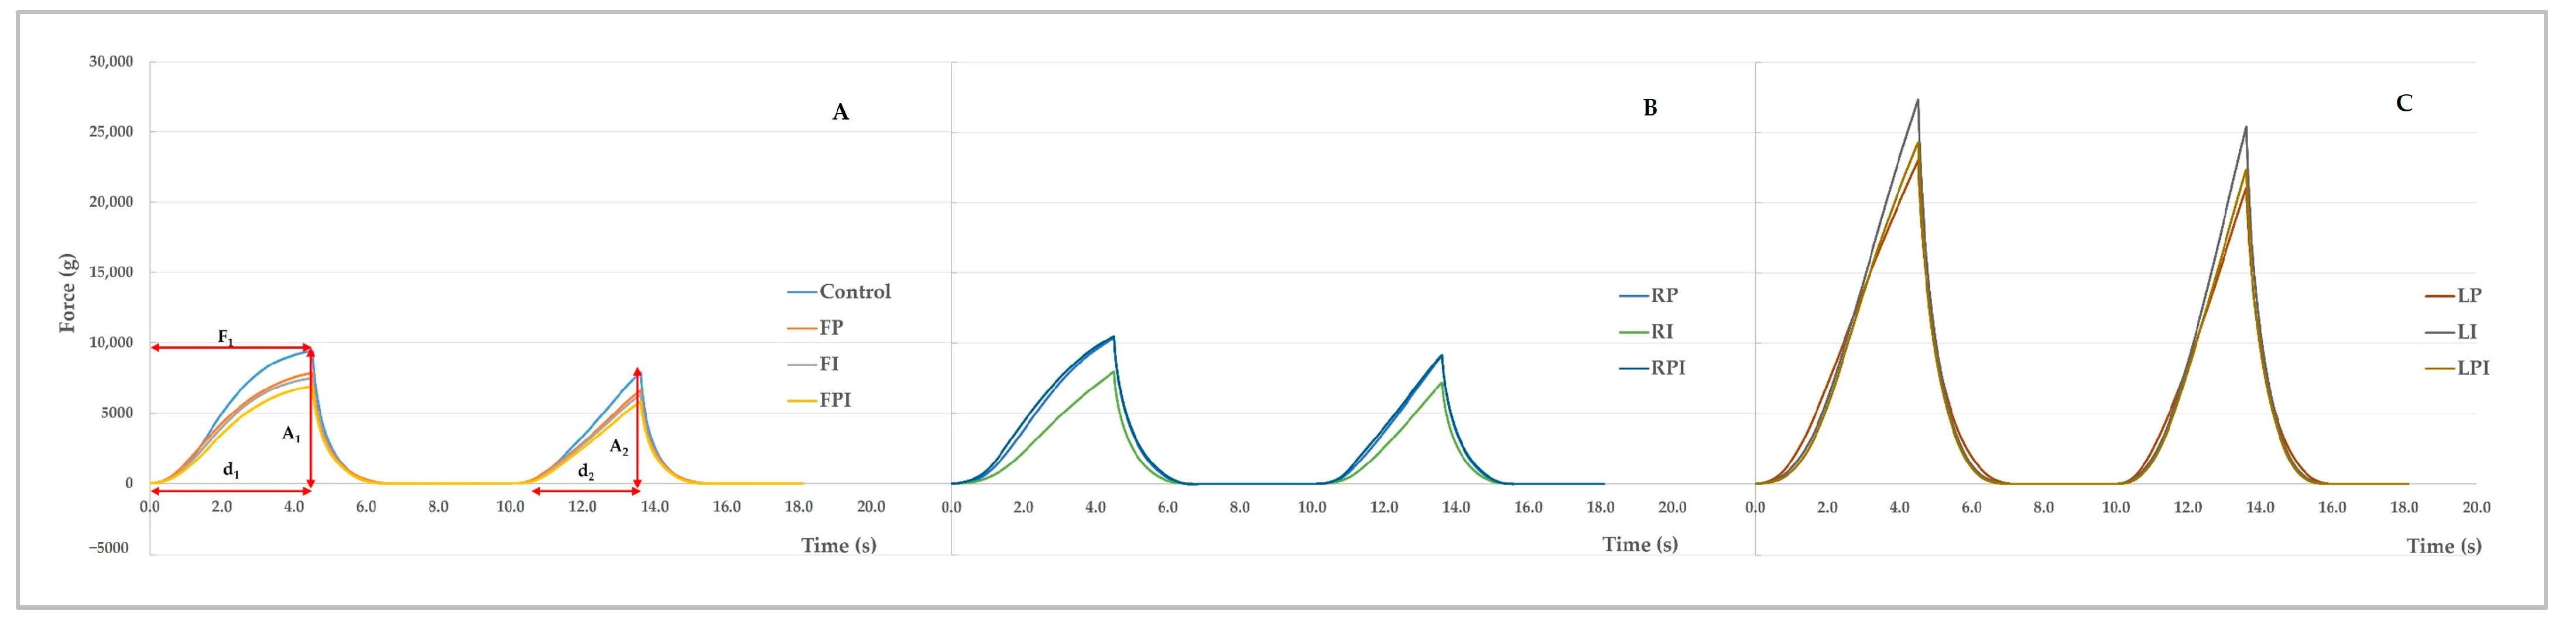
| Treatment | Hardness (g) | Cohesiveness | Springiness | Chewiness |
|---|---|---|---|---|
| CTRL | 9432 ± 946 c | 0.2846 ± 0.0488 d | 0.3543 ± 0.0477 c | 1071 ± 323 b |
| FP | 7847 ± 901 c | 0.3225 ± 0.0363 cd | 0.4071 ± 0.0244 bc | 1037 ± 222 b |
| FI | 7487 ± 1322 c | 0.3064 ±0.0229 cd | 0.3852 ± 0.0250 bc | 891 ± 225 b |
| FPI | 6904 ± 703 c | 0.3078 ± 0.0386 cd | 0.3809 ± 0.0296 bc | 813 ± 169 b |
| RP | 10,367 ± 1073 c | 0.4110 ± 0.0764 b | 0.4464 ± 0.0709 ab | 1944 ± 738 b |
| RI | 7964 ± 975 c | 0.4293 ± 0.0647 ab | 0.4368 ± 0.0713 ab | 1504 ± 444 b |
| RPI | 10,492 ± 1285 c | 0.3852 ± 0.0298 bc | 0.4313 ± 0.0280 abc | 1755 ± 339 b |
| LP | 23,021 ± 3692 b | 0.5054 ± 0.0550 a | 0.4994 ± 0.0730 a | 5798 ± 1376 a |
| LI | 27,328 ± 3948 a | 0.5106 ± 0.0600 a | 0.4573 ± 0.0379 ab | 6391 ± 1398 a |
| LPI | 24,293 ± 4888 ab | 0.5020 ± 0.0439 a | 0.4894 ± 0.0531 a | 5905 ± 1046 a |
| Sensory Characteristics | CTRL | FP | FI | FPI | RP | RI | RPI | LP | LI | LPI |
|---|---|---|---|---|---|---|---|---|---|---|
| Appearance | 7.71 ± 1.25 ns | 7.86 ± 1.07 ns | 7.86 ± 0.90 ns | 7.71 ± 0.95 ns | 7.71 ± 0.95 ns | 7.86 ± 0.90 ns | 7.29 ± 0.76 ns | 7.29 ± 1.25 ns | 7.14 ± 1.07 ns | 7.14 ± 0.90 ns |
| Color | 7.57 ± 0.90 ns | 7.43 ± 0.90 ns | 7.71 ± 0.88 ns | 7.43 ± 0.90 ns | 7.43 ± 0.90 ns | 7.57 ± 0.90 ns | 7.29 ± 1.03 ns | 7.14 ± 1.12 ns | 6.71 ± 1.03 ns | 6.71 ± 1.03 ns |
| Aroma | 7.71 ± 0.95 ns | 7.43 ± 1.27 ns | 7.57 ± 0.98 ns | 7.57 ± 0.98 ns | 7.29 ± 0.95 ns | 7.29 ± 0.95 ns | 7.14 ± 1.57 ns | 6.71 ± 1.38 ns | 6.57 ± 1.13 ns | 6.71 ± 1.11 ns |
| Saltiness | 6.71 ± 1.50 b | 7.29 ± 1.11 a | 6.43 ± 1.13 ab | 6.86 ± 0.90 ab | 7.00 ± 1.15 ab | 6.29 ± 1.50 ab | 6.57 ± 1.40 ab | 5.43 ± 1.40 a | 5.43 ± 1.62 a | 5.57 ± 1.62 a |
| Sourness | 6.57 ± 0.98 b | 6.86 ± 1.21 a | 6.29 ± 0.95 abc | 6.29 ± 0.95 abc | 6.43 ± 0.98 abc | 5.86 ± 1.07 abc | 6.14 ± 1.35 abc | 5.29 ± 1.11 bc | 5.29 ± 1.11 bc | 5.14 ± 1.21 c |
| Softness | 6.00 ± 1.29 a | 7.00 ± 1.15 a | 7.14 ± 1.07 a | 7.14 ± 1.07 a | 6.29 ± 1.25 a | 6.14 ± 1.21 a | 6.29 ± 1.25 a | 3.57 ± 1.90 b | 3.43 ± 1.51 b | 3.57 ± 2.15 b |
| Firmness | 6.43 ± 0.98 a | 7.00 ± 1.00 a | 7.00 ± 0.58 a | 7.14 ± 0.90 a | 6.86 ± 0.90 a | 6.86 ± 0.90 a | 6.57 ± 1.13 a | 3.71 ± 2.50 b | 3.86 ± 2.48 b | 3.57 ± 2.15 b |
| Crumbliness | 6.86 ± 0.69 a | 6.86 ± 1.07 a | 7.14 ± 0.69 a | 7.14 ± 1.07 a | 6.57 ± 1.13 a | 6.00 ± 1.41 a | 6.00 ± 1.15 a | 4.00 ± 1.83 b | 3.86 ± 1.95 b | 3.57 ± 2.07 b |
| Aftertaste | 6.86 ± 0.90 a | 7.00 ± 0.98 a | 6.86 ± 0.98 a | 7.14 ± 0.69 a | 7.00 ± 0.76 a | 6.86 ± 1.13 a | 6.29 ± 1.27 a | 5.14 ± 1.86 ab | 5.57 ± 1.38 ab | 5.00 ± 1.77 c |
| Overall acceptance | 6.86 ± 0.90 a | 7.43 ± 0.98 a | 7.43 ± 0.98 a | 7.14 ± 0.69 a | 6.71 ± 0.76 a | 6.43 ± 1.13 a | 6.43 ± 1.27 a | 3.86 ± 1.86 b | 3.71 ± 1.38 b | 3.86 ± 1.77 b |
Disclaimer/Publisher’s Note: The statements, opinions and data contained in all publications are solely those of the individual author(s) and contributor(s) and not of MDPI and/or the editor(s). MDPI and/or the editor(s) disclaim responsibility for any injury to people or property resulting from any ideas, methods, instructions or products referred to in the content. |
© 2025 by the authors. Licensee MDPI, Basel, Switzerland. This article is an open access article distributed under the terms and conditions of the Creative Commons Attribution (CC BY) license (https://creativecommons.org/licenses/by/4.0/).
Share and Cite
Wongkaew, M.; Tinpovong, B.; Inpramoon, A.; Chaimongkol, P.; Chailangka, A.; Thomya, S.; Salee, N. Functional Low-Fat Goat Feta Cheese Formulated with Dietary Fiber as a Fat Replacer: Physicochemical, Textural, and Sensory Interactions. Dairy 2025, 6, 31. https://doi.org/10.3390/dairy6040031
Wongkaew M, Tinpovong B, Inpramoon A, Chaimongkol P, Chailangka A, Thomya S, Salee N. Functional Low-Fat Goat Feta Cheese Formulated with Dietary Fiber as a Fat Replacer: Physicochemical, Textural, and Sensory Interactions. Dairy. 2025; 6(4):31. https://doi.org/10.3390/dairy6040031
Chicago/Turabian StyleWongkaew, Malaiporn, Bow Tinpovong, Aekarin Inpramoon, Pikulthong Chaimongkol, Auengploy Chailangka, Sureerat Thomya, and Nuttinee Salee. 2025. "Functional Low-Fat Goat Feta Cheese Formulated with Dietary Fiber as a Fat Replacer: Physicochemical, Textural, and Sensory Interactions" Dairy 6, no. 4: 31. https://doi.org/10.3390/dairy6040031
APA StyleWongkaew, M., Tinpovong, B., Inpramoon, A., Chaimongkol, P., Chailangka, A., Thomya, S., & Salee, N. (2025). Functional Low-Fat Goat Feta Cheese Formulated with Dietary Fiber as a Fat Replacer: Physicochemical, Textural, and Sensory Interactions. Dairy, 6(4), 31. https://doi.org/10.3390/dairy6040031