Article

Impact of Different Milk Types and Storage Period on the Quality Characteristics of Malatya Cheese

Department of Food Engineering, Faculty of Engineering, Adana Alparslan Turkes Science and Technology University, 01250 Adana, Turkey
*
Author to whom correspondence should be addressed.
Dairy 2025, 6(4), 30; https://doi.org/10.3390/dairy6040030
Submission received: 3 April 2025 / Revised: 22 June 2025 / Accepted: 24 June 2025 / Published: 26 June 2025
(This article belongs to the Section Milk Processing)

Abstract

In this study, Malatya cheeses were produced using cow’s milk, sheep’s milk, and a cow–sheep milk mixture (1:1), were stored in brine solutions, and samples from both the cheeses and their brines were collected and analyzed at 0, 30, 90, and 180 days of storage to investigate the impact of the milk type and storage time on the cheese characteristics. Cheese made from cow’s milk exhibited a lower fat content (14.5%), whereas cheese made from sheep’s milk had a lower protein content (17.5%). During storage, salt and ash contents increased. Water-soluble nitrogen (WSN) and trichloroacetic acid-soluble nitrogen (TCASN) levels decreased during the first 90 days of storage, followed by a subsequent increase. Cow’s milk cheese demonstrated higher ripening extension index (REI) values, indicating early-stage proteolysis, whereas sheep milk cheese showed higher ripening depth index (RDI) values, reflecting more advanced ripening. The total concentration of volatile compounds in the headspace increased over time, rising from 576.7–1060.2 to 5795.1–7360.1 µg/kg dry matter by day 180 of storage, with acids being the dominant volatile group in both quantity and diversity. Free fatty acids (FFAs) were the predominant volatiles and branched-chain acids and alcohols associated with proteolysis were particularly notable in cow’s milk cheeses. Additionally, the transfer of proteins and volatile compounds into the brine increased throughout the storage period. Overall, storage time significantly influenced the cheese characteristics, while milk type also played a role, albeit to a lesser extent.

1. Introduction

Malatya cheese is a semi-hard, elastic, brine-ripened cheese without holes or openings, traditionally produced and consumed in the Malatya province of Turkey. Although there are no official statistics on the total production of Malatya cheese, officials from the Malatya Provincial Directorate of Agriculture and Forestry reported in a personal communication that 356 tons were produced by registered enterprises in 2024. It is estimated that the total production in the region exceeds 700 tons. It is characterized by a milky or creamy flavor and a yellowish [1]. The heating or cooking process during Malatya cheese production is essential for achieving its elastic characteristic, compact texture and yellowish color [2,3]. The cooking process significantly influences the biochemical and storage properties of the cheese, particularly the residual coagulant activity [2]. The cheese can be produced using raw sheep’s milk, cow’s milk, or a mixture of both [4,5]. Today, Malatya cheese is produced using both traditional and industrial methods [4,5]. In traditional production, raw milk is used without the addition of a starter culture. After filtering the milk, it undergoes coagulation, curd cutting, mixing, and draining without pressing. The curd is then pressed onto a wooden block for approximately 2 h, followed by mixing with whey and cooked at 85–90 °C for 3–5 min. A second pressing is applied, and the cheese is rapidly cooled to room temperature. Finally, the cooled blocks are stored at 6–8 °C for at least 60 days, either by dry salting or by immersing them in brine [5]. In industrial production, pasteurized milk is used, and dry salting is generally not applied [4].
The heating process in Malatya cheese differs from that in pasta-filata-type cheeses. In pasta-filata cheeses, the stretching temperature does not exceed 75 °C, and the curd is cooked before the cheese is formed, typically in hot water containing approximately 5–7% salt. Moreover, these cheeses do not exhibit stretching properties unless the pH reaches 5.1–5.3. Thus, acidification before cooking and stretching in salty hot water are essential steps in pasta-filata cheese production. However, these steps are not required for Malatya cheese. In this regard, its production process is more like that of Halloumi cheese [6]. The heating time and temperature in Malatya cheese production vary widely, ranging from 60 °C to the boiling point. In industrial production, these parameters are typically set between 80 and 90 °C for 3–5 min [6,7].
There are a limited number of studies in the scientific literature on Malatya cheese. Previous studies have examined various characteristic parameters of Malatya cheese, including free fatty acid (FFA) profiles, proteolysis levels, and volatile compounds [8,9,10]. Malatya cheese differs from other Turkish regional cheeses by its high concentrations of volatile acids (including acetic acid) and very low levels of alcohol, likely due to the cooking process involved in its production [10]. Additionally, its antioxidant activity, mineral composition, as well as chemical, biochemical, and textural properties, have been analyzed [5]. Furthermore, the effects of pasteurization and heating temperatures (60, 70, 80, or 90 °C) on proteolysis levels during ripening, as well as the volatile compounds formed throughout the ripening process, have been investigated [6]. The results indicated that the use of raw milk in Malatya cheese production increased proteolysis, whereas the temperature of the cooking process had only a minor effect on proteolysis levels [6]. In another study, Hayaloğlu et al. (2014) [7] examined the thermal inactivation behavior of calf rennet and Rhizomucor miehei protease, along with the effects of different enzyme concentrations on the chemical composition, proteolysis, microstructure, hardness, and solubility of Malatya cheese. The authors reported that the microbial coagulant exhibited greater thermal stability and resulted in higher levels of proteolysis and meltability compared to calf rennet [7]. Additionally, the concentration kinetics of macroelements (Na, Ca, P, Mg, and K) during storage, under different salting methods (dry salting and brine) and at varying temperatures (7 °C and 20 °C), were investigated. The findings showed that higher storage temperatures led to lower concentrations of macroelements [4].
However, to the best of the authors’ knowledge, no studies have examined the effects of different milk types used in Malatya cheese production on its characteristics, volatile composition properties or the changes in brine composition during 180 days of storage. In this study, the effects of milk source and storage period on cheese production were investigated and the transfer of components into the brine was analyzed.

2. Materials and Methods

2.1. Materials

Raw cow milk and sheep milk were supplied by local producers from nearby villages in the province of Malatya.

2.2. Cheese Making

The Malatya cheese was produced using three different types of milk: cow’s milk, sheep’s milk, and an equal mixture of both. Cheese productions were carried out in duplicate and for each production, 50 L of raw milk was used. The cheeses produced are coded according to the type of milk used as raw material (CC as cow milk cheese, CS as sheep milk cheese and CSC as the mixed milk cheese). Following milking, the raw milk was cooled and promptly transferred to the production area using milk churns. Initially, raw milk was filtered through cheesecloth to remove impurities, then pasteurized at 65 °C for 20 min. Following pasteurization, the milk was cooled to 35 °C, and microbial rennet (Valiren® XTL XP, Mayasan, Turkey) was added to facilitate coagulation. Coagulation occurred within approximately 40–45 min and rennet amount (approximately 1%) was determined with respect to the estimated coagulation time. Then, curd was cut into 1–2 cm cubes, prompting the release of whey. The curd grains were then collected using strainers, wrapped in a press cloth, and weighted to facilitate whey drainage and form the characteristic flat shape of the cheese. After drainage, the cheeses were heated to 90 °C for 3 min in the whey. The shaped and hardened cheese blocks were subsequently immersed in brine, which had been prepared hot and cooled before use, and then stored at refrigeration conditions (~4 °C) for 180 days. Samples were collected from the cheeses and their brines on the 0th, 30th, 90th, and 180th days of storage for subsequent analyses.

2.3. Compositional Analysis

The compositions of raw cow and sheep milk, as well as the Malatya cheeses on days 0, 30, 90, and 180 of the storage period, were analyzed. In this context, the moisture content of the samples was determined using the gravimetric method [11], fat content using the Gerber-Van Gulik method [12,13], protein/nitrogen content using the Kjeldahl method [14], ash content using the gravimetric method [15], and salt content using the Mohr method [16]. Titration acidity values were determined using the alkali titration method and expressed as % lactic acid [17]. The pH values of the samples were measured using a pH/ion meter (MW 180Max, Milwaukee Instruments, Rocky Mount, NC, USA). Additionally, the moisture, total nitrogen, ash, and salt contents of the cheese brines were determined, and pH measurements were conducted using the same methods throughout the storage period.

2.4. Proteolytic Ripening Parameters of Cheeses

An essential parameter for assessing the ripening level of cheese is the rate of protein hydrolysis. The total nitrogen (TN) content of the samples was determined using the Kjeldahl method [14]. The concentrations of water-soluble nitrogen (WSN) and trichloroacetic acid-soluble nitrogen (TCASN) were analyzed following the method described by Bütikofer et al. [18]. The proteolytic ripening index values were then calculated based on the concentrations of these soluble nitrogen fractions (WSN, TCASN) using the following equations [19].
R i p e n i n g   E x t e n s i o n   I n d e x   ( R E I ) = W S N T N × 100 ,
R i p e n i n g   D e p t h   I n d e x   ( R D I ) = T C A S N T N × 100

2.5. Determination of Volatile Compounds

The isolation of volatile compounds in Malatya cheese and its brine was carried out using the headspace solid-phase microextraction (HS-SPME) method with a Divinylbenzene/Carboxen/Polydimethylsiloxane (DVB/CAR/PDMS, 57299-U, Sigma-Aldrich, Darmstadt, Germany) fiber. Determination of volatile compounds was carried out using a gas chromatography–mass spectrometry (GC–MS) equipped with an automatic injection module (components 7890B, 5977A MSD, GC Injector 80; Agilent Technologies, Santa Clara, CA, USA). For this purpose, 4 g of cheese and 10 g of brine were weighed into a 20 mL headspace vial equipped with a silicone/PTFE liner. The GC–MS conditions and extraction procedure were performed as described by Salum et al. [20]. Analytical standards and libraries (NIST14 and Wiley7) were used to identify volatile compounds. Retention indices on the DB-Wax column were determined using a mixture of alkane standards (C8–C40, Supelco, Bellefonte, PA, USA). An automated mass spectral deconvolution and identification system (AMDIS, National Institute of Standards and Technology (NIST), Gaithersburg, MD, USA) was used for spectral deconvolution and retention index calculations. The quantification of volatile compounds was performed based on the internal standard area, using 4-nonanol at a concentration of 9 µg/µL.

2.6. Statistical Analyses

The results were statistically evaluated using ANOVA and Duncan’s post hoc tests with the SPSS Statistical Package (IBM SPSS Statistics, Version 22, SPSS Inc., Chicago, IL, USA). In addition, principal component analysis (PCA) was conducted using XLSTAT (Addinsoft, New York, NY, USA).

3. Results and Discussion

3.1. Composition

In the present study, the composition of the milk used as raw material was first analyzed. The compositions of raw cow and sheep milk used in cheese production are given in Table 1. Based on these findings, sheep’s milk used as raw material contained higher levels of dry matter, protein, and fat compared to cow’s milk, which is a well-established fact. However, in the present study, no statistically significant difference was observed in ash content and titratable acidity (p < 0.05).
The composition of Malatya cheese samples made from cow, sheep, and mixed milk at different storage stages is presented in Table 2. Studies in the literature indicate that there is no standardized composition for Malatya cheeses. Hayaloğlu et al. [9], in their study, determined that the dry matter (%), protein (%), fat (%), salt (%), and pH content of Malatya cheese samples ranged between 38.81 and 64.08, 15.37 and 24.91, 16.50 and 29.50, 4.36 and 9.65, and 5.22 and 6.11, respectively [9]. Köse et al. [5] analyzed 25 cheese samples collected from retail market in Malatya and determined that the dry matter (%), fat (%), ash (%), protein (%), salt (%), lactic acid (%), and pH content of Malatya cheese samples ranged between 49.01 and 64.09, 24.50 and 31.00, 4.77 and 10.54, 16.59 and 23.54, 2.46 and 6.14, 0.13 and 0.73, and 5.50 and 6.76, respectively [5]. In general, the Malatya cheeses produced in this study fall within the reported ranges. However, the salt content in the cheeses examined in this study was higher than that reported in the literature. A review of the literature reveals significant fluctuations in the salt content of cheeses, ranging from 2% to 10%. This variability may be attributed to inconsistencies in achieving salt balance in the prepared brine, as well as differences in production parameters and the type of milk used as raw material. While no significant changes were observed in the moisture content of sheep’s and mixed milk cheeses during storage (decreasing from 50.7% and 50.3% to 49.6% and 49.0%, respectively), a slight reduction was noted in cow’s milk cheese, from 52.3% to 51.1%. However, this change is not markedly different from what is typically seen in practice, and it appears statistically significant primarily due to the low standard deviation in the measurements. The protein and fat content of the samples did not change during the storage period. Similarly, Ertekin et al. [21], determined that the fat content of Antep cheese remained unchanged during five-month storage. On the other hand, the ash and salt content increased during storage. As presented in Table 2, after 180 days of storage, ash contents increased by 9.6% to 20.6%, while salt contents increased by 14.9% to 26.0%. When the differences between the cheeses were examined at the same time intervals, it was found that the moisture, ash, and salt content of cheeses produced from cow’s milk were generally higher than those of the other samples. The fat contents were found to be higher in both the mixed milk (17.3–17.7%) and sheep’s milk cheeses (18.3–18.7%). This is considered to be related to the composition of the milk used in the production of these cheeses (Table 1). While some differences in protein composition were observed among the cheese samples on a wet basis (Table 2), the protein contents on a dry matter basis were quite comparable—ranging from 37.0 to 38.5% for cow milk cheese and 37.2 to 38.5% for mixed milk cheese—indicating that the difference between these two cheese types was not substantial. In contrast, cheese produced from sheep’s milk exhibited more distinct variation, which may be attributed to relatively higher fat retention, lower levels of residual whey proteins in the curd, or minor differences in production conditions.
In addition, some properties of the brine were analyzed and the results are presented in Table 2. According to the results of the cheeses, the change in the moisture content of the brine over time is not statistically significant (p > 0.05), whereas the protein, ash and salt contents in the brine increased over time in all samples (p < 0.05).

3.2. Ripening Parameters

Some of the ripening properties of Malatya cheeses were examined in the study. While the titratable acidity and pH values of the cheeses were measured, WSN and TCASN values, as well as the ripening index calculated from these values, were determined. The analysis results are presented in Table 2 and Table 3. Titratable acidity is an important parameter for determining the acidity level of cheese and is expressed in terms of lactic acid. Titratable acidity was observed to increase significantly in all cheese samples during storage (p < 0.05). Although the increase in titratable acidity during storage was statistically significant, no significant differences were observed between cheeses produced with different types of milk (p > 0.05). Similarly, pH values decreased significantly during storage (p < 0.05), while no significant differences were detected between cheeses made from different milk types (p > 0.05). Also, the pH of the brine significantly decreased during storage in all samples (p < 0.05) (Table 2). The gradual decrease in pH and the increase in titratable acidity may be attributed to lactic acid formation from residual lactose in the cheese, along with the limited production of alkaline compounds due to low levels of protein breakdown [22]. Moreover, volatile compound analyses have shown that acetic acid is formed during storage, and FFAs (Table 4 and Table 5), which are products of lipolysis, also increase over time–factors that may contribute to the pH decrease.
Total nitrogen (TN) is a direct measure of the protein content in cheese, and its variations are discussed in the section on protein content changes. However, by comparing TN values with soluble nitrogen fractions, the values obtained from fractions such as WSN and TCASN can be normalized, allowing for the calculation of ripening index parameters. According to the WSN values, regardless of the type of milk used as raw material, WSN values decrease during the first 90 days of storage, followed by an increasing trend. In the first 90 days, WSN values decreased by 31.7%, 36.2%, and 52.2% in cheeses produced from sheep, mixed, and cow milk, respectively, while an increase of up to 26.4% was observed by the 180th day (Table 3). A similar pattern was reported in Antep cheese [21], where WSN values decreased by 16.8% to 42.1% in the first 3 months, followed by increases of up to 35.3% in the subsequent 2 months. This trend can be explained by the balance between proteolytic activity and diffusion processes during cheese ripening. While an overall increase in WSN levels is expected due to proteolysis, it is hypothesized that the initially formed WSN diffuses into the brine at a faster rate than it is generated, leading to a temporary decline in WSN content during the first 90 days. However, after this period, ripening accelerates, and the rate of WSN formation surpasses the loss due to diffusion, resulting in a proportional increase in WSN levels [21,23,24,25]. A similar trend was observed in the TCASN results, with TCASN content decreasing by 29.2% to 49.3% during the first 90 days of storage, followed by a statistically significant increase of up to 164% (p < 0.05). An examination of the ripening extension index and ripening intensity index values indicates that proteolytic ripening is collectively assessed in terms of the effect of different milk types used as raw materials. In particular, cheeses made from cow’s milk exhibited high REI values (12.37 at 180 days of storage), indicating the initial stage of proteolytic ripening, whereas cheeses made from sheep’s milk showed high RDI values (3.72 at 180 days), representing a more advanced stage of proteolytic ripening. In mixed milk cheese, both values were relatively low, with REI and RDI measured at 4.76 and 2.80, respectively. This variation in trends based on milk type may be attributed to differences in the casein profile, the enzyme-to-substrate ratio during storage, and the accessibility of enzymes from different sources (e.g., plasmin and chymosin). These factors can influence primary and secondary proteolysis, which in turn affects the availability of peptides for degradation by starter culture peptidases [26,27]. Similar trends observed in the present study have also been reported in previous research [28,29].

3.3. Volatile Compounds

Volatile compounds in the headspace of Malatya cheeses produced from cow’s milk, sheep’s milk, and their mixtures as well as their respective brines, were analyzed at 0th, 30th, 90th, and 180th days of storage. The analysis was conducted using the HS-SPME method, followed by GC–MS. The identified volatile compounds in Malatya cheese samples and brine samples, along with their concentrations and standard deviation values, are presented in Table 4 and Table 5.
A total of 11 acid compounds, one alcohol, and one volatile phenol were detected in the cheese samples. Hayaloğlu and Karabulut [10] found that Malatya cheeses contained lower levels of volatile compounds compared to several other cheese varieties, including Divle, Civil, Ezine, Çanak, Van Otlu, and Mihaliç. They attributed this to the limiting effect of the cooking process on biochemical and microbial activities [10].
In the headspace of the samples, the total concentration of volatile compounds increased over the storage period. This indicates that the formation of volatile compounds—driven by ongoing biochemical reactions in the cheese, as explained below for specific compounds—exceeds their degradation during storage. Acids constitute the most dominant group of volatile compounds in the headspace of cheese, both in terms of quantity and diversity, and their concentrations are significantly influenced by storage time and milk type and similar results were obtained in the literature [3,10]. Among these, FFAs are the most prevalent, with octanoic acid being the most abundant, followed by hexanoic acid. FFAs in cheese are primarily generated through the hydrolysis of triacylglycerols during the lipolysis of milk fat. In addition to FFAs, glycerol, monoacylglycerols, and diacylglycerols are also released because of lipolysis. The FFAs identified in cheese samples contain between 4 and 18 carbon numbers. Notably, short- and medium-chain FFAs with even carbon numbers (C4:0–C12:0) play a crucial role in the development of characteristic cheese flavor due to their low detection thresholds [30]. Among the detected acids, butanoic acid, hexanoic acid, octanoic acid, and decanoic acid were present in all cheese samples throughout the storage period, with their concentrations increasing significantly over time, indicating ongoing lipolysis during storage (p < 0.05). Similar results were observed in the brine, where the concentrations of these acids increased significantly after 180 days. Additionally, dodecanoic acid was detected in cheeses made from cow’s milk at all storage times, whereas it was only identified in cheeses produced from sheep’s milk and mixed milks from the 90th day of storage onward. Similarly, acetic acid, heptanoic acid, and 9-decenoic acid were first detected in the headspace of cheeses after 90 days of storage. Nonanoic acid was identified in cheeses made from cow’s milk from the 30th day of storage, while in those produced from sheep’s milk and mixed milks, it was detected at the 90th and 180th days, respectively. Pentanoic acid and isovaleric acid were not detected in cheeses produced from sheep’s milk; however, they were identified in cheeses made from cow’s milk and mixed milks from the 180th day of storage. Unlike other FFAs, isovaleric acid (3-methyl butanoic acid) is a branched-chain fatty acid formed through proteolysis, specifically from the degradation of leucine [31]. Similar trends were generally observed for these compounds in the brine, except that pentanoic acid was not detected in the brine of the samples.
In addition to these acid compounds, isoamyl alcohol (3-methyl-1-butanol) was detected in Malatya cheeses produced from cow’s milk and mixed milk. This branched-chain primary alcohol is known to form through the reduction of an aldehyde derived from leucine [32]. However, it was not detected in the later stages of storage. The concentration of this compound was observed to increase in the brine of both samples over time (p < 0.05). Therefore, its decrease in cheese was likely attributed to diffusion into the brine. Another compound identified in the samples was volatile phenol and the concentration of phenols in the samples decreased over the course of storage. Phenol was also detected in the brine of sheep’s milk cheese at a concentration of 1.65 µg/kg dry matter, and its level increased over time, reaching 3.07 µg/kg dry matter after 180 days of storage. Volatile phenol, which is associated with amino acid degradation, can be produced from tyrosine via Strecker degradation [32].

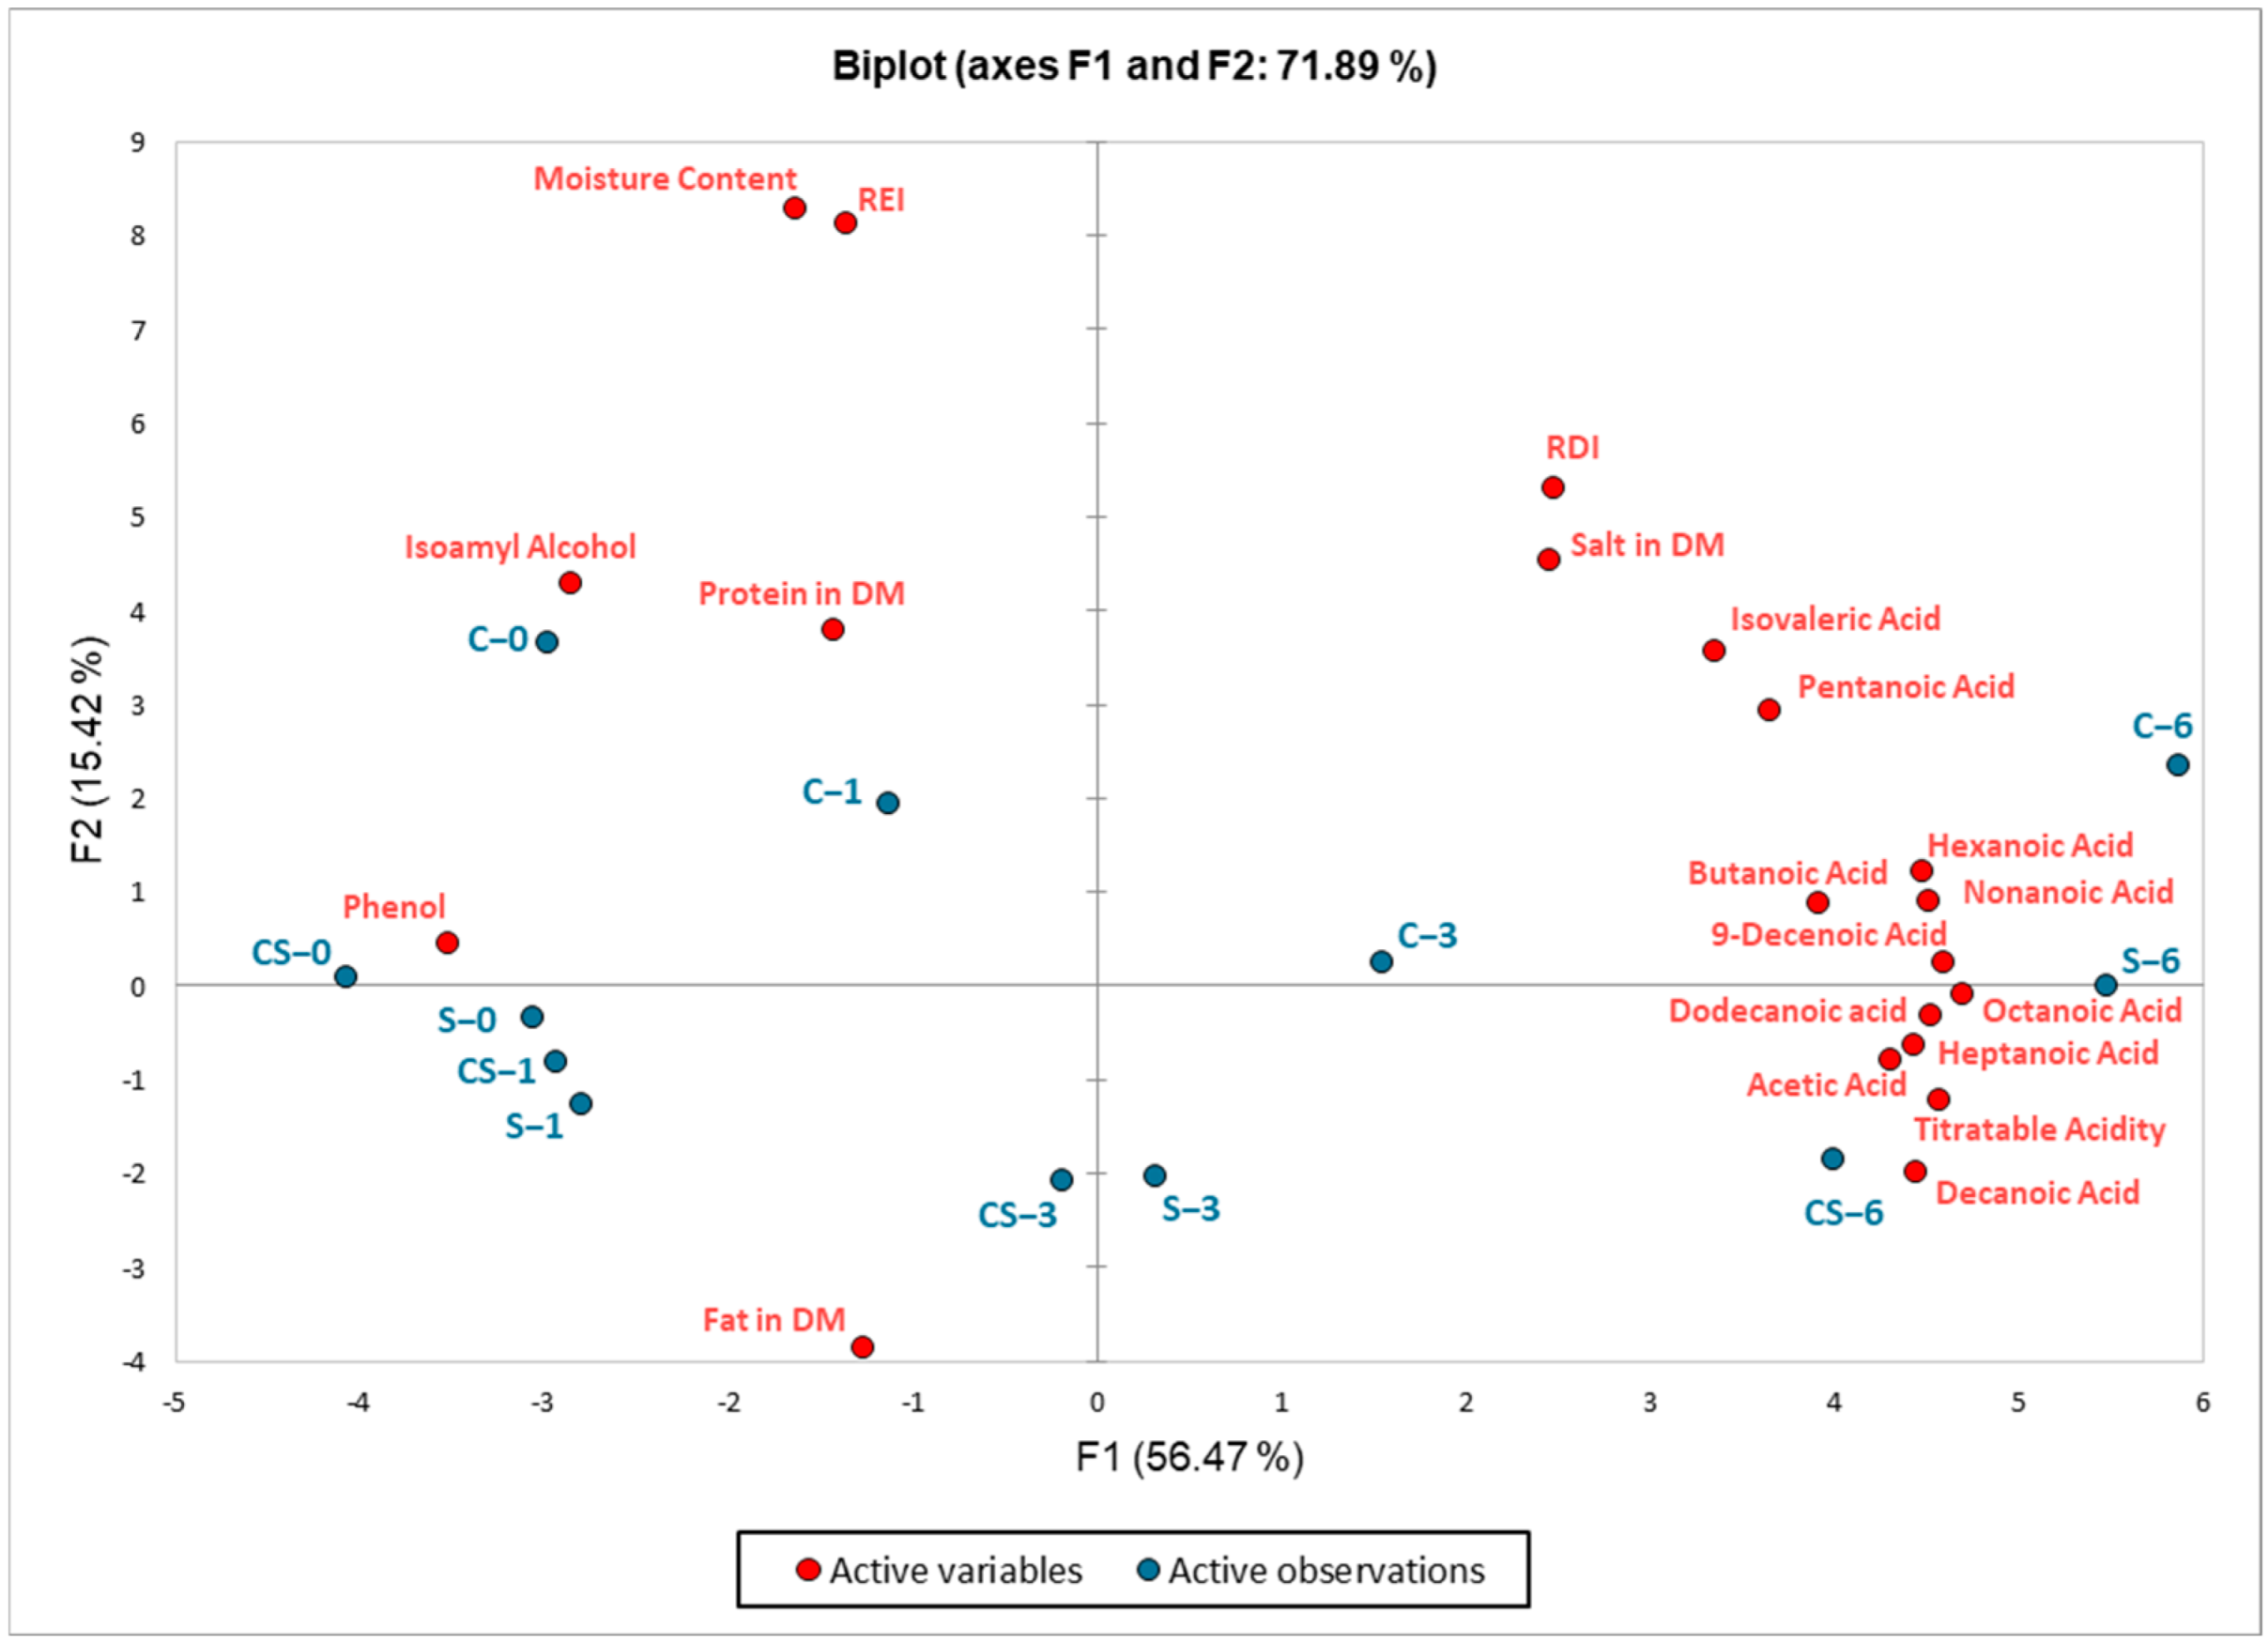
3.4. Principle Component Analysis (PCA)

PCA was performed to collectively evaluate the results. The PCA biplot, which explains 71.89% of the total variation, is presented in Figure 1. The changes in cheese during storage are positioned along the first principal component (F1, x-axis), which accounts for 56.47% of the total variation. The titratable acidity, volatile compounds (except phenol and isoamyl alcohol), and samples at the 180th day of storage were closely positioned. Additionally, the RDI values were also closely associated with them. The 0th and 30th days of the samples are positioned in the negative F1 region along with REI, protein (in DM), moisture, fat (in DM), phenol, and isoamyl alcohol. The effect of milk type played a role in positioning along the second principal component (F2, y-axis), which accounted for 15.42% of the total variation. All cheeses produced with cow’s milk are positioned in the positive F2 region and F2 seems to show the variation of milk type. When the results were evaluated, it was determined that storage period had a significant effect on cheese properties, while the milk type also influenced these properties, although to a lesser extent than storage period.

4. Conclusions

The findings of this study demonstrate that both milk type and storage time significantly influence the physicochemical and volatile composition of Malatya cheese. By day 180, cheeses produced from cow’s milk exhibited pronounced early-phase proteolysis, while those made from sheep’s milk had higher RDI values, indicating more advanced proteolytic ripening. This milk-type-dependent difference may be attributed to variations in the casein profile, the enzyme-to-substrate ratio during storage, and the accessibility of enzymes from different sources. Throughout storage, WSN and TCASN values initially declined before increasing, indicating dynamic protein degradation patterns. The total concentration of volatile compounds in the cheese samples increased over time. The increase in volatile compound concentrations, particularly FFAs, emphasizes the key role of storage in flavor development. Additionally, water-soluble compounds such as ash, small molecular peptides and amino acids, as well as various volatile compounds’ migration into the brine, intensified with storage. While milk type had a notable effect on cheese characteristics, storage period emerged as the dominant factor shaping the final product. These insights contribute to a deeper understanding of the storage dynamics of Malatya cheese and can aid in optimizing production and storage conditions. Additionally, monitoring changes in the brine’s composition during storage offers valuable information for managing brine as waste.

Author Contributions

Conceptualization, P.S. and Z.E.; methodology, E.A. and P.S.; formal analysis, E.A. and V.K.A.; investigation, E.A. and V.K.A.; software, P.S.; validation, V.K.A.; data curation, V.K.A. and P.S.; writing—original draft preparation, E.A. and P.S.; writing—review and editing, Z.E.; supervision, Z.E.; project administration, Z.E.; funding acquisition, Z.E. All authors have read and agreed to the published version of the manuscript.

Funding

This research was funded by the Scientific Research Project Fund of Adana Alparslan Türkeş Science and Technology University under the project number 22303008.

Institutional Review Board Statement

Not applicable.

Informed Consent Statement

The study did not involve humans.

Data Availability Statement

The data presented in this study are available upon request from the corresponding author. The data are not publicly available due to the confidentiality of the data.

Acknowledgments

This study was supported by the Scientific Research Project Fund of Adana Alparslan Türkeş Science and Technology University under the project number 22303008.

Conflicts of Interest

The authors declare no conflicts of interest.

References

  1. Hayaloglu, A.A.; Ozer, B.H.; Fox, P.F. Cheeses of Turkey: 2. Varieties ripened under brine. Dairy Sci. Technol. 2008, 88, 225–244. [Google Scholar] [CrossRef]
  2. Dagdelen, S.; Bilenler, T.; Durmaz, G.; Gokbulut, I.; Hayaloglu, A.A.; Karabulut, I. Volatile composition, antioxidant and antimicrobial activities of herbal plants used in the manufacture of van herby (OTLU) cheese. J. Food Process. Preserv. 2014, 38, 1716–1725. [Google Scholar] [CrossRef]
  3. Güler, Z.; Türkmen, D.; Dursun, A. Different scalding duration in hot whey influencing chemical, biochemical, physical, microstructural, textural and sensorial characteristics of brine-type cheese. LWT—Food Sci. Technol. 2021, 145, 111312. [Google Scholar] [CrossRef]
  4. Yasar, D.; Erim Kose, Y.; Kose, S. Kinetic modeling of macroelement concentration of Malatya cheese produced by traditional method. J. Food Process. Preserv. 2021, 45, e16021. [Google Scholar] [CrossRef]
  5. Kose, S.; Ceylan, M.M.; Altun, I.; Erim Kose, Y. Determination of some basic properties of traditional Malatya cheese. Food Sci. Technol. 2022, 42, e03921. [Google Scholar] [CrossRef]
  6. Hayaloglu, A.A.; Deegan, K.C.; McSweeney, P.L.H. Effect of milk pasteurization and curd scalding temperature on proteolysis in Malatya, a Halloumi-type cheese. Dairy Sci. Technol. 2010, 90, 99–109. [Google Scholar] [CrossRef]
  7. Hayaloglu, A.A.; Karatekin, B.; Gurkan, H. Thermal stability of chymosin or microbial coagulant in the manufacture of Malatya, a Halloumi type cheese: Proteolysis, microstructure and functional properties. Int. Dairy J. 2014, 38, 136–144. [Google Scholar] [CrossRef]
  8. Hayaloglu, A.A.; Karabulut, I. Characterization and comparison of free fatty acid profiles of eleven varieties of turkish cheeses. Int. J. Food Prop. 2013, 16, 1407–1416. [Google Scholar] [CrossRef]
  9. Hayaloglu, A.A.; Karabulut, I. Primary and secondary proteolysis in eleven Turkish cheese varieties. Int. J. Food Prop. 2013, 16, 1663–1675. [Google Scholar] [CrossRef]
  10. Hayaloglu, A.A.; Karabulut, I. SPME/GC-MS characterization and comparison of volatiles of eleven varieties of Turkish cheeses. Int. J. Food Prop. 2013, 16, 1630–1653. [Google Scholar] [CrossRef]
  11. AOAC. Loss on Drying (Moisture) in Cheese; AOAC International: Gaithersburg, MD, USA, 2012. [Google Scholar]
  12. AOAC. Fat Content of Raw and Pasteurized Whole Milk, Gerber Method by Weight; AOAC International: Gaithersburg, MD, USA, 2012. [Google Scholar]
  13. Funke-Gerber Laboratory Catalogue for Milk Analysis. Available online: https://egelaborsis.com/wp-content/uploads/2020/02/FUNKE-GERBER-CATALOG.pdf (accessed on 25 June 2025).
  14. AOAC International. Determination of Nitrogen (Total) in Cheese, Kjeldahl Method, Official Method 2001.14. In Official Methods of Analysis of AOAC International; Latimer, G.W., Jr., Ed.; AOAC International: Gaithersburg, MD, USA, 2012. [Google Scholar]
  15. AOAC. Ash of Cheese; AOAC International: Gaithersburg, MD, USA, 2012. [Google Scholar]
  16. ISO 5943:2006 (IDF 88:2006); ISO-IDF Cheese and Processed Cheese Products—Determination of Chloride Content—Potentiometric Titration Method. ISO International Organization for Standardization: Geneva, Switzerland, 2006.
  17. AOAC. Acidity of Milk, Titrimetric Method; AOAC International: Gaithersburg, MD, USA, 2012. [Google Scholar]
  18. Bütikofer, U.; Rüegg, M.; Ardö, Y. Determination of Nitrogen Fractions in Cheese: Evaluation of a Collaborative Study. LWT—Food Sci. Technol. 1993, 26, 271–275. [Google Scholar] [CrossRef]
  19. Pereira, C.I.; Gomes, E.O.; Gomes, A.M.P.; Malcata, F.X. Proteolysis in model Portuguese cheeses: Effects of rennet and starter culture. Food Chem. 2008, 108, 862–868. [Google Scholar] [CrossRef] [PubMed]
  20. Salum, P.; Erbay, Z.; Kelebek, H.; Selli, S. Optimization of Headspace Solid-Phase Microextraction with Different Fibers for the Analysis of Volatile Compounds of White-Brined Cheese by Using Response Surface Methodology. Food Anal. Methods 2017, 10, 1956–1964. [Google Scholar] [CrossRef]
  21. Ertekin, M.; Uğurlu, Ö.; Salum, P.; Erbay, Z. Effects of milk types used in Antep cheese production on some cheese organoleptic quality parameters and brine composition during 5-month ripening. J. Food Sci. 2023, 88, 1445–1465. [Google Scholar] [CrossRef]
  22. Akın, N.; Aydemir, S.; Koçak, C.; Yıldız, M.A. Changes of free fatty acid contents and sensory properties of white pickled cheese during ripening. Food Chem. 2003, 80, 77–83. [Google Scholar] [CrossRef]
  23. Polychroniadou, A.; Michaelidou, A.; Paschaloudis, N. Effect of time, temperature and extraction method on the trichloroacetic acid-soluble nitrogen of cheese. Int. Dairy J. 1999, 9, 559–568. [Google Scholar] [CrossRef]
  24. Michaelidou, A.; Alichanidis, E.; Polychroniadou, A.; Zerfiridis, G. Migration of water-soluble nitrogenous compounds of Feta cheese from the cheese blocks into the brine. Int. Dairy J. 2005, 15, 663–668. [Google Scholar] [CrossRef]
  25. Barac, M.; Pesic, M.; Zilic, S.; Smiljanic, M.; Sredovic Ignjatovic, I.; Vucic, T.; Kostic, A.; Milincic, D. The Influence of Milk Type on the Proteolysis and Antioxidant Capacity of White-Brined Cheese Manufactured from High-Heat-Treated Milk Pretreated with Chymosin. Foods 2019, 8, 128. [Google Scholar] [CrossRef]
  26. Niro, S.; Succi, M.; Tremonte, P.; Sorrentino, E.; Coppola, R.; Panfili, G.; Fratianni, A. Evolution of free amino acids during ripening of Caciocavallo cheeses made with different milks. J. Dairy Sci. 2017, 100, 9521–9531. [Google Scholar] [CrossRef]
  27. Tagliazucchi, D.; Martini, S.; Shamsia, S.; Helal, A.; Conte, A. Biological activities and peptidomic profile of in vitro-digested cow, camel, goat and sheep milk. Int. Dairy J. 2018, 81, 19–27. [Google Scholar] [CrossRef]
  28. Pappa, E.C.; Kandarakis, I.; Anifantakis, E.M.; Zerfiridis, G.K. Influence of types of milk and culture on the manufacturing practices, composition and sensory characteristics of Teleme cheese during ripening. Food Control 2006, 17, 570–581. [Google Scholar] [CrossRef]
  29. Öner, Z.; Saridağ, A.M. Proteolysis in the beyaz (White) cheese produced from various milk. Tarim Bilim. Derg. 2018, 24, 269–277. [Google Scholar] [CrossRef]
  30. Collins, Y.F.; McSweeney, P.L.H.; Wilkinson, M.G. Lipolysis and free fatty acid catabolism in cheese: A review of current knowledge. Int. Dairy J. 2003, 13, 841–866. [Google Scholar] [CrossRef]
  31. Yvon, M.; Rijnen, L. Cheese flavour formation by amino acid catabolism. Int. Dairy J. 2001, 11, 185–201. [Google Scholar] [CrossRef]
  32. Curioni, P.M.G.; Bosset, J.O. Key odorants in various cheese types as determined by gas chromatography-olfactometry. Int. Dairy J. 2002, 12, 959–984. [Google Scholar] [CrossRef]
Figure 1. Principle component analysis (PCA) biplot diagram for Malatya cheese samples during storage (C, cow milk; S, sheep milk; CS, mixture of cow and sheep milk; numbers represent the storage period (months)).
Dairy 06 00030 g001
Table 1. Composition of the milk types used in cheese production.
Cow Milk (%)Sheep Milk (%)p-Value
Dry Matter (%)10.12 ± 0.0115.38 ± 0.080.000
Protein (%)3.55 ± 0.175.25 ± 0.240.015
Fat (%)2.25 ± 0.074.85 ± 0.070.001
Ash (%)0.81 ± 0.041.05 ± 0.140.147
Titratable acidity (%)0.200 ± 0.0040.188 ± 0.0030.073
Values correspond mean ± standard deviation of the analysis results. Titratable acidity was presented in terms of lactic acid. p-value from ANOVA t tailed t-test.
Table 2. Composition of Malatya cheeses and brines produced using different milk types during 180 days of storage.
DayMoisture (%)Protein (%)Fat (%)Ash (%)Salt (%)pH
CC052.29 ± 0.29 b,B18.35 ± 0.21 a,B14.53 ± 0.42 a,A14.13 ± 0.08 a,C12.52 ± 0.15 a,B6.62 ± 0.02 c,B
3051.53 ± 0.22 ab,A18.16 ± 0.21 a,B14.37 ± 0.32 a,A15.54 ± 0.22 b,B14.16 ± 0.25 b,B6.58 ± 0.04 c,A
9051.37 ± 0.41 a,B17.98 ± 0.43 a,AB14.67 ± 0.29 a,A15.59 ± 0.03 b,C14.27 ± 0.35 b,B6.45 ± 0.02 b,A
18051.09 ± 0.05 a,A18.10 ± 0.24 a,AB14.50 ± 0.50 a,A15.79 ± 0.13 b,C14.42 ± 0.17 b,B6.37 ± 0.02 a,A
CCS050.53 ± 0.04 a,A19.06 ± 0.24 a,C17.67 ± 0.29 a,B11.79 ± 0.22 a,A10.04 ± 0.00 a,A6.62 ± 0.02 c,B
3049.89 ± 0.17 a,A18.96 ± 0.25 a,C17.50 ± 0.50 a,B13.28 ± 0.08 b,A11.98 ± 0.06 b,A6.60 ± 0.06 bc,A
9049.40 ± 0.34 a,A19.06 ± 0.44 a,B17.33 ± 0.58 a,B14.03 ± 0.16 c,B12.58 ± 0.17 c,A6.47 ± 0.06 ab,A
18049.01 ± 1.07 a,A18.95 ± 0.41 a,B17.67 ± 0.29 a,B14.22 ± 0.19 c,B12.65 ± 0.28 c,A6.35 ± 0.04 a,A
CS050.74 ± 0.32 a,A17.54 ± 0.20 a,A18.27 ± 0.25 a,B12.57 ± 0.09 a,B10.92 ± 0.83 a,A6.54 ± 0.01 c,A
3050.11 ± 0.85 a,A17.48 ± 0.10 a,A18.40 ± 0.36 a,B13.59 ± 0.07 b,A12.16 ± 0.08 ab,A6.52 ± 0.02 bc,A
9049.82 ± 0.09 a,A17.53 ± 0.32 a,A18.47 ± 0.50 a,B13.54 ± 0.10 bc,A12.30 ± 0.39 b,A6.43 ± 0.03 ab,A
18049.57 ± 0.90 a,A17.61 ± 0.12 a,A18.67 ± 0.29 a,B13.77 ± 0.06 c,A12.54 ± 0.13 b,A6.36 ± 0.05 a,A
BC077.45 ± 0.57 w,W0.08 ± 0.01 w,W-20.62 ± 0.05 y,W19.89 ± 0.16 w,W6.80 ± 0.03 z,X
3077.40 ± 0.55 w,W0.33 ± 0.01 x,W-20.44 ± 0.15 xy,W19.65 ± 0.32 w,W6.49 ± 0.05 y,X
9077.46 ± 0.13 w,W0.49 ± 0.03 y,W-20.220.12 x,W19.40 ± 0.30 w,W6.17 ± 0.05 x,X
18077.66 ± 0.14 w,W0.61 ± 0.01 z,W-19.72 ± 0.09 w,W19.07 ± 0.50 w,W5.81 ± 0.01 w,W
BCS077.79 ± 0.36 w,W0.07 ± 0.01 w,W-20.84 ± 0.06 y,X20.13 ± 0.13 x,W6.49 ± 0.06 y,w
3077.74 ± 0.52 w,W0.61 ± 0.04 x,X-20.45 ± 0.03 xy,W19.75 ± 0.19 wx,W6.28 ± 0.04 x,W
9078.23 ± 0.54 w,W0.80 ± 0.01 y,X-20.05 ± 0.27 wx,W19.38 ± 0.28 wx,W6.02 ± 0.06 w,W
18078.34 ± 0.35 w,W0.82 ± 0.01 y,X-19.88 ± 0.12 w,W19.17 ± 0.41 w,W5.94 ± 0.01 w,X
BS077.26 ± 0.85 w,W0.07 ± 0.01 w,W-20.84 ± 0.08 y,X20.14 ± 0.31 x,W6.68 ± 0.04 z,X
3077.91 ± 0.71 w,W0.73 ± 0.02 x,Y-20.45 ± 0.08 x,W19.76 ± 0.15 wx,W6.42 ± 0.03 y,X
9077.79 ± 0.44 w,W0.87 ± 0.01 y,Y-20.08 ± 0.13 w,W19.50 ± 0.27 w,W6.23 ± 0.03 x,X
18077.91 ± 0.21 w,W0.98 ± 0.02 z,Y-19.86 ± 0.08 w,W19.29 ± 0.14 w,W6.01 ± 0.01 w,Y
Values correspond mean ± standard deviation of the analysis results. a–c: The same letters indicate that the difference between the properties of cheeses produced from the same milk type during storage is not significant (p > 0.05). A–C: The same letters indicate that the difference between the properties of cheeses produced from different milk types at the same storage time is not significant (p > 0.05). w–z: The same letters indicate that the differences in the properties of the brine from the same cheese during storage are not significant (p > 0.05). W–Y: The same letters indicate that the differences in the properties of the brine from cheeses at the same storage time are not significant (p > 0.05). Abbreviations: CC, cow milk cheese; CCS, mix (cow and sheep) milk cheese; CS, sheep milk cheese, BC, brine of cow milk cheese; BCS, brine of mix (cow and sheep) milk cheese; BS, brine of sheep milk cheese.
Table 3. Acidity and proteolytic ripening parameters of Malatya cheeses produced using different milk types during 180 days of storage.
DayTitratable Acidity (%)TN (%)WSN (%)TCA-SN (%)REI (%)RDI (%)
CC00.130 ± 0.022 a,A2.88 ± 0.03 a,B0.356 ± 0.005 d,C0.092 ± 0.002 c,B12.373.21
300.188 ± 0.014 a,A2.87 ± 0.03 a,B0.241 ± 0.003 c,C0.064 ± 0.001 b,C8.402.25
900.497 ± 0.030 b,B2.82 ± 0.07 a,AB0.170 ± 0.003 a,B0.047 ± 0.001 a,A6.031.66
1800.583 ± 0.049 c,A2.84 ± 0.04 a,AB0.215 ± 0.010 b,C0.090 ± 0.010 c,A7.583.17
CCS00.146 ± 0.006 a,A2.99 ± 0.01 a,C0.231 ± 0.003 c,B0.061 ± 0.005 b,A7.732.06
300.209 ± 0.006 a,A2.97 ± 0.04 a,C0.180 ± 0.004 b,B0.055 ± 0.001 ab,B6.071.84
900.355 ± 0.036 b,A2.99 ± 0.07 a,B0.147 ± 0.010 a,A0.044 ± 0.003 a,A4.941.46
1800.462 ± 0.047 c,A2.97 ± 0.06 a,B0.141 ± 0.008 a,A0.083 ± 0.006 c,A4.762.80
CS00.165 ± 0.006 a,A2.75 ± 0.03 a,A0.204 ± 0.007 c,A0.066 ± 0.006 b,A7.422.39
300.199 ± 0.006 a,A2.74 ± 0.02 a,A0.162 ± 0.005 b,A0.042 ± 0.002 a,A5.901.54
900.361 ± 0.039 b,A2.75 ± 0.05 a,A0.139 ± 0.006 a,A0.039 ± 0.003 a,A5.071.42
1800.498 ± 0.025 c,A2.76 ± 0.02 a,A0.172 ± 0.005 b,B0.103 ± 0.014 c,A6.233.72
Values correspond mean ± standard deviation of the analysis results. a–c: The same letters indicate that the difference between the properties of cheeses produced from the same milk type during storage is not significant (p > 0.05). A–C: The same letters indicate that the difference between the properties of cheeses produced from different milk types at the same storage time is not significant (p > 0.05). Titratable acidity was shown in terms of lactic acid. Abbreviations: CC, cow milk cheese; CCS, mix (cow and sheep) milk cheese; CS, sheep milk cheese; TN, total nitrogen; WSN, water-soluble nitrogen, TCASN, trichloroacetic acid-soluble nitrogen; REI, ripening extension index; RDI, ripening depth index.
Table 4. Changes in volatile compounds (µg/kg dry matter) of Malatya cheeses with linear retention index values below 1900 produced using different milk types or mixtures during 180 days of storage.
DayIsoamyl AlcoholAcetic AcidButanoic AcidIsovaleric AcidPentanoic AcidHexanoic AcidPhenylethyl Alcohol
1231144516301672173118431890
CC086.5 ± 1.8 cND147.2 ± 0.5 a,BNDND337.0 ± 42.2 a,BND
3056.7 ± 0.3 bND200.6 ± 8.6 b,BNDND867.7 ± 15.1 c,CND
9031.6 ± 0.8 a42.1 ± 1.7 C188.4 ± 14.4 b,BNDND676.2 ± 82.6 b,BND
180ND39.7 ± 0.5 B235.8 ± 4.3 c,A91.2 ± 2.16.55 ± 0.191390.2 ± 3.1 d,AND
CCS0112.8 ± 1.0ND116.2 ± 2.9 a,ANDND223.5 ± 27.5 a,AND
3071.8 ± 1.3ND106.9 ± 6.3 a,ANDND272.6 ± 10.9 a,BND
90ND26.8 ± 2.3 B207.2 ± 29.8 b,BNDND420.0 ± 55.7 b,A.ND
180ND28.6 ± 0.6 A294.2 ± 28.1 c,ANDND1461.7 ± 207.8 c,AND
CS0NDND104.1 ± 11.6 a,ANDND147.2 ± 10.6 a,AND
30NDND86.9 ± 3.76 a,ANDND198.9 ± 10.4 a,AND
90ND13.3 ± 0.6 A107.0 ± 2.7 a,ANDND414.3 ± 15.3 b,AND
180ND36.9 ± 4.7 AB228.6 ± 25.5 b,A36.6 ± 2.45.73 ± 0.031705.4 ± 189.6 c,AND
BC013.8 ± 0.6 w1.48 ± 0.00 w2.57 ± 0.04 wNDND4.87 ± 0.62 w,X3.66 ± 0.58 w
3013.3 ± 0.7 w1.76 ± 0.14 w6.27 ± 0.47 xNDND30.0 ± 0.9 x,Y3.72 ± 0.51 w
9027.0 ± 0.1 x2.92 ± 0.01 x,W17.2 ± 0.1 y,XNDND117.1 ± 4.4 y,X4.14 ± 0.06 w
18025.9 ± 0.2 x4.46 ± 0.34 y,X38.9 ± 0.3 z,Y14.5 ± 0.2 XND268.9 ± 12.8 z,W6.66 ± 0.12 x
BCS012.0 ± 0.8 w1.44 ± 0.04 w3.01 ± 0.06 wNDND4.87 ± 0.46 w,X2.05 ± 0.02 w
3018.3 ± 1.2 x1.67 ± 0.12 w6.06 ± 0.10 xNDND27.6 ± 0.1 x,X2.03 ± 0.04 w
9033.3 ± 2.0 y2.54 ± 0.16 x,W18.7 ± 0.6 y,X6.52 ± 0.05ND113.2 ± 8.0 y,X2.57 ± 0.12 x
18033.5 ± 0.2 y5.69 ± 0.39 y,Y35.8 ± 0.9 z,X25.6 ± 1.1 YND249.1 ± 11.2 z,W3.35 ± 0.15 y
BS0NDNDNDNDND0.65 ± 0.01 w,WND
30NDNDNDNDND5.65 ± 0.16 w,WND
90ND3.41 ± 0.49 W10.4 ± 1.1 WNDND88.1 ± 9.6 x,WND
180ND3.00 ± 0.01 W23.4 ± 0.1 W7.20 ± 0.62 WND250.4 ± 12.7 y,WND
Values correspond mean ± standard deviation of the analysis results. a–c: The same letters indicate that the difference between the properties of cheeses produced from the same milk type during storage is not significant (p > 0.05). A–C: The same letters indicate that the difference between the properties of cheeses produced from different milk types at the same storage time is not significant (p > 0.05). w–z: The same letters indicate that the differences in the properties of the brine from the same cheese during storage are not significant (p > 0.05). W–Y: The same letters indicate that the differences in the properties of the brine from cheeses at the same storage time are not significant (p > 0.05). The numbers mentioned below the volatile compounds were related to linear retention index for DB-WAX Column. Abbreviations: CC, cow milk cheese; CCS, mix (cow and sheep) milk cheese; CS, sheep milk cheese; BC, brine of cow milk cheese; BCS, brine of mix (cow and sheep) milk cheese; BS, brine of sheep milk cheese; ND, not detected.
Table 5. Changes in volatile compounds (µg/kg dry matter) of Malatya cheeses with linear retention index values above 1900 produced using different milk types or mixtures during 180 days of storage.
DayHeptanoic AcidPhenolOctanoic AcidNonanoic AcidDecanoic Acid9-Decenoic AcidDodecanoic Acid
1934199620722161227423372492
CC0ND32.1 ± 4.5 bc,A268.5 ± 38.3 a,BND161.0 ± 4.7 a,CND15.2 ± 0.2 a
30ND34.6 ± 1.8 c,A833.3 ± 36.6 b,B22.8 ± 1.4 a414.1 ± 15.6 b,CND51.4 ± 3.2 b
9030.3 ± 4.821.3 ± 6.5 ab,A1195.7 ± 0.5 c,C24.4 ± 0.9 a755.0 ± 30.3 c,A49.9 ± 4.2 C71.7 ± 3.2 b,B
18039.9 ± 2.5 A18.9 ± 2.1 a,A2370.9 ± 34.3 d,A40.4 ± 2.1 b,AB1333.4 ± 183.0 d,A110.3 ± 6.0 B138.1 ± 18.3 c,B
CCS0ND49.8 ± 2.9 b,B137.8 ± 8.2 a,AND114.7 ± 3.9 a,ANDND
30ND27.8 ± 2.4 a,A305.0 ± 11.8 a,AND181.7 ± 2.2 a,ANDND
9020.9 ± 2.923.4 ± 2.8 a,A754.2 ± 24.8 b,AND699.0 ± 76.0 b,A23.3 ± 2.0 A46.9 ± 4.4 A
18046.0 ± 4.8 A24.1 ± 2.1 a,A2434.9 ± 265.4 c,A35.7 ± 3.1 A1878.9 ± 117.9 c,AB73.2 ± 3.1 A128.1 ± 3.3 AB
CS0ND50.2 ± 2.5 b,B149.6 ± 0.7 a,AND140.9 ± 0.5 a,BNDND
30ND48.7 ± 3.1 b,B259.2 ± 7.1 a,AND245.1 ± 20.9 a,BNDND
90ND16.8 ± 2.6 a,A1007.2 ± 59.3 b,B22.2 ± 0.11229.5 ± 111.5 b,B33.9 ± 2.6 B100.8 ± 8.1 C
18040.2 ± 2.0 A21.8 ± 0.4 a,A3048.8 ± 423.8 c,A43.4 ± 1.6 B2232.5 ± 270.2 c,B63.2 ± 5.0 A100.7 ± 6.6 A
BC0NDND18.2 ± 0.5 w,X2.38 ± 0.10 w19.9 ± 0.4 w,X2.49 ± 0.09 w16.5 ± 0.62 wx
30NDND86.8 ± 5.0 x,Y4.57 ± 0.21 w101.9 ± 14.9 x,Y3.87 ± 0.02 x13.2 ± 0.71 w
906.42 ± 0.45ND261.5 ± 3.9 y,Y7.16 ± 0.25 x,X158.7 ± 6.4 y,W11.6 ± 0.2 y,Y19.3 ± 0.10 x
1809.40 ± 0.08ND454.3 ± 2.9 z,X7.24 ± 0.19 x,X187.6 ± 9.4 z,W13.0 ± 0.2 z,X35.7 ± 2.74 y
BCS0NDND21.7 ± 1.2 w,Y2.37 ± 0.05 w42.3 ± 1.62 w,YNDND
30NDND59.7 ± 5.2 x,X2.51 ± 0.02 w78.3 ± 3.7 x,XNDND
904.68 ± 0.26ND245.1 ± 6.0 y,X4.59 ± 0.42 x,W232.3 ± 22.0 y,X8.44 ± 0.33 XND
1806.83 ± 0.51ND397.5 ± 9.7 z,W5.53 ± 0.09 y,W340.2 ± 44.0 z,X9.88 ± 0.99 WND
BS0ND1.65 ± 0.04 w4.81 ± 0.33 w,WND9.05 ± 0.24 w,WNDND
30ND1.98 ± 0.04 x20.2 ± 0.9 x,WND43.2 ± 6.8 x,WNDND
90ND2.81 ± 0.09 y183.3 ± 8.9 y,W4.22 ± 0.71 W202.2 ± 16.0 y,WX5.51 ± 0.35 W13.5 ± 0.78
180ND3.07 ± 0.06 z543.9 ± 8.7 z,Y7.14 ± 0.53 X304.1 ± 5.12 z,X9.85 ± 1.01 W16.0 ± 1.25
Values correspond mean ± standard deviation of the analysis results. a–c: The same letters indicate that the difference between the properties of cheeses produced from the same milk type during storage is not significant (p > 0.05). A–C: The same letters indicate that the difference between the properties of cheeses produced from different milk types at the same storage time is not significant (p > 0.05). w–z: The same letters indicate that the differences in the properties of the brine from the same cheese during storage are not significant (p > 0.05). W–Y: The same letters indicate that the differences in the properties of the brine from cheeses at the same storage time are not significant (p > 0.05). The numbers mentioned below the volatile compounds were related to linear retention index for DB-WAX Column. Abbreviations: CC, cow milk cheese; CCS, mix (cow and sheep) milk cheese; CS, sheep milk cheese; BC, brine of cow milk cheese; BCS, brine of mix (cow and sheep) milk cheese; BS, brine of sheep milk cheese; ND, not detected.
Disclaimer/Publisher’s Note: The statements, opinions and data contained in all publications are solely those of the individual author(s) and contributor(s) and not of MDPI and/or the editor(s). MDPI and/or the editor(s) disclaim responsibility for any injury to people or property resulting from any ideas, methods, instructions or products referred to in the content.

