3.1. Chemical Composition
Surface composition analysis was performed using XPS to determine the valence state of each element in the compound LaFe
0.7Ni
0.3O
3, with the analysis shown for a sintering temperature of 1073 K.
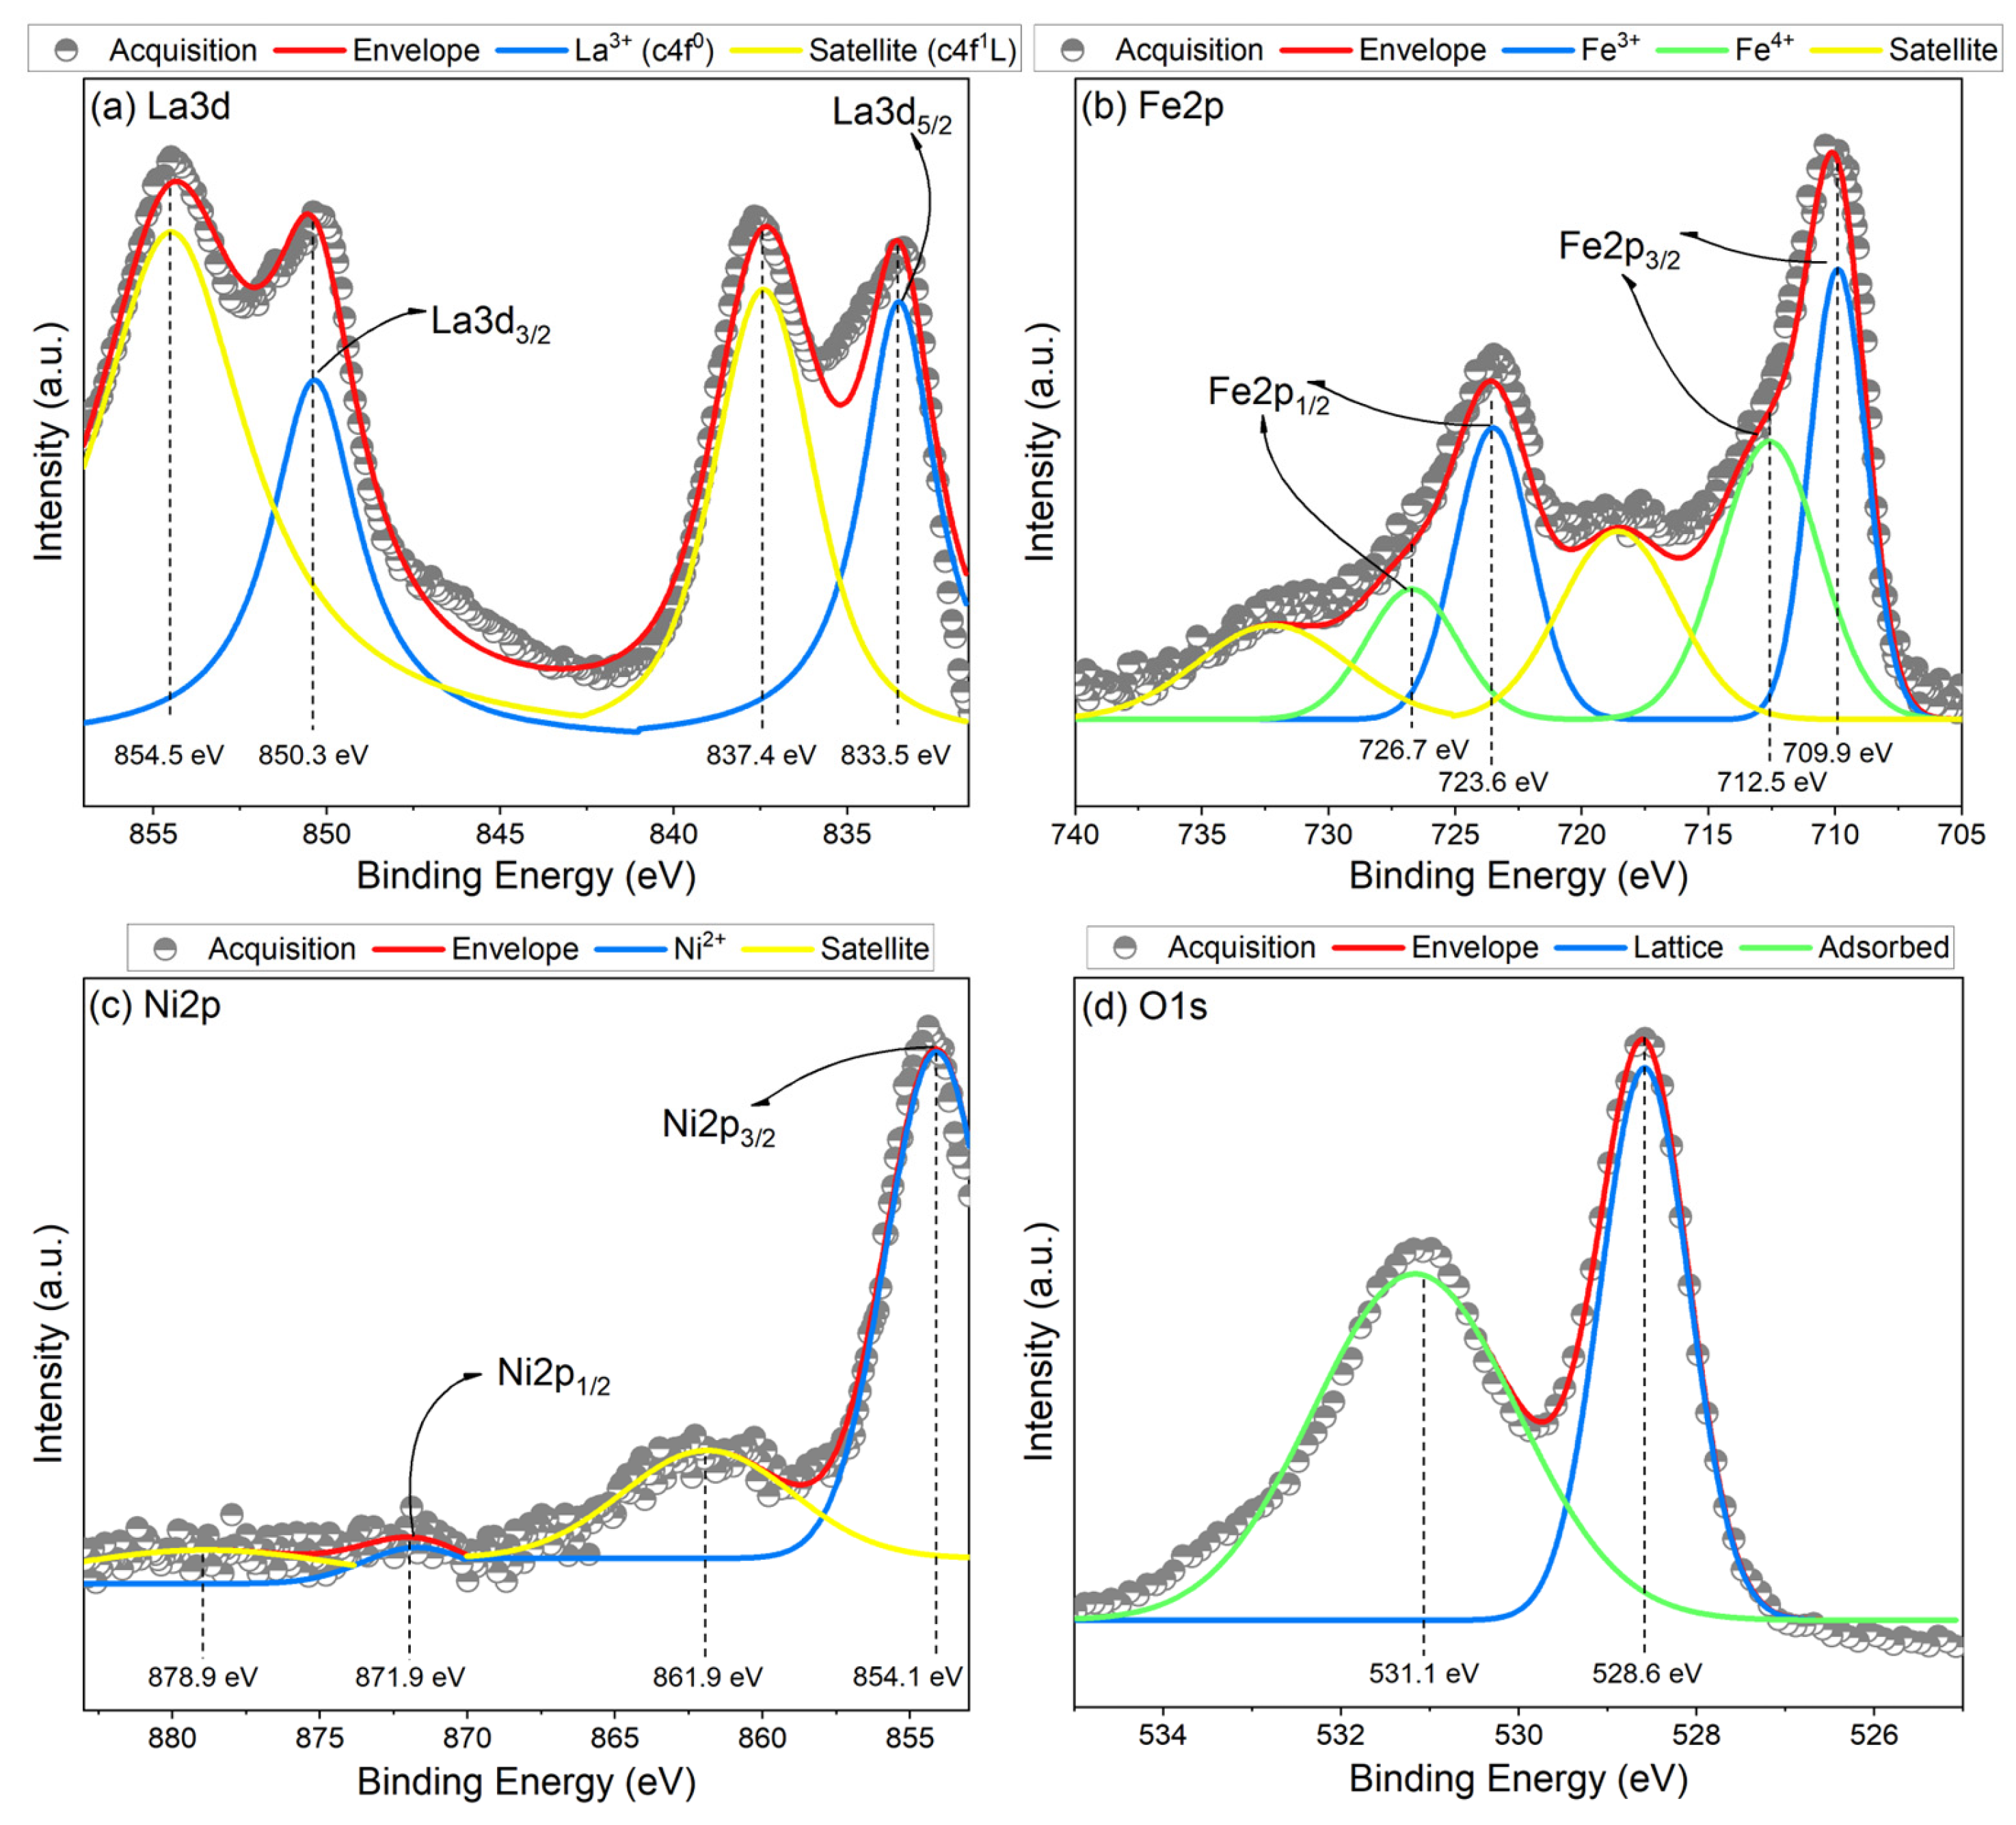
Figure 1 shows the XPS spectra obtained for lanthanum (
Figure 1a), iron (
Figure 1b), nickel (
Figure 1c), and oxygen (
Figure 1d), each one with their respective deconvolution.
Figure 1a, corresponding to La3d, shows doublets associated with the 3d
5/2 and 3d
3/2 states, with main peaks at 833.5 and 850.3 eV, respectively, and satellite peaks at 827.4 and 854.5 eV for each region of the spectrum. The presence of c4f
0 and c4f
1L indicates charge transfer between the metal and the oxygen, a characteristic behavior of perovskites with high oxygen mobility. The c4f
0 state, where c refers to the presence of a hole in the nucleus, 4f
0 to the absence of electrons in the 4f orbital indicating states in lanthanum without charge transfer, and c4f
1L, which marks the transfer of an electron from the ligand atom L to the 4f orbital denoting charge transfer; together with the aforementioned main and satellite peaks, shows evidence of trivalent lanthanum ions in the sample [
26].
Figure 1b presents the Fe2p spectrum, whose deconvolutions show the main peaks characteristic of the 2p
3/2 and 2p
1/2 states located at 709.9 eV and 723.6 eV, respectively, associated with the presence of Fe
3+. Likewise, peaks shifted towards higher bond energies corresponding to the same states are observed, which is evidence of oxidation to Fe
4+. The formation of Fe
4+ is related to the charge compensation mechanisms necessary to maintain electrical neutrality in the material [
27].
The oxidation to Fe
4+ does not occur arbitrarily, but as a direct consequence of the charge neutrality in the perovskite lattice. Structurally, each substitution of a divalent cation in a site occupied by a trivalent cation implies the loss of one positive charge per substitution. As compensation, a percentage of the 3+ cation formally transforms into a 4+ cation to ensure the system’s stability without the need for additional compensation processes. On the other hand, a cation in the 2+ state does not directly resolve the charge deficit but requires a greater energy cost to reach equilibrium. From a thermodynamic perspective, the system tends to minimize its Gibbs free energy, so the oxidation to Fe
4+ constitutes a more favorable route to stabilize the crystal lattice, as confirmed by the XPS results. This mechanism is not exclusive to ferrite; it has been observed in lanthanum manganites with divalent substitutions, even at A sites, with a confirmed oxidation of a percentage of Mn
3+ to Mn
4+ [
28].
Figure 1c shows the spectrum corresponding to Ni2p, where a main peak is observed at 854.1 eV, associated with the predominant position for Ni
2+ (Ni2p
3/2) [
29]. This cation is characterized by a multicomponent envelope spectrum that includes the Ni2p
1/2 state at 871.9 eV, as well as satellite peaks at 861.9 and 878.9 eV, which are visible in the deconvolutions. The presence of these satellites is considered unequivocal evidence of Ni
2+ states, since in the case of Ni
0 there are no satellite peaks and the main peak is typically located below 852 eV. whereas for Ni
3+ the associated states occur at higher binding energies and lack characteristic satellites.
The presence of Ni2+ is related to charge transfer processes associated with satellite peaks, indicating quite a strong electron-ligand interaction. Therefore, although Ni is present in relatively low proportions, its presence modulates the electronic structure and favors oxidation to Fe4+.
It is worth to note that the XPS spectra provide direct evidence supporting the stabilization of Fe4+ instead of Ni3+ in the LaFe0.7Ni0.3O3 samples. This occurs because Ni3+ is an uncommon and thermodynamically less stable cation in oxide structures such as LFO, due to several factors. First, its ionic radius is significantly smaller than that of Fe3+, which induces considerable distortions in the crystal lattice. In addition, the energy required to oxidize Ni2+ to Ni3+ is higher, pointing that this oxidation may only occur under special conditions such as high pressure or highly oxidizing atmospheres. Consequently, the presence of Ni3+ in perovskites is quite unlikely.
On the other hand, Fe3+ with a 3d5 configuration exhibits a stable half-filled state, since all d orbitals are singly occupied. When oxidized to Fe4+ with a 3d4 configuration, it loses this stability with minimal energy cost, owing to the ability of iron to accommodate different oxidation states in oxide environments. In perovskites, this oxidation is common due to the strong covalent interaction with oxygen.
In contrast, Ni2+ with a 3d8 configuration is highly stable in octahedral coordination because its d orbitals are nearly filled. Oxidizing it to Ni3+ with a 3d7 configuration requires removing an electron at a higher energetic cost compared to iron. Furthermore, Fe–O bonds exhibit greater covalent character, which favors the stabilization of Fe4+; whereas nickel tends to form more ionic bonds in its Ni2+ state, so the transition to Ni3+ would demand a more oxidizing chemical environment.
This interpretation is consistent with the findings of Ref. [
26], who demonstrated that oxygen non-stoichiometry in LaFeO
3 becomes more pronounced at elevated temperatures, and vacancy formation strongly influences both electrical transport and local structural distortions. In this case, it is expected that at higher sintering temperatures, oxygen vacancies will become thermodynamically favorable.
Finally,
Figure 1d presents the spectrum corresponding to oxygen, where the deconvolutions show two distinct contributions. The peak at 528.6 eV corresponds to structural oxygen present in the ferrite lattice, associated with La–O and Fe–O bonds in the crystal lattice. Meanwhile, the peak at 531.1 eV is associated with oxygen adsorbed or bound to oxygen vacancies on the surface. The presence of these vacancies provides high surface reactivity, so the adsorbed oxygen occupies them or interacts with them, influencing material properties such as conductivity and even generating an apparent increase in Maxwell–Wagner (MW) polarization, an intrinsic effect related to the material’s surface response. In this context, the XPS spectra also confirm the coexistence of Fe
3+ and Fe
4+ states, supporting the stabilization of Fe
4+ rather than Ni
3+.
Table 1 shows the relative proportion of ions present in the sample, expressed as atomic percentage and by weight. A significant percentage of C1s, representing adventitious carbon, is observed, related to the uncontrolled atmosphere during the material’s synthesis. O1s reflects the contribution of structural oxygen, with a significant percentage in the composition, also related to the oxidizing atmosphere during synthesis and processing. La3d and Ni3p ions appear in proportions consistent with their expected presence in the compound, with some slight variations attributed to surface sensitivity and interaction factors. Specifically, Fe2p and Ni2p show proportions consistent with doping, as both atomic percentage and weight are around 34%. The remaining composition is associated with relatively small amounts of F1s, N1s, and Na1s, corresponding to common surface contaminants and traces related to material handling.
3.2. Crystal Structure
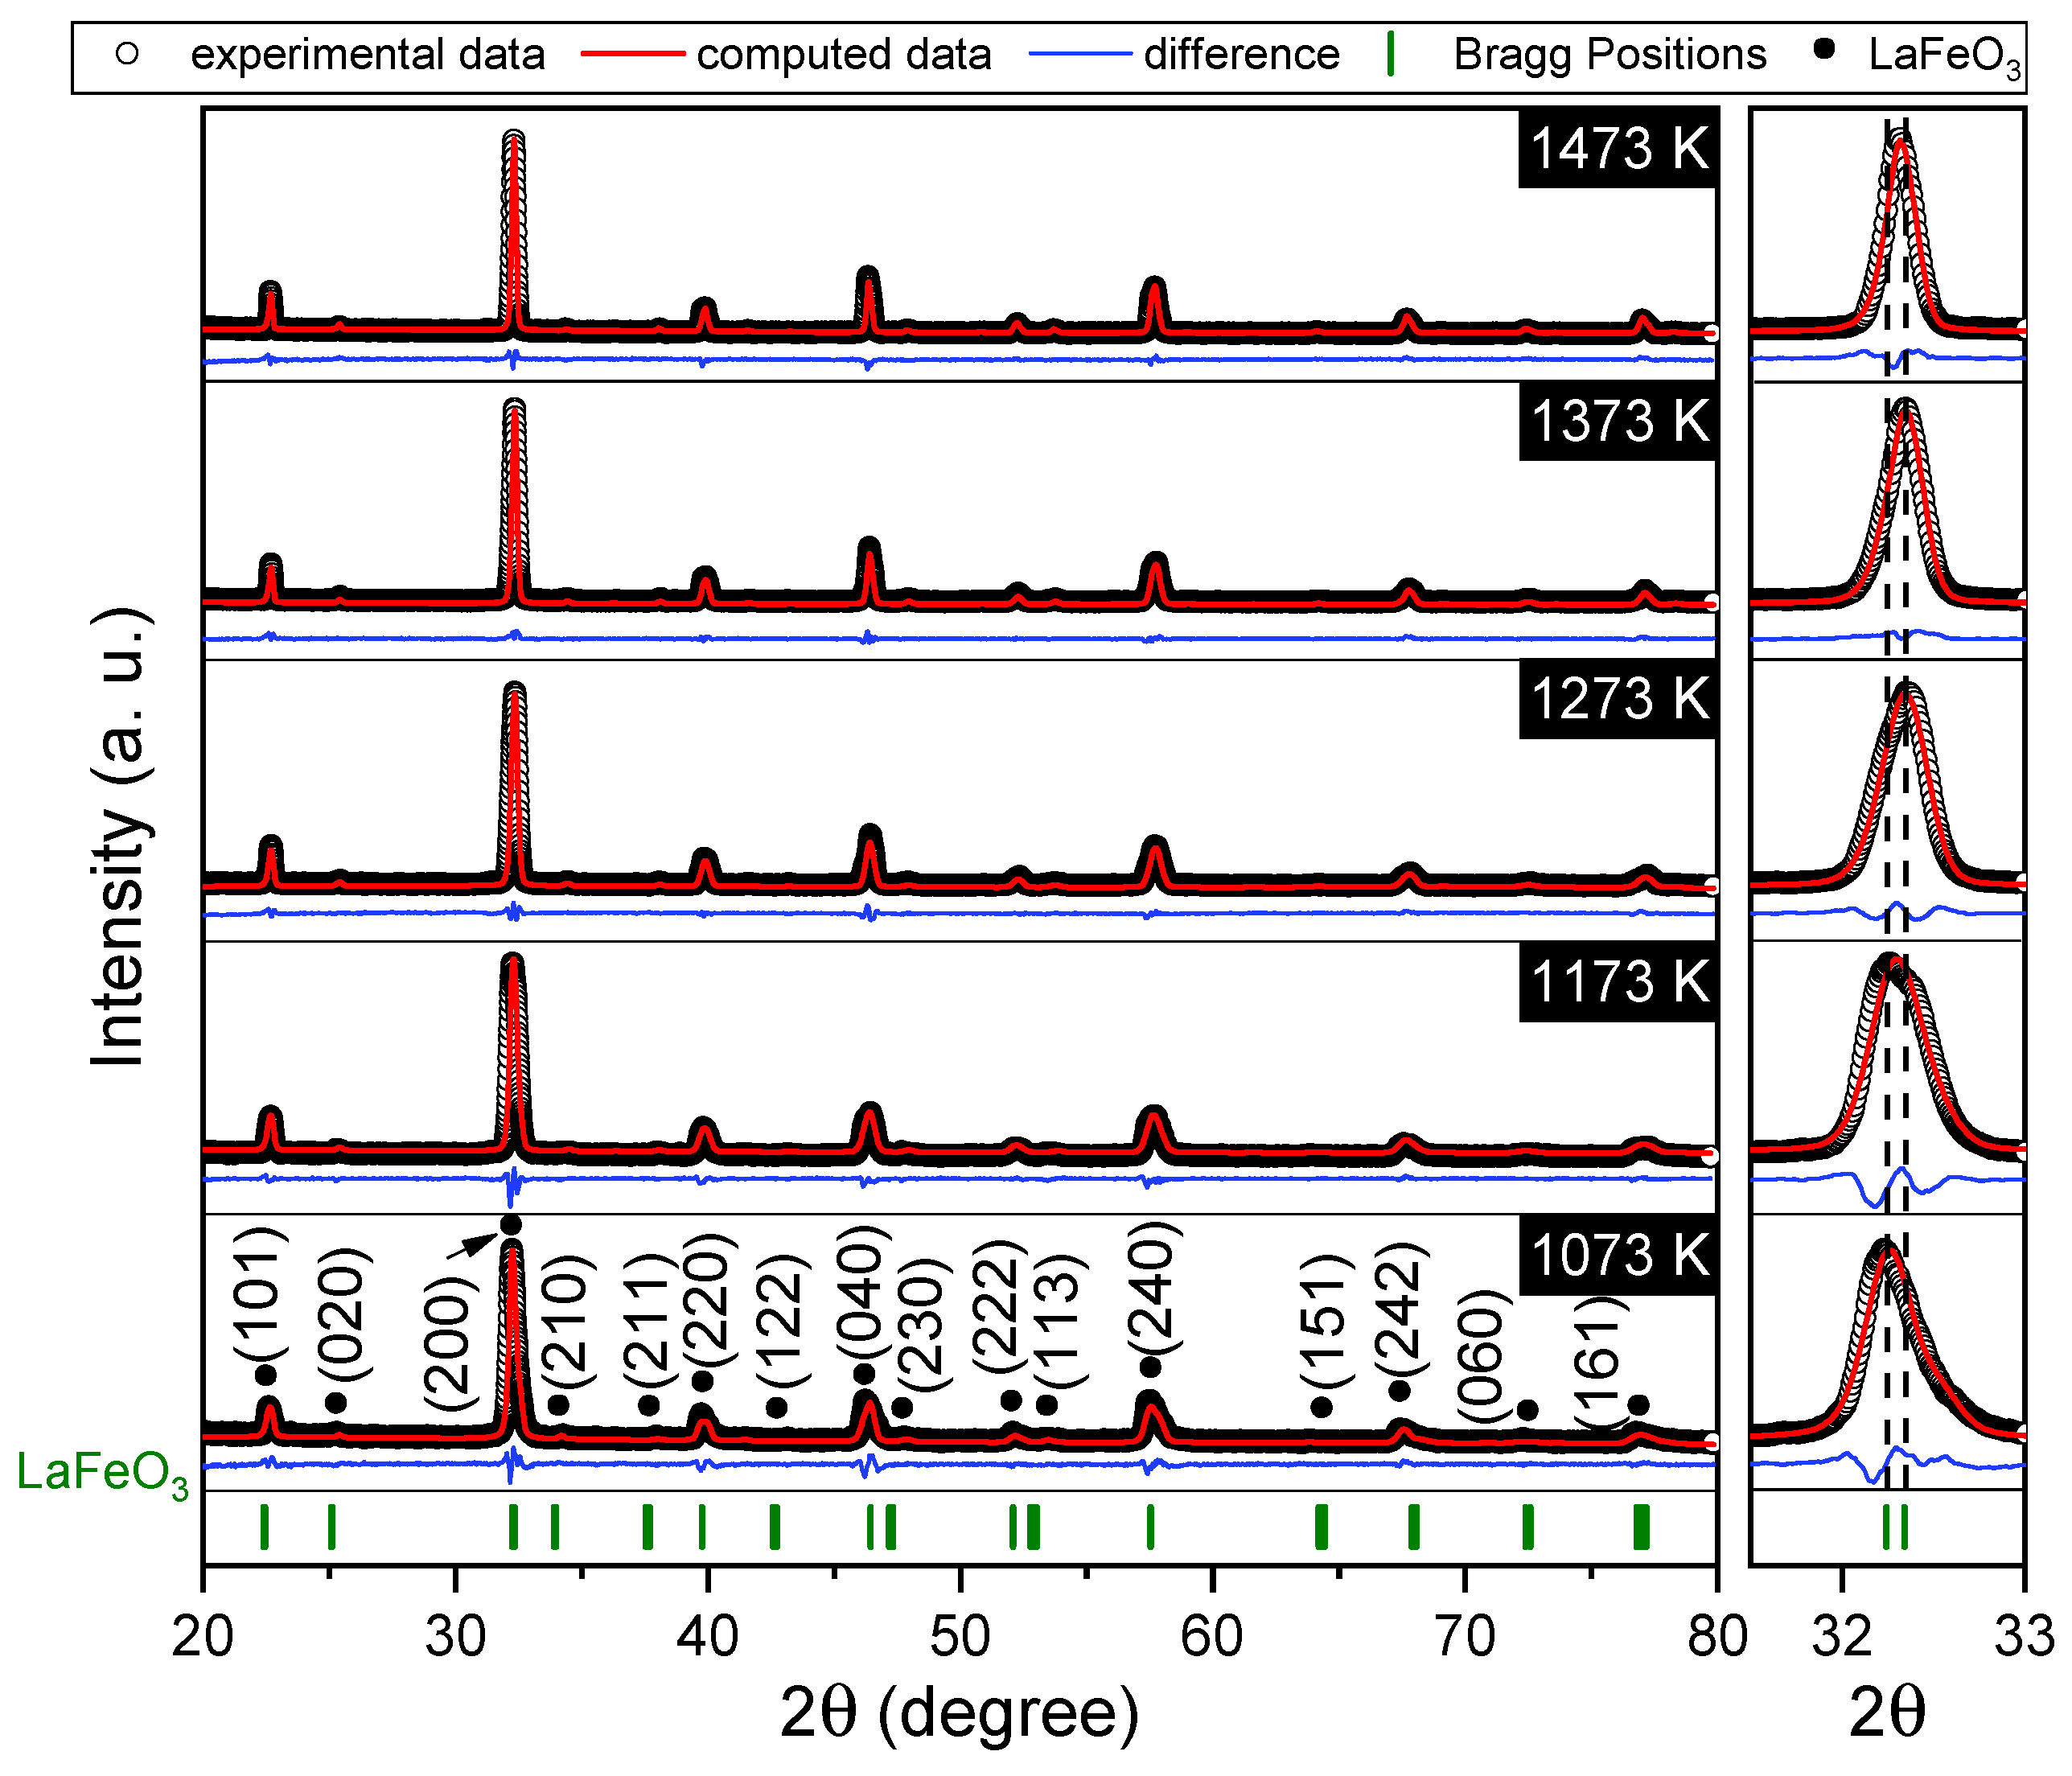
X-ray diffractograms were obtained for sintered pellets at different temperatures, which were analyzed by Rietveld refinement. The results are presented in
Figure 2 and in
Table 2, showing the values of cell size, crystallite size, microstrain, and fitting parameters, where
χ2 statistics and weighted profile residuals R
wp indicate an adequate fit between the calculated and experimentally obtained data. An orthorhombic phase of LFO (
Pnma, COD 1561807) was identified for all samples at different sintering temperatures without the presence of secondary phases, confirming that the stoichiometric reaction (1) was successfully completed. The introduction of 0.3 mol nickel does not change the orthorhombic phase, so it is considered that a solid solution was formed.
All the X-ray patterns exhibit a main diffraction peak around 32–32.5° in 2
θ, characteristic of the orthorhombic phase of LFO. As the sintering temperature increases, this peak shifts toward higher angles, indicating a contraction of the unit cell. This behavior is consistent with two contributing factors: initial doping and subsequent thermal effects. The lattice contraction is expected, as oxidation from Fe
3+ to Fe
4+ has been reported as a charge compensation mechanism when lower-valence cations are introduced [
13]. Since Fe
4+ (0.585 Å) has a smaller ionic radius than Fe
3+ (0.645 Å), the lattice contracts accordingly. Additionally, the ionic radius of Ni
2+ (0.69 Å) is comparable to that of Fe
3+, allowing the formation of a solid solution without significant structural distortion.
The reflections such as (101), (211), and (240) in diffraction patterns, which are not listed in the ideal cubic perovskite but characteristic of the orthorhombic Pnma symmetry. These reflections arise from antiferrodistortive rotations of the FeO6 octahedra, where adjacent octahedra rotate in opposite directions around the crystallographic axes. This distortion doubles the unit cell and breaks inversion symmetry at the midpoints between magnetic cations. Although tilting modes and ferroelectric displacements are structurally competitive, the observed superlattice peaks confirm that antiferrodistortion is the dominant structural feature in our samples, and it plays a crucial role in enabling weak ferromagnetism.
In addition,
Figure 2 includes a zoom-in on the main diffraction peak, where a progressive narrowing is observed as the sintering temperature increases. This narrowing indicates an increase in crystallite size, attributed to: (i) enhanced atomic diffusion in the solid state, facilitated by thermal energy that enables atoms to overcome activation barriers and migrate within the crystal lattice [
30]; (ii) the reduction in defects such as grain boundaries, which are thermodynamically unstable regions that hinder crystallite growth and tend to diminish at higher temperatures; and (iii) the Ostwald ripening effect, whereby smaller crystallites dissolve and their constituent atoms contribute to the growth of larger ones [
31]. These processes collectively promote material densification.
On the other hand, the values corresponding to the microstresses decrease, which is consistent with the narrowing, with the increase in crystallite size, and this decreases the energy of the crystalline structure, promotes relaxation of local stresses and is related to the increase in temperature. That is, since smaller crystallites have a larger relative surface area and more defects, they generate a greater amount of microstresses in the unit cell, so that as the crystallites grow, as a consequence of the atomic distribution due to diffusion and a lower presence of defects, there is less distortion and tension in the lattice. That is, larger crystallites reduce the system’s overall energy by relieving local stresses and minimizing lattice distortions. Smaller crystallites, due to their higher surface-to-volume ratio and greater defect density, introduce greater microstrain into the unit cell. As atomic diffusion progresses and defects decrease, the relaxation of the crystal lattice increases, resulting in lower stress and greater structural stability.
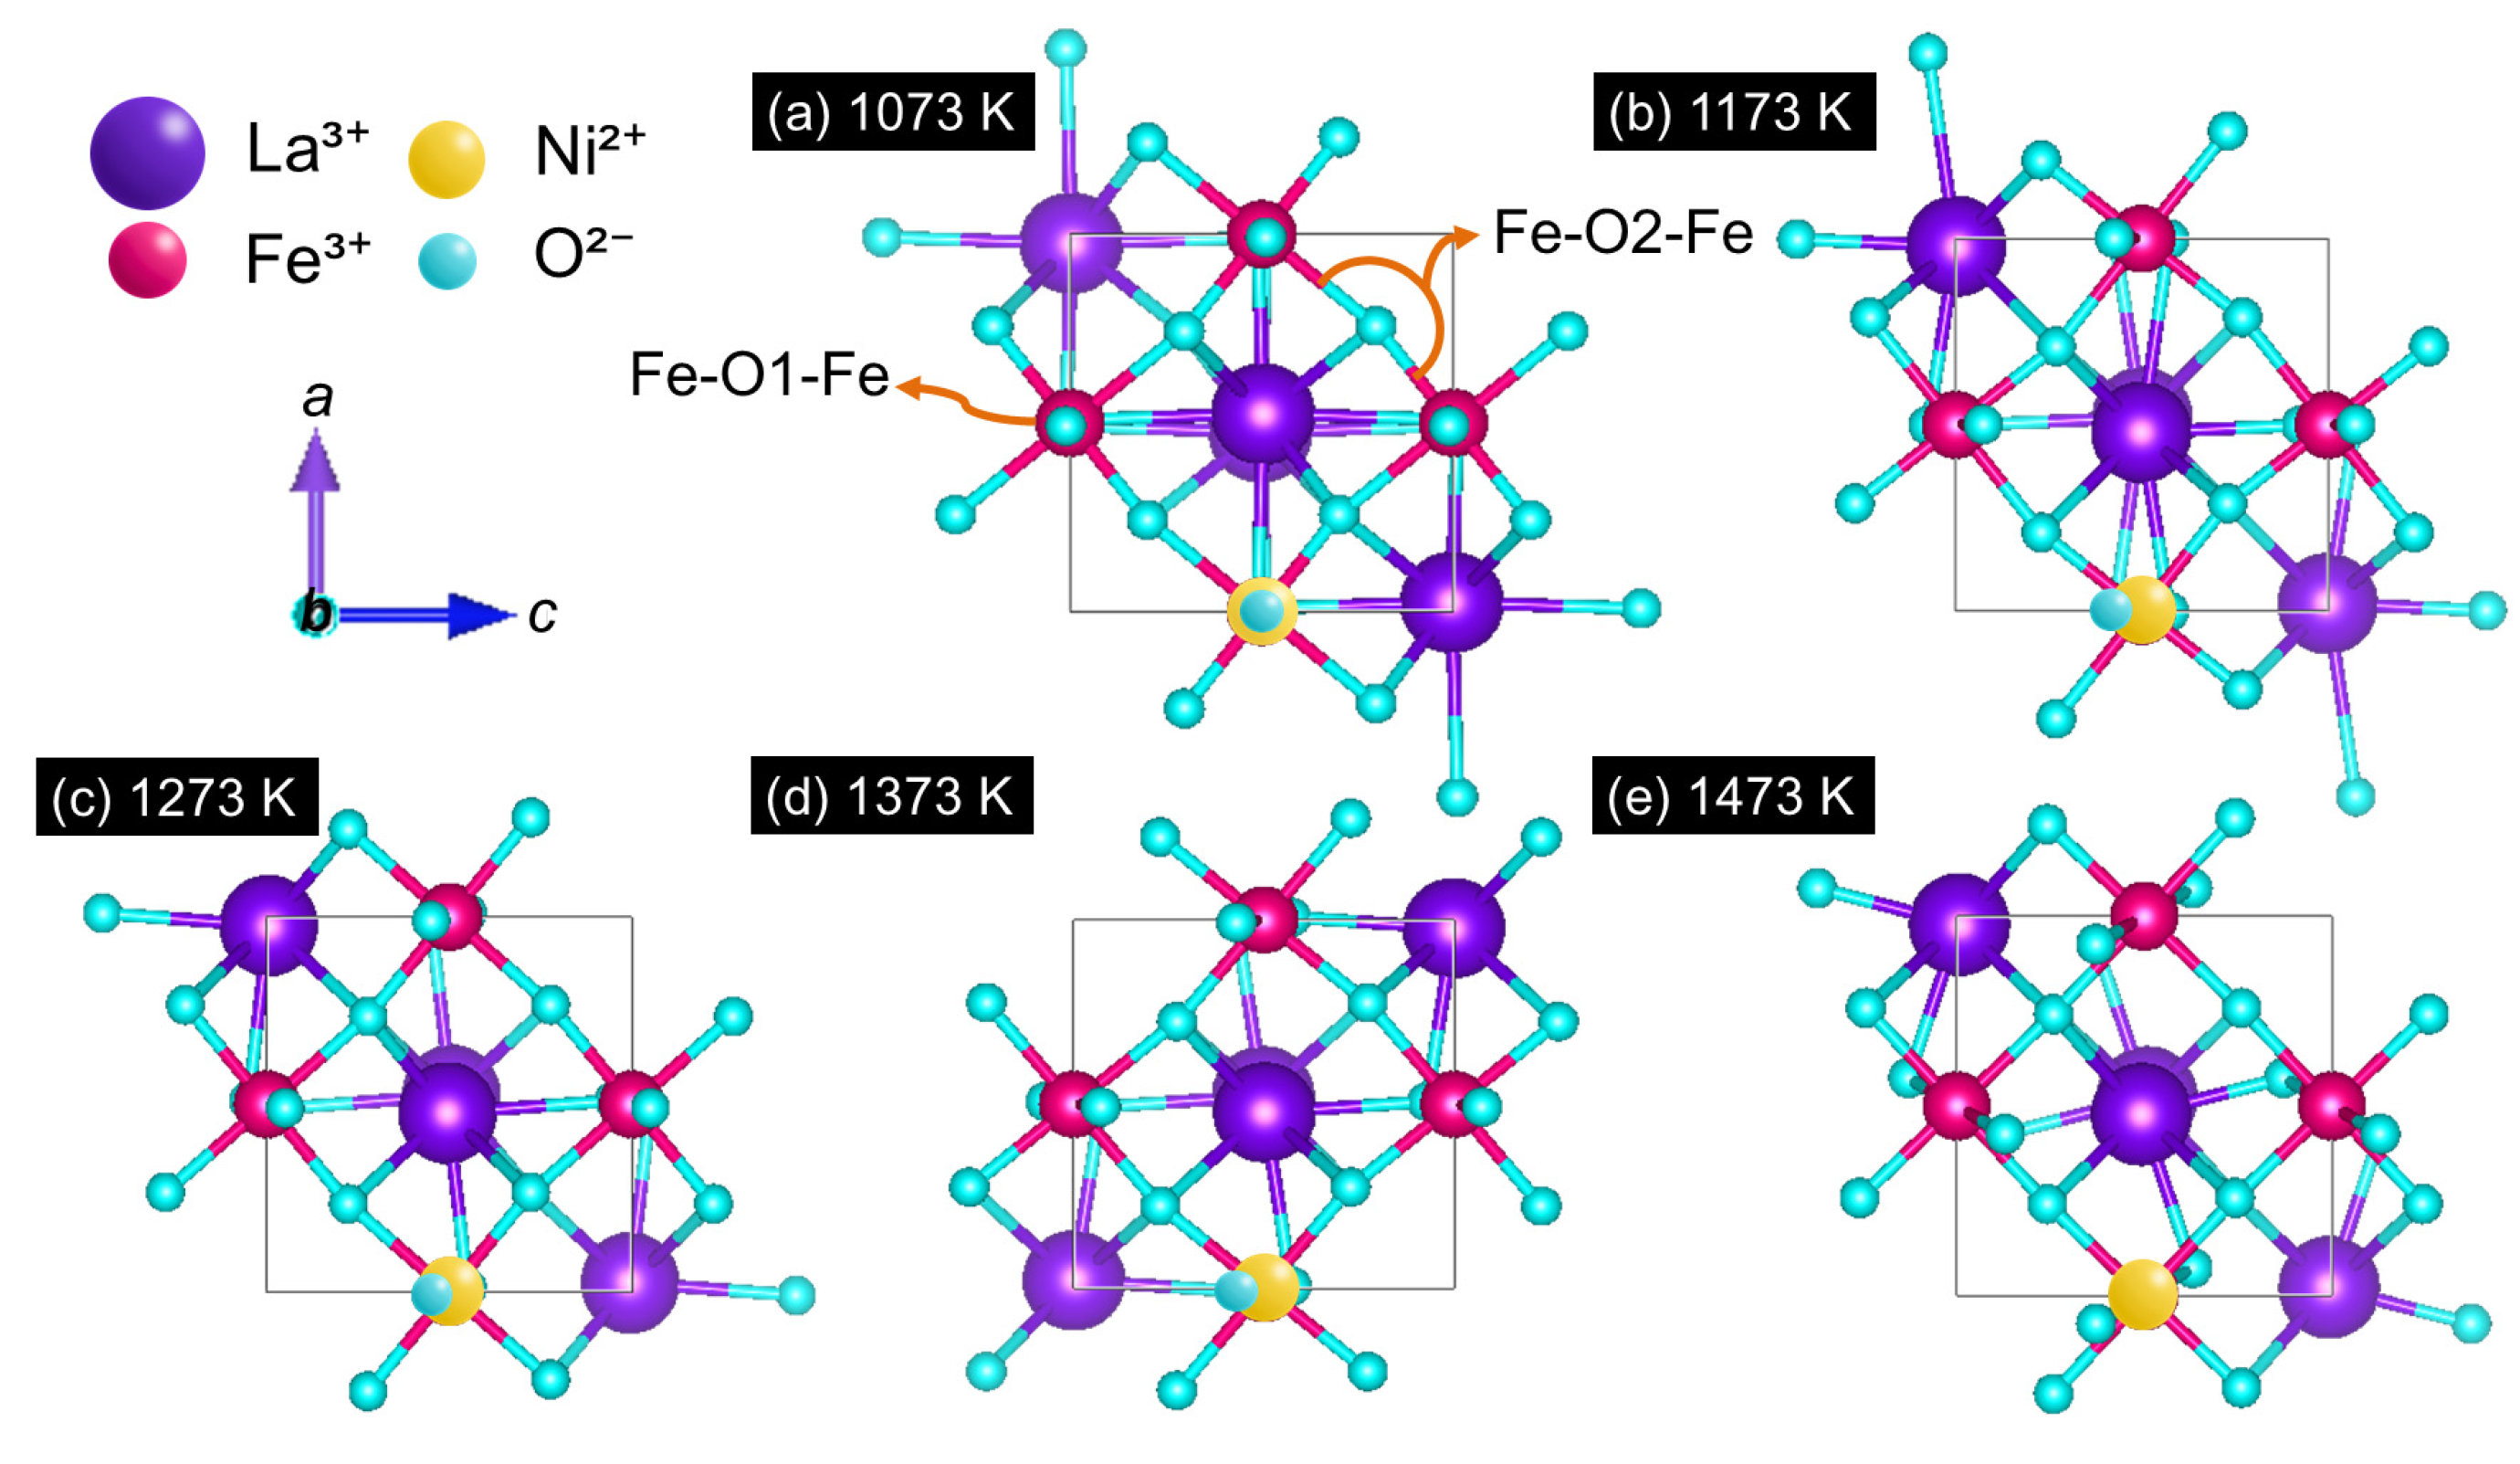
In order to visualize the deformation in the octahedron of the ferrite structure as a consequence of the increase in sintering temperature, a simulation was performed using the VESTA software v 3.5.5 (Visualization for Electronics and Structural Analysis) [
32] from the refinement data to estimate the Fe–O–Fe bond angles and Fe–O distances, given that the octahedron formed by these cations is responsible for the magnetic behavior of the material, so it is essential to analyze the modification of the angles. The obtained values, as well as the simulated structure of the material, are shown in
Table 3 and
Figure 3.
The proposed structural model has already considered the coexistence of the cations present in the system (Fe3+/Fe4+ and Ni2+), whose presence has been confirmed by XPS analysis. Moreover, the difference in ionic radii is compensated within the structural model by fulfilling the relation (Ni2+-Fe4+) - (Ni2+-Fe3+) = (Fe3+-Fe4+), which ensures that these variations do not significantly modify the structural framework or the crystallographic symmetry.
As observed, the simulations reveal different values for the Fe–O1–Fe, Fe–O2–Fe angles, as well as for the Fe–O1 and Fe–O2 distances. At 1073 K a tendency towards structural linearity can be noticed, that is, when the central atom is bonded to the other two at an angle of 180°, presenting values close to 176° for Fe–O1–Fe and 153.9° for Fe–O2–Fe, which suggests a reduction in angular distortion due to processing compared to literature-reported values around 167 degrees for Fe–O1–Fe, and that for the bond with O2 the distances are so large that they are not reported [
13]. Considering that LFO has a distorted orthorhombic perovskite structure due to the mismatch in ionic radii between La
3+, Fe
3+, and O
2−, these values indicate a compensated angular symmetry and greater internal deformation within the local symmetry of the present octahedron [
33].
At 1173 K, both angles show similar values, of 156.4 and 163.4°, reflecting a slight structural distortion with possible redistribution of octahedral tilts. At the intermediate temperature of 1273 K, both angles stabilize around 160°, indicating a balanced configuration between symmetry and distortion.
The non-monotonic behavior observed between 1173 and 1273 K can be explained by the competition of microscopic processes occurring in this temperature range. On the one hand, enhanced atomic diffusion promotes crystallite growth and partial relaxation of microstrain, leading to a more symmetrical configuration of the Fe–O–Fe octahedra. On the other hand, the redistribution of oxygen vacancies and local tilts introduces transient distortions that temporarily stabilize bond angles around 160°, as shown in
Table 3. This balance between structural relaxation and defect reorganization produces a metastable state, reflected in the non-linear evolution of structural properties. At higher temperatures, vacancy concentration and anisotropic distortions increase again, driving the subsequent reorganization of the lattice and the changes in hysteresis behavior.
At 1373 K, the Fe–O1–Fe angle decreases while Fe–O2–Fe increases, suggesting a compensated symmetry within the structure. However, at the highest temperature of 1473 K, an inversion in the trend occurs, Fe–O1–Fe decreases considerably up to 134.4°, while Fe–O2–Fe reaches its maximum at 168.2°, indicating a notable structural reorganization. At such high temperatures, diffusion mechanisms may cause atoms to move across grain boundaries, for example, dopants such as Ni2+, to migrating towards grain boundaries or other surfaces, even causing some oxygen vacancies or the generation of structural defects.
These vacancies alter the local coordination environment, producing distortions in bond lengths and angles, as observed in
Table 3. Such structural modifications are consistent with the stabilization of Fe
4+ cations, since oxygen deficiency promotes the oxidation of Fe
3+ to maintain charge neutrality. Therefore, the structural changes tabulated are rationalized by the combined effect of oxygen vacancy formation and Fe oxidation, rather than by the unlikely stabilization of Ni
3+. This interpretation is consistent with the observations of Cao [
26], who reported with vacancy formation strongly influencing electrical transport and local structural distortions.
This latter phenomenon promotes the formation of crystalline anisotropies, which impact the magnetic and dielectric behavior of the material.
Regarding the changes in bond distances, they reflect a definite thermal evolution. At low temperature (1073 K), axial elongation is observed, as shown in
Figure 3, with Fe–O2 measuring 2.120 Å and Fe–O1 at 1.966 Å. At 1173 and 1273 K, the distances progressively equilibrate around 2 Å, which, together with the bond angles at those temperatures, suggests structural relaxation and a possible tendency towards optimization of the octahedral lattice, that is, to achieve a more stable and symmetrical configuration.
At 1373 K, a partial inversion of these bond distances is observed, with Fe–O1 elongating to 1.994 Å and Fe–O2 shortening to 1.972 Å. This distortion becomes more pronounced at 1473 K, where Fe–O1 reaches a maximum of 2.121 Å and Fe–O2 a minimum of 1.970 Å. These modifications reflect structural distortions mainly associated with octahedral tilting within the same orthorhombic symmetry, which may favor the ferroelectric response of the material [
34].
It is hypothesized that, under high-temperature processing conditions and in the presence of oxygen vacancies, local regions with partial loss of centrosymmetry could emerge due to structural distortions, thereby promoting extrinsic polarization phenomena. Furthermore, variations in bond angles and distances affect the bandwidth (W), i.e., the extent of electronic itinerancy that mediates magnetic interactions through diamagnetic bridges between magnetic ions (Fe, Ni), favoring ferromagnetic-type electronic superexchange interactions.
This distance is calculated from the previously simulated bond angles and distances as follows [
35]:
where
W is the bandwidth,
ω is the Fe–O–Fe bond angle, and
dFe–O is the angle distance. On the other hand, to correlate the electronic connectivity and the structural distortion of the FeO
6 lattice with the change in the heat treatment, the angular deviation with respect to the ideal geometry mentioned above (180°) is quantified through the estimation of the tilt angle, which is calculated as follows for the orthorhombic perovskite structures [
36]:
and
where
ω1 refers to the Fe–O1–Fe angle along the Z-axis (axial angle), and
ω2 to the Fe–O2–Fe angle along the X-axis (perpendicular tilt), such that
φ1 represents the structural distortion along the Z-axis and
φ2 the structural distortion along the X-axis.
The values obtained from these calculations are given in
Table 4, where a decrease in
WFe–O1–Fe is observed at high temperatures, associated with a deoptimization of the FeO
6 lattice, that is, a loss of symmetry, reflecting a structural reorientation. Similarly, the tilting values at 1073 K indicate an almost ideal symmetry along the Fe–O1–Fe axis, as previously mentioned, while at 1473 K a notable increase confirms severe distortion of the octahedral environment. In contrast, the tilt for Fe–O2–Fe decreases with temperature, from 16.05° to 7.23°, suggesting partial relaxation along the perpendicular axis, possibly as a compensatory mechanism for the excessive octahedral rotation in
φ1 through redistribution of internal stresses. Considering all the parameters analyzed above, the sintering range between 1173 and 1273 K appears to be structurally optimal due to the balanced values of
W and
φ; that is,
W is not as low as at 1473 K, where symmetry and electron connectivity are lost, nor as high as at 1073 K, where symmetry is almost linear with limited electronic connectivity. Therefore, presenting intermediate values in the working temperature range implies that the itinerant electrons can still move with sufficient connectivity to favor FM super-exchange interactions over AFM interactions. For its part, the octahedral lattice is neither too rigid nor excessively distorted but rather compensated, which suggests a favorable structural configuration.
3.4. Magnetic Properties
It is known that lanthanum ferrite exhibits a G-type antiferromagnetic order in its pure state, resulting from the cancellation of magnetic moments due to the opposite orientation of the Fe spins. However, as mentioned, through doping, the induction of its magnetic order to weak ferromagnetic has been achieved, as is the case for the LaFe0.7Ni0.3O3 compound.
The observed weak ferromagnetism can be explained by the spin tilt induced by antiferrodistortion rotations of the FeO
6 octahedra. Antiferrodistortion rotations are alternating tilts of the octahedra in opposite directions, consequently destroying the inversion centers between Fe sites. These rotations eliminate the inversion centers between neighboring Fe sites, thus activating the DM interaction. As a result, the antiferromagnetic sublattices exhibit a slight spin tilt, producing a net magnetization. This mechanism is consistent with structural evidence obtained by X-ray diffraction and with the observations of Ederer [
37], where weak ferromagnetism in perovskites is directly linked to antiferrodistortion. Therefore, the magnitude of the magnetization is sensitive to the degree of octahedral rotation, which can vary with the sintering temperature and processing.
This change in order has been attributed to the structural distortion caused during synthesis and processing, as well as the substitution of Fe
3+ by Ni
2+, which modifies the superexchange interactions, favors double exchange mechanisms upon oxidation of Fe
3+ to Fe
4+ due to a charge compensation mechanism, and shows the appearance of coercivity [
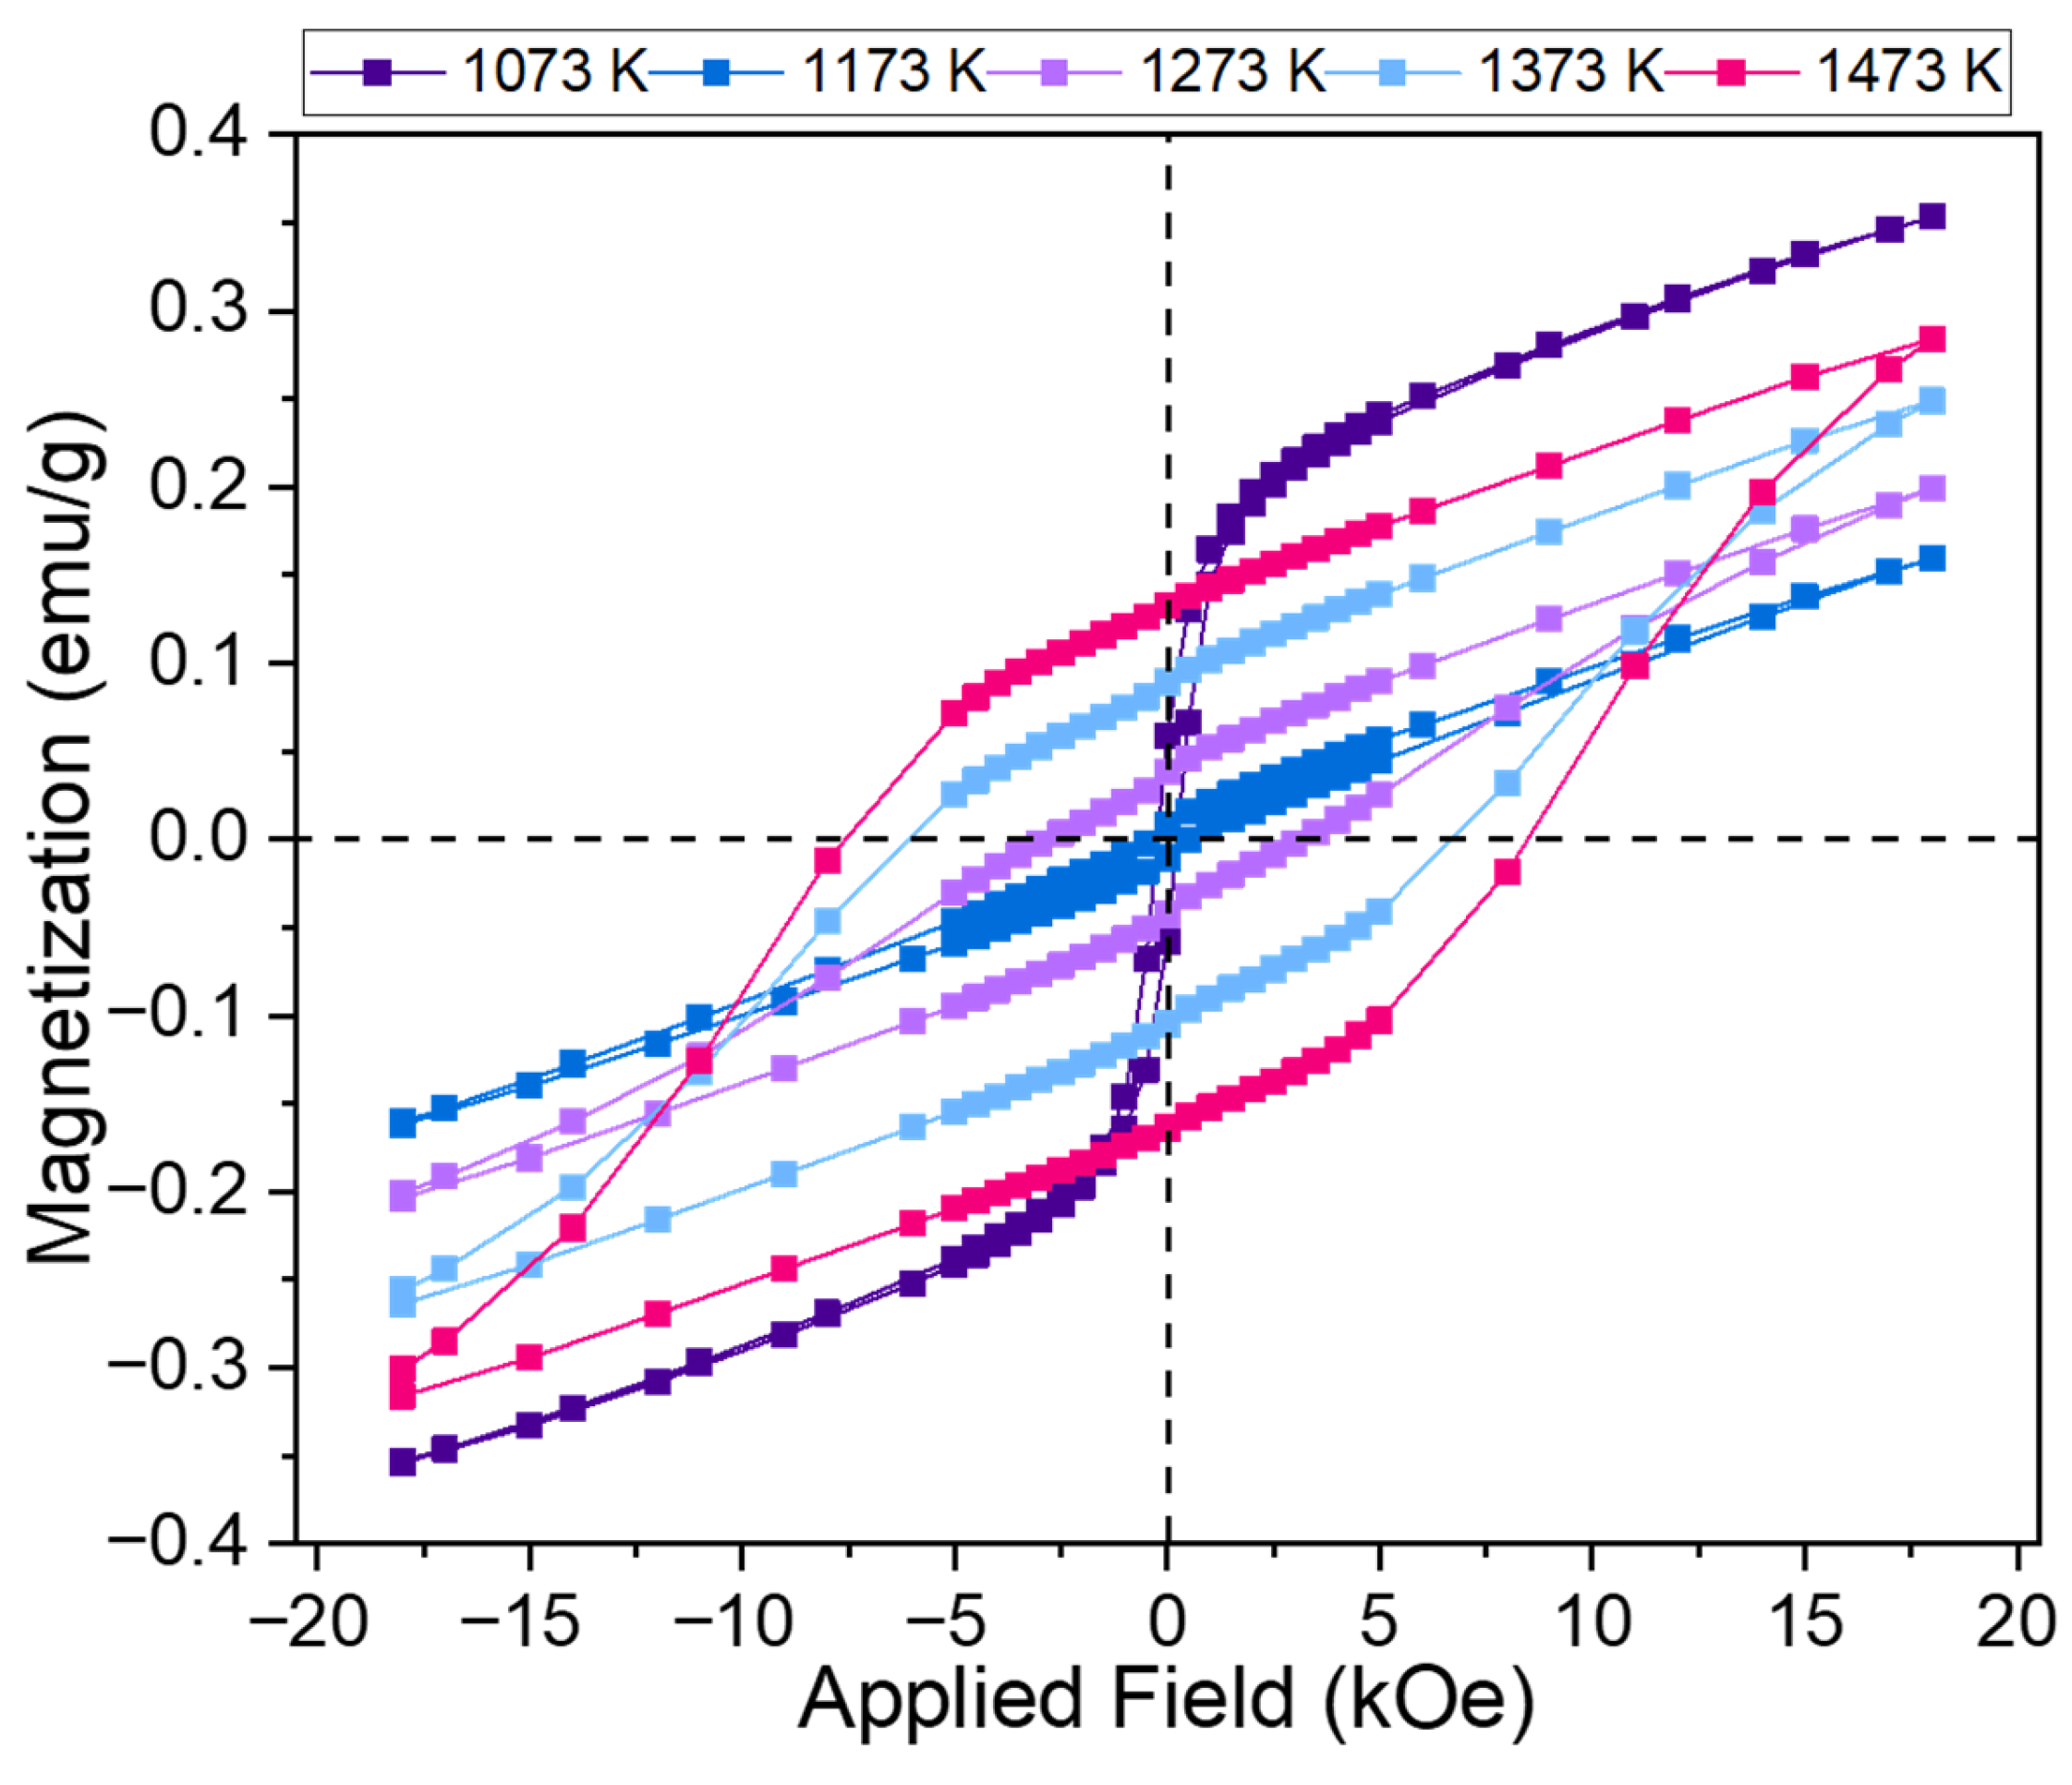
13]. To analyze the magnetic behavior of the material, the magnetic hysteresis loops of the LaFe
0.7Ni
0.3O
3 compound at different sintering temperatures are shown in
Figure 7.
The magnetic hysteresis loop of the sample at 1073 K is shown with a weak antiferromagnetic order with a saturation magnetization (M
s) of 0.3533 emu/g and an coercivity (H
c) of 236.0527 Oe (
Table 5), which coincides with previous studies [
13]. In the magnetic hysteresis loops, a change in magnetic behavior can be observed, where starting from the 1173 K sample, H
c increases and M
s decreases, suggesting structural distortions attributed to the increase in sintering temperature [
12]. Subsequently, it is observed that the increase in temperature leads to a behavior typically exhibited by hard magnetic materials; however, it is worth to mention that since the material is weak ferromagnetic, it is not considered magnetically hard.
In
Table 5, the values of M
s, remanent magnetization (M
r), H
c, as well as the squareness ratio (M
r/M
s) are presented. Generally, an abrupt decrease can be observed between the temperatures of 1073 and 1173 K, which subsequently recovers progressively. The minimum at 1173 K is associated with the possible inhibition of magnetic alignment by structural defects or local disorder, as well as the subsequent increase suggesting grain growth that favors a better magnetic order, meaning the alignment of domains, which is compatible with a multi-domain behavior. The grain growth is supported by the refinement values in
Table 2. This evolution in grain size is key, since larger grains allow for self-subdivision into regions with distinct magnetic orientation to minimize internal energy [
6]. On the other hand, the radically decreased microstrain values (from 20.7605 to 8.2344) indicate a relaxation of internal stresses, modifying the mobility capacity of the domain walls (pinning/depinning) and forming more stable domain structures, which impacts coercivity and results in higher remanence, as shown by the results. Regarding the M
r/M
s ratio, which indicates the material’s magnetic retention capacity, a value of 0.1741 is observed for 1073 K, an expected value in soft magnetic materials [
10]; however, at 1173 K it decreases to 0.0520 before increasing up to 0.47 at 1473 K with the sintering temperature, which also aligns with more stable and defined magnetic domains as mentioned, which resist demagnetization in coherence with the Rietveld refinement values. The LFO phase and the
Pnma space group remaining constant suggest that the magnetic changes are not due to phase transformations as is usual, but to microstructural evolution (grain growth and defects).
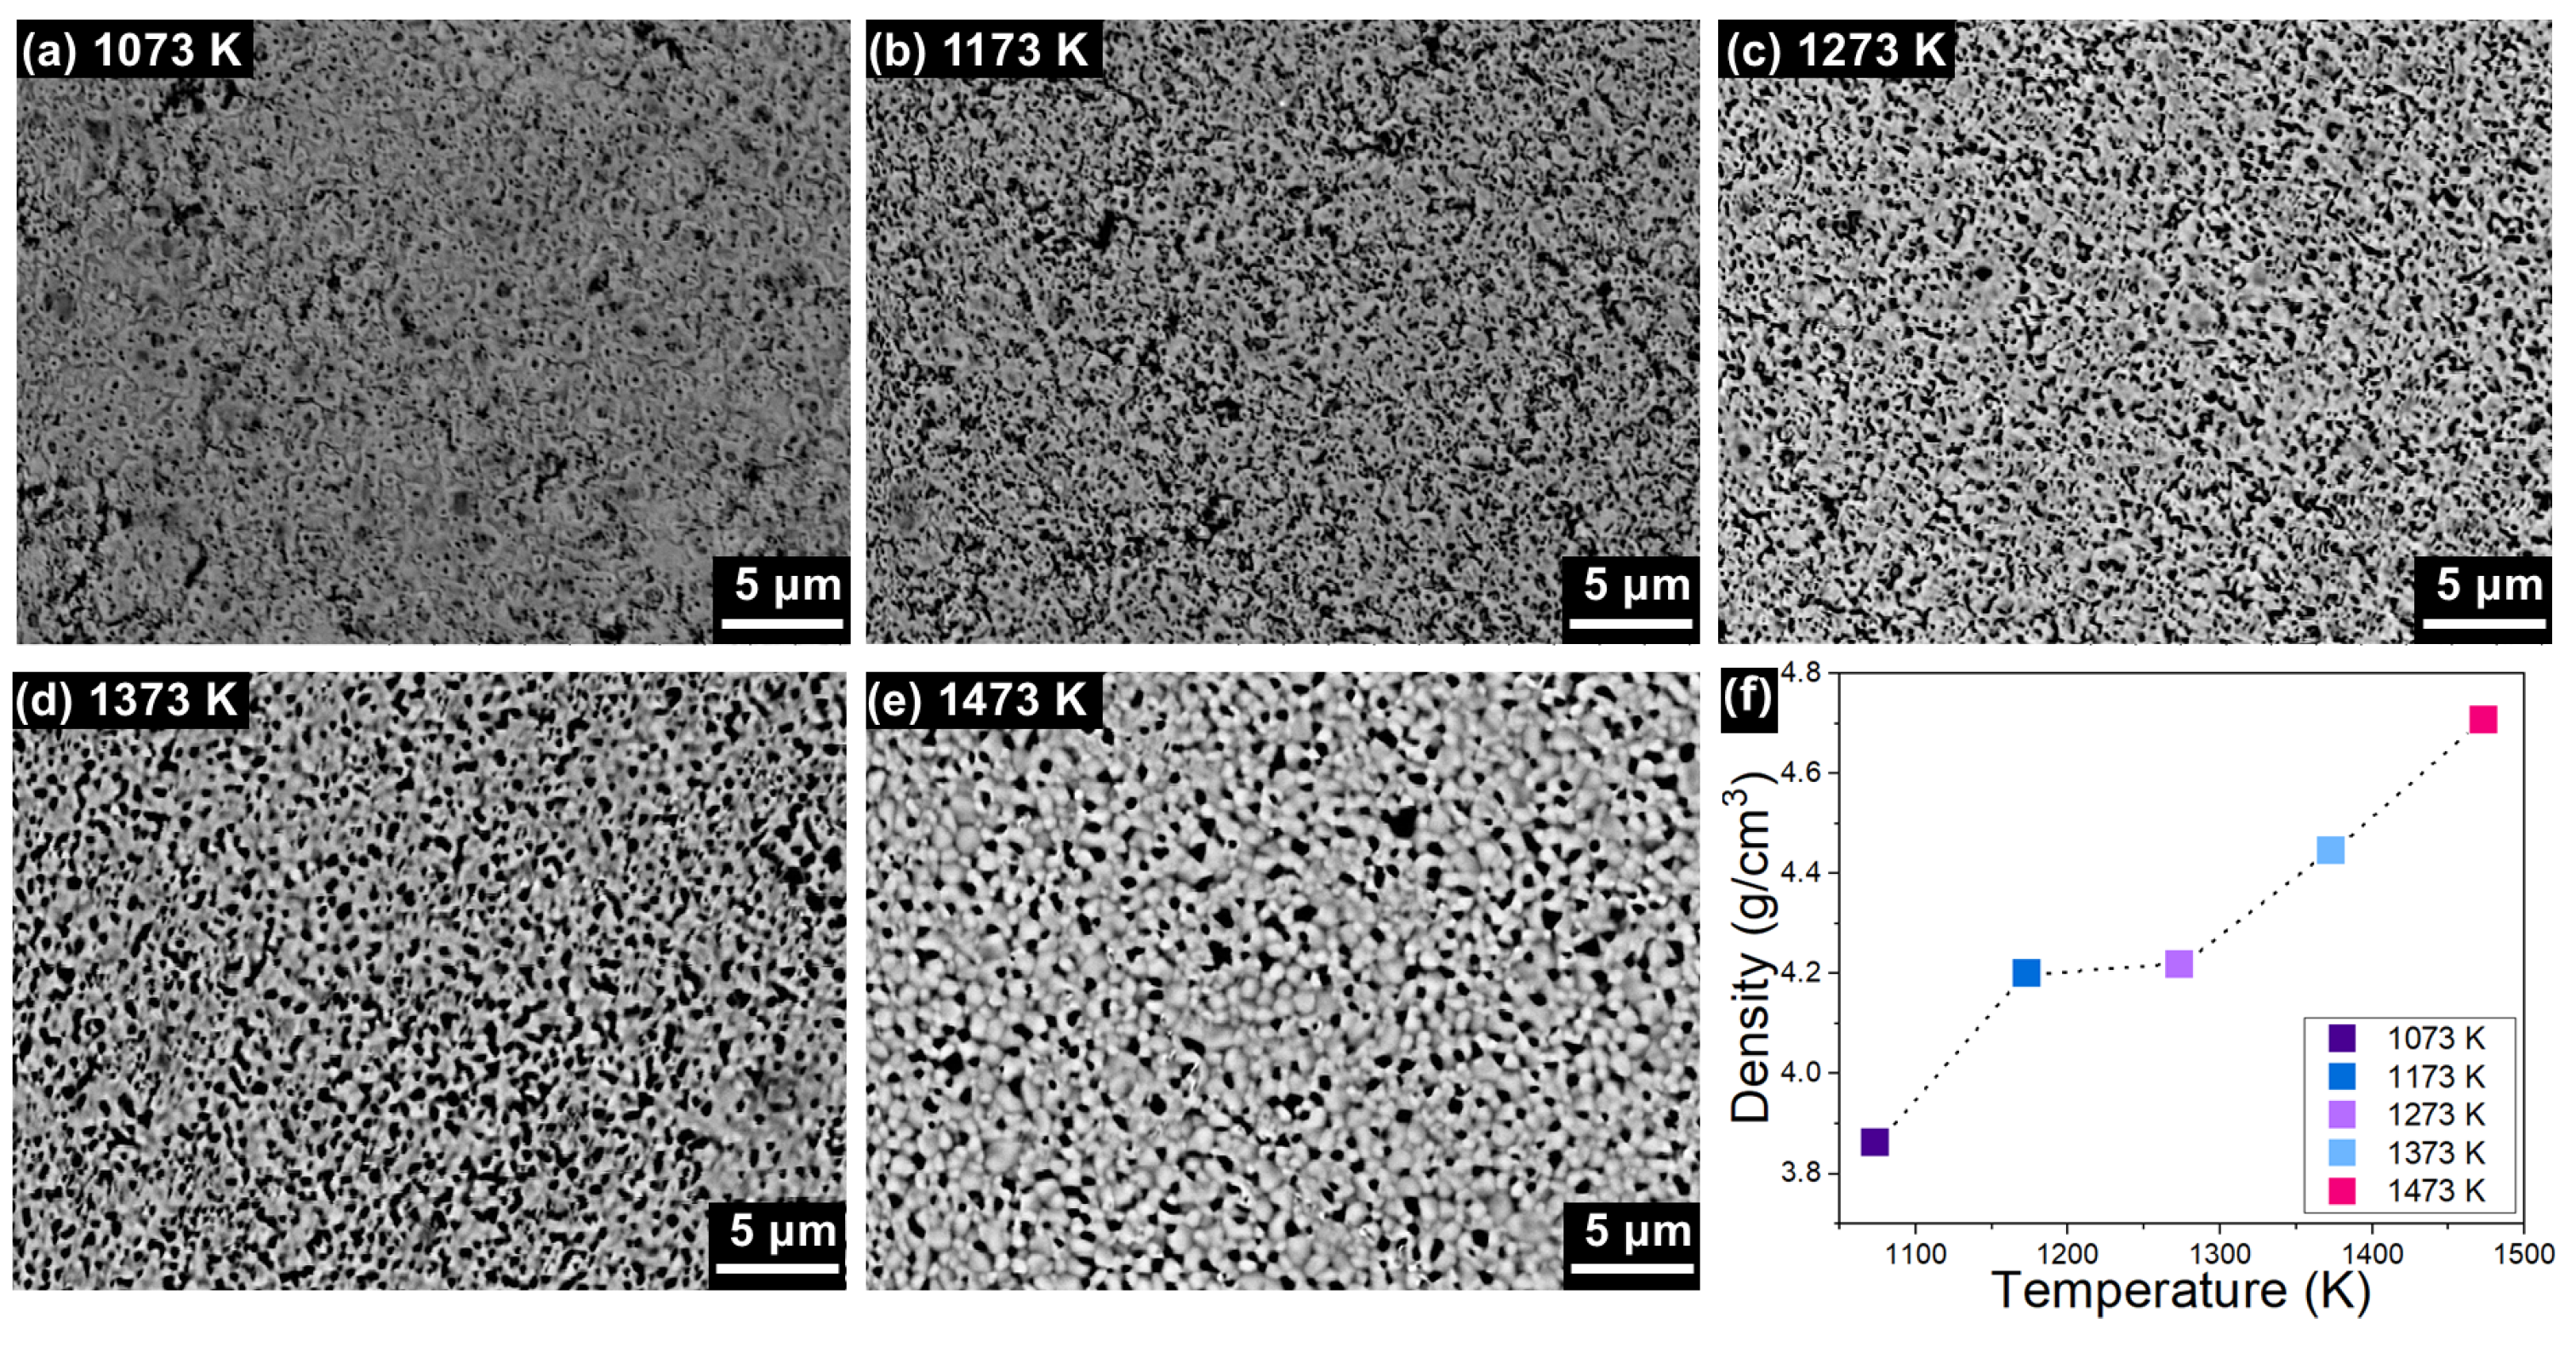
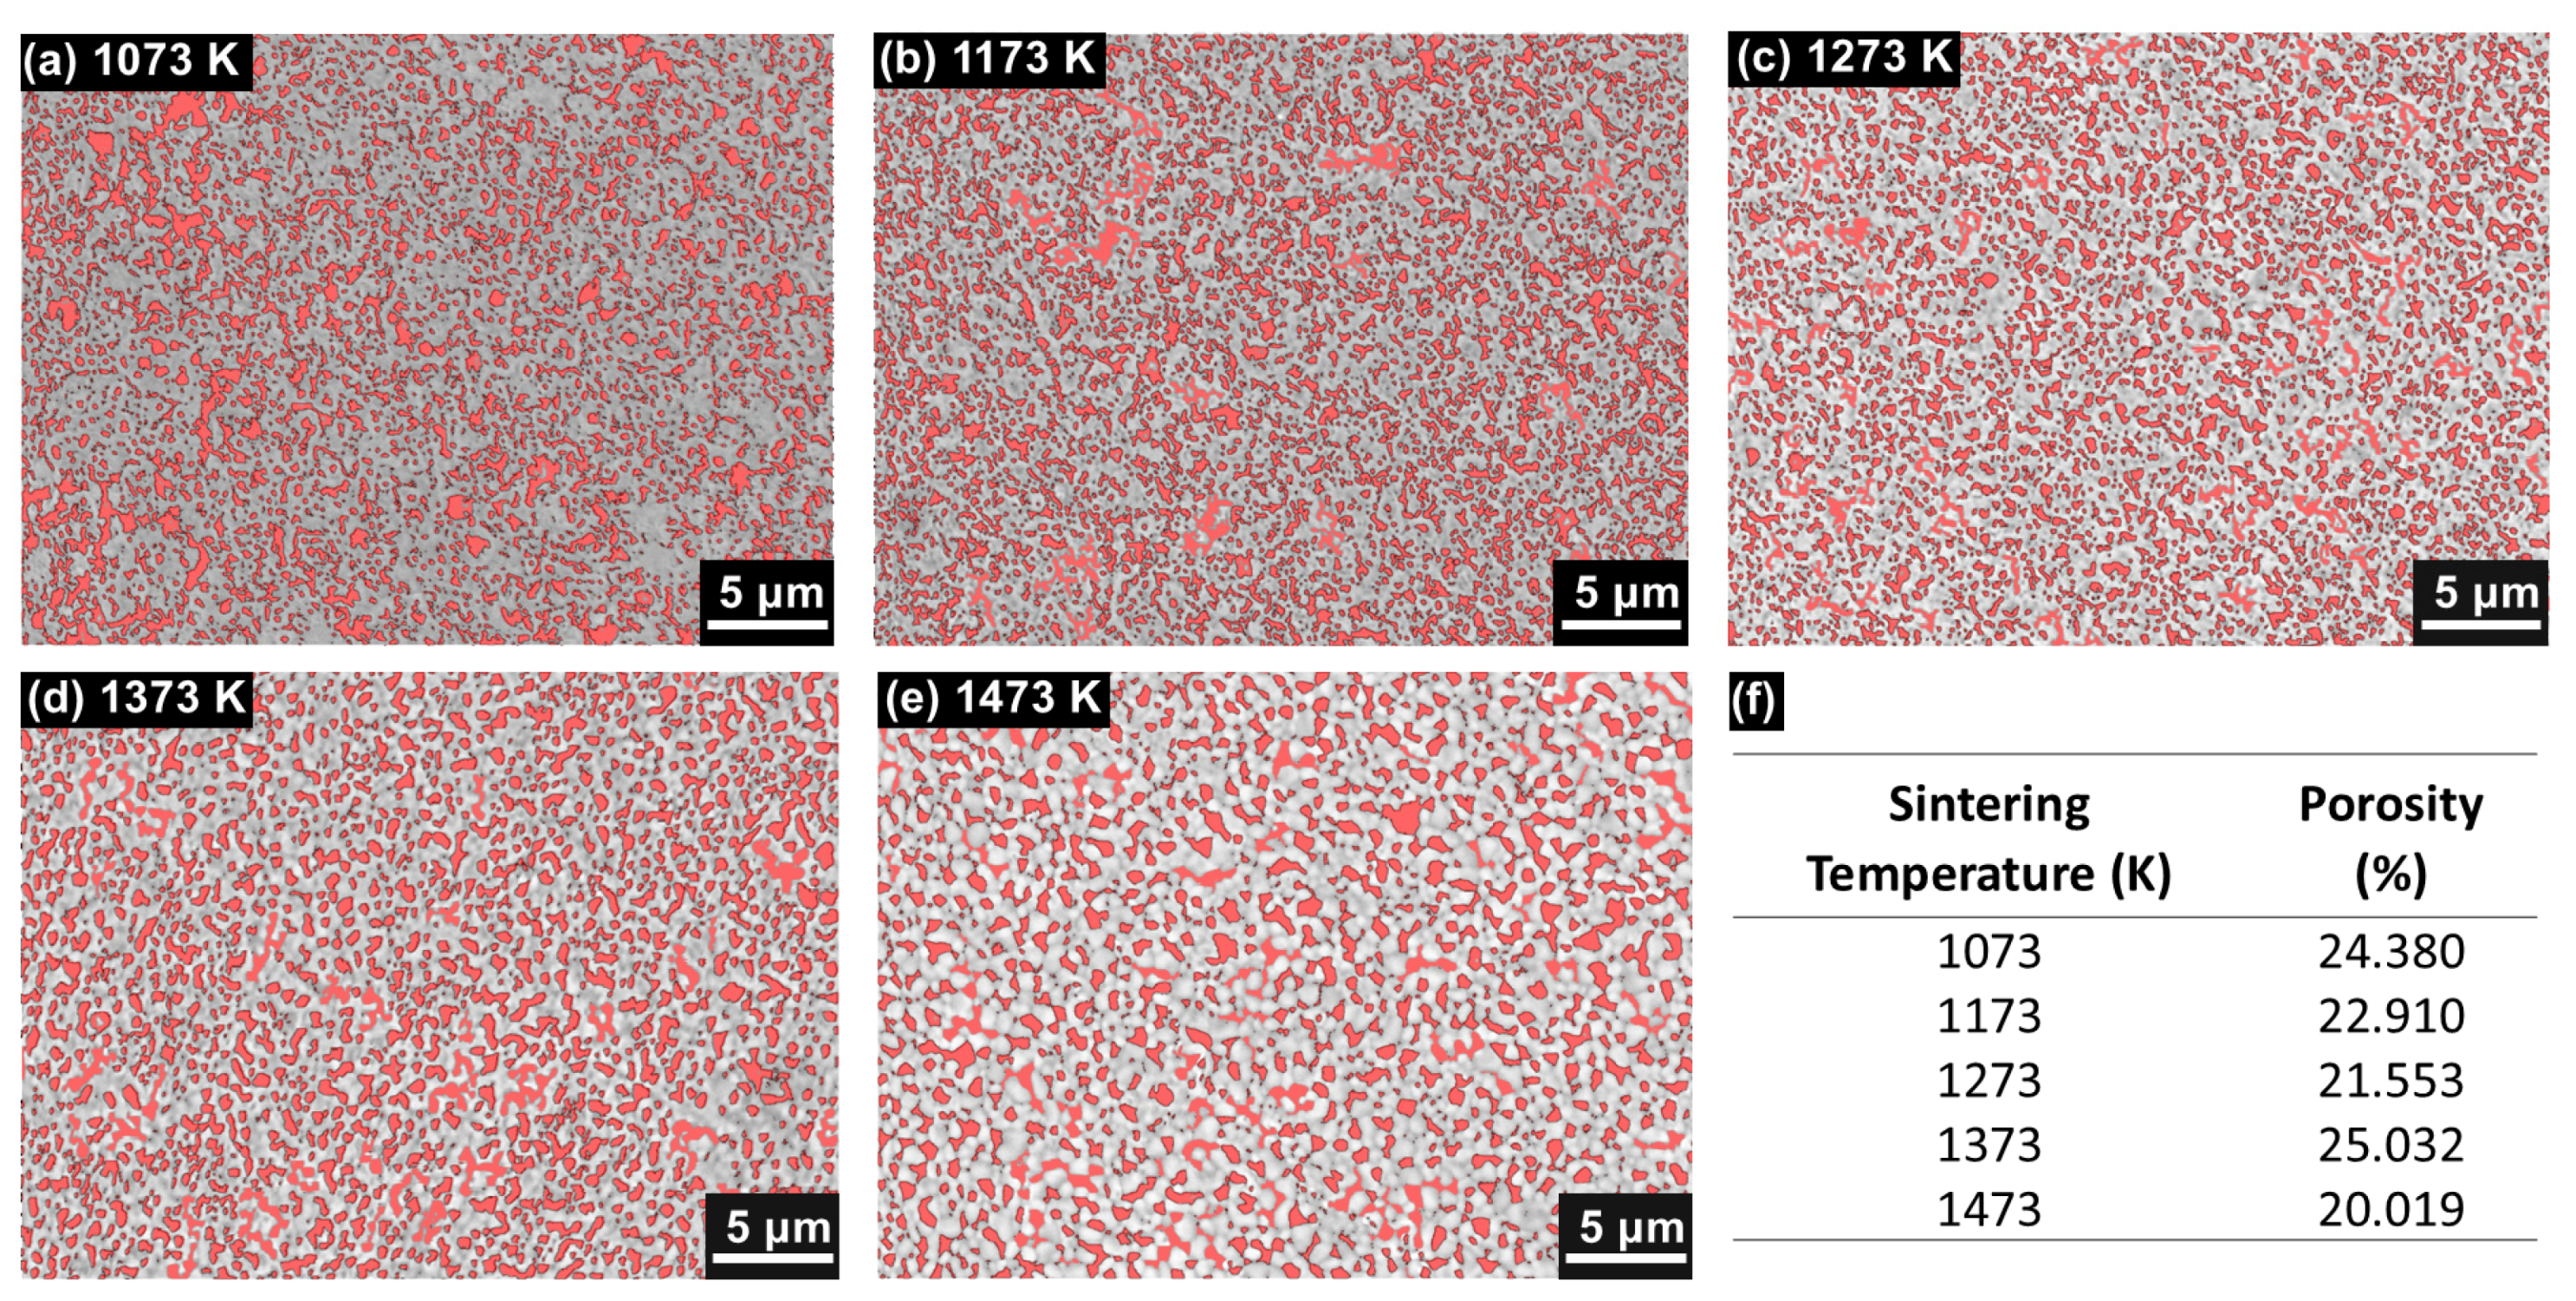
According to the densification measurements in
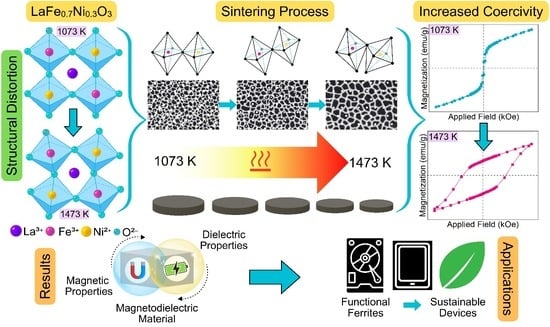
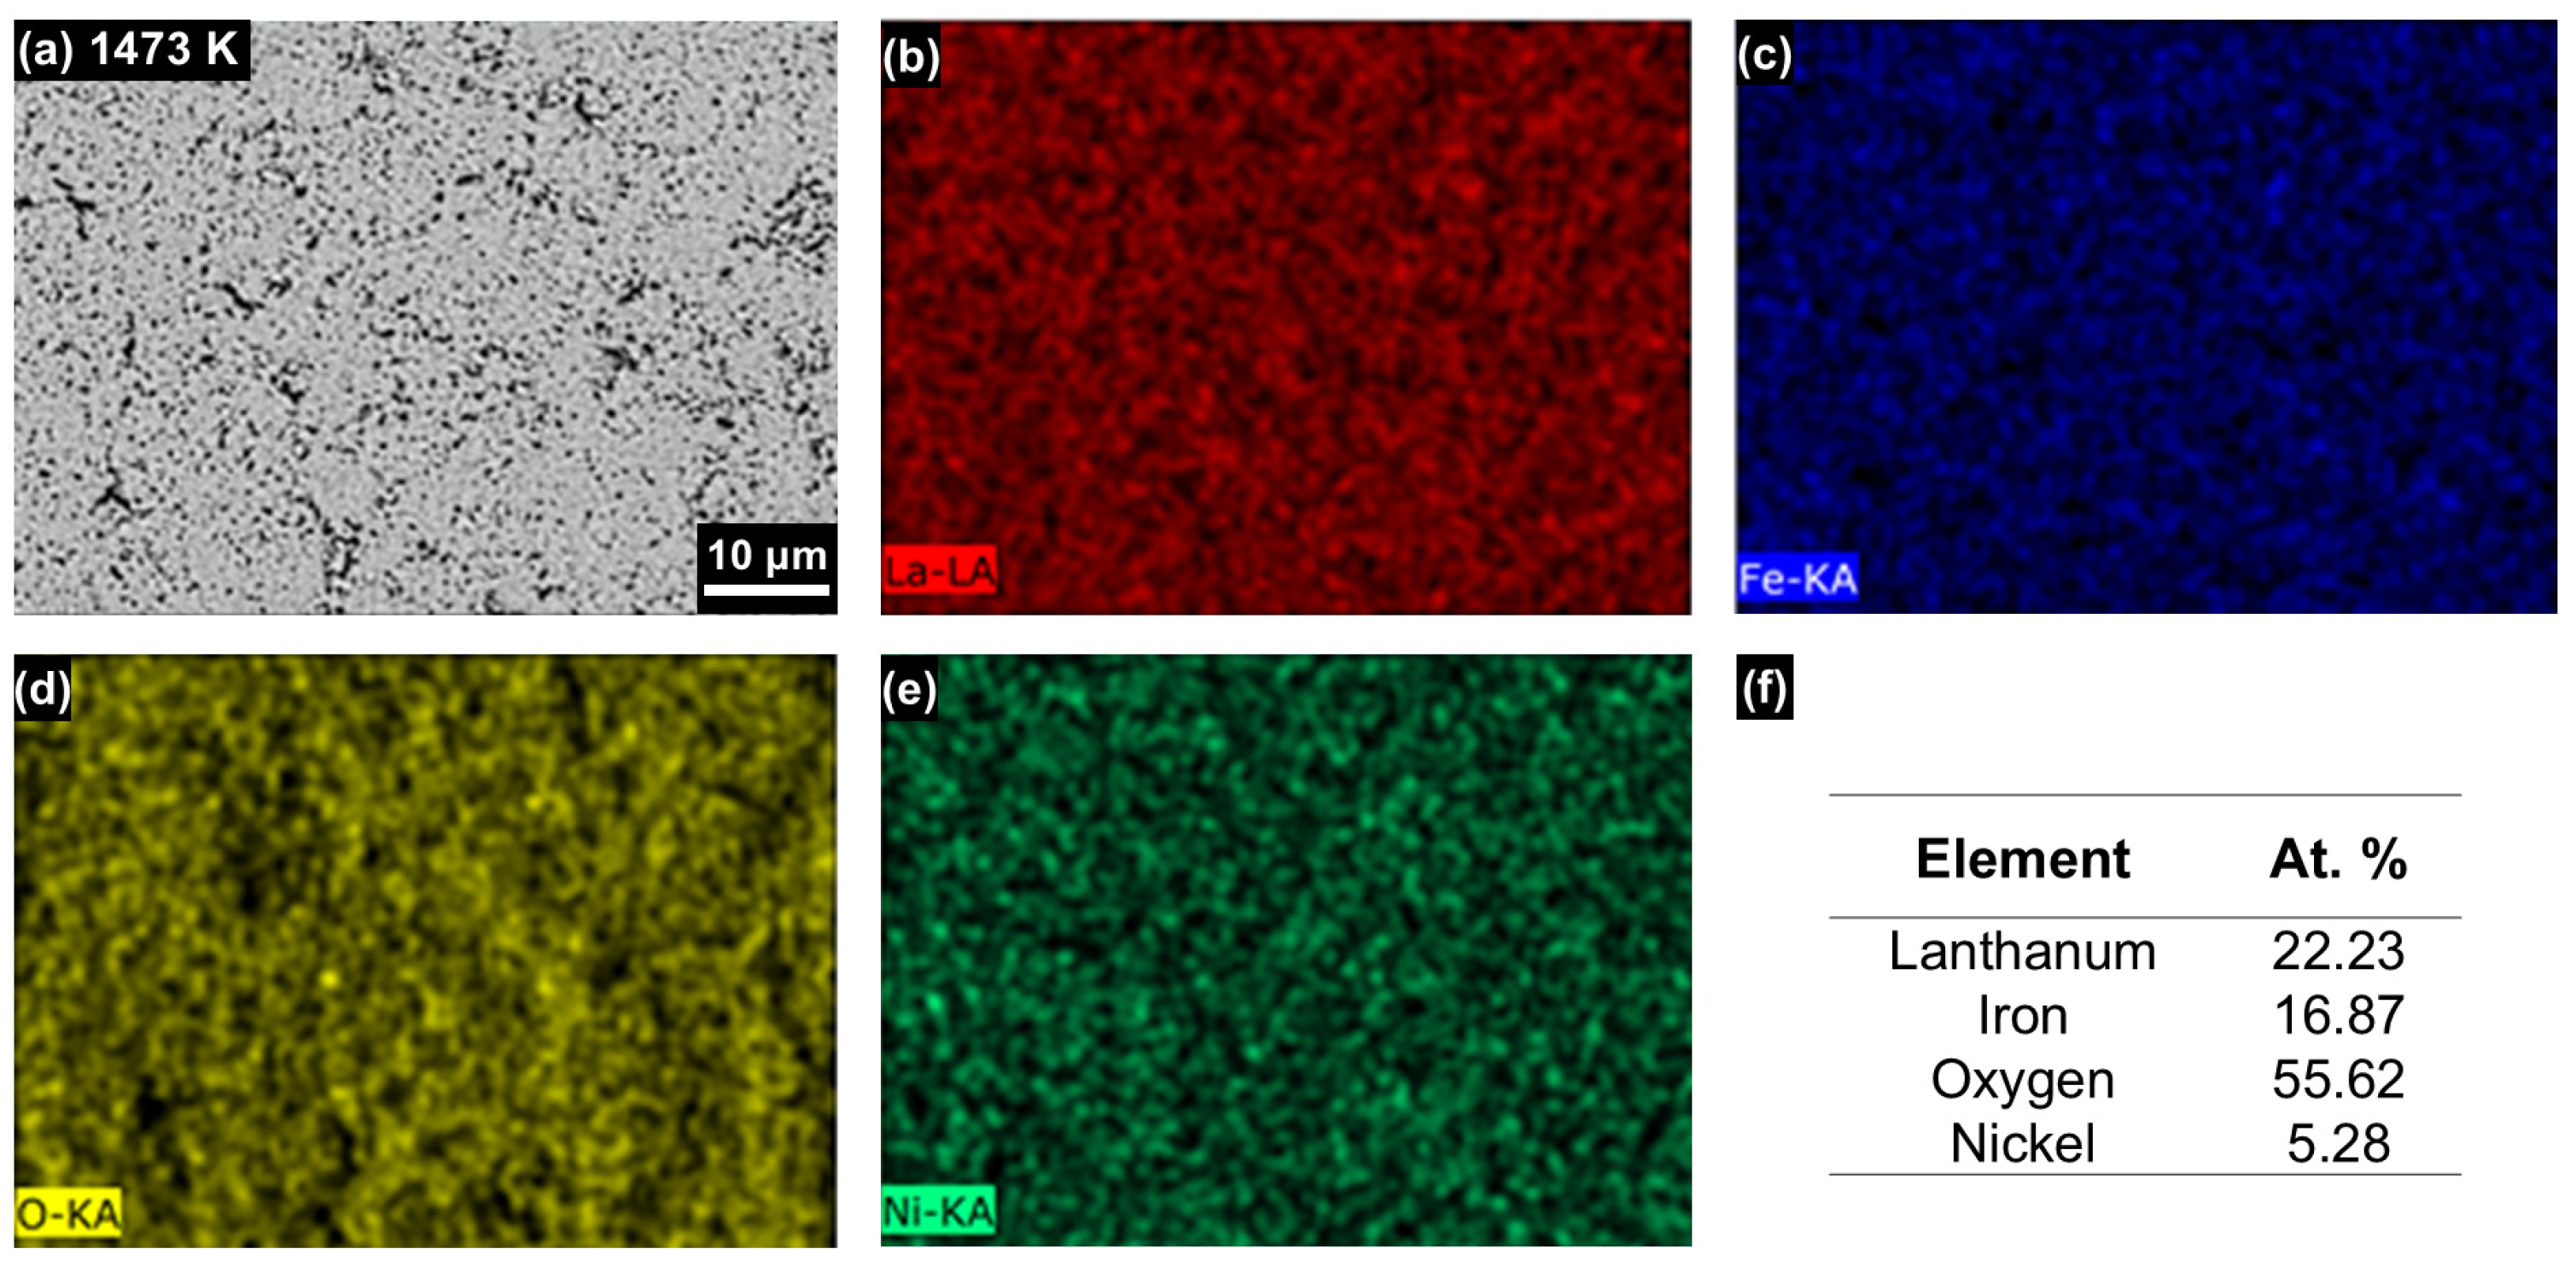
Figure 4, the samples sintered at the lowest temperatures exhibit a highly porous and disordered microstructure, consistent with the low coercivity observed. At the intermediate sintering temperature of 1273 K, the microstructure becomes noticeably denser, a change that aligns with the increase in coercivity. In contrast, the sample treated at 1473 K shows the highest densification and signs of grain overgrowth associated with over-sintering. This microstructural state correlates with the maximum coercivity, believed due to reduced domain disorder and enhanced magnetic stability.
Regarding the local geometry provided by the angle data in
Table 3, the ferromagnetic superexchange and double exchange interactions are evidenced as favored. At the highest temperature, a distorted angle of up to 134.4° is observed, breaking the 180° linearity found in AFM materials, which can induce weak ferromagnetic components due to spin canting. Similarly, the value at this same temperature of 2.121 Å suggests a significant lengthening of the Fe–O1 distance, indicating structural relaxation and a reduction in the antiferromagnetic superexchange interaction, pointing to the presence of more stable domains. Smaller Fe–O–Fe angles reduce AFM superexchange, which favors coercivity by preventing the cancellation of magnetic moments; a greater Fe–O length points to lower structural rigidity and microstrain as discussed in the Rietveld refinement; finally, the angular distortion and bond relaxation leads to the formation of more defined magnetic domains with more stable walls in a multi-domain behavior with high coercivity.
Table 4 includes the
W values, as an indirect measure of the orbital overlap between the Fe and O atoms, which influences the intensity of magnetic superexchange. Higher
W values indicate greater electronic coupling, which points to more efficient overlap, signifying a stronger transfer of magnetic interaction is allowed between the metallic ions through the oxygen. An efficient Fe–O–Fe coupling favors the alignment between the d orbitals of Fe and the p orbitals of O, generating greater energy dispersion. For 1073 K, presenting the highest
W value (0.0937), a more linear structure is suggested, promoting opposite spin directions, consistent with the bond angle values in
Table 3. This favors the superexchange interaction, which coexists with the double exchange due to the presence of Fe
4+, resulting in a ferromagnetic hysteresis curve [
13]. Conversely, for 1473 K, the lowest value (0.0663) is presented, suggesting a reduction in coupling, resulting in lower direct AFM interaction but fostering spin canting and coercivity due to domain stabilization, given that the angle distortion encourages the decrease in electronic coupling by breaking the structural symmetry (tilting), leading to spin canting, which is consistent with all the results above. In the particular case of the 1173 K temperature, a lower
W is observed compared to 1073 K, unlike the higher tilt angles. This indicates a radical decrease in orbital coupling, resulting in an increase in canting, which is a possible local magnetic disorder. This explains the abrupt drop in M
s and M
r, as well as the moderate increase in H
c. These values progressively recover with the increase in temperature, attributing this to the moderate distortion that seeks a favorable structural reorganization, which in turn has an effect on an increase in coercivity and remanence, indicating the consolidation of stable magnetic domains, continuing the distinct multi-domain behavior.
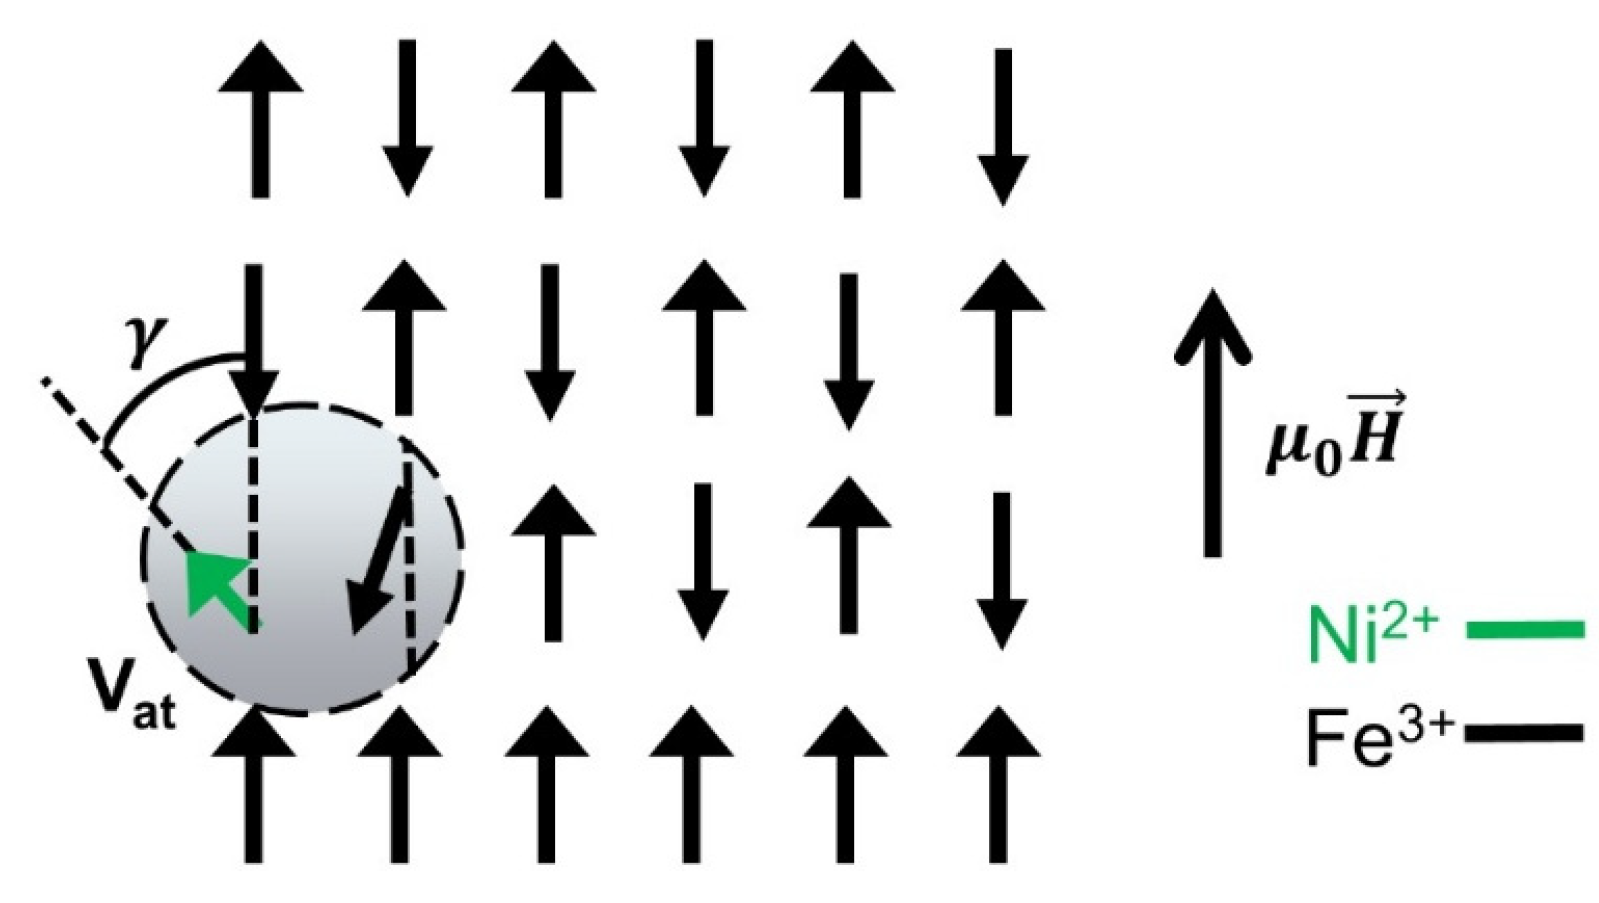
To deepen the understanding of the coercivity trend, a magnetic anisotropy analysis was performed, particularly of magnetocrystalline anisotropy, which is the one that arises from the interaction of the magnetic moments and the crystal field generated by the atomic lattice of the material. Therefore, any non-uniform process, locally, implies a breaking of one or more magnetic moments with respect to the others (
Figure 8).
This model relates the magnetization angle of anisotropy to effective anisotropy energy, a model that arises from the interaction between magnetic moments and is studied as a coercivity mechanism present in materials with significant coercivity that do not have phase change interactions, i.e., the coercivity or magnetization mechanisms are not influenced by the occurrence of a phase change; therefore, the model can be applied in materials with multi-domain behavior. Having an orthorhombic-type structure with the presence of structural strains as a consequence of sintering and bulk morphology, a second-order magnetocrystalline anisotropy model is considered. This model is commonly used in both uniaxial and cubic or distorted configurations, so the symmetry of the orthorhombic structure allows for second-order terms in the anisotropy energy, which is why the following expression is proposed [
38]:
where
Ema is the magnetic anisotropy energy,
K1 and
K2 are anisotropy constants, and
γ is the angle between the magnetization direction and the easy axis, the crystallographic orientation along which the material is most readily magnetized. The magnetocrystalline anisotropy arises primarily from the spin–orbit interaction, where the orbital motion of the electrons couples to the crystal’s internal electric field. This interaction defines the first-order contribution to the anisotropy. The second-order contribution, often treated as a correction, is associated with dipole–dipole interactions and subtle changes in the electron density driven by Coulomb forces.
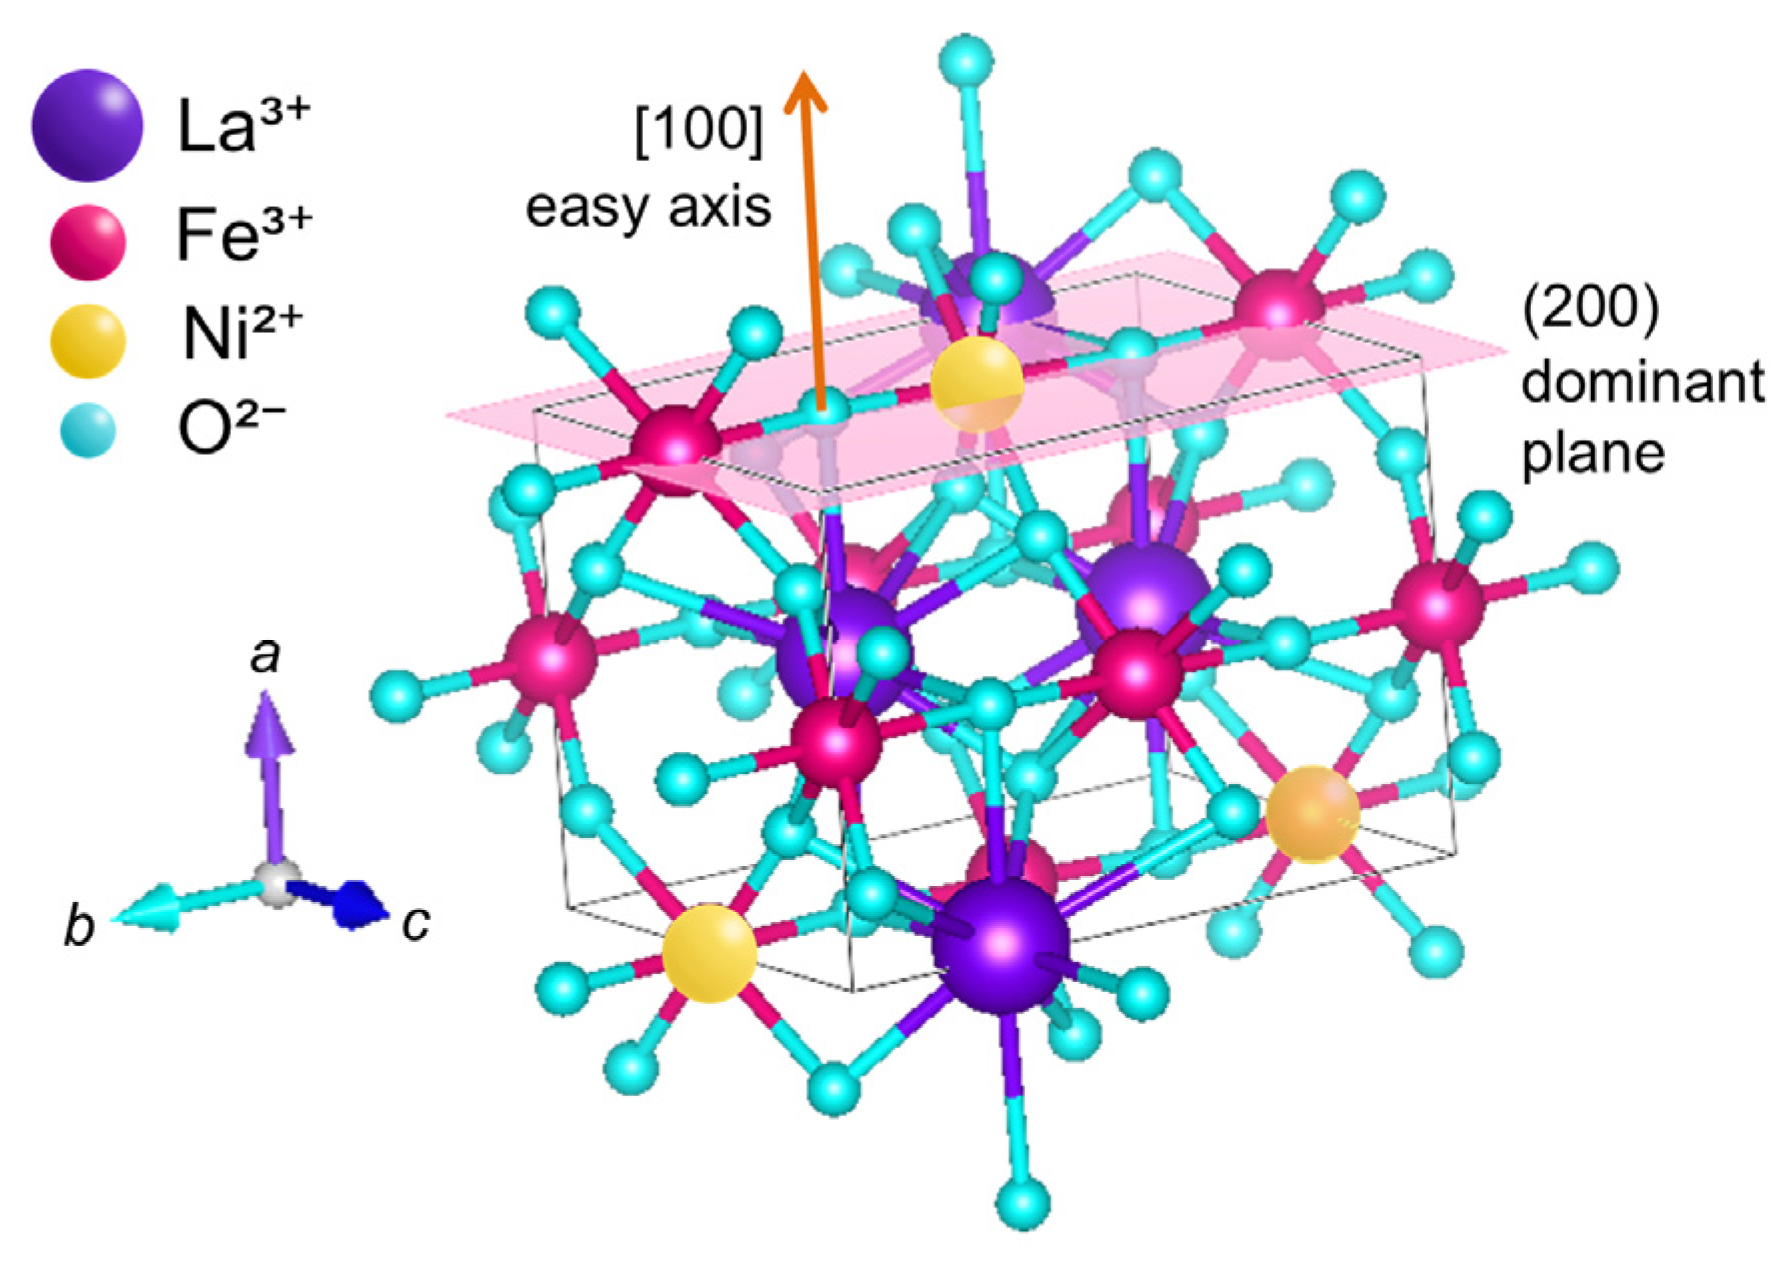
The estimation of the easy axis of magnetization (
Figure 9) has been proposed as a theoretical approximation based on the crystallographic symmetry of the orthorhombic system and on previous reports of similar materials. The XRD pattern exhibits a preferred orientation toward the (200) plane, whose normal is [200]. This crystallographic texture suggests that the crystallites tend to align with this plane parallel to the surface of the pellet. Nevertheless, it is worth to emphasize that the preferred orientation identified by X-ray diffraction does not directly determine the easy axis of magnetization.
By symmetry, the [100] direction, normal to the dominant plane, has been considered as a candidate for the easy axis, in agreement with what has been reported in related orthorhombic systems. To fit the anisotropy parameters (K1 and K2), the magnetic energy Ema(θ) was simulated by taking θ = 0° as the minimum, aligned with [100].
The second-order magnetocrystalline anisotropy model, which describes how the magnetic energy varies with the orientation of the magnetization relative to the crystallographic axes, can be modeled by estimating the anisotropy field from the hysteresis loops. Taking H
k as the field necessary for magnetic saturation, where the subscript k refers to the crystallographic anisotropy constant, the following expression can be used [
39]:
where
µ0 is the vacuum permeability, and effective anisotropy energy (
Eeff) can be used as an average estimation to adjust the second-order model. Therefore,
K1 and
K2 can be adjusted so that the minimum energy coincides with the expected direction of the easy axis and the maximum value approximates the effective anisotropy energy estimation, which is the material’s internal resistance to modifying the magnetization orientation. The adjustment values are shown in
Table 6. For the 1073 K sample, the Stoner-Wohlfarth (SW) model is used because the hysteresis loop presents low coercivity compared to the samples at other temperatures, which is evidence of smooth transitions in the magnetization direction, characteristic of soft magnets.
Eeff values of 1.08 × 10
4 erg/g and alpha of 2885.65 Oe are reported, showing moderate anisotropy and a coherent response to the external field, pointing it does not require great energy to reorient the magnetization. The energy value suggests that the system maintains a stable ferroic structure but with sufficient sensitivity to respond to external fields.
As can be seen in
Table 6, the lowest
Eeff value appears at 1073 K, which is consistent with a poorly consolidated microstructure, where the combination of internal stresses and limited densification leads to reduced anisotropy. When the temperature increases to 1173 K,
Eeff rises abruptly, indicating that the material begins to recover structural coherence as porosity decreases and the microstrain becomes more stable. From 1273 K, the progressive increase in
Eeff reflects a most distinct tendency toward densification (
Figure 4f), improved structural alignment, and stabilization of the anisotropy, in agreement with the microstrain evolution. This behavior also explains the increment in coercivity with temperature. According to the Givord model [
40], higher anisotropy increases the domain-wall energy and reduces the activation volume, which naturally results in higher H
c. Finally, the presence of Fe
4+, introduced as a charge-compensation mechanism, may also contribute to the observed coercivity. Fe
4+ in octahedral coordination can act as a Jahn–Teller center, producing local lattice distortions (Fe–O bond compression), modifying the magnetic interactions through partial double-exchange pathways, and hindering charge transport, all of which are consistent with the experimental observations.
Another relevant finding is the increase in the anisotropy constant
K1. According to the Kronmüller model [
41], the coercivity of a ferromagnetic material depends on its microstructure and is proportional to
K1. This model therefore predicts a significant increase in coercivity, as observed in the results. Furthermore, the increase in densification and the reduction in microstrain, evidenced in the structural analysis, contribute to increasing the microstructural parameter that reflects the efficiency of the domain wall pinning mechanisms. On the other hand, octahedral distortions directly modify the magnetocrystalline anisotropy, which translates into the variation of H
c described by the Kronmüller equation. Taken together, these experimental results confirm that the coercivity in doped ferrites depends not only on the intrinsic anisotropy but also on the microstructure induced by the heat treatment. The fitted anisotropy parameters are consistent with the structural distortions observed in the Fe–O–Fe bond angles obtained from Rietveld refinement, providing independent validation of the model.
Since it has been verified that the modification of structural stresses has increased coercivity, pointing it has modified the magnetic behavior, the consideration of a magnetoelastic anisotropy, a stress-induced anisotropy model, can be explored. This internal stress can be modeled by Hooke’s Law
where
σ is the internal stress,
E is the Young’s modulus, and
µs is the microstrain, so the magnetoelastic energy is then given by
with
λ as the magnetostriction constant, which can be estimated using typical values for Fe, Ni, or their oxides, and
ϑ as the angle between the magnetization and the stress axis.
From the literature, a Young’s modulus (
E) value for material under use is obtained, which is approximately 213 ± 14 GPa. The magnetostriction constant (
λ) for this material has not yet been measured; however, it has been reported that doping with Ni or Co tends to increase magnetostriction [
42]. For example, for NiFe (70% Ni), it has a
λ 100 value of 22.7, exceeding that of Fe, which is approximately 20. The knowledge or estimation of these values opens the way to the application of a semi-empirical model that describes the total anisotropy energy for this type of system using the expression
3.5. Dielectric Properties
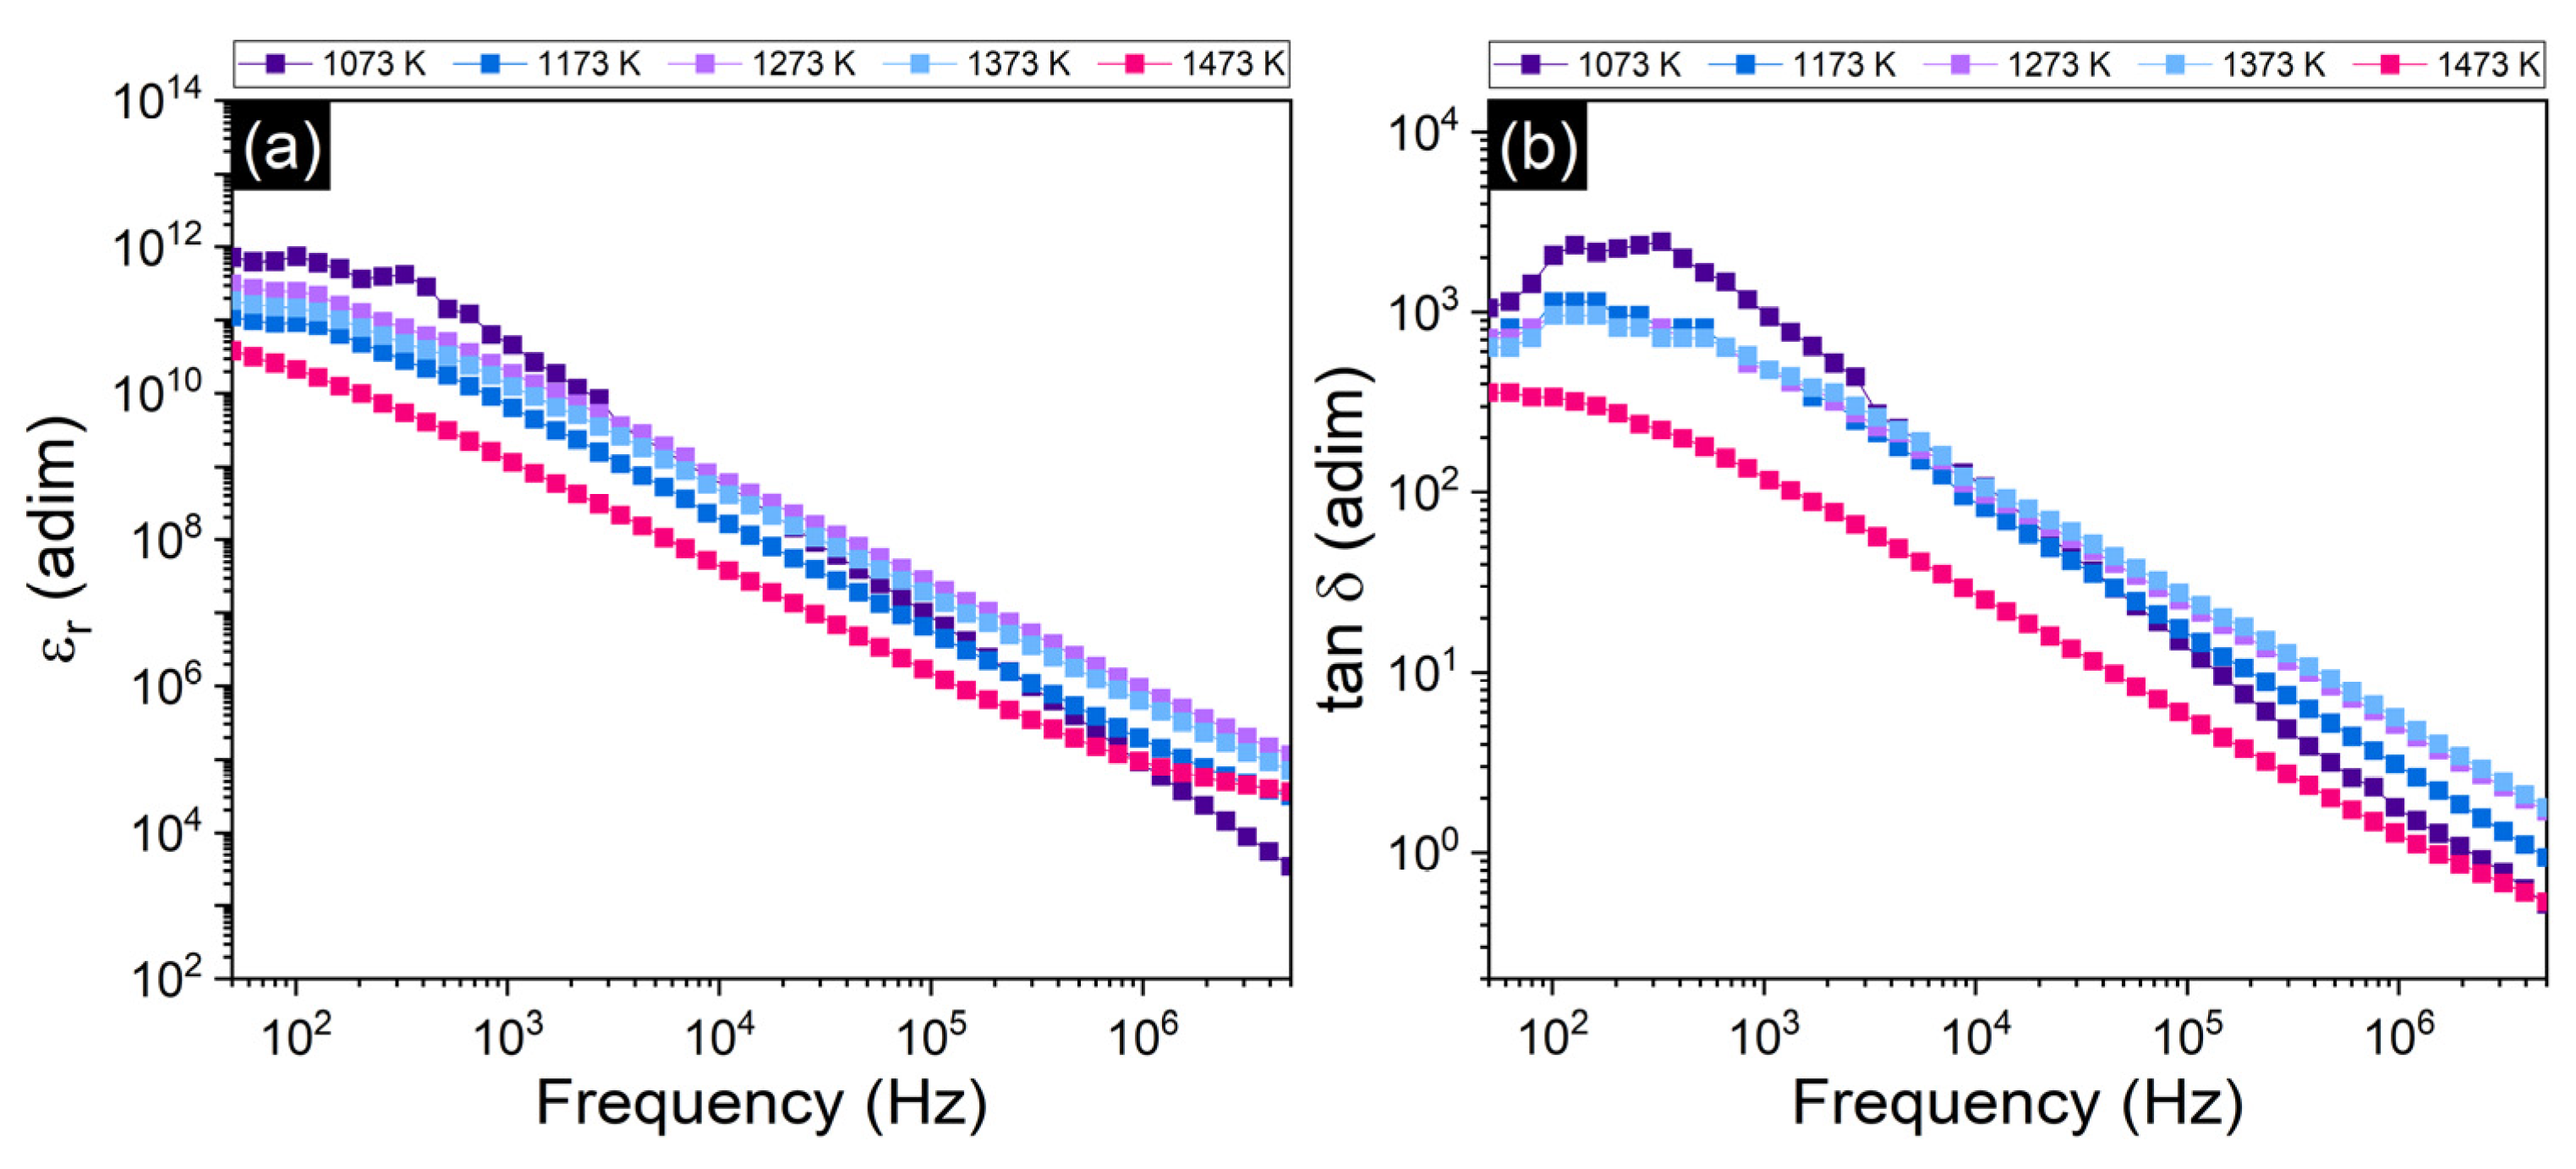
Figure 10 shows the effect of sintering temperature on the relative permittivity (
εr) and dielectric losses (tan
δ) of the material as a function of frequency.
εr decreases with increasing frequency at all temperatures. This behavior is attributed to the space charge polarization mechanism, specifically the MW effect, due to the presence of charge accumulators such as grain defects, vacancies, or material porosity resulting from processing and charge compensation mechanisms. From
Figure 10a, it is observed that permittivity values decrease with increasing sintering temperature, suggesting a reduction in interfacial polarization and defects, as well as greater material densification. Therefore, the density of each sample was calculated, and this assertion is supported by
Figure 10, which aligns with the SEM data in
Figure 4, allowing us to affirm that higher sintering temperatures lead to greater densification, reduced porosity, and consequently, lower MW polarization contribution, resulting in lower
εr and tan
δ values.
At relatively high frequencies, the
εr and tan
δ values reflect the intrinsic behavior of the material, falling within the reported range for bulk Ni
2+ doped LFO [
13]. The best condition is at 1473 K, along with the lowest dielectric losses. This condition is considered optimal because the relative permittivity remains within a stable and useful range without abrupt variations, while the dielectric losses reach their minimum. The combination of a sufficiently high εᵣ with the lowest tan
δ value indicates that the material can efficiently store electrical energy with minimal dissipation. In other words, the dielectric response at 1473 K represents the best balance between energy storage capacity and energy efficiency, making this temperature the most favorable for practical applications. On the other hand, Ni
2+ substitution has modified the crystal structure, generating distortion confirmed by structural analysis in
Section 1, attributed to the mismatch in ionic radii, processing conditions, and the presence of Fe
4+ cations as a result of charge compensation mechanisms [
13]. Therefore, greater distortion can be associated with improved dielectric response, linked to the previously mentioned hypothesis of partial loss of centrosymmetry [
34].
As shown in
Figure 4, increasing sintering temperature leads to grain growth, which reduces grain boundaries and hinders charge movement, also contributing to the reduction of tan
δ. In
Figure 10b, as already mentioned, the decrease in dielectric losses is visible; however, the separation between curves is more pronounced than in
εr, which may indicate that the loss factor is more sensitive to microstructural distortion induced by sintering. Regarding the trend, the sample sintered at 1173 K shows a decrease in both permittivity and tan
δ compared to the 1073 K sample. These values increase at 1273 K and then decrease again with further temperature increase, a trend also observed in the XRD results, indicating that the behavior is largely dependent on changes in the crystal structure.
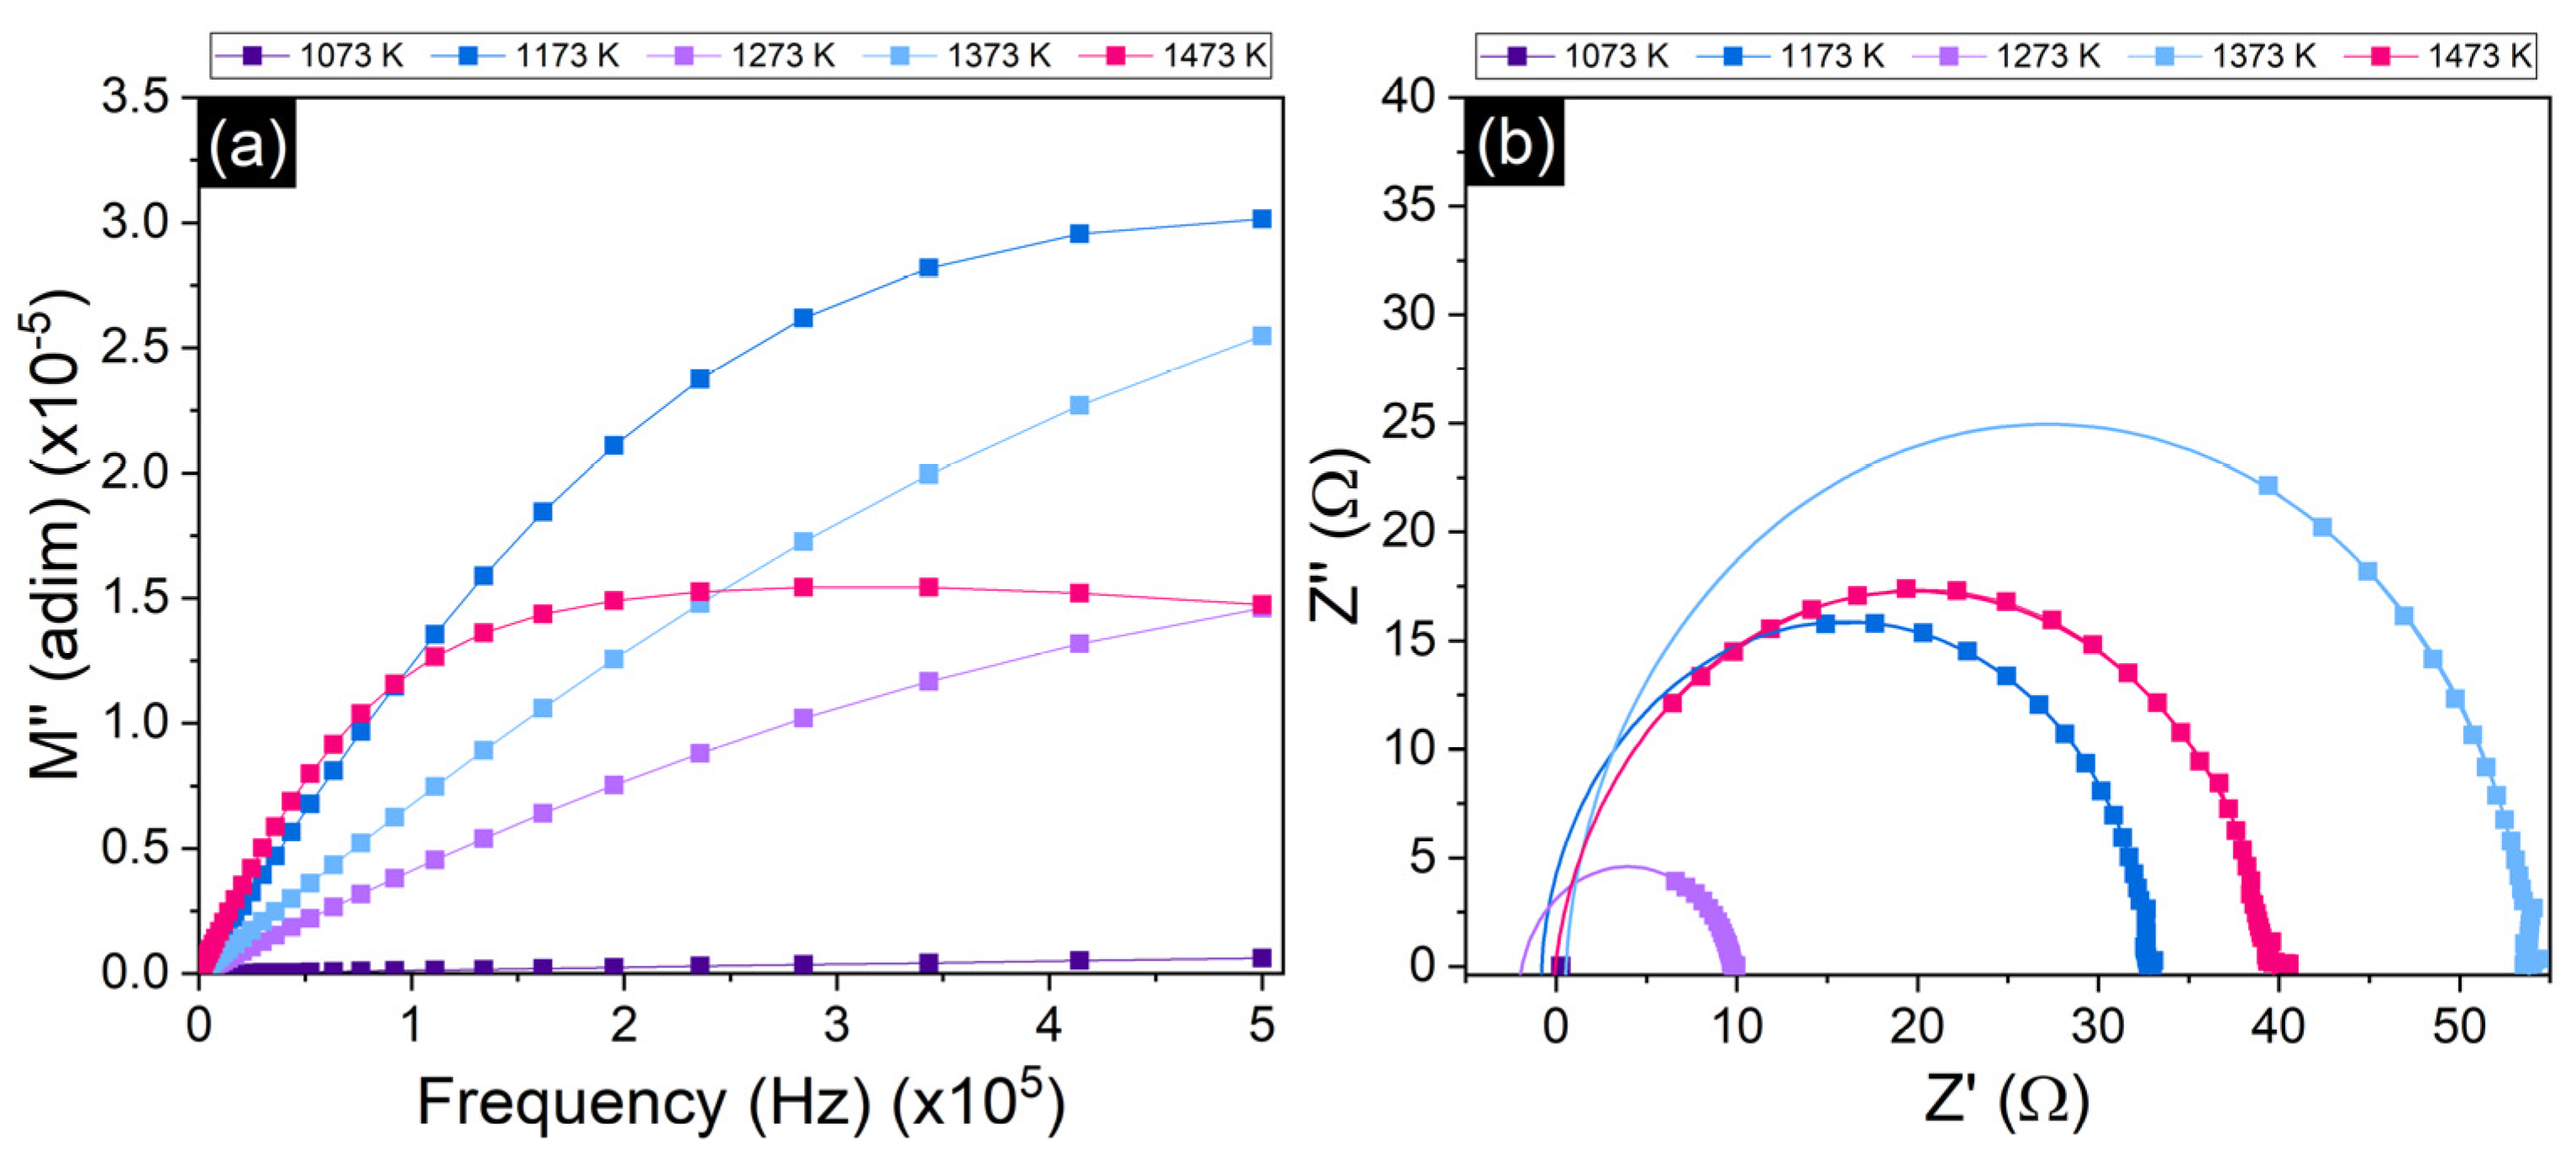
To understand the relaxation processes and the complex impedance response, the imaginary electric modulus (M″) and a Nyquist plot are used, shown in
Figure 11a and
Figure 11b, respectively. In M″, which indicates the energy dissipated by relaxation processes, no significant slope change is observed at 1073 K, indicating the absence of significant internal relaxation. For the other temperatures, a slope change is observed, associated with a characteristic relaxation frequency directly related to the relaxation time and dipole mobility dynamics in the material [
10]. In the low-frequency region (below 10
3 Hz), electrode effects tend to dominate, so no marked internal relaxation is observed, which is associated with the high interfacial permittivity in this range due to the MW effect.
In the regions where a change in behavior (slope) is observed, the change in relaxation processes can be seen as a consequence of the sintering temperature. This suggests that the temperature increase accelerates these processes due to a lower defect density, which is consistent with the structural analysis. Finally, at high frequencies, the dipoles can no longer follow the change in the field, so the response of the dense grains dominates, with less contribution from the interfaces. The behavior of M″ and the imaginary axis Z′ versus the real axis Z″ may also be influenced by the so-called “electron hopping”, a charge transport mechanism in materials lacking free electron movement and they jump between localized sites [
43], due to the presence of mixed valence states between Fe
3+/Fe
4+ and Ni
2+, favored by super and double exchange.
In
Figure 11b, no characteristic semicircle is formed at 1073 K, suggesting the absence of relaxation processes, consistent with the M″ analysis. In contrast, for higher temperatures, well-defined semicircles are observed, indicating transport or relaxation processes associated with grain or grain boundary responses. The semicircles shift to the left, implying lower Z′, which is associated with reduced effective resistance to current flow, enriching the analysis of permittivity and losses. The reduction in semicircle size indicates lower Z″, which, being the component associated with energy storage, results in lower charge accumulation.
These behaviors are also associated with improved structural and magnetic alignment, which, being an improper multiferroic material with favored double exchange, directly impacts its dielectric properties. In conclusion, at low sintering temperatures, the behavior corresponds to a porous material with incomplete densification. As the sintering temperature increases, the microstructure becomes progressively consolidated, and the observed changes are due to bond-angle and bond-length distortions within the crystal lattice rather than a phase transition. This microstructural evolution improves dielectric behavior, as evidenced by reduced interfacial polarization, controlled dielectric relaxations, and changes in internal resistance, indicating a denser, less defective material, favorable for applications in capacitors, sensors, or dielectric devices.
3.7. Magnetodielectric Coupling
Lanthanum ferrite is a multiferroic material at room temperature that has undergone a change in magnetic order due to cationic substitution with Ni
2+ [
13], which has opened the possibility of coupling between magnetic and dielectric properties. Ferromagnetic oxides typically possess centrosymmetry, a property that hinders electric polarization. The compound LaFe
0.7Ni
0.3O
3, sintered at different temperatures, has enabled exploration of this coupling due to evidence of structural distortion that modifies its centrosymmetry without breaking the inversion symmetry. On the other hand, ferroelectric materials often contain transition metal ions that hinder magnetism, an issue resolved in this material. Magnetodielectric (MD) coupling is explored through the variation in relative permittivity in response to a static magnetic field applied within a range of ±18 kOe, allowing quantification of magnetocapacitance (MC) using the following expression [
45]:
where
C(
B) is the capacitance under magnetic field B and
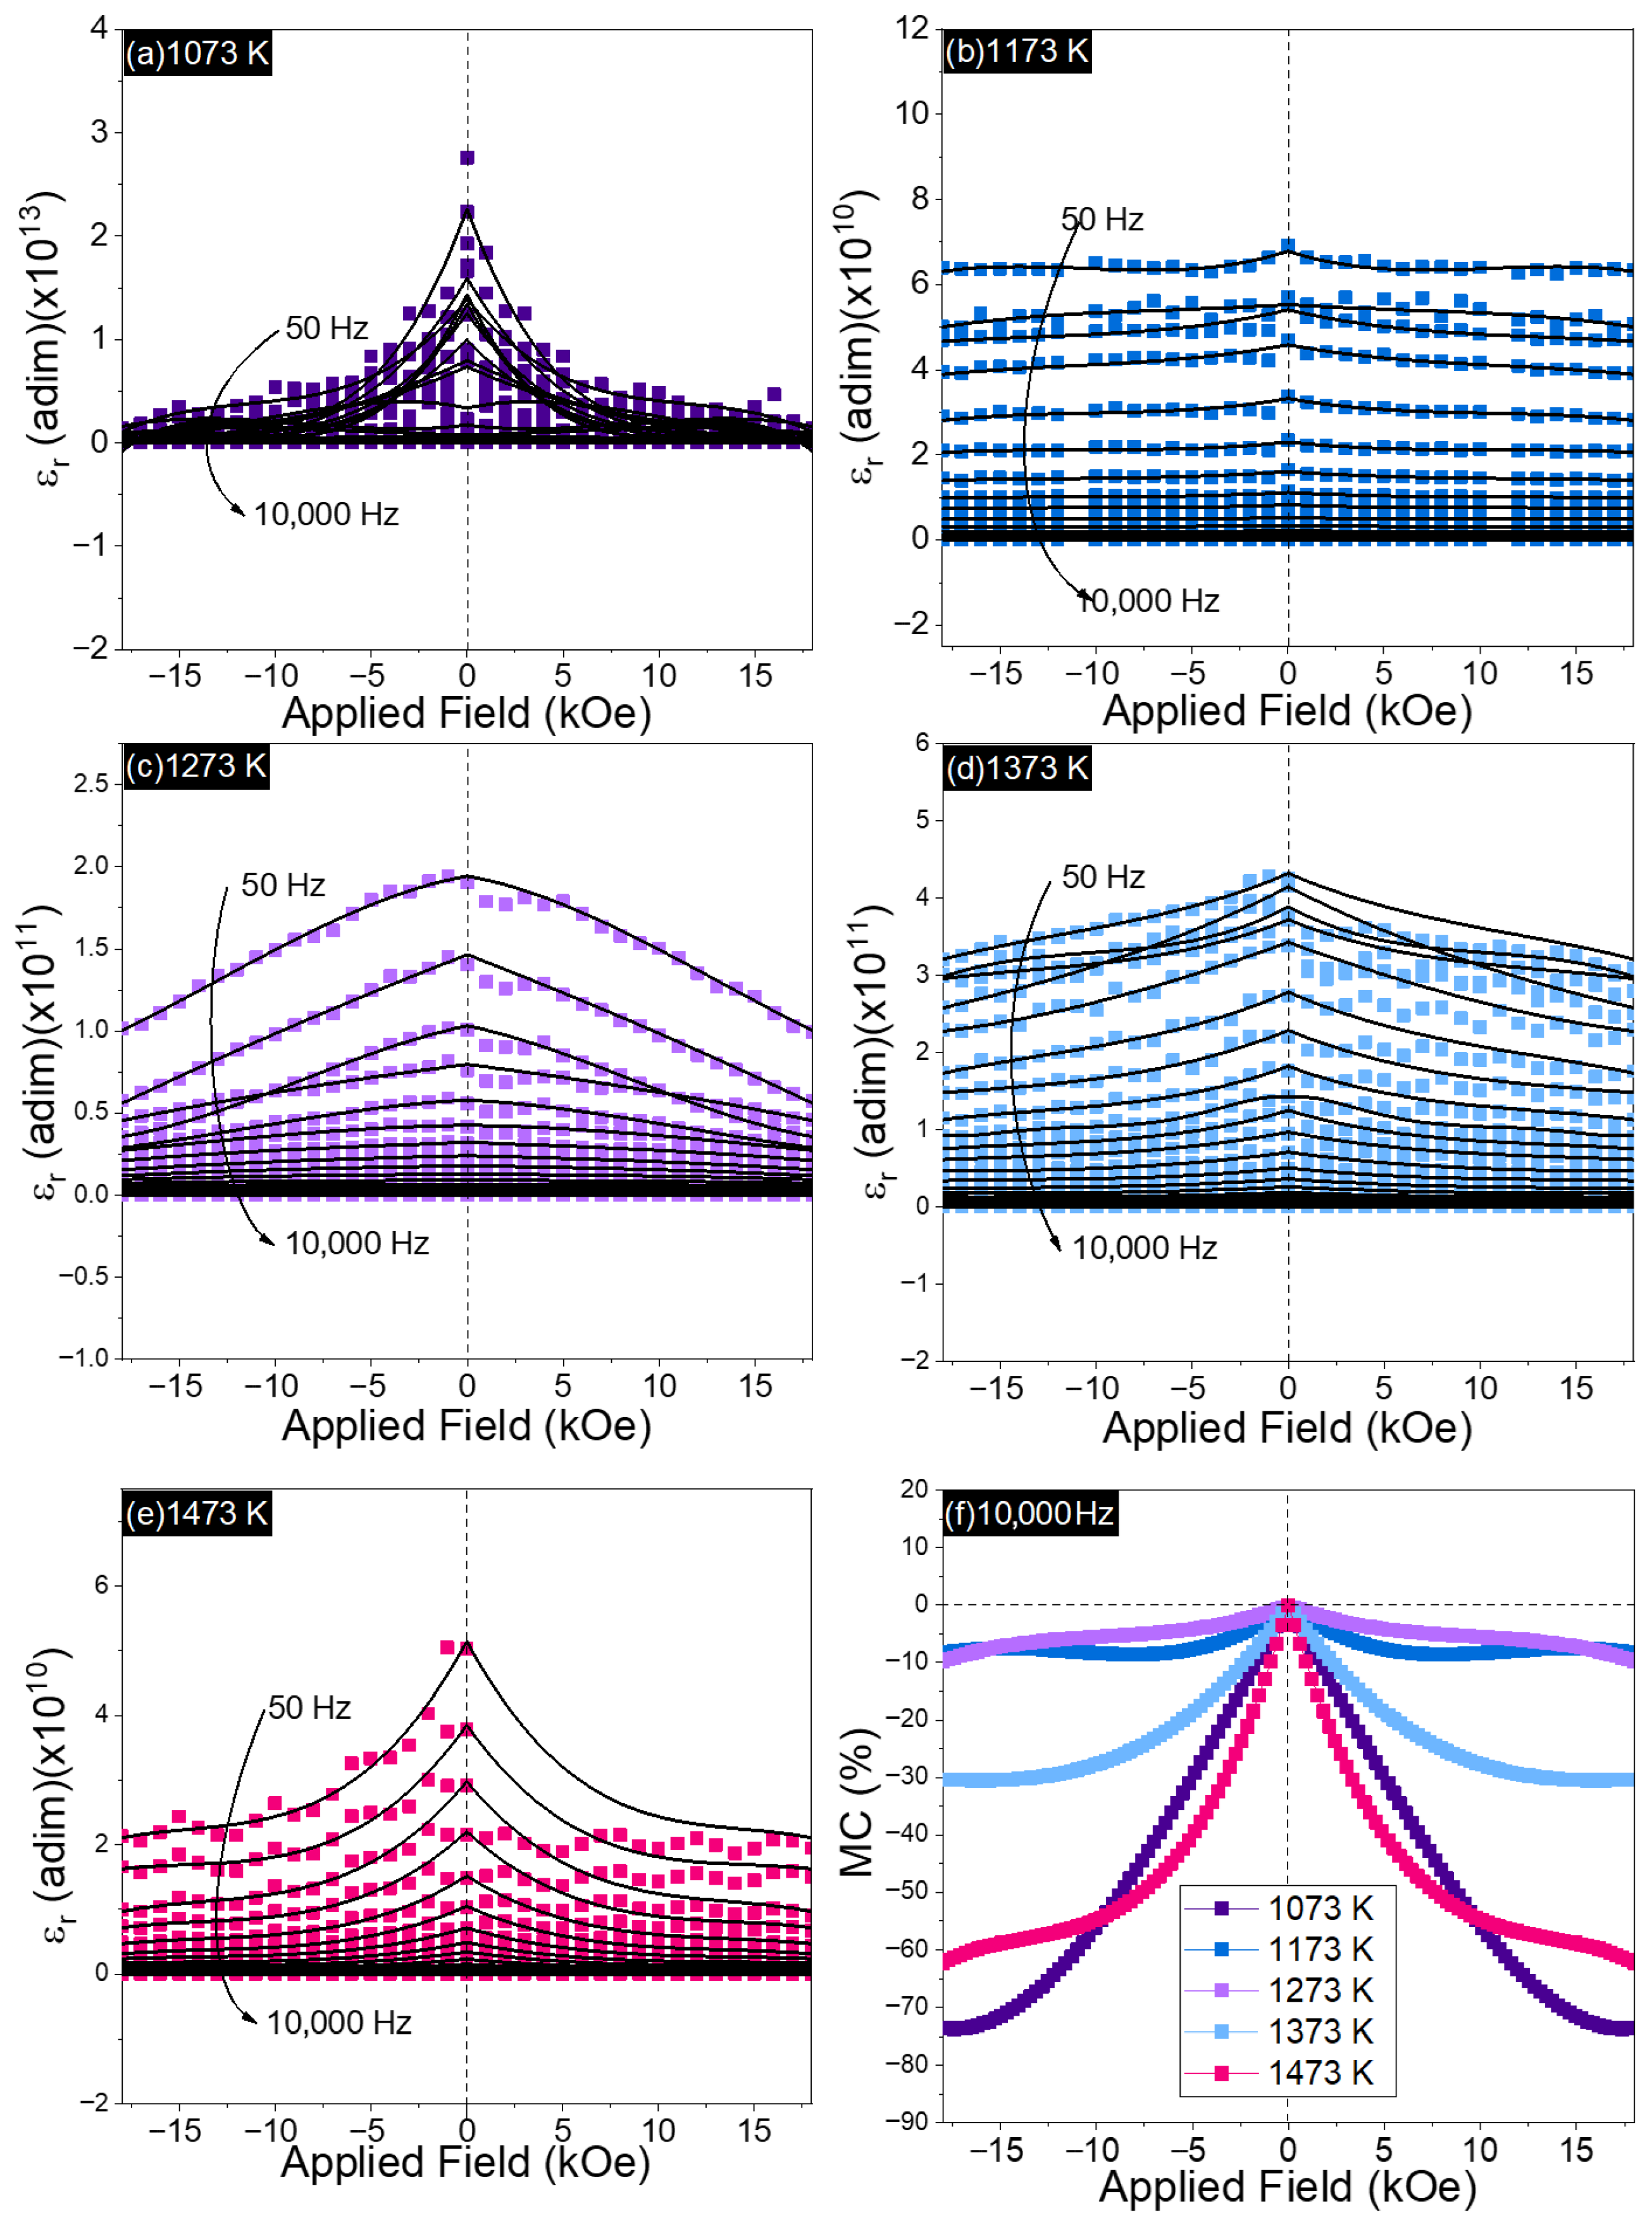
C(0) is the capacitance in the absence of a magnetic field. The magnetodielectric coupling analysis is shown in
Figure 13 (50 Hz to 10,000 Hz).
In general, MD coupling is observed in all samples, with a decrease in permittivity as frequency increases, consistent with
Figure 10. This behavior is indicative of a direct MD effect, where electric order is modified by the magnetic field [
46].
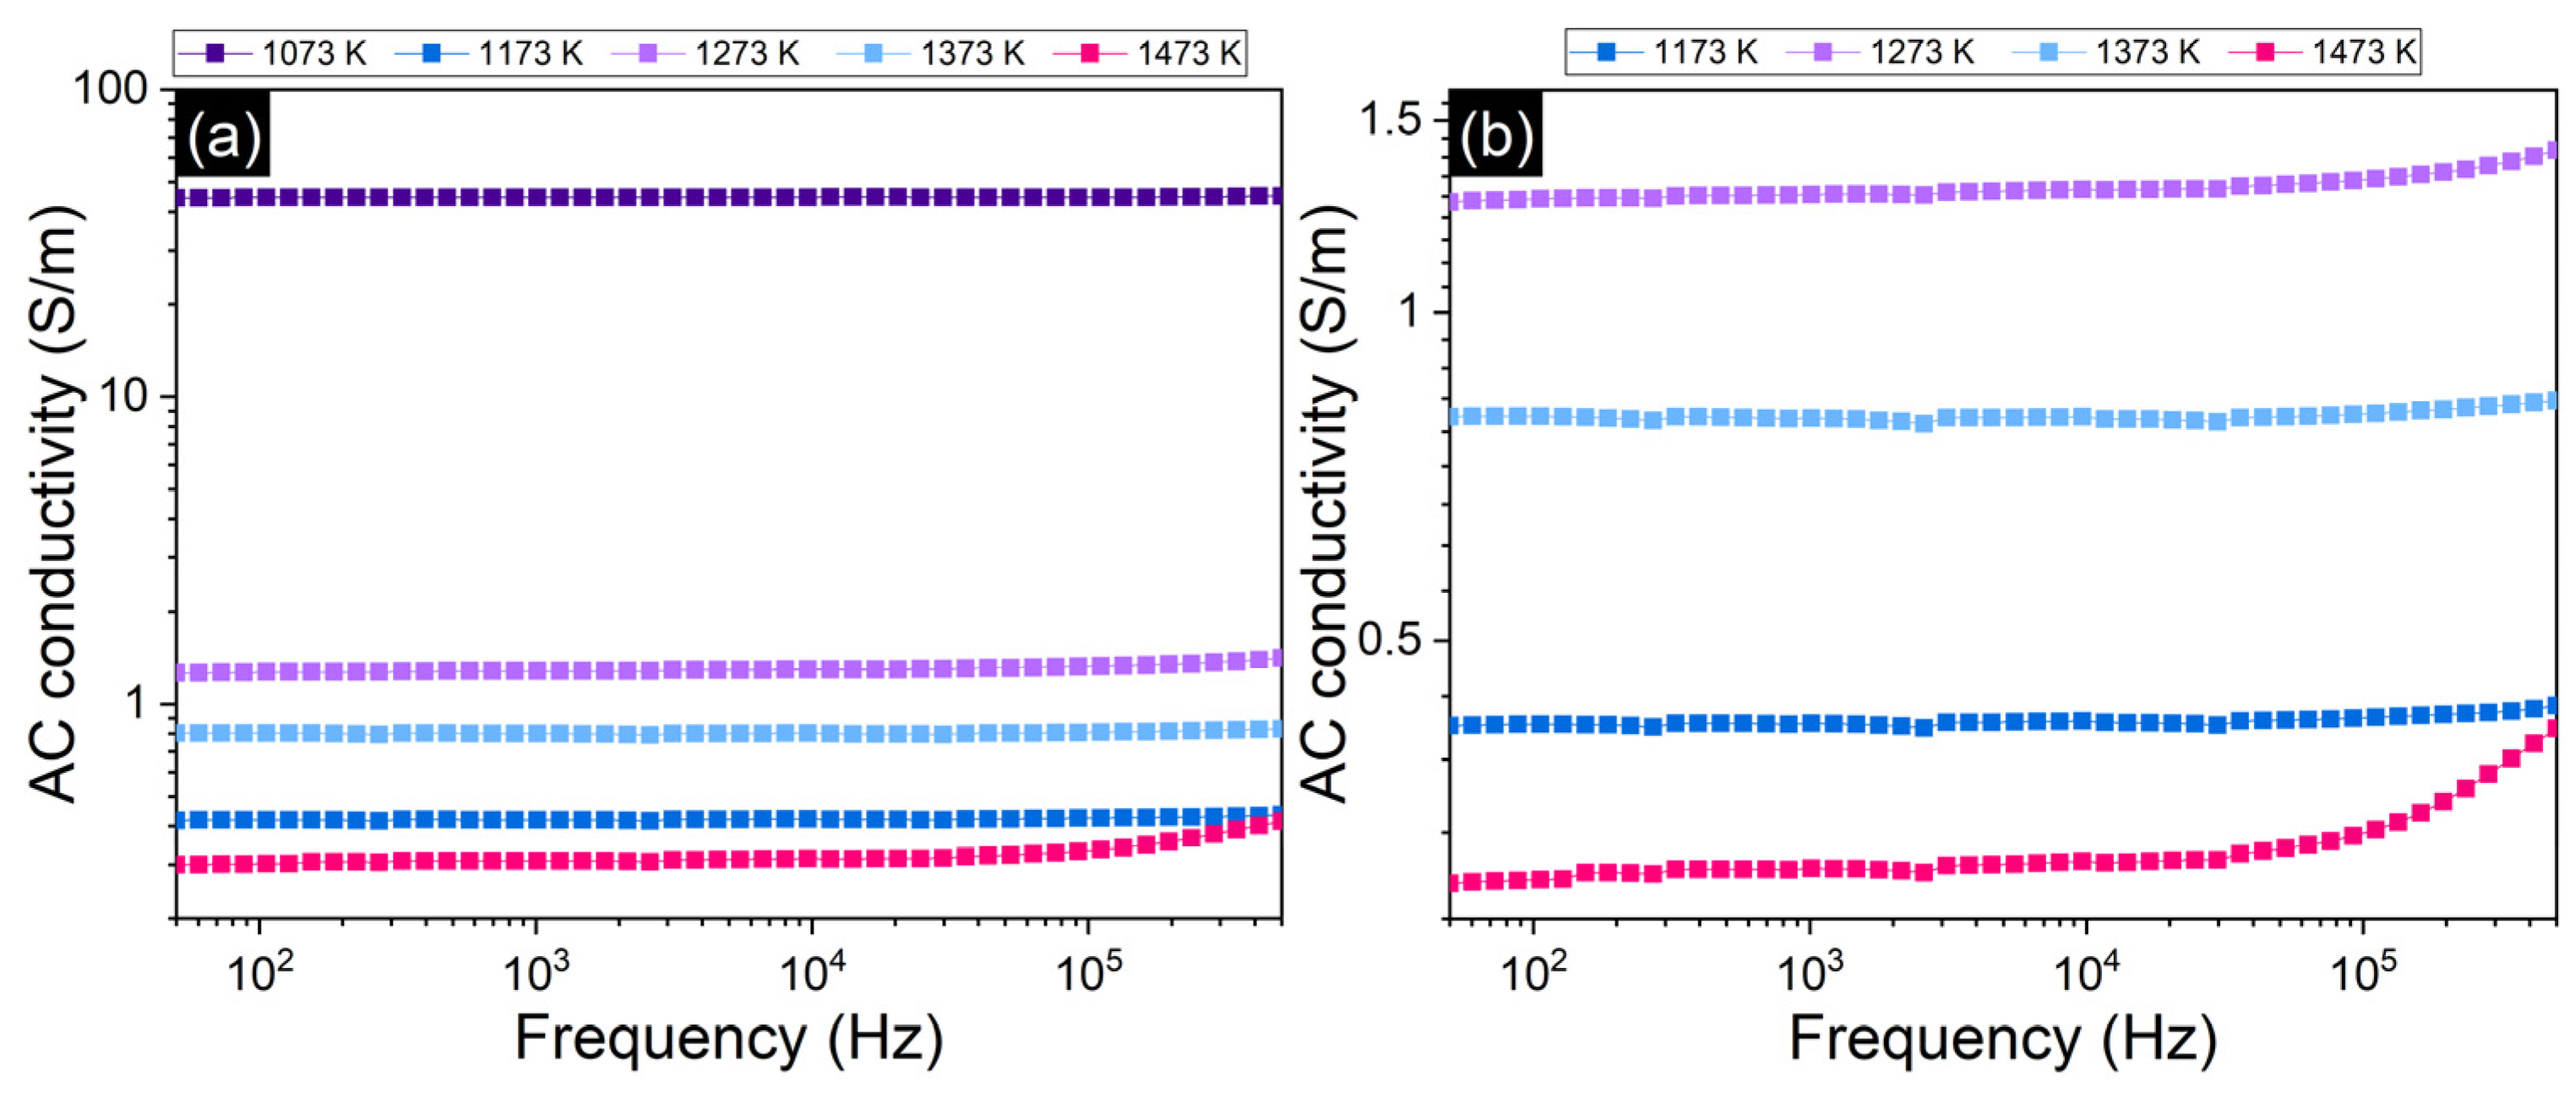
At 1073 K, where the microstructure is porous, a high dielectric response (high εr) and dispersive behavior are observed. MD coupling is favored by structural disorder, vacancies, and mixed valence states. This sample, dominated by interfacial effects, likely exhibits spin–charge coupling. At 1173 K, the temperature at which the first microstructural modification occurs, lower interfacial polarization and more controlled losses are observed. Thus, MD coupling may be related to defects and hopping mechanisms associated with densification while maintaining magnetic sensitivity. At 1273 K, with a more optimized microstructure, reduced losses, faster relaxation, and higher conductivity, the lowest MD coupling values are recorded. For the 1373 K system, with greater dielectric stability and fewer charge transport defects, the coupling appears more stable but less sensitive to the magnetic field.
Finally, at 1473 K, discussed above as potentially over-sintered, the result is a system that is more stable both magnetically and dielectrically, though not necessarily with enhanced magnetodielectric functionality.
In
Figure 13f, magnetocapacitance values are shown to be negative across all temperatures, indicating that the magnetic field reduces the permittivity of the studied system. These negative values may be associated with the suppression of interfacial polarization, which is present in all samples. The magnetic field may reduce charge accumulation at grain boundaries, for example. If the magnetic field aligns spins, it may restrict hopping between mixed valence states, thereby reducing polarization. Additionally, in densified systems, the magnetic field may stabilize the structure, decreasing the dielectric response associated with defects. It can be said that in a more ordered system, the magnetic field suppresses polarization mechanisms. Negative MC values may be related to coercivity, as they follow a similar trend with sintering temperature. Materials with high coercivity have more stable magnetic domains that do not easily respond to external fields, influencing how the magnetic field affects electric polarization.
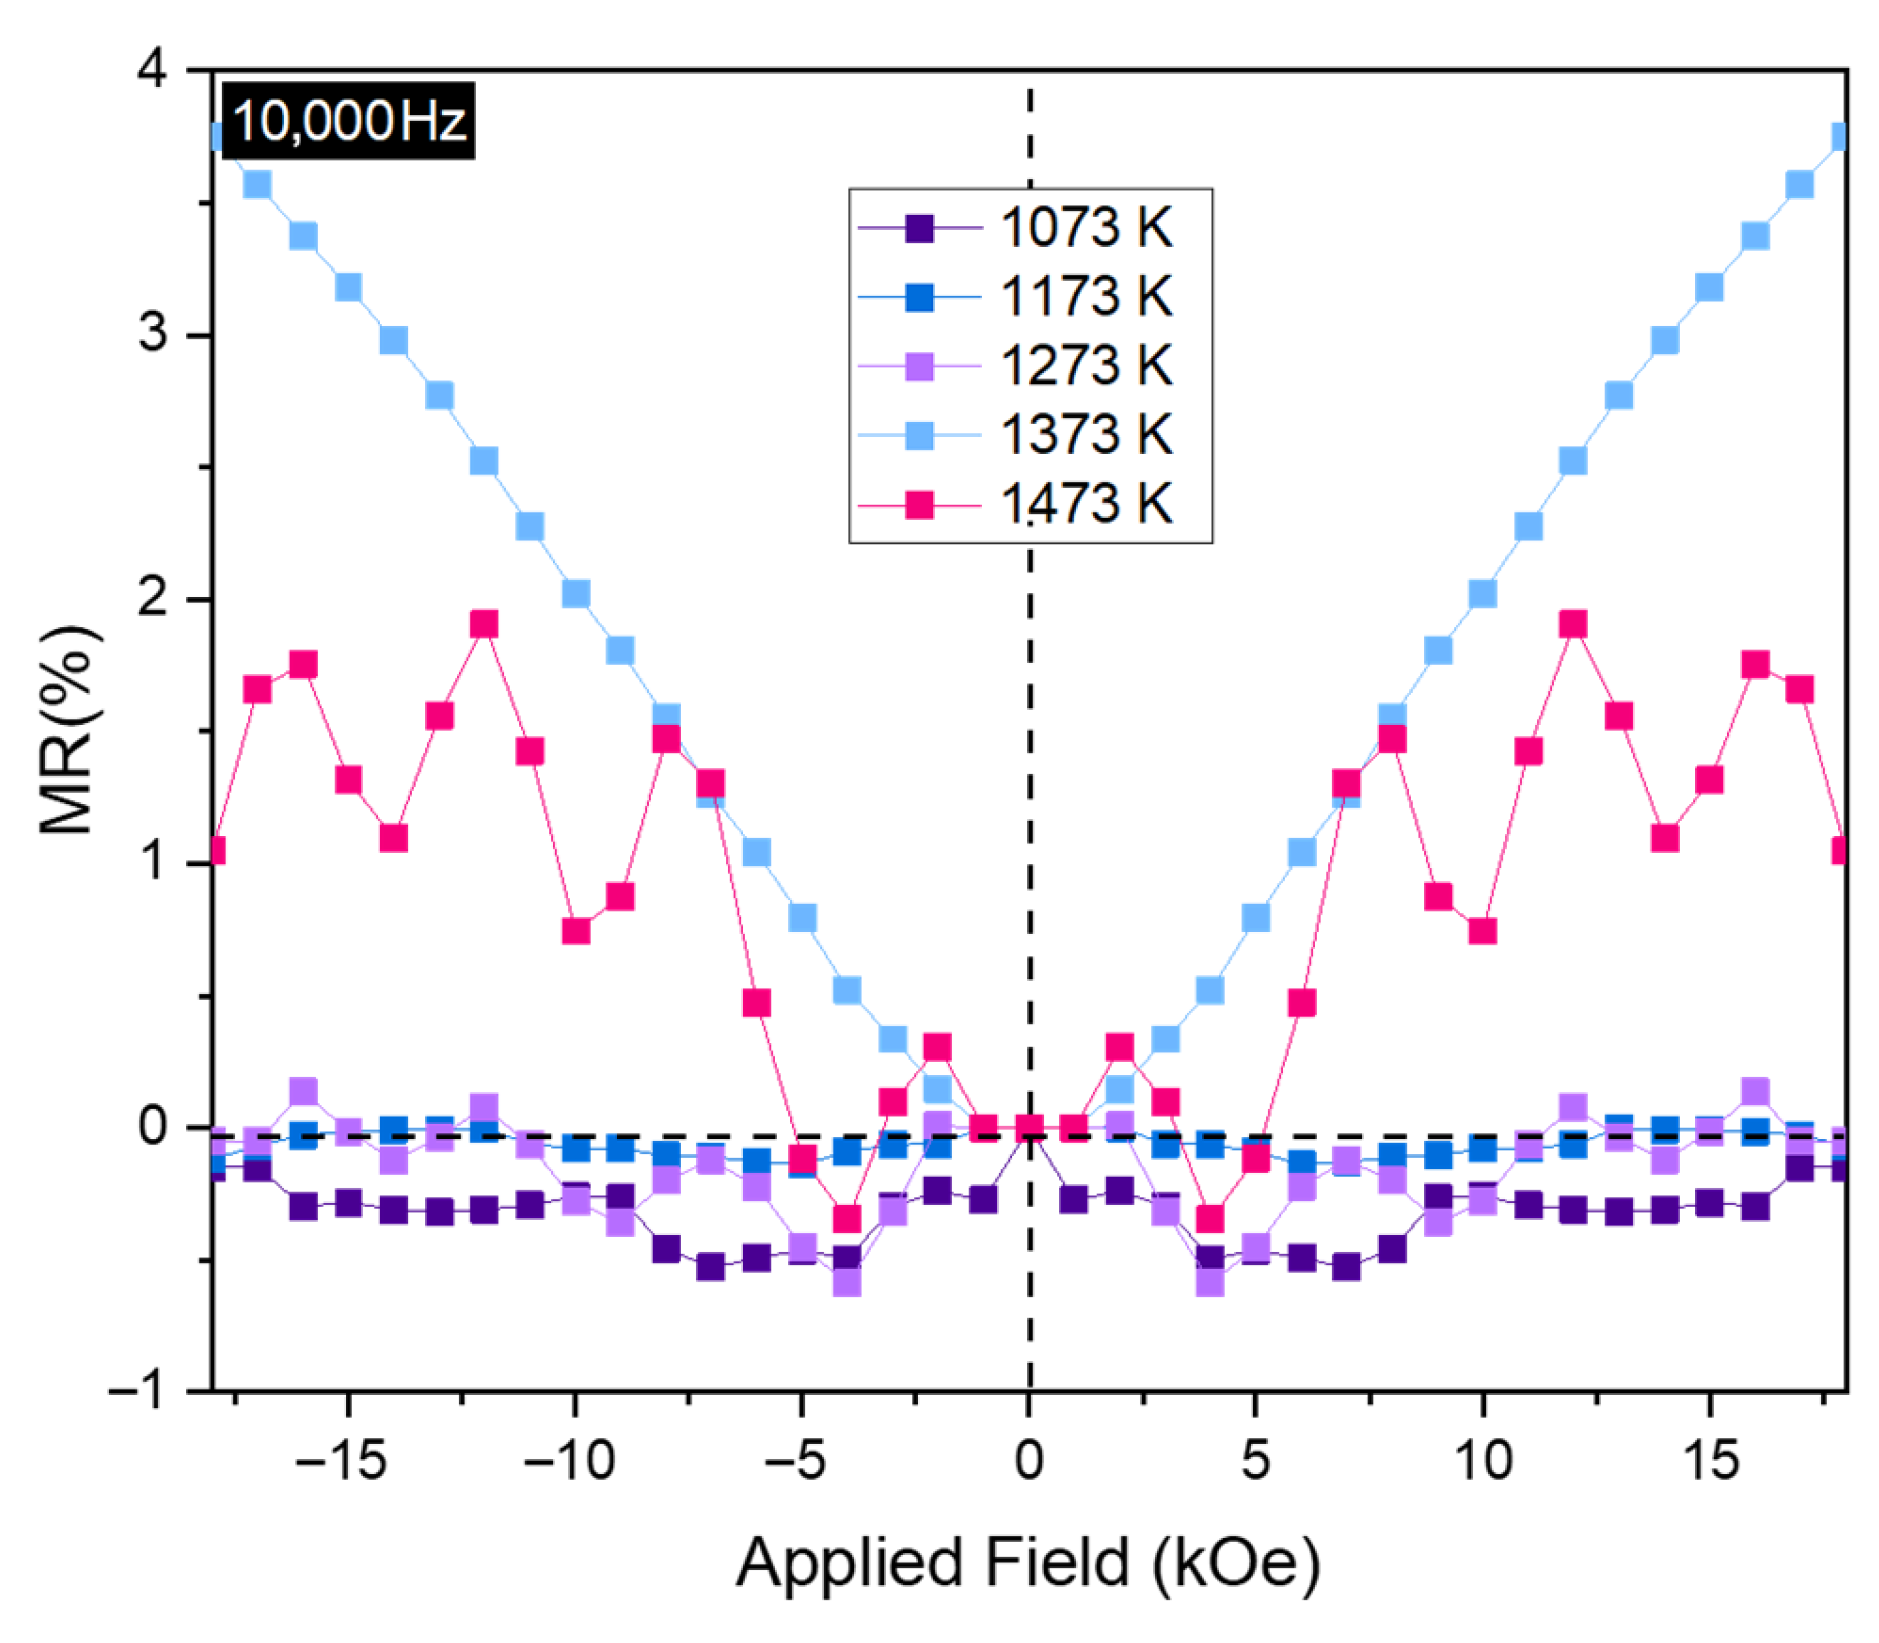
To rule out that the observed magnetodielectric coupling is extrinsic, magnetoresistance (MR) data were analyzed in parallel with magnetocapacitance (MC).
Figure 14 shows the percentage of MR, calculated using the following expression:
where
R is the resistance, as a function of the applied magnetic field. The MR measurements exhibit only minor variations (below 5%) compared to the significant changes observed in MC (about −90%).
The absence of a direct correlation between both curves suggests that the observed MC is not dominated by resistive artefacts.
This analysis is consistent with the report by Gustau Catalan [
47], who noted that MC may originate from MR via the MW mechanism, making it necessary to evaluate MC together with the resistive response of the system. The behavior of MC measured at 10,000 Hz further supports that the observed effect is not due to the MW mechanism, but rather reflects a magnetodielectric coupling of the material.
According to investigation [
48], at a frequency of 10,000 Hz, the contribution of MW–Sillars (MWS) polarization is already strongly reduced. This is supported by
Figure 10, where the pronounced drop in the frequency range of 10
2–10
3 Hz stabilizes at 10
4 Hz with much lower values. A similar behavior is observed in the loss tangent (tan
δ), whose characteristic peak appears in the intermediate region and decreases rapidly, so that at 10
4 Hz the MWS contribution is essentially suppressed. At the frequency investigated for MR, the MWeffect is attenuated and suppressed, leaving the spectra dominated by dipolar and electronic polarization mechanisms associated with the intrinsic behavior of the system.



 ,
,