Abstract
In this contribution, we examine the effect of the promoter´s ionic charge and valence orbital energy on the catalytic activity of Fe-based catalysts, based on in situ synchrotron X-ray powder diffraction (SXRPD), temperature-programmed-based techniques (TPR, TPD, CO-TP carburization), and Fischer–Tropsch synthesis catalytic testing studies. We compared the promoting effects of K (a known promoter for longer-chained products) with Ba, which has a similar ionic radius but has double the ionic charge. Despite being partially “buried” in a crystalline BaCO3 phase, the carburization of the Ba-promoted catalyst was more effective than that of K; this was primarily due to its higher (2+) ionic charge. With Ba2+, higher selectivity to methane and lighter products were obtained compared to the K-promoted catalysts; this is likely due to Ba´s lesser capability of suppressing H adsorption on the catalyst surface. An explanation is provided in terms of a more limited mixing between electron-filled Ba2+ 5p and partially filled Fe 3d orbitals, which are expected to be important for the chemical promotion, as they are further apart in energy compared to the K+ 3p and Fe 3d orbitals.
1. Introduction
Iron-based catalysts are an interesting choice for Fischer–Tropsch synthesis (FTS), where CO is hydrogenated to a mixture of hydrocarbons that can be upgraded and used as transportation fuels, lubricants, waxes, and other value-added products [1]. Part of the suitability of iron-based catalysts for FTS stems from their relatively lower cost (vis à vis cobalt-based catalysts). Furthermore, a residual Fe oxide phase that is present in the active catalyst enhances H2 production via its intrinsic water–gas shift (WGS) activity, thus enabling the use of H2 depleted, coal-derived syngas as a feed. Structural promoters, such as Al, Mg, and Si, positively impact catalyst performance by minimizing both the crystallite sintering and filter-clogging mechanical disintegration of the catalyst during working conditions [2]. Chemical promoters, such as alkalis and Cu, increase the coverage of the active phase [3]. Furthermore, small amounts of potassium may also enhance both activity and selectivity, mainly toward more value-added, longer-chained products [1,4]. Many efforts [1,3,4,5] have been dedicated to investigating the nature of the effect of potassium, which has been observed to increase the carburization rate during catalyst activation [5], resulting in the formation of a mixture of metastable iron carbides that seem to coexist in a dynamic equilibrium on the catalyst surface under FTS conditions. These carbides may be classified by the geometry of the interstices in the iron lattice that carbon may occupy. There are the octahedral carbides (OC), where carbon occupies somewhat distorted octahedral interstices. The so-called ε carbides (ε-Fe3C and η-Fe2C) belong to this OC carbide type. Likewise, there are carbides where carbon occupies trigonal prismatic (TP) interstices. χ-Fe5C2 (the Hägg carbide), θ-Fe3C (cementite), and Fe7C3 (Eckström-Hadcock carbide) fall within this TP category. Hägg carbide (χ-Fe5C2) has been proposed by some researchers to provide the most active carbidic phase for FTS [6] and is actually known to be the main phase under such conditions [7], along with η-Fe2C and ε-Fe3C [8,9]. θ-Fe3C is usually formed at temperatures above 310 °C and is the most thermodynamically stable product of the Fe-C carbon system and is less active than the Hagg carbide [10]. The carbide discovered by Eckström and Hadcock (Fe7C3) [11] has also been shown to form specifically in SiO2-promoted catalysts [12,13] under realistic FTS conditions. Nevertheless, knowledge about the carbidic structure that comprises the active phase for FTS in an iron-based catalyst is still a matter of intense debate, as there are many metastable carbidic phases that are relatively close in energy and therefore may be present in transient concentrations in the catalyst over the FTS temperature range (250–350 °C) [14], as shown in Figure 1.

Figure 1.
Expected temperature ranges for the several iron carbides, based on [14].
It should be expected that a particular phase distribution would be highly dependent on the experimental conditions and might rearrange after activation once exposed to the FTS feed [14,15,16]. In this regard, there is evidence that the nature of the promoter and particle size distribution also seem to play a role in determining the iron carbide phase distribution [12], which likely affects the temperature limits shown in Figure 1. Thus, research into the possible effect of the promoter (e.g., alkali) on active catalyst phase composition is ongoing.
Potassium enhances CO dissociative adsorption while inhibiting H adsorption [17,18], and the explanation for this has been given in terms of an electronically inductive effect that the K+ ion may exert on its vicinity either directly or via the oxygen bridges that it has with the catalyst surface [19,20], as it is expected that K is in a +1 formal oxidation state (e.g., present as a hydroxide, carbonate, formate, oxide, etc.). Such an electronic effect may be rationalized in terms of its large ionic radius (152 pm) due to the 3p64s0 valence levels compared to its charge. On the other hand, it should be expected that the alkali is likely present in the active catalyst in the form of a nanocrystalline phase whose nature is not entirely known. It may involve some sub-nanocrystalline carbonate (or related) phase [20,21], although it is also probable that this phase involves the formation of a K/Fe mixed oxide surface phase [22]. Some researchers have discussed the effect of K compared to other Group I alkali elements, attempting to ascertain the effect of the alkali size and the uniqueness of K as a good promoter in Fe-based FTS catalysts [5,23,24,25,26]. From these studies, a general, long-known [27,28] correlation between the production of longer-chained products and alkali basicity (which is directly related to alkali ion radius) emerges. However, this observation is complicated by the effect of the alkalis on other parallel reaction pathways, such as the catalyst deactivation caused by excessive carbon formation, or the WGS, which may influence activity/selectivity simply due to differences in the H2 supply locally occurring inside the reactor. Regarding the formerly mentioned deactivation issue, it is expected that basic alkali promoters (e.g., Rb, Cs) that are too large would lead to carburization that is too rapid, resulting in carbon buildup on the catalyst surface [5,23,26] and alkali carbonates that are too stable at FTS temperatures [20,21,29]. On the other hand, light alkali elements (Li, Na) are expected to result in lower syngas conversions due to their lower WGS activities, which would limit FTS in coal-derived, low H2/CO ratio syngas feeds, which would also be due to their lower capacity to reduce iron oxides toward FTS active iron carbide phases [26].
Besides the above-mentioned considerations of the effect of K+ on iron catalyst surface chemistry, which should be mainly based on the electronic inductive effect the heavy alkali should exert on its vicinity, it might also be expected that the catalyst´s surface acid–base chemistry should also be affected by the presence of the alkali. The acid–base chemistry change imparted by the presence of the alkali directly impacts the (transient) surface compounds that may be formed between the promoter ion and the FeOx matrix as well as with the adsorbed species (carbonates, formates, acetates, etc.). Considering these acid–base interactions merely in terms of ionic interactions, it might then be expected that the ionic charge of the promoter should play an important role, as it is known that the ionic lattice energies depend on the ionic charge. In this regard, in the present contribution, we aimed to investigate the effect of the promoter´s ionic valence by comparing the effect of K+ with a 2+ charged alkaline earth metal ion. In order to keep a suitable comparative basis, we then chose to compare it with Ba2+, as its ionic radius (149 pm) is quite comparable to that of K+ (152 pm), being only around 2% smaller than its alkaline counterpart. Moreover, Ba2+ has a np6(n+1)s0 valence level that is quite similar to that of K+ (Ba2+: 5p66s0 vis à vis K+: 3p64s0), which might a priori normalize any possible crystal field effects, even though they have different valence energies. In fact, alkaline-earth elements have also been considered to be promoters in iron-based catalysts in a few studies [30,31,32,33,34,35,36], although only a minor promoting effect has been observed. In the present contribution, we investigate the effect of the ionic charge and valence level of the promoter on the carburization rate, activity, selectivity, and stability of Fe-based catalysts. This is the first study on this subject as far as we are aware. To this end, iron-based catalysts with the atomic formula 5 Me: 100Fe (Me = K or Ba) were prepared and characterized by synchrotron X-ray powder diffraction (SXRPD), temperature-programmed-based techniques (TPR, TPD, CO-TP carburization), and FTS catalytic testing.
2. Materials and Methods
2.1. Catalyst Preparation
Fe-based catalysts were prepared by the precipitation of a 0.1 M Fe(NO3)3·9H2O (Aldrich, St. Louis, MO, USA, 99%) solution with concentrated ammonia solution (Dinamica, (Indaiatuba, São Paulo, Brazil), 28–30%) to reach a nominal Fe:NH3 molar ratio of 1:10. The suspension was then stirred for over 30 min at room temperature and was then vacuum-filtered. After the filtration of the precipitated cake and drying at 120 °C for 10 h, it was calcined in a muffle furnace at 400 °C over the course of 10 h under stagnant ambient air. This iron oxide support was then impregnated to the point of incipient wetness (0.3 mL of solution per gram of support) with K2CO3 (Vetec, (Rio de Janeiro, Rio de Janeiro, Brazil)), 99%) and Ba(NO3)2 (Vetec, (Rio de Janeiro, Rio de Janeiro, Brazil), 99%)) solutions. The K2CO3 solution was treated with a few drops of 0.01 M dilute HNO3 (Synth (Diadema, São Paulo, Brazil), 37% solution) solution prior to the impregnation until total gas elimination in order to minimize the presence of carbonates in the dried catalyst precursor. After impregnation, the precursors were then dried at 120 °C for 10 h under flowing air. The catalysts were prepared in order to attain a 5 Me:100 Fe atomic ratio (Me = K, Ba). Distilled water was used in all of these procedures.
2.2. BET Surface Area and Porosity Measurements
In order to study pore structure and surface specific area, Brunauer–Emmet–Teller (BET) experiments were performed in a Micromeritics 3-Flex system. The samples were pretreated upon temperature ramping to 160 °C followed by evacuation at that temperature over the course of 12 h at ~50 mTorr. Pore structure (pore volume, average pore diameter and pore size distribution) was determined using Barrett–Joyner–Hallenda (BJH) pore size and volume analysis.
2.3. In Situ Synchrotron X-ray Diffraction
The evolution of the crystalline phases in the catalysts while being exposed to CO and CO+H2 mixtures (at 1 bar) was studied by in situ synchrotron X-ray diffraction (SXRPD) at the X-ray powder diffraction beamline (XPD) located in the Brazilian Synchrotron Light Source (LNLS-Campinas). The samples were placed into a rotating sample holder located inside a furnace (Canário) that allowed gas flowing during the analysis. The samples were then irradiated with 7000 eV (λ = 1.7712 Å) light in a Hübner 4+2 circle diffractometer. Heat treatment of the samples, as depicted in Figure 2, occurred in three steps: (i) temperature ramping (2 °C min−1) up to 270 °C followed by a (ii) 1 h soaking at 270 °C under 100 mL min−1 5% CO (He) (White Martins (Campinas, São Paulo, Brazil)) and (iii) 1 h flowing in 85 mL min−1 of mixture containing 2.5% CO and 1.75% H2 diluted in He (1:0.7 CO to H2 molar ratio) (White Martins (Campinas, São Paulo, Brazil)), while the temperature was kept at 270 °C. This mixture was made using 50 mL min−1 of 5% CO (He) (White Martins (Campinas, São Paulo, Brazil)) and 35 mL min−1 of a mixture with 5% H2 (He) (White Martins (Campinas, São Paulo, Brazil)). Crystalline parameters (phase speciation, unit cell dimensions, atomic positions) were obtained via Rietveld analysis of the X-ray patterns using GSAS-II software [37]. The instrumental parameters were extracted using a NIST 676-a Al2O3 standard XRD pattern that was retrieved under the same experimental setup considered in this work.

Figure 2.
Temperature program used in the SXRD study.
2.4. Temperature Programmed Reduction (TPR)
H2 TPR profiles were recorded using an Altamira AMI-300R (Pittsburgh, PA, USA) unit equipped with a thermal conductivity detector (TCD). Catalysts (33 mg) were first pretreated in flowing helium at 30 mL min−1 at 300 °C (1 °C min−1 heating rate) for 1 h and were cooled. TPR was performed using a 10% H2/Ar gas (Airgas, San Antonio, TX, USA) mixture referenced to argon (Airgas, San Antonio, TX, USA) at a flow rate of 30 cm3 min−1. Each sample was heated from 50 to 1000 °C using a heating ramp of 10 °C min−1.
2.5. Hydrogen Temperature Programmed Desorption (TPD)
Hydrogen TPD profiles were recorded using the Altamira AMI-300R (Pittsburgh, PA, USA) unit equipped with a TCD. In each experiment, catalysts (400 mg) were activated in H2 (30 mL min−1) (Airgas, San Antonio, TX, USA) by ramping (1 °C min−1) to 400 °C and holding for 1 h. Catalysts were then cooled to 50 °C in flowing H2 and were held at that temperature for 1 h. Argon (Airgas, San Antonio, TX, USA) was then flowed (30 mL min−1) as the temperature was increased to 800 °C at a ramp rate of 10 °C min−1.
2.6. CO-Temperature Programmed Carburization/Mass Spectrometry (TPC-MS)
Temperature programmed carburization mass spectrometry (TPC-MS) was performed using an Altamira AMI-300R catalyst characterization unit coupled to a Hiden quadrupole mass spectrometer (QMS). An amount of 4% CO/He (Airgas, San Antonio, TX, USA) was flowed at 25 mL min−1 as the temperature was ramped at 10 °C/min to 570 °C and was held for 50 min. CO was analyzed using an online QMS (Hiden, Warrington, UK). Appropriate mass-to-charge ratios (m/z) that were examined were 28, 16, and 12 for CO and 44, 28, and 16 for CO2. Each experiment used 45 mg of catalyst load.
2.7. Catalytic Activity
A continuously stirred-tank reactor (CSTR, Pressure products industries, PA, USA) made up of a stainless steel (316) autoclave (1 L) was used to perform the FTS reactions. The calibrated mass flow controllers from Brooks (5850 E series, Brooks Instruments, Halfield, PA, USA) were used to individually control the gas flow of H2 (UHP grade supplied by American Welding & Gas, Lexington, KY, USA)), CO (UHP grade supplied by American Welding & Gas, Lexington, KY, USA), and N2. (UHP grade supplied by Scott-Gross Company Inc., Lexington, KY, USA). The gas streams were delivered to the reactor via a dip tube. A Cr-Ni thermocouple was inserted into a thermowell that measures the reactor temperature in real time. Typically, 310 g of polywax-3000 (Baker Hughes, Houston, TX, USA), which acts as slurry medium, was placed into a 1 L CSTR and was heated to 140 °C so that the wax could melt at 140 °C. About 8 g of iron catalyst was mixed with the polywax solvent. The FTS reactor was then purged with CO flow (24 slph) at the temperature and pressure of 270 °C and 1.2 MPa, respectively. This CO activation condition was maintained for 24 h. After CO activation, the feed was switched from CO to syngas (H2:CO) at a mole ratio of 0.7:1 and a constant space velocity of syngas at 3.0 slph/gcat. The gas stream exiting the CSTR was subsequently passed through both warm and cold traps maintained to the temperatures of 100 °C and 0 °C, respectively. A steady state was typically reached within 10 h after the beginning of the reaction. At this point, the effluent gases were sent to a dry test meter (DTM) followed by gas analysis being performed with an online micro-GC (Inficon, East Syracuse, NY, USA). The condensed products in the warm and cold traps were separated into oil and water phases. The oil phase was analyzed by an Agilent 7890 gas chromatograph (Agilent, Santa Clara, CA, USA) equipped with a DB-5 capillary column (60 m) and a flame ionization detector (FID). The aqueous part of the sample was analyzed using an SRI 8610 C gas chromatograph (SRI Instruments, Earl St. Torrance, CA, USA) with a HayeSep Q packed column (9Ft 1/8 80/100 SS) and a TCD detector. Software developed at UK-CAER was used to process the gas analysis to determine conversion and selectivity based on Equations (1) and (2), given below:
where and are the numbers of moles of CO fed and unconverted, respectively. is defined as the number of moles of a particular product being formed.
3. Results
3.1. SXRPD Studies
SXRPD patterns of the calcined catalyst precursors are displayed in Figure 3A. All the samples were initially comprised of α-Fe2O3 (hematite), although the K- and Ba-containing samples also displayed additional small peaks, which can be observed within the 32° to 55° 2θ region, as shown in more detail in Figure 3B. In the K-promoted calcined precursor, peaks related to FeCO3 (ICSD 169791), K2O (ICSD 60489) and a Fe-K mixed oxide (Fe10.9K1.55O17- ICSD 201095) were observed. The Ba-promoted calcined precursor displayed peaks related to FeCO3 (ICSD 169791), BaCO3 (ICSD 158379), and a Fe-Ba mixed oxide (BaFe12O19- ICSD 230509). These phases were likely formed during calcination and storage and tended to disappear with the carburization and reduction treatments that were performed. Figure 3C shows the patterns obtained after ramping the temperature to 270 °C and soaking at that temperature for 1 h under 5% CO (balance He). All the catalyst samples underwent phase changes such that diffraction lines related to magnetite could be observed in the three samples. Furthermore, diffraction lines related to other compounds, especially χ-Fe5C2 (Hägg carbide) and θ-Fe3C (cementite), could be observed in both K- and Ba-promoted samples, while extensive carburization was not observed in the unpromoted sample; in that case, lines related to magnetite were observed, with only minor peaks related to carbides. This rather restrict carburization was likely due to the use of diluted CO and H2 gas mixtures in the synchrotron experiment. Regarding the K- and Ba-promoted samples, visual inspection does not allow for a conclusion to be drawn as to whether or not other metastable carbides (ε-Fe3C or η-Fe2C) might have formed. Interestingly, the Ba-promoted catalyst also yielded BaCO3, as observed by the diffraction peaks located at 2θ at approximately 28° and 39°. Figure 3D displays the patterns obtained after 1 h at 270 °C under diluted CO + H2 (H2/CO molar ratio of 0.7). In contrast to the results observed for unpromoted and K-promoted catalysts, the magnetite phase virtually disappeared for the Ba-promoted catalyst, while the diffraction lines related to iron carbides became more prevalent.
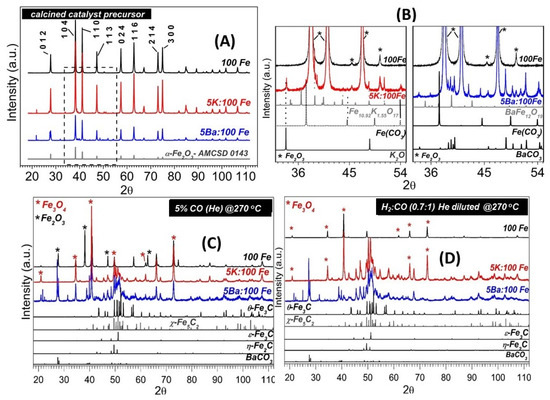
Figure 3.
SXRPD patterns of the Fe-based samples after calcination (A). Blow-up of the dotted line circled area of Figure A, which displays small diffraction lines related to minor phases that were formed in the K- and Ba-promoted calcined catalyst precursors (B). After 1 h of carburization under 5% CO (He diluted) flow (C) and after 1 h flow of exposure to a He-diluted mixture of H2:CO (0.7:1 molar ratio) (D).
SXRPD data were Rietveld-refined in order to obtain the evolution of phase composition over the carburization process of our samples considering the following phases (described in detail in Table 1): α-Fe2O3, Fe3O4, χ-Fe5C2, and θ-Fe3C.

Table 1.
Phase models considered in the Rietveld refinement considered in this work.
Figure 4 depicts the phase evolution of the unpromoted, K-promoted, and Ba-promoted samples as a function of the temperature and testing conditions. The phase transition from Fe2O3 to Fe3O4 was observed in all samples during temperature ramping under He-diluted, 5% CO. The addition of potassium resulted in a slight delay in the Fe2O3 to Fe3O4 transition, as be observed by the Fe3O4 temperature onset, which was 213 °C and 229 °C for the unpromoted and K-promoted samples, respectively. This shift in the Fe2O3 to Fe3O4 transition in the presence of alkalis has been observed by Li et al. [23] and will be further analyzed during the discussion of the temperature-programmed results. The presence of Ba was found to decrease the Fe2O3 to Fe3O4 reduction onset at approximately 168 °C, indicating a strong promoting effect that could be ascribed to the activation of either the Fe-O bond (toward iron oxide reduction) or C-O bond (toward the formation of CO2 from lattice-O). Based on Raman spectroscopy, Li et al. [30] reported that Fe-O bond strengthening caused by the presence of the alkaline-earth promoter, although Sr and Ba were found to slightly facilitate the Fe2O3 reduction to Fe3O4 caused by CO.
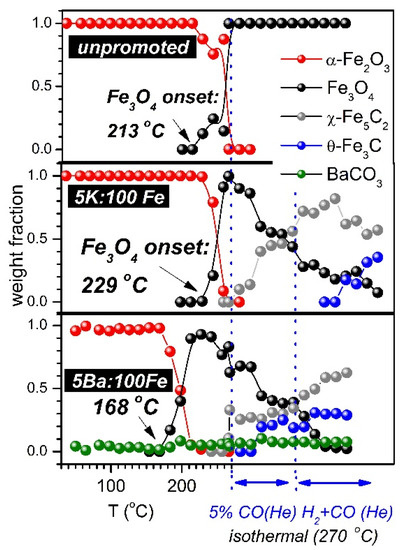
Figure 4.
Evolution of catalyst phase composition as a function of the temperature and in situ testing conditions.
There was no observable formation of phases other than magnetite in our unpromoted catalyst during treatment in either CO or syngas. This suggests that, at the most, only a tiny fraction of the iron oxides was transformed into an amorphous iron carbide phase under the experimental conditions adopted in this work. The K- and Ba-promoted samples displayed a greater extent of carburization, such that the final magnetite content was (after 1 h flowing the (He-diluted) CO+H2 mixture, at 270 °C) only about 10% and 2%, respectively. In this analysis, both χ-Fe5C2 and θ-Fe3C were considered. The η-Fe2C and ε-Fe3C crystallographic phases, also considered in former refinements of our data, only gave trace or zero weight fractions. This strongly suggests that they did not form in our experimental conditions, at least in a noticeable quantity or as a crystalline phase. Theoretical studies [16,38] have indicated that octahedral (O) phases (e.g., η-Fe2C, ε-Fe3C) have slightly lower energies and therefore should be more stable than the trigonal prismatic (TP) carbides (χ-Fe5C2, θ-Fe3C, and the high pressure formed h-Fe7C3). However, TP phases are more frequently shown to form under in situ, in operando FTS conditions as well as in spent FTS catalysts [13,39]. According to a hypothesis proposed by de Smit et al. [16], this might be ascribed to the higher entropy that these TP carbides possess in comparison to the O carbides.
The evolution of the Fe2O3 and Fe3O4 a lattice parameters as a function of the temperature and gas phase composition is displayed in Figure 5A. The expected linear evolution of the cell parameters is observed in both phases during temperature ramping toward 270 °C. Regarding the Fe2O3 phase, the fact that the slopes are similar for all of the samples suggests that there was not a significant insertion of the promoter ion into the Fe2O3 phase during temperature ramping. Regarding the behavior of Fe3O4 in the 270 °C constant temperature region, it can be noticed that larger values of the unit cell parameter are obtained for both the K- and Ba-promoted samples, indicating the insertion of promoter ions into the Fe3O4 structure, probably by substituting Fe ions for the voluminous alkali and alkaline earth ions. Interestingly, the parameter cell of the Fe3O4 phase in the Ba-promoted sample slightly decreased toward the values observed in the unpromoted sample during the isothermal treatment under He-diluted syngas, suggesting that the fraction of magnetite that was doped with Ba2+ ions was reduced first (towards iron carbides), yielding only small Fe3O4 crystallites containing lower amounts (if any) of Ba2+ ions. Likely, the Ba2+ ions present in the Ba-doped Fe3O4 were being segregated towards a stable, nanocrystalline BaCO3 phase, as the magnetite phase was being consumed under diluted syngas treatment. Regarding the K-promoted sample, a slight linear increase in the Fe3O4 a cell parameter during isothermal treatment with diluted syngas suggests K+ insertion. This nanocrystalline K-Fe3O4 phase might be responsible [26] for the somewhat higher WGS activity displayed by the K-promoted catalyst, which is to be discussed later.
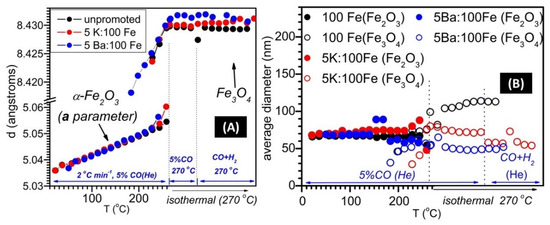
Figure 5.
Fe2O3 and Fe3O4 a unit cell parameters, respectively (A), and average particle diameter (B), as a function of the temperature and in situ testing conditions.
Average crystallite sizes of the Fe2O3 and Fe3O4 phases are displayed in Figure 5B. Although the particle sizes of the hematite phase are similar in the three samples, the magnetite particles assume significantly different sizes, such that the order was: unpromoted > 5K:100Fe > 5Ba:100Fe. If one considers a model whereby iron carbides grow around Fe3O4 nanoparticles [4] under carburization and FTS conditions in a core–shell configuration, one might rationalize this order by ascribing the smaller Fe3O4 particle sizes found in Ba-promoted and (to a lower extent) K-promoted catalysts to magnetite cores of variable sizes surrounded by iron carbide shells with variable thicknesses. Nevertheless, additional experiments (e.g., TEM studies) are required to further explore this hypothesis. Figure 6 summarizes the different phases formed during reduction under either H2 or CO.
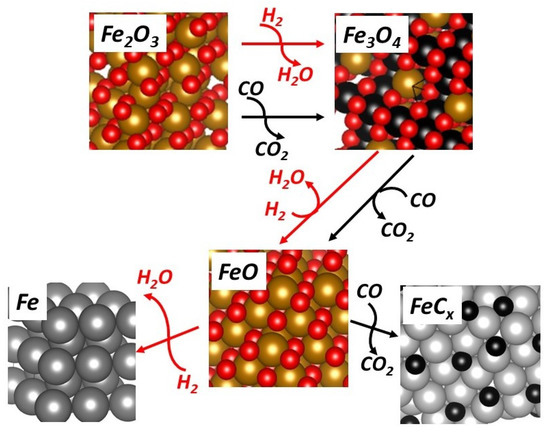
Figure 6.
Phases formed during reduction under H2 and CO (carburization).
3.2. Temperature-Programmed Studies
H2-TPR profiles are reported in Figure 7A and follow a typical stepwise progression, including 3Fe2O3 + H2 → 2Fe3O4 + H2O; 2Fe3O4 + 2H2 → 6FeO + 2H2O; 6FeO + 6H2 → 6Fe0 + 6H2O. Adding the alkali has an inhibiting effect on the first step of reduction, shifting it from 376 °C to 435 °C in the case of K-promotion and to 392 °C in the case of Ba-promotion. This shift toward higher temperatures in the Fe2O3-to-Fe3O4 reduction peak has also been observed by Li et al. [17,23] and has been related to either the strengthening of Fe-O bonds or to an inhibiting effect that the promoter may have in the activation of H2 [17,23]. The maxima for the latter two steps occurred over a similar temperature range (Maximum #2: 594 °C, 599 °C, and 594 °C and Maximum #3: 623 °C, 631 °C, and 621 °C for unpromoted, K-promoted, and Ba-promoted, respectively).
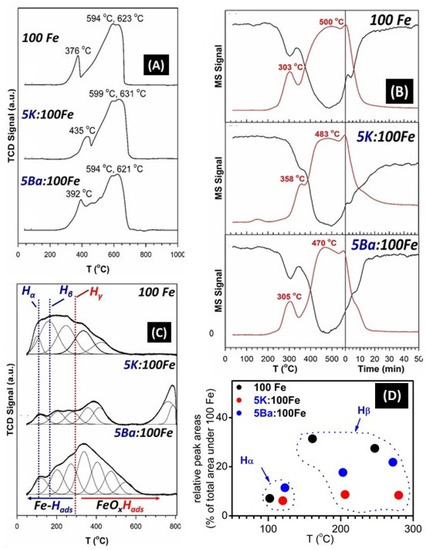
Figure 7.
H2-TPR (A), CO-TPC (MS signals of (black) CO and (red) CO2) (B), H-TPD profiles (C) of the un-promoted, K-, and Ba-promoted catalysts; relative H-TPD peak areas (% relative to the area under the unpromoted (100Fe) catalyst) (D).
In the case of CO-TPC (Figure 7B), the profiles are quite complex. The first carburization step involves converting Fe2O3 to Fe3O4, and the alkali has an inhibiting effect (maximum #1: 303 °C, 358 °C, and 305 °C for unpromoted, K-promoted, and Ba-promoted, respectively). The observed trend in the temperatures where the Fe2O3 to Fe3O4 transition maxima are observed is consistent with the observed Fe2O3 to Fe3O4 transition temperature onsets, as previously shown by the XRD data (213, 229, and 168 °C, related to the unpromoted, K- and Ba-promoted samples, respectively). This trend may be rationalized in terms of alkali-promoted Fe-O bond strengthening, which is compensated for by the more facile dissociative adsorption of CO on an alkaline-earth-doped iron oxide surface [30]. Carburization, however, occurs more rapidly, as Fe3O4 passes through a defect-laden oxide resembling FeO and progresses further to the Fe carbide.
Based on the XRD results previously shown in Figure 4, the presence of the alkaline earth promoter seems to promote carburization more effectively. This is consistent with CO-TPC studies (Figure 7B), as there is a noticeable shift to the lower temperatures of the main CO2 evolution peak located above 380 °C: unpromoted (500 °C) > K-promoted (483 °C) > Ba-promoted (470 °C).
Figure 7C displays the H2-TPD desorption profiles deconvoluted as Gaussian curves in order to estimate the different contributions lumped together under the profile areas. The unpromoted catalyst displays a broad asymmetric peak containing various contributions below 560 °C, including approximately 100 °C, 167, 250 °C, 323 °C, and 424 °C. With the addition of K, the asymmetric cluster of peaks below 560 °C was suppressed. These peaks included those at 117 °C, 203 °C, 263 °C, and 336 °C. In addition, there was an intense peak at a high temperature, 783 °C. With the addition of Ba, the cluster of peaks was broadened to 650 °C. The peaks included 117 °C, 203 °C, 263 °C, and 336 °C along with a few further contributions extending up to approximately 650 °C. The multiplicity of peaks indicates the existence of H adsorption surface sites of various strengths. In fact, H-desorption studies made on clean Fe surfaces revealed the existence of two broad desorption peaks located below 200 °C and within the 200–300 °C range, designated as Hα and Hβ [23], which have been correlated with adsorbed H on differently coordinated Fe surface sites. The desorption peaks located above 300 °C are related to the decomposition of the hydroxyl groups located on unreduced surface sites. Figure 7D displays the relative peak areas, as a percentage of the total area of the 100 Fe (unpromoted) H-TPD profile. Assuming that the areas are proportional to the amount of H desorbed, it can be clearly seen that while the areas related to the loosely chemisorbed H (around 120 °C) are about the same among the three catalyst samples (perhaps with a little enhancement due to Ba), the areas related to more strongly adsorbed H (hollow fourfold surface sites and defects [23,40]) are suppressed by the presence of Ba2+ and, to an even larger extent, K+. This suppression might be explained in terms of an electronic effect where the ionic promoter valence levels mix with incomplete Fe 3d levels, thus increasing the activation energy necessary to adsorb H2 and form the Fe-H bond, mainly via electronic repulsion [40].
3.3. BET Results
As shown in the Table S1, the BET surface areas (12.5–14.2 m2/g), BJH pore volumes (0.11–0.12 cm3/g), and pore diameters (31–33 nm) were similar among the catalysts.
3.4. FTS Catalyst Testing
Unpromoted, K-promoted, and Ba-promoted catalysts were tested at typical FTS process conditions for more than 200 h. Figure 8 shows that both CO and H2 conversions decrease with time on-synthesis (TOS) for all three catalysts. The K-promoted Fe-catalyst displayed a CO conversion of about 73% at 24 h, which then decreased rapidly to 60% at 100 h and then decreased further to 35% after 200 h. The H2 conversion shows a similar trend to that of CO conversion. The unpromoted Fe catalyst exhibits a steady hydrogen conversion over 200 h, while it displayed a decrease in the conversion of CO during the same period. The CO conversion trend for the Ba-promoted Fe catalysts followed that of unpromoted Fe but was 5–10% lower. This indicates that the K promoter influences the catalyst deactivation rate moreso than Ba does at the promoter loadings used in this work (5Me:100Fe, atomic ratio). This is consistent with the results reported by Luo and Davis [31]. It is well-known that the presence of K facilitates substantial carbon formation on the catalyst surface during CO activation and FTS [41]. These carbon fringes have a direct impact on catalyst stability depending on their structure and location, which is expected to alter the conversion and product selectivity during FTS. In agreement with the H2-TPR and H-TPD trends, the addition of potassium suppresses hydrogen activation. On the other hand, K is known to enhance dissociative CO adsorption on Fe, which likely results in carbon accumulation over the catalyst surfaces covering the active iron carbides either partially or completely [42]. Using TPR/XANES, Ribeiro et al. [5] observed an increase in the extent of carburization in alkali-promoted Fe catalysts, which is related to an enhancement in the CO dissociation rate. Earlier, Arakawa and Bell [43] found that potassium increases the rate of catalyst carburization as well as the water–gas shift activity.
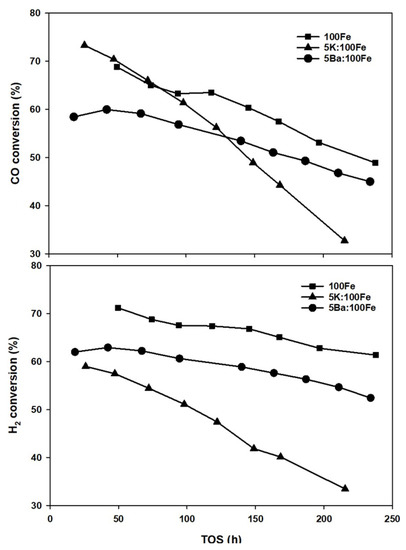
Figure 8.
CO (top) and H2 conversions (bottom) as a function of time on-synthesis for Fe catalysts.
The selectivities to methane and CO2 of the various catalysts are shown in Figure 9. Both unpromoted and Ba-promoted Fe catalysts show about the same methane selectivity, which is in the range of 5–6.5 mol% over the course of 200 h of FT synthesis. In contrast, K-promoted Fe produced methane as low as 3 mol%, approximately half of that which evolved from the pure Fe and Ba-promoted Fe catalysts. CO2 selectivity represents the catalyst activity for the WGS reaction. The promoter effects on the WGS activity of Fe follow the order 5K:100Fe > 5Ba:100Fe > 100Fe.
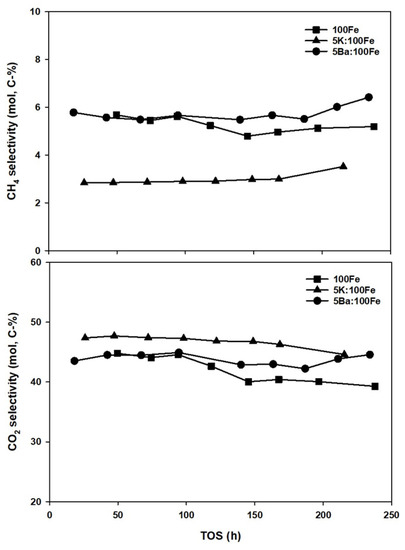
Figure 9.
CH4 (top) and CO2 (bottom) selectivity as a function of time on-synthesis for Fe-catalysts.
Davis et al. [44] pointed out that potassium increases WGS activity and that there is an optimum K loading that is necessary to achieve maximum syngas conversion. Overall, FTS activity depends on both FTS and WGS reactions, as the latter would provide hydrogen that is needed for Fe-based FTS. In this regard, all three Fe catalysts showed some deactivation; in particular, the K-promoted Fe catalyst lost most of its activity, and this was accompanied by a slight decrease in the WGS selectivity after 100 h of TOS.
Anderson–Schulz–Flory (ASF) plots for hydrocarbons and oxygenates are shown in Figure 10. The sharp decline at the C5-carbon in the case of hydrocarbons is attributed to volatile product losses during liquid sampling and during sample preparation for GC analysis. Hence, only the carbon numbers from C9 to C21 are considered for determining the alpha value. The alpha of hydrocarbons for the 100Fe catalyst is 0.72, while it was higher for the promoted catalysts: 0.84 and 0.76 for 5K:100Fe and 5Ba:100Fe, respectively. Without any additional structural promoters, K and Ba seem to not significantly influence the chain growth probability of oxygenates (~0.73). They mainly impact the hydrocarbon distribution and the selectivity to olefins. This is in agreement with the literature [44]. The co-feeding experiments with the Fe catalysts for FTS suggest that both 1-olefin and oxygenates take part in the secondary reactions that may increase chain growth probability. It has been pointed out by many authors that 1-olefins and oxygenates both follow a similar trend with respect to chain propagation. However, there is a debate in the discussion of the reaction pathways for oxygenates (CO insertion versus hydroxy carbene) and the degree to which alcohols and olefins undergo reincorporation. The pioneering work from Kummer and Emmett [45] (later summarized by Davis and Jacobs [46]) showed from radioactive tracer experiments that the alcohol acts as an initiator for FTS over iron catalysts. Potassium was found to suppress the secondary reactions of olefins and thereby increased olefin formation over the 100Fe:5.1Si:2Cu:(1.25 or 3.0)K catalyst [47]. In this work, the chain growth probability factor (α) increased for olefins with an alkali addition over iron, supporting previous findings. On the other hand, both K and Ba had no effect on the alpha value obtained for oxygenates, and an explanation requires further research.
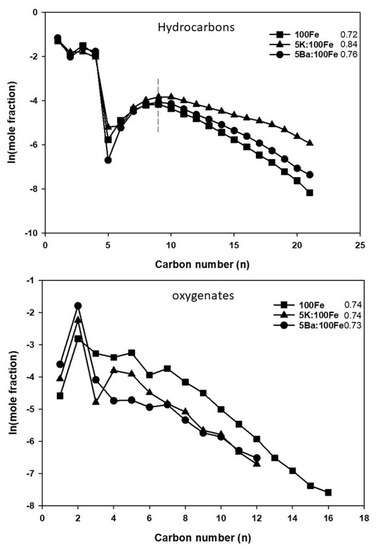
Figure 10.
ASF plots for hydrocarbons (top) and oxygenates (bottom).
Table 2 shows FTS product selectivity for different Fe catalysts. Comparing selectivity at similar conversion levels provides a more valid comparison. Here, the CO conversion was kept within a narrow range (CO: 59.1–63.3%, H2: 51.1–67.6%) in order to provide this comparison. Therefore, at similar CO conversion levels, the K-promoted Fe catalyst exhibited higher olefin selectivity and lower oxygenate and paraffin selectivities compared to unpromoted iron. Ba-promoted iron produced slightly higher paraffin selectivity compared to unpromoted iron oxide; however, the olefin content essentially remained the same. These data indicate that Ba-promotion to iron for FTS is marginal compared to K-promotion, with potassium being the generally preferred promoter.

Table 2.
The conversion and product selectivity of Fe-Fischer–Tropsch synthesis.
The olefin/paraffin ratio as a function of carbon number products for Fe-FTS is shown in Figure 11. Lower olefins such as C2, C3, and C4 contribute significantly to the total olefins formed on all three catalysts. Higher olefin-to-paraffin ratios were obtained with 5K:100Fe over the entire carbon number range observed in this study, whereas both unpromoted and Ba-promoted samples showed a similar trend, both producing less olefinic products in comparison to 5K:100Fe.
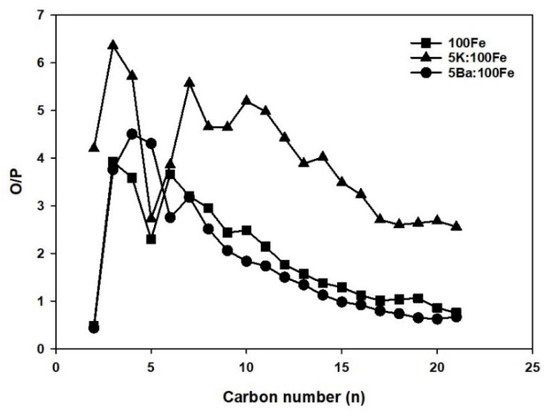
Figure 11.
Olefin/paraffin as a function of carbon number.
4. Discussion
The presence of Ba resulted in a somewhat less active catalyst in comparison to the K-promoted catalyst. Regarding the selectivities, the heavy alkaline earth promoter, Ba, played a less active role than K, leading to lower α-values and higher methane selectivies. There is a general picture that points to a correlation between promoter basicity, high carburization rates, and higher selectivities toward heavier products [5]. Furthermore, it is understood that K depresses the population of adsorbed H species by inductively increasing electron density in the Fe 3d levels located within its neighborhood and therefore increases the barrier for the adsorption of the H2 molecule on the active sites [23,40]. Interestingly, our SXRD results showed that Ba induced a higher carburization extent than K, indicating that Ba is in fact more active than K in the enhancement of CO dissociative adsorption rates. However, the fact that part of the Ba2+ was kept “buried” in a rather stable, crystalline BaCO3 phase might potentially prevent a fraction of the alkaline-earth ion to be available to exert any promoting effect on FTS. Nevertheles, the amount of the promoter (5Me:100 Fe) used in this work was chosen to be somewhat higher than what is usually found either in the literature or in technical Fe-based FTS catalysts (ranging from 0.3 to 3 Me:100Fe; Me = K-Ba) in order to minimize the effect of eventual differences in the promoter dispersion on catalyst performance. In other words, we expect that both K and Ba being in excess in the catalyst should minimize the effect of differences in dispersion and as such facilitate a comparison between them. On this basis, the observed differences between K and Ba as promoters might allow some discussion in terms of the intrinsic activity of Ba2+ compared to K+ regarding their relative effects on FTS selectivities.
Figure 12 displays Ba2+ 5p6 6s0, K+ 3p6 4s0 and Fe0 3d6 4s2 valence level energies [48]. Although more complicated interactions between the promoter and Fe 3d levels should be expected, it is important to note that K+ 3p levels, which are somewhat closer in energy to Fe 3d levels, should be able to interact with the metal 3d states more effectively than they can with Ba 5p levels. The difference between Ba2+ and K+ np levels apparently did not prevent Ba2+ from more effectively promoting the dissociative adsorption of CO. However, this difference apparently did exert some influence on the H2 dissociative adsorption and likely key chain growth processes in FTS. In that sense, Ba2+ 5p-Fe 3d mixing, unlike K+ 3p-Fe 3d mixing, is not enough to decrease H adsorption via increased repulsion between the H2 molecule and Fe active sites [23,40]. Therefore, lower chain growth probabilities and higher methane selectivities were observed for the Ba-promoted catalyst in comparison with the K-promoted catalyst.
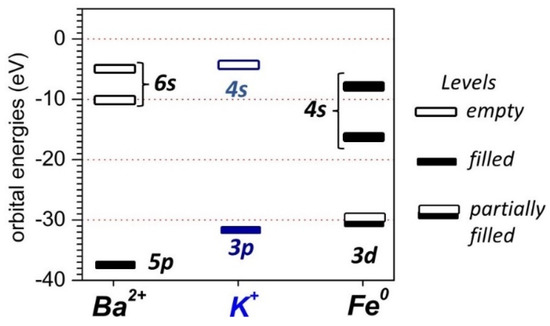
Figure 12.
Atomic Ba 5p, K 3p, and Fe 3d energy levels based on ionization potentials [48].
5. Conclusions
In the present contribution, the effect of the promoter´s ionic charge and valence states on structure–activity relationships in Fe-based FTS catalysts was examined. Although displaying formally lower basicity than K (comparable ionic radius, but with double ionic charge), the addition of Ba2+ surprisingly resulted in increased carburization rates. However, this effect did not lead to either increased overall catalyst activity or enhanced chain growth rates (alpha values) and olefin selectivities, as observed for our K-promoted sample. The most apparent effect of the ionic charge of the promoter was the formation of a stable BaCO3 phase in our catalysts (as shown by SXRD). This may indicate that the potentially better performance of Ba2+ might be merely leveled off by the inevitable formation of a stable layer of BaCO3 that may act negatively both by pore clogging/active site inhibition or by keeping Ba2+ from being available at the catalyst surface. Even though a formal comparison between K+ and Ba2+ was therefore somewhat precluded by partial Ba2+ encapsulation as a stable BaCO3 phase, the remaining Ba2+ available in the catalyst surface was not prevented from promoting the dissociative adsorption of CO more effectively than K+. The fact that H2 adsorption on Fe0 surface sites was not depressed as effectively by Ba2+ compared to K+, (thus resulting in the higher selectivities to methane and light products observed in the Ba-promoted catalyst) indicates that the charge transfer between the promoter and the catalyst active sites, postulated to be the main promotion mechanism, is not as effective between Ba2+ 5p-Fe 3d states as it is between K+ 3p-Fe 3d states. This is likely due to differences in their relative energies.
Supplementary Materials
The following are available online at https://www.mdpi.com/article/10.3390/reactions2040026/s1, Table S1: BET surface area and pore size distribution.
Author Contributions
Conceptualization, investigation, visualization, M.Z.L.L.R.; investigation and formal analysis, J.C.S.; investigation, formal analysis, and writing, M.K.G.; investigation, visualization, formal analysis, conceptualization, and writing, M.M.; investigation, visualization, and formal analysis, G.F.U.; conceptualization, investigation, visualization, formal analysis, supervision, and writing, G.J.; conceptualization, investigation, visualization, formal analysis, supervision, and writing, M.C.R. All authors have read and agreed to the published version of the manuscript.
Funding
This research received no external funding.
Acknowledgments
CAER research was supported by the Commonwealth of Kentucky. Gabe Upton would like to acknowledge support from the UTSA College of Engineering. Gary Jacobs would like to thank UTSA and the State of Texas for financial support through startup funds. This research used resources from the Brazilian Synchrotron Light Laboratory (LNLS), an open national facility operated by the Brazilian Centre for Research in Energy and Materials (CNPEM) for the Brazilian Ministry for Science, Technology and Innovations (MCTI). The XPD beamline staff is acknowledged for their assistance during the experiments (project number XPD 20160477). Mauro Ribeiro thanks the ICEx-UFF, Department of Chemistry for providing some of the reactants used in the catalyst synthesis.
Conflicts of Interest
The authors declare no conflict of interest.
References
- van de Loosdrecht, J.; Botes, F.G.; Ciobica, I.M.; Ferreira, A.C.; Gibson, P.; Moodley, D.J.; Saib, A.M.; Visagie, J.L.; Weststrate, C.J.; Niemantsverdriet, J.W. Fischer-Tropsch synthesis: Catalysts and chemistry. In Comprehensive Inorganic Chemistry II: From Elements to Applications; Surface Inorganic Chemistry and Heterogeneous Catalysis; Reedijk, J., Poeppelmeier, K., Eds.; Elsevier: Amsterdam, The Netherlands, 2013; Volume 7.20, pp. 525–557. [Google Scholar]
- Suo, H.; Wang, S.; Zhang, C.; Xu, J.; Wu, B.; Yang, Y.; Xiang, H.; Li, Y.W. Chemical and structural effects of silica in iron-based Fischer–Tropsch synthesis catalysts. J. Catal. 2012, 286, 111–123. [Google Scholar] [CrossRef]
- Chernavskii, P.A.; Kazak, V.O.; Pankina, G.V.; Perfiliev, Y.D.; Li, T.; Virginie, M.; Khodakov, A.Y. Influence of copper and potassium on the structure and carbidisation of supported iron catalysts for Fischer-Tropsch synthesis. Catal. Sci. Technol. 2017, 7, 2325–2334. [Google Scholar] [CrossRef]
- de Smit, E.; Weckhuysen, B.M. The renaissance of iron-based Fischer-Tropsch synthesis: On the multifaceted catalyst deactivation behavior. Chem. Soc. Rev. 2008, 37, 2758–2781. [Google Scholar] [CrossRef] [PubMed]
- Ribeiro, M.C.; Jacobs, G.; Davis, B.H.; Cronauer, D.C.; Kropf, A.J.; Marshall, C.L. Fischer−Tropsch synthesis: An in-situ TPR-EXAFS/XANES investigation of the influence of Group I alkali promoters on the local atomic and electronic structure of carburized iron/silica catalysts. J. Phys. Chem. C 2010, 114, 7895–7903. [Google Scholar] [CrossRef]
- Gnanamani, M.K.; Hamdeh, H.H.; Jacobs, G.; Shafer, W.D.; Sparks, D.E.; Davis, B.H. Fischer-Tropsch Synthesis Activity and Selectivity of χ-Fe5C2 and θ-Fe3C Carbides. In Fischer-Tropsch Synthesis, Catalysts, and Catalysis; Davis, B.H., Occelli, M., Eds.; CRC Press: Boca Raton, FL, USA, 2016; pp. 15–30. [Google Scholar]
- Nagakura, S. Study of Metallic Carbides by Electron Diffraction. Part III: Iron Carbides. J. Phys. Soc. Jpn. 1959, 14, 186–195. [Google Scholar] [CrossRef]
- Raupp, G.B.; Delgass, W.N. Mössbauer investigation of supported Fe and FeNi catalysts: II. Carbides formed Fischer-Tropsch synthesis. J. Catal. 1979, 58, 348–360. [Google Scholar] [CrossRef]
- Paalanen, P.P.; van Vreeswijk, S.H.; Dugulan, A.I.; Weckhuysen, B.M. Identification of Iron Carbides in Fe(Na-S)/α-Al2O3 Fischer-Tropsch Synthesis Catalysts with X-ray Powder Diffractometry and Mössbauer Absorption Spectroscopy. ChemCatChem 2020, 12, 5121–5139. [Google Scholar] [CrossRef]
- Herranz, T.; Rojas, S.; Perez-Alonso, F.J.; Ojeda, M.; Terreros, P.; Fierro, J.L.G. Genesis of iron carbides and their role in the synthesis of hydrocarbons from synthesis gas. J. Catal. 2006, 243, 199–211. [Google Scholar] [CrossRef]
- Eckstrom, H.C.; Adcock, W.A. A New Iron Carbide in Hydrocarbon Synthesis Catalysts. J. Am. Chem. Soc. 1950, 72, 1042–1043. [Google Scholar] [CrossRef]
- Datye, A.K.; Jin, Y.; Mansker, L.; Motjope, R.T.; Dlamini, T.H.; Coville, N.J. The nature of the active phase in iron Fischer−Tropsch catalysts. Stud. Surf. Sci. Catal. 2000, 130, 1139–1144. [Google Scholar]
- Chang, Q.; Zhang, C.; Liu, C.; Wei, Y.; Cheruvathur, A.V.; Dugulan, A.I.; Niemantsverdriet, J.W.; Liu, X.; He, Y.; Qing, M.; et al. Relationship between iron carbide phases (ε-Fe2C, Fe7C3, and χ-Fe5C2) and catalytic performances of Fe/SiO2 Fischer−Tropsch catalysts. ACS Catal. 2018, 8, 3304–3316. [Google Scholar] [CrossRef]
- Paalanen, P.P.; Weckhuysen, B.M. Carbon pathways, sodium-sulphur promotion and identification of iron carbides in iron-based Fischer-Tropsch synthesis. ChemCatChem 2020, 12, 4202–4223. [Google Scholar] [CrossRef]
- de Smit, E.; Beale, A.M.; Nikitenko, S.; Weckhuysen, B.M. Local and long-range order in promoted iron-based Fischer–Tropsch catalysts: A combined in situ x-ray absorption spectroscopy/wide angle x-ray scattering study. J. Catal. 2009, 262, 244–256. [Google Scholar] [CrossRef]
- de Smit, E.; Cinquini, F.; Beale, A.M.; Safonova, O.V.; van Beek, W.; Sautet, P.; Weckhuysen, B.M. Stability and reactivity of ϵ−χ−θ iron carbide catalyst phases in Fischer−Tropsch synthesis: Controlling μC. J. Am. Chem. Soc. 2010, 132, 14928–14941. [Google Scholar] [CrossRef] [PubMed]
- Li, J.; Cheng, X.; Zhang, C.; Yang, Y.; Li, Y.W. Effects of alkali on iron-based catalysts for Fischer-Tropsch synthesis: CO chemisorption study. J. Mol. Catal. A Chem. 2015, 396, 174–180. [Google Scholar] [CrossRef]
- Zhang, C.; Zhao, G.; Liu, K.; Yang, Y.; Xiang, H.; Li, Y.W. Adsorption and reaction of CO and hydrogen on iron-based Fischer–Tropsch synthesis catalysts. J. Mol. Catal. A Chem. 2010, 328, 35–43. [Google Scholar] [CrossRef]
- Zhao, S.; Liu, X.-W.; Huo, C.F.; Li, Y.W.; Wang, J.; Jiao, H. The role of potassium promoter in surface carbon hydrogenation on Hägg carbide surfaces. Appl. Catal. A Gen. 2015, 493, 68–76. [Google Scholar] [CrossRef]
- Jacobs, G.; Pendyala, V.R.R.; Martinelli, M.; Shafer, W.D.; Gnanamani, M.K.; Khalid, S.; MacLennan, A.; Hu, Y.; Davis, B.H. Fischer–Tropsch synthesis: XANES spectra of potassium in promoted precipitated iron catalysts as a function of time on-stream. Catal. Lett. 2017, 147, 1861–1870. [Google Scholar] [CrossRef]
- Sarkar, A.; Jacobs, G.; Ji, Y.; Hamdeh, H.H.; Davis, B.H. Fischer–Tropsch synthesis: Characterization Rb promoted iron catalyst. Catal. Lett. 2008, 121, 1–11. [Google Scholar] [CrossRef]
- Parkinson, G.S. Iron oxide surfaces. Surf. Sci. Rep. 2016, 71, 272–365. [Google Scholar] [CrossRef] [Green Version]
- Li, J.; Cheng, X.; Zhang, C.; Chang, Q.; Wang, J.; Wang, X.; Lv, Z.; Dong, W.; Yang, Y.; Li, Y.W. Effect of alkalis on iron-based Fischer-Tropsch synthesis catalysts: Alkali-FeOX interaction, reduction, and catalytic performance. Appl. Catal. A Gen. 2016, 528, 131–141. [Google Scholar] [CrossRef]
- Cheng, K.; Ordomsky, V.V.; Legras, B.; Virginie, M.; Paul, S.; Wang, Y.; Khodakov, A.Y. Sodium-promoted iron catalysts prepared on different supports for high temperature Fischer–Tropsch synthesis. Appl. Catal. A Gen. 2015, 502, 204–214. [Google Scholar] [CrossRef]
- Xiong, H.; Motchelaho, M.A.; Moyo, M.; Jewell, L.L.; Coville, N.J. Effect of Group I alkali metal promoters on Fe/CNT catalysts in Fischer–Tropsch synthesis. Fuel 2015, 150, 687–696. [Google Scholar] [CrossRef]
- Ngantsoue-Hoc, W.; Zhang, Y.; O’Brien, R.J.; Luo, M.; Davis, B.H. Fischer−Tropsch synthesis: Activity and selectivity for Group I alkali promoted iron-based catalysts. Appl. Catal. A Gen. 2002, 236, 77–89. [Google Scholar] [CrossRef]
- Dry, M.E.; Oosthuizen, G.J. The correlation between catalyst surface basicity and hydrocarbon selectivity in the Fischer-Tropsch synthesis. J. Catal. 1968, 11, 18–24. [Google Scholar] [CrossRef]
- Dry, M.E.; Shingles, T.; Boshoff, L.J.; Oosthuizen, G.J. Heats of chemisorption on promoted iron surfaces and the role of alkali in Fischer-Tropsch synthesis. J. Catal. 1969, 15, 190–199. [Google Scholar] [CrossRef]
- Rajabi, Z.; Martinelli, M.; Watson, C.D.; Cronauer, D.C.; Kropf, A.J.; Jacobs, G. Influence of Cs Loading on Pt/m-ZrO2 Water–Gas Shift Catalysts. Catalysts 2021, 11, 570. [Google Scholar] [CrossRef]
- Li, J.; Zhang, C.; Cheng, X.; Qing, M.; Xu, J.; Wu, B.; Yang, Y.; Li, Y. Effects of alkaline-earth metals on the structure, adsorption, and catalytic behavior of iron-based Fischer–Tropsch synthesis catalyst. Appl. Catal. A Gen. 2013, 464–465, 10–19. [Google Scholar] [CrossRef]
- Luo, M.; Davis, B.H. Fischer–Tropsch synthesis: Group II alkali-earth metal promoted catalysts. Appl. Catal. A Gen. 2003, 246, 171–181. [Google Scholar] [CrossRef]
- Yang, J.; Sun, Y.; Tang, Y.; Liu, Y.; Wang, H.; Tian, L.; Wang, H.; Zhang, Z.; Xiang, H.; Li, Y. Effect of magnesium promoter on iron-based catalyst for Fischer–Tropsch synthesis. J. Mol. Catal. A Chem. 2006, 245, 26–36. [Google Scholar] [CrossRef]
- Li, J.; Hou, Y.; Song, Z.; Liu, C.; Dong, W.; Zhang, C.; Yang, Y.; Li, Y. Chemical and structural effects of strontium on iron-based Fischer-Tropsch synthesis catalysts. Mol. Catal. 2018, 449, 1–7. [Google Scholar] [CrossRef]
- Tao, Z.; Yang, Y.; Zhang, C.; Li, T.; Wang, J.; Wan, H.; Xiang, H.; Li, Y. Effect of calcium promoter on a precipitated iron–manganese catalyst for Fischer–Tropsch synthesis. Catal. Commun. 2006, 7, 1061–1066. [Google Scholar] [CrossRef]
- Pour A., N.; Housaindokht, M.R.; Tayyari, S.F.; Zarkesh, J.; Alaei, M.R. Kinetic studies of the Fischer–Tropsch synthesis over La, Mg and Ca promoted nano-structured iron catalyst. J. Nat. Gas Sci. Eng. 2010, 2, 61–68. [Google Scholar] [CrossRef]
- Gallegos, N.G.; Alvarez, A.M.; Cagnoli, M.V.; Bengoa, J.F.; Marchetti, S.G.; Mercader, R.C.; Yeramian, A.A. Selectivity to Olefins of Fe/SiO2–MgO Catalysts in the Fischer–Tropsch Reaction. J. Catal. 1996, 161, 132–142. [Google Scholar] [CrossRef]
- Toby B., H.; Von Dreele R., B. GSAS-II: The genesis of a modern open-source all-purpose crystallography software package. J. Appl. Cryst. 2013, 46, 544–549. [Google Scholar] [CrossRef]
- Liu, X.W.; Zhao, S.; Meng, Y.; Peng, Q.; Dearden, A.K.; Huo, C.F.; Yang, Y.; Li, Y.W.; Wen, X.D. Mossbauer Spectroscopy of Iron Carbides: From Prediction to Experimental Confirmation. Sci. Rep. 2016, 6, 26184. [Google Scholar] [CrossRef] [PubMed] [Green Version]
- Paalanen, P.P.; van Vreeswijk, S.H.; Weckhuysen, B.M. Combined In Situ X-ray Powder Diffractometry/Raman Spectroscopy of Iron Carbide and Carbon Species Evolution in Fe(−Na–S)/α-Al2O3 Catalysts during Fischer–Tropsch Synthesis. ACS Catal. 2020, 10, 9837–9855. [Google Scholar] [CrossRef]
- Harris, J.; Andersson, S. H2 Dissociation at Metal Surfaces. Phys. Rev. Lett. 1985, 55, 1583. [Google Scholar] [CrossRef] [PubMed]
- Xu, J.; Bartholomew, C.H. Temperature-programmed hydrogenation (TPH) and in situ Mossbauer spectroscopy studies of carbonaceous species on silica-supported iron Fischer-Tropsch catalysts. J. Phys. Chem. B 2005, 109, 2392–2403. [Google Scholar] [CrossRef] [PubMed]
- Pendyala, V.R.R.; Graham, U.M.; Jacobs, G.; Hamdeh, H.H.; Davis, B.H. Fischer-Tropsch Synthesis: Morphology, phase transformation and carbon-layer growth of iron-based catalysts. ChemCatChem 2014, 6, 1952–1960. [Google Scholar] [CrossRef]
- Arakawa, H.; Bell, A.T. Effects of potassium promotion on the activity and selectivity of iron Fischer-Tropsch catalysts. Ind. Eng. Chem. Process Des. Dev. 1983, 22, 97–103. [Google Scholar] [CrossRef]
- Raje, A.P.; O’Brien, R.J.; Davis, B.H. Effect of potassium promotion on iron-based catalysts for Fischer-Tropsch synthesis. J. Catal. 1998, 180, 36–43. [Google Scholar] [CrossRef]
- Kummer, J.T.; Emmett, P.H. Fischer-Tropsch Synthesis Mechanism Studies. The Addition of Radioactive Alcohols to the Synthesis Gas. J. Am. Chem. Soc. 1953, 75, 5177–5183. [Google Scholar] [CrossRef]
- Jacobs, G.; and Davis, B.H. Applications of Isotopic Tracers in Fischer-Tropsch Synthesis. Catal. Sci. Technol. 2014, 4, 3927–3944. [Google Scholar] [CrossRef]
- Ma, W.; Jacobs, G.; Graham, U.M.; Davis, B.H. Fischer–Tropsch Synthesis: Effect of K Loading on the Water-Gas Shift Reaction and Liquid Hydrocarbon Formation Rate over Precipitated Iron Catalysts. Top. Catal. 2014, 57, 561–571. [Google Scholar] [CrossRef]
- Housecroft, C.E.; Sharpe, A.G. Inorganic Chemistry, 2nd ed.; Pearson: Harlow, UK, 2005; pp. 880–882. [Google Scholar]
Publisher’s Note: MDPI stays neutral with regard to jurisdictional claims in published maps and institutional affiliations. |
© 2021 by the authors. Licensee MDPI, Basel, Switzerland. This article is an open access article distributed under the terms and conditions of the Creative Commons Attribution (CC BY) license (https://creativecommons.org/licenses/by/4.0/).